Immigrants Married-Couple Family Poverty
COMPARE
Immigrants
Select to Compare
Married-Couple Family Poverty
Immigrants Married-Couple Family Poverty
6.0%
POVERTY | MARRIED-COUPLE FAMILIES
0.5/ 100
METRIC RATING
258th/ 347
METRIC RANK
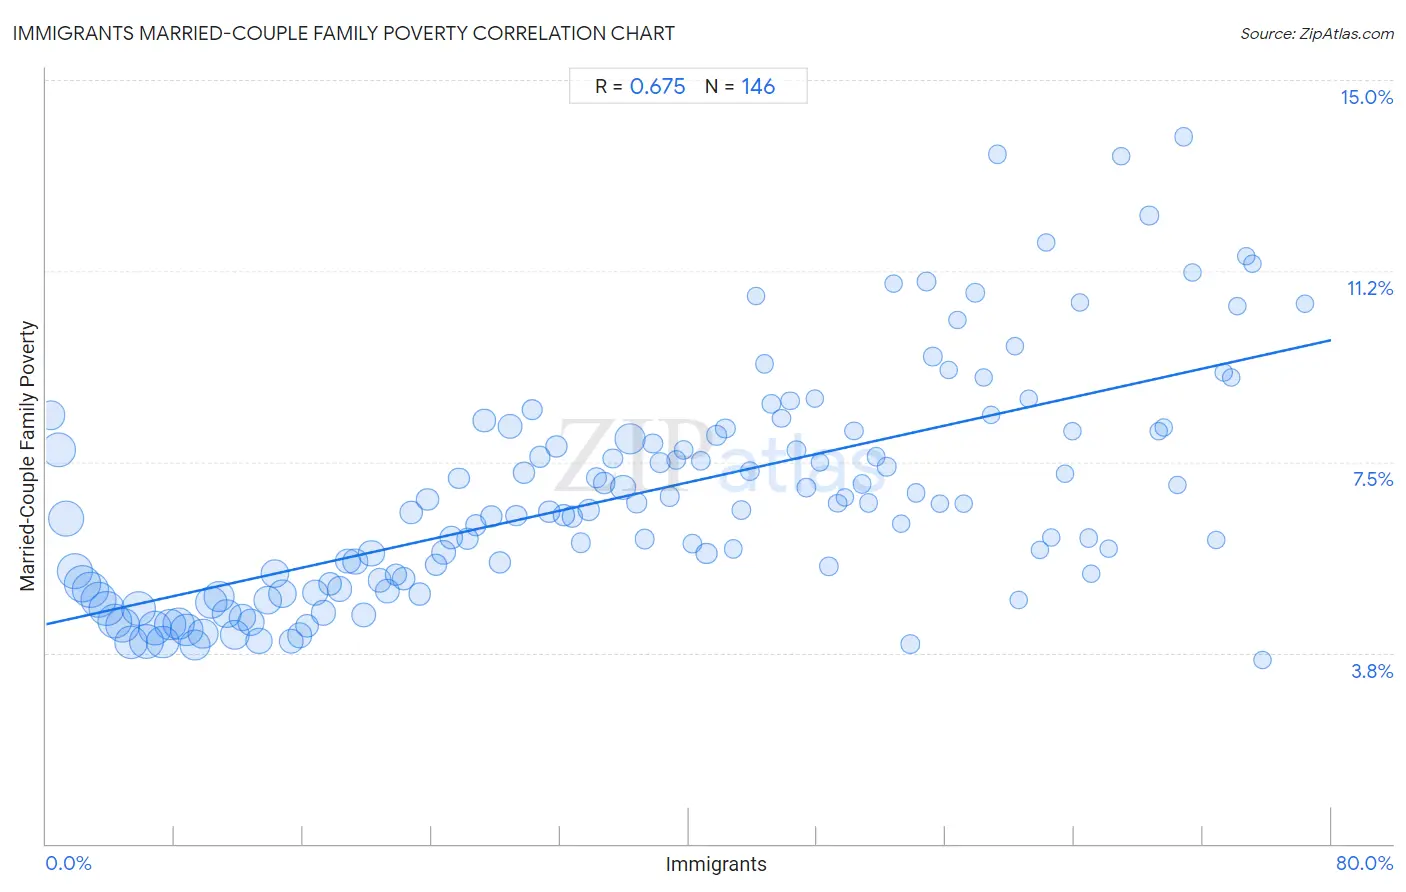
Immigrants Married-Couple Family Poverty Correlation Chart
The statistical analysis conducted on geographies consisting of 562,504,380 people shows a significant positive correlation between the proportion of Immigrants and poverty level among married-couple families in the United States with a correlation coefficient (R) of 0.675 and weighted average of 6.0%. On average, for every 1% (one percent) increase in Immigrants within a typical geography, there is an increase of 0.070% in poverty level among married-couple families.
It is essential to understand that the correlation between the percentage of Immigrants and poverty level among married-couple families does not imply a direct cause-and-effect relationship. It remains uncertain whether the presence of Immigrants influences an upward or downward trend in the level of poverty level among married-couple families within an area, or if Immigrants simply ended up residing in those areas with higher or lower levels of poverty level among married-couple families due to other factors.
Demographics Similar to Immigrants by Married-Couple Family Poverty
In terms of married-couple family poverty, the demographic groups most similar to Immigrants are Immigrants from Burma/Myanmar (6.0%, a difference of 0.13%), Bangladeshi (6.0%, a difference of 0.37%), Alaskan Athabascan (6.1%, a difference of 0.58%), Jamaican (6.1%, a difference of 0.79%), and Comanche (6.0%, a difference of 0.87%).
| Demographics | Rating | Rank | Married-Couple Family Poverty |
| Immigrants from Ghana | 1.0 /100 | #251 | Tragic 5.9% |
| Immigrants from Western Asia | 0.7 /100 | #252 | Tragic 6.0% |
| Africans | 0.7 /100 | #253 | Tragic 6.0% |
| Immigrants from Somalia | 0.7 /100 | #254 | Tragic 6.0% |
| Comanche | 0.7 /100 | #255 | Tragic 6.0% |
| Bangladeshis | 0.5 /100 | #256 | Tragic 6.0% |
| Immigrants from Burma/Myanmar | 0.5 /100 | #257 | Tragic 6.0% |
| Immigrants | 0.5 /100 | #258 | Tragic 6.0% |
| Alaskan Athabascans | 0.4 /100 | #259 | Tragic 6.1% |
| Jamaicans | 0.3 /100 | #260 | Tragic 6.1% |
| Senegalese | 0.3 /100 | #261 | Tragic 6.1% |
| Shoshone | 0.3 /100 | #262 | Tragic 6.1% |
| Immigrants from Senegal | 0.3 /100 | #263 | Tragic 6.1% |
| Immigrants from Congo | 0.2 /100 | #264 | Tragic 6.1% |
| Blackfeet | 0.2 /100 | #265 | Tragic 6.2% |
Immigrants Married-Couple Family Poverty Correlation Summary
| Measurement | Immigrants Data | Married-Couple Family Poverty Data |
| Minimum | 0.28% | 3.6% |
| Maximum | 78.4% | 13.9% |
| Range | 78.1% | 10.3% |
| Mean | 36.9% | 6.9% |
| Median | 36.5% | 6.6% |
| Interquartile 25% (IQ1) | 18.3% | 5.1% |
| Interquartile 75% (IQ3) | 54.8% | 8.1% |
| Interquartile Range (IQR) | 36.5% | 3.0% |
| Standard Deviation (Sample) | 21.7% | 2.2% |
| Standard Deviation (Population) | 21.6% | 2.2% |
Correlation Details
| Immigrants Percentile | Sample Size | Married-Couple Family Poverty |
[ 0.0% - 0.5% ] 0.28% | 8,985,695 | 8.4% |
[ 0.5% - 1.0% ] 0.76% | 13,960,823 | 7.7% |
[ 1.0% - 1.5% ] 1.25% | 14,964,179 | 6.4% |
[ 1.5% - 2.0% ] 1.75% | 14,938,959 | 5.4% |
[ 2.0% - 2.5% ] 2.24% | 15,819,697 | 5.1% |
[ 2.5% - 3.0% ] 2.74% | 15,113,488 | 5.0% |
[ 3.0% - 3.5% ] 3.24% | 15,103,441 | 4.8% |
[ 3.5% - 4.0% ] 3.75% | 14,196,419 | 4.6% |
[ 4.0% - 4.5% ] 4.25% | 14,012,662 | 4.4% |
[ 4.5% - 5.0% ] 4.75% | 13,425,393 | 4.3% |
[ 5.0% - 5.5% ] 5.26% | 12,968,566 | 4.0% |
[ 5.5% - 6.0% ] 5.75% | 13,994,039 | 4.6% |
[ 6.0% - 6.5% ] 6.24% | 13,361,313 | 4.0% |
[ 6.5% - 7.0% ] 6.75% | 12,754,558 | 4.2% |
[ 7.0% - 7.5% ] 7.24% | 12,303,549 | 4.0% |
[ 7.5% - 8.0% ] 7.74% | 11,286,765 | 4.3% |
[ 8.0% - 8.5% ] 8.23% | 11,795,928 | 4.3% |
[ 8.5% - 9.0% ] 8.75% | 11,802,393 | 4.2% |
[ 9.0% - 9.5% ] 9.25% | 10,565,344 | 3.9% |
[ 9.5% - 10.0% ] 9.76% | 9,622,848 | 4.1% |
[ 10.0% - 10.5% ] 10.26% | 11,520,565 | 4.7% |
[ 10.5% - 11.0% ] 10.74% | 10,060,255 | 4.9% |
[ 11.0% - 11.5% ] 11.24% | 8,723,451 | 4.5% |
[ 11.5% - 12.0% ] 11.76% | 9,823,805 | 4.1% |
[ 12.0% - 12.5% ] 12.22% | 7,530,618 | 4.5% |
[ 12.5% - 13.0% ] 12.75% | 7,774,627 | 4.4% |
[ 13.0% - 13.5% ] 13.26% | 6,978,156 | 4.0% |
[ 13.5% - 14.0% ] 13.80% | 8,154,684 | 4.8% |
[ 14.0% - 14.5% ] 14.24% | 8,679,555 | 5.3% |
[ 14.5% - 15.0% ] 14.73% | 8,538,110 | 4.9% |
[ 15.0% - 15.5% ] 15.23% | 5,305,614 | 4.0% |
[ 15.5% - 16.0% ] 15.77% | 5,801,013 | 4.1% |
[ 16.0% - 16.5% ] 16.23% | 4,920,308 | 4.3% |
[ 16.5% - 17.0% ] 16.74% | 5,998,297 | 4.9% |
[ 17.0% - 17.5% ] 17.25% | 5,829,722 | 4.5% |
[ 17.5% - 18.0% ] 17.70% | 4,051,994 | 5.1% |
[ 18.0% - 18.5% ] 18.25% | 5,931,956 | 5.0% |
[ 18.5% - 19.0% ] 18.78% | 5,528,383 | 5.5% |
[ 19.0% - 19.5% ] 19.26% | 5,796,029 | 5.5% |
[ 19.5% - 20.0% ] 19.74% | 5,390,757 | 4.5% |
[ 20.0% - 20.5% ] 20.27% | 7,048,505 | 5.7% |
[ 20.5% - 21.0% ] 20.77% | 4,806,956 | 5.2% |
[ 21.0% - 21.5% ] 21.23% | 5,500,157 | 5.0% |
[ 21.5% - 22.0% ] 21.77% | 3,671,113 | 5.3% |
[ 22.0% - 22.5% ] 22.23% | 4,394,590 | 5.2% |
[ 22.5% - 23.0% ] 22.73% | 4,267,628 | 6.5% |
[ 23.0% - 23.5% ] 23.24% | 3,713,727 | 4.9% |
[ 23.5% - 24.0% ] 23.76% | 4,139,742 | 6.8% |
[ 24.0% - 24.5% ] 24.28% | 3,518,154 | 5.5% |
[ 24.5% - 25.0% ] 24.75% | 5,463,537 | 5.7% |
[ 25.0% - 25.5% ] 25.25% | 4,136,859 | 6.0% |
[ 25.5% - 26.0% ] 25.69% | 2,866,443 | 7.2% |
[ 26.0% - 26.5% ] 26.24% | 3,155,812 | 6.0% |
[ 26.5% - 27.0% ] 26.76% | 2,746,027 | 6.3% |
[ 27.0% - 27.5% ] 27.27% | 3,303,076 | 8.3% |
[ 27.5% - 28.0% ] 27.73% | 2,958,493 | 6.4% |
[ 28.0% - 28.5% ] 28.24% | 3,336,120 | 5.5% |
[ 28.5% - 29.0% ] 28.86% | 5,089,292 | 8.2% |
[ 29.0% - 29.5% ] 29.27% | 3,105,679 | 6.4% |
[ 29.5% - 30.0% ] 29.76% | 2,765,067 | 7.3% |
[ 30.0% - 30.5% ] 30.27% | 2,682,568 | 8.5% |
[ 30.5% - 31.0% ] 30.74% | 2,230,952 | 7.6% |
[ 31.0% - 31.5% ] 31.31% | 2,403,852 | 6.5% |
[ 31.5% - 32.0% ] 31.76% | 2,823,684 | 7.8% |
[ 32.0% - 32.5% ] 32.21% | 2,886,071 | 6.5% |
[ 32.5% - 33.0% ] 32.75% | 2,356,129 | 6.4% |
[ 33.0% - 33.5% ] 33.27% | 1,717,721 | 5.9% |
[ 33.5% - 34.0% ] 33.74% | 3,240,073 | 6.6% |
[ 34.0% - 34.5% ] 34.23% | 1,737,232 | 7.2% |
[ 34.5% - 35.0% ] 34.74% | 2,374,849 | 7.1% |
[ 35.0% - 35.5% ] 35.26% | 1,556,145 | 7.6% |
[ 35.5% - 36.0% ] 35.91% | 5,367,667 | 7.0% |
[ 36.0% - 36.5% ] 36.32% | 10,443,739 | 8.0% |
[ 36.5% - 37.0% ] 36.77% | 1,308,345 | 6.7% |
[ 37.0% - 37.5% ] 37.26% | 1,593,647 | 6.0% |
[ 37.5% - 38.0% ] 37.76% | 1,531,688 | 7.9% |
[ 38.0% - 38.5% ] 38.23% | 1,926,793 | 7.5% |
[ 38.5% - 39.0% ] 38.81% | 1,576,719 | 6.8% |
[ 39.0% - 39.5% ] 39.23% | 1,148,077 | 7.5% |
[ 39.5% - 40.0% ] 39.69% | 1,200,091 | 7.7% |
[ 40.0% - 40.5% ] 40.25% | 1,247,228 | 5.9% |
[ 40.5% - 41.0% ] 40.76% | 1,731,820 | 7.5% |
[ 41.0% - 41.5% ] 41.11% | 2,636,421 | 5.7% |
[ 41.5% - 42.0% ] 41.73% | 1,519,111 | 8.0% |
[ 42.0% - 42.5% ] 42.28% | 1,499,445 | 8.2% |
[ 42.5% - 43.0% ] 42.78% | 811,816 | 5.8% |
[ 43.0% - 43.5% ] 43.26% | 883,716 | 6.5% |
[ 43.5% - 44.0% ] 43.79% | 1,268,776 | 7.3% |
[ 44.0% - 44.5% ] 44.20% | 369,140 | 10.8% |
[ 44.5% - 45.0% ] 44.72% | 852,317 | 9.4% |
[ 45.0% - 45.5% ] 45.14% | 861,686 | 8.6% |
[ 45.5% - 46.0% ] 45.75% | 702,307 | 8.4% |
[ 46.0% - 46.5% ] 46.30% | 774,401 | 8.7% |
[ 46.5% - 47.0% ] 46.72% | 706,686 | 7.7% |
[ 47.0% - 47.5% ] 47.30% | 838,509 | 7.0% |
[ 47.5% - 48.0% ] 47.83% | 275,611 | 8.7% |
[ 48.0% - 48.5% ] 48.14% | 162,053 | 7.5% |
[ 48.5% - 49.0% ] 48.74% | 843,319 | 5.4% |
[ 49.0% - 49.5% ] 49.28% | 846,575 | 6.7% |
[ 49.5% - 50.0% ] 49.69% | 165,996 | 6.8% |
[ 50.0% - 50.5% ] 50.28% | 640,490 | 8.1% |
[ 50.5% - 51.0% ] 50.79% | 729,299 | 7.1% |
[ 51.0% - 51.5% ] 51.18% | 319,766 | 6.7% |
[ 51.5% - 52.0% ] 51.67% | 303,161 | 7.6% |
[ 52.0% - 52.5% ] 52.32% | 204,872 | 7.4% |
[ 52.5% - 53.0% ] 52.76% | 236,458 | 11.0% |
[ 53.0% - 53.5% ] 53.24% | 135,949 | 6.3% |
[ 53.5% - 54.0% ] 53.81% | 463,502 | 3.9% |
[ 54.0% - 54.5% ] 54.17% | 368,627 | 6.9% |
[ 54.5% - 55.0% ] 54.78% | 593,586 | 11.0% |
[ 55.0% - 55.5% ] 55.18% | 479,611 | 9.6% |
[ 55.5% - 56.0% ] 55.61% | 148,590 | 6.7% |
[ 56.0% - 56.5% ] 56.17% | 91,247 | 9.3% |
[ 56.5% - 57.0% ] 56.72% | 75,873 | 10.3% |
[ 57.0% - 57.5% ] 57.13% | 110,508 | 6.7% |
[ 57.5% - 58.0% ] 57.84% | 597,359 | 10.8% |
[ 58.0% - 58.5% ] 58.34% | 98,862 | 9.2% |
[ 58.5% - 59.0% ] 58.80% | 221,458 | 8.4% |
[ 59.0% - 59.5% ] 59.19% | 85,384 | 13.5% |
[ 60.0% - 60.5% ] 60.30% | 153,212 | 9.8% |
[ 60.5% - 61.0% ] 60.53% | 36,392 | 4.8% |
[ 61.0% - 61.5% ] 61.13% | 58,079 | 8.7% |
[ 61.5% - 62.0% ] 61.88% | 128,746 | 5.8% |
[ 62.0% - 62.5% ] 62.28% | 93,988 | 11.8% |
[ 62.5% - 63.0% ] 62.56% | 24,520 | 6.0% |
[ 63.0% - 63.5% ] 63.43% | 24,597 | 7.3% |
[ 63.5% - 64.0% ] 63.91% | 117,426 | 8.1% |
[ 64.0% - 64.5% ] 64.33% | 109,357 | 10.6% |
[ 64.5% - 65.0% ] 64.88% | 104,781 | 6.0% |
[ 65.0% - 65.5% ] 65.08% | 50,814 | 5.3% |
[ 66.0% - 66.5% ] 66.17% | 152,851 | 5.8% |
[ 66.5% - 67.0% ] 66.92% | 106,222 | 13.5% |
[ 68.5% - 69.0% ] 68.68% | 119,624 | 12.3% |
[ 69.0% - 69.5% ] 69.26% | 90,791 | 8.1% |
[ 69.5% - 70.0% ] 69.58% | 766 | 8.2% |
[ 70.0% - 70.5% ] 70.39% | 115,169 | 7.1% |
[ 70.5% - 71.0% ] 70.79% | 137,895 | 13.9% |
[ 71.0% - 71.5% ] 71.37% | 45,620 | 11.2% |
[ 72.5% - 73.0% ] 72.85% | 57,066 | 6.0% |
[ 73.0% - 73.5% ] 73.31% | 29,830 | 9.3% |
[ 73.5% - 74.0% ] 73.75% | 19,399 | 9.2% |
[ 74.0% - 74.5% ] 74.15% | 257,738 | 10.6% |
[ 74.5% - 75.0% ] 74.68% | 46,798 | 11.5% |
[ 75.0% - 75.5% ] 75.10% | 71,088 | 11.4% |
[ 75.5% - 76.0% ] 75.74% | 1,018 | 3.6% |
[ 78.0% - 78.5% ] 78.37% | 42,081 | 10.6% |