African Married-Couple Family Poverty
COMPARE
African
Select to Compare
Married-Couple Family Poverty
African Married-Couple Family Poverty
6.0%
POVERTY | MARRIED-COUPLE FAMILIES
0.7/ 100
METRIC RATING
253rd/ 347
METRIC RANK
African Married-Couple Family Poverty Correlation Chart
The statistical analysis conducted on geographies consisting of 465,332,891 people shows a mild positive correlation between the proportion of Africans and poverty level among married-couple families in the United States with a correlation coefficient (R) of 0.393 and weighted average of 6.0%. On average, for every 1% (one percent) increase in Africans within a typical geography, there is an increase of 0.25% in poverty level among married-couple families.
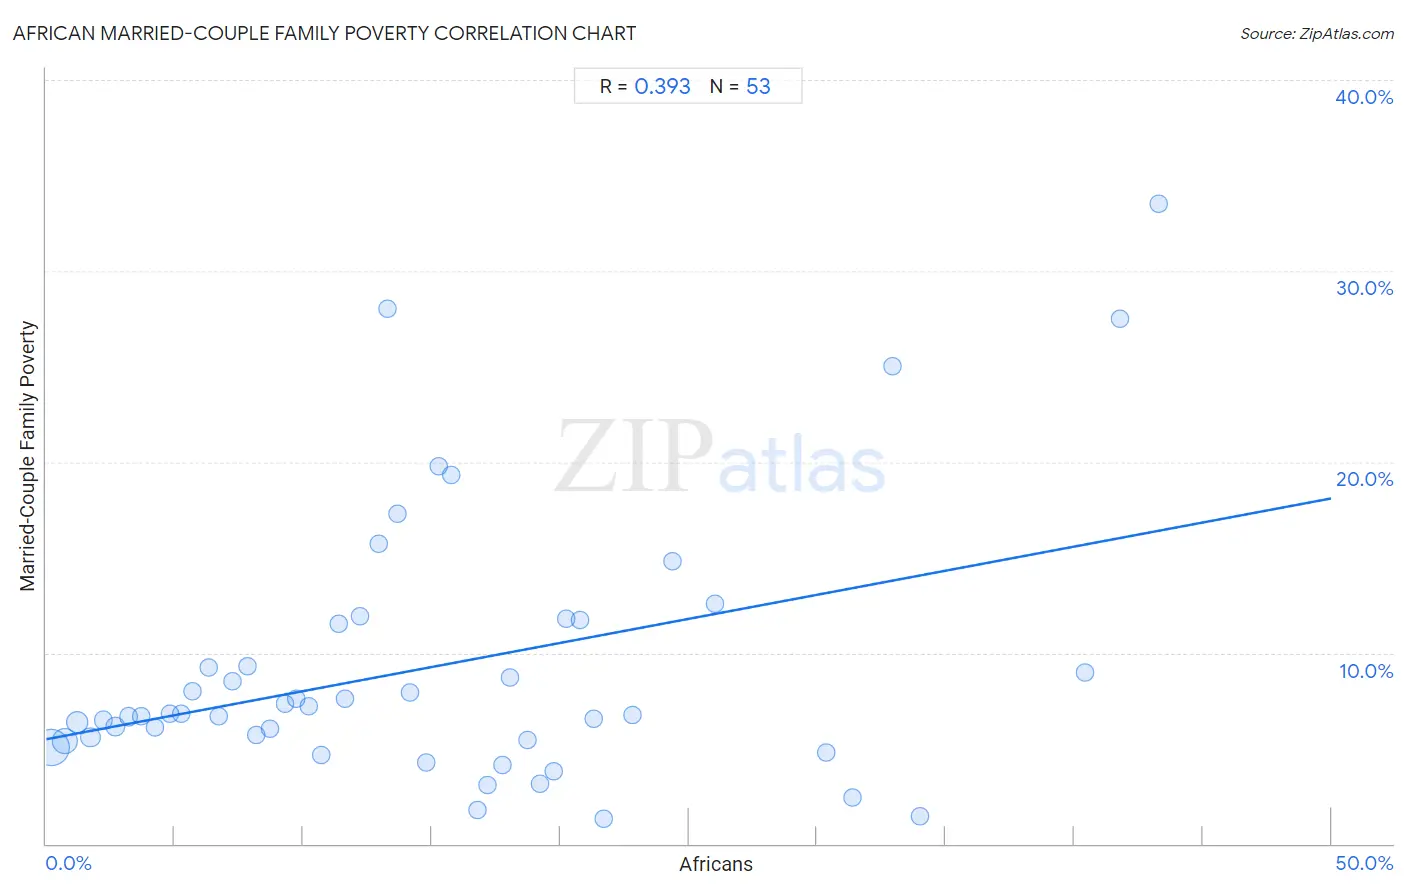
It is essential to understand that the correlation between the percentage of Africans and poverty level among married-couple families does not imply a direct cause-and-effect relationship. It remains uncertain whether the presence of Africans influences an upward or downward trend in the level of poverty level among married-couple families within an area, or if Africans simply ended up residing in those areas with higher or lower levels of poverty level among married-couple families due to other factors.
Demographics Similar to Africans by Married-Couple Family Poverty
In terms of married-couple family poverty, the demographic groups most similar to Africans are Immigrants from Somalia (6.0%, a difference of 0.060%), Immigrants from Western Asia (6.0%, a difference of 0.090%), Comanche (6.0%, a difference of 0.21%), Bangladeshi (6.0%, a difference of 0.71%), and Immigrants from Ghana (5.9%, a difference of 0.73%).
| Demographics | Rating | Rank | Married-Couple Family Poverty |
| Immigrants from Venezuela | 1.8 /100 | #246 | Tragic 5.8% |
| Iraqis | 1.4 /100 | #247 | Tragic 5.9% |
| Cree | 1.2 /100 | #248 | Tragic 5.9% |
| Tsimshian | 1.1 /100 | #249 | Tragic 5.9% |
| Immigrants from Eritrea | 1.1 /100 | #250 | Tragic 5.9% |
| Immigrants from Ghana | 1.0 /100 | #251 | Tragic 5.9% |
| Immigrants from Western Asia | 0.7 /100 | #252 | Tragic 6.0% |
| Africans | 0.7 /100 | #253 | Tragic 6.0% |
| Immigrants from Somalia | 0.7 /100 | #254 | Tragic 6.0% |
| Comanche | 0.7 /100 | #255 | Tragic 6.0% |
| Bangladeshis | 0.5 /100 | #256 | Tragic 6.0% |
| Immigrants from Burma/Myanmar | 0.5 /100 | #257 | Tragic 6.0% |
| Immigrants | 0.5 /100 | #258 | Tragic 6.0% |
| Alaskan Athabascans | 0.4 /100 | #259 | Tragic 6.1% |
| Jamaicans | 0.3 /100 | #260 | Tragic 6.1% |
African Married-Couple Family Poverty Correlation Summary
| Measurement | African Data | Married-Couple Family Poverty Data |
| Minimum | 0.21% | 1.3% |
| Maximum | 43.3% | 33.5% |
| Range | 43.1% | 32.2% |
| Mean | 15.0% | 9.3% |
| Median | 13.3% | 6.8% |
| Interquartile 25% (IQ1) | 6.5% | 5.4% |
| Interquartile 75% (IQ3) | 20.5% | 11.6% |
| Interquartile Range (IQR) | 14.0% | 6.2% |
| Standard Deviation (Sample) | 10.8% | 7.0% |
| Standard Deviation (Population) | 10.7% | 6.9% |
Correlation Details
| African Percentile | Sample Size | Married-Couple Family Poverty |
[ 0.0% - 0.5% ] 0.21% | 251,137,922 | 5.0% |
[ 0.5% - 1.0% ] 0.72% | 105,086,900 | 5.4% |
[ 1.0% - 1.5% ] 1.21% | 57,791,767 | 6.3% |
[ 1.5% - 2.0% ] 1.72% | 20,752,989 | 5.6% |
[ 2.0% - 2.5% ] 2.23% | 10,493,516 | 6.5% |
[ 2.5% - 3.0% ] 2.68% | 7,760,298 | 6.1% |
[ 3.0% - 3.5% ] 3.20% | 4,177,850 | 6.7% |
[ 3.5% - 4.0% ] 3.71% | 1,795,273 | 6.7% |
[ 4.0% - 4.5% ] 4.22% | 1,206,416 | 6.1% |
[ 4.5% - 5.0% ] 4.82% | 1,313,967 | 6.8% |
[ 5.0% - 5.5% ] 5.26% | 816,661 | 6.8% |
[ 5.5% - 6.0% ] 5.70% | 417,486 | 8.0% |
[ 6.0% - 6.5% ] 6.32% | 383,473 | 9.2% |
[ 6.5% - 7.0% ] 6.70% | 477,373 | 6.7% |
[ 7.0% - 7.5% ] 7.25% | 279,998 | 8.5% |
[ 7.5% - 8.0% ] 7.84% | 191,588 | 9.3% |
[ 8.0% - 8.5% ] 8.18% | 150,664 | 5.7% |
[ 8.5% - 9.0% ] 8.70% | 135,631 | 6.0% |
[ 9.0% - 9.5% ] 9.27% | 159,015 | 7.3% |
[ 9.5% - 10.0% ] 9.74% | 61,344 | 7.6% |
[ 10.0% - 10.5% ] 10.21% | 131,289 | 7.2% |
[ 10.5% - 11.0% ] 10.71% | 218,911 | 4.6% |
[ 11.0% - 11.5% ] 11.36% | 8,579 | 11.5% |
[ 11.5% - 12.0% ] 11.63% | 26,091 | 7.6% |
[ 12.0% - 12.5% ] 12.23% | 11,708 | 11.9% |
[ 12.5% - 13.0% ] 12.93% | 22,254 | 15.7% |
[ 13.0% - 13.5% ] 13.29% | 3,763 | 28.0% |
[ 13.5% - 14.0% ] 13.66% | 3,749 | 17.3% |
[ 14.0% - 14.5% ] 14.16% | 15,168 | 7.9% |
[ 14.5% - 15.0% ] 14.77% | 103,882 | 4.2% |
[ 15.0% - 15.5% ] 15.28% | 22,936 | 19.7% |
[ 15.5% - 16.0% ] 15.75% | 4,368 | 19.3% |
[ 16.5% - 17.0% ] 16.78% | 5,937 | 1.7% |
[ 17.0% - 17.5% ] 17.15% | 13,466 | 3.1% |
[ 17.5% - 18.0% ] 17.74% | 2,672 | 4.1% |
[ 18.0% - 18.5% ] 18.05% | 38,278 | 8.7% |
[ 18.5% - 19.0% ] 18.74% | 19,765 | 5.5% |
[ 19.0% - 19.5% ] 19.22% | 385 | 3.1% |
[ 19.5% - 20.0% ] 19.75% | 12,698 | 3.8% |
[ 20.0% - 20.5% ] 20.24% | 3,305 | 11.8% |
[ 20.5% - 21.0% ] 20.77% | 366 | 11.7% |
[ 21.0% - 21.5% ] 21.32% | 15,443 | 6.5% |
[ 21.5% - 22.0% ] 21.71% | 6,846 | 1.3% |
[ 22.5% - 23.0% ] 22.80% | 9,290 | 6.8% |
[ 24.0% - 24.5% ] 24.38% | 24,795 | 14.8% |
[ 26.0% - 26.5% ] 26.04% | 1,056 | 12.6% |
[ 30.0% - 30.5% ] 30.36% | 606 | 4.8% |
[ 31.0% - 31.5% ] 31.35% | 2,485 | 2.4% |
[ 32.5% - 33.0% ] 32.93% | 334 | 25.0% |
[ 34.0% - 34.5% ] 34.01% | 1,476 | 1.5% |
[ 40.0% - 40.5% ] 40.41% | 9,613 | 8.9% |
[ 41.5% - 42.0% ] 41.76% | 613 | 27.5% |
[ 43.0% - 43.5% ] 43.29% | 633 | 33.5% |