Eastern European Married-Couple Family Poverty

COMPARE

Eastern European
Race
Ancestry
AfghanAfricanAlaska NativeAlaskan AthabascanAlbanianAleutAlsatianAmericanApacheArabArapahoArgentineanArmenianAssyrian/Chaldean/SyriacAustralianAustrianBahamianBangladeshiBarbadianBasqueBelgianBelizeanBermudanBhutaneseBlackfeetBolivianBrazilianBritishBritish West IndianBulgarianBurmeseCajunCambodianCanadianCape VerdeanCarpatho RusynCelticCentral AmericanCentral American IndianCherokeeCheyenneChickasawChileanChineseChippewaChoctawColombianColvilleComancheCosta RicanCreeCreekCroatianCrowCubanCypriotCzechCzechoslovakianDanishDelawareDominicanDutchDutch West IndianEastern EuropeanEcuadorianEgyptianEnglishEstonianEthiopianEuropeanFijianFilipinoFinnishFrenchFrench American IndianFrench CanadianGermanGerman RussianGhanaianGreekGuamanian/ChamorroGuatemalanGuyaneseHaitianHmongHonduranHopiHoumaHungarianIcelanderIndian (Asian)IndonesianInupiatIranianIraqiIrishIroquoisIsraeliItalianJamaicanJapaneseJordanianKenyanKiowaKoreanLaotianLatvianLebaneseLiberianLithuanianLumbeeLuxembourgerMacedonianMalaysianMalteseMarshalleseMenomineeMexicanMexican American IndianMongolianMoroccanNative HawaiianNavajoNepaleseNew ZealanderNicaraguanNigerianNorthern EuropeanNorwegianOkinawanOsageOttawaPaiutePakistaniPalestinianPanamanianParaguayanPennsylvania GermanPeruvianPimaPolishPortuguesePotawatomiPuebloPuerto RicanPuget Sound SalishRomanianRussianSalvadoranSamoanScandinavianScotch-IrishScottishSeminoleSenegaleseSerbianShoshoneSierra LeoneanSiouxSlavicSlovakSloveneSomaliSouth AfricanSouth AmericanSouth American IndianSoviet UnionSpaniardSpanishSpanish AmericanSpanish American IndianSri LankanSubsaharan AfricanSudaneseSwedishSwissSyrianTaiwaneseThaiTlingit-HaidaTohono O'OdhamTonganTrinidadian and TobagonianTsimshianTurkishU.S. Virgin IslanderUgandanUkrainianUruguayanUteVenezuelanVietnameseWelshWest IndianYakamaYaquiYugoslavianYumanYup'ikZimbabwean
Immigration
NonimmigrantsImmigrantsAfghanistanAfricaAlbaniaArgentinaArmeniaAsiaAustraliaAustriaBahamasBangladeshBarbadosBelarusBelgiumBelizeBoliviaBosnia and HerzegovinaBrazilBulgariaBurma/MyanmarCabo VerdeCambodiaCameroonCanadaCaribbeanCentral AmericaChileChinaColombiaCongoCosta RicaCroatiaCubaCzechoslovakiaDenmarkDominicaDominican RepublicEastern AfricaEastern AsiaEastern EuropeEcuadorEgyptEl SalvadorEnglandEritreaEthiopiaEuropeFijiFranceGermanyGhanaGreeceGrenadaGuatemalaGuyanaHaitiHondurasHong KongHungaryIndiaIndonesiaIranIraqIrelandIsraelItalyJamaicaJapanJordanKazakhstanKenyaKoreaKuwaitLaosLatin AmericaLatviaLebanonLiberiaLithuaniaMalaysiaMexicoMicronesiaMiddle AfricaMoldovaMoroccoNepalNetherlandsNicaraguaNigeriaNorth AmericaNorth MacedoniaNorthern AfricaNorthern EuropeNorwayOceaniaPakistanPanamaPeruPhilippinesPolandPortugalRomaniaRussiaSaudi ArabiaScotlandSenegalSerbiaSierra LeoneSingaporeSomaliaSouth AfricaSouth AmericaSouth Central AsiaSouth Eastern AsiaSouthern EuropeSpainSri LankaSt. Vincent and the GrenadinesSudanSwedenSwitzerlandSyriaTaiwanThailandTrinidad and TobagoTurkeyUgandaUkraineUruguayUzbekistanVenezuelaVietnamWest IndiesWestern AfricaWestern AsiaWestern EuropeYemenZaireZimbabweAzores
Select to Compare
Race
Ancestry
AfghanAfricanAlaska NativeAlaskan AthabascanAlbanianAleutAlsatianAmericanApacheArabArapahoArgentineanArmenianAssyrian/Chaldean/SyriacAustralianAustrianBahamianBangladeshiBarbadianBasqueBelgianBelizeanBermudanBhutaneseBlackfeetBolivianBrazilianBritishBritish West IndianBulgarianBurmeseCajunCambodianCanadianCape VerdeanCarpatho RusynCelticCentral AmericanCentral American IndianCherokeeCheyenneChickasawChileanChineseChippewaChoctawColombianColvilleComancheCosta RicanCreeCreekCroatianCrowCubanCypriotCzechCzechoslovakianDanishDelawareDominicanDutchDutch West IndianEcuadorianEgyptianEnglishEstonianEthiopianEuropeanFijianFilipinoFinnishFrenchFrench American IndianFrench CanadianGermanGerman RussianGhanaianGreekGuamanian/ChamorroGuatemalanGuyaneseHaitianHmongHonduranHopiHoumaHungarianIcelanderIndian (Asian)IndonesianInupiatIranianIraqiIrishIroquoisIsraeliItalianJamaicanJapaneseJordanianKenyanKiowaKoreanLaotianLatvianLebaneseLiberianLithuanianLumbeeLuxembourgerMacedonianMalaysianMalteseMarshalleseMenomineeMexicanMexican American IndianMongolianMoroccanNative HawaiianNavajoNepaleseNew ZealanderNicaraguanNigerianNorthern EuropeanNorwegianOkinawanOsageOttawaPaiutePakistaniPalestinianPanamanianParaguayanPennsylvania GermanPeruvianPimaPolishPortuguesePotawatomiPuebloPuerto RicanPuget Sound SalishRomanianRussianSalvadoranSamoanScandinavianScotch-IrishScottishSeminoleSenegaleseSerbianShoshoneSierra LeoneanSiouxSlavicSlovakSloveneSomaliSouth AfricanSouth AmericanSouth American IndianSoviet UnionSpaniardSpanishSpanish AmericanSpanish American IndianSri LankanSubsaharan AfricanSudaneseSwedishSwissSyrianTaiwaneseThaiTlingit-HaidaTohono O'OdhamTonganTrinidadian and TobagonianTsimshianTurkishU.S. Virgin IslanderUgandanUkrainianUruguayanUteVenezuelanVietnameseWelshWest IndianYakamaYaquiYugoslavianYumanYup'ikZimbabwean
Immigration
NonimmigrantsImmigrantsAfghanistanAfricaAlbaniaArgentinaArmeniaAsiaAustraliaAustriaBahamasBangladeshBarbadosBelarusBelgiumBelizeBoliviaBosnia and HerzegovinaBrazilBulgariaBurma/MyanmarCabo VerdeCambodiaCameroonCanadaCaribbeanCentral AmericaChileChinaColombiaCongoCosta RicaCroatiaCubaCzechoslovakiaDenmarkDominicaDominican RepublicEastern AfricaEastern AsiaEastern EuropeEcuadorEgyptEl SalvadorEnglandEritreaEthiopiaEuropeFijiFranceGermanyGhanaGreeceGrenadaGuatemalaGuyanaHaitiHondurasHong KongHungaryIndiaIndonesiaIranIraqIrelandIsraelItalyJamaicaJapanJordanKazakhstanKenyaKoreaKuwaitLaosLatin AmericaLatviaLebanonLiberiaLithuaniaMalaysiaMexicoMicronesiaMiddle AfricaMoldovaMoroccoNepalNetherlandsNicaraguaNigeriaNorth AmericaNorth MacedoniaNorthern AfricaNorthern EuropeNorwayOceaniaPakistanPanamaPeruPhilippinesPolandPortugalRomaniaRussiaSaudi ArabiaScotlandSenegalSerbiaSierra LeoneSingaporeSomaliaSouth AfricaSouth AmericaSouth Central AsiaSouth Eastern AsiaSouthern EuropeSpainSri LankaSt. Vincent and the GrenadinesSudanSwedenSwitzerlandSyriaTaiwanThailandTrinidad and TobagoTurkeyUgandaUkraineUruguayUzbekistanVenezuelaVietnamWest IndiesWestern AfricaWestern AsiaWestern EuropeYemenZaireZimbabweAzores
Married-Couple Family Poverty
Income
Poverty
Unemployment
Labor Participation
Family Structure
Vehicle Availability
Education Level
Disability

Eastern European Married-Couple Family Poverty
Exceptional

4.1%
POVERTY | MARRIED-COUPLE FAMILIES
99.9/ 100
METRIC RATING
24th/ 347
METRIC RANK

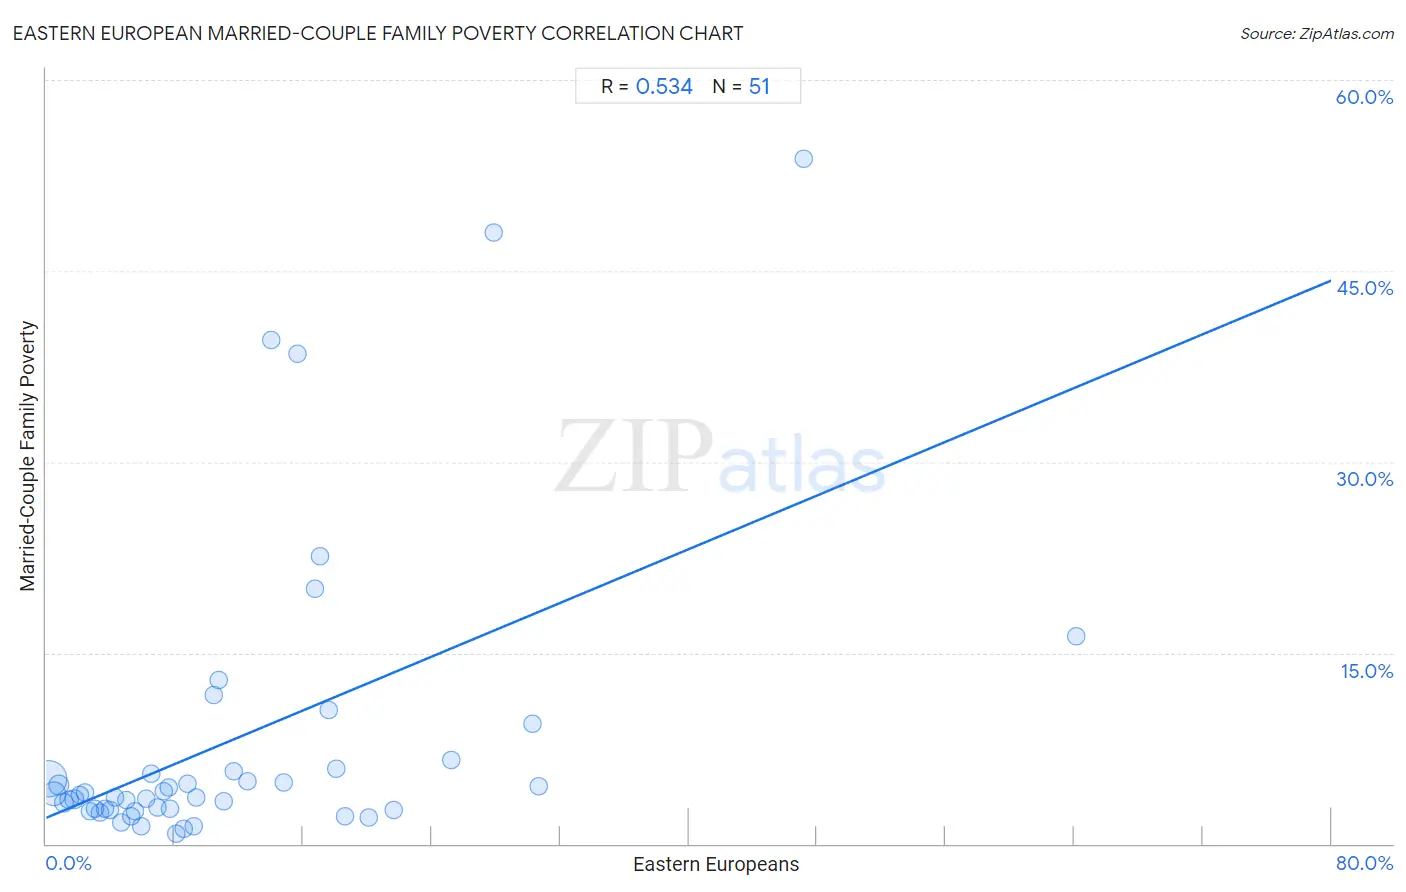
Eastern European Married-Couple Family Poverty Correlation Chart

The statistical analysis conducted on geographies consisting of 454,266,648 people shows a substantial positive correlation between the proportion of Eastern Europeans and poverty level among married-couple families in the United States with a correlation coefficient (R) of 0.534 and weighted average of 4.1%. On average, for every 1% (one percent) increase in Eastern Europeans within a typical geography, there is an increase of 0.53% in poverty level among married-couple families.
Eastern European Married-Couple Family Poverty
It is essential to understand that the correlation between the percentage of Eastern Europeans and poverty level among married-couple families does not imply a direct cause-and-effect relationship. It remains uncertain whether the presence of Eastern Europeans influences an upward or downward trend in the level of poverty level among married-couple families within an area, or if Eastern Europeans simply ended up residing in those areas with higher or lower levels of poverty level among married-couple families due to other factors.

Demographics Similar to Eastern Europeans by Married-Couple Family Poverty

In terms of married-couple family poverty, the demographic groups most similar to Eastern Europeans are Bhutanese (4.1%, a difference of 0.23%), Immigrants from Singapore (4.1%, a difference of 0.26%), Immigrants from Taiwan (4.1%, a difference of 0.57%), Zimbabwean (4.1%, a difference of 0.62%), and Maltese (4.1%, a difference of 0.65%).
DemographicsRating | RankMarried-Couple Family Poverty
Filipinos
100.0
/100
|
#17
Exceptional
4.0%
Italians
100.0
/100
|
#18
Exceptional
4.0%
Immigrants from Ireland
99.9
/100
|
#19
Exceptional
4.1%
Maltese
99.9
/100
|
#20
Exceptional
4.1%
Zimbabweans
99.9
/100
|
#21
Exceptional
4.1%
Immigrants from Singapore
99.9
/100
|
#22
Exceptional
4.1%
Bhutanese
99.9
/100
|
#23
Exceptional
4.1%
Eastern Europeans
99.9
/100
|
#24
Exceptional
4.1%
Immigrants from Taiwan
99.9
/100
|
#25
Exceptional
4.1%
Cypriots
99.9
/100
|
#26
Exceptional
4.1%
Danes
99.9
/100
|
#27
Exceptional
4.1%
Scandinavians
99.9
/100
|
#28
Exceptional
4.1%
Immigrants from Scotland
99.9
/100
|
#29
Exceptional
4.2%
Finns
99.9
/100
|
#30
Exceptional
4.2%
Estonians
99.9
/100
|
#31
Exceptional
4.2%

Eastern European Married-Couple Family Poverty Correlation Summary

MeasurementEastern European DataMarried-Couple Family Poverty Data
Minimum0.14%0.83%
Maximum64.1%53.8%
Range64.0%53.0%
Mean11.8%8.3%
Median8.1%3.8%
Interquartile 25% (IQ1)4.0%2.7%
Interquartile 75% (IQ3)16.7%5.9%
Interquartile Range (IQR)12.7%3.2%
Standard Deviation (Sample)12.0%11.8%
Standard Deviation (Population)11.9%11.7%

Correlation Details

Eastern European PercentileSample SizeMarried-Couple Family Poverty
[
0.0%
-
0.5%
]
0.14%
289,846,6295.1%
[
0.0%
-
0.5%
]
0.45%
94,121,2353.9%
[
0.5%
-
1.0%
]
0.79%
36,750,2014.6%
[
1.0%
-
1.5%
]
1.09%
14,373,4183.2%
[
1.0%
-
1.5%
]
1.43%
6,561,2983.5%
[
1.5%
-
2.0%
]
1.75%
3,768,0663.5%
[
2.0%
-
2.5%
]
2.07%
2,223,4023.8%
[
2.0%
-
2.5%
]
2.40%
1,809,1744.0%
[
2.5%
-
3.0%
]
2.72%
1,052,9372.6%
[
3.0%
-
3.5%
]
3.03%
885,7122.8%
[
3.0%
-
3.5%
]
3.35%
456,7492.4%
[
3.5%
-
4.0%
]
3.67%
585,1112.8%
[
4.0%
-
4.5%
]
4.00%
250,2672.7%
[
4.0%
-
4.5%
]
4.30%
507,5243.6%
[
4.5%
-
5.0%
]
4.68%
208,9331.6%
[
4.5%
-
5.0%
]
4.98%
143,6493.4%
[
5.0%
-
5.5%
]
5.30%
191,3662.2%
[
5.5%
-
6.0%
]
5.50%
196,1532.5%
[
5.5%
-
6.0%
]
5.92%
126,6781.4%
[
6.0%
-
6.5%
]
6.20%
27,3643.6%
[
6.5%
-
7.0%
]
6.52%
1,7345.5%
[
6.5%
-
7.0%
]
6.91%
24,0522.8%
[
7.0%
-
7.5%
]
7.31%
14,8014.1%
[
7.5%
-
8.0%
]
7.60%
10,3404.5%
[
7.5%
-
8.0%
]
7.74%
33,5142.8%
[
8.0%
-
8.5%
]
8.06%
24,4560.83%
[
8.5%
-
9.0%
]
8.57%
30,1021.1%
[
8.5%
-
9.0%
]
8.78%
3,8384.7%
[
9.0%
-
9.5%
]
9.17%
14,0201.4%
[
9.0%
-
9.5%
]
9.34%
1,9373.7%
[
10.0%
-
10.5%
]
10.41%
79711.7%
[
10.5%
-
11.0%
]
10.75%
2,56812.9%
[
11.0%
-
11.5%
]
11.04%
3,9673.3%
[
11.5%
-
12.0%
]
11.66%
2,8555.7%
[
12.5%
-
13.0%
]
12.56%
1,4174.9%
[
14.0%
-
14.5%
]
14.04%
17839.6%
[
14.5%
-
15.0%
]
14.81%
1,3504.8%
[
15.5%
-
16.0%
]
15.62%
16038.5%
[
16.5%
-
17.0%
]
16.69%
59920.0%
[
17.0%
-
17.5%
]
17.07%
12322.6%
[
17.5%
-
18.0%
]
17.61%
35210.5%
[
18.0%
-
18.5%
]
18.06%
1555.9%
[
18.5%
-
19.0%
]
18.63%
2,7102.1%
[
20.0%
-
20.5%
]
20.04%
4842.0%
[
21.5%
-
22.0%
]
21.66%
1,8472.6%
[
25.0%
-
25.5%
]
25.20%
6116.6%
[
27.5%
-
28.0%
]
27.87%
24448.1%
[
30.0%
-
30.5%
]
30.26%
9989.4%
[
30.5%
-
31.0%
]
30.70%
3164.5%
[
47.0%
-
47.5%
]
47.13%
8753.8%
[
64.0%
-
64.5%
]
64.12%
17016.3%