Blackfeet Married-Couple Family Poverty
COMPARE
Blackfeet
Select to Compare
Married-Couple Family Poverty
Blackfeet Married-Couple Family Poverty
6.2%
POVERTY | MARRIED-COUPLE FAMILIES
0.2/ 100
METRIC RATING
265th/ 347
METRIC RANK
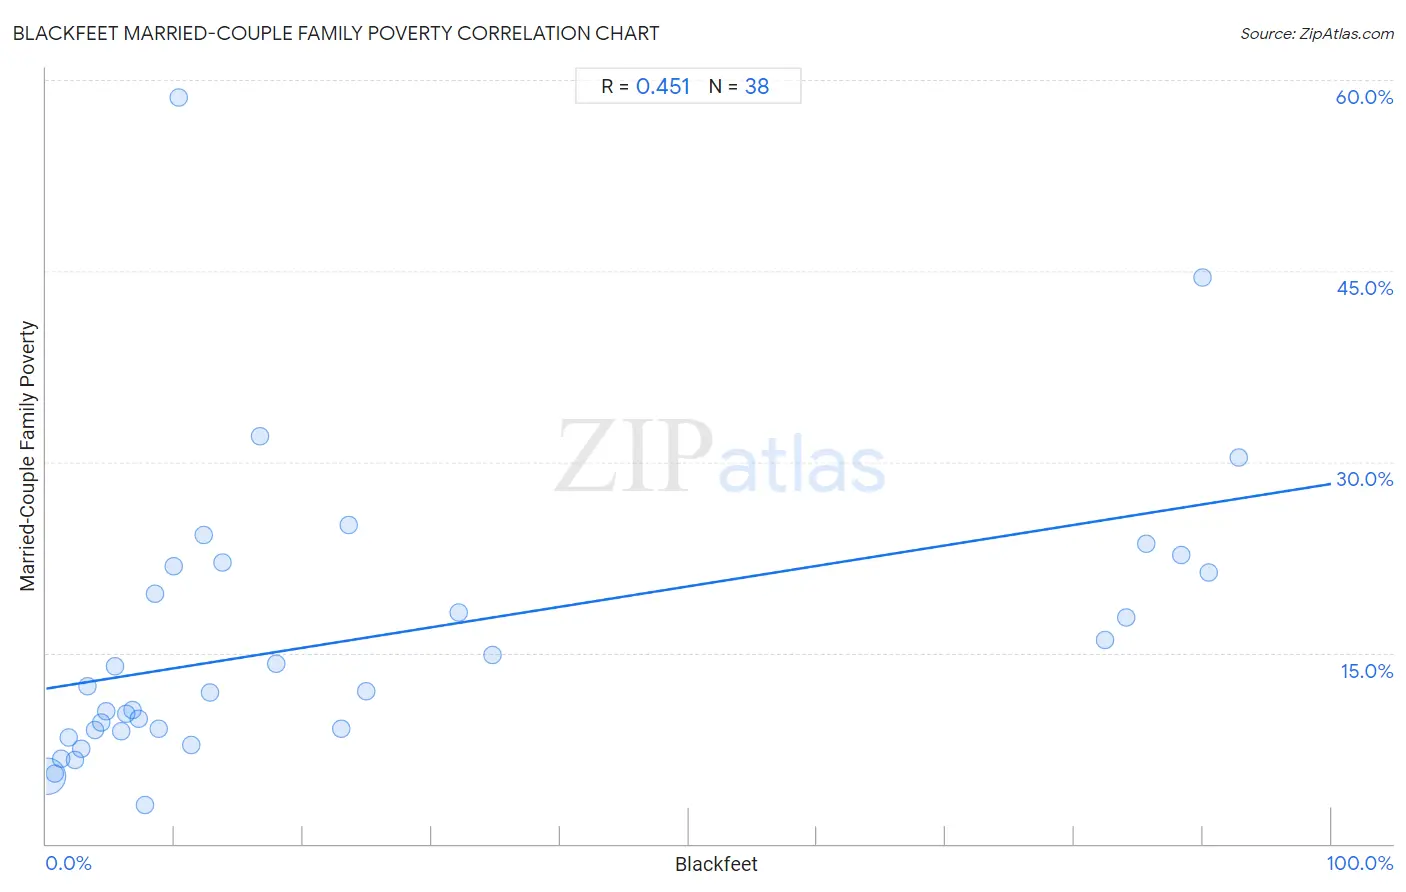
Blackfeet Married-Couple Family Poverty Correlation Chart
The statistical analysis conducted on geographies consisting of 307,833,949 people shows a moderate positive correlation between the proportion of Blackfeet and poverty level among married-couple families in the United States with a correlation coefficient (R) of 0.451 and weighted average of 6.2%. On average, for every 1% (one percent) increase in Blackfeet within a typical geography, there is an increase of 0.16% in poverty level among married-couple families.
It is essential to understand that the correlation between the percentage of Blackfeet and poverty level among married-couple families does not imply a direct cause-and-effect relationship. It remains uncertain whether the presence of Blackfeet influences an upward or downward trend in the level of poverty level among married-couple families within an area, or if Blackfeet simply ended up residing in those areas with higher or lower levels of poverty level among married-couple families due to other factors.
Demographics Similar to Blackfeet by Married-Couple Family Poverty
In terms of married-couple family poverty, the demographic groups most similar to Blackfeet are Creek (6.2%, a difference of 0.080%), Spanish American (6.2%, a difference of 0.13%), Immigrants from Congo (6.1%, a difference of 0.43%), Alaska Native (6.2%, a difference of 0.61%), and Immigrants from Senegal (6.1%, a difference of 0.66%).
| Demographics | Rating | Rank | Married-Couple Family Poverty |
| Immigrants | 0.5 /100 | #258 | Tragic 6.0% |
| Alaskan Athabascans | 0.4 /100 | #259 | Tragic 6.1% |
| Jamaicans | 0.3 /100 | #260 | Tragic 6.1% |
| Senegalese | 0.3 /100 | #261 | Tragic 6.1% |
| Shoshone | 0.3 /100 | #262 | Tragic 6.1% |
| Immigrants from Senegal | 0.3 /100 | #263 | Tragic 6.1% |
| Immigrants from Congo | 0.2 /100 | #264 | Tragic 6.1% |
| Blackfeet | 0.2 /100 | #265 | Tragic 6.2% |
| Creek | 0.2 /100 | #266 | Tragic 6.2% |
| Spanish Americans | 0.2 /100 | #267 | Tragic 6.2% |
| Alaska Natives | 0.2 /100 | #268 | Tragic 6.2% |
| Immigrants from West Indies | 0.1 /100 | #269 | Tragic 6.2% |
| Immigrants from Jamaica | 0.1 /100 | #270 | Tragic 6.2% |
| Immigrants from Bahamas | 0.1 /100 | #271 | Tragic 6.2% |
| Trinidadians and Tobagonians | 0.1 /100 | #272 | Tragic 6.2% |
Blackfeet Married-Couple Family Poverty Correlation Summary
| Measurement | Blackfeet Data | Married-Couple Family Poverty Data |
| Minimum | 0.087% | 3.1% |
| Maximum | 92.8% | 58.6% |
| Range | 92.7% | 55.5% |
| Mean | 24.7% | 16.2% |
| Median | 10.1% | 12.2% |
| Interquartile 25% (IQ1) | 4.7% | 9.0% |
| Interquartile 75% (IQ3) | 24.9% | 21.8% |
| Interquartile Range (IQR) | 20.2% | 12.8% |
| Standard Deviation (Sample) | 31.5% | 11.2% |
| Standard Deviation (Population) | 31.0% | 11.1% |
Correlation Details
| Blackfeet Percentile | Sample Size | Married-Couple Family Poverty |
[ 0.0% - 0.5% ] 0.087% | 299,529,888 | 5.3% |
[ 0.5% - 1.0% ] 0.68% | 6,349,070 | 5.5% |
[ 1.0% - 1.5% ] 1.20% | 896,810 | 6.6% |
[ 1.5% - 2.0% ] 1.72% | 632,467 | 8.4% |
[ 2.0% - 2.5% ] 2.20% | 196,516 | 6.6% |
[ 2.5% - 3.0% ] 2.68% | 63,164 | 7.5% |
[ 3.0% - 3.5% ] 3.25% | 39,470 | 12.4% |
[ 3.5% - 4.0% ] 3.77% | 25,432 | 9.0% |
[ 4.0% - 4.5% ] 4.28% | 26,476 | 9.5% |
[ 4.5% - 5.0% ] 4.67% | 6,084 | 10.4% |
[ 5.0% - 5.5% ] 5.35% | 5,436 | 14.0% |
[ 5.5% - 6.0% ] 5.83% | 13,624 | 8.8% |
[ 6.0% - 6.5% ] 6.26% | 9,051 | 10.3% |
[ 6.5% - 7.0% ] 6.71% | 1,997 | 10.5% |
[ 7.0% - 7.5% ] 7.22% | 3,199 | 9.8% |
[ 7.5% - 8.0% ] 7.64% | 2,645 | 3.1% |
[ 8.0% - 8.5% ] 8.45% | 1,799 | 19.6% |
[ 8.5% - 9.0% ] 8.78% | 1,901 | 9.0% |
[ 9.5% - 10.0% ] 9.95% | 221 | 21.8% |
[ 10.0% - 10.5% ] 10.32% | 853 | 58.6% |
[ 11.0% - 11.5% ] 11.26% | 1,563 | 7.7% |
[ 12.0% - 12.5% ] 12.24% | 147 | 24.2% |
[ 12.5% - 13.0% ] 12.78% | 266 | 11.9% |
[ 13.5% - 14.0% ] 13.68% | 658 | 22.1% |
[ 16.5% - 17.0% ] 16.67% | 534 | 32.0% |
[ 17.5% - 18.0% ] 17.94% | 3,061 | 14.1% |
[ 22.5% - 23.0% ] 22.98% | 5,008 | 9.1% |
[ 23.5% - 24.0% ] 23.53% | 85 | 25.0% |
[ 24.5% - 25.0% ] 24.88% | 414 | 11.9% |
[ 32.0% - 32.5% ] 32.06% | 262 | 18.2% |
[ 34.5% - 35.0% ] 34.78% | 1,317 | 14.8% |
[ 82.0% - 82.5% ] 82.35% | 1,654 | 16.0% |
[ 84.0% - 84.5% ] 84.09% | 7,532 | 17.8% |
[ 85.5% - 86.0% ] 85.65% | 871 | 23.5% |
[ 88.0% - 88.5% ] 88.34% | 3,001 | 22.7% |
[ 89.5% - 90.0% ] 89.96% | 229 | 44.4% |
[ 90.0% - 90.5% ] 90.43% | 690 | 21.3% |
[ 92.5% - 93.0% ] 92.78% | 554 | 30.3% |