Burmese Married-Couple Family Poverty
COMPARE
Burmese
Select to Compare
Married-Couple Family Poverty
Burmese Married-Couple Family Poverty
4.3%
POVERTY | MARRIED-COUPLE FAMILIES
99.7/ 100
METRIC RATING
50th/ 347
METRIC RANK
Burmese Married-Couple Family Poverty Correlation Chart
The statistical analysis conducted on geographies consisting of 459,334,774 people shows a slight positive correlation between the proportion of Burmese and poverty level among married-couple families in the United States with a correlation coefficient (R) of 0.072 and weighted average of 4.3%. On average, for every 1% (one percent) increase in Burmese within a typical geography, there is an increase of 0.017% in poverty level among married-couple families.
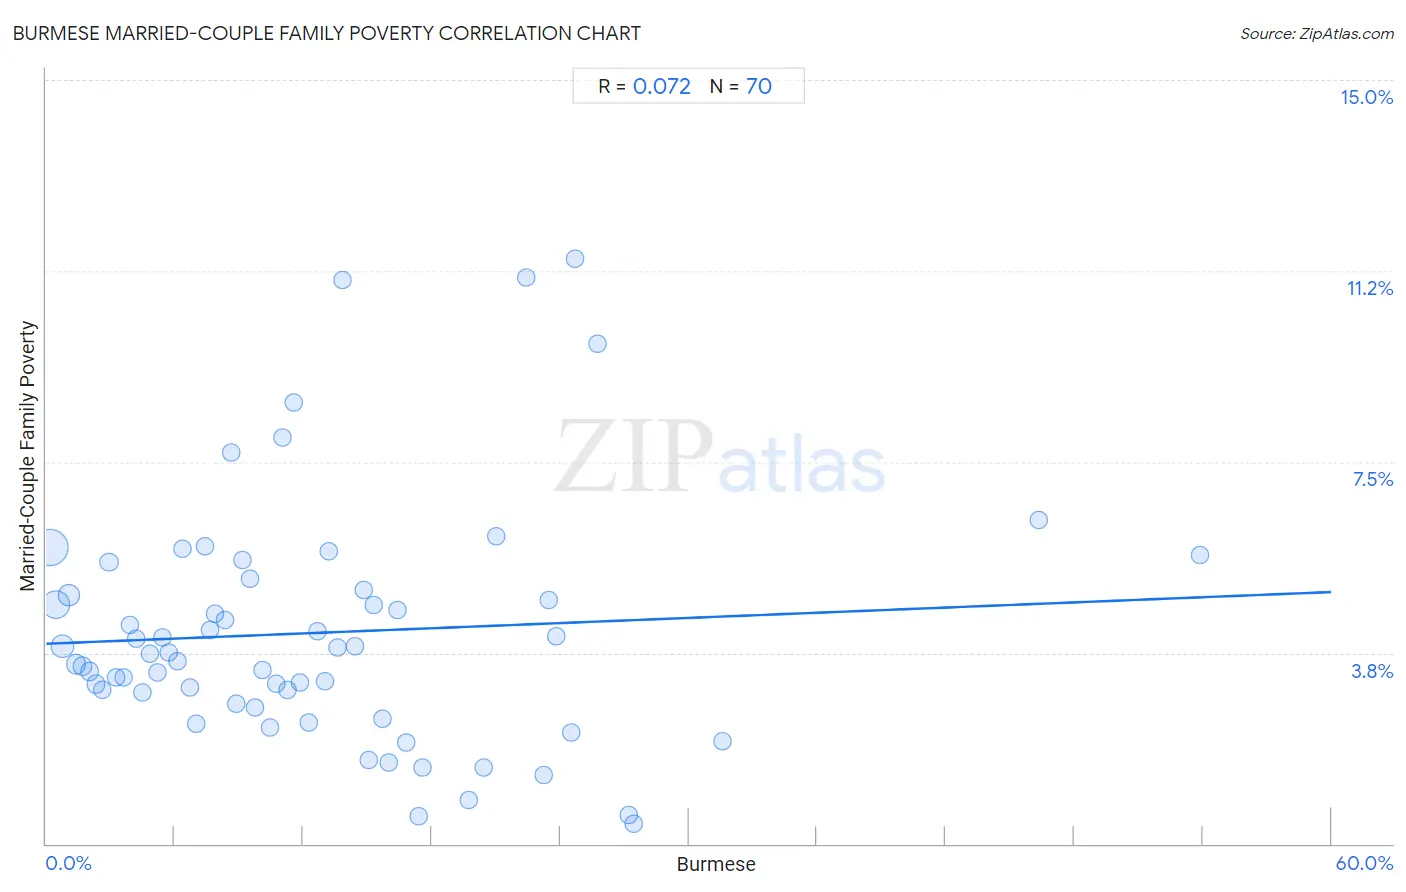
It is essential to understand that the correlation between the percentage of Burmese and poverty level among married-couple families does not imply a direct cause-and-effect relationship. It remains uncertain whether the presence of Burmese influences an upward or downward trend in the level of poverty level among married-couple families within an area, or if Burmese simply ended up residing in those areas with higher or lower levels of poverty level among married-couple families due to other factors.
Demographics Similar to Burmese by Married-Couple Family Poverty
In terms of married-couple family poverty, the demographic groups most similar to Burmese are Immigrants from Lithuania (4.3%, a difference of 0.010%), Russian (4.3%, a difference of 0.040%), Turkish (4.3%, a difference of 0.10%), Australian (4.3%, a difference of 0.18%), and Welsh (4.3%, a difference of 0.19%).
| Demographics | Rating | Rank | Married-Couple Family Poverty |
| Swiss | 99.8 /100 | #43 | Exceptional 4.3% |
| Immigrants from Japan | 99.8 /100 | #44 | Exceptional 4.3% |
| Serbians | 99.8 /100 | #45 | Exceptional 4.3% |
| British | 99.8 /100 | #46 | Exceptional 4.3% |
| Immigrants from South Central Asia | 99.8 /100 | #47 | Exceptional 4.3% |
| Australians | 99.7 /100 | #48 | Exceptional 4.3% |
| Turks | 99.7 /100 | #49 | Exceptional 4.3% |
| Burmese | 99.7 /100 | #50 | Exceptional 4.3% |
| Immigrants from Lithuania | 99.7 /100 | #51 | Exceptional 4.3% |
| Russians | 99.7 /100 | #52 | Exceptional 4.3% |
| Welsh | 99.7 /100 | #53 | Exceptional 4.3% |
| Austrians | 99.7 /100 | #54 | Exceptional 4.3% |
| French | 99.7 /100 | #55 | Exceptional 4.3% |
| Immigrants from Zimbabwe | 99.7 /100 | #56 | Exceptional 4.3% |
| Immigrants from Netherlands | 99.7 /100 | #57 | Exceptional 4.3% |
Burmese Married-Couple Family Poverty Correlation Summary
| Measurement | Burmese Data | Married-Couple Family Poverty Data |
| Minimum | 0.15% | 0.39% |
| Maximum | 53.9% | 11.5% |
| Range | 53.7% | 11.1% |
| Mean | 12.7% | 4.1% |
| Median | 10.9% | 3.8% |
| Interquartile 25% (IQ1) | 5.4% | 2.8% |
| Interquartile 75% (IQ3) | 16.8% | 5.0% |
| Interquartile Range (IQR) | 11.4% | 2.2% |
| Standard Deviation (Sample) | 10.1% | 2.4% |
| Standard Deviation (Population) | 10.0% | 2.4% |
Correlation Details
| Burmese Percentile | Sample Size | Married-Couple Family Poverty |
[ 0.0% - 0.5% ] 0.15% | 192,004,526 | 5.8% |
[ 0.0% - 0.5% ] 0.45% | 109,802,829 | 4.7% |
[ 0.5% - 1.0% ] 0.76% | 51,803,411 | 3.9% |
[ 1.0% - 1.5% ] 1.07% | 34,458,250 | 4.9% |
[ 1.0% - 1.5% ] 1.39% | 17,291,862 | 3.5% |
[ 1.5% - 2.0% ] 1.70% | 13,555,219 | 3.5% |
[ 2.0% - 2.5% ] 2.02% | 8,355,814 | 3.4% |
[ 2.0% - 2.5% ] 2.32% | 5,386,021 | 3.1% |
[ 2.5% - 3.0% ] 2.63% | 3,745,789 | 3.0% |
[ 2.5% - 3.0% ] 2.94% | 7,135,718 | 5.5% |
[ 3.0% - 3.5% ] 3.28% | 2,257,706 | 3.3% |
[ 3.5% - 4.0% ] 3.60% | 1,708,186 | 3.3% |
[ 3.5% - 4.0% ] 3.89% | 1,466,556 | 4.3% |
[ 4.0% - 4.5% ] 4.20% | 1,192,449 | 4.0% |
[ 4.0% - 4.5% ] 4.50% | 1,012,913 | 3.0% |
[ 4.5% - 5.0% ] 4.83% | 620,736 | 3.7% |
[ 5.0% - 5.5% ] 5.17% | 948,005 | 3.4% |
[ 5.0% - 5.5% ] 5.43% | 786,922 | 4.1% |
[ 5.5% - 6.0% ] 5.73% | 287,963 | 3.8% |
[ 6.0% - 6.5% ] 6.11% | 778,535 | 3.6% |
[ 6.0% - 6.5% ] 6.38% | 299,864 | 5.8% |
[ 6.5% - 7.0% ] 6.74% | 222,263 | 3.1% |
[ 6.5% - 7.0% ] 6.99% | 238,790 | 2.4% |
[ 7.0% - 7.5% ] 7.39% | 226,622 | 5.8% |
[ 7.5% - 8.0% ] 7.66% | 124,665 | 4.2% |
[ 7.5% - 8.0% ] 7.87% | 471,707 | 4.5% |
[ 8.0% - 8.5% ] 8.34% | 76,226 | 4.4% |
[ 8.5% - 9.0% ] 8.61% | 131,961 | 7.7% |
[ 8.5% - 9.0% ] 8.87% | 265,025 | 2.8% |
[ 9.0% - 9.5% ] 9.19% | 99,422 | 5.6% |
[ 9.5% - 10.0% ] 9.52% | 138,563 | 5.2% |
[ 9.5% - 10.0% ] 9.75% | 125,470 | 2.7% |
[ 10.0% - 10.5% ] 10.11% | 119,966 | 3.4% |
[ 10.0% - 10.5% ] 10.47% | 35,220 | 2.3% |
[ 10.5% - 11.0% ] 10.77% | 205,131 | 3.1% |
[ 11.0% - 11.5% ] 11.03% | 282,578 | 8.0% |
[ 11.0% - 11.5% ] 11.27% | 40,914 | 3.0% |
[ 11.5% - 12.0% ] 11.58% | 59,410 | 8.7% |
[ 11.5% - 12.0% ] 11.84% | 47,099 | 3.2% |
[ 12.0% - 12.5% ] 12.24% | 22,339 | 2.4% |
[ 12.5% - 13.0% ] 12.68% | 253,938 | 4.2% |
[ 13.0% - 13.5% ] 13.04% | 49,955 | 3.2% |
[ 13.0% - 13.5% ] 13.19% | 229,923 | 5.7% |
[ 13.5% - 14.0% ] 13.57% | 72,859 | 3.9% |
[ 13.5% - 14.0% ] 13.81% | 93,823 | 11.1% |
[ 14.0% - 14.5% ] 14.44% | 22,723 | 3.9% |
[ 14.5% - 15.0% ] 14.80% | 152,639 | 5.0% |
[ 15.0% - 15.5% ] 15.04% | 50,419 | 1.6% |
[ 15.0% - 15.5% ] 15.28% | 746 | 4.7% |
[ 15.5% - 16.0% ] 15.71% | 25,382 | 2.5% |
[ 16.0% - 16.5% ] 16.02% | 24,044 | 1.6% |
[ 16.0% - 16.5% ] 16.41% | 20,092 | 4.6% |
[ 16.5% - 17.0% ] 16.79% | 32,344 | 2.0% |
[ 17.0% - 17.5% ] 17.38% | 30,685 | 0.53% |
[ 17.5% - 18.0% ] 17.58% | 5,495 | 1.5% |
[ 19.5% - 20.0% ] 19.71% | 10,694 | 0.86% |
[ 20.0% - 20.5% ] 20.45% | 28,788 | 1.5% |
[ 21.0% - 21.5% ] 21.01% | 39,049 | 6.0% |
[ 22.0% - 22.5% ] 22.41% | 116 | 11.1% |
[ 23.0% - 23.5% ] 23.22% | 23,546 | 1.3% |
[ 23.0% - 23.5% ] 23.48% | 133,518 | 4.8% |
[ 23.5% - 24.0% ] 23.80% | 22,930 | 4.1% |
[ 24.5% - 25.0% ] 24.51% | 17,110 | 2.2% |
[ 24.5% - 25.0% ] 24.71% | 37,754 | 11.5% |
[ 25.5% - 26.0% ] 25.72% | 43,169 | 9.8% |
[ 27.0% - 27.5% ] 27.19% | 18,564 | 0.57% |
[ 27.0% - 27.5% ] 27.45% | 11,314 | 0.39% |
[ 31.5% - 32.0% ] 31.55% | 5,863 | 2.0% |
[ 46.0% - 46.5% ] 46.33% | 4,185 | 6.4% |
[ 53.5% - 54.0% ] 53.89% | 40,462 | 5.7% |