Lumbee Married-Couple Family Poverty

COMPARE

Lumbee
Race
Ancestry
AfghanAfricanAlaska NativeAlaskan AthabascanAlbanianAleutAlsatianAmericanApacheArabArapahoArgentineanArmenianAssyrian/Chaldean/SyriacAustralianAustrianBahamianBangladeshiBarbadianBasqueBelgianBelizeanBermudanBhutaneseBlackfeetBolivianBrazilianBritishBritish West IndianBulgarianBurmeseCajunCambodianCanadianCape VerdeanCarpatho RusynCelticCentral AmericanCentral American IndianCherokeeCheyenneChickasawChileanChineseChippewaChoctawColombianColvilleComancheCosta RicanCreeCreekCroatianCrowCubanCypriotCzechCzechoslovakianDanishDelawareDominicanDutchDutch West IndianEastern EuropeanEcuadorianEgyptianEnglishEstonianEthiopianEuropeanFijianFilipinoFinnishFrenchFrench American IndianFrench CanadianGermanGerman RussianGhanaianGreekGuamanian/ChamorroGuatemalanGuyaneseHaitianHmongHonduranHopiHoumaHungarianIcelanderIndian (Asian)IndonesianInupiatIranianIraqiIrishIroquoisIsraeliItalianJamaicanJapaneseJordanianKenyanKiowaKoreanLaotianLatvianLebaneseLiberianLithuanianLumbeeLuxembourgerMacedonianMalaysianMalteseMarshalleseMenomineeMexicanMexican American IndianMongolianMoroccanNative HawaiianNavajoNepaleseNew ZealanderNicaraguanNigerianNorthern EuropeanNorwegianOkinawanOsageOttawaPaiutePakistaniPalestinianPanamanianParaguayanPennsylvania GermanPeruvianPimaPolishPortuguesePotawatomiPuebloPuerto RicanPuget Sound SalishRomanianRussianSalvadoranSamoanScandinavianScotch-IrishScottishSeminoleSenegaleseSerbianShoshoneSierra LeoneanSiouxSlavicSlovakSloveneSomaliSouth AfricanSouth AmericanSouth American IndianSoviet UnionSpaniardSpanishSpanish AmericanSpanish American IndianSri LankanSubsaharan AfricanSudaneseSwedishSwissSyrianTaiwaneseThaiTlingit-HaidaTohono O'OdhamTonganTrinidadian and TobagonianTsimshianTurkishU.S. Virgin IslanderUgandanUkrainianUruguayanUteVenezuelanVietnameseWelshWest IndianYakamaYaquiYugoslavianYumanYup'ikZimbabwean
Immigration
NonimmigrantsImmigrantsAfghanistanAfricaAlbaniaArgentinaArmeniaAsiaAustraliaAustriaBahamasBangladeshBarbadosBelarusBelgiumBelizeBoliviaBosnia and HerzegovinaBrazilBulgariaBurma/MyanmarCabo VerdeCambodiaCameroonCanadaCaribbeanCentral AmericaChileChinaColombiaCongoCosta RicaCroatiaCubaCzechoslovakiaDenmarkDominicaDominican RepublicEastern AfricaEastern AsiaEastern EuropeEcuadorEgyptEl SalvadorEnglandEritreaEthiopiaEuropeFijiFranceGermanyGhanaGreeceGrenadaGuatemalaGuyanaHaitiHondurasHong KongHungaryIndiaIndonesiaIranIraqIrelandIsraelItalyJamaicaJapanJordanKazakhstanKenyaKoreaKuwaitLaosLatin AmericaLatviaLebanonLiberiaLithuaniaMalaysiaMexicoMicronesiaMiddle AfricaMoldovaMoroccoNepalNetherlandsNicaraguaNigeriaNorth AmericaNorth MacedoniaNorthern AfricaNorthern EuropeNorwayOceaniaPakistanPanamaPeruPhilippinesPolandPortugalRomaniaRussiaSaudi ArabiaScotlandSenegalSerbiaSierra LeoneSingaporeSomaliaSouth AfricaSouth AmericaSouth Central AsiaSouth Eastern AsiaSouthern EuropeSpainSri LankaSt. Vincent and the GrenadinesSudanSwedenSwitzerlandSyriaTaiwanThailandTrinidad and TobagoTurkeyUgandaUkraineUruguayUzbekistanVenezuelaVietnamWest IndiesWestern AfricaWestern AsiaWestern EuropeYemenZaireZimbabweAzores
Select to Compare
Race
Ancestry
AfghanAfricanAlaska NativeAlaskan AthabascanAlbanianAleutAlsatianAmericanApacheArabArapahoArgentineanArmenianAssyrian/Chaldean/SyriacAustralianAustrianBahamianBangladeshiBarbadianBasqueBelgianBelizeanBermudanBhutaneseBlackfeetBolivianBrazilianBritishBritish West IndianBulgarianBurmeseCajunCambodianCanadianCape VerdeanCarpatho RusynCelticCentral AmericanCentral American IndianCherokeeCheyenneChickasawChileanChineseChippewaChoctawColombianColvilleComancheCosta RicanCreeCreekCroatianCrowCubanCypriotCzechCzechoslovakianDanishDelawareDominicanDutchDutch West IndianEastern EuropeanEcuadorianEgyptianEnglishEstonianEthiopianEuropeanFijianFilipinoFinnishFrenchFrench American IndianFrench CanadianGermanGerman RussianGhanaianGreekGuamanian/ChamorroGuatemalanGuyaneseHaitianHmongHonduranHopiHoumaHungarianIcelanderIndian (Asian)IndonesianInupiatIranianIraqiIrishIroquoisIsraeliItalianJamaicanJapaneseJordanianKenyanKiowaKoreanLaotianLatvianLebaneseLiberianLithuanianLuxembourgerMacedonianMalaysianMalteseMarshalleseMenomineeMexicanMexican American IndianMongolianMoroccanNative HawaiianNavajoNepaleseNew ZealanderNicaraguanNigerianNorthern EuropeanNorwegianOkinawanOsageOttawaPaiutePakistaniPalestinianPanamanianParaguayanPennsylvania GermanPeruvianPimaPolishPortuguesePotawatomiPuebloPuerto RicanPuget Sound SalishRomanianRussianSalvadoranSamoanScandinavianScotch-IrishScottishSeminoleSenegaleseSerbianShoshoneSierra LeoneanSiouxSlavicSlovakSloveneSomaliSouth AfricanSouth AmericanSouth American IndianSoviet UnionSpaniardSpanishSpanish AmericanSpanish American IndianSri LankanSubsaharan AfricanSudaneseSwedishSwissSyrianTaiwaneseThaiTlingit-HaidaTohono O'OdhamTonganTrinidadian and TobagonianTsimshianTurkishU.S. Virgin IslanderUgandanUkrainianUruguayanUteVenezuelanVietnameseWelshWest IndianYakamaYaquiYugoslavianYumanYup'ikZimbabwean
Immigration
NonimmigrantsImmigrantsAfghanistanAfricaAlbaniaArgentinaArmeniaAsiaAustraliaAustriaBahamasBangladeshBarbadosBelarusBelgiumBelizeBoliviaBosnia and HerzegovinaBrazilBulgariaBurma/MyanmarCabo VerdeCambodiaCameroonCanadaCaribbeanCentral AmericaChileChinaColombiaCongoCosta RicaCroatiaCubaCzechoslovakiaDenmarkDominicaDominican RepublicEastern AfricaEastern AsiaEastern EuropeEcuadorEgyptEl SalvadorEnglandEritreaEthiopiaEuropeFijiFranceGermanyGhanaGreeceGrenadaGuatemalaGuyanaHaitiHondurasHong KongHungaryIndiaIndonesiaIranIraqIrelandIsraelItalyJamaicaJapanJordanKazakhstanKenyaKoreaKuwaitLaosLatin AmericaLatviaLebanonLiberiaLithuaniaMalaysiaMexicoMicronesiaMiddle AfricaMoldovaMoroccoNepalNetherlandsNicaraguaNigeriaNorth AmericaNorth MacedoniaNorthern AfricaNorthern EuropeNorwayOceaniaPakistanPanamaPeruPhilippinesPolandPortugalRomaniaRussiaSaudi ArabiaScotlandSenegalSerbiaSierra LeoneSingaporeSomaliaSouth AfricaSouth AmericaSouth Central AsiaSouth Eastern AsiaSouthern EuropeSpainSri LankaSt. Vincent and the GrenadinesSudanSwedenSwitzerlandSyriaTaiwanThailandTrinidad and TobagoTurkeyUgandaUkraineUruguayUzbekistanVenezuelaVietnamWest IndiesWestern AfricaWestern AsiaWestern EuropeYemenZaireZimbabweAzores
Married-Couple Family Poverty
Income
Poverty
Unemployment
Labor Participation
Family Structure
Vehicle Availability
Education Level
Disability

Lumbee Married-Couple Family Poverty
Tragic

8.3%
POVERTY | MARRIED-COUPLE FAMILIES
0.0/ 100
METRIC RATING
333rd/ 347
METRIC RANK

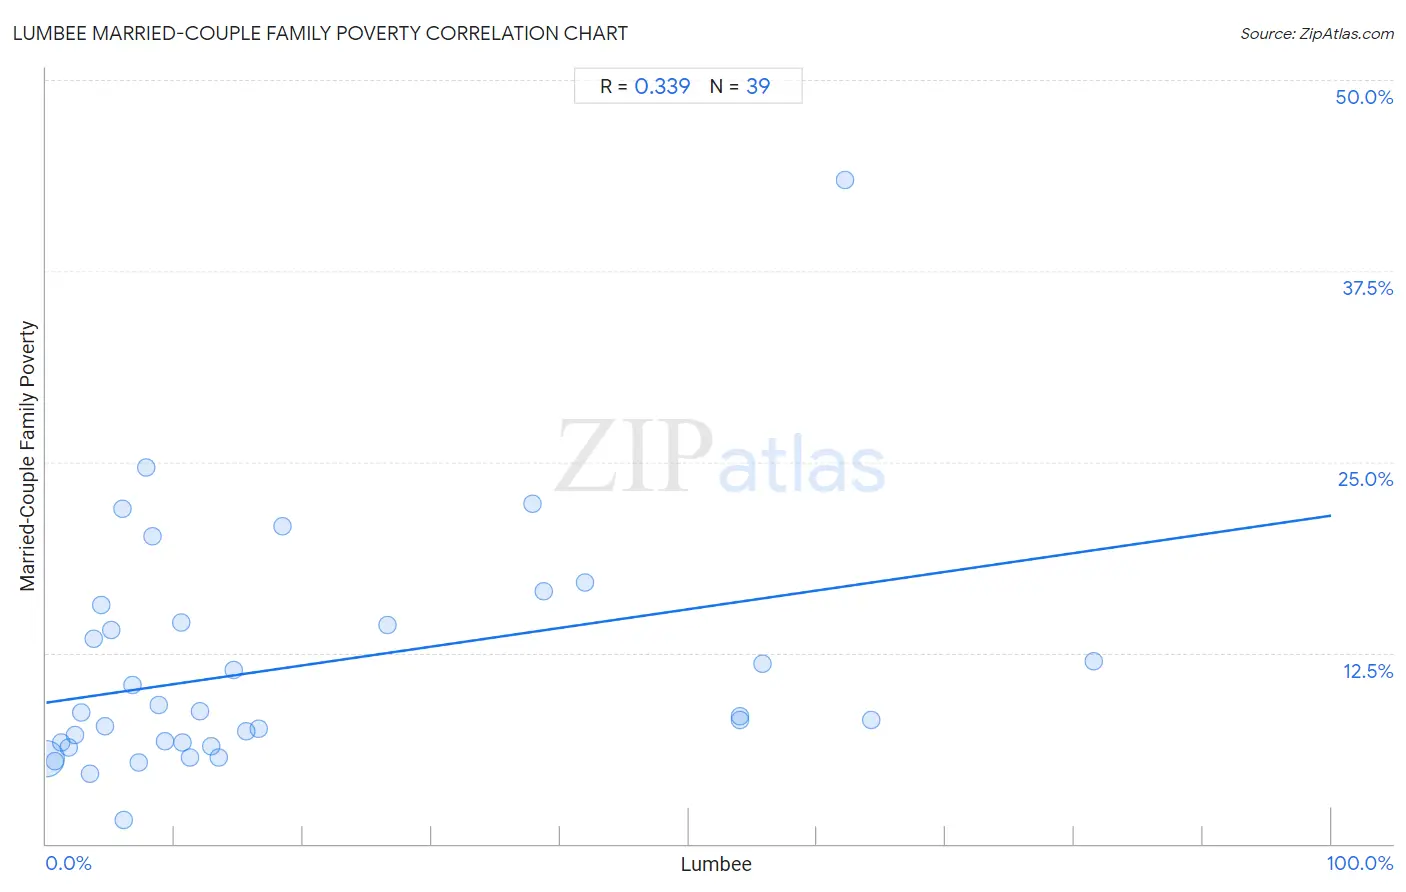
Lumbee Married-Couple Family Poverty Correlation Chart

The statistical analysis conducted on geographies consisting of 92,019,006 people shows a mild positive correlation between the proportion of Lumbee and poverty level among married-couple families in the United States with a correlation coefficient (R) of 0.339 and weighted average of 8.3%. On average, for every 1% (one percent) increase in Lumbee within a typical geography, there is an increase of 0.12% in poverty level among married-couple families.
Lumbee Married-Couple Family Poverty
It is essential to understand that the correlation between the percentage of Lumbee and poverty level among married-couple families does not imply a direct cause-and-effect relationship. It remains uncertain whether the presence of Lumbee influences an upward or downward trend in the level of poverty level among married-couple families within an area, or if Lumbee simply ended up residing in those areas with higher or lower levels of poverty level among married-couple families due to other factors.

Demographics Similar to Lumbee by Married-Couple Family Poverty

In terms of married-couple family poverty, the demographic groups most similar to Lumbee are Dominican (8.3%, a difference of 0.47%), Central American Indian (8.3%, a difference of 0.53%), Paiute (8.3%, a difference of 0.59%), Immigrants from Dominican Republic (8.4%, a difference of 0.68%), and Native/Alaskan (8.2%, a difference of 1.9%).
DemographicsRating | RankMarried-Couple Family Poverty
Immigrants from Bangladesh
0.0
/100
|
#326
Tragic
7.5%
Hispanics or Latinos
0.0
/100
|
#327
Tragic
7.5%
Immigrants from Mexico
0.0
/100
|
#328
Tragic
7.6%
Natives/Alaskans
0.0
/100
|
#329
Tragic
8.2%
Paiute
0.0
/100
|
#330
Tragic
8.3%
Central American Indians
0.0
/100
|
#331
Tragic
8.3%
Dominicans
0.0
/100
|
#332
Tragic
8.3%
Lumbee
0.0
/100
|
#333
Tragic
8.3%
Immigrants from Dominican Republic
0.0
/100
|
#334
Tragic
8.4%
Sioux
0.0
/100
|
#335
Tragic
8.7%
Apache
0.0
/100
|
#336
Tragic
9.0%
Yakama
0.0
/100
|
#337
Tragic
9.0%
Cheyenne
0.0
/100
|
#338
Tragic
9.4%
Crow
0.0
/100
|
#339
Tragic
9.6%
Yuman
0.0
/100
|
#340
Tragic
9.7%

Lumbee Married-Couple Family Poverty Correlation Summary

MeasurementLumbee DataMarried-Couple Family Poverty Data
Minimum0.041%1.5%
Maximum81.5%43.5%
Range81.5%41.9%
Mean19.0%11.6%
Median10.5%8.6%
Interquartile 25% (IQ1)4.6%6.6%
Interquartile 75% (IQ3)26.5%14.5%
Interquartile Range (IQR)21.9%7.9%
Standard Deviation (Sample)21.3%7.7%
Standard Deviation (Population)21.1%7.6%

Correlation Details

Lumbee PercentileSample SizeMarried-Couple Family Poverty
[
0.0%
-
0.5%
]
0.041%
90,257,4115.6%
[
0.5%
-
1.0%
]
0.65%
1,094,5485.4%
[
1.0%
-
1.5%
]
1.20%
211,8656.6%
[
1.5%
-
2.0%
]
1.79%
116,9986.3%
[
2.0%
-
2.5%
]
2.25%
77,9597.1%
[
2.5%
-
3.0%
]
2.71%
9,4778.6%
[
3.0%
-
3.5%
]
3.43%
9,2554.6%
[
3.5%
-
4.0%
]
3.69%
9,27713.5%
[
4.0%
-
4.5%
]
4.24%
3,84815.6%
[
4.5%
-
5.0%
]
4.60%
6,8317.7%
[
5.0%
-
5.5%
]
5.10%
5,42914.0%
[
5.5%
-
6.0%
]
5.90%
32222.0%
[
6.0%
-
6.5%
]
6.05%
2,0161.5%
[
6.5%
-
7.0%
]
6.70%
1,41810.4%
[
7.0%
-
7.5%
]
7.24%
18,8935.3%
[
7.5%
-
8.0%
]
7.81%
67924.6%
[
8.0%
-
8.5%
]
8.27%
1,54820.1%
[
8.5%
-
9.0%
]
8.72%
3,1779.1%
[
9.0%
-
9.5%
]
9.22%
9656.7%
[
10.0%
-
10.5%
]
10.47%
10,58814.5%
[
10.5%
-
11.0%
]
10.57%
9466.7%
[
11.0%
-
11.5%
]
11.24%
27,4945.6%
[
11.5%
-
12.0%
]
11.95%
25,7838.7%
[
12.5%
-
13.0%
]
12.81%
3,2396.4%
[
13.0%
-
13.5%
]
13.47%
2,2725.7%
[
14.5%
-
15.0%
]
14.61%
86911.3%
[
15.5%
-
16.0%
]
15.52%
2,5197.3%
[
16.5%
-
17.0%
]
16.58%
34,0937.6%
[
18.0%
-
18.5%
]
18.38%
3,11820.7%
[
26.5%
-
27.0%
]
26.53%
9,79014.3%
[
37.5%
-
38.0%
]
37.84%
3722.2%
[
38.5%
-
39.0%
]
38.67%
11,54816.5%
[
41.5%
-
42.0%
]
41.93%
5,06517.1%
[
54.0%
-
54.5%
]
54.00%
3008.3%
[
54.0%
-
54.5%
]
54.01%
6,4998.1%
[
55.5%
-
56.0%
]
55.71%
29,67011.8%
[
62.0%
-
62.5%
]
62.12%
26443.5%
[
64.0%
-
64.5%
]
64.19%
12,3468.1%
[
81.5%
-
82.0%
]
81.54%
65012.0%