Immigrants from Ukraine Married-Couple Family Poverty

COMPARE

Immigrants from Ukraine
Race
Ancestry
AfghanAfricanAlaska NativeAlaskan AthabascanAlbanianAleutAlsatianAmericanApacheArabArapahoArgentineanArmenianAssyrian/Chaldean/SyriacAustralianAustrianBahamianBangladeshiBarbadianBasqueBelgianBelizeanBermudanBhutaneseBlackfeetBolivianBrazilianBritishBritish West IndianBulgarianBurmeseCajunCambodianCanadianCape VerdeanCarpatho RusynCelticCentral AmericanCentral American IndianCherokeeCheyenneChickasawChileanChineseChippewaChoctawColombianColvilleComancheCosta RicanCreeCreekCroatianCrowCubanCypriotCzechCzechoslovakianDanishDelawareDominicanDutchDutch West IndianEastern EuropeanEcuadorianEgyptianEnglishEstonianEthiopianEuropeanFijianFilipinoFinnishFrenchFrench American IndianFrench CanadianGermanGerman RussianGhanaianGreekGuamanian/ChamorroGuatemalanGuyaneseHaitianHmongHonduranHopiHoumaHungarianIcelanderIndian (Asian)IndonesianInupiatIranianIraqiIrishIroquoisIsraeliItalianJamaicanJapaneseJordanianKenyanKiowaKoreanLaotianLatvianLebaneseLiberianLithuanianLumbeeLuxembourgerMacedonianMalaysianMalteseMarshalleseMenomineeMexicanMexican American IndianMongolianMoroccanNative HawaiianNavajoNepaleseNew ZealanderNicaraguanNigerianNorthern EuropeanNorwegianOkinawanOsageOttawaPaiutePakistaniPalestinianPanamanianParaguayanPennsylvania GermanPeruvianPimaPolishPortuguesePotawatomiPuebloPuerto RicanPuget Sound SalishRomanianRussianSalvadoranSamoanScandinavianScotch-IrishScottishSeminoleSenegaleseSerbianShoshoneSierra LeoneanSiouxSlavicSlovakSloveneSomaliSouth AfricanSouth AmericanSouth American IndianSoviet UnionSpaniardSpanishSpanish AmericanSpanish American IndianSri LankanSubsaharan AfricanSudaneseSwedishSwissSyrianTaiwaneseThaiTlingit-HaidaTohono O'OdhamTonganTrinidadian and TobagonianTsimshianTurkishU.S. Virgin IslanderUgandanUkrainianUruguayanUteVenezuelanVietnameseWelshWest IndianYakamaYaquiYugoslavianYumanYup'ikZimbabwean
Immigration
NonimmigrantsImmigrantsAfghanistanAfricaAlbaniaArgentinaArmeniaAsiaAustraliaAustriaBahamasBangladeshBarbadosBelarusBelgiumBelizeBoliviaBosnia and HerzegovinaBrazilBulgariaBurma/MyanmarCabo VerdeCambodiaCameroonCanadaCaribbeanCentral AmericaChileChinaColombiaCongoCosta RicaCroatiaCubaCzechoslovakiaDenmarkDominicaDominican RepublicEastern AfricaEastern AsiaEastern EuropeEcuadorEgyptEl SalvadorEnglandEritreaEthiopiaEuropeFijiFranceGermanyGhanaGreeceGrenadaGuatemalaGuyanaHaitiHondurasHong KongHungaryIndiaIndonesiaIranIraqIrelandIsraelItalyJamaicaJapanJordanKazakhstanKenyaKoreaKuwaitLaosLatin AmericaLatviaLebanonLiberiaLithuaniaMalaysiaMexicoMicronesiaMiddle AfricaMoldovaMoroccoNepalNetherlandsNicaraguaNigeriaNorth AmericaNorth MacedoniaNorthern AfricaNorthern EuropeNorwayOceaniaPakistanPanamaPeruPhilippinesPolandPortugalRomaniaRussiaSaudi ArabiaScotlandSenegalSerbiaSierra LeoneSingaporeSomaliaSouth AfricaSouth AmericaSouth Central AsiaSouth Eastern AsiaSouthern EuropeSpainSri LankaSt. Vincent and the GrenadinesSudanSwedenSwitzerlandSyriaTaiwanThailandTrinidad and TobagoTurkeyUgandaUkraineUruguayUzbekistanVenezuelaVietnamWest IndiesWestern AfricaWestern AsiaWestern EuropeYemenZaireZimbabweAzores
Select to Compare
Race
Ancestry
AfghanAfricanAlaska NativeAlaskan AthabascanAlbanianAleutAlsatianAmericanApacheArabArapahoArgentineanArmenianAssyrian/Chaldean/SyriacAustralianAustrianBahamianBangladeshiBarbadianBasqueBelgianBelizeanBermudanBhutaneseBlackfeetBolivianBrazilianBritishBritish West IndianBulgarianBurmeseCajunCambodianCanadianCape VerdeanCarpatho RusynCelticCentral AmericanCentral American IndianCherokeeCheyenneChickasawChileanChineseChippewaChoctawColombianColvilleComancheCosta RicanCreeCreekCroatianCrowCubanCypriotCzechCzechoslovakianDanishDelawareDominicanDutchDutch West IndianEastern EuropeanEcuadorianEgyptianEnglishEstonianEthiopianEuropeanFijianFilipinoFinnishFrenchFrench American IndianFrench CanadianGermanGerman RussianGhanaianGreekGuamanian/ChamorroGuatemalanGuyaneseHaitianHmongHonduranHopiHoumaHungarianIcelanderIndian (Asian)IndonesianInupiatIranianIraqiIrishIroquoisIsraeliItalianJamaicanJapaneseJordanianKenyanKiowaKoreanLaotianLatvianLebaneseLiberianLithuanianLumbeeLuxembourgerMacedonianMalaysianMalteseMarshalleseMenomineeMexicanMexican American IndianMongolianMoroccanNative HawaiianNavajoNepaleseNew ZealanderNicaraguanNigerianNorthern EuropeanNorwegianOkinawanOsageOttawaPaiutePakistaniPalestinianPanamanianParaguayanPennsylvania GermanPeruvianPimaPolishPortuguesePotawatomiPuebloPuerto RicanPuget Sound SalishRomanianRussianSalvadoranSamoanScandinavianScotch-IrishScottishSeminoleSenegaleseSerbianShoshoneSierra LeoneanSiouxSlavicSlovakSloveneSomaliSouth AfricanSouth AmericanSouth American IndianSoviet UnionSpaniardSpanishSpanish AmericanSpanish American IndianSri LankanSubsaharan AfricanSudaneseSwedishSwissSyrianTaiwaneseThaiTlingit-HaidaTohono O'OdhamTonganTrinidadian and TobagonianTsimshianTurkishU.S. Virgin IslanderUgandanUkrainianUruguayanUteVenezuelanVietnameseWelshWest IndianYakamaYaquiYugoslavianYumanYup'ikZimbabwean
Immigration
NonimmigrantsImmigrantsAfghanistanAfricaAlbaniaArgentinaArmeniaAsiaAustraliaAustriaBahamasBangladeshBarbadosBelarusBelgiumBelizeBoliviaBosnia and HerzegovinaBrazilBulgariaBurma/MyanmarCabo VerdeCambodiaCameroonCanadaCaribbeanCentral AmericaChileChinaColombiaCongoCosta RicaCroatiaCubaCzechoslovakiaDenmarkDominicaDominican RepublicEastern AfricaEastern AsiaEastern EuropeEcuadorEgyptEl SalvadorEnglandEritreaEthiopiaEuropeFijiFranceGermanyGhanaGreeceGrenadaGuatemalaGuyanaHaitiHondurasHong KongHungaryIndiaIndonesiaIranIraqIrelandIsraelItalyJamaicaJapanJordanKazakhstanKenyaKoreaKuwaitLaosLatin AmericaLatviaLebanonLiberiaLithuaniaMalaysiaMexicoMicronesiaMiddle AfricaMoldovaMoroccoNepalNetherlandsNicaraguaNigeriaNorth AmericaNorth MacedoniaNorthern AfricaNorthern EuropeNorwayOceaniaPakistanPanamaPeruPhilippinesPolandPortugalRomaniaRussiaSaudi ArabiaScotlandSenegalSerbiaSierra LeoneSingaporeSomaliaSouth AfricaSouth AmericaSouth Central AsiaSouth Eastern AsiaSouthern EuropeSpainSri LankaSt. Vincent and the GrenadinesSudanSwedenSwitzerlandSyriaTaiwanThailandTrinidad and TobagoTurkeyUgandaUruguayUzbekistanVenezuelaVietnamWest IndiesWestern AfricaWestern AsiaWestern EuropeYemenZaireZimbabweAzores
Married-Couple Family Poverty
Income
Poverty
Unemployment
Labor Participation
Family Structure
Vehicle Availability
Education Level
Disability

Immigrants from Ukraine Married-Couple Family Poverty
Average

5.2%
POVERTY | MARRIED-COUPLE FAMILIES
44.9/ 100
METRIC RATING
178th/ 347
METRIC RANK

Immigrants from Ukraine Married-Couple Family Poverty Correlation Chart

The statistical analysis conducted on geographies consisting of 287,534,974 people shows a moderate positive correlation between the proportion of Immigrants from Ukraine and poverty level among married-couple families in the United States with a correlation coefficient (R) of 0.403 and weighted average of 5.2%. On average, for every 1% (one percent) increase in Immigrants from Ukraine within a typical geography, there is an increase of 0.28% in poverty level among married-couple families.
Immigrants from Ukraine Married-Couple Family Poverty
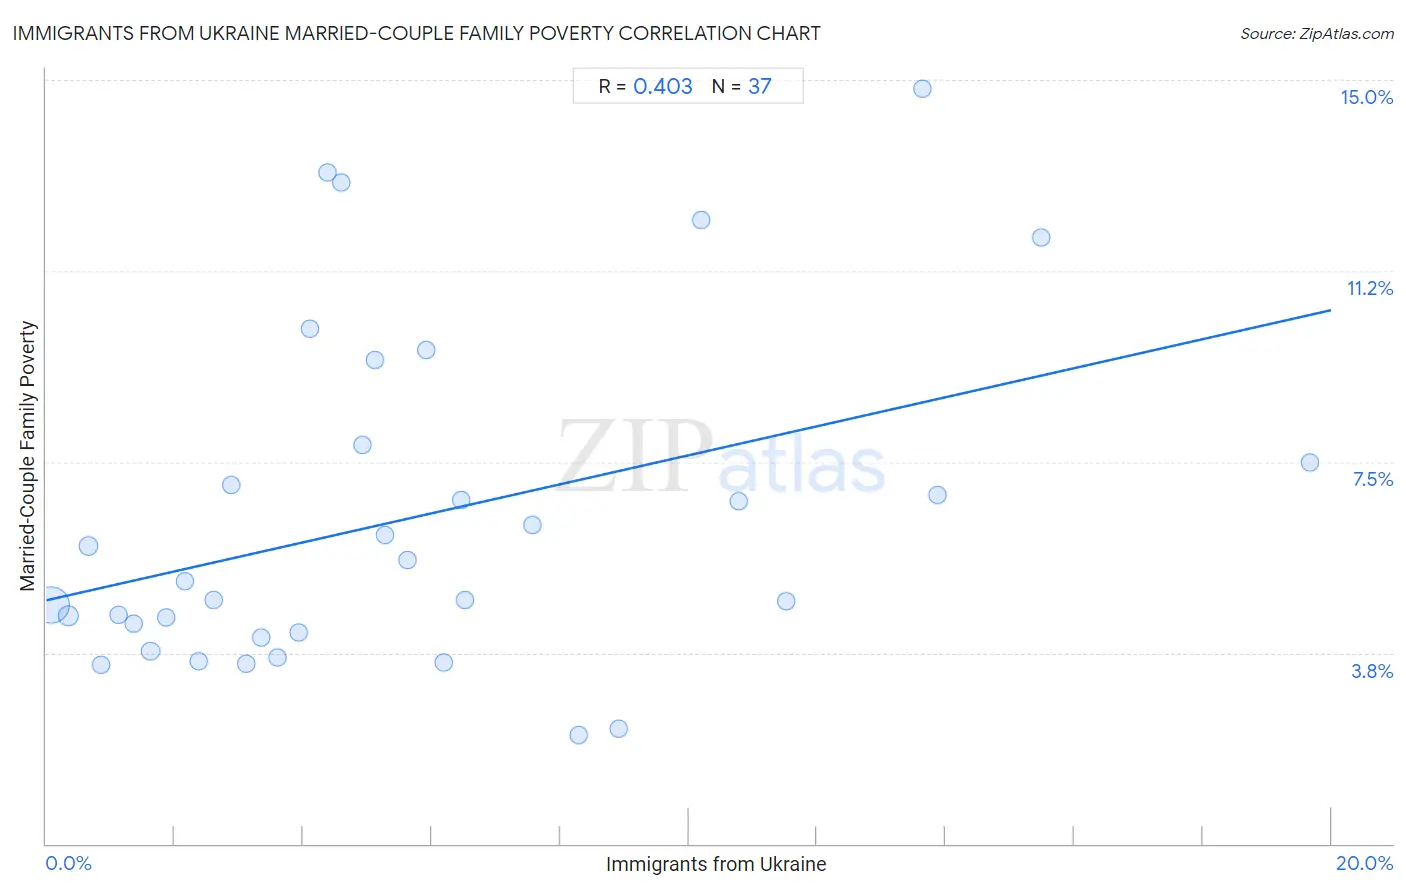
It is essential to understand that the correlation between the percentage of Immigrants from Ukraine and poverty level among married-couple families does not imply a direct cause-and-effect relationship. It remains uncertain whether the presence of Immigrants from Ukraine influences an upward or downward trend in the level of poverty level among married-couple families within an area, or if Immigrants from Ukraine simply ended up residing in those areas with higher or lower levels of poverty level among married-couple families due to other factors.

Demographics Similar to Immigrants from Ukraine by Married-Couple Family Poverty

In terms of married-couple family poverty, the demographic groups most similar to Immigrants from Ukraine are Immigrants from Kazakhstan (5.2%, a difference of 0.020%), Menominee (5.2%, a difference of 0.34%), Marshallese (5.2%, a difference of 0.35%), Spanish (5.3%, a difference of 0.42%), and Immigrants from Eastern Africa (5.2%, a difference of 0.59%).
DemographicsRating | RankMarried-Couple Family Poverty
Bermudans
52.9
/100
|
#171
Average
5.2%
Immigrants from Northern Africa
51.3
/100
|
#172
Average
5.2%
Alsatians
51.2
/100
|
#173
Average
5.2%
Immigrants from Eastern Africa
50.0
/100
|
#174
Average
5.2%
Marshallese
47.9
/100
|
#175
Average
5.2%
Menominee
47.8
/100
|
#176
Average
5.2%
Immigrants from Kazakhstan
45.1
/100
|
#177
Average
5.2%
Immigrants from Ukraine
44.9
/100
|
#178
Average
5.2%
Spanish
41.4
/100
|
#179
Average
5.3%
Immigrants from Sierra Leone
39.3
/100
|
#180
Fair
5.3%
Immigrants from Chile
38.8
/100
|
#181
Fair
5.3%
Immigrants from Vietnam
37.7
/100
|
#182
Fair
5.3%
Peruvians
37.6
/100
|
#183
Fair
5.3%
Nonimmigrants
35.8
/100
|
#184
Fair
5.3%
Americans
35.4
/100
|
#185
Fair
5.3%

Immigrants from Ukraine Married-Couple Family Poverty Correlation Summary

MeasurementImmigrants from Ukraine DataMarried-Couple Family Poverty Data
Minimum0.079%2.1%
Maximum19.7%14.8%
Range19.6%12.7%
Mean5.7%6.4%
Median4.6%5.2%
Interquartile 25% (IQ1)2.3%4.1%
Interquartile 75% (IQ3)7.9%7.7%
Interquartile Range (IQR)5.7%3.6%
Standard Deviation (Sample)4.6%3.3%
Standard Deviation (Population)4.6%3.2%

Correlation Details

Immigrants from Ukraine PercentileSample SizeMarried-Couple Family Poverty
[
0.0%
-
0.5%
]
0.079%
214,923,5304.7%
[
0.0%
-
0.5%
]
0.35%
37,722,4394.5%
[
0.5%
-
1.0%
]
0.66%
20,172,5195.8%
[
0.5%
-
1.0%
]
0.86%
4,206,1343.5%
[
1.0%
-
1.5%
]
1.12%
3,195,0344.5%
[
1.0%
-
1.5%
]
1.36%
1,497,6274.3%
[
1.5%
-
2.0%
]
1.62%
1,330,6953.8%
[
1.5%
-
2.0%
]
1.88%
1,063,8524.4%
[
2.0%
-
2.5%
]
2.16%
597,0825.2%
[
2.0%
-
2.5%
]
2.37%
470,5003.6%
[
2.5%
-
3.0%
]
2.61%
365,0674.8%
[
2.5%
-
3.0%
]
2.89%
218,5647.0%
[
3.0%
-
3.5%
]
3.10%
385,0983.5%
[
3.0%
-
3.5%
]
3.35%
103,7754.1%
[
3.5%
-
4.0%
]
3.59%
73,5403.7%
[
3.5%
-
4.0%
]
3.93%
71,0454.1%
[
4.0%
-
4.5%
]
4.11%
124,62110.1%
[
4.0%
-
4.5%
]
4.38%
115,26513.2%
[
4.5%
-
5.0%
]
4.60%
106,62213.0%
[
4.5%
-
5.0%
]
4.93%
53,5927.8%
[
5.0%
-
5.5%
]
5.12%
115,6839.5%
[
5.0%
-
5.5%
]
5.27%
82,1066.1%
[
5.5%
-
6.0%
]
5.62%
168,9875.6%
[
5.5%
-
6.0%
]
5.91%
91,6359.7%
[
6.0%
-
6.5%
]
6.18%
8743.6%
[
6.0%
-
6.5%
]
6.46%
87,8846.7%
[
6.5%
-
7.0%
]
6.52%
47,6984.8%
[
7.5%
-
8.0%
]
7.58%
666.2%
[
8.0%
-
8.5%
]
8.30%
7,4142.1%
[
8.5%
-
9.0%
]
8.91%
1,1002.3%
[
10.0%
-
10.5%
]
10.19%
64812.2%
[
10.5%
-
11.0%
]
10.77%
4926.7%
[
11.5%
-
12.0%
]
11.51%
2784.8%
[
13.5%
-
14.0%
]
13.63%
47,89314.8%
[
13.5%
-
14.0%
]
13.87%
3826.8%
[
15.0%
-
15.5%
]
15.48%
84,93311.9%
[
19.5%
-
20.0%
]
19.67%
3007.5%