Finnish Married-Couple Family Poverty

COMPARE

Finnish
Race
Ancestry
AfghanAfricanAlaska NativeAlaskan AthabascanAlbanianAleutAlsatianAmericanApacheArabArapahoArgentineanArmenianAssyrian/Chaldean/SyriacAustralianAustrianBahamianBangladeshiBarbadianBasqueBelgianBelizeanBermudanBhutaneseBlackfeetBolivianBrazilianBritishBritish West IndianBulgarianBurmeseCajunCambodianCanadianCape VerdeanCarpatho RusynCelticCentral AmericanCentral American IndianCherokeeCheyenneChickasawChileanChineseChippewaChoctawColombianColvilleComancheCosta RicanCreeCreekCroatianCrowCubanCypriotCzechCzechoslovakianDanishDelawareDominicanDutchDutch West IndianEastern EuropeanEcuadorianEgyptianEnglishEstonianEthiopianEuropeanFijianFilipinoFinnishFrenchFrench American IndianFrench CanadianGermanGerman RussianGhanaianGreekGuamanian/ChamorroGuatemalanGuyaneseHaitianHmongHonduranHopiHoumaHungarianIcelanderIndian (Asian)IndonesianInupiatIranianIraqiIrishIroquoisIsraeliItalianJamaicanJapaneseJordanianKenyanKiowaKoreanLaotianLatvianLebaneseLiberianLithuanianLumbeeLuxembourgerMacedonianMalaysianMalteseMarshalleseMenomineeMexicanMexican American IndianMongolianMoroccanNative HawaiianNavajoNepaleseNew ZealanderNicaraguanNigerianNorthern EuropeanNorwegianOkinawanOsageOttawaPaiutePakistaniPalestinianPanamanianParaguayanPennsylvania GermanPeruvianPimaPolishPortuguesePotawatomiPuebloPuerto RicanPuget Sound SalishRomanianRussianSalvadoranSamoanScandinavianScotch-IrishScottishSeminoleSenegaleseSerbianShoshoneSierra LeoneanSiouxSlavicSlovakSloveneSomaliSouth AfricanSouth AmericanSouth American IndianSoviet UnionSpaniardSpanishSpanish AmericanSpanish American IndianSri LankanSubsaharan AfricanSudaneseSwedishSwissSyrianTaiwaneseThaiTlingit-HaidaTohono O'OdhamTonganTrinidadian and TobagonianTsimshianTurkishU.S. Virgin IslanderUgandanUkrainianUruguayanUteVenezuelanVietnameseWelshWest IndianYakamaYaquiYugoslavianYumanYup'ikZimbabwean
Immigration
NonimmigrantsImmigrantsAfghanistanAfricaAlbaniaArgentinaArmeniaAsiaAustraliaAustriaBahamasBangladeshBarbadosBelarusBelgiumBelizeBoliviaBosnia and HerzegovinaBrazilBulgariaBurma/MyanmarCabo VerdeCambodiaCameroonCanadaCaribbeanCentral AmericaChileChinaColombiaCongoCosta RicaCroatiaCubaCzechoslovakiaDenmarkDominicaDominican RepublicEastern AfricaEastern AsiaEastern EuropeEcuadorEgyptEl SalvadorEnglandEritreaEthiopiaEuropeFijiFranceGermanyGhanaGreeceGrenadaGuatemalaGuyanaHaitiHondurasHong KongHungaryIndiaIndonesiaIranIraqIrelandIsraelItalyJamaicaJapanJordanKazakhstanKenyaKoreaKuwaitLaosLatin AmericaLatviaLebanonLiberiaLithuaniaMalaysiaMexicoMicronesiaMiddle AfricaMoldovaMoroccoNepalNetherlandsNicaraguaNigeriaNorth AmericaNorth MacedoniaNorthern AfricaNorthern EuropeNorwayOceaniaPakistanPanamaPeruPhilippinesPolandPortugalRomaniaRussiaSaudi ArabiaScotlandSenegalSerbiaSierra LeoneSingaporeSomaliaSouth AfricaSouth AmericaSouth Central AsiaSouth Eastern AsiaSouthern EuropeSpainSri LankaSt. Vincent and the GrenadinesSudanSwedenSwitzerlandSyriaTaiwanThailandTrinidad and TobagoTurkeyUgandaUkraineUruguayUzbekistanVenezuelaVietnamWest IndiesWestern AfricaWestern AsiaWestern EuropeYemenZaireZimbabweAzores
Select to Compare
Race
Ancestry
AfghanAfricanAlaska NativeAlaskan AthabascanAlbanianAleutAlsatianAmericanApacheArabArapahoArgentineanArmenianAssyrian/Chaldean/SyriacAustralianAustrianBahamianBangladeshiBarbadianBasqueBelgianBelizeanBermudanBhutaneseBlackfeetBolivianBrazilianBritishBritish West IndianBulgarianBurmeseCajunCambodianCanadianCape VerdeanCarpatho RusynCelticCentral AmericanCentral American IndianCherokeeCheyenneChickasawChileanChineseChippewaChoctawColombianColvilleComancheCosta RicanCreeCreekCroatianCrowCubanCypriotCzechCzechoslovakianDanishDelawareDominicanDutchDutch West IndianEastern EuropeanEcuadorianEgyptianEnglishEstonianEthiopianEuropeanFijianFilipinoFrenchFrench American IndianFrench CanadianGermanGerman RussianGhanaianGreekGuamanian/ChamorroGuatemalanGuyaneseHaitianHmongHonduranHopiHoumaHungarianIcelanderIndian (Asian)IndonesianInupiatIranianIraqiIrishIroquoisIsraeliItalianJamaicanJapaneseJordanianKenyanKiowaKoreanLaotianLatvianLebaneseLiberianLithuanianLumbeeLuxembourgerMacedonianMalaysianMalteseMarshalleseMenomineeMexicanMexican American IndianMongolianMoroccanNative HawaiianNavajoNepaleseNew ZealanderNicaraguanNigerianNorthern EuropeanNorwegianOkinawanOsageOttawaPaiutePakistaniPalestinianPanamanianParaguayanPennsylvania GermanPeruvianPimaPolishPortuguesePotawatomiPuebloPuerto RicanPuget Sound SalishRomanianRussianSalvadoranSamoanScandinavianScotch-IrishScottishSeminoleSenegaleseSerbianShoshoneSierra LeoneanSiouxSlavicSlovakSloveneSomaliSouth AfricanSouth AmericanSouth American IndianSoviet UnionSpaniardSpanishSpanish AmericanSpanish American IndianSri LankanSubsaharan AfricanSudaneseSwedishSwissSyrianTaiwaneseThaiTlingit-HaidaTohono O'OdhamTonganTrinidadian and TobagonianTsimshianTurkishU.S. Virgin IslanderUgandanUkrainianUruguayanUteVenezuelanVietnameseWelshWest IndianYakamaYaquiYugoslavianYumanYup'ikZimbabwean
Immigration
NonimmigrantsImmigrantsAfghanistanAfricaAlbaniaArgentinaArmeniaAsiaAustraliaAustriaBahamasBangladeshBarbadosBelarusBelgiumBelizeBoliviaBosnia and HerzegovinaBrazilBulgariaBurma/MyanmarCabo VerdeCambodiaCameroonCanadaCaribbeanCentral AmericaChileChinaColombiaCongoCosta RicaCroatiaCubaCzechoslovakiaDenmarkDominicaDominican RepublicEastern AfricaEastern AsiaEastern EuropeEcuadorEgyptEl SalvadorEnglandEritreaEthiopiaEuropeFijiFranceGermanyGhanaGreeceGrenadaGuatemalaGuyanaHaitiHondurasHong KongHungaryIndiaIndonesiaIranIraqIrelandIsraelItalyJamaicaJapanJordanKazakhstanKenyaKoreaKuwaitLaosLatin AmericaLatviaLebanonLiberiaLithuaniaMalaysiaMexicoMicronesiaMiddle AfricaMoldovaMoroccoNepalNetherlandsNicaraguaNigeriaNorth AmericaNorth MacedoniaNorthern AfricaNorthern EuropeNorwayOceaniaPakistanPanamaPeruPhilippinesPolandPortugalRomaniaRussiaSaudi ArabiaScotlandSenegalSerbiaSierra LeoneSingaporeSomaliaSouth AfricaSouth AmericaSouth Central AsiaSouth Eastern AsiaSouthern EuropeSpainSri LankaSt. Vincent and the GrenadinesSudanSwedenSwitzerlandSyriaTaiwanThailandTrinidad and TobagoTurkeyUgandaUkraineUruguayUzbekistanVenezuelaVietnamWest IndiesWestern AfricaWestern AsiaWestern EuropeYemenZaireZimbabweAzores
Married-Couple Family Poverty
Income
Poverty
Unemployment
Labor Participation
Family Structure
Vehicle Availability
Education Level
Disability

Finnish Married-Couple Family Poverty
Exceptional

4.0%
POVERTY | MARRIED-COUPLE FAMILIES
96.8/ 100
METRIC RATING
18th/ 347
METRIC RANK

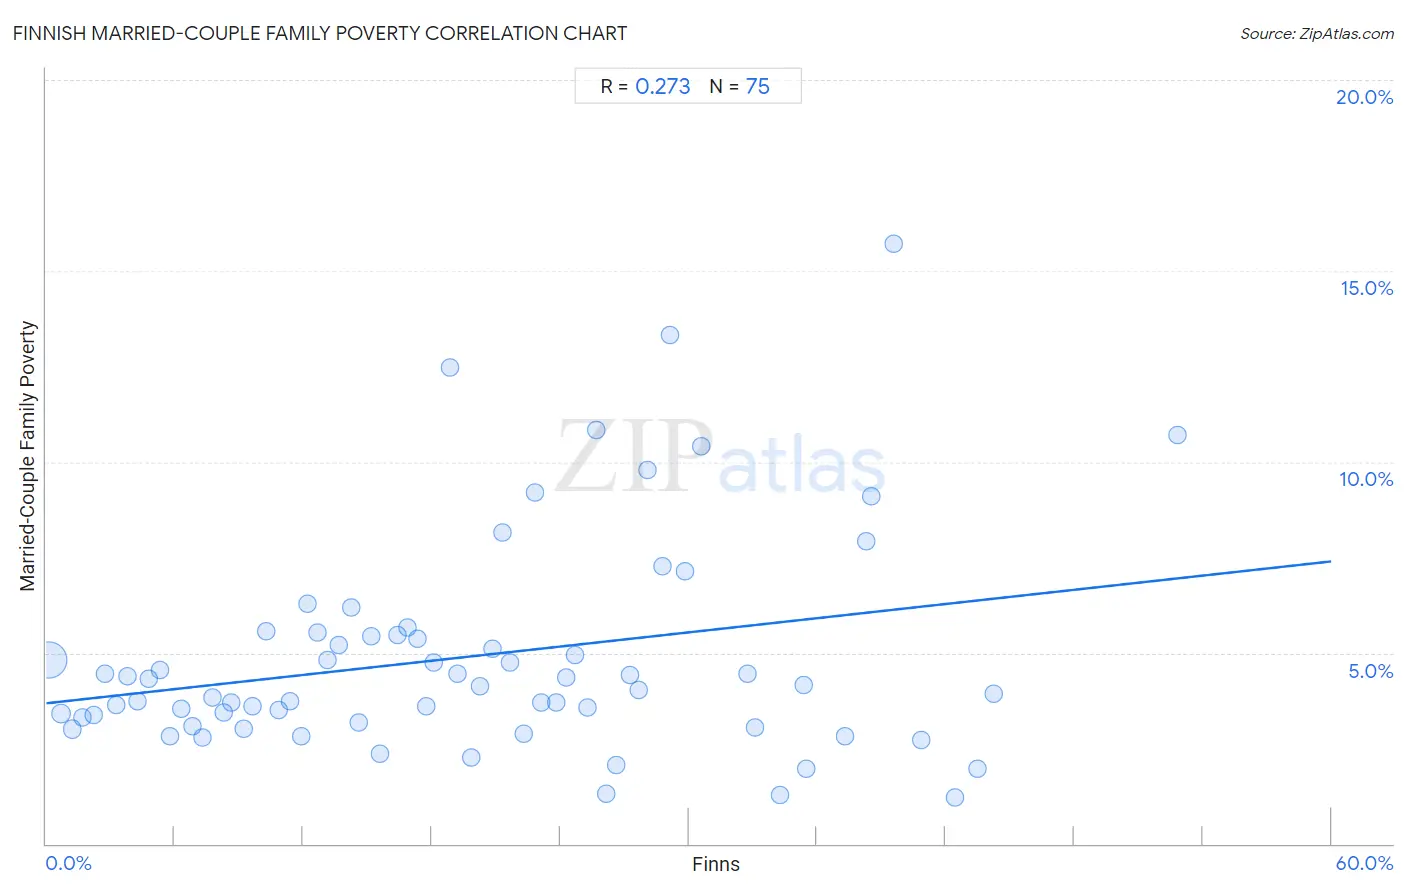
Finnish Married-Couple Family Poverty Correlation Chart

The statistical analysis conducted on geographies consisting of 397,506,097 people shows a mild positive correlation between the proportion of Finns and poverty level among married-couple families in the United States with a correlation coefficient (R) of 0.398 and weighted average of 4.0%. On average, for every 1% (one percent) increase in Finns within a typical geography, there is an increase of 0.13% in poverty level among married-couple families.
Finnish Married-Couple Family Poverty
It is essential to understand that the correlation between the percentage of Finns and poverty level among married-couple families does not imply a direct cause-and-effect relationship. It remains uncertain whether the presence of Finns influences an upward or downward trend in the level of poverty level among married-couple families within an area, or if Finns simply ended up residing in those areas with higher or lower levels of poverty level among married-couple families due to other factors.

Demographics Similar to Finns by Married-Couple Family Poverty

In terms of married-couple family poverty, the demographic groups most similar to Finns are Polish (4.0%, a difference of 0.060%), Greek (4.0%, a difference of 0.17%), Slovak (4.0%, a difference of 0.18%), Taiwanese (4.0%, a difference of 0.18%), and German (4.0%, a difference of 0.28%).
DemographicsRating | RankMarried-Couple Family Poverty
Lithuanians
97.3
/100
|
#11
Exceptional
4.0%
Immigrants from Ireland
97.2
/100
|
#12
Exceptional
4.0%
Croatians
97.1
/100
|
#13
Exceptional
4.0%
Zimbabweans
97.0
/100
|
#14
Exceptional
4.0%
Belgians
96.9
/100
|
#15
Exceptional
4.0%
Slovaks
96.9
/100
|
#16
Exceptional
4.0%
Taiwanese
96.9
/100
|
#17
Exceptional
4.0%
Finns
96.8
/100
|
#18
Exceptional
4.0%
Poles
96.8
/100
|
#19
Exceptional
4.0%
Greeks
96.8
/100
|
#20
Exceptional
4.0%
Germans
96.7
/100
|
#21
Exceptional
4.0%
Italians
96.7
/100
|
#22
Exceptional
4.0%
Bulgarians
96.7
/100
|
#23
Exceptional
4.0%
Scandinavians
96.6
/100
|
#24
Exceptional
4.1%
Japanese
96.5
/100
|
#25
Exceptional
4.1%

Finnish Married-Couple Family Poverty Correlation Summary

MeasurementFinnish DataMarried-Couple Family Poverty Data
Minimum0.11%0.54%
Maximum54.2%23.8%
Range54.1%23.3%
Mean19.3%5.3%
Median17.6%4.0%
Interquartile 25% (IQ1)8.7%3.0%
Interquartile 75% (IQ3)28.0%6.1%
Interquartile Range (IQR)19.2%3.1%
Standard Deviation (Sample)12.8%4.2%
Standard Deviation (Population)12.7%4.2%

Correlation Details

Finnish PercentileSample SizeMarried-Couple Family Poverty
[
0.0%
-
0.5%
]
0.11%
326,814,7615.0%
[
0.0%
-
0.5%
]
0.50%
44,485,2583.5%
[
0.5%
-
1.0%
]
0.86%
13,107,0613.4%
[
1.0%
-
1.5%
]
1.19%
5,899,0162.8%
[
1.5%
-
2.0%
]
1.57%
2,747,5293.1%
[
1.5%
-
2.0%
]
1.92%
1,140,9953.1%
[
2.0%
-
2.5%
]
2.24%
593,9183.5%
[
2.5%
-
3.0%
]
2.61%
517,6663.6%
[
2.5%
-
3.0%
]
2.97%
302,6713.0%
[
3.0%
-
3.5%
]
3.30%
184,6833.9%
[
3.5%
-
4.0%
]
3.64%
174,2393.8%
[
4.0%
-
4.5%
]
4.01%
159,4913.0%
[
4.0%
-
4.5%
]
4.40%
86,2685.0%
[
4.5%
-
5.0%
]
4.68%
48,5334.3%
[
5.0%
-
5.5%
]
5.10%
140,3483.6%
[
5.0%
-
5.5%
]
5.46%
59,3862.2%
[
5.5%
-
6.0%
]
5.81%
67,5054.0%
[
6.0%
-
6.5%
]
6.13%
45,0993.1%
[
6.0%
-
6.5%
]
6.44%
193,8453.3%
[
6.5%
-
7.0%
]
6.81%
41,4934.5%
[
7.0%
-
7.5%
]
7.19%
21,8413.8%
[
7.5%
-
8.0%
]
7.67%
44,4662.3%
[
7.5%
-
8.0%
]
7.98%
24,1463.6%
[
8.0%
-
8.5%
]
8.13%
11,9488.6%
[
8.5%
-
9.0%
]
8.55%
45,3311.6%
[
8.5%
-
9.0%
]
8.88%
5,89810.4%
[
9.0%
-
9.5%
]
9.28%
27,5033.8%
[
9.5%
-
10.0%
]
9.74%
47,8553.8%
[
9.5%
-
10.0%
]
10.00%
15,1715.2%
[
10.0%
-
10.5%
]
10.34%
40,6334.3%
[
10.5%
-
11.0%
]
10.85%
48,5873.0%
[
11.0%
-
11.5%
]
11.09%
35,2223.7%
[
11.0%
-
11.5%
]
11.45%
34,9634.2%
[
11.5%
-
12.0%
]
11.78%
16,4904.4%
[
12.0%
-
12.5%
]
12.16%
5,8744.0%
[
12.0%
-
12.5%
]
12.33%
7,3294.2%
[
12.5%
-
13.0%
]
12.74%
3,2802.8%
[
13.0%
-
13.5%
]
13.12%
5,5664.8%
[
13.0%
-
13.5%
]
13.46%
9,8576.6%
[
13.5%
-
14.0%
]
13.92%
19,7107.0%
[
14.0%
-
14.5%
]
14.15%
4,7066.2%
[
14.5%
-
15.0%
]
14.56%
15,4203.4%
[
15.0%
-
15.5%
]
15.01%
6,2834.5%
[
15.0%
-
15.5%
]
15.30%
1,0520.55%
[
15.5%
-
16.0%
]
15.62%
1,1460.54%
[
15.5%
-
16.0%
]
15.91%
4,1226.4%
[
16.0%
-
16.5%
]
16.36%
7,7375.3%
[
16.5%
-
17.0%
]
16.68%
16,9343.5%
[
16.5%
-
17.0%
]
16.97%
3,6122.4%
[
17.0%
-
17.5%
]
17.48%
3,26112.3%
[
17.5%
-
18.0%
]
17.76%
1076.2%
[
18.0%
-
18.5%
]
18.05%
6,4705.0%
[
18.5%
-
19.0%
]
18.52%
11,0093.8%
[
18.5%
-
19.0%
]
18.94%
11,0264.9%
[
19.5%
-
20.0%
]
19.56%
6,6472.4%
[
19.5%
-
20.0%
]
19.83%
4,4882.9%
[
20.0%
-
20.5%
]
20.26%
4,9605.4%
[
20.5%
-
21.0%
]
20.73%
1,1432.8%
[
21.0%
-
21.5%
]
21.35%
4,5395.5%
[
21.5%
-
22.0%
]
21.71%
4,6344.7%
[
21.5%
-
22.0%
]
21.81%
24320.0%
[
22.5%
-
23.0%
]
22.76%
11,3607.6%
[
23.0%
-
23.5%
]
23.11%
9652.5%
[
23.0%
-
23.5%
]
23.40%
2,9786.5%
[
23.5%
-
24.0%
]
23.88%
5,6441.6%
[
24.0%
-
24.5%
]
24.15%
4,1744.7%
[
24.0%
-
24.5%
]
24.35%
2,0004.5%
[
25.0%
-
25.5%
]
25.13%
2,2805.2%
[
25.0%
-
25.5%
]
25.35%
1,4363.5%
[
25.5%
-
26.0%
]
25.72%
8,2712.3%
[
26.0%
-
26.5%
]
26.17%
1,4067.5%
[
26.5%
-
27.0%
]
26.61%
6843.7%
[
26.5%
-
27.0%
]
26.77%
1,08711.9%
[
27.0%
-
27.5%
]
27.17%
16,3104.8%
[
27.5%
-
28.0%
]
27.64%
2,6051.7%
[
28.0%
-
28.5%
]
28.29%
1,11710.9%
[
28.5%
-
29.0%
]
28.92%
10,2031.0%
[
29.5%
-
30.0%
]
29.58%
7,7638.3%
[
29.5%
-
30.0%
]
29.97%
2,3620.94%
[
30.5%
-
31.0%
]
30.69%
1,4244.7%
[
31.0%
-
31.5%
]
31.23%
7591.7%
[
31.5%
-
32.0%
]
31.51%
1,8602.9%
[
31.5%
-
32.0%
]
31.98%
5417.2%
[
32.0%
-
32.5%
]
32.15%
5634.7%
[
32.5%
-
33.0%
]
32.56%
4320.0%
[
33.0%
-
33.5%
]
33.29%
3,0011.6%
[
33.5%
-
34.0%
]
33.62%
4671.2%
[
33.5%
-
34.0%
]
33.98%
7272.1%
[
34.0%
-
34.5%
]
34.29%
4,8216.4%
[
36.0%
-
36.5%
]
36.22%
1,0052.1%
[
37.0%
-
37.5%
]
37.19%
24217.0%
[
38.0%
-
38.5%
]
38.24%
1,1613.3%
[
38.0%
-
38.5%
]
38.41%
9328.6%
[
39.5%
-
40.0%
]
39.81%
84915.7%
[
41.5%
-
42.0%
]
41.70%
1,11512.6%
[
41.5%
-
42.0%
]
41.84%
6190.88%
[
42.5%
-
43.0%
]
42.66%
14311.9%
[
50.5%
-
51.0%
]
50.62%
1,2136.0%
[
53.0%
-
53.5%
]
53.49%
8623.8%
[
54.0%
-
54.5%
]
54.24%
9079.4%