Cypriot Married-Couple Family Poverty

COMPARE

Cypriot
Race
Ancestry
AfghanAfricanAlaska NativeAlaskan AthabascanAlbanianAleutAlsatianAmericanApacheArabArapahoArgentineanArmenianAssyrian/Chaldean/SyriacAustralianAustrianBahamianBangladeshiBarbadianBasqueBelgianBelizeanBermudanBhutaneseBlackfeetBolivianBrazilianBritishBritish West IndianBulgarianBurmeseCajunCambodianCanadianCape VerdeanCarpatho RusynCelticCentral AmericanCentral American IndianCherokeeCheyenneChickasawChileanChineseChippewaChoctawColombianColvilleComancheCosta RicanCreeCreekCroatianCrowCubanCypriotCzechCzechoslovakianDanishDelawareDominicanDutchDutch West IndianEastern EuropeanEcuadorianEgyptianEnglishEstonianEthiopianEuropeanFijianFilipinoFinnishFrenchFrench American IndianFrench CanadianGermanGerman RussianGhanaianGreekGuamanian/ChamorroGuatemalanGuyaneseHaitianHmongHonduranHopiHoumaHungarianIcelanderIndian (Asian)IndonesianInupiatIranianIraqiIrishIroquoisIsraeliItalianJamaicanJapaneseJordanianKenyanKiowaKoreanLaotianLatvianLebaneseLiberianLithuanianLumbeeLuxembourgerMacedonianMalaysianMalteseMarshalleseMenomineeMexicanMexican American IndianMongolianMoroccanNative HawaiianNavajoNepaleseNew ZealanderNicaraguanNigerianNorthern EuropeanNorwegianOkinawanOsageOttawaPaiutePakistaniPalestinianPanamanianParaguayanPennsylvania GermanPeruvianPimaPolishPortuguesePotawatomiPuebloPuerto RicanPuget Sound SalishRomanianRussianSalvadoranSamoanScandinavianScotch-IrishScottishSeminoleSenegaleseSerbianShoshoneSierra LeoneanSiouxSlavicSlovakSloveneSomaliSouth AfricanSouth AmericanSouth American IndianSoviet UnionSpaniardSpanishSpanish AmericanSpanish American IndianSri LankanSubsaharan AfricanSudaneseSwedishSwissSyrianTaiwaneseThaiTlingit-HaidaTohono O'OdhamTonganTrinidadian and TobagonianTsimshianTurkishU.S. Virgin IslanderUgandanUkrainianUruguayanUteVenezuelanVietnameseWelshWest IndianYakamaYaquiYugoslavianYumanYup'ikZimbabwean
Immigration
NonimmigrantsImmigrantsAfghanistanAfricaAlbaniaArgentinaArmeniaAsiaAustraliaAustriaBahamasBangladeshBarbadosBelarusBelgiumBelizeBoliviaBosnia and HerzegovinaBrazilBulgariaBurma/MyanmarCabo VerdeCambodiaCameroonCanadaCaribbeanCentral AmericaChileChinaColombiaCongoCosta RicaCroatiaCubaCzechoslovakiaDenmarkDominicaDominican RepublicEastern AfricaEastern AsiaEastern EuropeEcuadorEgyptEl SalvadorEnglandEritreaEthiopiaEuropeFijiFranceGermanyGhanaGreeceGrenadaGuatemalaGuyanaHaitiHondurasHong KongHungaryIndiaIndonesiaIranIraqIrelandIsraelItalyJamaicaJapanJordanKazakhstanKenyaKoreaKuwaitLaosLatin AmericaLatviaLebanonLiberiaLithuaniaMalaysiaMexicoMicronesiaMiddle AfricaMoldovaMoroccoNepalNetherlandsNicaraguaNigeriaNorth AmericaNorth MacedoniaNorthern AfricaNorthern EuropeNorwayOceaniaPakistanPanamaPeruPhilippinesPolandPortugalRomaniaRussiaSaudi ArabiaScotlandSenegalSerbiaSierra LeoneSingaporeSomaliaSouth AfricaSouth AmericaSouth Central AsiaSouth Eastern AsiaSouthern EuropeSpainSri LankaSt. Vincent and the GrenadinesSudanSwedenSwitzerlandSyriaTaiwanThailandTrinidad and TobagoTurkeyUgandaUkraineUruguayUzbekistanVenezuelaVietnamWest IndiesWestern AfricaWestern AsiaWestern EuropeYemenZaireZimbabweAzores
Select to Compare
Race
Ancestry
AfghanAfricanAlaska NativeAlaskan AthabascanAlbanianAleutAlsatianAmericanApacheArabArapahoArgentineanArmenianAssyrian/Chaldean/SyriacAustralianAustrianBahamianBangladeshiBarbadianBasqueBelgianBelizeanBermudanBhutaneseBlackfeetBolivianBrazilianBritishBritish West IndianBulgarianBurmeseCajunCambodianCanadianCape VerdeanCarpatho RusynCelticCentral AmericanCentral American IndianCherokeeCheyenneChickasawChileanChineseChippewaChoctawColombianColvilleComancheCosta RicanCreeCreekCroatianCrowCubanCzechCzechoslovakianDanishDelawareDominicanDutchDutch West IndianEastern EuropeanEcuadorianEgyptianEnglishEstonianEthiopianEuropeanFijianFilipinoFinnishFrenchFrench American IndianFrench CanadianGermanGerman RussianGhanaianGreekGuamanian/ChamorroGuatemalanGuyaneseHaitianHmongHonduranHopiHoumaHungarianIcelanderIndian (Asian)IndonesianInupiatIranianIraqiIrishIroquoisIsraeliItalianJamaicanJapaneseJordanianKenyanKiowaKoreanLaotianLatvianLebaneseLiberianLithuanianLumbeeLuxembourgerMacedonianMalaysianMalteseMarshalleseMenomineeMexicanMexican American IndianMongolianMoroccanNative HawaiianNavajoNepaleseNew ZealanderNicaraguanNigerianNorthern EuropeanNorwegianOkinawanOsageOttawaPaiutePakistaniPalestinianPanamanianParaguayanPennsylvania GermanPeruvianPimaPolishPortuguesePotawatomiPuebloPuerto RicanPuget Sound SalishRomanianRussianSalvadoranSamoanScandinavianScotch-IrishScottishSeminoleSenegaleseSerbianShoshoneSierra LeoneanSiouxSlavicSlovakSloveneSomaliSouth AfricanSouth AmericanSouth American IndianSoviet UnionSpaniardSpanishSpanish AmericanSpanish American IndianSri LankanSubsaharan AfricanSudaneseSwedishSwissSyrianTaiwaneseThaiTlingit-HaidaTohono O'OdhamTonganTrinidadian and TobagonianTsimshianTurkishU.S. Virgin IslanderUgandanUkrainianUruguayanUteVenezuelanVietnameseWelshWest IndianYakamaYaquiYugoslavianYumanYup'ikZimbabwean
Immigration
NonimmigrantsImmigrantsAfghanistanAfricaAlbaniaArgentinaArmeniaAsiaAustraliaAustriaBahamasBangladeshBarbadosBelarusBelgiumBelizeBoliviaBosnia and HerzegovinaBrazilBulgariaBurma/MyanmarCabo VerdeCambodiaCameroonCanadaCaribbeanCentral AmericaChileChinaColombiaCongoCosta RicaCroatiaCubaCzechoslovakiaDenmarkDominicaDominican RepublicEastern AfricaEastern AsiaEastern EuropeEcuadorEgyptEl SalvadorEnglandEritreaEthiopiaEuropeFijiFranceGermanyGhanaGreeceGrenadaGuatemalaGuyanaHaitiHondurasHong KongHungaryIndiaIndonesiaIranIraqIrelandIsraelItalyJamaicaJapanJordanKazakhstanKenyaKoreaKuwaitLaosLatin AmericaLatviaLebanonLiberiaLithuaniaMalaysiaMexicoMicronesiaMiddle AfricaMoldovaMoroccoNepalNetherlandsNicaraguaNigeriaNorth AmericaNorth MacedoniaNorthern AfricaNorthern EuropeNorwayOceaniaPakistanPanamaPeruPhilippinesPolandPortugalRomaniaRussiaSaudi ArabiaScotlandSenegalSerbiaSierra LeoneSingaporeSomaliaSouth AfricaSouth AmericaSouth Central AsiaSouth Eastern AsiaSouthern EuropeSpainSri LankaSt. Vincent and the GrenadinesSudanSwedenSwitzerlandSyriaTaiwanThailandTrinidad and TobagoTurkeyUgandaUkraineUruguayUzbekistanVenezuelaVietnamWest IndiesWestern AfricaWestern AsiaWestern EuropeYemenZaireZimbabweAzores
Married-Couple Family Poverty
Income
Poverty
Unemployment
Labor Participation
Family Structure
Vehicle Availability
Education Level
Disability

Cypriot Married-Couple Family Poverty
Exceptional

4.1%
POVERTY | MARRIED-COUPLE FAMILIES
99.9/ 100
METRIC RATING
26th/ 347
METRIC RANK

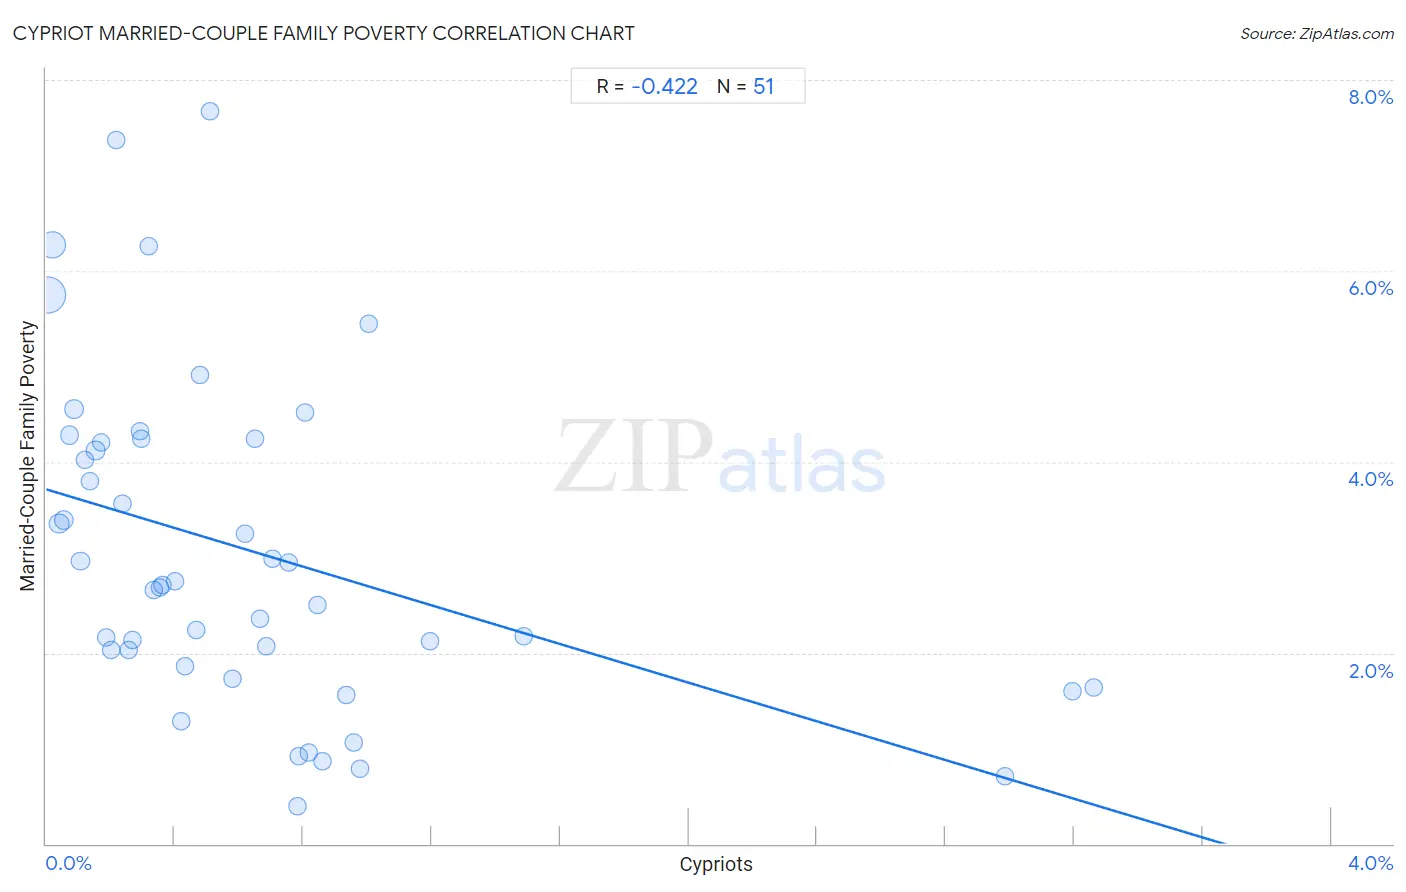
Cypriot Married-Couple Family Poverty Correlation Chart

The statistical analysis conducted on geographies consisting of 61,691,047 people shows a moderate negative correlation between the proportion of Cypriots and poverty level among married-couple families in the United States with a correlation coefficient (R) of -0.422 and weighted average of 4.1%. On average, for every 1% (one percent) increase in Cypriots within a typical geography, there is a decrease of 1.0% in poverty level among married-couple families.
Cypriot Married-Couple Family Poverty
It is essential to understand that the correlation between the percentage of Cypriots and poverty level among married-couple families does not imply a direct cause-and-effect relationship. It remains uncertain whether the presence of Cypriots influences an upward or downward trend in the level of poverty level among married-couple families within an area, or if Cypriots simply ended up residing in those areas with higher or lower levels of poverty level among married-couple families due to other factors.

Demographics Similar to Cypriots by Married-Couple Family Poverty

In terms of married-couple family poverty, the demographic groups most similar to Cypriots are Danish (4.1%, a difference of 0.11%), Scandinavian (4.1%, a difference of 0.22%), Immigrants from Scotland (4.2%, a difference of 0.26%), Immigrants from Taiwan (4.1%, a difference of 0.27%), and Finnish (4.2%, a difference of 0.50%).
DemographicsRating | RankMarried-Couple Family Poverty
Immigrants from Ireland
99.9
/100
|
#19
Exceptional
4.1%
Maltese
99.9
/100
|
#20
Exceptional
4.1%
Zimbabweans
99.9
/100
|
#21
Exceptional
4.1%
Immigrants from Singapore
99.9
/100
|
#22
Exceptional
4.1%
Bhutanese
99.9
/100
|
#23
Exceptional
4.1%
Eastern Europeans
99.9
/100
|
#24
Exceptional
4.1%
Immigrants from Taiwan
99.9
/100
|
#25
Exceptional
4.1%
Cypriots
99.9
/100
|
#26
Exceptional
4.1%
Danes
99.9
/100
|
#27
Exceptional
4.1%
Scandinavians
99.9
/100
|
#28
Exceptional
4.1%
Immigrants from Scotland
99.9
/100
|
#29
Exceptional
4.2%
Finns
99.9
/100
|
#30
Exceptional
4.2%
Estonians
99.9
/100
|
#31
Exceptional
4.2%
Greeks
99.9
/100
|
#32
Exceptional
4.2%
Irish
99.9
/100
|
#33
Exceptional
4.2%

Cypriot Married-Couple Family Poverty Correlation Summary

MeasurementCypriot DataMarried-Couple Family Poverty Data
Minimum0.0054%0.39%
Maximum3.3%7.7%
Range3.3%7.3%
Mean0.64%3.1%
Median0.43%2.7%
Interquartile 25% (IQ1)0.20%1.9%
Interquartile 75% (IQ3)0.80%4.2%
Interquartile Range (IQR)0.60%2.4%
Standard Deviation (Sample)0.72%1.7%
Standard Deviation (Population)0.71%1.7%

Correlation Details

Cypriot PercentileSample SizeMarried-Couple Family Poverty
[
0.0%
-
0.5%
]
0.0054%
33,992,2005.7%
[
0.0%
-
0.5%
]
0.020%
16,345,5096.3%
[
0.0%
-
0.5%
]
0.040%
3,110,9103.4%
[
0.0%
-
0.5%
]
0.056%
2,025,9493.4%
[
0.0%
-
0.5%
]
0.073%
1,651,0124.3%
[
0.0%
-
0.5%
]
0.087%
936,4384.6%
[
0.0%
-
0.5%
]
0.11%
588,9093.0%
[
0.0%
-
0.5%
]
0.12%
436,0914.0%
[
0.0%
-
0.5%
]
0.14%
334,4333.8%
[
0.0%
-
0.5%
]
0.15%
313,6024.1%
[
0.0%
-
0.5%
]
0.17%
297,2584.2%
[
0.0%
-
0.5%
]
0.19%
251,6942.2%
[
0.0%
-
0.5%
]
0.20%
237,7522.0%
[
0.0%
-
0.5%
]
0.22%
47,7177.4%
[
0.0%
-
0.5%
]
0.24%
114,9773.6%
[
0.0%
-
0.5%
]
0.26%
52,2842.0%
[
0.0%
-
0.5%
]
0.27%
87,9592.1%
[
0.0%
-
0.5%
]
0.29%
30,4134.3%
[
0.0%
-
0.5%
]
0.30%
138,3344.2%
[
0.0%
-
0.5%
]
0.32%
74,9656.3%
[
0.0%
-
0.5%
]
0.34%
24,6922.7%
[
0.0%
-
0.5%
]
0.35%
82,2902.7%
[
0.0%
-
0.5%
]
0.36%
31,4462.7%
[
0.0%
-
0.5%
]
0.40%
74,3192.7%
[
0.0%
-
0.5%
]
0.42%
1,4241.3%
[
0.0%
-
0.5%
]
0.43%
36,9141.9%
[
0.0%
-
0.5%
]
0.47%
23,0852.2%
[
0.0%
-
0.5%
]
0.48%
70,6434.9%
[
0.5%
-
1.0%
]
0.51%
22,5107.7%
[
0.5%
-
1.0%
]
0.58%
3,6261.7%
[
0.5%
-
1.0%
]
0.62%
13,0643.3%
[
0.5%
-
1.0%
]
0.65%
9,2344.2%
[
0.5%
-
1.0%
]
0.67%
6,4442.4%
[
0.5%
-
1.0%
]
0.68%
2,3372.1%
[
0.5%
-
1.0%
]
0.71%
36,0283.0%
[
0.5%
-
1.0%
]
0.76%
3,0402.9%
[
0.5%
-
1.0%
]
0.78%
2,0500.39%
[
0.5%
-
1.0%
]
0.79%
12,1860.91%
[
0.5%
-
1.0%
]
0.80%
7,4584.5%
[
0.5%
-
1.0%
]
0.82%
8,0960.96%
[
0.5%
-
1.0%
]
0.84%
18,7482.5%
[
0.5%
-
1.0%
]
0.86%
10,6940.86%
[
0.5%
-
1.0%
]
0.93%
9,4131.6%
[
0.5%
-
1.0%
]
0.96%
36,8421.1%
[
0.5%
-
1.0%
]
0.98%
7160.78%
[
1.0%
-
1.5%
]
1.00%
38,2145.4%
[
1.0%
-
1.5%
]
1.20%
2,5912.1%
[
1.0%
-
1.5%
]
1.48%
17,1102.2%
[
2.5%
-
3.0%
]
2.99%
11,7880.70%
[
3.0%
-
3.5%
]
3.20%
2,8471.6%
[
3.0%
-
3.5%
]
3.26%
2,7921.6%