Chickasaw Female Disability
COMPARE
Chickasaw
Select to Compare
Female Disability
Chickasaw Female Disability
15.2%
DISABILITY | FEMALES
0.0/ 100
METRIC RATING
340th/ 347
METRIC RANK
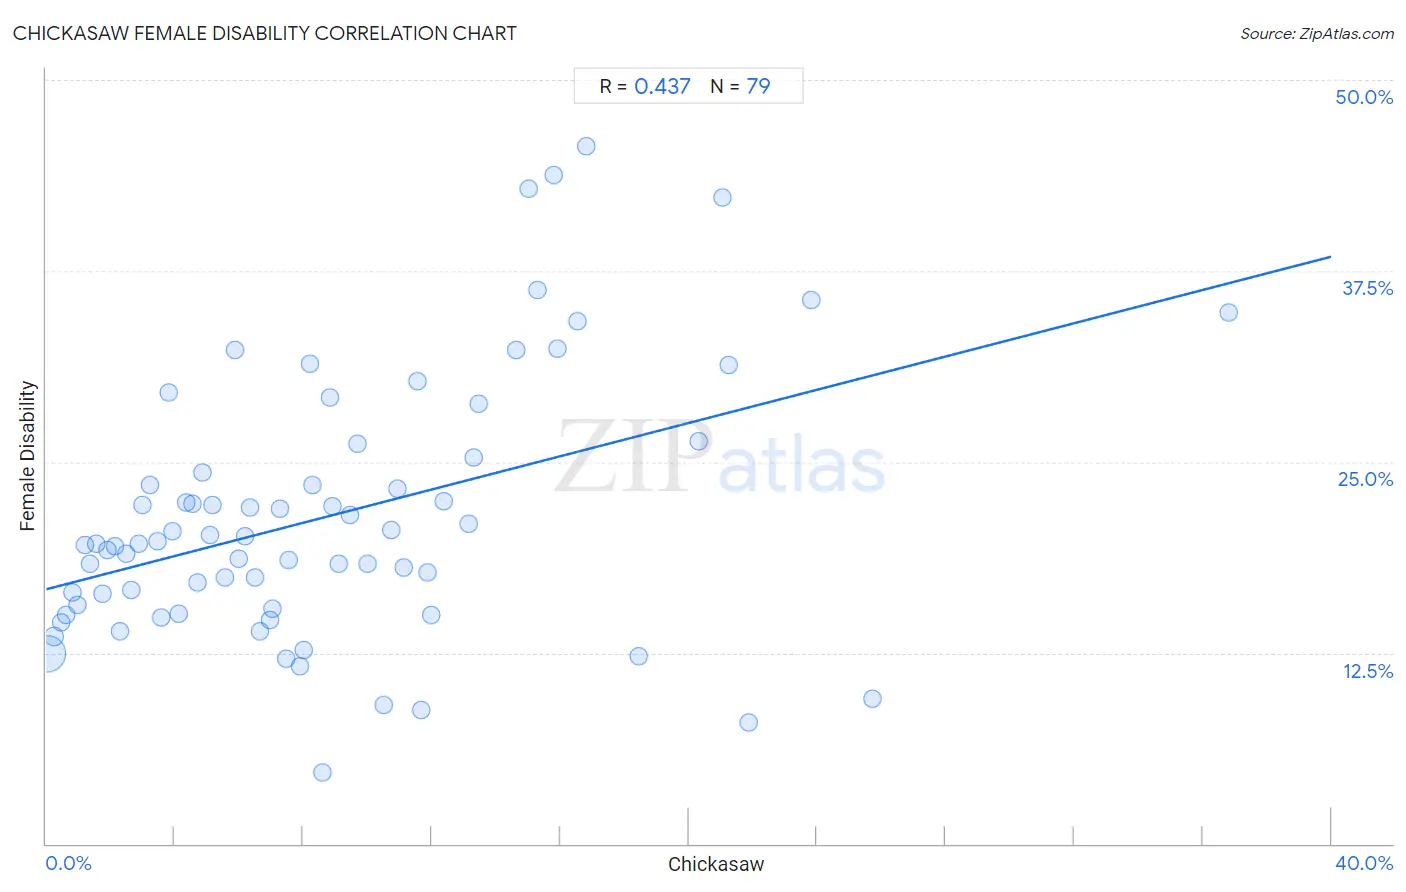
Chickasaw Female Disability Correlation Chart
The statistical analysis conducted on geographies consisting of 147,688,443 people shows a moderate positive correlation between the proportion of Chickasaw and percentage of females with a disability in the United States with a correlation coefficient (R) of 0.437 and weighted average of 15.2%. On average, for every 1% (one percent) increase in Chickasaw within a typical geography, there is an increase of 0.54% in percentage of females with a disability.
It is essential to understand that the correlation between the percentage of Chickasaw and percentage of females with a disability does not imply a direct cause-and-effect relationship. It remains uncertain whether the presence of Chickasaw influences an upward or downward trend in the level of percentage of females with a disability within an area, or if Chickasaw simply ended up residing in those areas with higher or lower levels of percentage of females with a disability due to other factors.
Demographics Similar to Chickasaw by Female Disability
In terms of female disability, the demographic groups most similar to Chickasaw are Colville (15.1%, a difference of 0.95%), Dutch West Indian (15.0%, a difference of 1.4%), Choctaw (15.4%, a difference of 1.4%), Tohono O'odham (15.0%, a difference of 1.5%), and Seminole (15.0%, a difference of 1.6%).
| Demographics | Rating | Rank | Female Disability |
| Immigrants from the Azores | 0.0 /100 | #333 | Tragic 14.9% |
| Cherokee | 0.0 /100 | #334 | Tragic 14.9% |
| Cajuns | 0.0 /100 | #335 | Tragic 14.9% |
| Seminole | 0.0 /100 | #336 | Tragic 15.0% |
| Tohono O'odham | 0.0 /100 | #337 | Tragic 15.0% |
| Dutch West Indians | 0.0 /100 | #338 | Tragic 15.0% |
| Colville | 0.0 /100 | #339 | Tragic 15.1% |
| Chickasaw | 0.0 /100 | #340 | Tragic 15.2% |
| Choctaw | 0.0 /100 | #341 | Tragic 15.4% |
| Creek | 0.0 /100 | #342 | Tragic 15.7% |
| Lumbee | 0.0 /100 | #343 | Tragic 15.8% |
| Kiowa | 0.0 /100 | #344 | Tragic 15.8% |
| Puerto Ricans | 0.0 /100 | #345 | Tragic 16.6% |
| Tsimshian | 0.0 /100 | #346 | Tragic 16.8% |
| Houma | 0.0 /100 | #347 | Tragic 16.9% |
Chickasaw Female Disability Correlation Summary
| Measurement | Chickasaw Data | Female Disability Data |
| Minimum | 0.032% | 4.7% |
| Maximum | 36.8% | 45.6% |
| Range | 36.8% | 41.0% |
| Mean | 8.8% | 21.5% |
| Median | 7.5% | 19.7% |
| Interquartile 25% (IQ1) | 3.6% | 15.4% |
| Interquartile 75% (IQ3) | 12.0% | 25.3% |
| Interquartile Range (IQR) | 8.4% | 9.8% |
| Standard Deviation (Sample) | 6.9% | 8.6% |
| Standard Deviation (Population) | 6.8% | 8.5% |
Correlation Details
| Chickasaw Percentile | Sample Size | Female Disability |
[ 0.0% - 0.5% ] 0.032% | 136,650,667 | 12.4% |
[ 0.0% - 0.5% ] 0.25% | 5,299,596 | 13.6% |
[ 0.0% - 0.5% ] 0.45% | 1,606,572 | 14.5% |
[ 0.5% - 1.0% ] 0.60% | 1,614,409 | 15.0% |
[ 0.5% - 1.0% ] 0.83% | 822,648 | 16.4% |
[ 0.5% - 1.0% ] 0.99% | 474,840 | 15.6% |
[ 1.0% - 1.5% ] 1.19% | 233,583 | 19.6% |
[ 1.0% - 1.5% ] 1.35% | 249,739 | 18.3% |
[ 1.5% - 2.0% ] 1.54% | 89,231 | 19.7% |
[ 1.5% - 2.0% ] 1.74% | 88,533 | 16.4% |
[ 1.5% - 2.0% ] 1.93% | 53,323 | 19.3% |
[ 2.0% - 2.5% ] 2.13% | 48,029 | 19.4% |
[ 2.0% - 2.5% ] 2.28% | 55,156 | 13.9% |
[ 2.5% - 3.0% ] 2.51% | 15,979 | 19.0% |
[ 2.5% - 3.0% ] 2.66% | 16,025 | 16.6% |
[ 2.5% - 3.0% ] 2.88% | 67,875 | 19.6% |
[ 3.0% - 3.5% ] 3.00% | 18,539 | 22.2% |
[ 3.0% - 3.5% ] 3.24% | 16,118 | 23.5% |
[ 3.0% - 3.5% ] 3.46% | 7,995 | 19.8% |
[ 3.5% - 4.0% ] 3.58% | 7,909 | 14.8% |
[ 3.5% - 4.0% ] 3.83% | 1,750 | 29.6% |
[ 3.5% - 4.0% ] 3.93% | 2,773 | 20.4% |
[ 4.0% - 4.5% ] 4.14% | 4,957 | 15.1% |
[ 4.0% - 4.5% ] 4.35% | 20,308 | 22.4% |
[ 4.5% - 5.0% ] 4.53% | 26,620 | 22.3% |
[ 4.5% - 5.0% ] 4.70% | 4,529 | 17.1% |
[ 4.5% - 5.0% ] 4.86% | 2,471 | 24.3% |
[ 5.0% - 5.5% ] 5.10% | 4,663 | 20.3% |
[ 5.0% - 5.5% ] 5.18% | 40,906 | 22.2% |
[ 5.5% - 6.0% ] 5.57% | 4,596 | 17.5% |
[ 5.5% - 6.0% ] 5.86% | 290 | 32.3% |
[ 5.5% - 6.0% ] 6.00% | 4,318 | 18.6% |
[ 6.0% - 6.5% ] 6.17% | 486 | 20.1% |
[ 6.0% - 6.5% ] 6.36% | 6,967 | 22.0% |
[ 6.5% - 7.0% ] 6.51% | 215 | 17.4% |
[ 6.5% - 7.0% ] 6.65% | 1,234 | 13.9% |
[ 6.5% - 7.0% ] 6.95% | 4,633 | 14.6% |
[ 7.0% - 7.5% ] 7.04% | 1,108 | 15.4% |
[ 7.0% - 7.5% ] 7.28% | 8,632 | 21.9% |
[ 7.0% - 7.5% ] 7.45% | 2,925 | 12.1% |
[ 7.5% - 8.0% ] 7.56% | 6,148 | 18.6% |
[ 7.5% - 8.0% ] 7.88% | 2,449 | 11.6% |
[ 8.0% - 8.5% ] 8.00% | 350 | 12.7% |
[ 8.0% - 8.5% ] 8.21% | 633 | 31.4% |
[ 8.0% - 8.5% ] 8.29% | 4,329 | 23.5% |
[ 8.5% - 9.0% ] 8.60% | 651 | 4.7% |
[ 8.5% - 9.0% ] 8.81% | 919 | 29.2% |
[ 8.5% - 9.0% ] 8.93% | 1,803 | 22.1% |
[ 9.0% - 9.5% ] 9.11% | 966 | 18.3% |
[ 9.0% - 9.5% ] 9.44% | 4,841 | 21.5% |
[ 9.5% - 10.0% ] 9.70% | 268 | 26.2% |
[ 10.0% - 10.5% ] 10.00% | 7,518 | 18.3% |
[ 10.0% - 10.5% ] 10.49% | 286 | 9.1% |
[ 10.5% - 11.0% ] 10.75% | 930 | 20.5% |
[ 10.5% - 11.0% ] 10.95% | 5,491 | 23.3% |
[ 11.0% - 11.5% ] 11.15% | 1,283 | 18.1% |
[ 11.5% - 12.0% ] 11.54% | 208 | 30.3% |
[ 11.5% - 12.0% ] 11.68% | 1,516 | 8.8% |
[ 11.5% - 12.0% ] 11.85% | 16,537 | 17.7% |
[ 11.5% - 12.0% ] 11.98% | 31,368 | 15.0% |
[ 12.0% - 12.5% ] 12.37% | 897 | 22.4% |
[ 13.0% - 13.5% ] 13.13% | 8,460 | 20.9% |
[ 13.0% - 13.5% ] 13.31% | 3,110 | 25.3% |
[ 13.0% - 13.5% ] 13.45% | 119 | 28.8% |
[ 14.5% - 15.0% ] 14.64% | 560 | 32.3% |
[ 15.0% - 15.5% ] 15.00% | 40 | 42.9% |
[ 15.0% - 15.5% ] 15.30% | 791 | 36.3% |
[ 15.5% - 16.0% ] 15.79% | 190 | 43.8% |
[ 15.5% - 16.0% ] 15.93% | 841 | 32.4% |
[ 16.5% - 17.0% ] 16.55% | 145 | 34.2% |
[ 16.5% - 17.0% ] 16.79% | 262 | 45.6% |
[ 18.0% - 18.5% ] 18.46% | 428 | 12.3% |
[ 20.0% - 20.5% ] 20.31% | 64 | 26.3% |
[ 21.0% - 21.5% ] 21.05% | 114 | 42.3% |
[ 21.0% - 21.5% ] 21.23% | 212 | 31.3% |
[ 21.5% - 22.0% ] 21.86% | 988 | 7.9% |
[ 23.5% - 24.0% ] 23.81% | 189 | 35.6% |
[ 25.5% - 26.0% ] 25.74% | 1,286 | 9.5% |
[ 36.5% - 37.0% ] 36.79% | 106 | 34.8% |