Haitian Married-Couple Family Poverty
COMPARE
Haitian
Select to Compare
Married-Couple Family Poverty
Haitian Married-Couple Family Poverty
6.8%
POVERTY | MARRIED-COUPLE FAMILIES
0.0/ 100
METRIC RATING
305th/ 347
METRIC RANK
Haitian Married-Couple Family Poverty Correlation Chart
The statistical analysis conducted on geographies consisting of 285,930,838 people shows a moderate positive correlation between the proportion of Haitians and poverty level among married-couple families in the United States with a correlation coefficient (R) of 0.457 and weighted average of 6.8%. On average, for every 1% (one percent) increase in Haitians within a typical geography, there is an increase of 0.13% in poverty level among married-couple families.
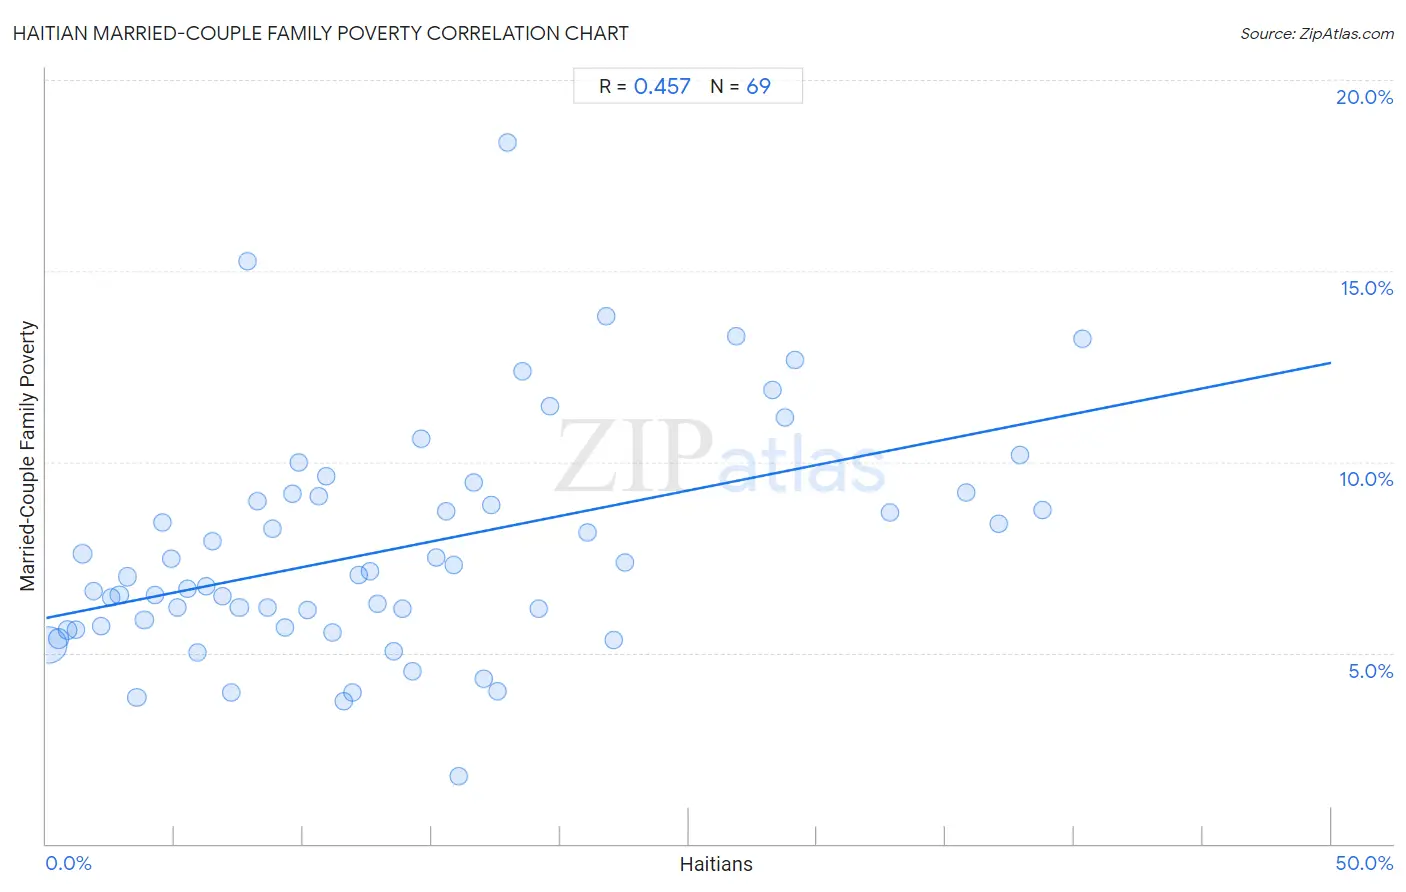
It is essential to understand that the correlation between the percentage of Haitians and poverty level among married-couple families does not imply a direct cause-and-effect relationship. It remains uncertain whether the presence of Haitians influences an upward or downward trend in the level of poverty level among married-couple families within an area, or if Haitians simply ended up residing in those areas with higher or lower levels of poverty level among married-couple families due to other factors.
Demographics Similar to Haitians by Married-Couple Family Poverty
In terms of married-couple family poverty, the demographic groups most similar to Haitians are Cuban (6.8%, a difference of 0.10%), Immigrants from El Salvador (6.8%, a difference of 0.55%), Immigrants from Ecuador (6.7%, a difference of 0.83%), Central American (6.7%, a difference of 0.97%), and Immigrants from Belize (6.7%, a difference of 1.6%).
| Demographics | Rating | Rank | Married-Couple Family Poverty |
| Immigrants from Guyana | 0.0 /100 | #298 | Tragic 6.7% |
| Nicaraguans | 0.0 /100 | #299 | Tragic 6.7% |
| Immigrants from Belize | 0.0 /100 | #300 | Tragic 6.7% |
| Central Americans | 0.0 /100 | #301 | Tragic 6.7% |
| Immigrants from Ecuador | 0.0 /100 | #302 | Tragic 6.7% |
| Immigrants from El Salvador | 0.0 /100 | #303 | Tragic 6.8% |
| Cubans | 0.0 /100 | #304 | Tragic 6.8% |
| Haitians | 0.0 /100 | #305 | Tragic 6.8% |
| Immigrants from Haiti | 0.0 /100 | #306 | Tragic 7.0% |
| Guatemalans | 0.0 /100 | #307 | Tragic 7.0% |
| Spanish American Indians | 0.0 /100 | #308 | Tragic 7.1% |
| Hopi | 0.0 /100 | #309 | Tragic 7.1% |
| Immigrants from Nicaragua | 0.0 /100 | #310 | Tragic 7.1% |
| Immigrants from Dominica | 0.0 /100 | #311 | Tragic 7.1% |
| Immigrants from Armenia | 0.0 /100 | #312 | Tragic 7.1% |
Haitian Married-Couple Family Poverty Correlation Summary
| Measurement | Haitian Data | Married-Couple Family Poverty Data |
| Minimum | 0.095% | 1.8% |
| Maximum | 40.3% | 18.4% |
| Range | 40.2% | 16.6% |
| Mean | 13.6% | 7.7% |
| Median | 11.6% | 7.0% |
| Interquartile 25% (IQ1) | 5.7% | 5.7% |
| Interquartile 75% (IQ3) | 18.2% | 9.1% |
| Interquartile Range (IQR) | 12.5% | 3.4% |
| Standard Deviation (Sample) | 10.3% | 3.0% |
| Standard Deviation (Population) | 10.2% | 3.0% |
Correlation Details
| Haitian Percentile | Sample Size | Married-Couple Family Poverty |
[ 0.0% - 0.5% ] 0.095% | 202,846,333 | 5.2% |
[ 0.0% - 0.5% ] 0.48% | 29,643,827 | 5.4% |
[ 0.5% - 1.0% ] 0.81% | 12,801,804 | 5.6% |
[ 1.0% - 1.5% ] 1.15% | 6,652,434 | 5.6% |
[ 1.0% - 1.5% ] 1.41% | 12,288,743 | 7.6% |
[ 1.5% - 2.0% ] 1.83% | 2,975,714 | 6.6% |
[ 2.0% - 2.5% ] 2.15% | 2,326,258 | 5.7% |
[ 2.5% - 3.0% ] 2.53% | 1,365,830 | 6.5% |
[ 2.5% - 3.0% ] 2.84% | 1,284,235 | 6.5% |
[ 3.0% - 3.5% ] 3.16% | 2,312,453 | 7.0% |
[ 3.5% - 4.0% ] 3.53% | 902,918 | 3.8% |
[ 3.5% - 4.0% ] 3.82% | 949,801 | 5.9% |
[ 4.0% - 4.5% ] 4.22% | 324,793 | 6.5% |
[ 4.5% - 5.0% ] 4.53% | 759,144 | 8.4% |
[ 4.5% - 5.0% ] 4.85% | 305,516 | 7.4% |
[ 5.0% - 5.5% ] 5.12% | 751,880 | 6.2% |
[ 5.5% - 6.0% ] 5.50% | 414,815 | 6.7% |
[ 5.5% - 6.0% ] 5.88% | 485,059 | 5.0% |
[ 6.0% - 6.5% ] 6.22% | 702,549 | 6.7% |
[ 6.0% - 6.5% ] 6.47% | 160,947 | 7.9% |
[ 6.5% - 7.0% ] 6.84% | 403,554 | 6.5% |
[ 7.0% - 7.5% ] 7.20% | 212,253 | 4.0% |
[ 7.5% - 8.0% ] 7.51% | 450,046 | 6.2% |
[ 7.5% - 8.0% ] 7.85% | 174,274 | 15.3% |
[ 8.0% - 8.5% ] 8.21% | 573,945 | 9.0% |
[ 8.5% - 9.0% ] 8.60% | 207,256 | 6.2% |
[ 8.5% - 9.0% ] 8.81% | 115,715 | 8.2% |
[ 9.0% - 9.5% ] 9.29% | 188,944 | 5.7% |
[ 9.5% - 10.0% ] 9.57% | 79,212 | 9.2% |
[ 9.5% - 10.0% ] 9.81% | 53,626 | 10.0% |
[ 10.0% - 10.5% ] 10.18% | 375,633 | 6.1% |
[ 10.5% - 11.0% ] 10.62% | 34,449 | 9.1% |
[ 10.5% - 11.0% ] 10.88% | 45,801 | 9.6% |
[ 11.0% - 11.5% ] 11.13% | 72,397 | 5.5% |
[ 11.5% - 12.0% ] 11.56% | 27,845 | 3.7% |
[ 11.5% - 12.0% ] 11.94% | 186,230 | 4.0% |
[ 12.0% - 12.5% ] 12.16% | 153,053 | 7.0% |
[ 12.5% - 13.0% ] 12.62% | 98,037 | 7.1% |
[ 12.5% - 13.0% ] 12.90% | 179,860 | 6.3% |
[ 13.5% - 14.0% ] 13.50% | 231,368 | 5.0% |
[ 13.5% - 14.0% ] 13.85% | 180,853 | 6.1% |
[ 14.0% - 14.5% ] 14.26% | 94,219 | 4.5% |
[ 14.5% - 15.0% ] 14.61% | 103,341 | 10.6% |
[ 15.0% - 15.5% ] 15.19% | 144,317 | 7.5% |
[ 15.5% - 16.0% ] 15.59% | 207,337 | 8.7% |
[ 15.5% - 16.0% ] 15.86% | 33,709 | 7.3% |
[ 16.0% - 16.5% ] 16.07% | 26,814 | 1.8% |
[ 16.5% - 17.0% ] 16.65% | 14,585 | 9.5% |
[ 17.0% - 17.5% ] 17.04% | 118,661 | 4.3% |
[ 17.0% - 17.5% ] 17.33% | 62,604 | 8.9% |
[ 17.5% - 18.0% ] 17.57% | 86,232 | 4.0% |
[ 17.5% - 18.0% ] 17.94% | 37,241 | 18.4% |
[ 18.5% - 19.0% ] 18.53% | 62,827 | 12.4% |
[ 19.0% - 19.5% ] 19.19% | 10,946 | 6.2% |
[ 19.5% - 20.0% ] 19.62% | 70,810 | 11.5% |
[ 21.0% - 21.5% ] 21.04% | 62,232 | 8.2% |
[ 21.5% - 22.0% ] 21.79% | 83,221 | 13.8% |
[ 22.0% - 22.5% ] 22.08% | 37,533 | 5.3% |
[ 22.5% - 23.0% ] 22.54% | 43,269 | 7.4% |
[ 26.5% - 27.0% ] 26.83% | 35,914 | 13.3% |
[ 28.0% - 28.5% ] 28.25% | 31,807 | 11.9% |
[ 28.5% - 29.0% ] 28.76% | 22,823 | 11.2% |
[ 29.0% - 29.5% ] 29.13% | 1,775 | 12.7% |
[ 32.5% - 33.0% ] 32.84% | 48,326 | 8.7% |
[ 35.5% - 36.0% ] 35.77% | 17,163 | 9.2% |
[ 37.0% - 37.5% ] 37.04% | 52,824 | 8.4% |
[ 37.5% - 38.0% ] 37.88% | 59,854 | 10.2% |
[ 38.5% - 39.0% ] 38.75% | 2,867 | 8.7% |
[ 40.0% - 40.5% ] 40.35% | 58,183 | 13.2% |