Salvadoran Married-Couple Family Poverty
COMPARE
Salvadoran
Select to Compare
Married-Couple Family Poverty
Salvadoran Married-Couple Family Poverty
6.5%
POVERTY | MARRIED-COUPLE FAMILIES
0.0/ 100
METRIC RATING
288th/ 347
METRIC RANK
Salvadoran Married-Couple Family Poverty Correlation Chart
The statistical analysis conducted on geographies consisting of 395,885,602 people shows a slight positive correlation between the proportion of Salvadorans and poverty level among married-couple families in the United States with a correlation coefficient (R) of 0.092 and weighted average of 6.5%. On average, for every 1% (one percent) increase in Salvadorans within a typical geography, there is an increase of 0.037% in poverty level among married-couple families.
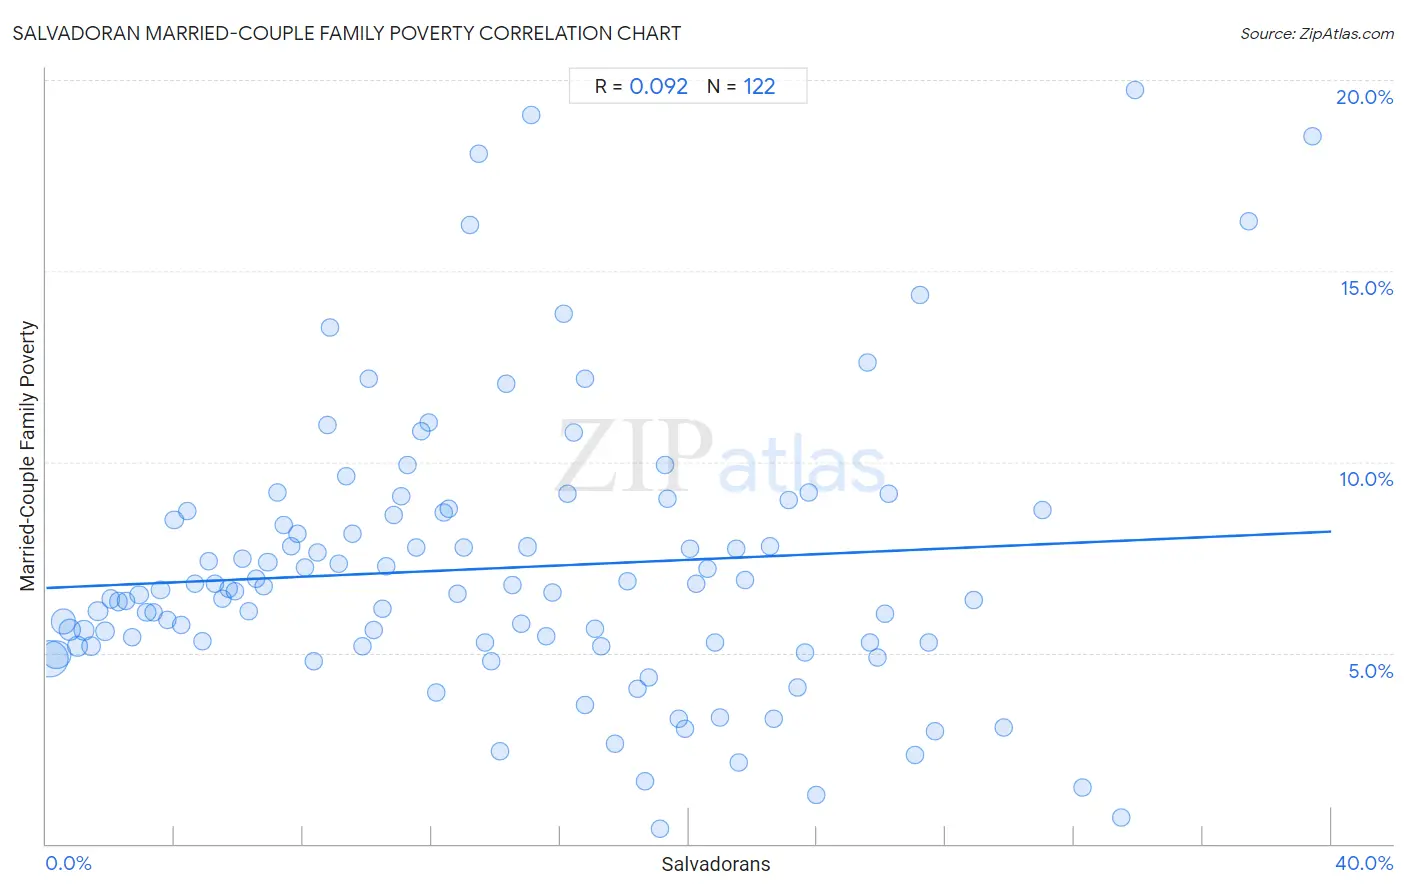
It is essential to understand that the correlation between the percentage of Salvadorans and poverty level among married-couple families does not imply a direct cause-and-effect relationship. It remains uncertain whether the presence of Salvadorans influences an upward or downward trend in the level of poverty level among married-couple families within an area, or if Salvadorans simply ended up residing in those areas with higher or lower levels of poverty level among married-couple families due to other factors.
Demographics Similar to Salvadorans by Married-Couple Family Poverty
In terms of married-couple family poverty, the demographic groups most similar to Salvadorans are Nepalese (6.5%, a difference of 0.17%), Ecuadorian (6.5%, a difference of 0.19%), Immigrants from Barbados (6.5%, a difference of 0.40%), Belizean (6.5%, a difference of 0.44%), and Guyanese (6.5%, a difference of 0.56%).
| Demographics | Rating | Rank | Married-Couple Family Poverty |
| Mexican American Indians | 0.0 /100 | #281 | Tragic 6.4% |
| Seminole | 0.0 /100 | #282 | Tragic 6.4% |
| Ute | 0.0 /100 | #283 | Tragic 6.4% |
| Dutch West Indians | 0.0 /100 | #284 | Tragic 6.4% |
| Blacks/African Americans | 0.0 /100 | #285 | Tragic 6.5% |
| Guyanese | 0.0 /100 | #286 | Tragic 6.5% |
| Ecuadorians | 0.0 /100 | #287 | Tragic 6.5% |
| Salvadorans | 0.0 /100 | #288 | Tragic 6.5% |
| Nepalese | 0.0 /100 | #289 | Tragic 6.5% |
| Immigrants from Barbados | 0.0 /100 | #290 | Tragic 6.5% |
| Belizeans | 0.0 /100 | #291 | Tragic 6.5% |
| Immigrants from Lebanon | 0.0 /100 | #292 | Tragic 6.6% |
| Arapaho | 0.0 /100 | #293 | Tragic 6.6% |
| Bahamians | 0.0 /100 | #294 | Tragic 6.6% |
| Immigrants from Uzbekistan | 0.0 /100 | #295 | Tragic 6.6% |
Salvadoran Married-Couple Family Poverty Correlation Summary
| Measurement | Salvadoran Data | Married-Couple Family Poverty Data |
| Minimum | 0.098% | 0.40% |
| Maximum | 39.4% | 19.7% |
| Range | 39.3% | 19.3% |
| Mean | 14.0% | 7.2% |
| Median | 13.1% | 6.6% |
| Interquartile 25% (IQ1) | 6.6% | 5.3% |
| Interquartile 75% (IQ3) | 20.3% | 8.7% |
| Interquartile Range (IQR) | 13.7% | 3.4% |
| Standard Deviation (Sample) | 9.1% | 3.6% |
| Standard Deviation (Population) | 9.1% | 3.6% |
Correlation Details
| Salvadoran Percentile | Sample Size | Married-Couple Family Poverty |
[ 0.0% - 0.5% ] 0.098% | 129,514,281 | 4.8% |
[ 0.0% - 0.5% ] 0.31% | 73,903,350 | 5.0% |
[ 0.5% - 1.0% ] 0.54% | 48,584,121 | 5.8% |
[ 0.5% - 1.0% ] 0.74% | 28,910,535 | 5.6% |
[ 0.5% - 1.0% ] 0.97% | 17,069,292 | 5.2% |
[ 1.0% - 1.5% ] 1.17% | 13,375,219 | 5.6% |
[ 1.0% - 1.5% ] 1.40% | 10,354,400 | 5.2% |
[ 1.5% - 2.0% ] 1.61% | 10,166,407 | 6.1% |
[ 1.5% - 2.0% ] 1.82% | 8,097,441 | 5.6% |
[ 2.0% - 2.5% ] 2.01% | 5,963,616 | 6.4% |
[ 2.0% - 2.5% ] 2.24% | 4,509,964 | 6.3% |
[ 2.0% - 2.5% ] 2.48% | 4,315,600 | 6.4% |
[ 2.5% - 3.0% ] 2.68% | 4,049,138 | 5.4% |
[ 2.5% - 3.0% ] 2.89% | 2,572,822 | 6.5% |
[ 3.0% - 3.5% ] 3.12% | 2,721,003 | 6.1% |
[ 3.0% - 3.5% ] 3.34% | 2,106,368 | 6.1% |
[ 3.5% - 4.0% ] 3.56% | 1,929,305 | 6.6% |
[ 3.5% - 4.0% ] 3.78% | 1,670,880 | 5.9% |
[ 3.5% - 4.0% ] 3.99% | 1,282,706 | 8.5% |
[ 4.0% - 4.5% ] 4.19% | 1,029,922 | 5.7% |
[ 4.0% - 4.5% ] 4.39% | 3,054,279 | 8.7% |
[ 4.5% - 5.0% ] 4.62% | 883,774 | 6.8% |
[ 4.5% - 5.0% ] 4.85% | 925,630 | 5.3% |
[ 5.0% - 5.5% ] 5.05% | 631,834 | 7.4% |
[ 5.0% - 5.5% ] 5.26% | 884,923 | 6.8% |
[ 5.0% - 5.5% ] 5.50% | 868,391 | 6.4% |
[ 5.5% - 6.0% ] 5.68% | 538,755 | 6.7% |
[ 5.5% - 6.0% ] 5.89% | 425,791 | 6.6% |
[ 6.0% - 6.5% ] 6.10% | 699,945 | 7.5% |
[ 6.0% - 6.5% ] 6.32% | 503,638 | 6.1% |
[ 6.5% - 7.0% ] 6.55% | 588,325 | 6.9% |
[ 6.5% - 7.0% ] 6.77% | 443,588 | 6.8% |
[ 6.5% - 7.0% ] 6.89% | 4,229,716 | 7.4% |
[ 7.0% - 7.5% ] 7.18% | 407,078 | 9.2% |
[ 7.0% - 7.5% ] 7.40% | 204,232 | 8.3% |
[ 7.5% - 8.0% ] 7.62% | 381,832 | 7.8% |
[ 7.5% - 8.0% ] 7.83% | 437,421 | 8.1% |
[ 8.0% - 8.5% ] 8.07% | 532,452 | 7.2% |
[ 8.0% - 8.5% ] 8.32% | 111,619 | 4.8% |
[ 8.0% - 8.5% ] 8.45% | 474,844 | 7.6% |
[ 8.5% - 9.0% ] 8.76% | 278,194 | 11.0% |
[ 8.5% - 9.0% ] 8.84% | 85,102 | 13.5% |
[ 9.0% - 9.5% ] 9.11% | 455,582 | 7.3% |
[ 9.0% - 9.5% ] 9.35% | 323,888 | 9.6% |
[ 9.5% - 10.0% ] 9.54% | 166,820 | 8.1% |
[ 9.5% - 10.0% ] 9.85% | 33,126 | 5.2% |
[ 10.0% - 10.5% ] 10.03% | 248,031 | 12.2% |
[ 10.0% - 10.5% ] 10.20% | 86,693 | 5.6% |
[ 10.0% - 10.5% ] 10.46% | 99,721 | 6.1% |
[ 10.5% - 11.0% ] 10.57% | 170,428 | 7.3% |
[ 10.5% - 11.0% ] 10.83% | 148,515 | 8.6% |
[ 11.0% - 11.5% ] 11.06% | 253,338 | 9.1% |
[ 11.0% - 11.5% ] 11.26% | 104,223 | 9.9% |
[ 11.5% - 12.0% ] 11.51% | 64,640 | 7.8% |
[ 11.5% - 12.0% ] 11.69% | 167,741 | 10.8% |
[ 11.5% - 12.0% ] 11.91% | 224,804 | 11.0% |
[ 12.0% - 12.5% ] 12.13% | 89,488 | 4.0% |
[ 12.0% - 12.5% ] 12.37% | 236,936 | 8.7% |
[ 12.5% - 13.0% ] 12.51% | 54,358 | 8.8% |
[ 12.5% - 13.0% ] 12.82% | 64,666 | 6.5% |
[ 12.5% - 13.0% ] 13.00% | 152,703 | 7.8% |
[ 13.0% - 13.5% ] 13.19% | 107,743 | 16.2% |
[ 13.0% - 13.5% ] 13.48% | 2,485 | 18.1% |
[ 13.5% - 14.0% ] 13.66% | 130,830 | 5.3% |
[ 13.5% - 14.0% ] 13.84% | 24,963 | 4.8% |
[ 14.0% - 14.5% ] 14.11% | 114,309 | 2.4% |
[ 14.0% - 14.5% ] 14.33% | 134,582 | 12.0% |
[ 14.5% - 15.0% ] 14.51% | 140,862 | 6.8% |
[ 14.5% - 15.0% ] 14.77% | 150,447 | 5.8% |
[ 14.5% - 15.0% ] 14.99% | 146,718 | 7.8% |
[ 15.0% - 15.5% ] 15.11% | 748 | 19.1% |
[ 15.5% - 16.0% ] 15.56% | 75,388 | 5.4% |
[ 15.5% - 16.0% ] 15.77% | 48,651 | 6.6% |
[ 16.0% - 16.5% ] 16.09% | 56,628 | 13.9% |
[ 16.0% - 16.5% ] 16.23% | 144,532 | 9.2% |
[ 16.0% - 16.5% ] 16.43% | 45,208 | 10.8% |
[ 16.5% - 17.0% ] 16.76% | 57,182 | 12.2% |
[ 16.5% - 17.0% ] 16.76% | 5,697 | 3.6% |
[ 17.0% - 17.5% ] 17.09% | 32,271 | 5.6% |
[ 17.0% - 17.5% ] 17.29% | 2,719 | 5.2% |
[ 17.5% - 18.0% ] 17.71% | 67,229 | 2.6% |
[ 18.0% - 18.5% ] 18.11% | 55,960 | 6.9% |
[ 18.0% - 18.5% ] 18.39% | 63,751 | 4.1% |
[ 18.5% - 19.0% ] 18.62% | 18,346 | 1.6% |
[ 18.5% - 19.0% ] 18.75% | 57,116 | 4.3% |
[ 19.0% - 19.5% ] 19.12% | 17,123 | 0.40% |
[ 19.0% - 19.5% ] 19.27% | 38,524 | 9.9% |
[ 19.0% - 19.5% ] 19.35% | 1,907 | 9.0% |
[ 19.5% - 20.0% ] 19.68% | 81,379 | 3.3% |
[ 19.5% - 20.0% ] 19.87% | 97,824 | 3.0% |
[ 20.0% - 20.5% ] 20.03% | 56,319 | 7.7% |
[ 20.0% - 20.5% ] 20.25% | 33,927 | 6.8% |
[ 20.5% - 21.0% ] 20.60% | 61,783 | 7.2% |
[ 20.5% - 21.0% ] 20.82% | 51,837 | 5.3% |
[ 20.5% - 21.0% ] 20.98% | 53,308 | 3.3% |
[ 21.0% - 21.5% ] 21.48% | 58,557 | 7.7% |
[ 21.5% - 22.0% ] 21.56% | 19,289 | 2.1% |
[ 21.5% - 22.0% ] 21.74% | 28,660 | 6.9% |
[ 22.5% - 23.0% ] 22.53% | 13,299 | 7.8% |
[ 22.5% - 23.0% ] 22.65% | 34,625 | 3.3% |
[ 23.0% - 23.5% ] 23.12% | 19,102 | 9.0% |
[ 23.0% - 23.5% ] 23.38% | 52,775 | 4.1% |
[ 23.5% - 24.0% ] 23.60% | 19,704 | 5.0% |
[ 23.5% - 24.0% ] 23.74% | 19,233 | 9.2% |
[ 23.5% - 24.0% ] 23.95% | 27,886 | 1.3% |
[ 25.5% - 26.0% ] 25.55% | 21,778 | 12.6% |
[ 25.5% - 26.0% ] 25.64% | 35,336 | 5.3% |
[ 25.5% - 26.0% ] 25.88% | 167,043 | 4.9% |
[ 26.0% - 26.5% ] 26.12% | 82,627 | 6.0% |
[ 26.0% - 26.5% ] 26.22% | 39,875 | 9.2% |
[ 27.0% - 27.5% ] 27.05% | 3,782 | 2.3% |
[ 27.0% - 27.5% ] 27.19% | 20,627 | 14.4% |
[ 27.0% - 27.5% ] 27.47% | 22,966 | 5.3% |
[ 27.5% - 28.0% ] 27.66% | 3,851 | 3.0% |
[ 28.5% - 29.0% ] 28.88% | 7,515 | 6.4% |
[ 29.5% - 30.0% ] 29.79% | 10,563 | 3.1% |
[ 31.0% - 31.5% ] 31.00% | 101,422 | 8.8% |
[ 32.0% - 32.5% ] 32.26% | 1,516 | 1.5% |
[ 33.0% - 33.5% ] 33.45% | 3,312 | 0.69% |
[ 33.5% - 34.0% ] 33.91% | 14,162 | 19.7% |
[ 37.0% - 37.5% ] 37.43% | 12,603 | 16.3% |
[ 39.0% - 39.5% ] 39.40% | 1,764 | 18.5% |