Immigrants from Western Asia Married-Couple Family Poverty
COMPARE
Immigrants from Western Asia
Select to Compare
Married-Couple Family Poverty
Immigrants from Western Asia Married-Couple Family Poverty
6.0%
POVERTY | MARRIED-COUPLE FAMILIES
0.7/ 100
METRIC RATING
252nd/ 347
METRIC RANK
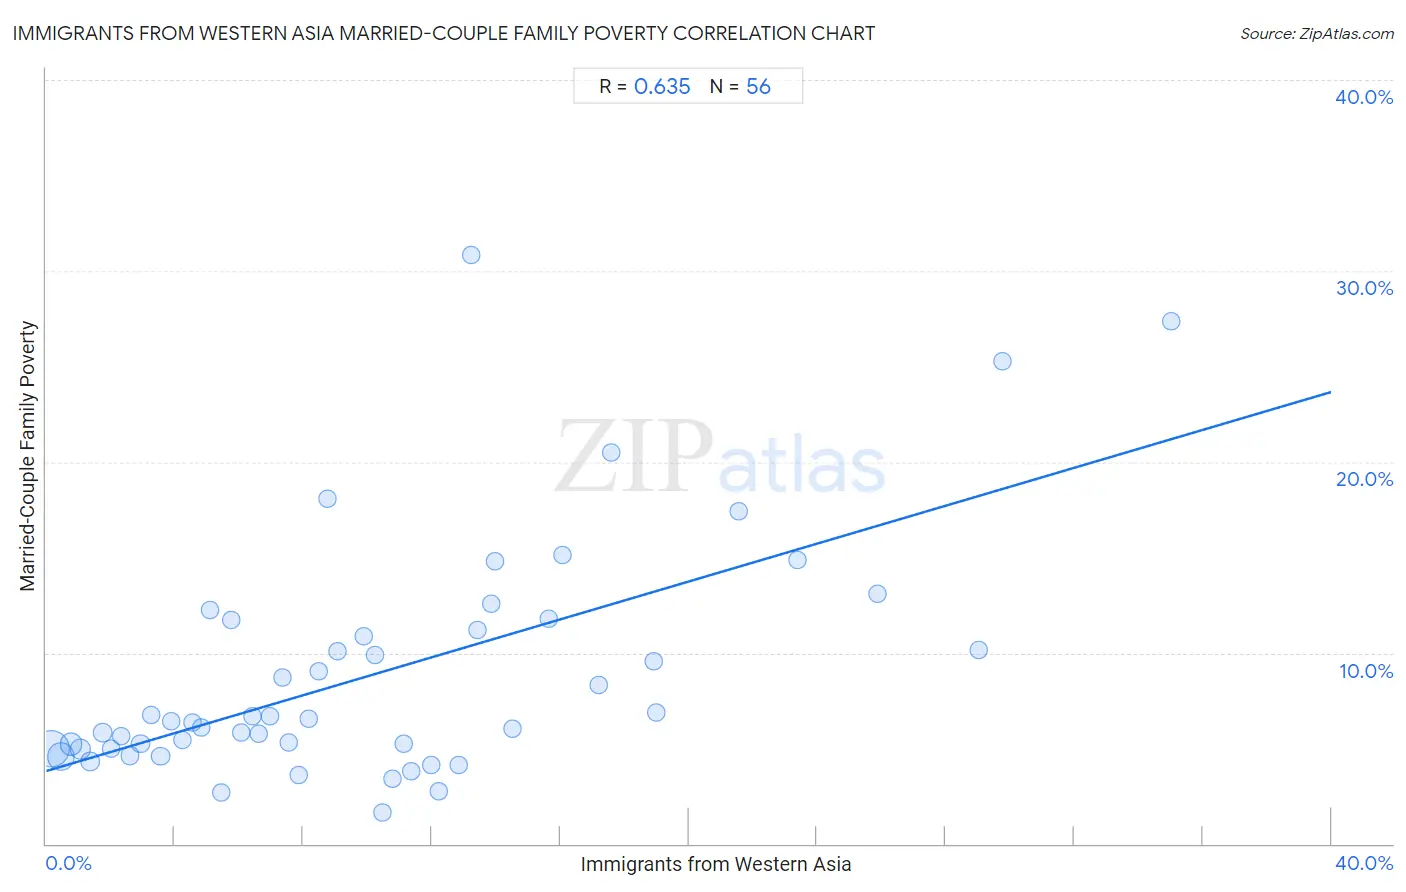
Immigrants from Western Asia Married-Couple Family Poverty Correlation Chart
The statistical analysis conducted on geographies consisting of 400,576,171 people shows a significant positive correlation between the proportion of Immigrants from Western Asia and poverty level among married-couple families in the United States with a correlation coefficient (R) of 0.635 and weighted average of 6.0%. On average, for every 1% (one percent) increase in Immigrants from Western Asia within a typical geography, there is an increase of 0.50% in poverty level among married-couple families.
It is essential to understand that the correlation between the percentage of Immigrants from Western Asia and poverty level among married-couple families does not imply a direct cause-and-effect relationship. It remains uncertain whether the presence of Immigrants from Western Asia influences an upward or downward trend in the level of poverty level among married-couple families within an area, or if Immigrants from Western Asia simply ended up residing in those areas with higher or lower levels of poverty level among married-couple families due to other factors.
Demographics Similar to Immigrants from Western Asia by Married-Couple Family Poverty
In terms of married-couple family poverty, the demographic groups most similar to Immigrants from Western Asia are African (6.0%, a difference of 0.090%), Immigrants from Somalia (6.0%, a difference of 0.15%), Comanche (6.0%, a difference of 0.30%), Immigrants from Ghana (5.9%, a difference of 0.64%), and Bangladeshi (6.0%, a difference of 0.80%).
| Demographics | Rating | Rank | Married-Couple Family Poverty |
| Immigrants from Afghanistan | 2.1 /100 | #245 | Tragic 5.8% |
| Immigrants from Venezuela | 1.8 /100 | #246 | Tragic 5.8% |
| Iraqis | 1.4 /100 | #247 | Tragic 5.9% |
| Cree | 1.2 /100 | #248 | Tragic 5.9% |
| Tsimshian | 1.1 /100 | #249 | Tragic 5.9% |
| Immigrants from Eritrea | 1.1 /100 | #250 | Tragic 5.9% |
| Immigrants from Ghana | 1.0 /100 | #251 | Tragic 5.9% |
| Immigrants from Western Asia | 0.7 /100 | #252 | Tragic 6.0% |
| Africans | 0.7 /100 | #253 | Tragic 6.0% |
| Immigrants from Somalia | 0.7 /100 | #254 | Tragic 6.0% |
| Comanche | 0.7 /100 | #255 | Tragic 6.0% |
| Bangladeshis | 0.5 /100 | #256 | Tragic 6.0% |
| Immigrants from Burma/Myanmar | 0.5 /100 | #257 | Tragic 6.0% |
| Immigrants | 0.5 /100 | #258 | Tragic 6.0% |
| Alaskan Athabascans | 0.4 /100 | #259 | Tragic 6.1% |
Immigrants from Western Asia Married-Couple Family Poverty Correlation Summary
| Measurement | Immigrants from Western Asia Data | Married-Couple Family Poverty Data |
| Minimum | 0.14% | 1.7% |
| Maximum | 35.0% | 30.8% |
| Range | 34.9% | 29.2% |
| Mean | 10.3% | 8.9% |
| Median | 8.6% | 6.5% |
| Interquartile 25% (IQ1) | 4.4% | 5.0% |
| Interquartile 75% (IQ3) | 13.9% | 11.5% |
| Interquartile Range (IQR) | 9.5% | 6.5% |
| Standard Deviation (Sample) | 7.9% | 6.2% |
| Standard Deviation (Population) | 7.8% | 6.1% |
Correlation Details
| Immigrants from Western Asia Percentile | Sample Size | Married-Couple Family Poverty |
[ 0.0% - 0.5% ] 0.14% | 201,908,412 | 5.0% |
[ 0.0% - 0.5% ] 0.45% | 101,059,710 | 4.6% |
[ 0.5% - 1.0% ] 0.78% | 44,819,983 | 5.2% |
[ 1.0% - 1.5% ] 1.07% | 19,290,587 | 5.0% |
[ 1.0% - 1.5% ] 1.38% | 9,241,866 | 4.3% |
[ 1.5% - 2.0% ] 1.76% | 9,934,172 | 5.8% |
[ 2.0% - 2.5% ] 2.01% | 3,522,728 | 5.0% |
[ 2.0% - 2.5% ] 2.32% | 2,288,969 | 5.6% |
[ 2.5% - 3.0% ] 2.61% | 1,463,553 | 4.6% |
[ 2.5% - 3.0% ] 2.94% | 1,390,730 | 5.3% |
[ 3.0% - 3.5% ] 3.28% | 916,398 | 6.7% |
[ 3.5% - 4.0% ] 3.56% | 584,863 | 4.6% |
[ 3.5% - 4.0% ] 3.89% | 283,688 | 6.4% |
[ 4.0% - 4.5% ] 4.25% | 491,642 | 5.5% |
[ 4.5% - 5.0% ] 4.54% | 271,210 | 6.3% |
[ 4.5% - 5.0% ] 4.81% | 167,401 | 6.1% |
[ 5.0% - 5.5% ] 5.09% | 300,297 | 12.3% |
[ 5.0% - 5.5% ] 5.43% | 101,188 | 2.7% |
[ 5.5% - 6.0% ] 5.77% | 264,138 | 11.7% |
[ 6.0% - 6.5% ] 6.08% | 187,917 | 5.8% |
[ 6.0% - 6.5% ] 6.44% | 120,665 | 6.7% |
[ 6.5% - 7.0% ] 6.60% | 148,150 | 5.7% |
[ 6.5% - 7.0% ] 6.95% | 100,920 | 6.7% |
[ 7.0% - 7.5% ] 7.35% | 102,180 | 8.7% |
[ 7.5% - 8.0% ] 7.54% | 74,265 | 5.3% |
[ 7.5% - 8.0% ] 7.84% | 37,339 | 3.6% |
[ 8.0% - 8.5% ] 8.17% | 87,848 | 6.5% |
[ 8.0% - 8.5% ] 8.48% | 11,326 | 9.1% |
[ 8.5% - 9.0% ] 8.77% | 25,278 | 18.1% |
[ 9.0% - 9.5% ] 9.06% | 49,028 | 10.1% |
[ 9.5% - 10.0% ] 9.90% | 3,950 | 10.9% |
[ 10.0% - 10.5% ] 10.23% | 51,654 | 9.9% |
[ 10.0% - 10.5% ] 10.49% | 11,091 | 1.7% |
[ 10.5% - 11.0% ] 10.77% | 22,430 | 3.4% |
[ 11.0% - 11.5% ] 11.14% | 45,937 | 5.2% |
[ 11.0% - 11.5% ] 11.36% | 61,447 | 3.8% |
[ 12.0% - 12.5% ] 12.00% | 21,587 | 4.1% |
[ 12.0% - 12.5% ] 12.23% | 33,174 | 2.8% |
[ 12.5% - 13.0% ] 12.83% | 34,921 | 4.1% |
[ 13.0% - 13.5% ] 13.24% | 43,863 | 30.8% |
[ 13.0% - 13.5% ] 13.42% | 59,775 | 11.2% |
[ 13.5% - 14.0% ] 13.84% | 105,950 | 12.6% |
[ 13.5% - 14.0% ] 13.99% | 18,445 | 14.8% |
[ 14.5% - 15.0% ] 14.53% | 146,149 | 6.0% |
[ 15.5% - 16.0% ] 15.62% | 17,165 | 11.8% |
[ 16.0% - 16.5% ] 16.05% | 62,474 | 15.1% |
[ 17.0% - 17.5% ] 17.18% | 194,512 | 8.3% |
[ 17.5% - 18.0% ] 17.59% | 50,005 | 20.5% |
[ 18.5% - 19.0% ] 18.92% | 32,294 | 9.6% |
[ 18.5% - 19.0% ] 18.99% | 22,831 | 6.8% |
[ 21.5% - 22.0% ] 21.57% | 40,392 | 17.4% |
[ 23.0% - 23.5% ] 23.38% | 151,646 | 14.9% |
[ 25.5% - 26.0% ] 25.87% | 35,755 | 13.1% |
[ 29.0% - 29.5% ] 29.03% | 310 | 10.1% |
[ 29.5% - 30.0% ] 29.76% | 8,919 | 25.3% |
[ 35.0% - 35.5% ] 35.02% | 53,044 | 27.3% |