Indian (Asian) Married-Couple Family Poverty
COMPARE
Indian (Asian)
Select to Compare
Married-Couple Family Poverty
Indian (Asian) Married-Couple Family Poverty
4.8%
POVERTY | MARRIED-COUPLE FAMILIES
93.2/ 100
METRIC RATING
121st/ 347
METRIC RANK
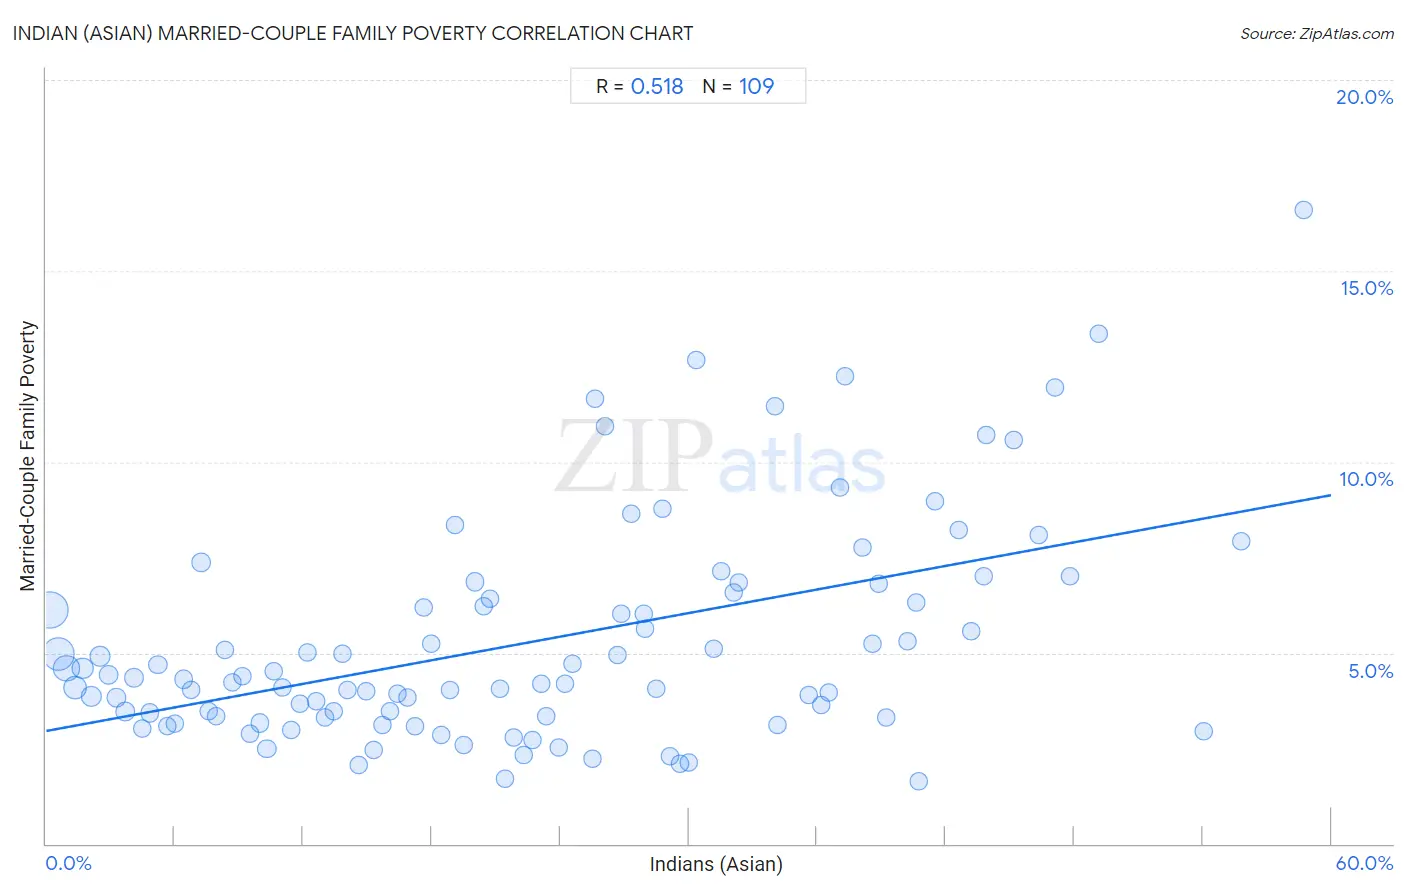
Indian (Asian) Married-Couple Family Poverty Correlation Chart
The statistical analysis conducted on geographies consisting of 487,935,416 people shows a substantial positive correlation between the proportion of Indians (Asian) and poverty level among married-couple families in the United States with a correlation coefficient (R) of 0.518 and weighted average of 4.8%. On average, for every 1% (one percent) increase in Indians (Asian) within a typical geography, there is an increase of 0.10% in poverty level among married-couple families.
It is essential to understand that the correlation between the percentage of Indians (Asian) and poverty level among married-couple families does not imply a direct cause-and-effect relationship. It remains uncertain whether the presence of Indians (Asian) influences an upward or downward trend in the level of poverty level among married-couple families within an area, or if Indians (Asian) simply ended up residing in those areas with higher or lower levels of poverty level among married-couple families due to other factors.
Demographics Similar to Indians (Asian) by Married-Couple Family Poverty
In terms of married-couple family poverty, the demographic groups most similar to Indians (Asian) are White/Caucasian (4.8%, a difference of 0.050%), Jordanian (4.8%, a difference of 0.060%), Immigrants from Southern Europe (4.8%, a difference of 0.090%), Romanian (4.8%, a difference of 0.33%), and Immigrants from Bosnia and Herzegovina (4.8%, a difference of 0.35%).
| Demographics | Rating | Rank | Married-Couple Family Poverty |
| Immigrants from Indonesia | 95.1 /100 | #114 | Exceptional 4.8% |
| Taiwanese | 94.8 /100 | #115 | Exceptional 4.8% |
| Celtics | 94.8 /100 | #116 | Exceptional 4.8% |
| Kenyans | 94.7 /100 | #117 | Exceptional 4.8% |
| Immigrants from Philippines | 94.6 /100 | #118 | Exceptional 4.8% |
| Immigrants from Eastern Asia | 94.0 /100 | #119 | Exceptional 4.8% |
| Immigrants from Southern Europe | 93.4 /100 | #120 | Exceptional 4.8% |
| Indians (Asian) | 93.2 /100 | #121 | Exceptional 4.8% |
| Whites/Caucasians | 93.1 /100 | #122 | Exceptional 4.8% |
| Jordanians | 93.1 /100 | #123 | Exceptional 4.8% |
| Romanians | 92.5 /100 | #124 | Exceptional 4.8% |
| Immigrants from Bosnia and Herzegovina | 92.5 /100 | #125 | Exceptional 4.8% |
| Immigrants from Asia | 92.3 /100 | #126 | Exceptional 4.8% |
| Egyptians | 92.0 /100 | #127 | Exceptional 4.8% |
| Palestinians | 91.2 /100 | #128 | Exceptional 4.9% |
Indian (Asian) Married-Couple Family Poverty Correlation Summary
| Measurement | Indian (Asian) Data | Married-Couple Family Poverty Data |
| Minimum | 0.19% | 1.7% |
| Maximum | 58.7% | 16.6% |
| Range | 58.5% | 14.9% |
| Mean | 22.5% | 5.3% |
| Median | 21.2% | 4.3% |
| Interquartile 25% (IQ1) | 10.5% | 3.3% |
| Interquartile 75% (IQ3) | 33.2% | 6.5% |
| Interquartile Range (IQR) | 22.7% | 3.2% |
| Standard Deviation (Sample) | 14.4% | 2.9% |
| Standard Deviation (Population) | 14.3% | 2.9% |
Correlation Details
| Indian (Asian) Percentile | Sample Size | Married-Couple Family Poverty |
[ 0.0% - 0.5% ] 0.19% | 138,954,685 | 6.1% |
[ 0.5% - 1.0% ] 0.57% | 106,944,889 | 5.0% |
[ 0.5% - 1.0% ] 0.95% | 61,805,203 | 4.6% |
[ 1.0% - 1.5% ] 1.34% | 35,646,938 | 4.1% |
[ 1.5% - 2.0% ] 1.72% | 25,419,654 | 4.6% |
[ 2.0% - 2.5% ] 2.11% | 17,199,774 | 3.9% |
[ 2.5% - 3.0% ] 2.51% | 17,826,108 | 4.9% |
[ 2.5% - 3.0% ] 2.91% | 11,293,696 | 4.4% |
[ 3.0% - 3.5% ] 3.29% | 6,755,613 | 3.8% |
[ 3.5% - 4.0% ] 3.67% | 5,849,981 | 3.5% |
[ 4.0% - 4.5% ] 4.08% | 5,718,187 | 4.3% |
[ 4.0% - 4.5% ] 4.48% | 3,326,374 | 3.0% |
[ 4.5% - 5.0% ] 4.83% | 3,255,502 | 3.4% |
[ 5.0% - 5.5% ] 5.22% | 4,030,343 | 4.7% |
[ 5.5% - 6.0% ] 5.64% | 2,302,891 | 3.1% |
[ 5.5% - 6.0% ] 6.00% | 2,109,915 | 3.1% |
[ 6.0% - 6.5% ] 6.42% | 1,589,236 | 4.3% |
[ 6.5% - 7.0% ] 6.77% | 1,821,532 | 4.0% |
[ 7.0% - 7.5% ] 7.25% | 10,835,531 | 7.4% |
[ 7.5% - 8.0% ] 7.61% | 1,054,668 | 3.5% |
[ 7.5% - 8.0% ] 7.95% | 1,237,228 | 3.4% |
[ 8.0% - 8.5% ] 8.35% | 1,261,673 | 5.1% |
[ 8.5% - 9.0% ] 8.71% | 1,859,603 | 4.2% |
[ 9.0% - 9.5% ] 9.15% | 691,422 | 4.4% |
[ 9.5% - 10.0% ] 9.51% | 759,624 | 2.9% |
[ 9.5% - 10.0% ] 9.99% | 1,431,554 | 3.2% |
[ 10.0% - 10.5% ] 10.30% | 412,909 | 2.5% |
[ 10.5% - 11.0% ] 10.62% | 409,302 | 4.5% |
[ 11.0% - 11.5% ] 11.04% | 678,063 | 4.1% |
[ 11.0% - 11.5% ] 11.44% | 562,738 | 3.0% |
[ 11.5% - 12.0% ] 11.85% | 702,618 | 3.7% |
[ 12.0% - 12.5% ] 12.19% | 753,531 | 5.0% |
[ 12.5% - 13.0% ] 12.63% | 668,360 | 3.7% |
[ 13.0% - 13.5% ] 13.00% | 438,274 | 3.3% |
[ 13.0% - 13.5% ] 13.42% | 224,691 | 3.5% |
[ 13.5% - 14.0% ] 13.81% | 336,115 | 5.0% |
[ 14.0% - 14.5% ] 14.08% | 531,630 | 4.0% |
[ 14.5% - 15.0% ] 14.60% | 192,636 | 2.0% |
[ 14.5% - 15.0% ] 14.93% | 465,998 | 4.0% |
[ 15.0% - 15.5% ] 15.27% | 747,449 | 2.4% |
[ 15.5% - 16.0% ] 15.71% | 459,611 | 3.1% |
[ 16.0% - 16.5% ] 16.08% | 272,449 | 3.5% |
[ 16.0% - 16.5% ] 16.40% | 515,007 | 3.9% |
[ 16.5% - 17.0% ] 16.89% | 415,089 | 3.8% |
[ 17.0% - 17.5% ] 17.21% | 102,332 | 3.1% |
[ 17.5% - 18.0% ] 17.63% | 316,651 | 6.2% |
[ 17.5% - 18.0% ] 17.97% | 632,061 | 5.2% |
[ 18.0% - 18.5% ] 18.43% | 527,126 | 2.9% |
[ 18.5% - 19.0% ] 18.87% | 338,253 | 4.0% |
[ 19.0% - 19.5% ] 19.11% | 110,633 | 8.3% |
[ 19.0% - 19.5% ] 19.48% | 304,723 | 2.6% |
[ 20.0% - 20.5% ] 20.02% | 795,403 | 6.9% |
[ 20.0% - 20.5% ] 20.43% | 104,063 | 6.2% |
[ 20.5% - 21.0% ] 20.74% | 236,857 | 6.4% |
[ 21.0% - 21.5% ] 21.21% | 65,312 | 4.1% |
[ 21.0% - 21.5% ] 21.41% | 203,886 | 1.7% |
[ 21.5% - 22.0% ] 21.85% | 64,946 | 2.8% |
[ 22.0% - 22.5% ] 22.29% | 70,768 | 2.3% |
[ 22.5% - 23.0% ] 22.71% | 133,398 | 2.7% |
[ 23.0% - 23.5% ] 23.09% | 144,601 | 4.2% |
[ 23.0% - 23.5% ] 23.36% | 862,624 | 3.4% |
[ 23.5% - 24.0% ] 23.95% | 60,815 | 2.5% |
[ 24.0% - 24.5% ] 24.23% | 171,320 | 4.2% |
[ 24.5% - 25.0% ] 24.58% | 45,466 | 4.7% |
[ 25.0% - 25.5% ] 25.50% | 49,352 | 2.2% |
[ 25.5% - 26.0% ] 25.62% | 91,833 | 11.7% |
[ 26.0% - 26.5% ] 26.11% | 23,343 | 10.9% |
[ 26.5% - 27.0% ] 26.69% | 50,734 | 4.9% |
[ 26.5% - 27.0% ] 26.85% | 88,531 | 6.0% |
[ 27.0% - 27.5% ] 27.30% | 19,882 | 8.7% |
[ 27.5% - 28.0% ] 27.87% | 125,567 | 6.0% |
[ 27.5% - 28.0% ] 27.93% | 52,707 | 5.6% |
[ 28.0% - 28.5% ] 28.48% | 108,626 | 4.1% |
[ 28.5% - 29.0% ] 28.77% | 46,424 | 8.8% |
[ 29.0% - 29.5% ] 29.10% | 114,878 | 2.3% |
[ 29.5% - 30.0% ] 29.57% | 90,121 | 2.1% |
[ 29.5% - 30.0% ] 29.99% | 90,534 | 2.1% |
[ 30.0% - 30.5% ] 30.34% | 118,437 | 12.7% |
[ 31.0% - 31.5% ] 31.18% | 19,928 | 5.1% |
[ 31.5% - 32.0% ] 31.53% | 48,930 | 7.1% |
[ 32.0% - 32.5% ] 32.10% | 38,554 | 6.6% |
[ 32.0% - 32.5% ] 32.32% | 98,730 | 6.8% |
[ 34.0% - 34.5% ] 34.02% | 135,971 | 11.5% |
[ 34.0% - 34.5% ] 34.14% | 43,304 | 3.1% |
[ 35.5% - 36.0% ] 35.63% | 80,880 | 3.9% |
[ 36.0% - 36.5% ] 36.18% | 65,922 | 3.6% |
[ 36.5% - 37.0% ] 36.54% | 31,986 | 4.0% |
[ 37.0% - 37.5% ] 37.05% | 62,692 | 9.3% |
[ 37.0% - 37.5% ] 37.28% | 126,375 | 12.2% |
[ 38.0% - 38.5% ] 38.11% | 129,504 | 7.8% |
[ 38.5% - 39.0% ] 38.57% | 115,076 | 5.2% |
[ 38.5% - 39.0% ] 38.86% | 85,525 | 6.8% |
[ 39.0% - 39.5% ] 39.20% | 7,786 | 3.3% |
[ 40.0% - 40.5% ] 40.24% | 22,654 | 5.3% |
[ 40.5% - 41.0% ] 40.62% | 28,212 | 6.3% |
[ 40.5% - 41.0% ] 40.74% | 2,825 | 1.7% |
[ 41.5% - 42.0% ] 41.51% | 33,937 | 9.0% |
[ 42.5% - 43.0% ] 42.62% | 59,410 | 8.2% |
[ 43.0% - 43.5% ] 43.21% | 83,114 | 5.6% |
[ 43.5% - 44.0% ] 43.76% | 91,781 | 7.0% |
[ 43.5% - 44.0% ] 43.92% | 25,460 | 10.7% |
[ 45.0% - 45.5% ] 45.16% | 37,340 | 10.6% |
[ 46.0% - 46.5% ] 46.32% | 557 | 8.1% |
[ 47.0% - 47.5% ] 47.13% | 89,536 | 12.0% |
[ 47.5% - 48.0% ] 47.80% | 95,942 | 7.0% |
[ 49.0% - 49.5% ] 49.15% | 12,070 | 13.4% |
[ 54.0% - 54.5% ] 54.04% | 25,001 | 2.9% |
[ 55.5% - 56.0% ] 55.81% | 26,418 | 7.9% |
[ 58.5% - 59.0% ] 58.72% | 79,495 | 16.6% |