Swedish Married-Couple Family Poverty
COMPARE
Swedish
Select to Compare
Married-Couple Family Poverty
Swedish Married-Couple Family Poverty
3.9%
POVERTY | MARRIED-COUPLE FAMILIES
100.0/ 100
METRIC RATING
5th/ 347
METRIC RANK
Swedish Married-Couple Family Poverty Correlation Chart
The statistical analysis conducted on geographies consisting of 527,096,192 people shows a significant positive correlation between the proportion of Swedes and poverty level among married-couple families in the United States with a correlation coefficient (R) of 0.622 and weighted average of 3.9%. On average, for every 1% (one percent) increase in Swedes within a typical geography, there is an increase of 0.69% in poverty level among married-couple families.
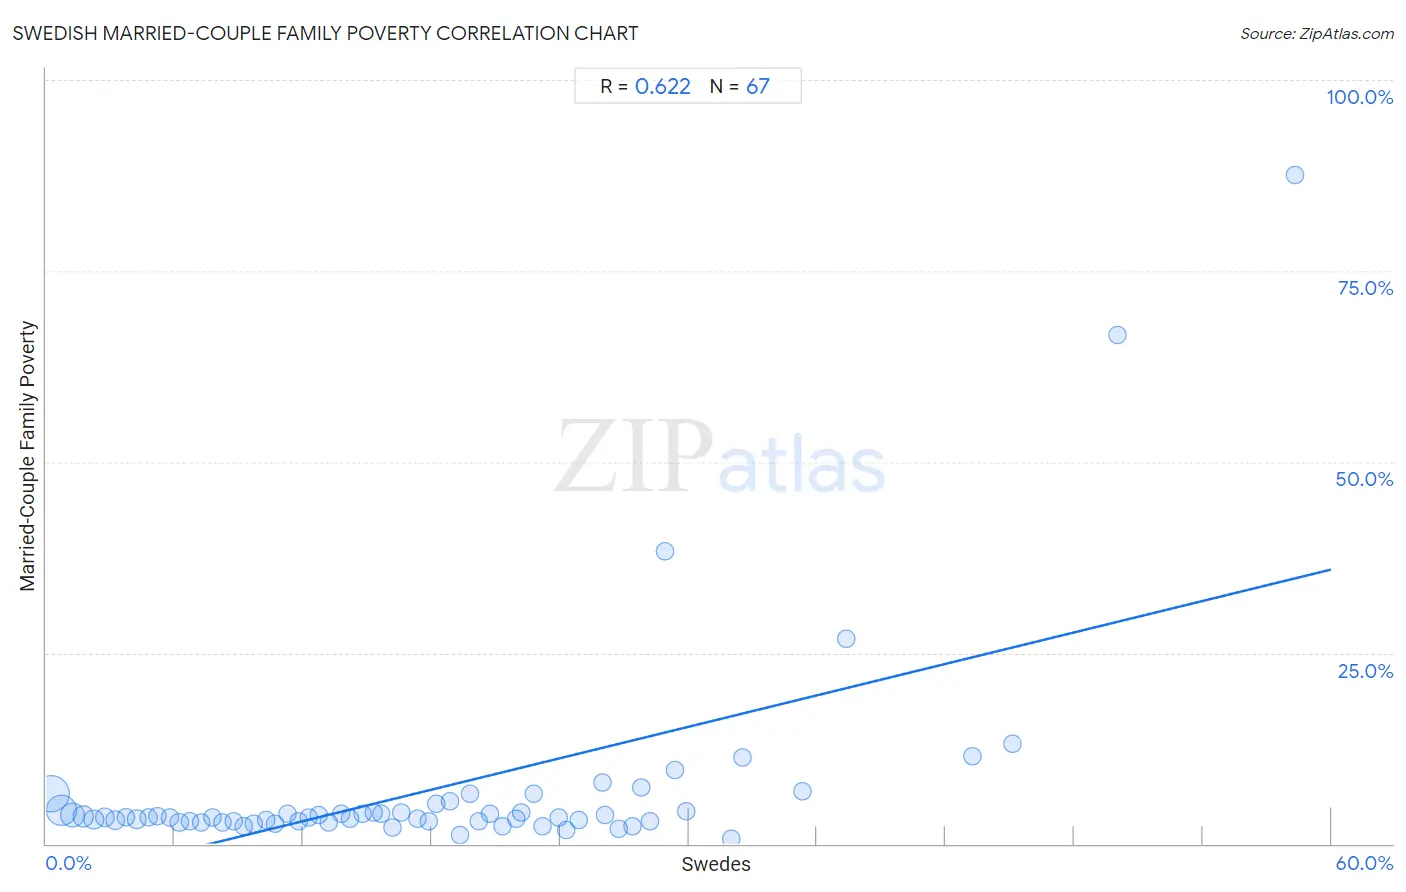
It is essential to understand that the correlation between the percentage of Swedes and poverty level among married-couple families does not imply a direct cause-and-effect relationship. It remains uncertain whether the presence of Swedes influences an upward or downward trend in the level of poverty level among married-couple families within an area, or if Swedes simply ended up residing in those areas with higher or lower levels of poverty level among married-couple families due to other factors.
Demographics Similar to Swedes by Married-Couple Family Poverty
In terms of married-couple family poverty, the demographic groups most similar to Swedes are Slovene (3.8%, a difference of 0.15%), Luxembourger (3.9%, a difference of 0.61%), Latvian (3.9%, a difference of 1.1%), Thai (3.9%, a difference of 1.7%), and Croatian (3.9%, a difference of 2.1%).
| Demographics | Rating | Rank | Married-Couple Family Poverty |
| Immigrants from India | 100.0 /100 | #1 | Exceptional 3.6% |
| Chinese | 100.0 /100 | #2 | Exceptional 3.6% |
| Norwegians | 100.0 /100 | #3 | Exceptional 3.7% |
| Slovenes | 100.0 /100 | #4 | Exceptional 3.8% |
| Swedes | 100.0 /100 | #5 | Exceptional 3.9% |
| Luxembourgers | 100.0 /100 | #6 | Exceptional 3.9% |
| Latvians | 100.0 /100 | #7 | Exceptional 3.9% |
| Thais | 100.0 /100 | #8 | Exceptional 3.9% |
| Croatians | 100.0 /100 | #9 | Exceptional 3.9% |
| Carpatho Rusyns | 100.0 /100 | #10 | Exceptional 3.9% |
| Lithuanians | 100.0 /100 | #11 | Exceptional 4.0% |
| Bulgarians | 100.0 /100 | #12 | Exceptional 4.0% |
| Czechs | 100.0 /100 | #13 | Exceptional 4.0% |
| Slovaks | 100.0 /100 | #14 | Exceptional 4.0% |
| Poles | 100.0 /100 | #15 | Exceptional 4.0% |
Swedish Married-Couple Family Poverty Correlation Summary
| Measurement | Swedish Data | Married-Couple Family Poverty Data |
| Minimum | 0.26% | 0.65% |
| Maximum | 58.3% | 87.5% |
| Range | 58.1% | 86.9% |
| Mean | 18.0% | 7.1% |
| Median | 16.6% | 3.4% |
| Interquartile 25% (IQ1) | 8.2% | 2.9% |
| Interquartile 75% (IQ3) | 25.9% | 4.3% |
| Interquartile Range (IQR) | 17.7% | 1.4% |
| Standard Deviation (Sample) | 12.4% | 13.7% |
| Standard Deviation (Population) | 12.3% | 13.5% |
Correlation Details
| Swedish Percentile | Sample Size | Married-Couple Family Poverty |
[ 0.0% - 0.5% ] 0.26% | 208,803,750 | 6.6% |
[ 0.5% - 1.0% ] 0.73% | 132,149,463 | 4.3% |
[ 1.0% - 1.5% ] 1.22% | 69,698,660 | 3.8% |
[ 1.5% - 2.0% ] 1.73% | 38,610,785 | 3.5% |
[ 2.0% - 2.5% ] 2.23% | 25,393,348 | 3.2% |
[ 2.5% - 3.0% ] 2.72% | 17,305,016 | 3.4% |
[ 3.0% - 3.5% ] 3.23% | 10,143,657 | 3.1% |
[ 3.5% - 4.0% ] 3.72% | 6,887,913 | 3.5% |
[ 4.0% - 4.5% ] 4.22% | 3,327,784 | 3.2% |
[ 4.5% - 5.0% ] 4.76% | 2,337,270 | 3.5% |
[ 5.0% - 5.5% ] 5.20% | 2,108,967 | 3.6% |
[ 5.5% - 6.0% ] 5.77% | 1,567,038 | 3.4% |
[ 6.0% - 6.5% ] 6.21% | 1,892,634 | 2.9% |
[ 6.5% - 7.0% ] 6.71% | 1,162,624 | 3.0% |
[ 7.0% - 7.5% ] 7.24% | 858,586 | 2.8% |
[ 7.5% - 8.0% ] 7.77% | 1,072,704 | 3.4% |
[ 8.0% - 8.5% ] 8.22% | 672,596 | 2.8% |
[ 8.5% - 9.0% ] 8.75% | 578,218 | 2.9% |
[ 9.0% - 9.5% ] 9.23% | 490,690 | 2.3% |
[ 9.5% - 10.0% ] 9.72% | 492,306 | 2.6% |
[ 10.0% - 10.5% ] 10.29% | 272,459 | 3.1% |
[ 10.5% - 11.0% ] 10.70% | 150,619 | 2.7% |
[ 11.0% - 11.5% ] 11.24% | 197,909 | 3.9% |
[ 11.5% - 12.0% ] 11.81% | 80,302 | 3.0% |
[ 12.0% - 12.5% ] 12.26% | 130,680 | 3.4% |
[ 12.5% - 13.0% ] 12.74% | 135,105 | 3.8% |
[ 13.0% - 13.5% ] 13.20% | 128,224 | 2.8% |
[ 13.5% - 14.0% ] 13.77% | 81,656 | 3.9% |
[ 14.0% - 14.5% ] 14.18% | 47,662 | 3.2% |
[ 14.5% - 15.0% ] 14.79% | 43,321 | 3.9% |
[ 15.0% - 15.5% ] 15.27% | 49,304 | 4.1% |
[ 15.5% - 16.0% ] 15.66% | 22,721 | 4.0% |
[ 16.0% - 16.5% ] 16.16% | 33,832 | 2.2% |
[ 16.5% - 17.0% ] 16.58% | 40,232 | 4.1% |
[ 17.0% - 17.5% ] 17.32% | 15,837 | 3.3% |
[ 17.5% - 18.0% ] 17.88% | 23,784 | 3.0% |
[ 18.0% - 18.5% ] 18.20% | 8,366 | 5.3% |
[ 18.5% - 19.0% ] 18.84% | 2,988 | 5.6% |
[ 19.0% - 19.5% ] 19.34% | 11,453 | 1.2% |
[ 19.5% - 20.0% ] 19.77% | 14,652 | 6.5% |
[ 20.0% - 20.5% ] 20.21% | 10,879 | 2.9% |
[ 20.5% - 21.0% ] 20.70% | 2,300 | 3.9% |
[ 21.0% - 21.5% ] 21.33% | 1,735 | 2.3% |
[ 21.5% - 22.0% ] 21.96% | 3,269 | 3.3% |
[ 22.0% - 22.5% ] 22.19% | 2,244 | 4.1% |
[ 22.5% - 23.0% ] 22.76% | 3,378 | 6.5% |
[ 23.0% - 23.5% ] 23.14% | 4,619 | 2.2% |
[ 23.5% - 24.0% ] 23.91% | 2,070 | 3.4% |
[ 24.0% - 24.5% ] 24.29% | 2,799 | 1.8% |
[ 24.5% - 25.0% ] 24.87% | 752 | 3.1% |
[ 25.5% - 26.0% ] 25.95% | 3,542 | 8.0% |
[ 26.0% - 26.5% ] 26.10% | 1,230 | 3.7% |
[ 26.5% - 27.0% ] 26.75% | 1,103 | 2.0% |
[ 27.0% - 27.5% ] 27.36% | 1,250 | 2.2% |
[ 27.5% - 28.0% ] 27.78% | 900 | 7.4% |
[ 28.0% - 28.5% ] 28.17% | 1,608 | 2.9% |
[ 28.5% - 29.0% ] 28.87% | 1,247 | 38.4% |
[ 29.0% - 29.5% ] 29.34% | 242 | 9.7% |
[ 29.5% - 30.0% ] 29.88% | 2,503 | 4.2% |
[ 31.5% - 32.0% ] 31.99% | 569 | 0.65% |
[ 32.5% - 33.0% ] 32.52% | 1,891 | 11.2% |
[ 35.0% - 35.5% ] 35.29% | 187 | 6.9% |
[ 37.0% - 37.5% ] 37.37% | 281 | 26.9% |
[ 43.0% - 43.5% ] 43.26% | 141 | 11.5% |
[ 45.0% - 45.5% ] 45.10% | 204 | 13.0% |
[ 50.0% - 50.5% ] 50.00% | 50 | 66.7% |
[ 58.0% - 58.5% ] 58.33% | 84 | 87.5% |