Samoan Married-Couple Family Poverty
COMPARE
Samoan
Select to Compare
Married-Couple Family Poverty
Samoan Married-Couple Family Poverty
4.9%
POVERTY | MARRIED-COUPLE FAMILIES
90.2/ 100
METRIC RATING
134th/ 347
METRIC RANK
Samoan Married-Couple Family Poverty Correlation Chart
The statistical analysis conducted on geographies consisting of 224,354,255 people shows a poor positive correlation between the proportion of Samoans and poverty level among married-couple families in the United States with a correlation coefficient (R) of 0.180 and weighted average of 4.9%. On average, for every 1% (one percent) increase in Samoans within a typical geography, there is an increase of 0.13% in poverty level among married-couple families.
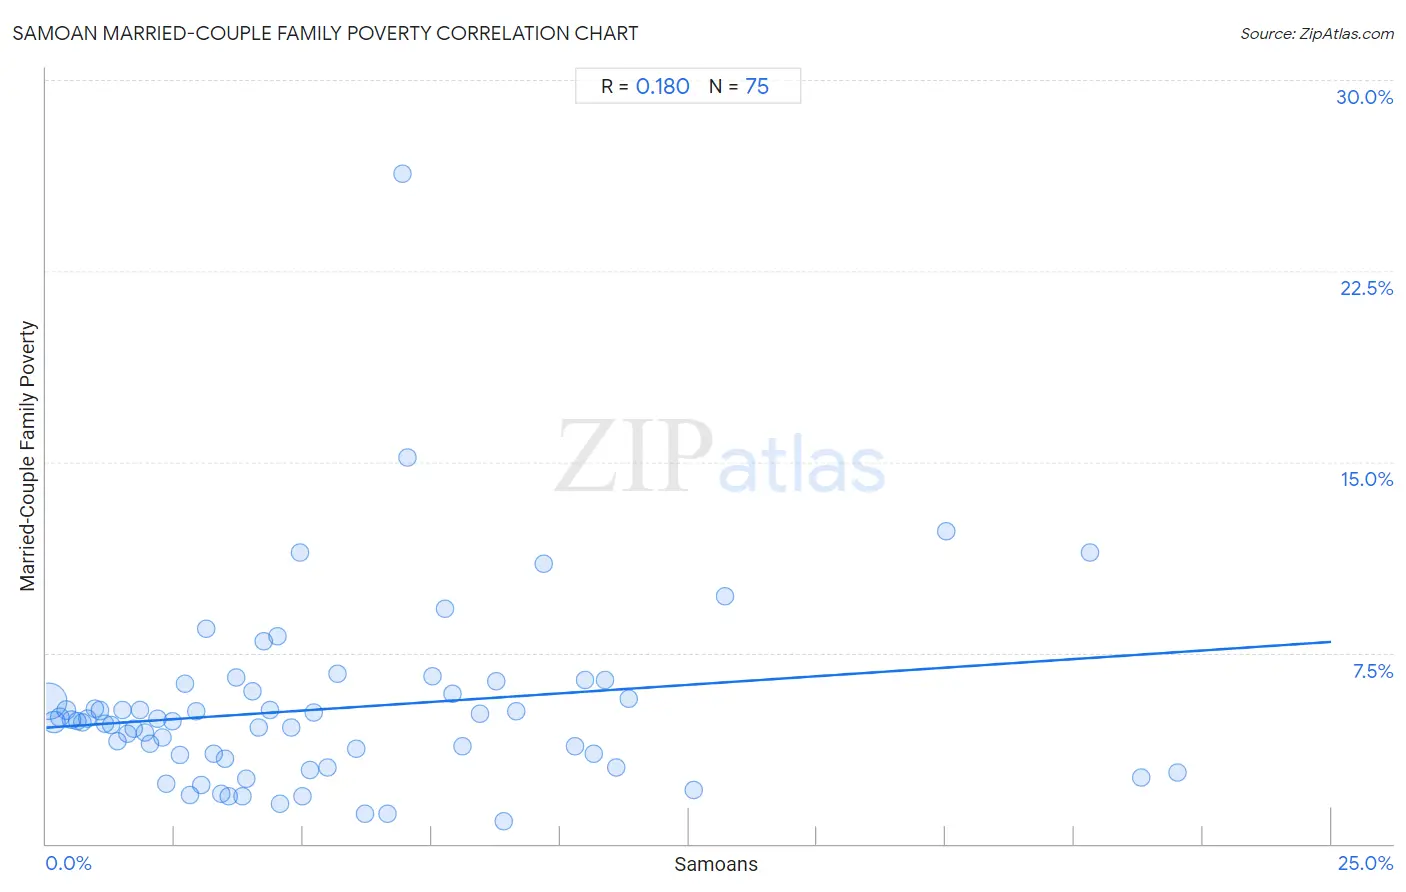
It is essential to understand that the correlation between the percentage of Samoans and poverty level among married-couple families does not imply a direct cause-and-effect relationship. It remains uncertain whether the presence of Samoans influences an upward or downward trend in the level of poverty level among married-couple families within an area, or if Samoans simply ended up residing in those areas with higher or lower levels of poverty level among married-couple families due to other factors.
Demographics Similar to Samoans by Married-Couple Family Poverty
In terms of married-couple family poverty, the demographic groups most similar to Samoans are Immigrants from Kenya (4.9%, a difference of 0.010%), Puget Sound Salish (4.9%, a difference of 0.080%), Immigrants from Eastern Europe (4.9%, a difference of 0.090%), Soviet Union (4.9%, a difference of 0.16%), and Immigrants from Pakistan (4.9%, a difference of 0.17%).
| Demographics | Rating | Rank | Married-Couple Family Poverty |
| Egyptians | 92.0 /100 | #127 | Exceptional 4.8% |
| Palestinians | 91.2 /100 | #128 | Exceptional 4.9% |
| Immigrants from Pakistan | 90.7 /100 | #129 | Exceptional 4.9% |
| Soviet Union | 90.7 /100 | #130 | Exceptional 4.9% |
| Immigrants from Eastern Europe | 90.5 /100 | #131 | Exceptional 4.9% |
| Puget Sound Salish | 90.4 /100 | #132 | Exceptional 4.9% |
| Immigrants from Kenya | 90.2 /100 | #133 | Exceptional 4.9% |
| Samoans | 90.2 /100 | #134 | Exceptional 4.9% |
| Assyrians/Chaldeans/Syriacs | 89.4 /100 | #135 | Excellent 4.9% |
| Immigrants from Hungary | 88.7 /100 | #136 | Excellent 4.9% |
| Guamanians/Chamorros | 86.5 /100 | #137 | Excellent 4.9% |
| Chileans | 86.0 /100 | #138 | Excellent 4.9% |
| German Russians | 85.1 /100 | #139 | Excellent 5.0% |
| Immigrants from Portugal | 84.8 /100 | #140 | Excellent 5.0% |
| Immigrants from Brazil | 84.6 /100 | #141 | Excellent 5.0% |
Samoan Married-Couple Family Poverty Correlation Summary
| Measurement | Samoan Data | Married-Couple Family Poverty Data |
| Minimum | 0.040% | 0.90% |
| Maximum | 22.0% | 26.3% |
| Range | 22.0% | 25.4% |
| Mean | 5.5% | 5.3% |
| Median | 4.1% | 4.8% |
| Interquartile 25% (IQ1) | 2.0% | 3.3% |
| Interquartile 75% (IQ3) | 7.9% | 6.0% |
| Interquartile Range (IQR) | 5.9% | 2.7% |
| Standard Deviation (Sample) | 4.9% | 3.7% |
| Standard Deviation (Population) | 4.8% | 3.6% |
Correlation Details
| Samoan Percentile | Sample Size | Married-Couple Family Poverty |
[ 0.0% - 0.5% ] 0.040% | 145,187,701 | 5.6% |
[ 0.0% - 0.5% ] 0.15% | 35,548,029 | 4.8% |
[ 0.0% - 0.5% ] 0.26% | 12,829,896 | 5.0% |
[ 0.0% - 0.5% ] 0.38% | 8,635,699 | 5.2% |
[ 0.0% - 0.5% ] 0.49% | 5,617,380 | 4.9% |
[ 0.5% - 1.0% ] 0.60% | 3,137,235 | 4.8% |
[ 0.5% - 1.0% ] 0.71% | 2,381,482 | 4.8% |
[ 0.5% - 1.0% ] 0.81% | 2,023,183 | 4.9% |
[ 0.5% - 1.0% ] 0.94% | 1,391,067 | 5.3% |
[ 1.0% - 1.5% ] 1.05% | 1,080,517 | 5.2% |
[ 1.0% - 1.5% ] 1.14% | 817,961 | 4.7% |
[ 1.0% - 1.5% ] 1.27% | 679,884 | 4.7% |
[ 1.0% - 1.5% ] 1.38% | 694,398 | 4.0% |
[ 1.0% - 1.5% ] 1.49% | 262,362 | 5.3% |
[ 1.5% - 2.0% ] 1.58% | 435,169 | 4.3% |
[ 1.5% - 2.0% ] 1.71% | 388,670 | 4.5% |
[ 1.5% - 2.0% ] 1.81% | 307,225 | 5.3% |
[ 1.5% - 2.0% ] 1.93% | 257,443 | 4.4% |
[ 2.0% - 2.5% ] 2.02% | 165,009 | 3.9% |
[ 2.0% - 2.5% ] 2.16% | 197,596 | 4.9% |
[ 2.0% - 2.5% ] 2.26% | 445,646 | 4.2% |
[ 2.0% - 2.5% ] 2.35% | 40,755 | 2.4% |
[ 2.0% - 2.5% ] 2.46% | 77,756 | 4.8% |
[ 2.5% - 3.0% ] 2.61% | 369,753 | 3.5% |
[ 2.5% - 3.0% ] 2.69% | 166,198 | 6.3% |
[ 2.5% - 3.0% ] 2.80% | 25,082 | 1.9% |
[ 2.5% - 3.0% ] 2.91% | 55,435 | 5.2% |
[ 3.0% - 3.5% ] 3.02% | 68,537 | 2.3% |
[ 3.0% - 3.5% ] 3.11% | 56,341 | 8.5% |
[ 3.0% - 3.5% ] 3.26% | 103,784 | 3.6% |
[ 3.0% - 3.5% ] 3.41% | 38,674 | 2.0% |
[ 3.0% - 3.5% ] 3.47% | 115,702 | 3.3% |
[ 3.5% - 4.0% ] 3.56% | 61,753 | 1.9% |
[ 3.5% - 4.0% ] 3.70% | 51,223 | 6.5% |
[ 3.5% - 4.0% ] 3.83% | 27,523 | 1.8% |
[ 3.5% - 4.0% ] 3.90% | 14,251 | 2.6% |
[ 4.0% - 4.5% ] 4.02% | 27,517 | 6.0% |
[ 4.0% - 4.5% ] 4.13% | 73,906 | 4.6% |
[ 4.0% - 4.5% ] 4.23% | 41,733 | 8.0% |
[ 4.0% - 4.5% ] 4.36% | 17,867 | 5.2% |
[ 4.0% - 4.5% ] 4.49% | 5,905 | 8.2% |
[ 4.5% - 5.0% ] 4.54% | 12,288 | 1.6% |
[ 4.5% - 5.0% ] 4.76% | 294 | 4.5% |
[ 4.5% - 5.0% ] 4.93% | 365 | 11.4% |
[ 4.5% - 5.0% ] 4.99% | 28,173 | 1.9% |
[ 5.0% - 5.5% ] 5.13% | 35,858 | 2.9% |
[ 5.0% - 5.5% ] 5.21% | 57,907 | 5.2% |
[ 5.0% - 5.5% ] 5.47% | 25,427 | 3.0% |
[ 5.5% - 6.0% ] 5.67% | 8,205 | 6.7% |
[ 6.0% - 6.5% ] 6.04% | 72,324 | 3.7% |
[ 6.0% - 6.5% ] 6.21% | 10,098 | 1.2% |
[ 6.5% - 7.0% ] 6.65% | 7,551 | 1.2% |
[ 6.5% - 7.0% ] 6.93% | 101 | 26.3% |
[ 7.0% - 7.5% ] 7.04% | 696 | 15.2% |
[ 7.5% - 8.0% ] 7.51% | 17,628 | 6.6% |
[ 7.5% - 8.0% ] 7.76% | 2,564 | 9.2% |
[ 7.5% - 8.0% ] 7.90% | 51,367 | 5.9% |
[ 8.0% - 8.5% ] 8.11% | 3,909 | 3.8% |
[ 8.0% - 8.5% ] 8.44% | 237 | 5.1% |
[ 8.5% - 9.0% ] 8.74% | 10,042 | 6.4% |
[ 8.5% - 9.0% ] 8.91% | 3,188 | 0.90% |
[ 9.0% - 9.5% ] 9.14% | 38,142 | 5.2% |
[ 9.5% - 10.0% ] 9.67% | 331 | 11.0% |
[ 10.0% - 10.5% ] 10.30% | 4,555 | 3.8% |
[ 10.0% - 10.5% ] 10.49% | 391 | 6.5% |
[ 10.5% - 11.0% ] 10.66% | 5,921 | 3.6% |
[ 10.5% - 11.0% ] 10.88% | 377 | 6.5% |
[ 11.0% - 11.5% ] 11.09% | 649 | 3.0% |
[ 11.0% - 11.5% ] 11.33% | 256 | 5.7% |
[ 12.5% - 13.0% ] 12.61% | 3,593 | 2.1% |
[ 13.0% - 13.5% ] 13.21% | 12,370 | 9.7% |
[ 17.5% - 18.0% ] 17.51% | 2,742 | 12.3% |
[ 20.0% - 20.5% ] 20.32% | 2,274 | 11.4% |
[ 21.0% - 21.5% ] 21.30% | 5,774 | 2.6% |
[ 22.0% - 22.5% ] 22.01% | 5,411 | 2.8% |