Arab Married-Couple Family Poverty
COMPARE
Arab
Select to Compare
Married-Couple Family Poverty
Arab Married-Couple Family Poverty
5.7%
POVERTY | MARRIED-COUPLE FAMILIES
5.4/ 100
METRIC RATING
228th/ 347
METRIC RANK
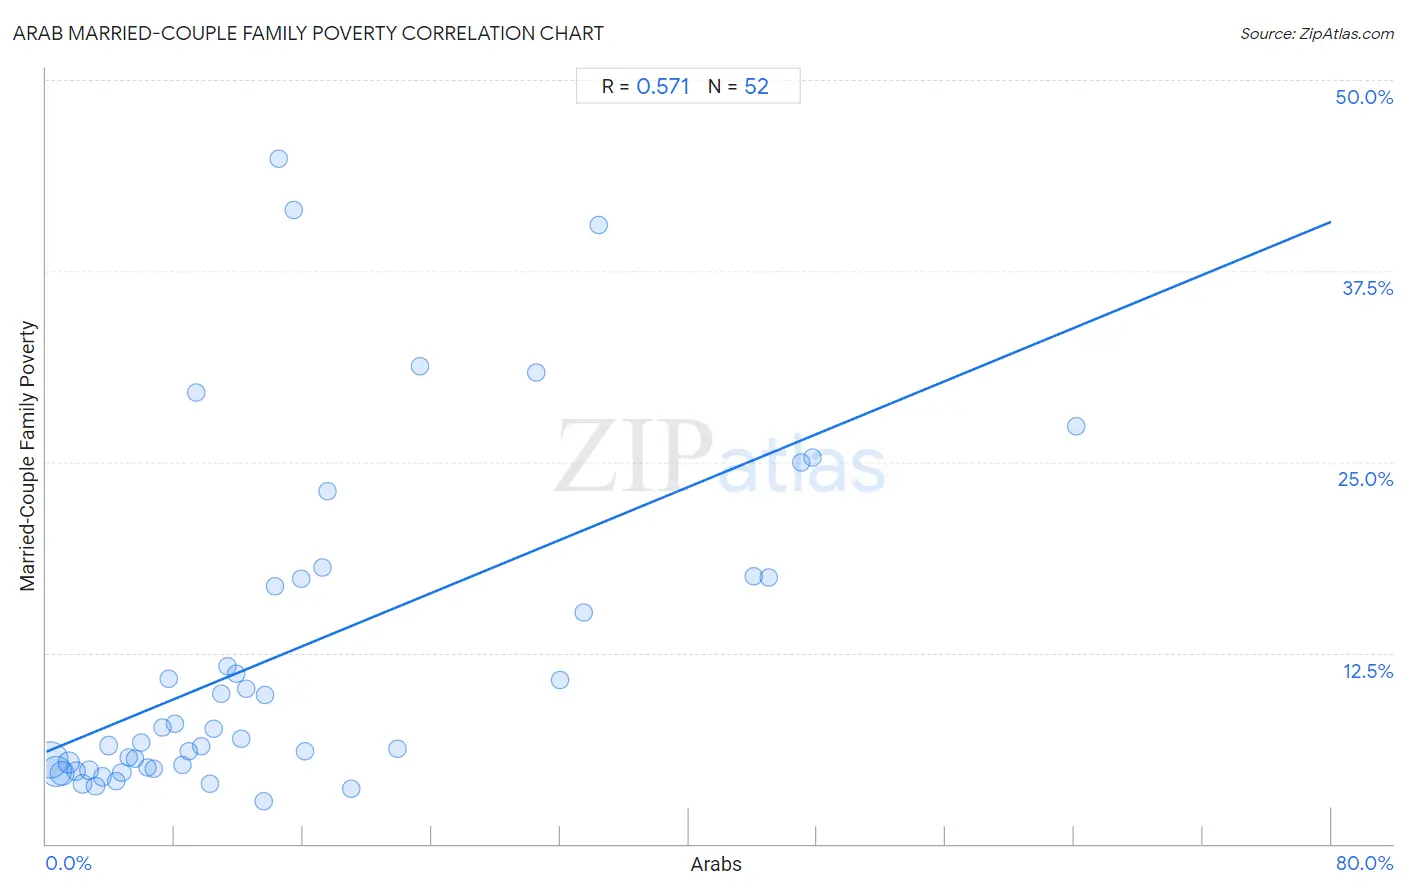
Arab Married-Couple Family Poverty Correlation Chart
The statistical analysis conducted on geographies consisting of 480,161,401 people shows a substantial positive correlation between the proportion of Arabs and poverty level among married-couple families in the United States with a correlation coefficient (R) of 0.571 and weighted average of 5.7%. On average, for every 1% (one percent) increase in Arabs within a typical geography, there is an increase of 0.43% in poverty level among married-couple families.
It is essential to understand that the correlation between the percentage of Arabs and poverty level among married-couple families does not imply a direct cause-and-effect relationship. It remains uncertain whether the presence of Arabs influences an upward or downward trend in the level of poverty level among married-couple families within an area, or if Arabs simply ended up residing in those areas with higher or lower levels of poverty level among married-couple families due to other factors.
Demographics Similar to Arabs by Married-Couple Family Poverty
In terms of married-couple family poverty, the demographic groups most similar to Arabs are Immigrants from Zaire (5.6%, a difference of 0.13%), South American (5.6%, a difference of 0.15%), Subsaharan African (5.7%, a difference of 0.25%), Moroccan (5.7%, a difference of 0.28%), and Immigrants from Cambodia (5.6%, a difference of 0.37%).
| Demographics | Rating | Rank | Married-Couple Family Poverty |
| Panamanians | 9.2 /100 | #221 | Tragic 5.6% |
| Cajuns | 6.9 /100 | #222 | Tragic 5.6% |
| Immigrants from Fiji | 6.7 /100 | #223 | Tragic 5.6% |
| Sudanese | 6.4 /100 | #224 | Tragic 5.6% |
| Immigrants from Cambodia | 6.1 /100 | #225 | Tragic 5.6% |
| South Americans | 5.7 /100 | #226 | Tragic 5.6% |
| Immigrants from Zaire | 5.6 /100 | #227 | Tragic 5.6% |
| Arabs | 5.4 /100 | #228 | Tragic 5.7% |
| Sub-Saharan Africans | 4.9 /100 | #229 | Tragic 5.7% |
| Moroccans | 4.9 /100 | #230 | Tragic 5.7% |
| Immigrants from Iraq | 4.4 /100 | #231 | Tragic 5.7% |
| Immigrants from Laos | 4.4 /100 | #232 | Tragic 5.7% |
| Immigrants from Colombia | 3.7 /100 | #233 | Tragic 5.7% |
| Immigrants from Uruguay | 3.7 /100 | #234 | Tragic 5.7% |
| Immigrants from Sudan | 3.5 /100 | #235 | Tragic 5.7% |
Arab Married-Couple Family Poverty Correlation Summary
| Measurement | Arab Data | Married-Couple Family Poverty Data |
| Minimum | 0.20% | 2.8% |
| Maximum | 64.1% | 44.8% |
| Range | 63.9% | 42.1% |
| Mean | 15.0% | 12.5% |
| Median | 10.7% | 7.2% |
| Interquartile 25% (IQ1) | 5.3% | 5.0% |
| Interquartile 75% (IQ3) | 17.4% | 17.4% |
| Interquartile Range (IQR) | 12.0% | 12.4% |
| Standard Deviation (Sample) | 14.3% | 10.8% |
| Standard Deviation (Population) | 14.1% | 10.7% |
Correlation Details
| Arab Percentile | Sample Size | Married-Couple Family Poverty |
[ 0.0% - 0.5% ] 0.20% | 195,056,105 | 5.5% |
[ 0.5% - 1.0% ] 0.61% | 126,661,915 | 4.7% |
[ 0.5% - 1.0% ] 1.00% | 73,094,267 | 4.6% |
[ 1.0% - 1.5% ] 1.39% | 38,929,675 | 5.3% |
[ 1.5% - 2.0% ] 1.84% | 15,571,772 | 4.8% |
[ 2.0% - 2.5% ] 2.24% | 10,855,400 | 3.9% |
[ 2.5% - 3.0% ] 2.67% | 6,771,375 | 4.8% |
[ 3.0% - 3.5% ] 3.06% | 3,233,879 | 3.8% |
[ 3.0% - 3.5% ] 3.50% | 2,017,876 | 4.4% |
[ 3.5% - 4.0% ] 3.87% | 2,092,026 | 6.4% |
[ 4.0% - 4.5% ] 4.32% | 926,244 | 4.1% |
[ 4.5% - 5.0% ] 4.71% | 798,598 | 4.6% |
[ 5.0% - 5.5% ] 5.12% | 674,326 | 5.7% |
[ 5.5% - 6.0% ] 5.55% | 421,320 | 5.6% |
[ 5.5% - 6.0% ] 5.92% | 211,851 | 6.6% |
[ 6.0% - 6.5% ] 6.31% | 403,271 | 5.0% |
[ 6.5% - 7.0% ] 6.67% | 272,576 | 4.9% |
[ 7.0% - 7.5% ] 7.25% | 136,756 | 7.6% |
[ 7.5% - 8.0% ] 7.64% | 267,862 | 10.8% |
[ 7.5% - 8.0% ] 7.99% | 197,256 | 7.8% |
[ 8.0% - 8.5% ] 8.49% | 84,138 | 5.1% |
[ 8.5% - 9.0% ] 8.86% | 318,398 | 6.1% |
[ 9.0% - 9.5% ] 9.37% | 30,385 | 29.6% |
[ 9.5% - 10.0% ] 9.63% | 74,506 | 6.4% |
[ 10.0% - 10.5% ] 10.19% | 46,532 | 3.9% |
[ 10.0% - 10.5% ] 10.42% | 88,751 | 7.5% |
[ 10.5% - 11.0% ] 10.90% | 124,995 | 9.8% |
[ 11.0% - 11.5% ] 11.30% | 144,458 | 11.7% |
[ 11.5% - 12.0% ] 11.83% | 46,979 | 11.1% |
[ 12.0% - 12.5% ] 12.15% | 48,494 | 6.9% |
[ 12.0% - 12.5% ] 12.43% | 22,082 | 10.2% |
[ 13.5% - 14.0% ] 13.55% | 33,174 | 2.8% |
[ 13.5% - 14.0% ] 13.60% | 72,809 | 9.7% |
[ 14.0% - 14.5% ] 14.24% | 1,215 | 16.9% |
[ 14.0% - 14.5% ] 14.46% | 332 | 44.8% |
[ 15.0% - 15.5% ] 15.38% | 156 | 41.5% |
[ 15.5% - 16.0% ] 15.89% | 686 | 17.4% |
[ 16.0% - 16.5% ] 16.13% | 34,046 | 6.1% |
[ 17.0% - 17.5% ] 17.22% | 25,511 | 18.0% |
[ 17.0% - 17.5% ] 17.50% | 120 | 23.1% |
[ 19.0% - 19.5% ] 19.00% | 6,842 | 3.6% |
[ 21.5% - 22.0% ] 21.88% | 96 | 6.2% |
[ 23.0% - 23.5% ] 23.30% | 43,213 | 31.2% |
[ 30.5% - 31.0% ] 30.52% | 27,842 | 30.9% |
[ 31.5% - 32.0% ] 32.00% | 12,405 | 10.8% |
[ 33.0% - 33.5% ] 33.47% | 62,474 | 15.1% |
[ 34.0% - 34.5% ] 34.38% | 5,526 | 40.5% |
[ 44.0% - 44.5% ] 44.01% | 108,414 | 17.6% |
[ 44.5% - 45.0% ] 44.98% | 40,392 | 17.4% |
[ 47.0% - 47.5% ] 47.01% | 117 | 25.0% |
[ 47.5% - 48.0% ] 47.71% | 8,919 | 25.3% |
[ 64.0% - 64.5% ] 64.10% | 53,044 | 27.3% |