Sierra Leonean Married-Couple Family Poverty

COMPARE

Sierra Leonean
Race
Ancestry
AfghanAfricanAlaska NativeAlaskan AthabascanAlbanianAleutAlsatianAmericanApacheArabArapahoArgentineanArmenianAssyrian/Chaldean/SyriacAustralianAustrianBahamianBangladeshiBarbadianBasqueBelgianBelizeanBermudanBhutaneseBlackfeetBolivianBrazilianBritishBritish West IndianBulgarianBurmeseCajunCambodianCanadianCape VerdeanCarpatho RusynCelticCentral AmericanCentral American IndianCherokeeCheyenneChickasawChileanChineseChippewaChoctawColombianColvilleComancheCosta RicanCreeCreekCroatianCrowCubanCypriotCzechCzechoslovakianDanishDelawareDominicanDutchDutch West IndianEastern EuropeanEcuadorianEgyptianEnglishEstonianEthiopianEuropeanFijianFilipinoFinnishFrenchFrench American IndianFrench CanadianGermanGerman RussianGhanaianGreekGuamanian/ChamorroGuatemalanGuyaneseHaitianHmongHonduranHopiHoumaHungarianIcelanderIndian (Asian)IndonesianInupiatIranianIraqiIrishIroquoisIsraeliItalianJamaicanJapaneseJordanianKenyanKiowaKoreanLaotianLatvianLebaneseLiberianLithuanianLumbeeLuxembourgerMacedonianMalaysianMalteseMarshalleseMenomineeMexicanMexican American IndianMongolianMoroccanNative HawaiianNavajoNepaleseNew ZealanderNicaraguanNigerianNorthern EuropeanNorwegianOkinawanOsageOttawaPaiutePakistaniPalestinianPanamanianParaguayanPennsylvania GermanPeruvianPimaPolishPortuguesePotawatomiPuebloPuerto RicanPuget Sound SalishRomanianRussianSalvadoranSamoanScandinavianScotch-IrishScottishSeminoleSenegaleseSerbianShoshoneSierra LeoneanSiouxSlavicSlovakSloveneSomaliSouth AfricanSouth AmericanSouth American IndianSoviet UnionSpaniardSpanishSpanish AmericanSpanish American IndianSri LankanSubsaharan AfricanSudaneseSwedishSwissSyrianTaiwaneseThaiTlingit-HaidaTohono O'OdhamTonganTrinidadian and TobagonianTsimshianTurkishU.S. Virgin IslanderUgandanUkrainianUruguayanUteVenezuelanVietnameseWelshWest IndianYakamaYaquiYugoslavianYumanYup'ikZimbabwean
Immigration
NonimmigrantsImmigrantsAfghanistanAfricaAlbaniaArgentinaArmeniaAsiaAustraliaAustriaBahamasBangladeshBarbadosBelarusBelgiumBelizeBoliviaBosnia and HerzegovinaBrazilBulgariaBurma/MyanmarCabo VerdeCambodiaCameroonCanadaCaribbeanCentral AmericaChileChinaColombiaCongoCosta RicaCroatiaCubaCzechoslovakiaDenmarkDominicaDominican RepublicEastern AfricaEastern AsiaEastern EuropeEcuadorEgyptEl SalvadorEnglandEritreaEthiopiaEuropeFijiFranceGermanyGhanaGreeceGrenadaGuatemalaGuyanaHaitiHondurasHong KongHungaryIndiaIndonesiaIranIraqIrelandIsraelItalyJamaicaJapanJordanKazakhstanKenyaKoreaKuwaitLaosLatin AmericaLatviaLebanonLiberiaLithuaniaMalaysiaMexicoMicronesiaMiddle AfricaMoldovaMoroccoNepalNetherlandsNicaraguaNigeriaNorth AmericaNorth MacedoniaNorthern AfricaNorthern EuropeNorwayOceaniaPakistanPanamaPeruPhilippinesPolandPortugalRomaniaRussiaSaudi ArabiaScotlandSenegalSerbiaSierra LeoneSingaporeSomaliaSouth AfricaSouth AmericaSouth Central AsiaSouth Eastern AsiaSouthern EuropeSpainSri LankaSt. Vincent and the GrenadinesSudanSwedenSwitzerlandSyriaTaiwanThailandTrinidad and TobagoTurkeyUgandaUkraineUruguayUzbekistanVenezuelaVietnamWest IndiesWestern AfricaWestern AsiaWestern EuropeYemenZaireZimbabweAzores
Select to Compare
Race
Ancestry
AfghanAfricanAlaska NativeAlaskan AthabascanAlbanianAleutAlsatianAmericanApacheArabArapahoArgentineanArmenianAssyrian/Chaldean/SyriacAustralianAustrianBahamianBangladeshiBarbadianBasqueBelgianBelizeanBermudanBhutaneseBlackfeetBolivianBrazilianBritishBritish West IndianBulgarianBurmeseCajunCambodianCanadianCape VerdeanCarpatho RusynCelticCentral AmericanCentral American IndianCherokeeCheyenneChickasawChileanChineseChippewaChoctawColombianColvilleComancheCosta RicanCreeCreekCroatianCrowCubanCypriotCzechCzechoslovakianDanishDelawareDominicanDutchDutch West IndianEastern EuropeanEcuadorianEgyptianEnglishEstonianEthiopianEuropeanFijianFilipinoFinnishFrenchFrench American IndianFrench CanadianGermanGerman RussianGhanaianGreekGuamanian/ChamorroGuatemalanGuyaneseHaitianHmongHonduranHopiHoumaHungarianIcelanderIndian (Asian)IndonesianInupiatIranianIraqiIrishIroquoisIsraeliItalianJamaicanJapaneseJordanianKenyanKiowaKoreanLaotianLatvianLebaneseLiberianLithuanianLumbeeLuxembourgerMacedonianMalaysianMalteseMarshalleseMenomineeMexicanMexican American IndianMongolianMoroccanNative HawaiianNavajoNepaleseNew ZealanderNicaraguanNigerianNorthern EuropeanNorwegianOkinawanOsageOttawaPaiutePakistaniPalestinianPanamanianParaguayanPennsylvania GermanPeruvianPimaPolishPortuguesePotawatomiPuebloPuerto RicanPuget Sound SalishRomanianRussianSalvadoranSamoanScandinavianScotch-IrishScottishSeminoleSenegaleseSerbianShoshoneSiouxSlavicSlovakSloveneSomaliSouth AfricanSouth AmericanSouth American IndianSoviet UnionSpaniardSpanishSpanish AmericanSpanish American IndianSri LankanSubsaharan AfricanSudaneseSwedishSwissSyrianTaiwaneseThaiTlingit-HaidaTohono O'OdhamTonganTrinidadian and TobagonianTsimshianTurkishU.S. Virgin IslanderUgandanUkrainianUruguayanUteVenezuelanVietnameseWelshWest IndianYakamaYaquiYugoslavianYumanYup'ikZimbabwean
Immigration
NonimmigrantsImmigrantsAfghanistanAfricaAlbaniaArgentinaArmeniaAsiaAustraliaAustriaBahamasBangladeshBarbadosBelarusBelgiumBelizeBoliviaBosnia and HerzegovinaBrazilBulgariaBurma/MyanmarCabo VerdeCambodiaCameroonCanadaCaribbeanCentral AmericaChileChinaColombiaCongoCosta RicaCroatiaCubaCzechoslovakiaDenmarkDominicaDominican RepublicEastern AfricaEastern AsiaEastern EuropeEcuadorEgyptEl SalvadorEnglandEritreaEthiopiaEuropeFijiFranceGermanyGhanaGreeceGrenadaGuatemalaGuyanaHaitiHondurasHong KongHungaryIndiaIndonesiaIranIraqIrelandIsraelItalyJamaicaJapanJordanKazakhstanKenyaKoreaKuwaitLaosLatin AmericaLatviaLebanonLiberiaLithuaniaMalaysiaMexicoMicronesiaMiddle AfricaMoldovaMoroccoNepalNetherlandsNicaraguaNigeriaNorth AmericaNorth MacedoniaNorthern AfricaNorthern EuropeNorwayOceaniaPakistanPanamaPeruPhilippinesPolandPortugalRomaniaRussiaSaudi ArabiaScotlandSenegalSerbiaSierra LeoneSingaporeSomaliaSouth AfricaSouth AmericaSouth Central AsiaSouth Eastern AsiaSouthern EuropeSpainSri LankaSt. Vincent and the GrenadinesSudanSwedenSwitzerlandSyriaTaiwanThailandTrinidad and TobagoTurkeyUgandaUkraineUruguayUzbekistanVenezuelaVietnamWest IndiesWestern AfricaWestern AsiaWestern EuropeYemenZaireZimbabweAzores
Married-Couple Family Poverty
Income
Poverty
Unemployment
Labor Participation
Family Structure
Vehicle Availability
Education Level
Disability

Sierra Leonean Married-Couple Family Poverty
Good

5.1%
POVERTY | MARRIED-COUPLE FAMILIES
64.1/ 100
METRIC RATING
163rd/ 347
METRIC RANK

Sierra Leonean Married-Couple Family Poverty Correlation Chart

The statistical analysis conducted on geographies consisting of 83,227,965 people shows a poor positive correlation between the proportion of Sierra Leoneans and poverty level among married-couple families in the United States with a correlation coefficient (R) of 0.153 and weighted average of 5.1%. On average, for every 1% (one percent) increase in Sierra Leoneans within a typical geography, there is an increase of 0.26% in poverty level among married-couple families.
Sierra Leonean Married-Couple Family Poverty
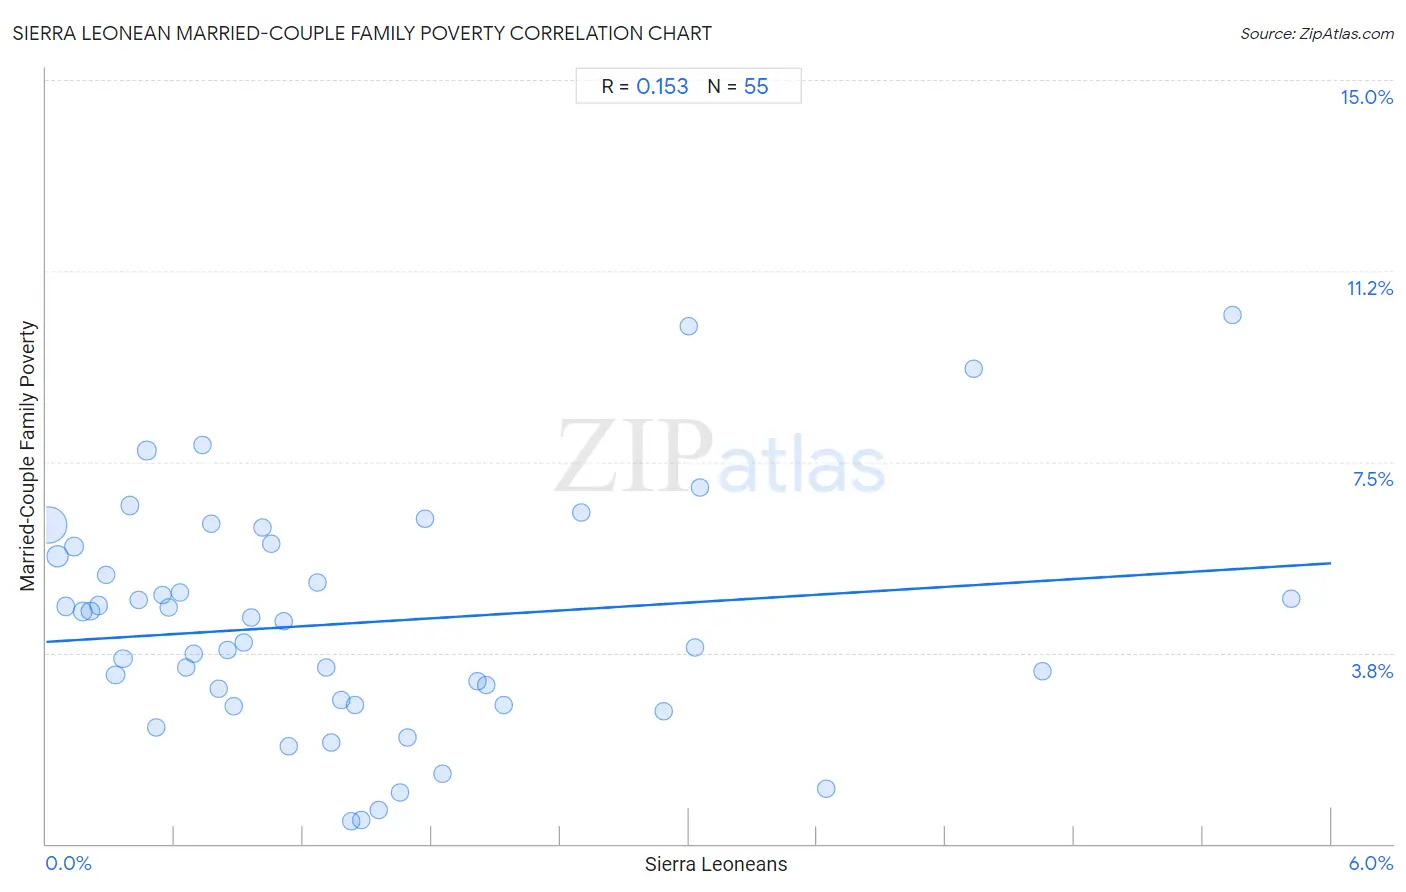
It is essential to understand that the correlation between the percentage of Sierra Leoneans and poverty level among married-couple families does not imply a direct cause-and-effect relationship. It remains uncertain whether the presence of Sierra Leoneans influences an upward or downward trend in the level of poverty level among married-couple families within an area, or if Sierra Leoneans simply ended up residing in those areas with higher or lower levels of poverty level among married-couple families due to other factors.

Demographics Similar to Sierra Leoneans by Married-Couple Family Poverty

In terms of married-couple family poverty, the demographic groups most similar to Sierra Leoneans are Hawaiian (5.1%, a difference of 0.24%), Immigrants from Malaysia (5.1%, a difference of 0.25%), Immigrants from Jordan (5.1%, a difference of 0.31%), Paraguayan (5.1%, a difference of 0.34%), and Costa Rican (5.1%, a difference of 0.34%).
DemographicsRating | RankMarried-Couple Family Poverty
Sri Lankans
72.2
/100
|
#156
Good
5.1%
Argentineans
70.7
/100
|
#157
Good
5.1%
Immigrants from South Eastern Asia
70.4
/100
|
#158
Good
5.1%
Immigrants from Saudi Arabia
70.3
/100
|
#159
Good
5.1%
Pennsylvania Germans
68.5
/100
|
#160
Good
5.1%
Ethiopians
68.1
/100
|
#161
Good
5.1%
Immigrants from Jordan
66.5
/100
|
#162
Good
5.1%
Sierra Leoneans
64.1
/100
|
#163
Good
5.1%
Hawaiians
62.3
/100
|
#164
Good
5.1%
Immigrants from Malaysia
62.2
/100
|
#165
Good
5.1%
Paraguayans
61.5
/100
|
#166
Good
5.1%
Costa Ricans
61.5
/100
|
#167
Good
5.1%
Immigrants from Uganda
54.9
/100
|
#168
Average
5.2%
Ottawa
54.5
/100
|
#169
Average
5.2%
Immigrants from Argentina
54.4
/100
|
#170
Average
5.2%

Sierra Leonean Married-Couple Family Poverty Correlation Summary

MeasurementSierra Leonean DataMarried-Couple Family Poverty Data
Minimum0.013%0.45%
Maximum5.8%10.4%
Range5.8%9.9%
Mean1.4%4.3%
Median1.0%4.4%
Interquartile 25% (IQ1)0.51%2.7%
Interquartile 75% (IQ3)1.9%5.8%
Interquartile Range (IQR)1.3%3.1%
Standard Deviation (Sample)1.3%2.3%
Standard Deviation (Population)1.3%2.2%

Correlation Details

Sierra Leonean PercentileSample SizeMarried-Couple Family Poverty
[
0.0%
-
0.5%
]
0.013%
57,488,0746.3%
[
0.0%
-
0.5%
]
0.055%
11,196,4305.6%
[
0.0%
-
0.5%
]
0.092%
2,801,4534.7%
[
0.0%
-
0.5%
]
0.13%
1,820,8075.8%
[
0.0%
-
0.5%
]
0.17%
2,275,5794.6%
[
0.0%
-
0.5%
]
0.21%
1,138,0774.6%
[
0.0%
-
0.5%
]
0.24%
1,066,8504.7%
[
0.0%
-
0.5%
]
0.28%
753,2165.3%
[
0.0%
-
0.5%
]
0.32%
483,1343.3%
[
0.0%
-
0.5%
]
0.36%
455,9113.6%
[
0.0%
-
0.5%
]
0.39%
559,2786.6%
[
0.0%
-
0.5%
]
0.43%
464,1144.8%
[
0.0%
-
0.5%
]
0.47%
236,9207.7%
[
0.5%
-
1.0%
]
0.51%
198,7762.3%
[
0.5%
-
1.0%
]
0.54%
156,1294.9%
[
0.5%
-
1.0%
]
0.57%
408,8174.6%
[
0.5%
-
1.0%
]
0.63%
116,7544.9%
[
0.5%
-
1.0%
]
0.66%
222,7643.5%
[
0.5%
-
1.0%
]
0.69%
144,3203.7%
[
0.5%
-
1.0%
]
0.73%
103,1537.8%
[
0.5%
-
1.0%
]
0.77%
127,9006.3%
[
0.5%
-
1.0%
]
0.81%
111,7703.0%
[
0.5%
-
1.0%
]
0.85%
52,3563.8%
[
0.5%
-
1.0%
]
0.87%
134,1702.7%
[
0.5%
-
1.0%
]
0.92%
60,6833.9%
[
0.5%
-
1.0%
]
0.96%
47,9784.4%
[
1.0%
-
1.5%
]
1.01%
25,4956.2%
[
1.0%
-
1.5%
]
1.05%
50,6925.9%
[
1.0%
-
1.5%
]
1.11%
74,2754.4%
[
1.0%
-
1.5%
]
1.13%
13,4251.9%
[
1.0%
-
1.5%
]
1.27%
48,5635.1%
[
1.0%
-
1.5%
]
1.31%
6,1183.5%
[
1.0%
-
1.5%
]
1.33%
4,9502.0%
[
1.0%
-
1.5%
]
1.38%
13,9822.8%
[
1.0%
-
1.5%
]
1.42%
9,8350.45%
[
1.0%
-
1.5%
]
1.44%
38,2952.7%
[
1.0%
-
1.5%
]
1.47%
9,5270.47%
[
1.5%
-
2.0%
]
1.55%
26,2530.67%
[
1.5%
-
2.0%
]
1.65%
15,2441.0%
[
1.5%
-
2.0%
]
1.68%
9,0242.1%
[
1.5%
-
2.0%
]
1.77%
7,5156.4%
[
1.5%
-
2.0%
]
1.85%
11,4551.4%
[
2.0%
-
2.5%
]
2.01%
19,3693.2%
[
2.0%
-
2.5%
]
2.06%
43,7973.1%
[
2.0%
-
2.5%
]
2.13%
7,1682.7%
[
2.5%
-
3.0%
]
2.50%
9,0376.5%
[
2.5%
-
3.0%
]
2.89%
14,9012.6%
[
2.5%
-
3.0%
]
3.00%
31,01810.2%
[
3.0%
-
3.5%
]
3.03%
9,1833.9%
[
3.0%
-
3.5%
]
3.06%
52,3737.0%
[
3.5%
-
4.0%
]
3.64%
4,2261.1%
[
4.0%
-
4.5%
]
4.33%
19,4659.3%
[
4.5%
-
5.0%
]
4.65%
5,9763.4%
[
5.5%
-
6.0%
]
5.54%
18,10410.4%
[
5.5%
-
6.0%
]
5.81%
3,2874.8%