Area Code 878 Map & Demographics
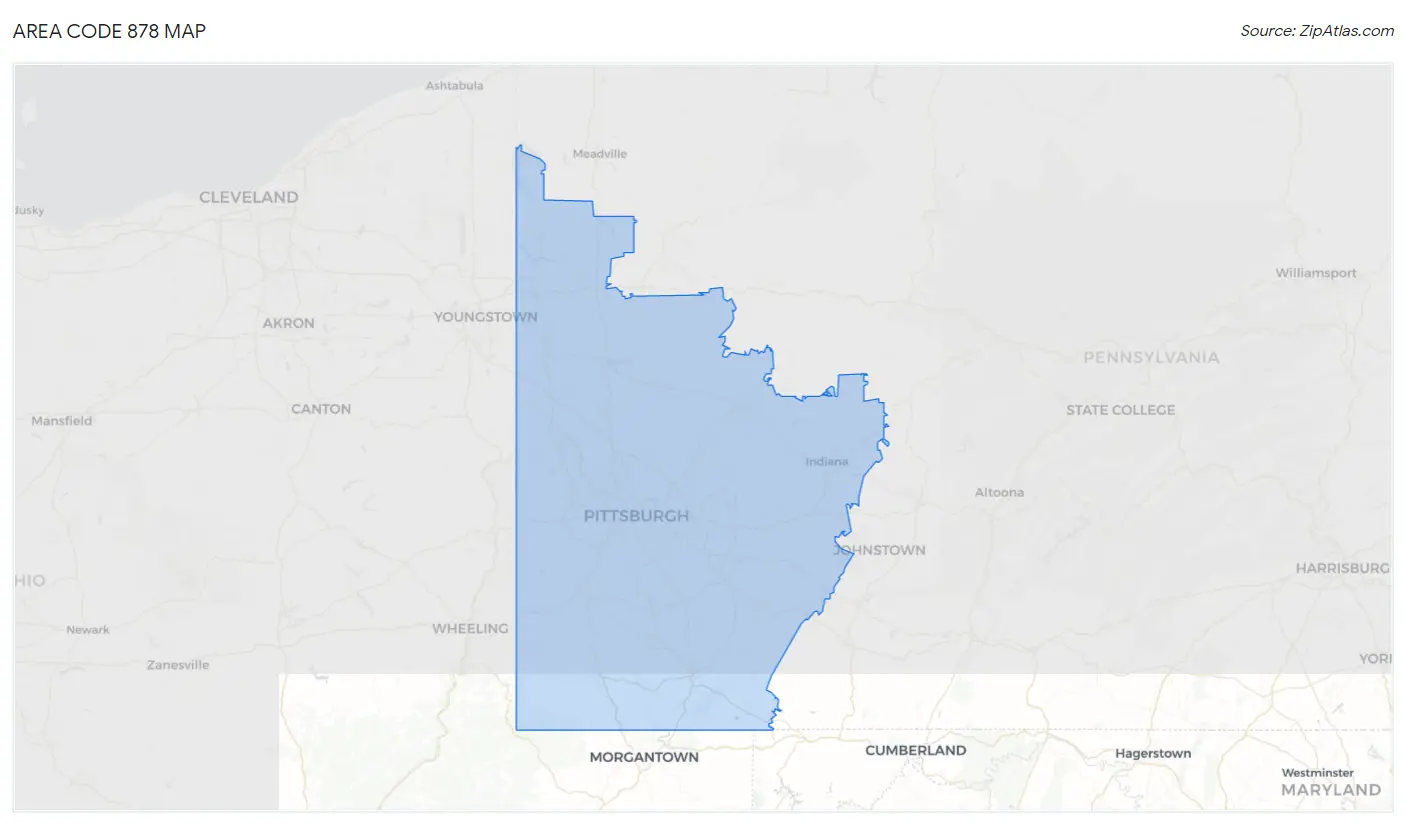
Area Code 878 Map
Area Code 878 Overview
$38,116
PER CAPITA INCOME
$87,418
AVG FAMILY INCOME
$68,639
AVG HOUSEHOLD INCOME
31.2%
WAGE / INCOME GAP [ % ]
68.8¢/ $1
WAGE / INCOME GAP [ $ ]
$10,132
FAMILY INCOME DEFICIT
20.63
INEQUALITY / GINI INDEX
301,064
TOTAL POPULATION
147,026
MALE POPULATION
154,038
FEMALE POPULATION
95.45
MALES / 100 FEMALES
104.77
FEMALES / 100 MALES
44.9
MEDIAN AGE
2.9
AVG FAMILY SIZE
2.3
AVG HOUSEHOLD SIZE
162,254
LABOR FORCE [ PEOPLE ]
62.9%
PERCENT IN LABOR FORCE
5.3%
UNEMPLOYMENT RATE
Income in Area Code 878
Income Overview in Area Code 878
Per Capita Income in Area Code 878 is $38,116, while median incomes of families and households are $87,418 and $68,639 respectively.
| Characteristic | Number | Measure |
| Per Capita Income | 301,064 | $38,116 |
| Median Family Income | 72,422 | $87,418 |
| Mean Family Income | 72,422 | $5,020,703 |
| Median Household Income | 127,776 | $68,639 |
| Mean Household Income | 127,776 | $4,286,610 |
| Income Deficit | 72,422 | $10,132 |
| Wage / Income Gap (%) | 301,064 | 31.25% |
| Wage / Income Gap ($) | 301,064 | 68.75¢ per $1 |
| Gini / Inequality Index | 301,064 | 20.63 |
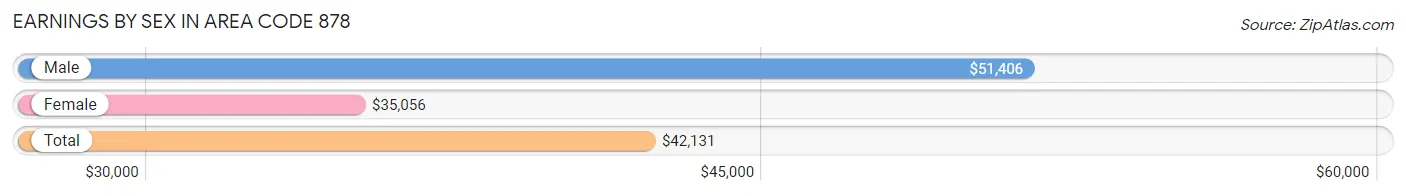
Earnings by Sex in Area Code 878
Average Earnings in Area Code 878 are $42,131, $51,406 for men and $35,056 for women, a difference of 31.8%.
| Sex | Number | Average Earnings |
| Male | 87,865 (52.1%) | $51,406 |
| Female | 80,927 (47.9%) | $35,056 |
| Total | 168,792 (100.0%) | $42,131 |
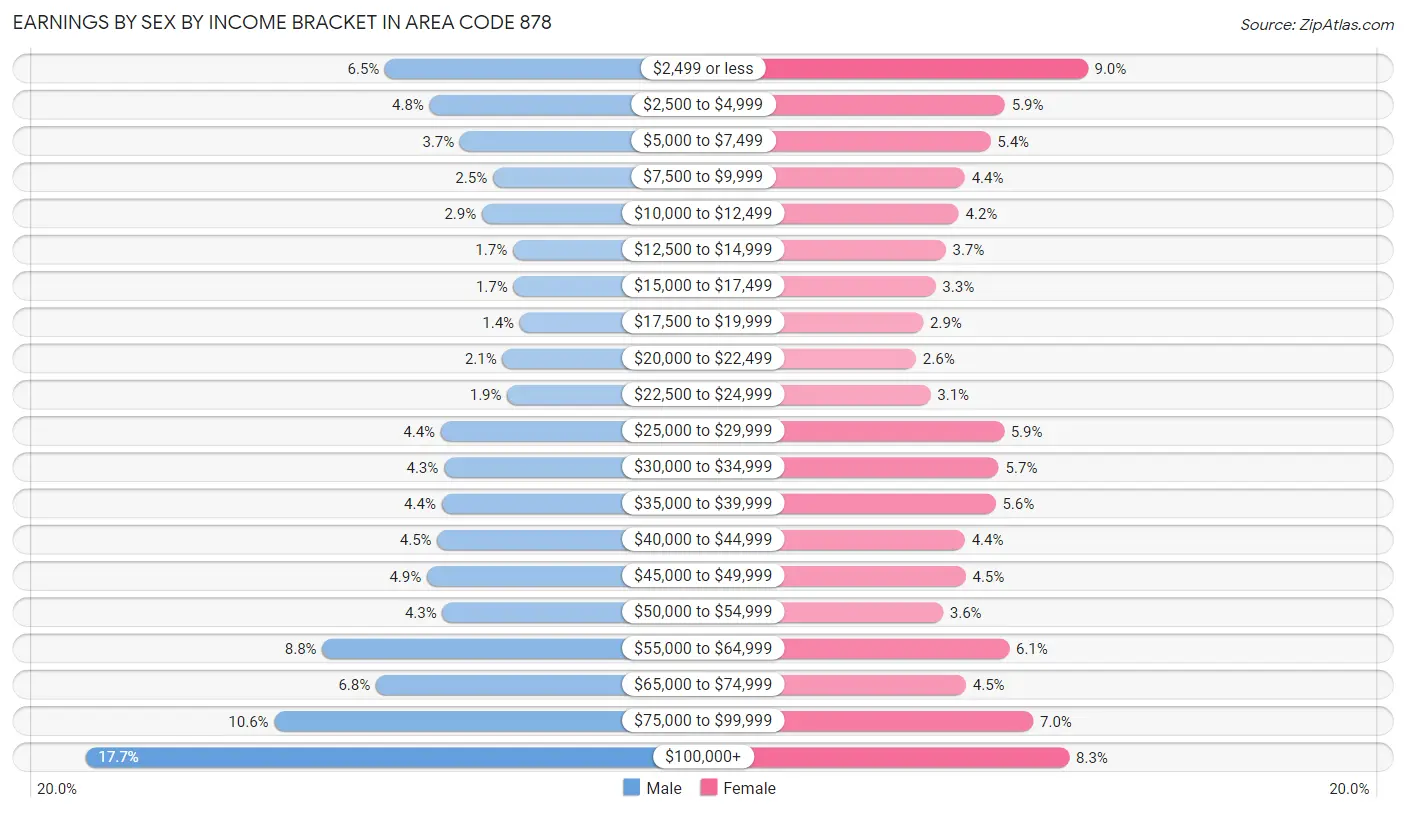
Earnings by Sex by Income Bracket in Area Code 878
The most common earnings brackets in Area Code 878 are $100,000+ for men (15,572 | 17.7%) and $2,499 or less for women (7,297 | 9.0%).
| Income | Male | Female |
| $2,499 or less | 5,700 (6.5%) | 7,297 (9.0%) |
| $2,500 to $4,999 | 4,238 (4.8%) | 4,791 (5.9%) |
| $5,000 to $7,499 | 3,234 (3.7%) | 4,354 (5.4%) |
| $7,500 to $9,999 | 2,149 (2.5%) | 3,574 (4.4%) |
| $10,000 to $12,499 | 2,514 (2.9%) | 3,389 (4.2%) |
| $12,500 to $14,999 | 1,493 (1.7%) | 2,994 (3.7%) |
| $15,000 to $17,499 | 1,478 (1.7%) | 2,690 (3.3%) |
| $17,500 to $19,999 | 1,264 (1.4%) | 2,317 (2.9%) |
| $20,000 to $22,499 | 1,834 (2.1%) | 2,093 (2.6%) |
| $22,500 to $24,999 | 1,682 (1.9%) | 2,534 (3.1%) |
| $25,000 to $29,999 | 3,867 (4.4%) | 4,755 (5.9%) |
| $30,000 to $34,999 | 3,762 (4.3%) | 4,608 (5.7%) |
| $35,000 to $39,999 | 3,842 (4.4%) | 4,510 (5.6%) |
| $40,000 to $44,999 | 3,983 (4.5%) | 3,581 (4.4%) |
| $45,000 to $49,999 | 4,327 (4.9%) | 3,604 (4.4%) |
| $50,000 to $54,999 | 3,815 (4.3%) | 2,917 (3.6%) |
| $55,000 to $64,999 | 7,763 (8.8%) | 4,919 (6.1%) |
| $65,000 to $74,999 | 5,997 (6.8%) | 3,613 (4.5%) |
| $75,000 to $99,999 | 9,351 (10.6%) | 5,647 (7.0%) |
| $100,000+ | 15,572 (17.7%) | 6,740 (8.3%) |
| Total | 87,865 (100.0%) | 80,927 (100.0%) |
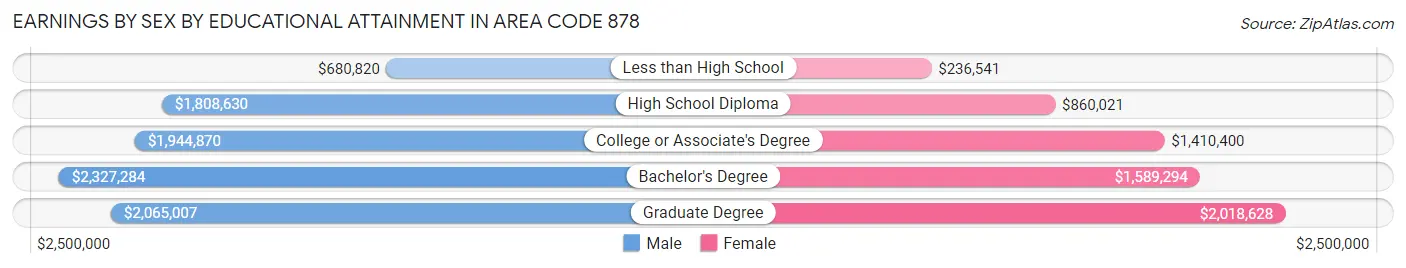
Earnings by Sex by Educational Attainment in Area Code 878
Average earnings in Area Code 878 are $2,546,402 for men and $1,876,690 for women, a difference of 26.3%. Men with an educational attainment of bachelor's degree enjoy the highest average annual earnings of $2,327,284, while those with less than high school education earn the least with $680,820. Women with an educational attainment of graduate degree earn the most with the average annual earnings of $2,018,628, while those with less than high school education have the smallest earnings of $236,541.
| Educational Attainment | Male Income | Female Income |
| Less than High School | $680,820 | $236,541 |
| High School Diploma | $1,808,630 | $860,021 |
| College or Associate's Degree | $1,944,870 | $1,410,400 |
| Bachelor's Degree | $2,327,284 | $1,589,294 |
| Graduate Degree | $2,065,007 | $2,018,628 |
| Total | $2,546,402 | $1,876,690 |
Family Income in Area Code 878
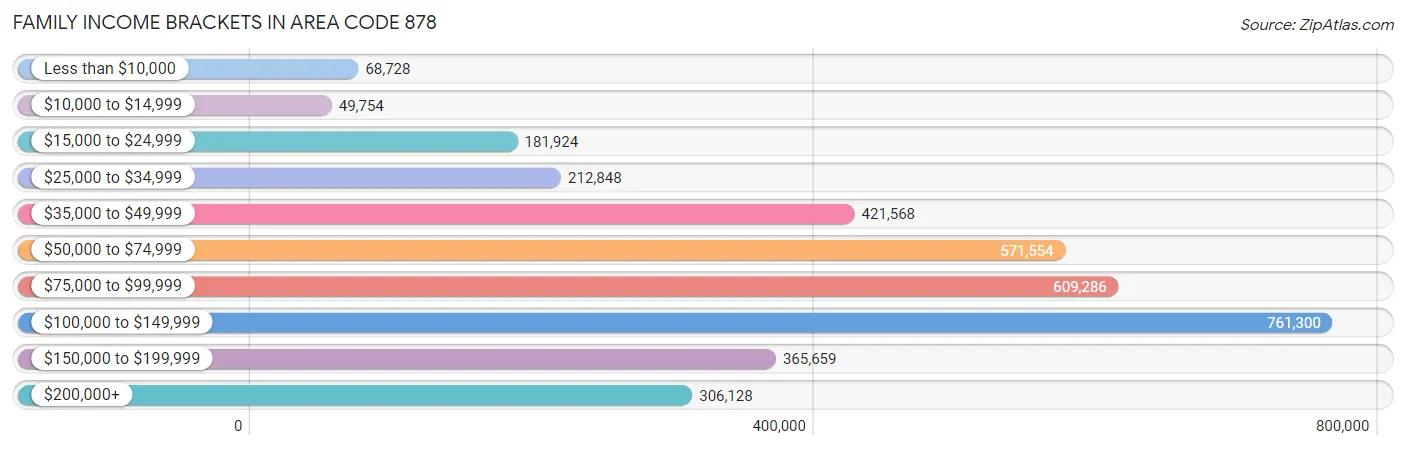
Family Income Brackets in Area Code 878
According to the Area Code 878 family income data, there are 761,300 families falling into the $100,000 to $149,999 income range, which is the most common income bracket and makes up 1,051.2% of all families. Conversely, the $10,000 to $14,999 income bracket is the least frequent group with only 49,754 families (68.7%) belonging to this category.
| Income Bracket | # Families | % Families |
| Less than $10,000 | 68,728 | 94.9% |
| $10,000 to $14,999 | 49,754 | 68.7% |
| $15,000 to $24,999 | 181,924 | 251.2% |
| $25,000 to $34,999 | 212,848 | 293.9% |
| $35,000 to $49,999 | 421,568 | 582.1% |
| $50,000 to $74,999 | 571,554 | 789.2% |
| $75,000 to $99,999 | 609,286 | 841.3% |
| $100,000 to $149,999 | 761,300 | 1,051.2% |
| $150,000 to $199,999 | 365,659 | 504.9% |
| $200,000+ | 306,128 | 422.7% |
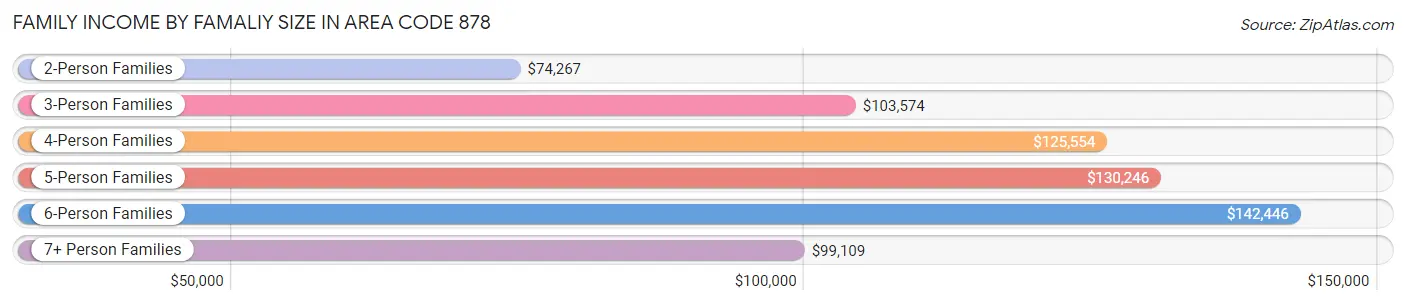
Family Income by Famaliy Size in Area Code 878
6-person families (1,309 | 1.8%) account for the highest median family income in Area Code 878 with $142,446 per family, while 2-person families (39,769 | 54.9%) have the highest median income of $37,134 per family member.
| Income Bracket | # Families | Median Income |
| 2-Person Families | 39,769 (54.9%) | $74,267 |
| 3-Person Families | 15,610 (21.5%) | $103,574 |
| 4-Person Families | 10,923 (15.1%) | $125,554 |
| 5-Person Families | 4,339 (6.0%) | $130,246 |
| 6-Person Families | 1,309 (1.8%) | $142,446 |
| 7+ Person Families | 472 (0.6%) | $99,109 |
| Total | 72,422 (100.0%) | $87,418 |
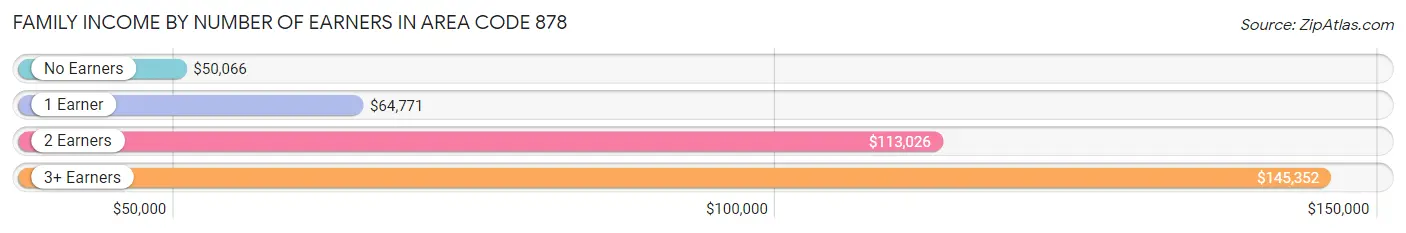
Family Income by Number of Earners in Area Code 878
The median family income in Area Code 878 is $87,418, with families comprising 3+ earners (7,892) having the highest median family income of $145,352, while families with no earners (12,582) have the lowest median family income of $50,066, accounting for 10.9% and 17.4% of families, respectively.
| Number of Earners | # Families | Median Income |
| No Earners | 12,582 (17.4%) | $50,066 |
| 1 Earner | 23,289 (32.2%) | $64,771 |
| 2 Earners | 28,659 (39.6%) | $113,026 |
| 3+ Earners | 7,892 (10.9%) | $145,352 |
| Total | 72,422 (100.0%) | $87,418 |
Household Income in Area Code 878
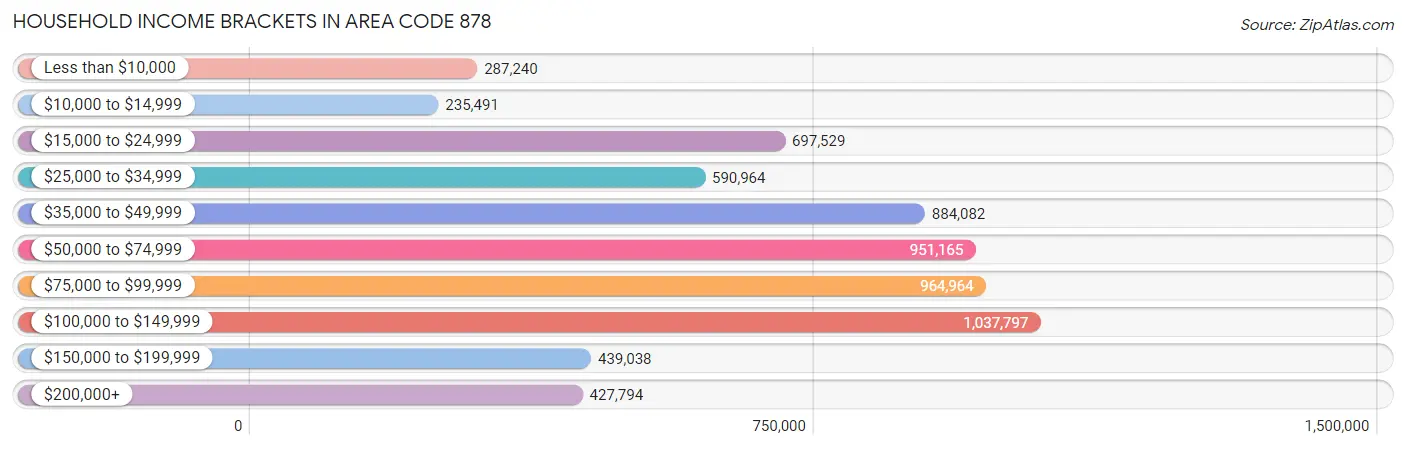
Household Income Brackets in Area Code 878
With 1,037,797 households falling in the category, the $100,000 to $149,999 income range is the most frequent in Area Code 878, accounting for 812.2% of all households. In contrast, only 235,491 households (184.3%) fall into the $10,000 to $14,999 income bracket, making it the least populous group.
| Income Bracket | # Households | % Households |
| Less than $10,000 | 287,240 | 224.8% |
| $10,000 to $14,999 | 235,491 | 184.3% |
| $15,000 to $24,999 | 697,529 | 545.9% |
| $25,000 to $34,999 | 590,964 | 462.5% |
| $35,000 to $49,999 | 884,082 | 691.9% |
| $50,000 to $74,999 | 951,165 | 744.4% |
| $75,000 to $99,999 | 964,964 | 755.2% |
| $100,000 to $149,999 | 1,037,797 | 812.2% |
| $150,000 to $199,999 | 439,038 | 343.6% |
| $200,000+ | 427,794 | 334.8% |
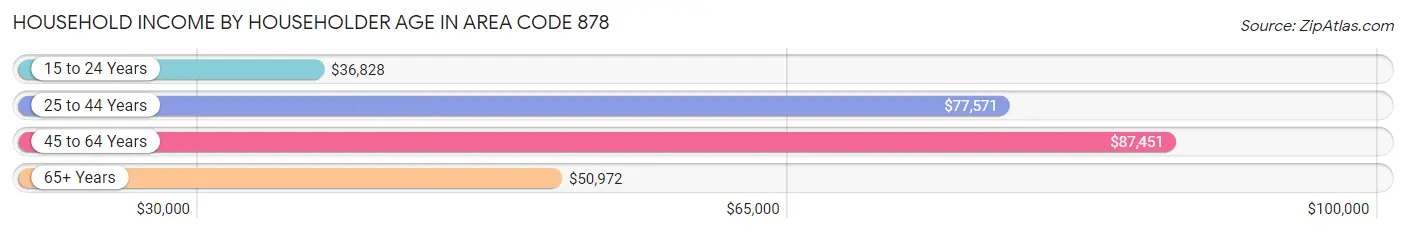
Household Income by Householder Age in Area Code 878
The median household income in Area Code 878 is $68,639, with the highest median household income of $87,451 found in the 45 to 64 years age bracket for the primary householder. A total of 44,144 households (34.5%) fall into this category. Meanwhile, the 15 to 24 years age bracket for the primary householder has the lowest median household income of $36,828, with 7,234 households (5.7%) in this group.
| Income Bracket | # Households | Median Income |
| 15 to 24 Years | 7,234 (5.7%) | $36,828 |
| 25 to 44 Years | 37,477 (29.3%) | $77,571 |
| 45 to 64 Years | 44,144 (34.5%) | $87,451 |
| 65+ Years | 38,921 (30.5%) | $50,972 |
| Total | 127,776 (100.0%) | $68,639 |
Poverty in Area Code 878
Income Below Poverty by Sex and Age in Area Code 878
With 10.8% poverty level for males and 14.5% for females among the residents of Area Code 878, 18 to 24 year old males and 18 to 24 year old females are the most vulnerable to poverty, with 4,197 males (30.0%) and 6,204 females (41.7%) in their respective age groups living below the poverty level.
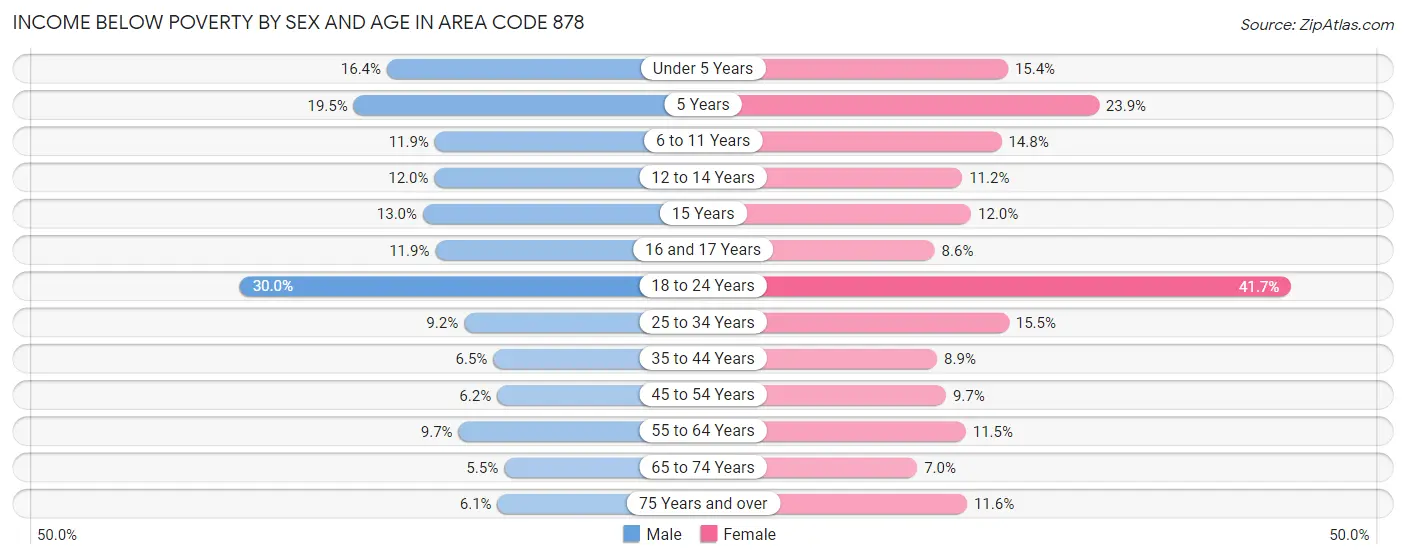
| Age Bracket | Male | Female |
| Under 5 Years | 1,008 (16.4%) | 883 (15.4%) |
| 5 Years | 242 (19.5%) | 318 (23.9%) |
| 6 to 11 Years | 948 (11.9%) | 1,192 (14.8%) |
| 12 to 14 Years | 520 (12.0%) | 449 (11.2%) |
| 15 Years | 249 (13.0%) | 204 (12.0%) |
| 16 and 17 Years | 400 (11.9%) | 262 (8.6%) |
| 18 to 24 Years | 4,197 (30.0%) | 6,204 (41.7%) |
| 25 to 34 Years | 1,867 (9.2%) | 2,996 (15.5%) |
| 35 to 44 Years | 1,054 (6.5%) | 1,328 (8.8%) |
| 45 to 54 Years | 1,075 (6.2%) | 1,680 (9.7%) |
| 55 to 64 Years | 1,921 (9.7%) | 2,419 (11.5%) |
| 65 to 74 Years | 925 (5.5%) | 1,237 (7.0%) |
| 75 Years and over | 595 (6.1%) | 1,743 (11.6%) |
| Total | 15,001 (10.8%) | 20,915 (14.5%) |
Income Above Poverty by Sex and Age in Area Code 878
According to the poverty statistics in Area Code 878, males aged 65 to 74 years and females aged 65 to 74 years are the age groups that are most secure financially, with 94.5% of males and 93.0% of females in these age groups living above the poverty line.
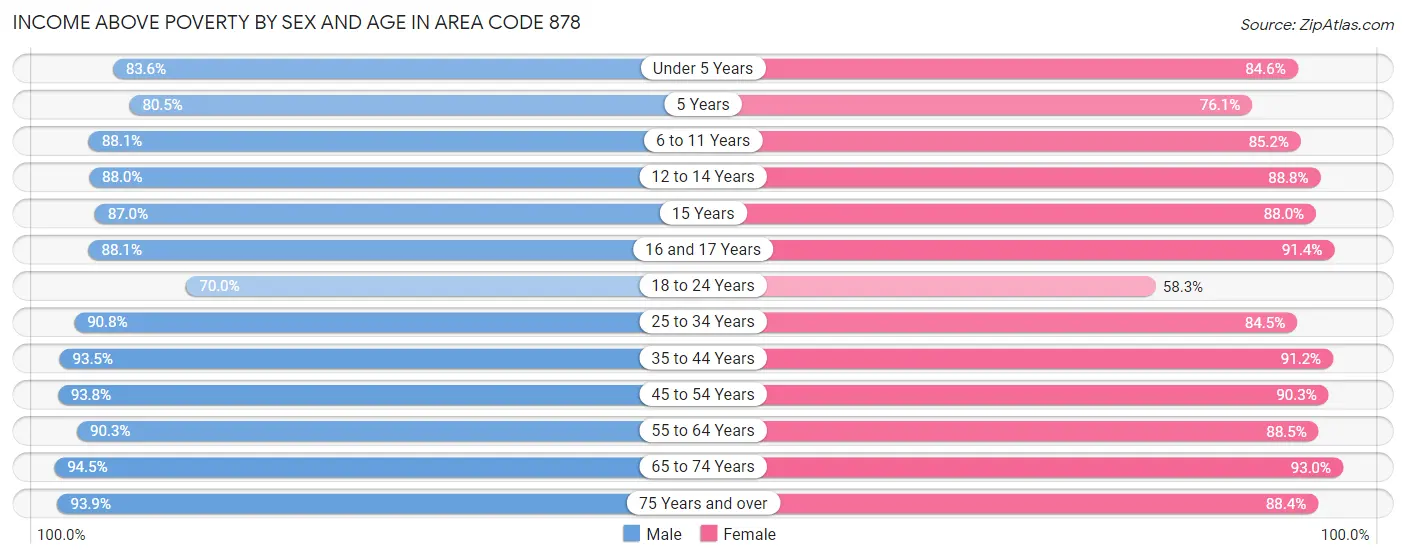
| Age Bracket | Male | Female |
| Under 5 Years | 5,145 (83.6%) | 4,845 (84.6%) |
| 5 Years | 1,001 (80.5%) | 1,015 (76.1%) |
| 6 to 11 Years | 6,994 (88.1%) | 6,853 (85.2%) |
| 12 to 14 Years | 3,819 (88.0%) | 3,566 (88.8%) |
| 15 Years | 1,661 (87.0%) | 1,496 (88.0%) |
| 16 and 17 Years | 2,964 (88.1%) | 2,778 (91.4%) |
| 18 to 24 Years | 9,781 (70.0%) | 8,673 (58.3%) |
| 25 to 34 Years | 18,383 (90.8%) | 16,333 (84.5%) |
| 35 to 44 Years | 15,144 (93.5%) | 13,682 (91.1%) |
| 45 to 54 Years | 16,372 (93.8%) | 15,688 (90.3%) |
| 55 to 64 Years | 17,799 (90.3%) | 18,592 (88.5%) |
| 65 to 74 Years | 15,856 (94.5%) | 16,444 (93.0%) |
| 75 Years and over | 9,135 (93.9%) | 13,256 (88.4%) |
| Total | 124,054 (89.2%) | 123,221 (85.5%) |
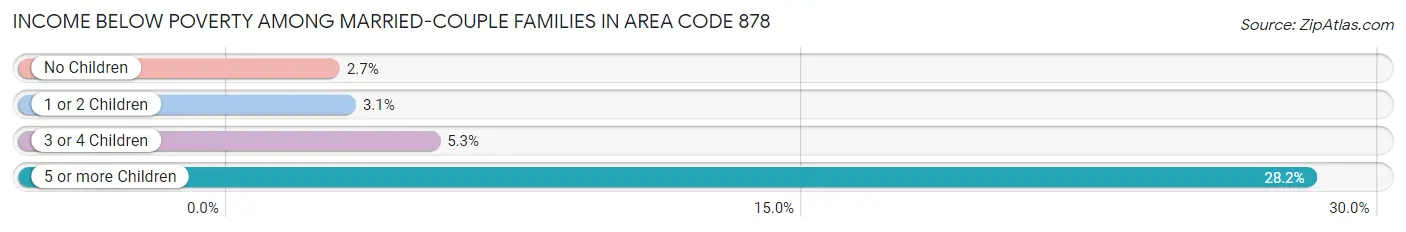
Income Below Poverty Among Married-Couple Families in Area Code 878
The poverty statistics for married-couple families in Area Code 878 show that 3.1% or 1,720 of the total 56,243 families live below the poverty line. Families with 5 or more children have the highest poverty rate of 28.2%, comprising of 78 families. On the other hand, families with no children have the lowest poverty rate of 2.7%, which includes 1,006 families.
| Children | Above Poverty | Below Poverty |
| No Children | 36,769 (97.3%) | 1,006 (2.7%) |
| 1 or 2 Children | 14,292 (96.9%) | 454 (3.1%) |
| 3 or 4 Children | 3,263 (94.7%) | 182 (5.3%) |
| 5 or more Children | 199 (71.8%) | 78 (28.2%) |
| Total | 54,523 (96.9%) | 1,720 (3.1%) |
Income Below Poverty Among Single-Parent Households in Area Code 878
According to the poverty data in Area Code 878, 8.3% or 418 single-father households and 25.4% or 2,824 single-mother households are living below the poverty line. Among single-father households, those with 1 or 2 children have the highest poverty rate, with 312 households (12.3%) experiencing poverty. Likewise, among single-mother households, those with 5 or more children have the highest poverty rate, with 22 households (100.0%) falling below the poverty line.
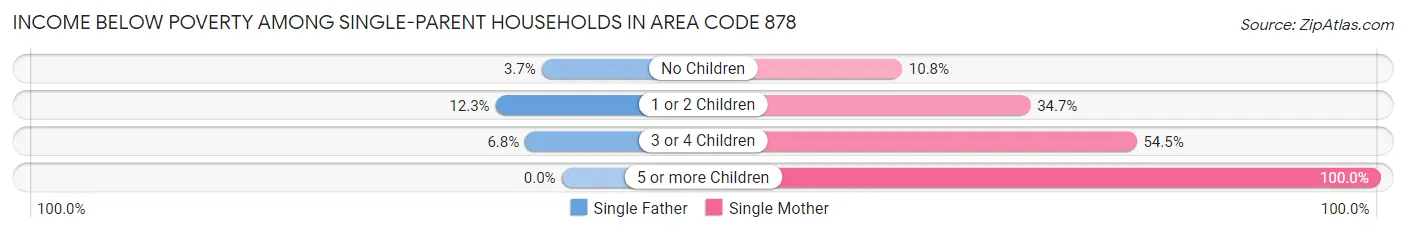
| Children | Single Father | Single Mother |
| No Children | 79 (3.7%) | 564 (10.8%) |
| 1 or 2 Children | 312 (12.3%) | 1,709 (34.7%) |
| 3 or 4 Children | 27 (6.8%) | 529 (54.5%) |
| 5 or more Children | 0 (0.0%) | 22 (100.0%) |
| Total | 418 (8.3%) | 2,824 (25.4%) |
Income Below Poverty Among Married-Couple vs Single-Parent Households in Area Code 878
The poverty data for Area Code 878 shows that 1,720 of the married-couple family households (3.1%) and 3,242 of the single-parent households (20.0%) are living below the poverty level. Within the married-couple family households, those with 5 or more children have the highest poverty rate, with 78 households (28.2%) falling below the poverty line. Among the single-parent households, those with 5 or more children have the highest poverty rate, with 22 household (100.0%) living below poverty.
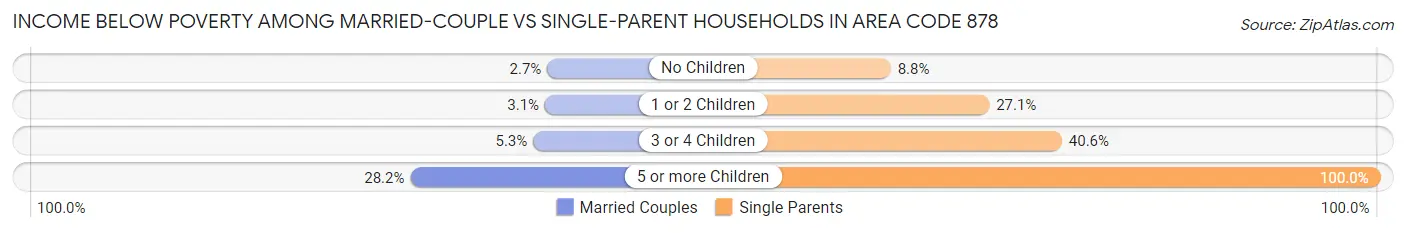
| Children | Married-Couple Families | Single-Parent Households |
| No Children | 1,006 (2.7%) | 643 (8.8%) |
| 1 or 2 Children | 454 (3.1%) | 2,021 (27.1%) |
| 3 or 4 Children | 182 (5.3%) | 556 (40.6%) |
| 5 or more Children | 78 (28.2%) | 22 (100.0%) |
| Total | 1,720 (3.1%) | 3,242 (20.0%) |
Race in Area Code 878
The most populous races in Area Code 878 are White / Caucasian (260,909 | 86.7%), Black / African American (15,667 | 5.2%), and Asian (11,375 | 3.8%).
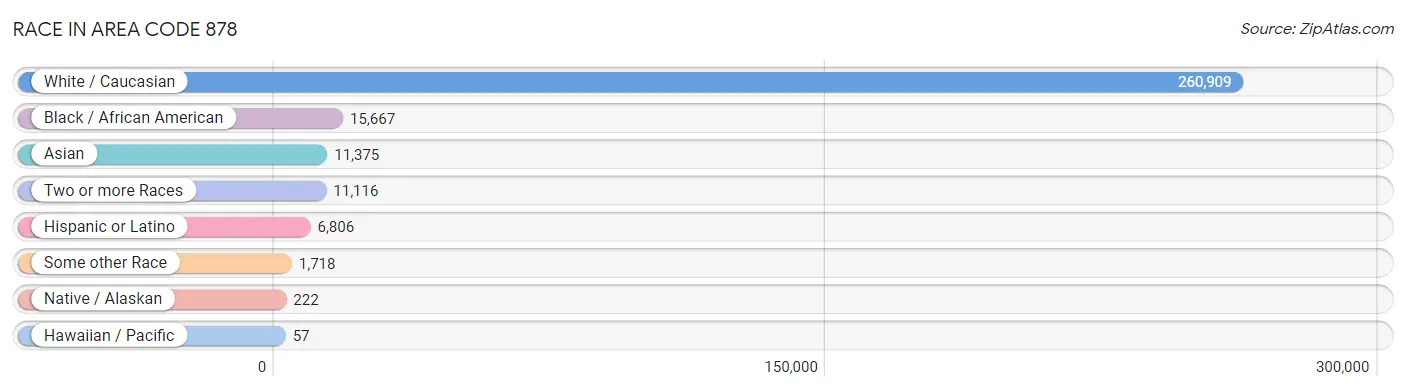
| Race | # Population | % Population |
| Asian | 11,375 | 3.8% |
| Black / African American | 15,667 | 5.2% |
| Hawaiian / Pacific | 57 | 0.0% |
| Hispanic or Latino | 6,806 | 2.3% |
| Native / Alaskan | 222 | 0.1% |
| White / Caucasian | 260,909 | 86.7% |
| Two or more Races | 11,116 | 3.7% |
| Some other Race | 1,718 | 0.6% |
| Total | 301,064 | 100.0% |
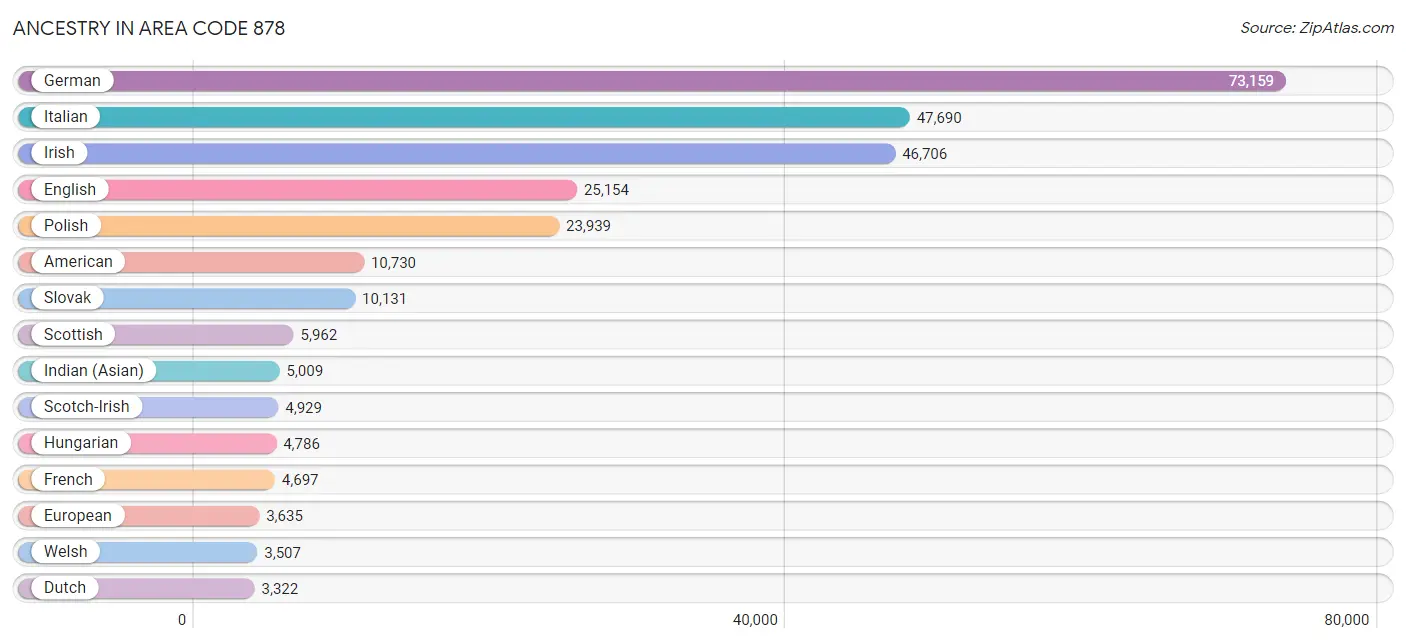
Ancestry in Area Code 878
The most populous ancestries reported in Area Code 878 are German (73,159 | 24.3%), Italian (47,690 | 15.8%), Irish (46,706 | 15.5%), English (25,154 | 8.4%), and Polish (23,939 | 8.0%), together accounting for 72.0% of all Area Code 878 residents.
| Ancestry | # Population | % Population |
| Afghan | 20 | 0.0% |
| African | 636 | 0.2% |
| Albanian | 18 | 0.0% |
| Alsatian | 3 | 0.0% |
| American | 10,730 | 3.6% |
| Apache | 8 | 0.0% |
| Arab | 1,939 | 0.6% |
| Argentinean | 78 | 0.0% |
| Armenian | 97 | 0.0% |
| Australian | 51 | 0.0% |
| Austrian | 951 | 0.3% |
| Bahamian | 196 | 0.1% |
| Bangladeshi | 11 | 0.0% |
| Barbadian | 10 | 0.0% |
| Basque | 7 | 0.0% |
| Belgian | 368 | 0.1% |
| Bhutanese | 687 | 0.2% |
| Blackfeet | 124 | 0.0% |
| Bolivian | 40 | 0.0% |
| Brazilian | 183 | 0.1% |
| British | 1,150 | 0.4% |
| Bulgarian | 145 | 0.1% |
| Burmese | 1,612 | 0.5% |
| Cambodian | 36 | 0.0% |
| Canadian | 310 | 0.1% |
| Cape Verdean | 101 | 0.0% |
| Carpatho Rusyn | 46 | 0.0% |
| Celtic | 49 | 0.0% |
| Central American | 616 | 0.2% |
| Central American Indian | 39 | 0.0% |
| Cherokee | 457 | 0.2% |
| Cheyenne | 3 | 0.0% |
| Chilean | 30 | 0.0% |
| Chippewa | 48 | 0.0% |
| Choctaw | 6 | 0.0% |
| Colombian | 311 | 0.1% |
| Comanche | 28 | 0.0% |
| Costa Rican | 78 | 0.0% |
| Croatian | 3,235 | 1.1% |
| Cuban | 192 | 0.1% |
| Cypriot | 31 | 0.0% |
| Czech | 1,910 | 0.6% |
| Czechoslovakian | 882 | 0.3% |
| Danish | 574 | 0.2% |
| Delaware | 43 | 0.0% |
| Dominican | 426 | 0.1% |
| Dutch | 3,322 | 1.1% |
| Dutch West Indian | 15 | 0.0% |
| Eastern European | 1,847 | 0.6% |
| Ecuadorian | 49 | 0.0% |
| Egyptian | 108 | 0.0% |
| English | 25,154 | 8.4% |
| Estonian | 7 | 0.0% |
| European | 3,635 | 1.2% |
| Filipino | 185 | 0.1% |
| Finnish | 134 | 0.0% |
| French | 4,697 | 1.6% |
| French American Indian | 12 | 0.0% |
| French Canadian | 623 | 0.2% |
| German | 73,159 | 24.3% |
| Ghanaian | 59 | 0.0% |
| Greek | 1,630 | 0.5% |
| Guatemalan | 222 | 0.1% |
| Guyanese | 18 | 0.0% |
| Haitian | 127 | 0.0% |
| Honduran | 49 | 0.0% |
| Hopi | 4 | 0.0% |
| Houma | 8 | 0.0% |
| Hungarian | 4,786 | 1.6% |
| Icelander | 124 | 0.0% |
| Indian (Asian) | 5,009 | 1.7% |
| Indonesian | 106 | 0.0% |
| Iranian | 159 | 0.1% |
| Iraqi | 40 | 0.0% |
| Irish | 46,706 | 15.5% |
| Iroquois | 85 | 0.0% |
| Israeli | 22 | 0.0% |
| Italian | 47,690 | 15.8% |
| Jamaican | 86 | 0.0% |
| Japanese | 3 | 0.0% |
| Jordanian | 141 | 0.1% |
| Kenyan | 49 | 0.0% |
| Kiowa | 2 | 0.0% |
| Korean | 1,088 | 0.4% |
| Laotian | 157 | 0.1% |
| Latvian | 79 | 0.0% |
| Lebanese | 641 | 0.2% |
| Liberian | 16 | 0.0% |
| Lithuanian | 1,137 | 0.4% |
| Lumbee | 13 | 0.0% |
| Luxembourger | 11 | 0.0% |
| Macedonian | 105 | 0.0% |
| Malaysian | 14 | 0.0% |
| Maltese | 53 | 0.0% |
| Mexican | 2,365 | 0.8% |
| Mexican American Indian | 16 | 0.0% |
| Mongolian | 13 | 0.0% |
| Moroccan | 87 | 0.0% |
| Native Hawaiian | 166 | 0.1% |
| Navajo | 25 | 0.0% |
| New Zealander | 6 | 0.0% |
| Nicaraguan | 42 | 0.0% |
| Nigerian | 349 | 0.1% |
| Northern European | 243 | 0.1% |
| Norwegian | 981 | 0.3% |
| Okinawan | 7 | 0.0% |
| Ottawa | 10 | 0.0% |
| Pakistani | 188 | 0.1% |
| Palestinian | 80 | 0.0% |
| Panamanian | 196 | 0.1% |
| Paraguayan | 21 | 0.0% |
| Pennsylvania German | 1,283 | 0.4% |
| Peruvian | 130 | 0.0% |
| Polish | 23,939 | 8.0% |
| Portuguese | 235 | 0.1% |
| Potawatomi | 3 | 0.0% |
| Puerto Rican | 1,401 | 0.5% |
| Puget Sound Salish | 8 | 0.0% |
| Romanian | 711 | 0.2% |
| Russian | 2,948 | 1.0% |
| Salvadoran | 26 | 0.0% |
| Samoan | 33 | 0.0% |
| Scandinavian | 362 | 0.1% |
| Scotch-Irish | 4,929 | 1.6% |
| Scottish | 5,962 | 2.0% |
| Senegalese | 4 | 0.0% |
| Serbian | 1,282 | 0.4% |
| Shoshone | 25 | 0.0% |
| Sioux | 52 | 0.0% |
| Slavic | 513 | 0.2% |
| Slovak | 10,131 | 3.4% |
| Slovene | 877 | 0.3% |
| South African | 30 | 0.0% |
| South American | 842 | 0.3% |
| South American Indian | 14 | 0.0% |
| Soviet Union | 13 | 0.0% |
| Spaniard | 160 | 0.1% |
| Spanish | 381 | 0.1% |
| Spanish American | 8 | 0.0% |
| Sri Lankan | 791 | 0.3% |
| Subsaharan African | 1,320 | 0.4% |
| Sudanese | 44 | 0.0% |
| Swedish | 3,210 | 1.1% |
| Swiss | 988 | 0.3% |
| Syrian | 561 | 0.2% |
| Thai | 3,045 | 1.0% |
| Trinidadian and Tobagonian | 12 | 0.0% |
| Turkish | 120 | 0.0% |
| Ukrainian | 2,170 | 0.7% |
| Uruguayan | 38 | 0.0% |
| Venezuelan | 145 | 0.1% |
| Vietnamese | 59 | 0.0% |
| Welsh | 3,507 | 1.2% |
| West Indian | 89 | 0.0% |
| Yaqui | 8 | 0.0% |
| Yugoslavian | 272 | 0.1% | View All 156 Rows |
Immigrants in Area Code 878
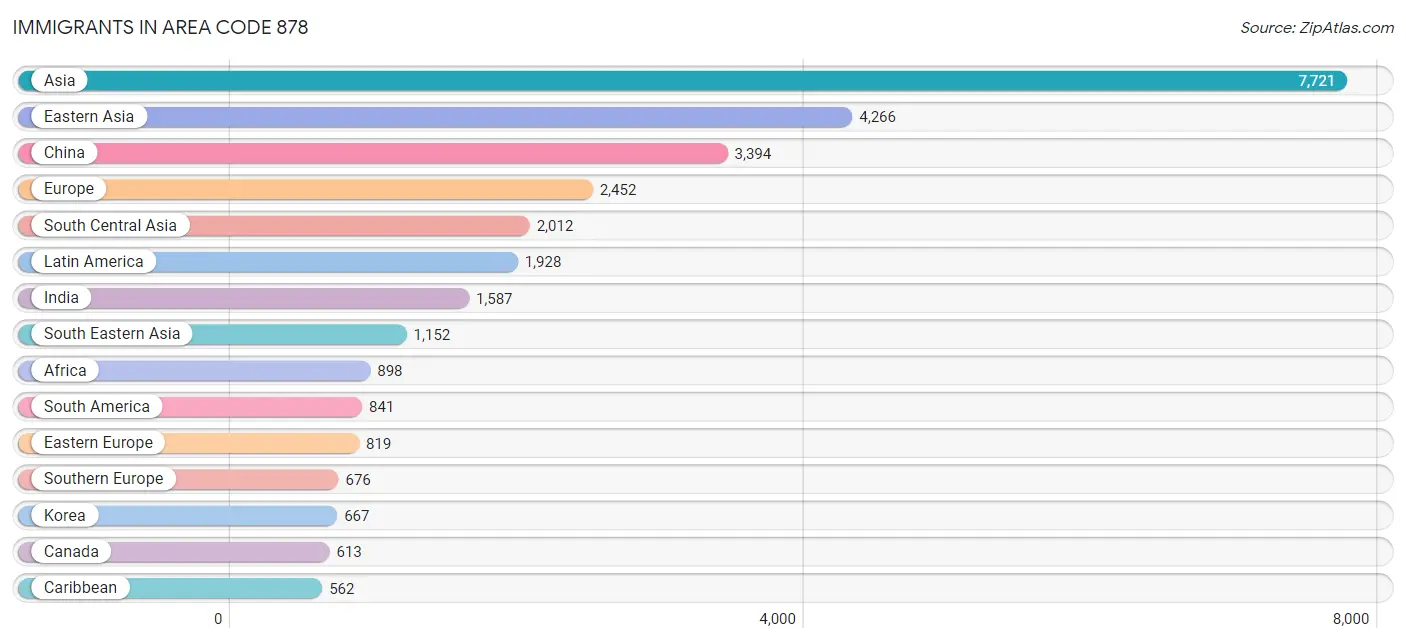
The most numerous immigrant groups reported in Area Code 878 came from Asia (7,721 | 2.6%), Eastern Asia (4,266 | 1.4%), China (3,394 | 1.1%), Europe (2,452 | 0.8%), and South Central Asia (2,012 | 0.7%), together accounting for 6.6% of all Area Code 878 residents.
| Immigration Origin | # Population | % Population |
| Afghanistan | 9 | 0.0% |
| Africa | 898 | 0.3% |
| Argentina | 32 | 0.0% |
| Asia | 7,721 | 2.6% |
| Australia | 65 | 0.0% |
| Austria | 67 | 0.0% |
| Bahamas | 174 | 0.1% |
| Bangladesh | 7 | 0.0% |
| Belarus | 59 | 0.0% |
| Belgium | 60 | 0.0% |
| Bolivia | 40 | 0.0% |
| Bosnia and Herzegovina | 8 | 0.0% |
| Brazil | 314 | 0.1% |
| Bulgaria | 66 | 0.0% |
| Canada | 613 | 0.2% |
| Caribbean | 562 | 0.2% |
| Central America | 525 | 0.2% |
| Chile | 21 | 0.0% |
| China | 3,394 | 1.1% |
| Colombia | 191 | 0.1% |
| Costa Rica | 53 | 0.0% |
| Croatia | 26 | 0.0% |
| Cuba | 38 | 0.0% |
| Czechoslovakia | 22 | 0.0% |
| Denmark | 11 | 0.0% |
| Dominican Republic | 275 | 0.1% |
| Eastern Africa | 90 | 0.0% |
| Eastern Asia | 4,266 | 1.4% |
| Eastern Europe | 819 | 0.3% |
| Ecuador | 4 | 0.0% |
| Egypt | 159 | 0.1% |
| England | 117 | 0.0% |
| Europe | 2,452 | 0.8% |
| France | 57 | 0.0% |
| Germany | 225 | 0.1% |
| Ghana | 52 | 0.0% |
| Greece | 173 | 0.1% |
| Guatemala | 116 | 0.0% |
| Guyana | 30 | 0.0% |
| Haiti | 4 | 0.0% |
| Honduras | 3 | 0.0% |
| Hong Kong | 36 | 0.0% |
| Hungary | 58 | 0.0% |
| India | 1,587 | 0.5% |
| Indonesia | 82 | 0.0% |
| Iran | 96 | 0.0% |
| Ireland | 43 | 0.0% |
| Israel | 10 | 0.0% |
| Italy | 455 | 0.2% |
| Jamaica | 50 | 0.0% |
| Japan | 184 | 0.1% |
| Jordan | 82 | 0.0% |
| Kazakhstan | 42 | 0.0% |
| Kenya | 63 | 0.0% |
| Korea | 667 | 0.2% |
| Kuwait | 11 | 0.0% |
| Latin America | 1,928 | 0.6% |
| Latvia | 10 | 0.0% |
| Lebanon | 9 | 0.0% |
| Liberia | 16 | 0.0% |
| Lithuania | 28 | 0.0% |
| Mexico | 320 | 0.1% |
| Nepal | 58 | 0.0% |
| Netherlands | 65 | 0.0% |
| Nicaragua | 22 | 0.0% |
| Nigeria | 137 | 0.1% |
| Northern Africa | 392 | 0.1% |
| Northern Europe | 463 | 0.2% |
| Norway | 5 | 0.0% |
| Oceania | 70 | 0.0% |
| Pakistan | 87 | 0.0% |
| Panama | 11 | 0.0% |
| Peru | 43 | 0.0% |
| Philippines | 387 | 0.1% |
| Poland | 88 | 0.0% |
| Romania | 84 | 0.0% |
| Russia | 212 | 0.1% |
| Saudi Arabia | 20 | 0.0% |
| Scotland | 17 | 0.0% |
| Senegal | 4 | 0.0% |
| Serbia | 17 | 0.0% |
| Sierra Leone | 4 | 0.0% |
| Singapore | 33 | 0.0% |
| South Africa | 29 | 0.0% |
| South America | 841 | 0.3% |
| South Central Asia | 2,012 | 0.7% |
| South Eastern Asia | 1,152 | 0.4% |
| Southern Europe | 676 | 0.2% |
| Spain | 42 | 0.0% |
| Sri Lanka | 3 | 0.0% |
| Sweden | 41 | 0.0% |
| Syria | 20 | 0.0% |
| Taiwan | 240 | 0.1% |
| Thailand | 166 | 0.1% |
| Trinidad and Tobago | 21 | 0.0% |
| Turkey | 86 | 0.0% |
| Ukraine | 50 | 0.0% |
| Uruguay | 27 | 0.0% |
| Venezuela | 118 | 0.0% |
| Vietnam | 434 | 0.1% |
| Western Africa | 261 | 0.1% |
| Western Asia | 266 | 0.1% |
| Western Europe | 474 | 0.2% | View All 103 Rows |
Sex and Age in Area Code 878
Sex and Age in Area Code 878
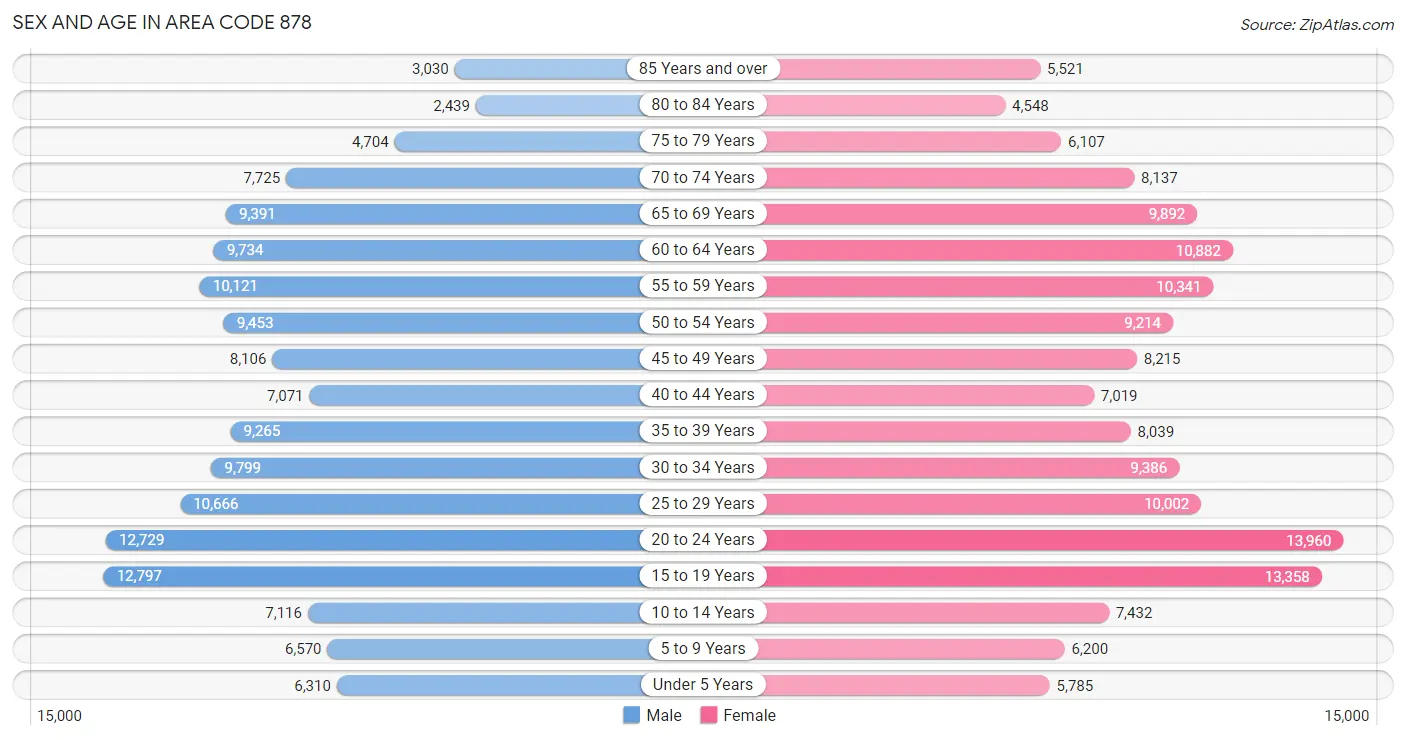
The most populous age groups in Area Code 878 are 15 to 19 Years (12,797 | 8.7%) for men and 20 to 24 Years (13,960 | 9.1%) for women.
| Age Bracket | Male | Female |
| Under 5 Years | 6,310 (4.3%) | 5,785 (3.8%) |
| 5 to 9 Years | 6,570 (4.5%) | 6,200 (4.0%) |
| 10 to 14 Years | 7,116 (4.8%) | 7,432 (4.8%) |
| 15 to 19 Years | 12,797 (8.7%) | 13,358 (8.7%) |
| 20 to 24 Years | 12,729 (8.7%) | 13,960 (9.1%) |
| 25 to 29 Years | 10,666 (7.2%) | 10,002 (6.5%) |
| 30 to 34 Years | 9,799 (6.7%) | 9,386 (6.1%) |
| 35 to 39 Years | 9,265 (6.3%) | 8,039 (5.2%) |
| 40 to 44 Years | 7,071 (4.8%) | 7,019 (4.6%) |
| 45 to 49 Years | 8,106 (5.5%) | 8,215 (5.3%) |
| 50 to 54 Years | 9,453 (6.4%) | 9,214 (6.0%) |
| 55 to 59 Years | 10,121 (6.9%) | 10,341 (6.7%) |
| 60 to 64 Years | 9,734 (6.6%) | 10,882 (7.1%) |
| 65 to 69 Years | 9,391 (6.4%) | 9,892 (6.4%) |
| 70 to 74 Years | 7,725 (5.2%) | 8,137 (5.3%) |
| 75 to 79 Years | 4,704 (3.2%) | 6,107 (4.0%) |
| 80 to 84 Years | 2,439 (1.7%) | 4,548 (2.9%) |
| 85 Years and over | 3,030 (2.1%) | 5,521 (3.6%) |
| Total | 147,026 (100.0%) | 154,038 (100.0%) |
Families and Households in Area Code 878
Median Family Size in Area Code 878
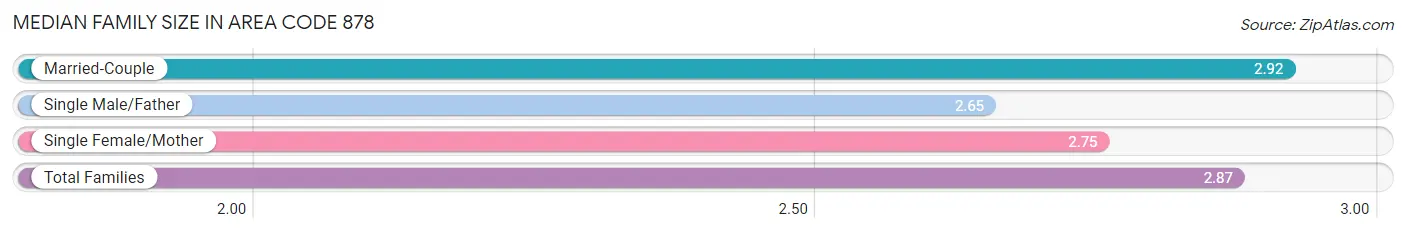
The median family size in Area Code 878 is 2.87 persons per family, with married-couple families (56,243 | 77.7%) accounting for the largest median family size of 2.91816 persons per family. On the other hand, single male/father families (5,064 | 7.0%) represent the smallest median family size with 2.65 persons per family.
| Family Type | # Families | Family Size |
| Married-Couple | 56,243 (77.7%) | 2.92 |
| Single Male/Father | 5,064 (7.0%) | 2.65 |
| Single Female/Mother | 11,115 (15.3%) | 2.75 |
| Total Families | 72,422 (100.0%) | 2.87 |
Median Household Size in Area Code 878
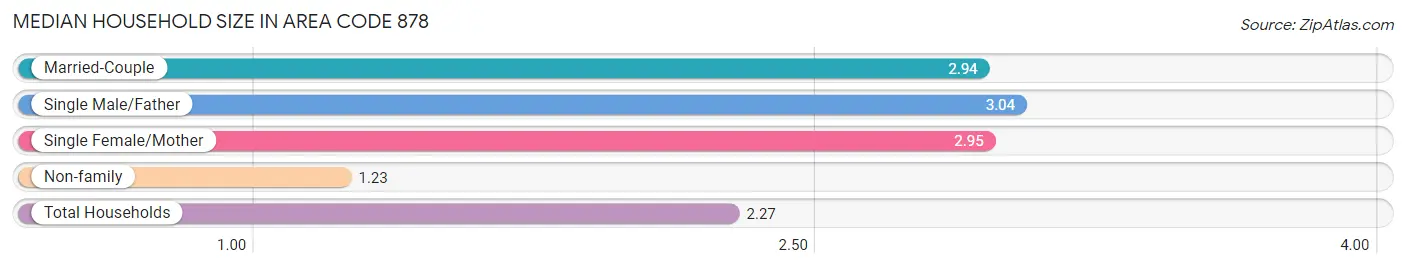
The median household size in Area Code 878 is 2.27 persons per household, with single male/father households (5,064 | 4.0%) accounting for the largest median household size of 3.03666 persons per household. non-family households (55,354 | 43.3%) represent the smallest median household size with 1.23 persons per household.
| Household Type | # Households | Household Size |
| Married-Couple | 56,243 (44.0%) | 2.94 |
| Single Male/Father | 5,064 (4.0%) | 3.04 |
| Single Female/Mother | 11,115 (8.7%) | 2.95 |
| Non-family | 55,354 (43.3%) | 1.23 |
| Total Households | 127,776 (100.0%) | 2.27 |
Household Size by Marriage Status in Area Code 878
Out of a total of 127,776 households in Area Code 878, 72,422 (56.7%) are family households, while 55,354 (43.3%) are nonfamily households. The most numerous type of family households are 2-person households, comprising 37,692, and the most common type of nonfamily households are 1-person households, comprising 45,053.
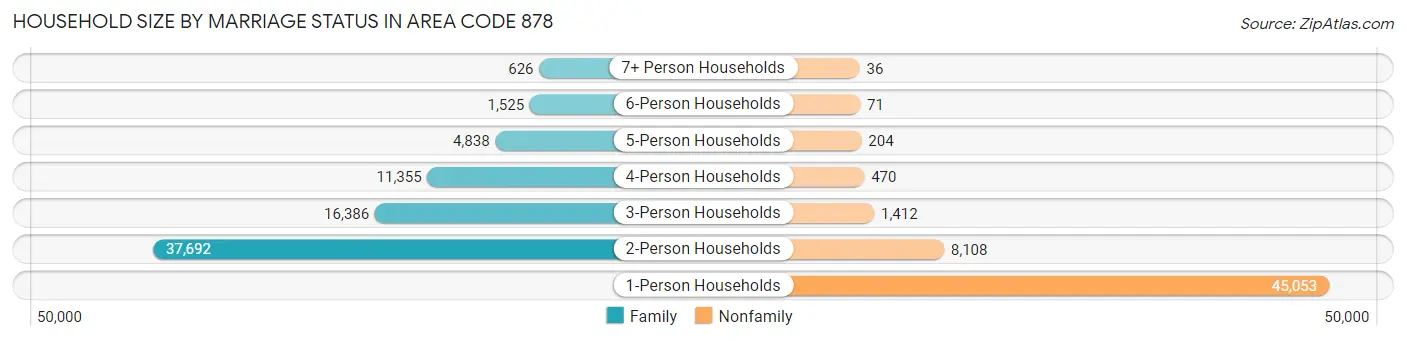
| Household Size | Family Households | Nonfamily Households |
| 1-Person Households | - | 45,053 (35.3%) |
| 2-Person Households | 37,692 (29.5%) | 8,108 (6.4%) |
| 3-Person Households | 16,386 (12.8%) | 1,412 (1.1%) |
| 4-Person Households | 11,355 (8.9%) | 470 (0.4%) |
| 5-Person Households | 4,838 (3.8%) | 204 (0.2%) |
| 6-Person Households | 1,525 (1.2%) | 71 (0.1%) |
| 7+ Person Households | 626 (0.5%) | 36 (0.0%) |
| Total | 72,422 (56.7%) | 55,354 (43.3%) |
Female Fertility in Area Code 878
Fertility by Age in Area Code 878
Average fertility rate in Area Code 878 is 81.0 births per 1,000 women. Women in the age bracket of 20 to 34 years have the highest fertility rate with 167.9 births per 1,000 women. Women in the age bracket of 20 to 34 years acount for 78.7% of all women with births.
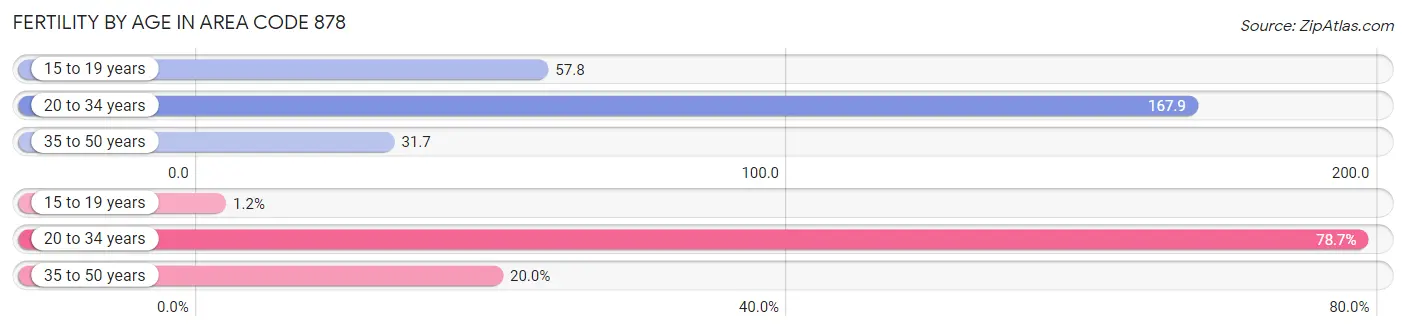
| Age Bracket | Women with Births | Births / 1,000 Women |
| 15 to 19 years | 40 (1.2%) | 57.8 |
| 20 to 34 years | 2,556 (78.7%) | 167.9 |
| 35 to 50 years | 650 (20.0%) | 31.6 |
| Total | 3,246 (100.0%) | 81.0 |
Fertility by Age by Marriage Status in Area Code 878
49.7% of women with births (3,246) in Area Code 878 are married. The highest percentage of unmarried women with births falls into 15 to 19 years age bracket with 100.0% of them unmarried at the time of birth, while the lowest percentage of unmarried women with births belong to 35 to 50 years age bracket with 43.7% of them unmarried.
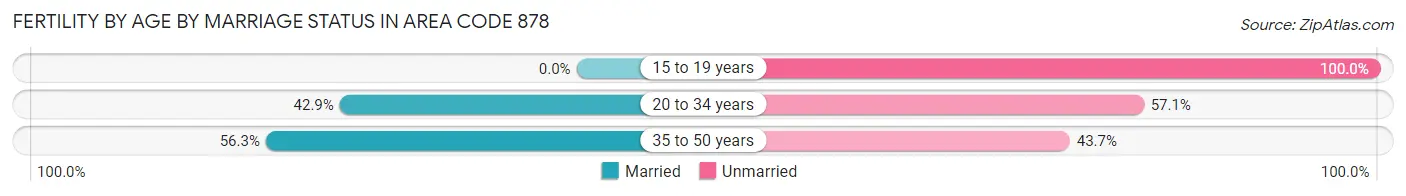
| Age Bracket | Married | Unmarried |
| 15 to 19 years | 0 (0.0%) | 40 (100.0%) |
| 20 to 34 years | 1,097 (42.9%) | 1,459 (57.1%) |
| 35 to 50 years | 366 (56.3%) | 284 (43.7%) |
| Total | 1,613 (49.7%) | 1,633 (50.3%) |
Fertility by Education in Area Code 878
Average fertility rate in Area Code 878 is 81.0 births per 1,000 women. Women with the education attainment of less than high school have the highest fertility rate of 187.7 births per 1,000 women, while women with the education attainment of college or associate's degree have the lowest fertility at 61.9 births per 1,000 women. Women with the education attainment of high school diploma represent 32.4% of all women with births.
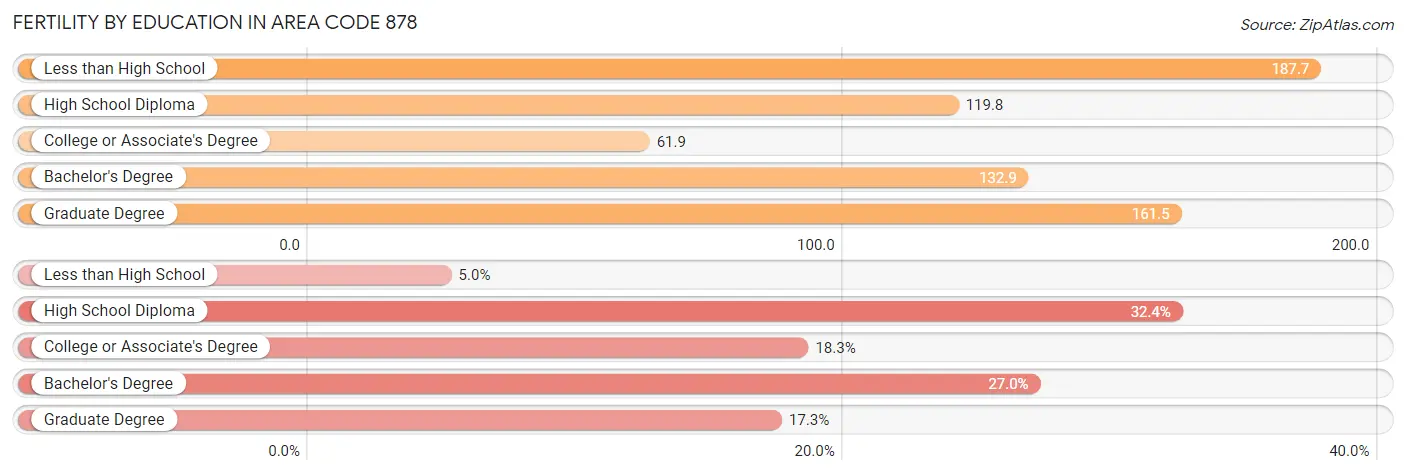
| Educational Attainment | Women with Births | Births / 1,000 Women |
| Less than High School | 161 (5.0%) | 187.7 |
| High School Diploma | 1,050 (32.4%) | 119.8 |
| College or Associate's Degree | 595 (18.3%) | 61.9 |
| Bachelor's Degree | 877 (27.0%) | 132.9 |
| Graduate Degree | 563 (17.3%) | 161.5 |
| Total | 3,246 (100.0%) | 81.0 |
Fertility by Education by Marriage Status in Area Code 878
50.3% of women with births in Area Code 878 are unmarried. Women with the educational attainment of graduate degree are most likely to be married with 60.0% of them married at childbirth, while women with the educational attainment of high school diploma are least likely to be married with 80.2% of them unmarried at childbirth.
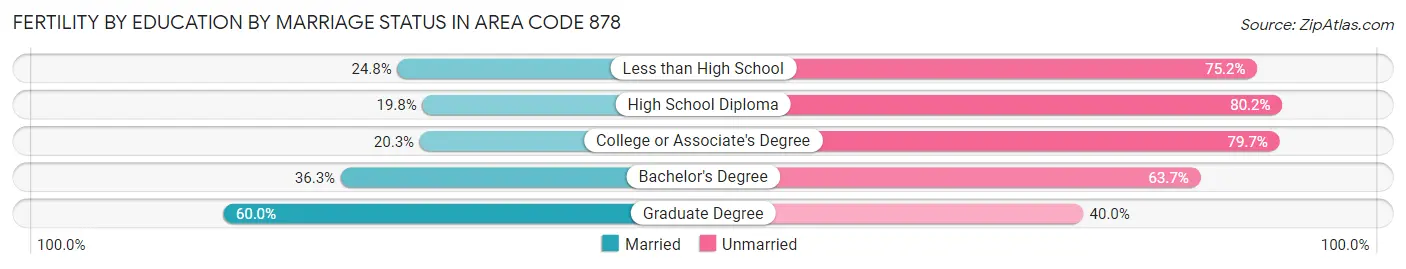
| Educational Attainment | Married | Unmarried |
| Less than High School | 40 (24.8%) | 121 (75.2%) |
| High School Diploma | 208 (19.8%) | 842 (80.2%) |
| College or Associate's Degree | 121 (20.3%) | 474 (79.7%) |
| Bachelor's Degree | 318 (36.3%) | 559 (63.7%) |
| Graduate Degree | 338 (60.0%) | 225 (40.0%) |
| Total | 1,613 (49.7%) | 1,633 (50.3%) |
Employment Characteristics in Area Code 878
Employment by Class of Employer in Area Code 878
Among the 143,875 employed individuals in Area Code 878, private company employees (97,552 | 67.8%), not-for-profit organizations (21,016 | 14.6%), and local government employees (7,284 | 5.1%) make up the most common classes of employment.
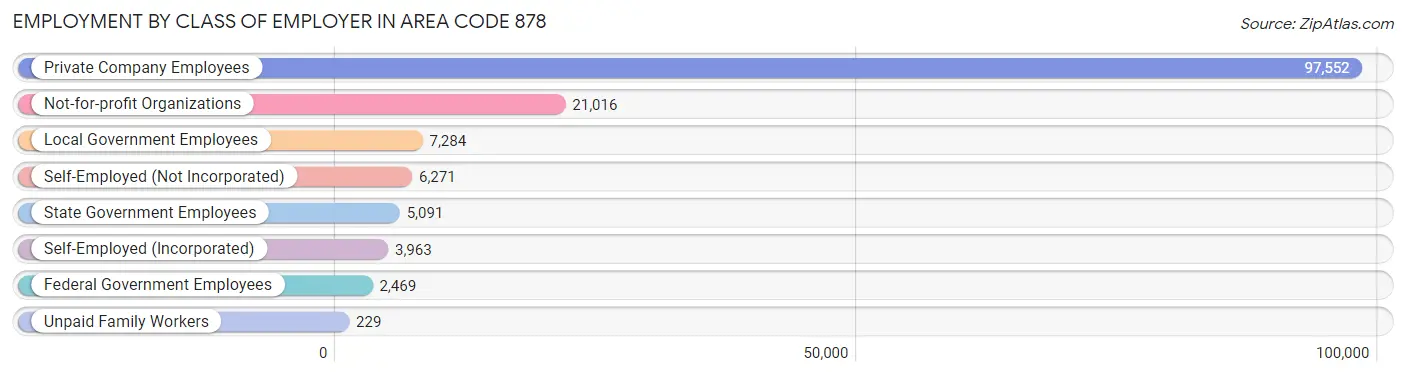
| Employer Class | # Employees | % Employees |
| Private Company Employees | 97,552 | 67.8% |
| Self-Employed (Incorporated) | 3,963 | 2.8% |
| Self-Employed (Not Incorporated) | 6,271 | 4.4% |
| Not-for-profit Organizations | 21,016 | 14.6% |
| Local Government Employees | 7,284 | 5.1% |
| State Government Employees | 5,091 | 3.5% |
| Federal Government Employees | 2,469 | 1.7% |
| Unpaid Family Workers | 229 | 0.2% |
| Total | 143,875 | 100.0% |
Employment Status by Age in Area Code 878
According to the labor force statistics for Area Code 878, out of the total population over 16 years of age (258,037), 62.9% or 162,254 individuals are in the labor force, with 5.3% or 8,583 of them unemployed. The age group with the highest labor force participation rate is 30 to 34 years, with 92.7% or 17,784 individuals in the labor force. Within the labor force, the 30 to 34 years age range has the highest percentage of unemployed individuals, with 362.5% or 64,467 of them being unemployed.
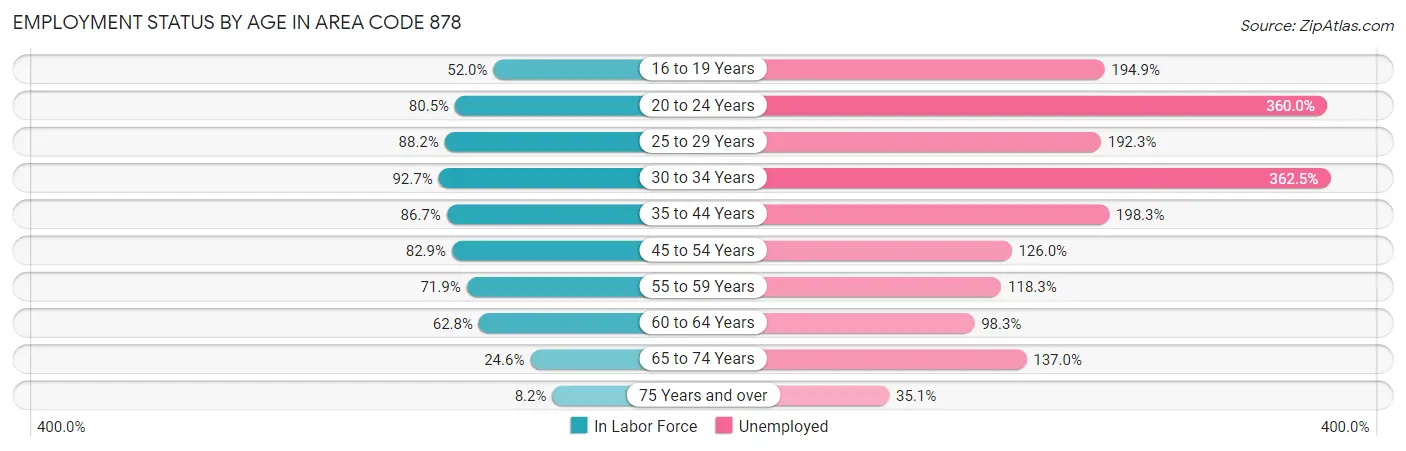
| Age Bracket | In Labor Force | Unemployed |
| 16 to 19 Years | 11,723 (52.0%) | 22,850 (194.9%) |
| 20 to 24 Years | 21,490 (80.5%) | 77,364 (360.0%) |
| 25 to 29 Years | 18,224 (88.2%) | 35,047 (192.3%) |
| 30 to 34 Years | 17,785 (92.7%) | 64,467 (362.5%) |
| 35 to 44 Years | 27,203 (86.7%) | 53,944 (198.3%) |
| 45 to 54 Years | 28,987 (82.9%) | 36,525 (126.0%) |
| 55 to 59 Years | 14,716 (71.9%) | 17,409 (118.3%) |
| 60 to 64 Years | 12,948 (62.8%) | 12,727 (98.3%) |
| 65 to 74 Years | 8,647 (24.6%) | 11,845 (137.0%) |
| 75 Years and over | 2,157 (8.2%) | 757 (35.1%) |
| Total | 162,254 (62.9%) | 8,582 (5.3%) |
Employment Status by Educational Attainment in Area Code 878
According to labor force statistics for Area Code 878, 80.1% of individuals (117,968) out of the total population between 25 and 64 years of age (147,313) are in the labor force, with 174.9% or 206,326 of them being unemployed. The group with the highest labor force participation rate are those with the educational attainment of bachelor's degree or higher, with 89.5% or 55,840 individuals in the labor force. Within the labor force, individuals with less than high school education have the highest percentage of unemployment, with 446.2% or 17,313 of them being unemployed.
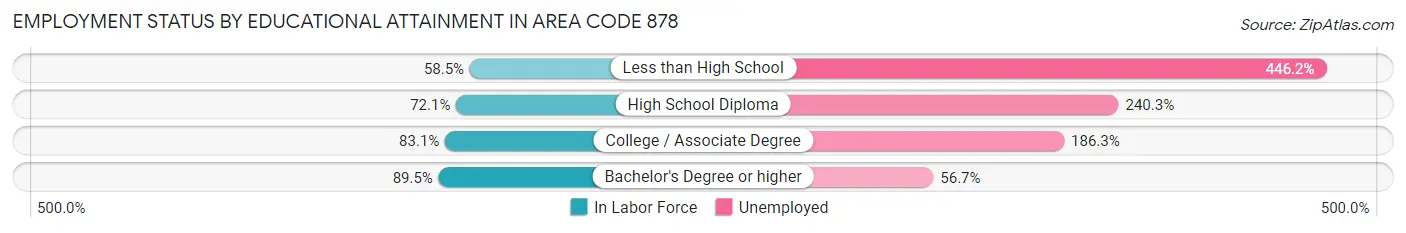
| Educational Attainment | In Labor Force | Unemployed |
| Less than High School | 3,879 (58.5%) | 29,588 (446.2%) |
| High School Diploma | 28,447 (72.1%) | 94,801 (240.3%) |
| College / Associate Degree | 32,268 (83.1%) | 72,333 (186.3%) |
| Bachelor's Degree or higher | 55,837 (89.5%) | 35,384 (56.7%) |
| Total | 117,968 (80.1%) | 257,650 (174.9%) |
Employment Occupations by Sex in Area Code 878
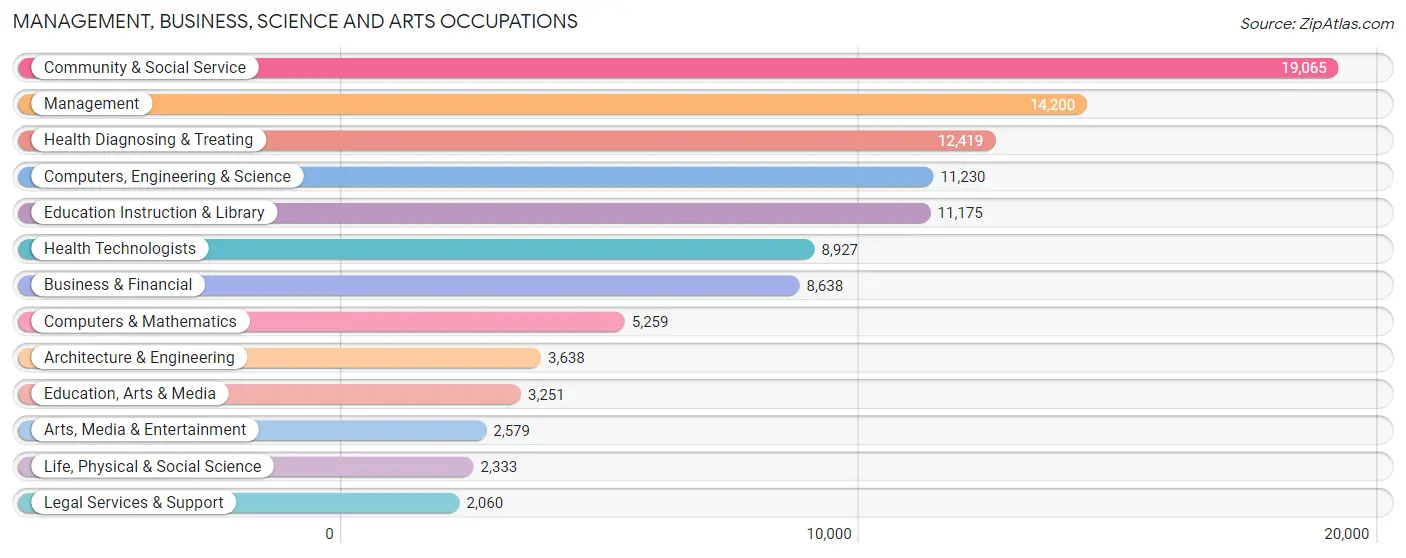
Management, Business, Science and Arts Occupations
The most common Management, Business, Science and Arts occupations in Area Code 878 are Community & Social Service (19,065 | 13.0%), Management (14,200 | 9.7%), Health Diagnosing & Treating (12,419 | 8.5%), Computers, Engineering & Science (11,230 | 7.7%), and Education Instruction & Library (11,175 | 7.6%).
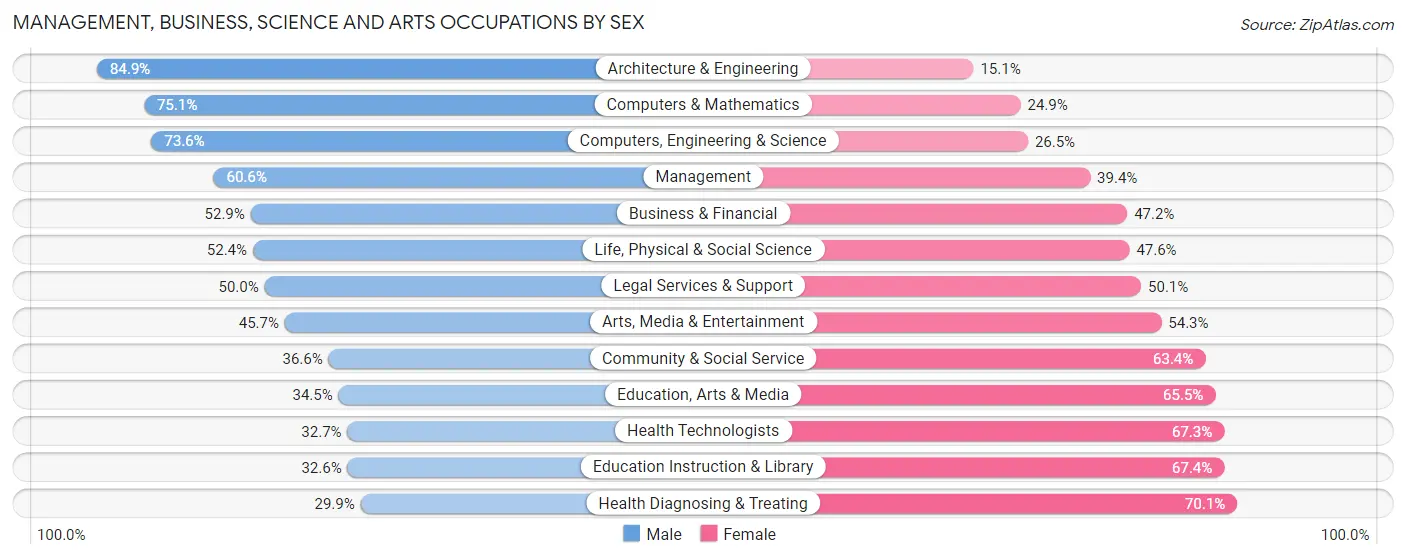
Management, Business, Science and Arts Occupations by Sex
Within the Management, Business, Science and Arts occupations in Area Code 878, the most male-oriented occupations are Architecture & Engineering (84.9%), Computers & Mathematics (75.1%), and Computers, Engineering & Science (73.6%), while the most female-oriented occupations are Health Diagnosing & Treating (70.1%), Education Instruction & Library (67.4%), and Health Technologists (67.3%).
| Occupation | Male | Female |
| Management | 8,603 (60.6%) | 5,597 (39.4%) |
| Business & Financial | 4,565 (52.8%) | 4,073 (47.1%) |
| Computers, Engineering & Science | 8,260 (73.6%) | 2,970 (26.5%) |
| Computers & Mathematics | 3,949 (75.1%) | 1,310 (24.9%) |
| Architecture & Engineering | 3,089 (84.9%) | 549 (15.1%) |
| Life, Physical & Social Science | 1,222 (52.4%) | 1,111 (47.6%) |
| Community & Social Service | 6,977 (36.6%) | 12,088 (63.4%) |
| Education, Arts & Media | 1,122 (34.5%) | 2,129 (65.5%) |
| Legal Services & Support | 1,029 (49.9%) | 1,031 (50.0%) |
| Education Instruction & Library | 3,647 (32.6%) | 7,528 (67.4%) |
| Arts, Media & Entertainment | 1,179 (45.7%) | 1,400 (54.3%) |
| Health Diagnosing & Treating | 3,716 (29.9%) | 8,703 (70.1%) |
| Health Technologists | 2,916 (32.7%) | 6,011 (67.3%) |
| Total (Category) | 32,121 (49.0%) | 33,431 (51.0%) |
| Total (Overall) | 75,819 (51.7%) | 70,702 (48.2%) |
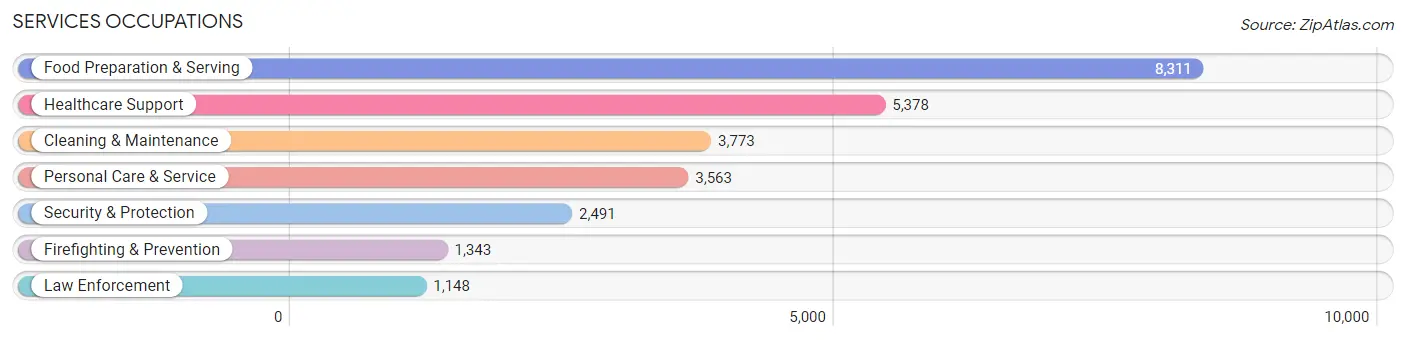
Services Occupations
The most common Services occupations in Area Code 878 are Food Preparation & Serving (8,311 | 5.7%), Healthcare Support (5,378 | 3.7%), Cleaning & Maintenance (3,773 | 2.6%), Personal Care & Service (3,563 | 2.4%), and Security & Protection (2,491 | 1.7%).
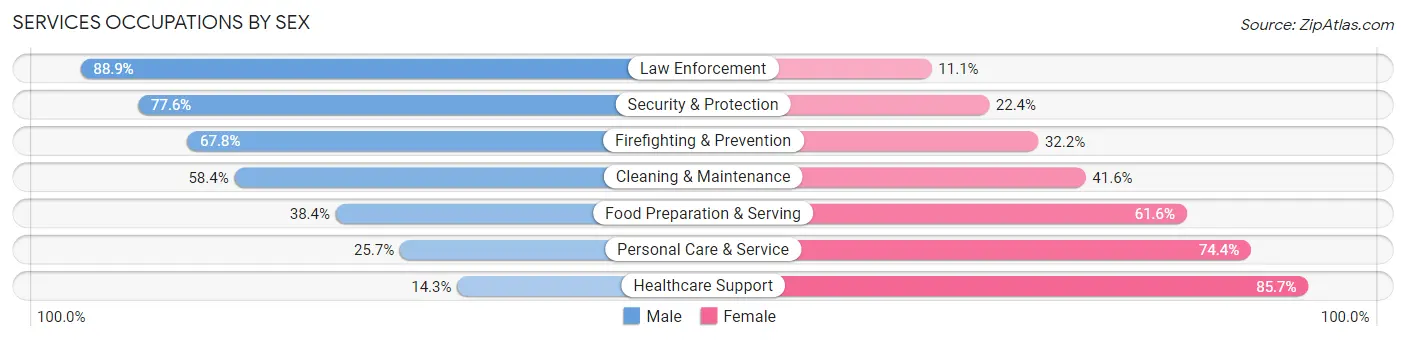
Services Occupations by Sex
Within the Services occupations in Area Code 878, the most male-oriented occupations are Law Enforcement (88.9%), Security & Protection (77.6%), and Firefighting & Prevention (67.8%), while the most female-oriented occupations are Healthcare Support (85.7%), Personal Care & Service (74.4%), and Food Preparation & Serving (61.6%).
| Occupation | Male | Female |
| Healthcare Support | 770 (14.3%) | 4,608 (85.7%) |
| Security & Protection | 1,932 (77.6%) | 559 (22.4%) |
| Firefighting & Prevention | 911 (67.8%) | 432 (32.2%) |
| Law Enforcement | 1,021 (88.9%) | 127 (11.1%) |
| Food Preparation & Serving | 3,190 (38.4%) | 5,121 (61.6%) |
| Cleaning & Maintenance | 2,205 (58.4%) | 1,568 (41.6%) |
| Personal Care & Service | 914 (25.7%) | 2,649 (74.4%) |
| Total (Category) | 9,011 (38.3%) | 14,505 (61.7%) |
| Total (Overall) | 75,819 (51.7%) | 70,702 (48.2%) |
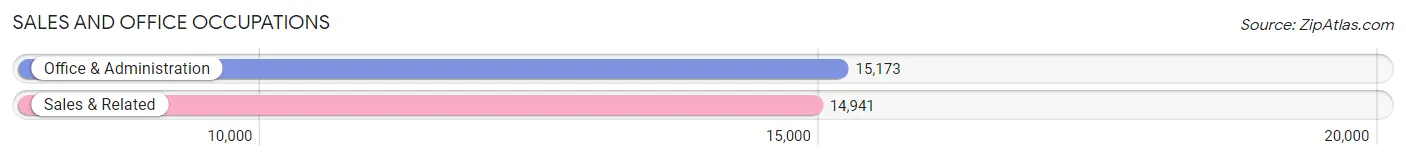
Sales and Office Occupations
The most common Sales and Office occupations in Area Code 878 are Office & Administration (15,173 | 10.4%), and Sales & Related (14,941 | 10.2%).
Sales and Office Occupations by Sex
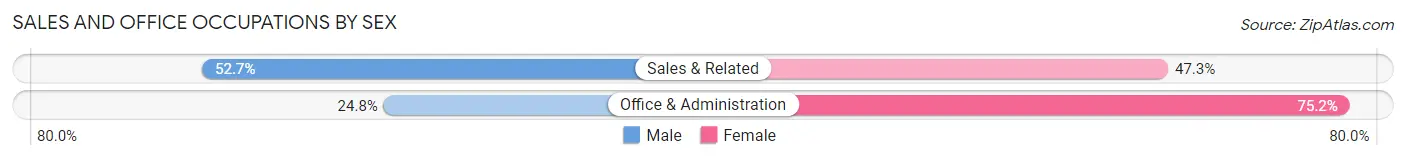
| Occupation | Male | Female |
| Sales & Related | 7,872 (52.7%) | 7,069 (47.3%) |
| Office & Administration | 3,757 (24.8%) | 11,416 (75.2%) |
| Total (Category) | 11,629 (38.6%) | 18,485 (61.4%) |
| Total (Overall) | 75,819 (51.7%) | 70,702 (48.2%) |
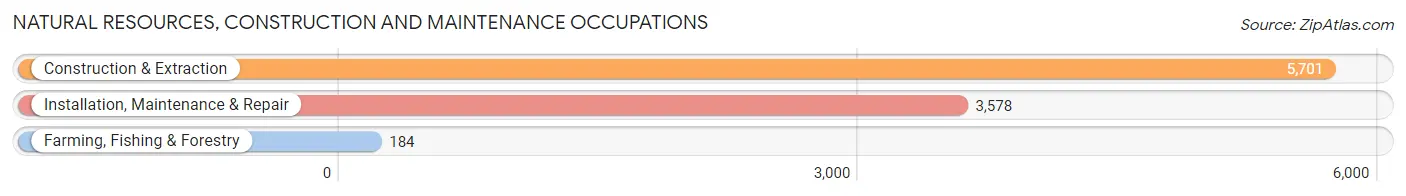
Natural Resources, Construction and Maintenance Occupations
The most common Natural Resources, Construction and Maintenance occupations in Area Code 878 are Construction & Extraction (5,701 | 3.9%), Installation, Maintenance & Repair (3,578 | 2.4%), and Farming, Fishing & Forestry (184 | 0.1%).
Natural Resources, Construction and Maintenance Occupations by Sex
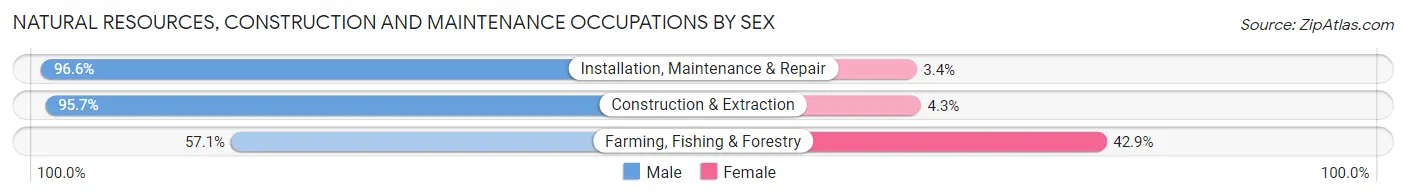
| Occupation | Male | Female |
| Farming, Fishing & Forestry | 105 (57.1%) | 79 (42.9%) |
| Construction & Extraction | 5,456 (95.7%) | 245 (4.3%) |
| Installation, Maintenance & Repair | 3,456 (96.6%) | 122 (3.4%) |
| Total (Category) | 9,017 (95.3%) | 446 (4.7%) |
| Total (Overall) | 75,819 (51.7%) | 70,702 (48.2%) |
Production, Transportation and Moving Occupations
The most common Production, Transportation and Moving occupations in Area Code 878 are Production (7,393 | 5.1%), Material Moving (5,854 | 4.0%), and Transportation (4,629 | 3.2%).
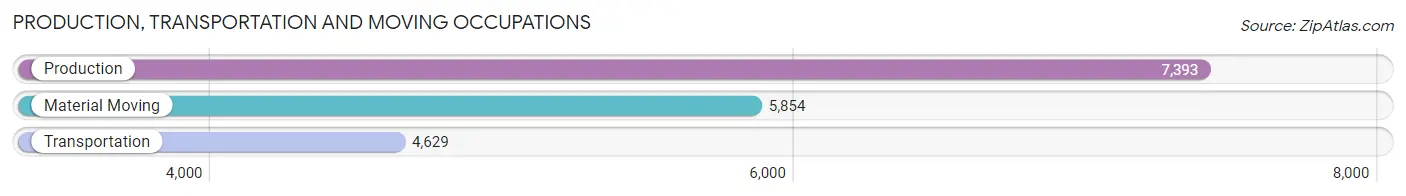
Production, Transportation and Moving Occupations by Sex
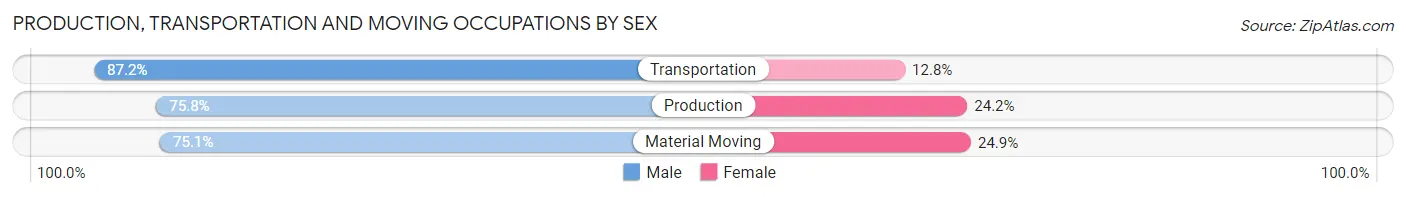
| Occupation | Male | Female |
| Production | 5,605 (75.8%) | 1,788 (24.2%) |
| Transportation | 4,038 (87.2%) | 591 (12.8%) |
| Material Moving | 4,398 (75.1%) | 1,456 (24.9%) |
| Total (Category) | 14,041 (78.5%) | 3,835 (21.4%) |
| Total (Overall) | 75,819 (51.7%) | 70,702 (48.2%) |
Employment Industries by Sex in Area Code 878
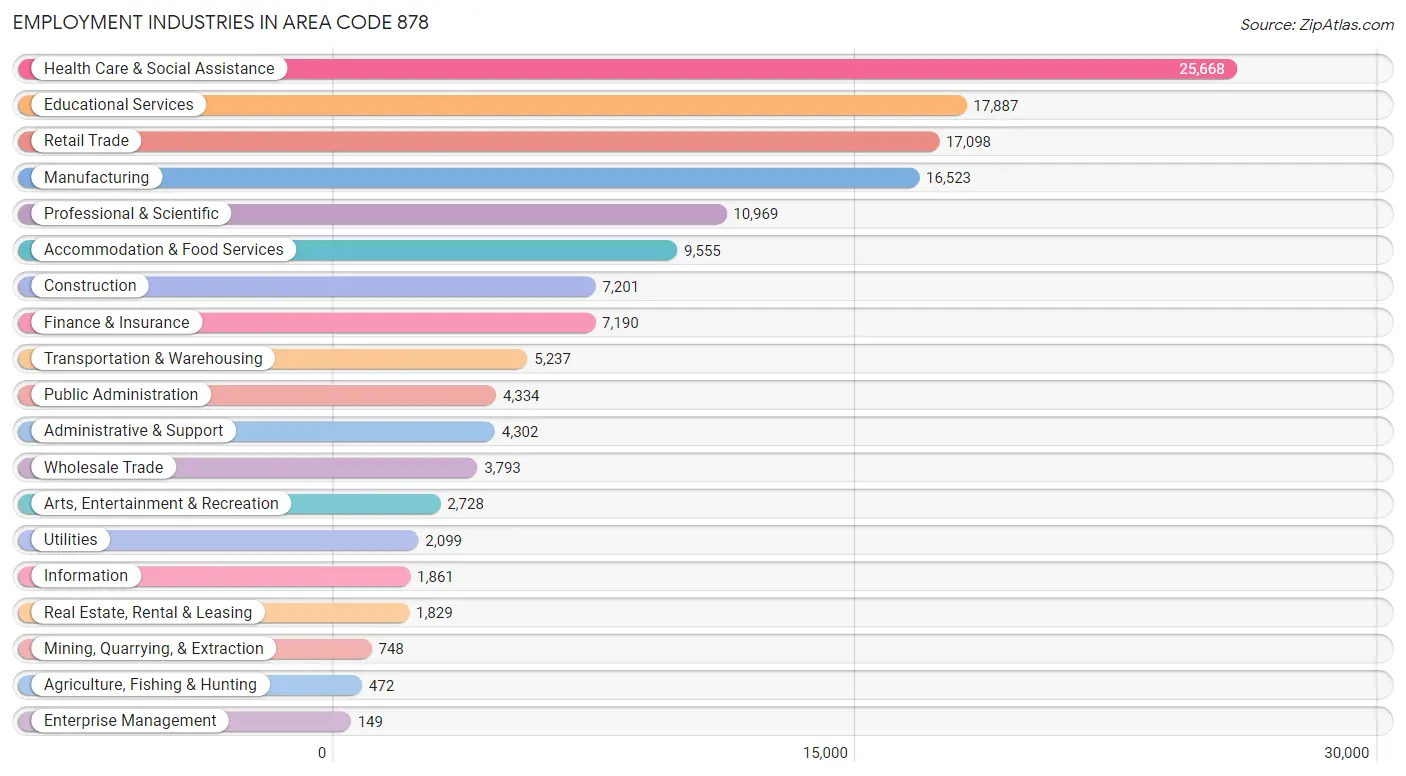
Employment Industries in Area Code 878
The major employment industries in Area Code 878 include Health Care & Social Assistance (25,668 | 17.5%), Educational Services (17,887 | 12.2%), Retail Trade (17,098 | 11.7%), Manufacturing (16,523 | 11.3%), and Professional & Scientific (10,969 | 7.5%).
Employment Industries by Sex in Area Code 878
The Area Code 878 industries that see more men than women are Construction (89.5%), Utilities (85.0%), and Mining, Quarrying, & Extraction (80.5%), whereas the industries that tend to have a higher number of women are Health Care & Social Assistance (72.9%), Educational Services (61.8%), and Accommodation & Food Services (59.6%).
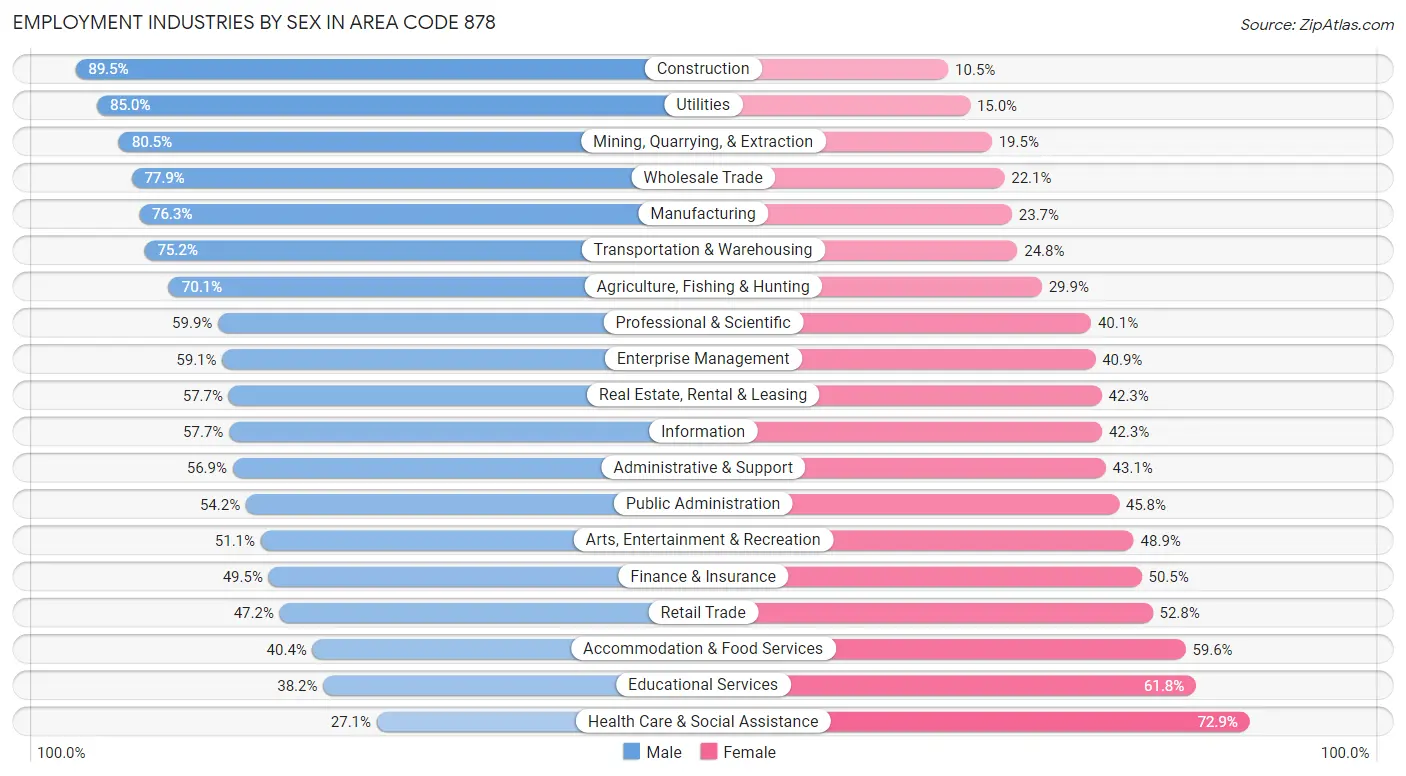
| Industry | Male | Female |
| Agriculture, Fishing & Hunting | 331 (70.1%) | 141 (29.9%) |
| Mining, Quarrying, & Extraction | 602 (80.5%) | 146 (19.5%) |
| Construction | 6,445 (89.5%) | 756 (10.5%) |
| Manufacturing | 12,609 (76.3%) | 3,914 (23.7%) |
| Wholesale Trade | 2,954 (77.9%) | 839 (22.1%) |
| Retail Trade | 8,069 (47.2%) | 9,029 (52.8%) |
| Transportation & Warehousing | 3,937 (75.2%) | 1,300 (24.8%) |
| Utilities | 1,784 (85.0%) | 315 (15.0%) |
| Information | 1,073 (57.7%) | 788 (42.3%) |
| Finance & Insurance | 3,557 (49.5%) | 3,633 (50.5%) |
| Real Estate, Rental & Leasing | 1,056 (57.7%) | 773 (42.3%) |
| Professional & Scientific | 6,575 (59.9%) | 4,394 (40.1%) |
| Enterprise Management | 88 (59.1%) | 61 (40.9%) |
| Administrative & Support | 2,448 (56.9%) | 1,854 (43.1%) |
| Educational Services | 6,829 (38.2%) | 11,058 (61.8%) |
| Health Care & Social Assistance | 6,954 (27.1%) | 18,714 (72.9%) |
| Arts, Entertainment & Recreation | 1,394 (51.1%) | 1,334 (48.9%) |
| Accommodation & Food Services | 3,858 (40.4%) | 5,697 (59.6%) |
| Public Administration | 2,348 (54.2%) | 1,986 (45.8%) |
| Total | 75,819 (51.7%) | 70,702 (48.2%) |
Education in Area Code 878
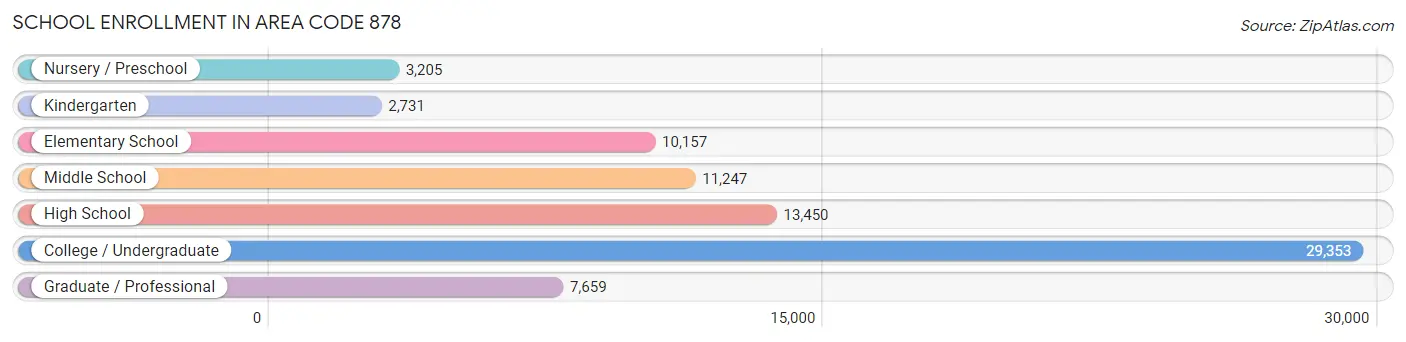
School Enrollment in Area Code 878
The most common levels of schooling among the 77,802 students in Area Code 878 are college / undergraduate (29,353 | 37.7%), high school (13,450 | 17.3%), and middle school (11,247 | 14.5%).
| School Level | # Students | % Students |
| Nursery / Preschool | 3,205 | 4.1% |
| Kindergarten | 2,731 | 3.5% |
| Elementary School | 10,157 | 13.1% |
| Middle School | 11,247 | 14.5% |
| High School | 13,450 | 17.3% |
| College / Undergraduate | 29,353 | 37.7% |
| Graduate / Professional | 7,659 | 9.8% |
| Total | 77,802 | 100.0% |
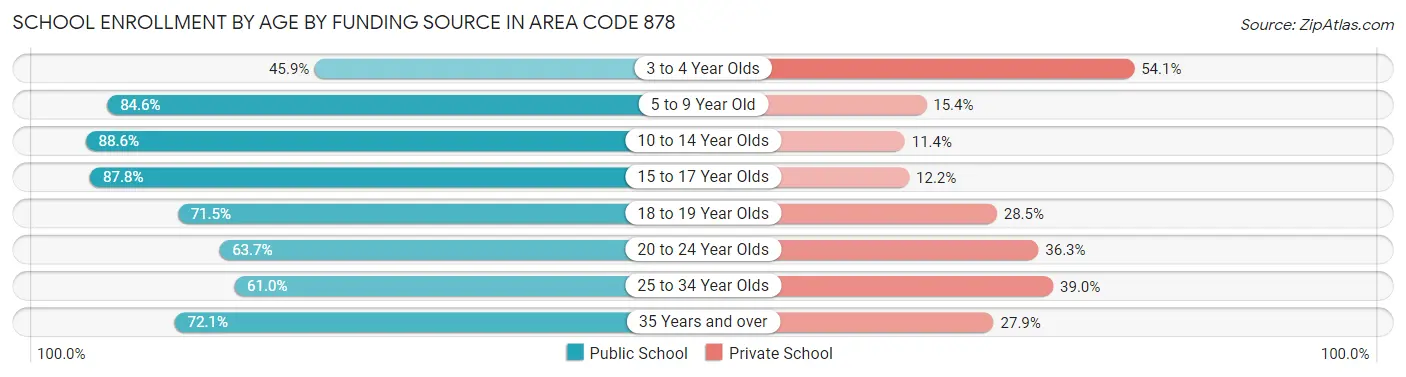
School Enrollment by Age by Funding Source in Area Code 878
Out of a total of 77,802 students who are enrolled in schools in Area Code 878, 18,992 (24.4%) attend a private institution, while the remaining 58,810 (75.6%) are enrolled in public schools. The age group of 3 to 4 year olds has the highest likelihood of being enrolled in private schools, with 1,229 (54.1% in the age bracket) enrolled. Conversely, the age group of 10 to 14 year olds has the lowest likelihood of being enrolled in a private school, with 12,614 (88.6% in the age bracket) attending a public institution.
| Age Bracket | Public School | Private School |
| 3 to 4 Year Olds | 1,042 (45.9%) | 1,229 (54.1%) |
| 5 to 9 Year Old | 10,190 (84.6%) | 1,853 (15.4%) |
| 10 to 14 Year Olds | 12,614 (88.6%) | 1,620 (11.4%) |
| 15 to 17 Year Olds | 8,584 (87.8%) | 1,192 (12.2%) |
| 18 to 19 Year Olds | 10,492 (71.5%) | 4,187 (28.5%) |
| 20 to 24 Year Olds | 10,776 (63.7%) | 6,131 (36.3%) |
| 25 to 34 Year Olds | 3,237 (61.0%) | 2,070 (39.0%) |
| 35 Years and over | 1,863 (72.1%) | 722 (27.9%) |
| Total | 58,810 (75.6%) | 18,992 (24.4%) |
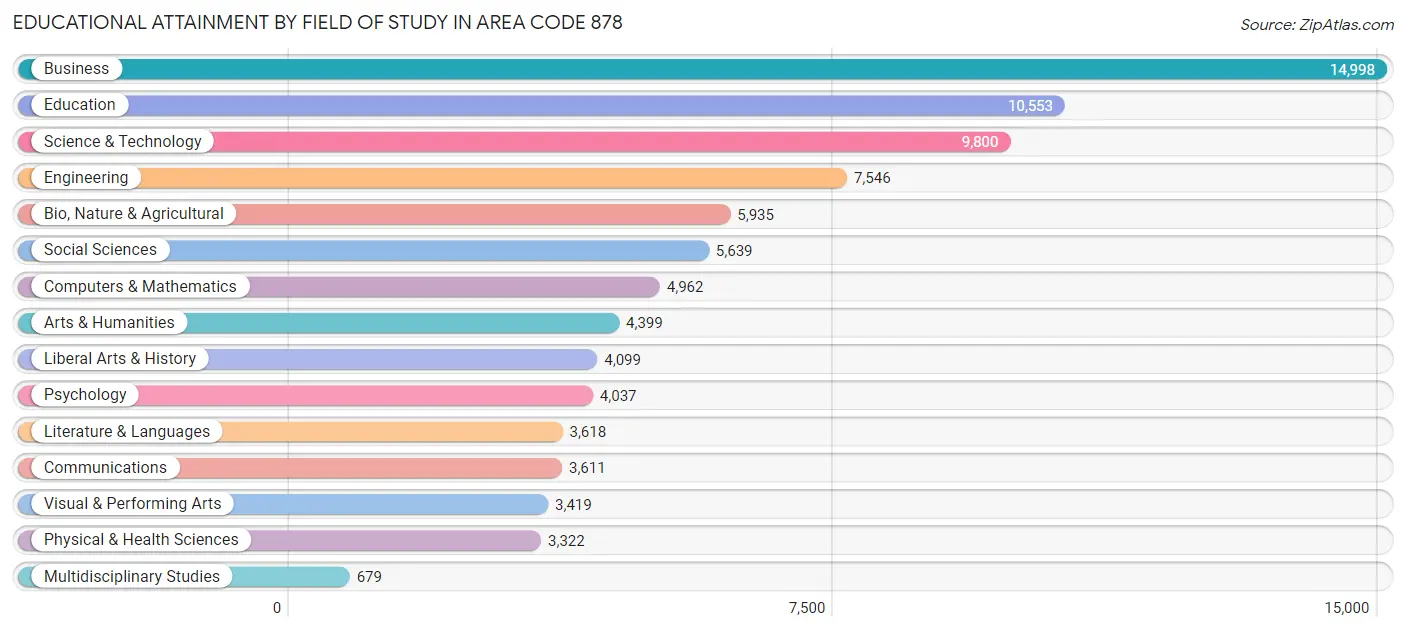
Educational Attainment by Field of Study in Area Code 878
Business (14,998 | 17.3%), education (10,553 | 12.2%), science & technology (9,800 | 11.3%), engineering (7,546 | 8.7%), and bio, nature & agricultural (5,935 | 6.9%) are the most common fields of study among 86,617 individuals in Area Code 878 who have obtained a bachelor's degree or higher.
| Field of Study | # Graduates | % Graduates |
| Computers & Mathematics | 4,962 | 5.7% |
| Bio, Nature & Agricultural | 5,935 | 6.9% |
| Physical & Health Sciences | 3,322 | 3.8% |
| Psychology | 4,037 | 4.7% |
| Social Sciences | 5,639 | 6.5% |
| Engineering | 7,546 | 8.7% |
| Multidisciplinary Studies | 679 | 0.8% |
| Science & Technology | 9,800 | 11.3% |
| Business | 14,998 | 17.3% |
| Education | 10,553 | 12.2% |
| Literature & Languages | 3,618 | 4.2% |
| Liberal Arts & History | 4,099 | 4.7% |
| Visual & Performing Arts | 3,419 | 4.0% |
| Communications | 3,611 | 4.2% |
| Arts & Humanities | 4,399 | 5.1% |
| Total | 86,617 | 100.0% |
Transportation & Commute in Area Code 878
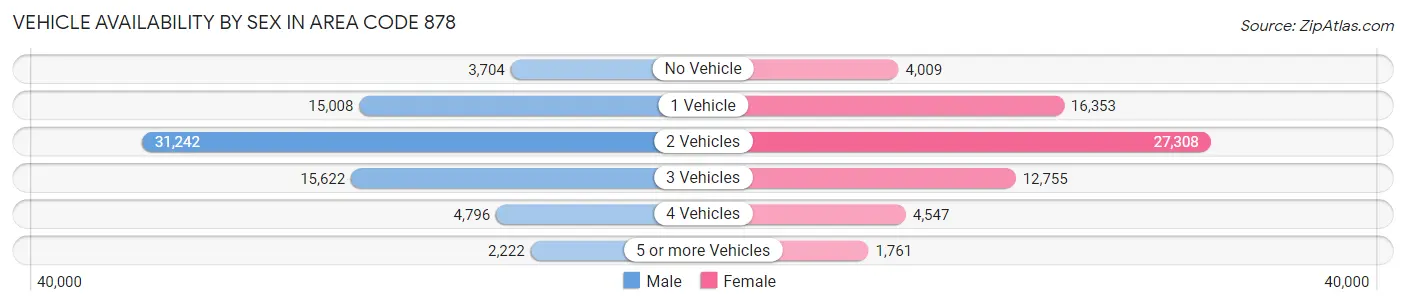
Vehicle Availability by Sex in Area Code 878
The most prevalent vehicle ownership categories in Area Code 878 are males with 2 vehicles (31,242, accounting for 43.0%) and females with 2 vehicles (27,308, making up 46.8%).
| Vehicles Available | Male | Female |
| No Vehicle | 3,704 (5.1%) | 4,009 (6.0%) |
| 1 Vehicle | 15,008 (20.7%) | 16,353 (24.5%) |
| 2 Vehicles | 31,242 (43.0%) | 27,308 (40.9%) |
| 3 Vehicles | 15,622 (21.5%) | 12,755 (19.1%) |
| 4 Vehicles | 4,796 (6.6%) | 4,547 (6.8%) |
| 5 or more Vehicles | 2,222 (3.1%) | 1,761 (2.6%) |
| Total | 72,594 (100.0%) | 66,733 (100.0%) |
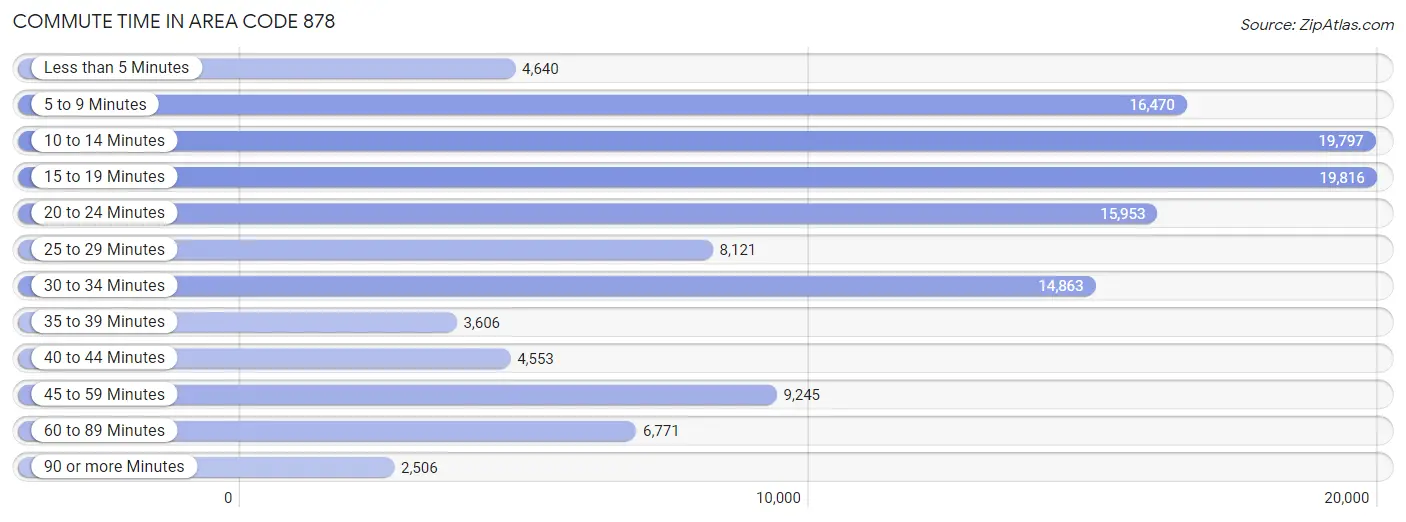
Commute Time in Area Code 878
The most frequently occuring commute durations in Area Code 878 are 15 to 19 minutes (19,816 commuters, 15.7%), 10 to 14 minutes (19,797 commuters, 15.7%), and 5 to 9 minutes (16,470 commuters, 13.0%).
| Commute Time | # Commuters | % Commuters |
| Less than 5 Minutes | 4,640 | 3.7% |
| 5 to 9 Minutes | 16,470 | 13.0% |
| 10 to 14 Minutes | 19,797 | 15.7% |
| 15 to 19 Minutes | 19,816 | 15.7% |
| 20 to 24 Minutes | 15,953 | 12.6% |
| 25 to 29 Minutes | 8,121 | 6.4% |
| 30 to 34 Minutes | 14,863 | 11.8% |
| 35 to 39 Minutes | 3,606 | 2.9% |
| 40 to 44 Minutes | 4,553 | 3.6% |
| 45 to 59 Minutes | 9,245 | 7.3% |
| 60 to 89 Minutes | 6,771 | 5.4% |
| 90 or more Minutes | 2,506 | 2.0% |
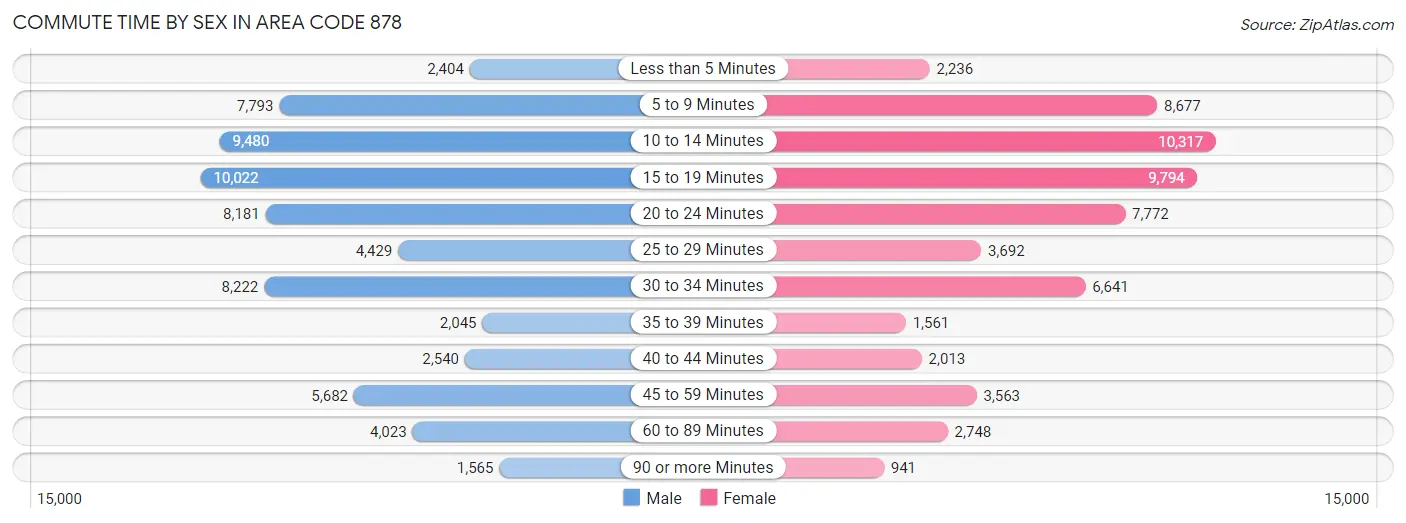
Commute Time by Sex in Area Code 878
The most common commute times in Area Code 878 are 15 to 19 minutes (10,022 commuters, 15.1%) for males and 10 to 14 minutes (10,317 commuters, 17.2%) for females.
| Commute Time | Male | Female |
| Less than 5 Minutes | 2,404 (3.6%) | 2,236 (3.7%) |
| 5 to 9 Minutes | 7,793 (11.7%) | 8,677 (14.5%) |
| 10 to 14 Minutes | 9,480 (14.3%) | 10,317 (17.2%) |
| 15 to 19 Minutes | 10,022 (15.1%) | 9,794 (16.3%) |
| 20 to 24 Minutes | 8,181 (12.3%) | 7,772 (13.0%) |
| 25 to 29 Minutes | 4,429 (6.7%) | 3,692 (6.2%) |
| 30 to 34 Minutes | 8,222 (12.4%) | 6,641 (11.1%) |
| 35 to 39 Minutes | 2,045 (3.1%) | 1,561 (2.6%) |
| 40 to 44 Minutes | 2,540 (3.8%) | 2,013 (3.4%) |
| 45 to 59 Minutes | 5,682 (8.6%) | 3,563 (5.9%) |
| 60 to 89 Minutes | 4,023 (6.1%) | 2,748 (4.6%) |
| 90 or more Minutes | 1,565 (2.4%) | 941 (1.6%) |
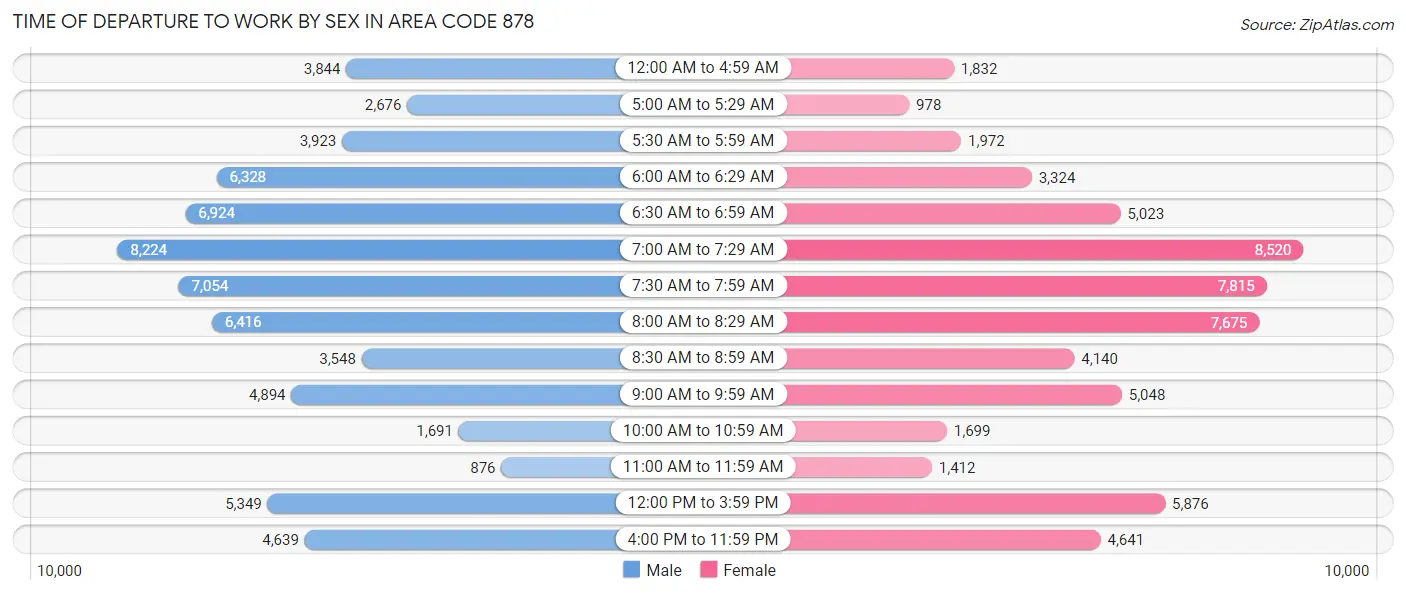
Time of Departure to Work by Sex in Area Code 878
The most frequent times of departure to work in Area Code 878 are 7:00 AM to 7:29 AM (8,224, 12.4%) for males and 7:00 AM to 7:29 AM (8,520, 14.2%) for females.
| Time of Departure | Male | Female |
| 12:00 AM to 4:59 AM | 3,844 (5.8%) | 1,832 (3.1%) |
| 5:00 AM to 5:29 AM | 2,676 (4.0%) | 978 (1.6%) |
| 5:30 AM to 5:59 AM | 3,923 (5.9%) | 1,972 (3.3%) |
| 6:00 AM to 6:29 AM | 6,328 (9.5%) | 3,324 (5.5%) |
| 6:30 AM to 6:59 AM | 6,924 (10.4%) | 5,023 (8.4%) |
| 7:00 AM to 7:29 AM | 8,224 (12.4%) | 8,520 (14.2%) |
| 7:30 AM to 7:59 AM | 7,054 (10.6%) | 7,815 (13.0%) |
| 8:00 AM to 8:29 AM | 6,416 (9.7%) | 7,675 (12.8%) |
| 8:30 AM to 8:59 AM | 3,548 (5.3%) | 4,140 (6.9%) |
| 9:00 AM to 9:59 AM | 4,894 (7.4%) | 5,048 (8.4%) |
| 10:00 AM to 10:59 AM | 1,691 (2.5%) | 1,699 (2.8%) |
| 11:00 AM to 11:59 AM | 876 (1.3%) | 1,412 (2.4%) |
| 12:00 PM to 3:59 PM | 5,349 (8.1%) | 5,876 (9.8%) |
| 4:00 PM to 11:59 PM | 4,639 (7.0%) | 4,641 (7.7%) |
| Total | 66,386 (100.0%) | 59,955 (100.0%) |
Housing Occupancy in Area Code 878
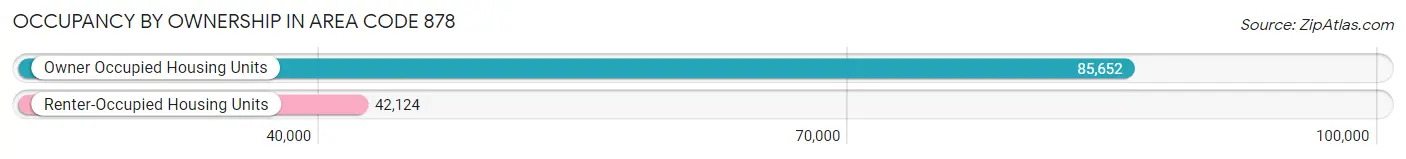
Occupancy by Ownership in Area Code 878
Of the total 127,776 dwellings in Area Code 878, owner-occupied units account for 85,652 (67.0%), while renter-occupied units make up 42,124 (33.0%).
| Occupancy | # Housing Units | % Housing Units |
| Owner Occupied Housing Units | 85,652 | 67.0% |
| Renter-Occupied Housing Units | 42,124 | 33.0% |
| Total Occupied Housing Units | 127,776 | 100.0% |
Occupancy by Household Size in Area Code 878
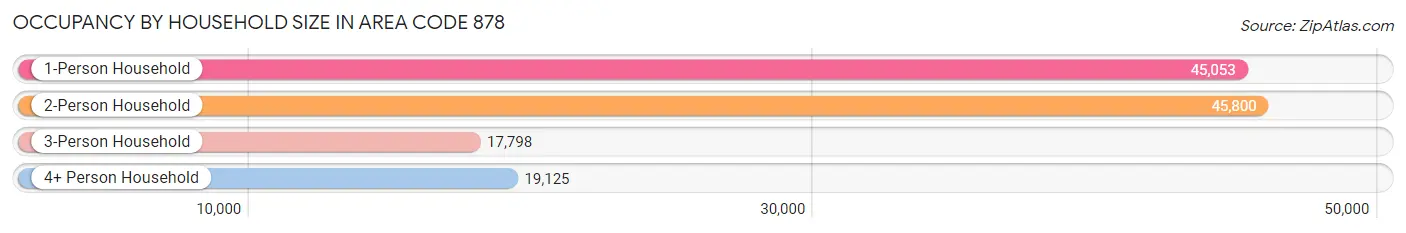
| Household Size | # Housing Units | % Housing Units |
| 1-Person Household | 45,053 | 35.3% |
| 2-Person Household | 45,800 | 35.8% |
| 3-Person Household | 17,798 | 13.9% |
| 4+ Person Household | 19,125 | 15.0% |
| Total Housing Units | 127,776 | 100.0% |
Occupancy by Ownership by Household Size in Area Code 878
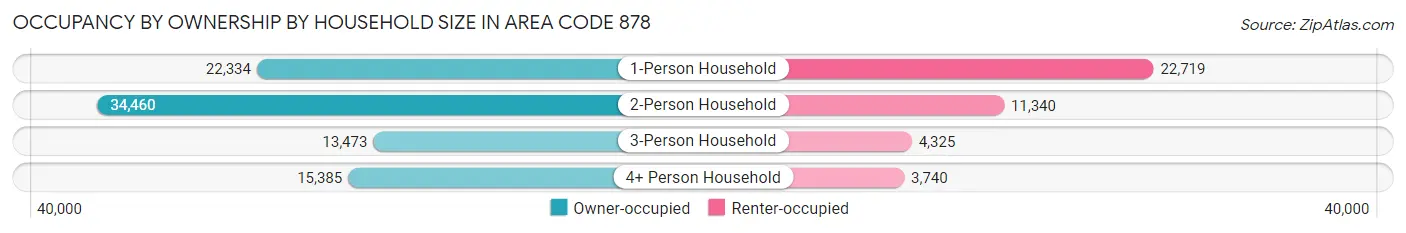
| Household Size | Owner-occupied | Renter-occupied |
| 1-Person Household | 22,334 (49.6%) | 22,719 (50.4%) |
| 2-Person Household | 34,460 (75.2%) | 11,340 (24.8%) |
| 3-Person Household | 13,473 (75.7%) | 4,325 (24.3%) |
| 4+ Person Household | 15,385 (80.4%) | 3,740 (19.6%) |
| Total Housing Units | 85,652 (67.0%) | 42,124 (33.0%) |
Occupancy by Educational Attainment in Area Code 878
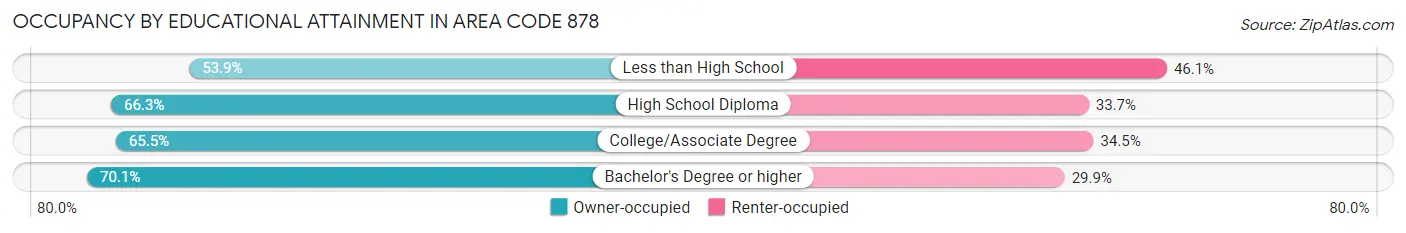
| Household Size | Owner-occupied | Renter-occupied |
| Less than High School | 3,127 (53.9%) | 2,677 (46.1%) |
| High School Diploma | 24,013 (66.3%) | 12,215 (33.7%) |
| College/Associate Degree | 22,669 (65.5%) | 11,937 (34.5%) |
| Bachelor's Degree or higher | 35,843 (70.1%) | 15,295 (29.9%) |
Occupancy by Age of Householder in Area Code 878
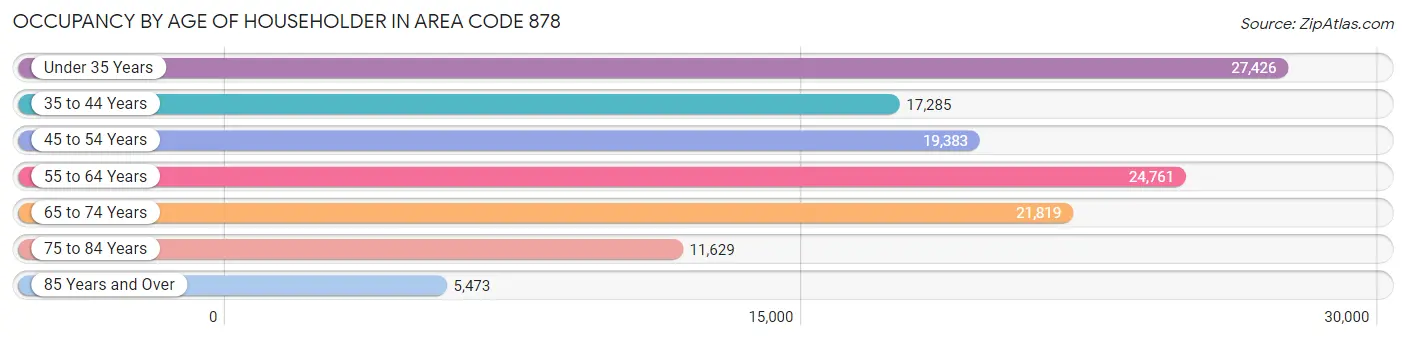
| Age Bracket | # Households | % Households |
| Under 35 Years | 27,426 | 21.5% |
| 35 to 44 Years | 17,285 | 13.5% |
| 45 to 54 Years | 19,383 | 15.2% |
| 55 to 64 Years | 24,761 | 19.4% |
| 65 to 74 Years | 21,819 | 17.1% |
| 75 to 84 Years | 11,629 | 9.1% |
| 85 Years and Over | 5,473 | 4.3% |
| Total | 127,776 | 100.0% |
Housing Finances in Area Code 878
Median Income by Occupancy in Area Code 878
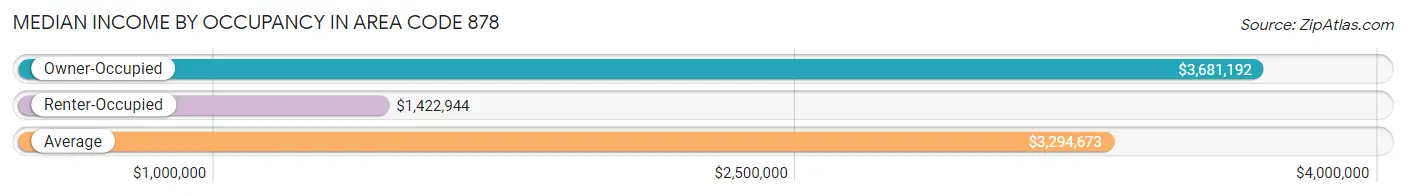
| Occupancy Type | # Households | Median Income |
| Owner-Occupied | 85,652 (67.0%) | $3,681,192 |
| Renter-Occupied | 42,124 (33.0%) | $1,422,944 |
| Average | 127,776 (100.0%) | $3,294,673 |
Occupancy by Householder Income Bracket in Area Code 878
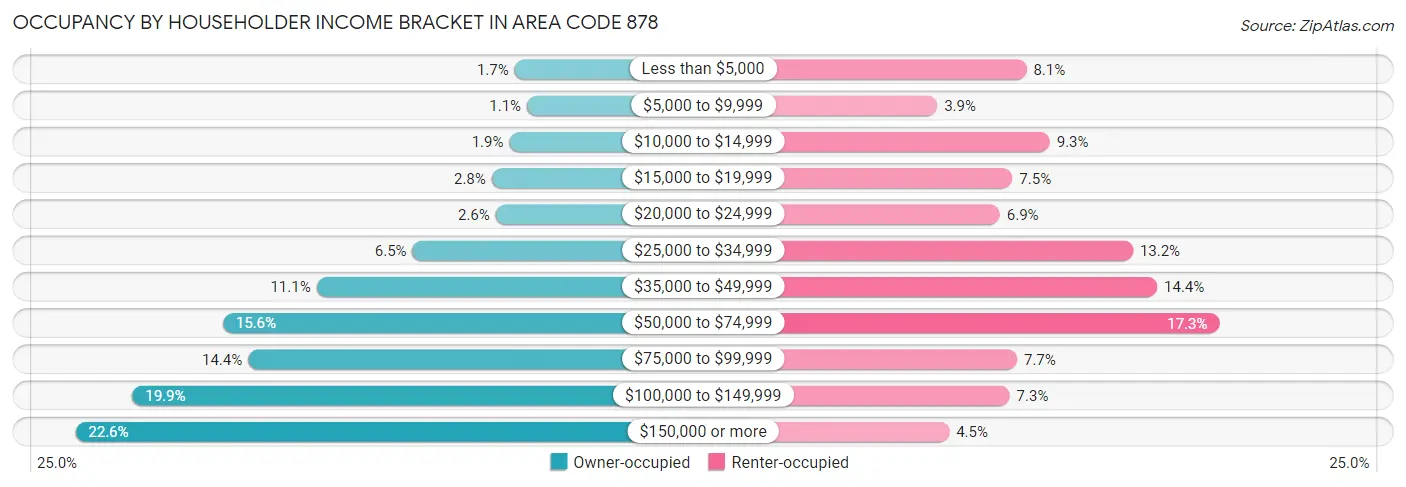
| Income Bracket | Owner-occupied | Renter-occupied |
| Less than $5,000 | 1,431 (1.7%) | 3,428 (8.1%) |
| $5,000 to $9,999 | 927 (1.1%) | 1,638 (3.9%) |
| $10,000 to $14,999 | 1,642 (1.9%) | 3,897 (9.2%) |
| $15,000 to $19,999 | 2,366 (2.8%) | 3,148 (7.5%) |
| $20,000 to $24,999 | 2,198 (2.6%) | 2,894 (6.9%) |
| $25,000 to $34,999 | 5,596 (6.5%) | 5,564 (13.2%) |
| $35,000 to $49,999 | 9,506 (11.1%) | 6,048 (14.4%) |
| $50,000 to $74,999 | 13,325 (15.6%) | 7,296 (17.3%) |
| $75,000 to $99,999 | 12,300 (14.4%) | 3,239 (7.7%) |
| $100,000 to $149,999 | 17,021 (19.9%) | 3,094 (7.3%) |
| $150,000 or more | 19,340 (22.6%) | 1,878 (4.5%) |
| Total | 85,652 (100.0%) | 42,124 (100.0%) |
Monthly Housing Cost Tiers in Area Code 878
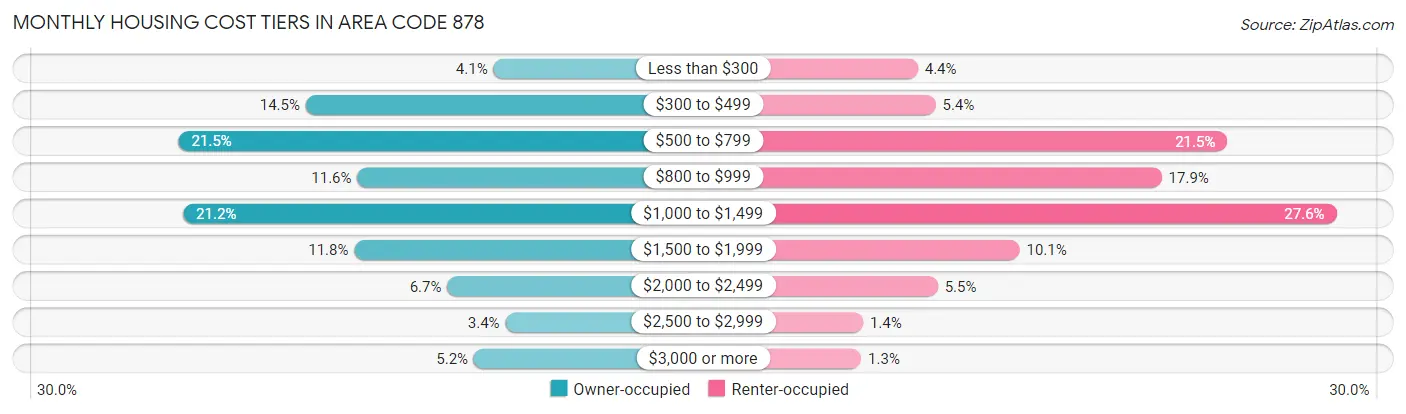
| Monthly Cost | Owner-occupied | Renter-occupied |
| Less than $300 | 3,511 (4.1%) | 1,870 (4.4%) |
| $300 to $499 | 12,394 (14.5%) | 2,283 (5.4%) |
| $500 to $799 | 18,418 (21.5%) | 9,068 (21.5%) |
| $800 to $999 | 9,953 (11.6%) | 7,544 (17.9%) |
| $1,000 to $1,499 | 18,193 (21.2%) | 11,608 (27.6%) |
| $1,500 to $1,999 | 10,099 (11.8%) | 4,236 (10.1%) |
| $2,000 to $2,499 | 5,696 (6.7%) | 2,333 (5.5%) |
| $2,500 to $2,999 | 2,948 (3.4%) | 593 (1.4%) |
| $3,000 or more | 4,440 (5.2%) | 551 (1.3%) |
| Total | 85,652 (100.0%) | 42,124 (100.0%) |
Physical Housing Characteristics in Area Code 878
Housing Structures in Area Code 878
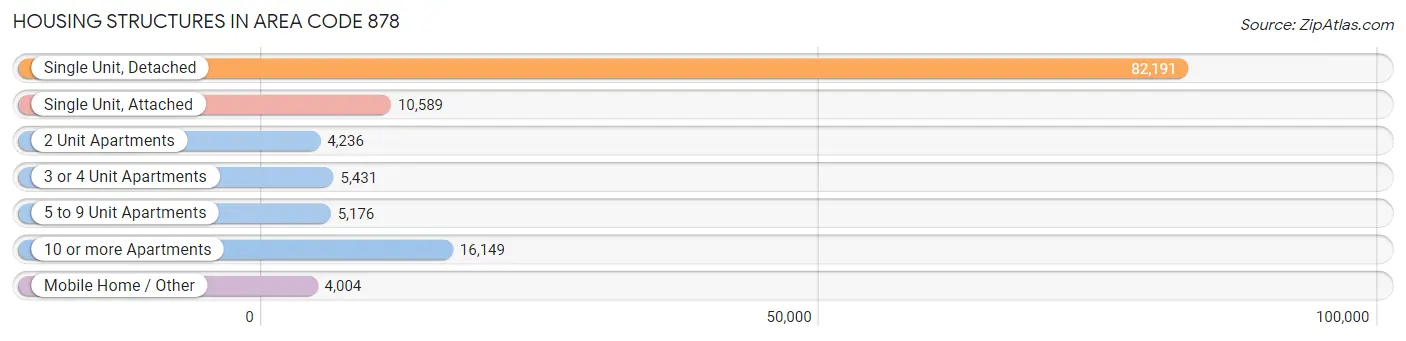
| Structure Type | # Housing Units | % Housing Units |
| Single Unit, Detached | 82,191 | 64.3% |
| Single Unit, Attached | 10,589 | 8.3% |
| 2 Unit Apartments | 4,236 | 3.3% |
| 3 or 4 Unit Apartments | 5,431 | 4.3% |
| 5 to 9 Unit Apartments | 5,176 | 4.1% |
| 10 or more Apartments | 16,149 | 12.6% |
| Mobile Home / Other | 4,004 | 3.1% |
| Total | 127,776 | 100.0% |
Housing Structures by Occupancy in Area Code 878
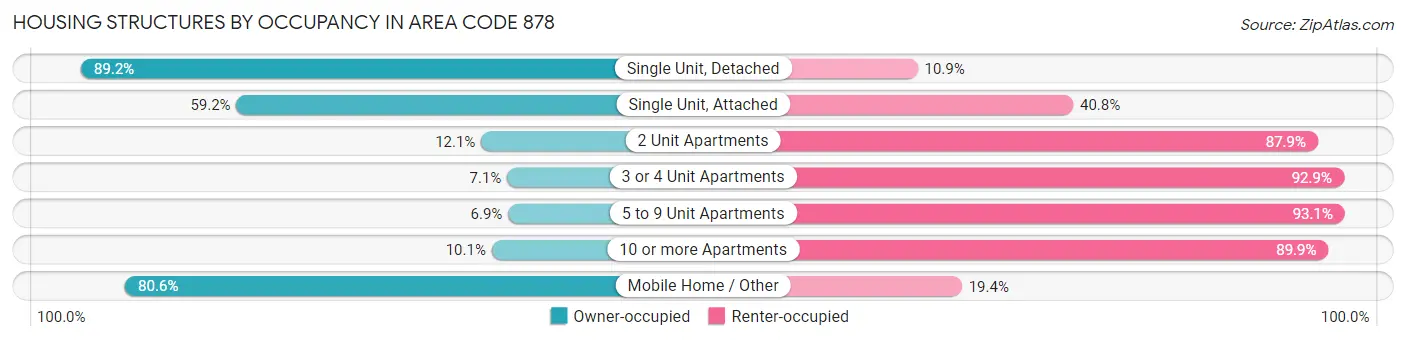
| Structure Type | Owner-occupied | Renter-occupied |
| Single Unit, Detached | 73,274 (89.1%) | 8,917 (10.8%) |
| Single Unit, Attached | 6,270 (59.2%) | 4,319 (40.8%) |
| 2 Unit Apartments | 512 (12.1%) | 3,724 (87.9%) |
| 3 or 4 Unit Apartments | 385 (7.1%) | 5,046 (92.9%) |
| 5 to 9 Unit Apartments | 357 (6.9%) | 4,819 (93.1%) |
| 10 or more Apartments | 1,625 (10.1%) | 14,524 (89.9%) |
| Mobile Home / Other | 3,229 (80.6%) | 775 (19.4%) |
| Total | 85,652 (67.0%) | 42,124 (33.0%) |
Housing Structures by Number of Rooms in Area Code 878
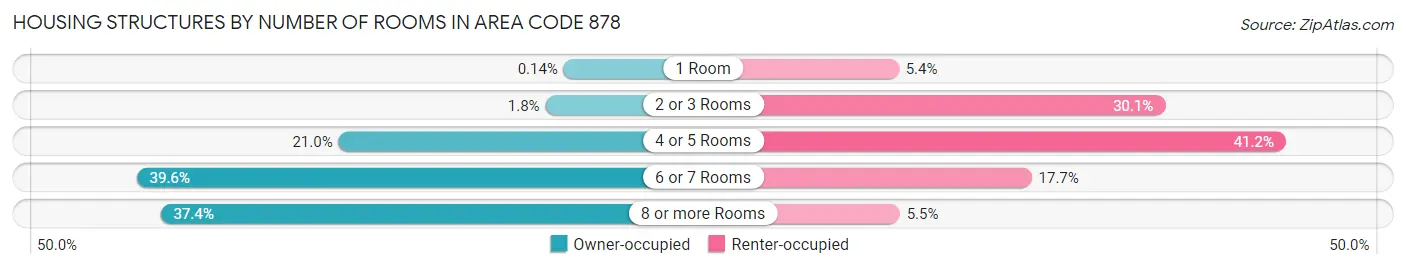
| Number of Rooms | Owner-occupied | Renter-occupied |
| 1 Room | 117 (0.1%) | 2,290 (5.4%) |
| 2 or 3 Rooms | 1,565 (1.8%) | 12,671 (30.1%) |
| 4 or 5 Rooms | 17,960 (21.0%) | 17,367 (41.2%) |
| 6 or 7 Rooms | 33,954 (39.6%) | 7,467 (17.7%) |
| 8 or more Rooms | 32,056 (37.4%) | 2,329 (5.5%) |
| Total | 85,652 (100.0%) | 42,124 (100.0%) |
Housing Structure by Heating Type in Area Code 878
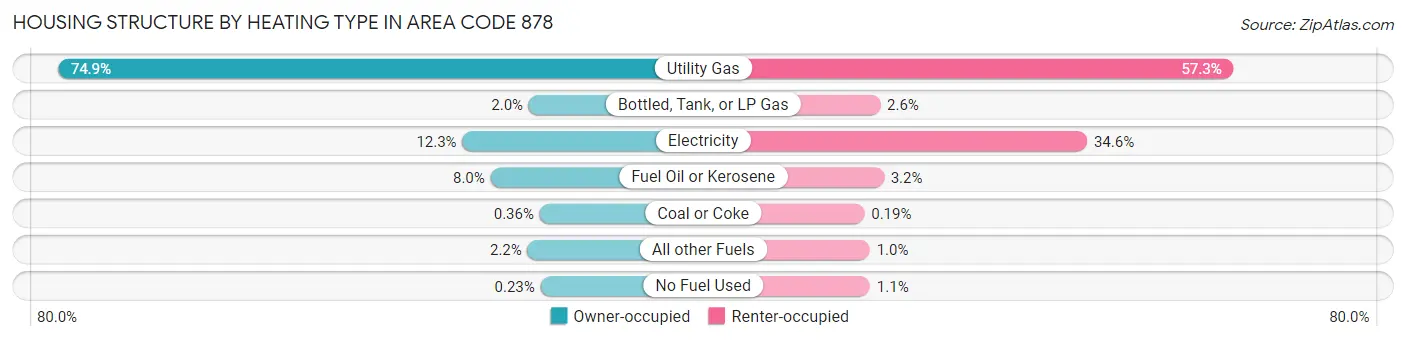
| Heating Type | Owner-occupied | Renter-occupied |
| Utility Gas | 64,116 (74.9%) | 24,129 (57.3%) |
| Bottled, Tank, or LP Gas | 1,748 (2.0%) | 1,107 (2.6%) |
| Electricity | 10,547 (12.3%) | 14,582 (34.6%) |
| Fuel Oil or Kerosene | 6,814 (8.0%) | 1,344 (3.2%) |
| Coal or Coke | 308 (0.4%) | 82 (0.2%) |
| All other Fuels | 1,919 (2.2%) | 434 (1.0%) |
| No Fuel Used | 200 (0.2%) | 446 (1.1%) |
| Total | 85,652 (100.0%) | 42,124 (100.0%) |
Household Vehicle Usage in Area Code 878
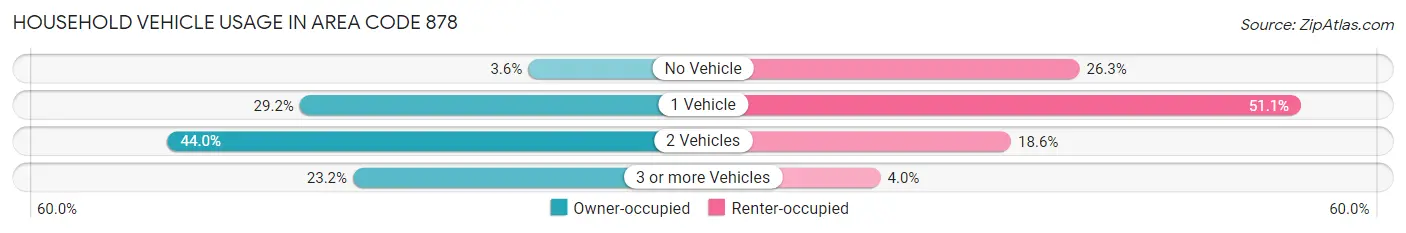
| Vehicles per Household | Owner-occupied | Renter-occupied |
| No Vehicle | 3,087 (3.6%) | 11,075 (26.3%) |
| 1 Vehicle | 25,006 (29.2%) | 21,517 (51.1%) |
| 2 Vehicles | 37,665 (44.0%) | 7,845 (18.6%) |
| 3 or more Vehicles | 19,894 (23.2%) | 1,687 (4.0%) |
| Total | 85,652 (100.0%) | 42,124 (100.0%) |
Real Estate & Mortgages in Area Code 878
Real Estate and Mortgage Overview in Area Code 878
| Characteristic | Without Mortgage | With Mortgage |
| Housing Units | 38,905 | 46,747 |
| Median Property Value | $6,017,500 | $8,440,100 |
| Median Household Income | $2,453,518 | $13,595 |
| Monthly Housing Costs | $22,088 | $4,324 |
| Real Estate Taxes | $85,620 | $711 |
Property Value by Mortgage Status in Area Code 878
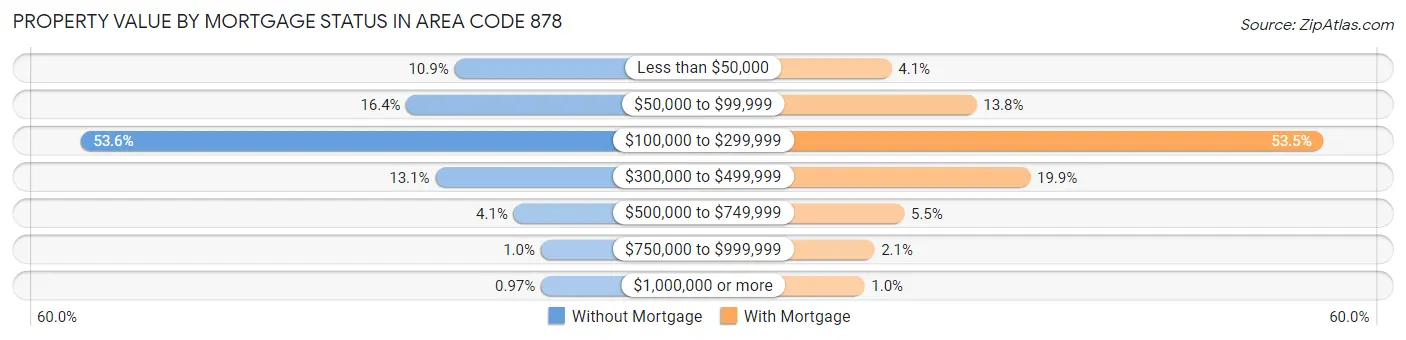
| Property Value | Without Mortgage | With Mortgage |
| Less than $50,000 | 4,228 (10.9%) | 1,914 (4.1%) |
| $50,000 to $99,999 | 6,366 (16.4%) | 6,453 (13.8%) |
| $100,000 to $299,999 | 20,865 (53.6%) | 25,000 (53.5%) |
| $300,000 to $499,999 | 5,080 (13.1%) | 9,322 (19.9%) |
| $500,000 to $749,999 | 1,595 (4.1%) | 2,588 (5.5%) |
| $750,000 to $999,999 | 394 (1.0%) | 996 (2.1%) |
| $1,000,000 or more | 377 (1.0%) | 474 (1.0%) |
| Total | 38,905 (100.0%) | 46,747 (100.0%) |
Household Income by Mortgage Status in Area Code 878
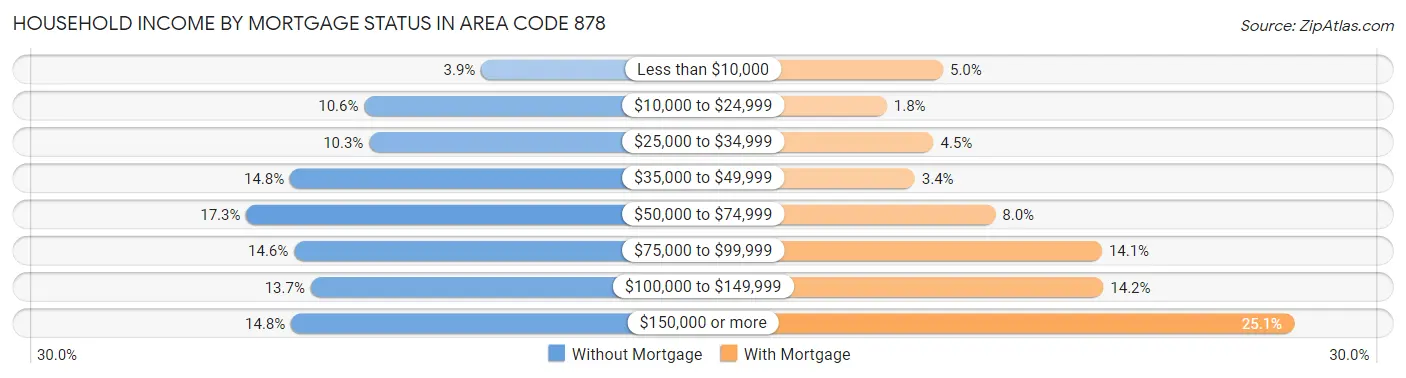
| Household Income | Without Mortgage | With Mortgage |
| Less than $10,000 | 1,522 (3.9%) | 2,338 (5.0%) |
| $10,000 to $24,999 | 4,121 (10.6%) | 836 (1.8%) |
| $25,000 to $34,999 | 4,013 (10.3%) | 2,085 (4.5%) |
| $35,000 to $49,999 | 5,771 (14.8%) | 1,583 (3.4%) |
| $50,000 to $74,999 | 6,744 (17.3%) | 3,735 (8.0%) |
| $75,000 to $99,999 | 5,679 (14.6%) | 6,581 (14.1%) |
| $100,000 to $149,999 | 5,310 (13.7%) | 6,621 (14.2%) |
| $150,000 or more | 5,745 (14.8%) | 11,711 (25.1%) |
| Total | 38,905 (100.0%) | 46,747 (100.0%) |
Property Value to Household Income Ratio in Area Code 878
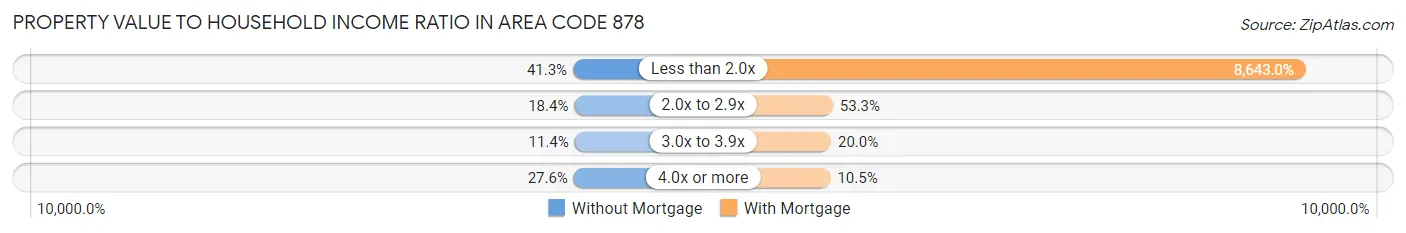
| Value-to-Income Ratio | Without Mortgage | With Mortgage |
| Less than 2.0x | 16,049 (41.2%) | 4,040,358 (8,643.0%) |
| 2.0x to 2.9x | 7,158 (18.4%) | 24,919 (53.3%) |
| 3.0x to 3.9x | 4,438 (11.4%) | 9,341 (20.0%) |
| 4.0x or more | 10,719 (27.6%) | 4,916 (10.5%) |
| Total | 38,905 (100.0%) | 46,747 (100.0%) |
Real Estate Taxes by Mortgage Status in Area Code 878
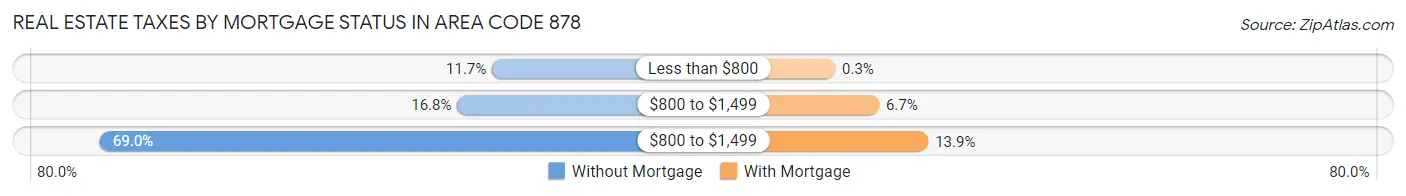
| Property Taxes | Without Mortgage | With Mortgage |
| Less than $800 | 4,548 (11.7%) | 138 (0.3%) |
| $800 to $1,499 | 6,525 (16.8%) | 3,136 (6.7%) |
| $800 to $1,499 | 26,839 (69.0%) | 6,502 (13.9%) |
| Total | 38,905 (100.0%) | 46,747 (100.0%) |
Health & Disability in Area Code 878
Health Insurance Coverage by Age in Area Code 878
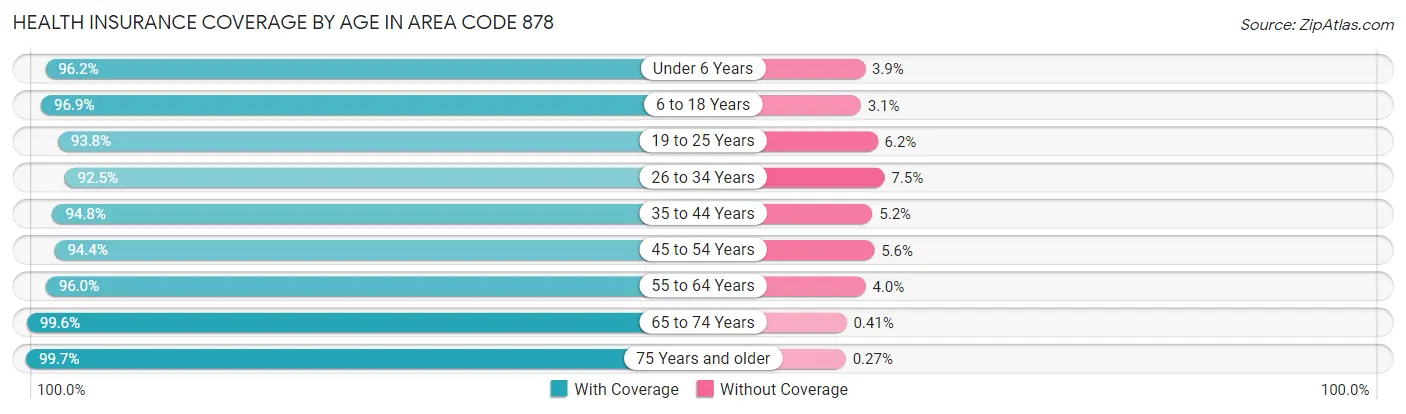
| Age Bracket | With Coverage | Without Coverage |
| Under 6 Years | 14,112 (96.2%) | 565 (3.8%) |
| 6 to 18 Years | 41,595 (96.9%) | 1,323 (3.1%) |
| 19 to 25 Years | 36,577 (93.8%) | 2,423 (6.2%) |
| 26 to 34 Years | 32,352 (92.5%) | 2,615 (7.5%) |
| 35 to 44 Years | 29,533 (94.8%) | 1,629 (5.2%) |
| 45 to 54 Years | 32,854 (94.4%) | 1,943 (5.6%) |
| 55 to 64 Years | 39,120 (96.0%) | 1,611 (4.0%) |
| 65 to 74 Years | 34,321 (99.6%) | 141 (0.4%) |
| 75 Years and older | 24,661 (99.7%) | 68 (0.3%) |
| Total | 285,125 (95.9%) | 12,318 (4.1%) |
Health Insurance Coverage by Citizenship Status in Area Code 878
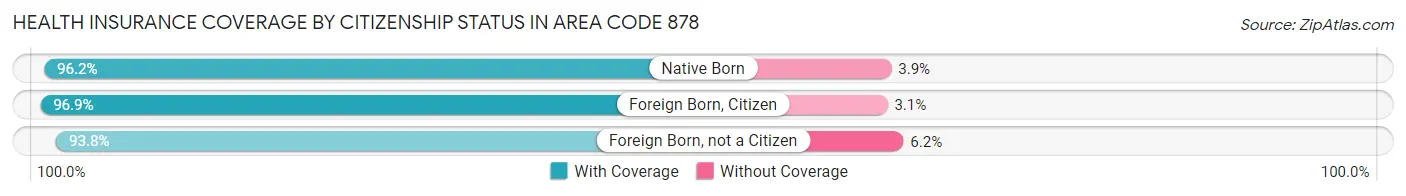
| Citizenship Status | With Coverage | Without Coverage |
| Native Born | 14,112 (96.2%) | 565 (3.8%) |
| Foreign Born, Citizen | 41,595 (96.9%) | 1,323 (3.1%) |
| Foreign Born, not a Citizen | 36,577 (93.8%) | 2,423 (6.2%) |
Health Insurance Coverage by Household Income in Area Code 878
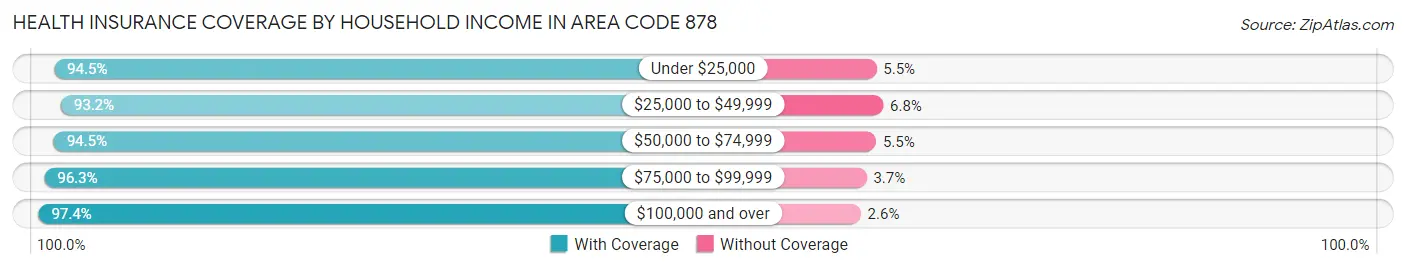
| Household Income | With Coverage | Without Coverage |
| Under $25,000 | 33,977 (94.5%) | 1,990 (5.5%) |
| $25,000 to $49,999 | 44,197 (93.2%) | 3,227 (6.8%) |
| $50,000 to $74,999 | 40,786 (94.5%) | 2,357 (5.5%) |
| $75,000 to $99,999 | 36,031 (96.3%) | 1,379 (3.7%) |
| $100,000 and over | 115,694 (97.4%) | 3,086 (2.6%) |
Public vs Private Health Insurance Coverage by Age in Area Code 878
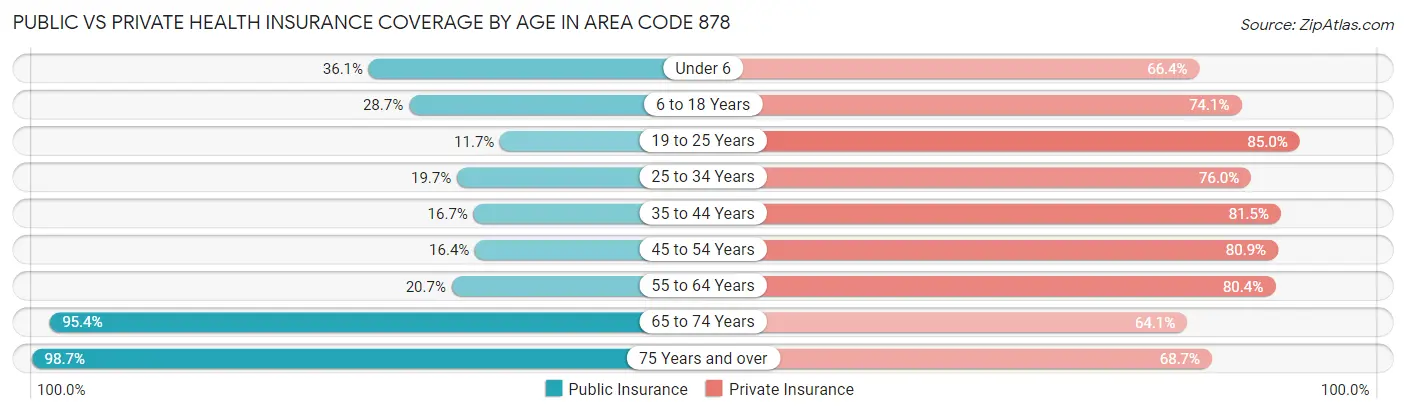
| Age Bracket | Public Insurance | Private Insurance |
| Under 6 | 5,298 (36.1%) | 9,742 (66.4%) |
| 6 to 18 Years | 12,297 (28.6%) | 31,815 (74.1%) |
| 19 to 25 Years | 4,576 (11.7%) | 33,141 (85.0%) |
| 25 to 34 Years | 6,900 (19.7%) | 26,565 (76.0%) |
| 35 to 44 Years | 5,189 (16.7%) | 25,392 (81.5%) |
| 45 to 54 Years | 5,696 (16.4%) | 28,166 (80.9%) |
| 55 to 64 Years | 8,438 (20.7%) | 32,746 (80.4%) |
| 65 to 74 Years | 32,885 (95.4%) | 22,084 (64.1%) |
| 75 Years and over | 24,405 (98.7%) | 16,983 (68.7%) |
| Total | 105,684 (35.5%) | 226,634 (76.2%) |
Disability Status by Sex by Age in Area Code 878
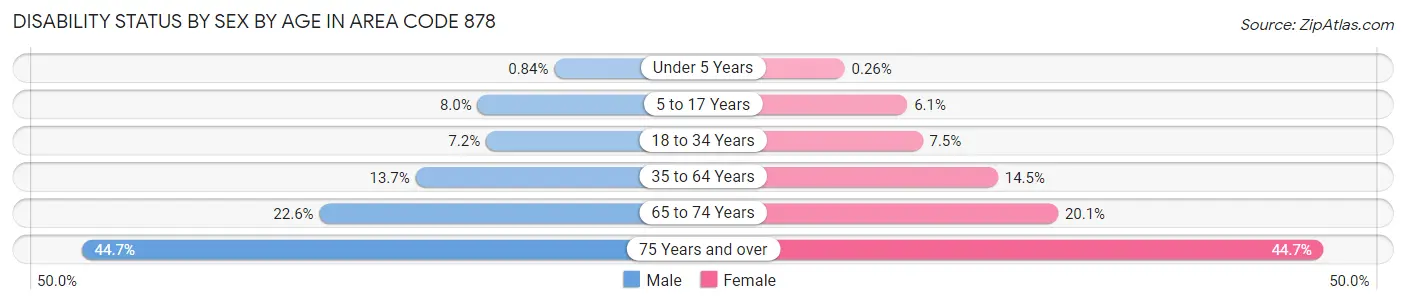
| Age Bracket | Male | Female |
| Under 5 Years | 53 (0.8%) | 15 (0.3%) |
| 5 to 17 Years | 1,512 (8.0%) | 1,117 (6.1%) |
| 18 to 34 Years | 2,888 (7.2%) | 3,133 (7.5%) |
| 35 to 64 Years | 7,314 (13.7%) | 7,729 (14.5%) |
| 65 to 74 Years | 3,800 (22.6%) | 3,546 (20.1%) |
| 75 Years and over | 4,349 (44.7%) | 6,707 (44.7%) |
Disability Class by Sex by Age in Area Code 878
Disability Class: Hearing Difficulty
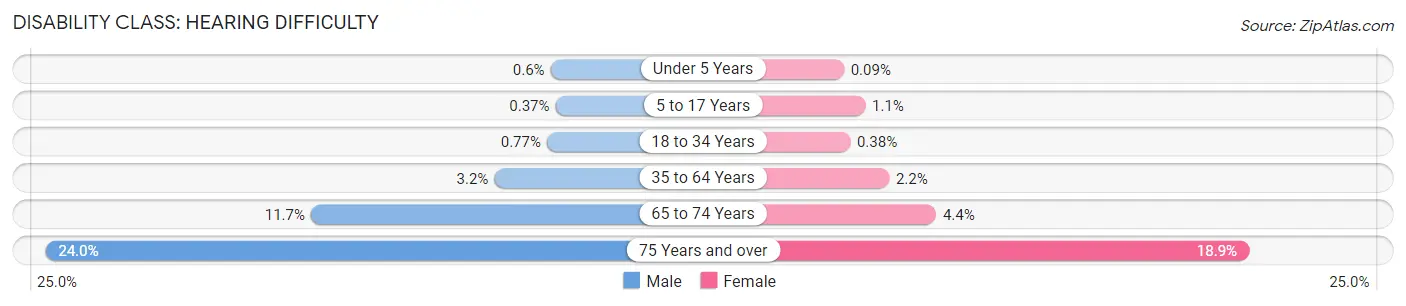
| Age Bracket | Male | Female |
| Under 5 Years | 38 (0.6%) | 5 (0.1%) |
| 5 to 17 Years | 70 (0.4%) | 199 (1.1%) |
| 18 to 34 Years | 310 (0.8%) | 160 (0.4%) |
| 35 to 64 Years | 1,712 (3.2%) | 1,170 (2.2%) |
| 65 to 74 Years | 1,966 (11.7%) | 773 (4.4%) |
| 75 Years and over | 2,339 (24.0%) | 2,834 (18.9%) |
Disability Class: Vision Difficulty
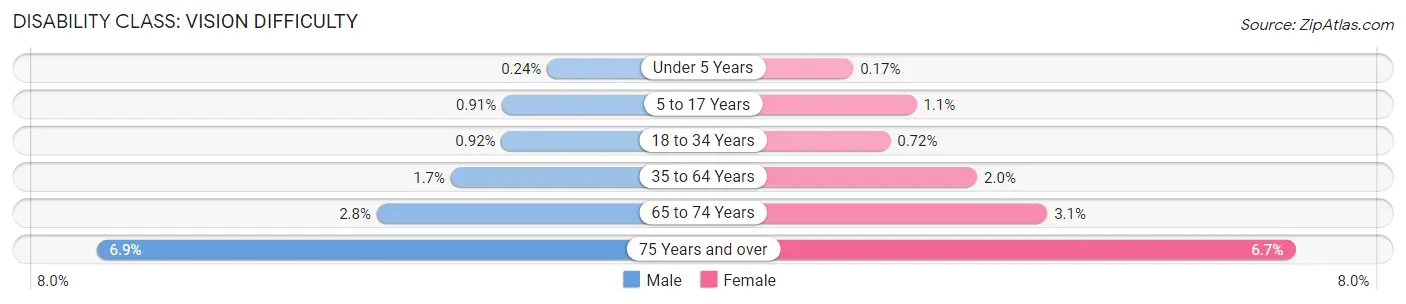
| Age Bracket | Male | Female |
| Under 5 Years | 15 (0.2%) | 10 (0.2%) |
| 5 to 17 Years | 172 (0.9%) | 205 (1.1%) |
| 18 to 34 Years | 369 (0.9%) | 299 (0.7%) |
| 35 to 64 Years | 888 (1.7%) | 1,072 (2.0%) |
| 65 to 74 Years | 465 (2.8%) | 540 (3.0%) |
| 75 Years and over | 674 (6.9%) | 1,010 (6.7%) |
Disability Class: Cognitive Difficulty
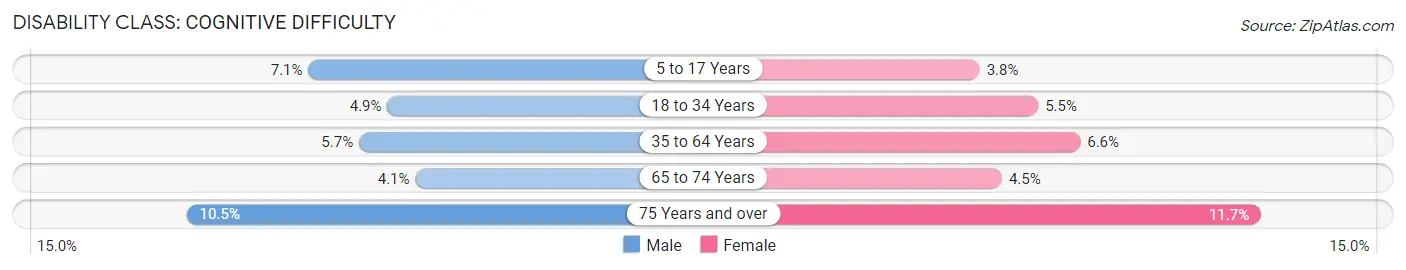
| Age Bracket | Male | Female |
| 5 to 17 Years | 1,350 (7.1%) | 707 (3.8%) |
| 18 to 34 Years | 1,971 (4.9%) | 2,287 (5.5%) |
| 35 to 64 Years | 3,036 (5.7%) | 3,545 (6.6%) |
| 65 to 74 Years | 692 (4.1%) | 789 (4.5%) |
| 75 Years and over | 1,021 (10.5%) | 1,750 (11.7%) |
Disability Class: Ambulatory Difficulty
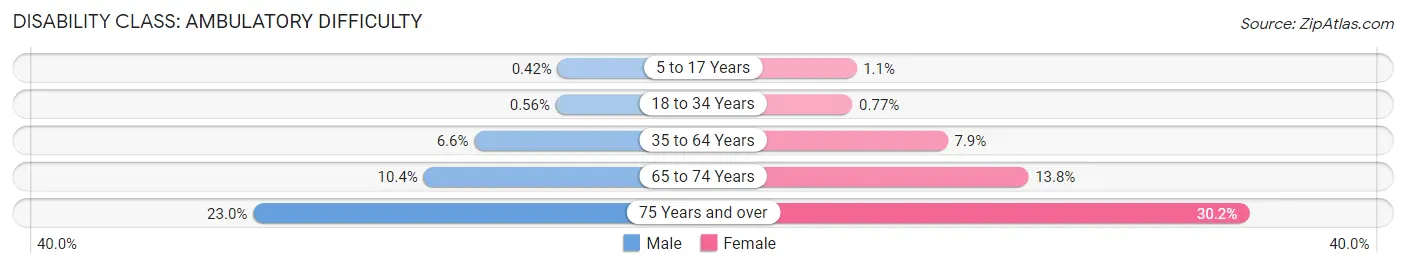
| Age Bracket | Male | Female |
| 5 to 17 Years | 80 (0.4%) | 197 (1.1%) |
| 18 to 34 Years | 227 (0.6%) | 320 (0.8%) |
| 35 to 64 Years | 3,526 (6.6%) | 4,192 (7.9%) |
| 65 to 74 Years | 1,740 (10.4%) | 2,447 (13.8%) |
| 75 Years and over | 2,241 (23.0%) | 4,535 (30.2%) |
Disability Class: Self-Care Difficulty
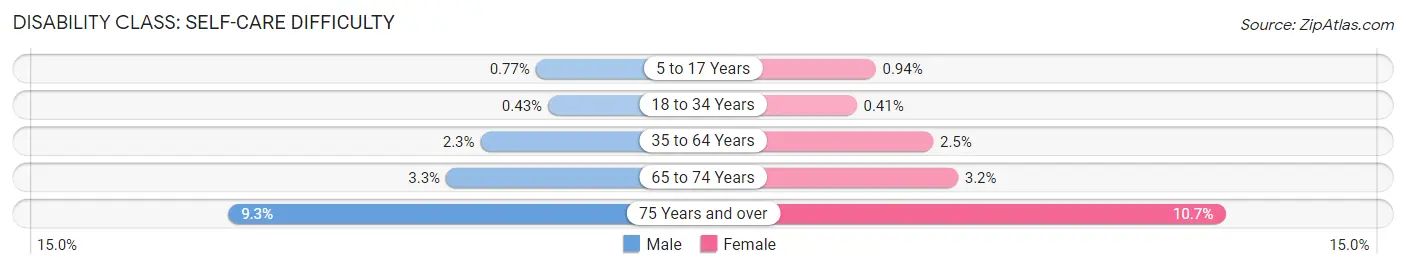
| Age Bracket | Male | Female |
| 5 to 17 Years | 146 (0.8%) | 173 (0.9%) |
| 18 to 34 Years | 173 (0.4%) | 171 (0.4%) |
| 35 to 64 Years | 1,231 (2.3%) | 1,356 (2.5%) |
| 65 to 74 Years | 549 (3.3%) | 571 (3.2%) |
| 75 Years and over | 908 (9.3%) | 1,600 (10.7%) |
Technology Access in Area Code 878
Computing Device Access in Area Code 878
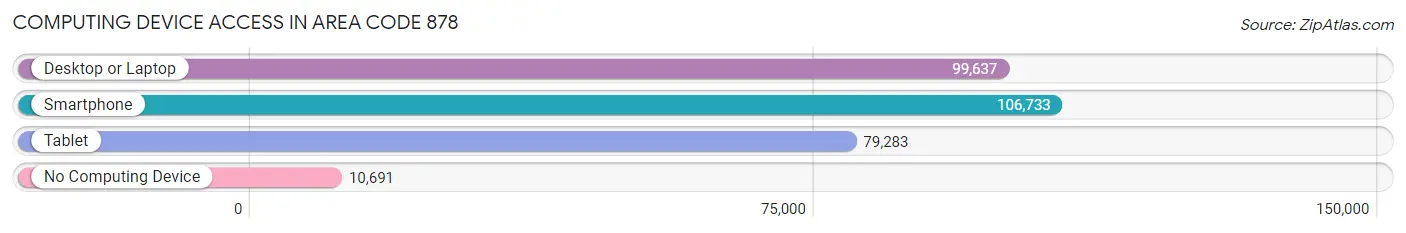
| Device Type | # Households | % Households |
| Desktop or Laptop | 99,637 | 78.0% |
| Smartphone | 106,733 | 83.5% |
| Tablet | 79,283 | 62.1% |
| No Computing Device | 10,691 | 8.4% |
| Total | 127,776 | 100.0% |
Internet Access in Area Code 878
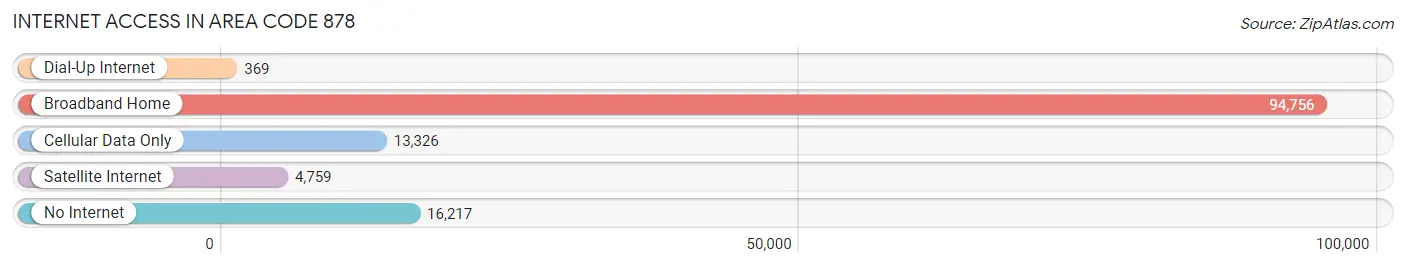
| Internet Type | # Households | % Households |
| Dial-Up Internet | 369 | 0.3% |
| Broadband Home | 94,756 | 74.2% |
| Cellular Data Only | 13,326 | 10.4% |
| Satellite Internet | 4,759 | 3.7% |
| No Internet | 16,217 | 12.7% |
| Total | 127,776 | 100.0% |
Area Code 878 Summary
Geography
Area code 878 is an overlay area code that covers the western part of Pennsylvania, including the cities of Pittsburgh, Erie, and Johnstown. It was created in 2001 to provide additional telephone numbers for the area.
Social
Area code 878 is a popular area code for people living in western Pennsylvania. It is a great way to stay connected with friends and family, as well as to stay in touch with the latest news and events.
Economics
Area code 878 is a great area for businesses to set up shop. The area is home to many large companies, such as PNC Financial Services, UPMC, and Highmark. The area also has a strong manufacturing base, with many factories and plants located in the region.
Demographics
Area code 878 is home to a diverse population. The area is home to a large number of immigrants, as well as a large number of people of color. The area also has a large number of college students, as well as a large number of young professionals.
Common Questions
What is Per Capita Income in Area Code 878?
Per Capita income in Area Code 878 is $38,116.
What is the Median Family Income in Area Code 878?
Median Family Income in Area Code 878 is $87,418.
What is the Median Household income in Area Code 878?
Median Household Income in Area Code 878 is $68,639.
What is Income or Wage Gap in Area Code 878?
Income or Wage Gap in Area Code 878 is 31.2%.
Women in Area Code 878 earn 68.8 cents for every dollar earned by a man.
What is Family Income Deficit in Area Code 878?
Family Income Deficit in Area Code 878 is $10,132.
Families that are below poverty line in Area Code 878 earn $10,132 less on average than the poverty threshold level.
What is Inequality or Gini Index in Area Code 878?
Inequality or Gini Index in Area Code 878 is 20.63.
What is the Total Population of Area Code 878?
Total Population of Area Code 878 is 301,064.
What is the Total Male Population of Area Code 878?
Total Male Population of Area Code 878 is 147,026.
What is the Total Female Population of Area Code 878?
Total Female Population of Area Code 878 is 154,038.
What is the Ratio of Males per 100 Females in Area Code 878?
There are 95.45 Males per 100 Females in Area Code 878.
What is the Ratio of Females per 100 Males in Area Code 878?
There are 104.77 Females per 100 Males in Area Code 878.
What is the Median Population Age in Area Code 878?
Median Population Age in Area Code 878 is 44.9 Years.
What is the Average Family Size in Area Code 878
Average Family Size in Area Code 878 is 2.9 People.
What is the Average Household Size in Area Code 878
Average Household Size in Area Code 878 is 2.3 People.
How Large is the Labor Force in Area Code 878?
There are 162,254 People in the Labor Forcein in Area Code 878.
What is the Percentage of People in the Labor Force in Area Code 878?
62.9% of People are in the Labor Force in Area Code 878.
What is the Unemployment Rate in Area Code 878?
Unemployment Rate in Area Code 878 is 5.3%.