Westmoreland County, PA Map & Demographics
Westmoreland County Overview
$40,193
PER CAPITA INCOME
$91,249
AVG FAMILY INCOME
$69,454
AVG HOUSEHOLD INCOME
35.9%
WAGE / INCOME GAP [ % ]
64.1¢/ $1
WAGE / INCOME GAP [ $ ]
$11,159
FAMILY INCOME DEFICIT
0.45
INEQUALITY / GINI INDEX
354,414
TOTAL POPULATION
175,081
MALE POPULATION
179,333
FEMALE POPULATION
97.63
MALES / 100 FEMALES
102.43
FEMALES / 100 MALES
47.2
MEDIAN AGE
2.8
AVG FAMILY SIZE
2.3
AVG HOUSEHOLD SIZE
180,538
LABOR FORCE [ PEOPLE ]
60.6%
PERCENT IN LABOR FORCE
5.0%
UNEMPLOYMENT RATE
Income in Westmoreland County
Income Overview in Westmoreland County
Per Capita Income in Westmoreland County is $40,193, while median incomes of families and households are $91,249 and $69,454 respectively.
| Characteristic | Number | Measure |
| Per Capita Income | 354,414 | $40,193 |
| Median Family Income | 96,524 | $91,249 |
| Mean Family Income | 96,524 | $112,078 |
| Median Household Income | 153,237 | $69,454 |
| Mean Household Income | 153,237 | $91,343 |
| Income Deficit | 96,524 | $11,159 |
| Wage / Income Gap (%) | 354,414 | 35.93% |
| Wage / Income Gap ($) | 354,414 | 64.07¢ per $1 |
| Gini / Inequality Index | 354,414 | 0.45 |
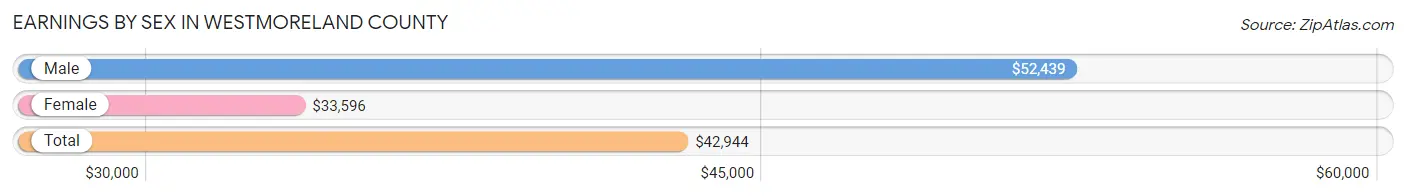
Earnings by Sex in Westmoreland County
Average Earnings in Westmoreland County are $42,944, $52,439 for men and $33,596 for women, a difference of 35.9%.
| Sex | Number | Average Earnings |
| Male | 100,985 (53.3%) | $52,439 |
| Female | 88,434 (46.7%) | $33,596 |
| Total | 189,419 (100.0%) | $42,944 |
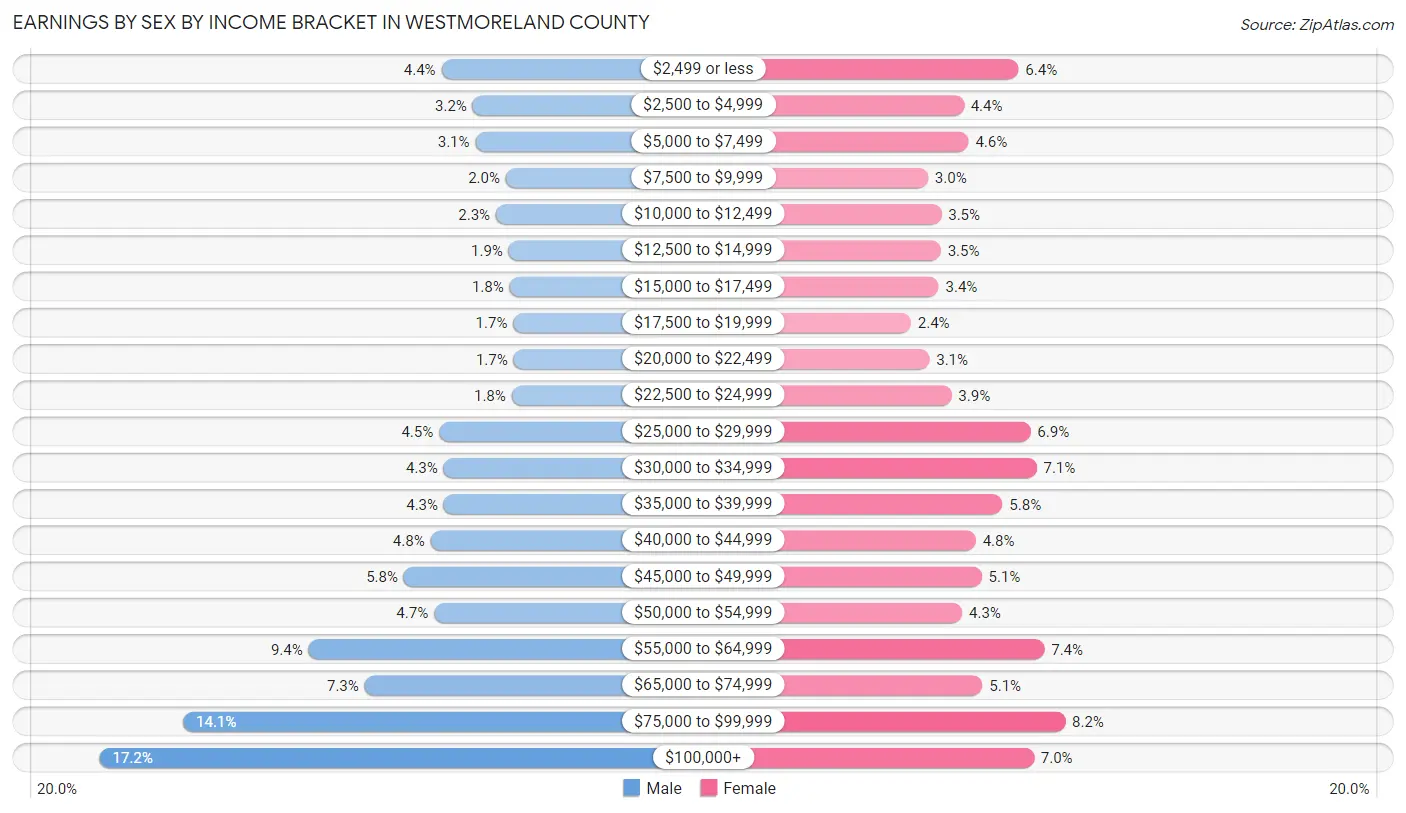
Earnings by Sex by Income Bracket in Westmoreland County
The most common earnings brackets in Westmoreland County are $100,000+ for men (17,363 | 17.2%) and $75,000 to $99,999 for women (7,236 | 8.2%).
| Income | Male | Female |
| $2,499 or less | 4,420 (4.4%) | 5,683 (6.4%) |
| $2,500 to $4,999 | 3,244 (3.2%) | 3,870 (4.4%) |
| $5,000 to $7,499 | 3,137 (3.1%) | 4,034 (4.6%) |
| $7,500 to $9,999 | 1,992 (2.0%) | 2,687 (3.0%) |
| $10,000 to $12,499 | 2,361 (2.3%) | 3,134 (3.5%) |
| $12,500 to $14,999 | 1,878 (1.9%) | 3,117 (3.5%) |
| $15,000 to $17,499 | 1,846 (1.8%) | 3,040 (3.4%) |
| $17,500 to $19,999 | 1,711 (1.7%) | 2,121 (2.4%) |
| $20,000 to $22,499 | 1,699 (1.7%) | 2,729 (3.1%) |
| $22,500 to $24,999 | 1,767 (1.8%) | 3,470 (3.9%) |
| $25,000 to $29,999 | 4,512 (4.5%) | 6,086 (6.9%) |
| $30,000 to $34,999 | 4,343 (4.3%) | 6,285 (7.1%) |
| $35,000 to $39,999 | 4,333 (4.3%) | 5,153 (5.8%) |
| $40,000 to $44,999 | 4,834 (4.8%) | 4,270 (4.8%) |
| $45,000 to $49,999 | 5,852 (5.8%) | 4,466 (5.1%) |
| $50,000 to $54,999 | 4,710 (4.7%) | 3,819 (4.3%) |
| $55,000 to $64,999 | 9,457 (9.4%) | 6,542 (7.4%) |
| $65,000 to $74,999 | 7,328 (7.3%) | 4,492 (5.1%) |
| $75,000 to $99,999 | 14,198 (14.1%) | 7,236 (8.2%) |
| $100,000+ | 17,363 (17.2%) | 6,200 (7.0%) |
| Total | 100,985 (100.0%) | 88,434 (100.0%) |
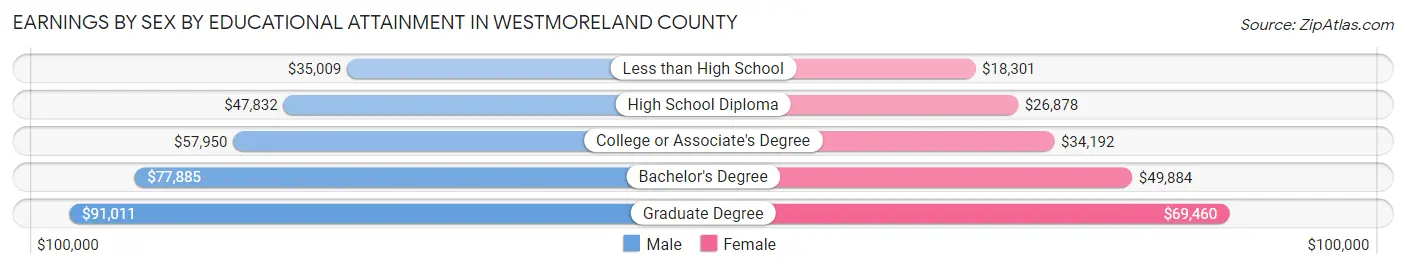
Earnings by Sex by Educational Attainment in Westmoreland County
Average earnings in Westmoreland County are $58,451 for men and $37,940 for women, a difference of 35.1%. Men with an educational attainment of graduate degree enjoy the highest average annual earnings of $91,011, while those with less than high school education earn the least with $35,009. Women with an educational attainment of graduate degree earn the most with the average annual earnings of $69,460, while those with less than high school education have the smallest earnings of $18,301.
| Educational Attainment | Male Income | Female Income |
| Less than High School | $35,009 | $18,301 |
| High School Diploma | $47,832 | $26,878 |
| College or Associate's Degree | $57,950 | $34,192 |
| Bachelor's Degree | $77,885 | $49,884 |
| Graduate Degree | $91,011 | $69,460 |
| Total | $58,451 | $37,940 |
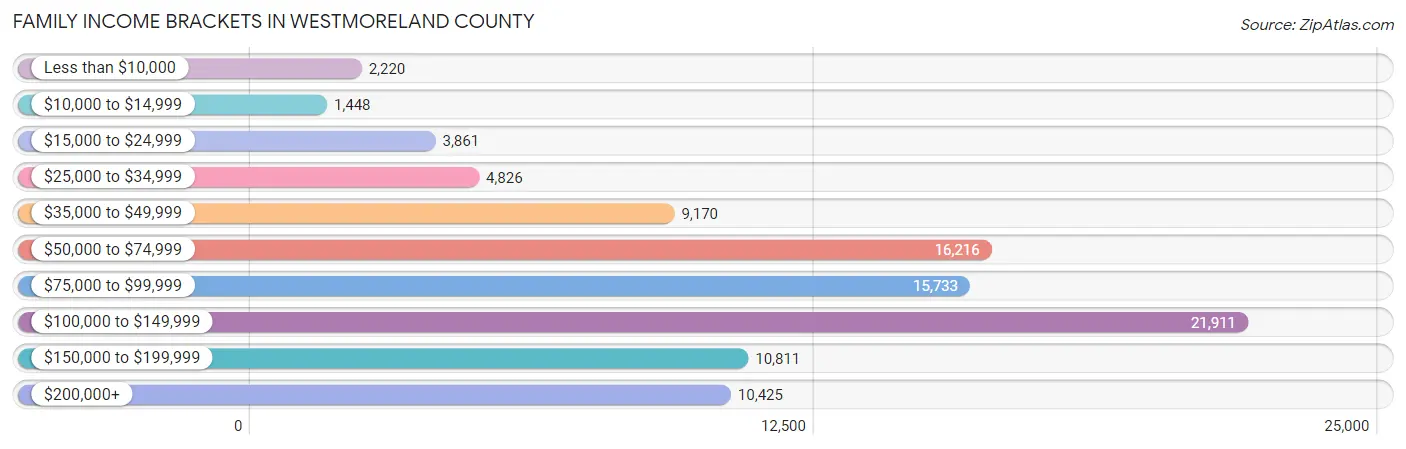
Family Income in Westmoreland County
Family Income Brackets in Westmoreland County
According to the Westmoreland County family income data, there are 21,911 families falling into the $100,000 to $149,999 income range, which is the most common income bracket and makes up 22.7% of all families. Conversely, the $10,000 to $14,999 income bracket is the least frequent group with only 1,448 families (1.5%) belonging to this category.
| Income Bracket | # Families | % Families |
| Less than $10,000 | 2,220 | 2.3% |
| $10,000 to $14,999 | 1,448 | 1.5% |
| $15,000 to $24,999 | 3,861 | 4.0% |
| $25,000 to $34,999 | 4,826 | 5.0% |
| $35,000 to $49,999 | 9,170 | 9.5% |
| $50,000 to $74,999 | 16,216 | 16.8% |
| $75,000 to $99,999 | 15,733 | 16.3% |
| $100,000 to $149,999 | 21,911 | 22.7% |
| $150,000 to $199,999 | 10,811 | 11.2% |
| $200,000+ | 10,425 | 10.8% |
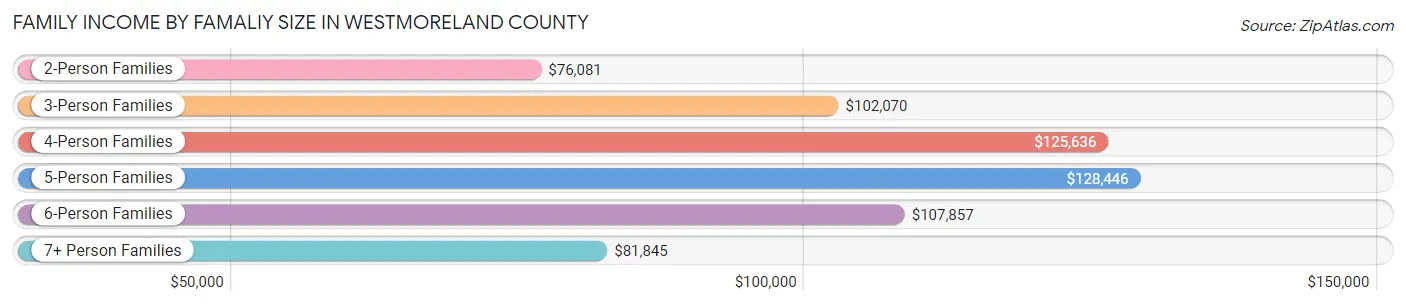
Family Income by Famaliy Size in Westmoreland County
5-person families (5,737 | 5.9%) account for the highest median family income in Westmoreland County with $128,446 per family, while 2-person families (52,765 | 54.7%) have the highest median income of $38,040 per family member.
| Income Bracket | # Families | Median Income |
| 2-Person Families | 52,765 (54.7%) | $76,081 |
| 3-Person Families | 20,682 (21.4%) | $102,070 |
| 4-Person Families | 15,011 (15.5%) | $125,636 |
| 5-Person Families | 5,737 (5.9%) | $128,446 |
| 6-Person Families | 1,812 (1.9%) | $107,857 |
| 7+ Person Families | 517 (0.5%) | $81,845 |
| Total | 96,524 (100.0%) | $91,249 |
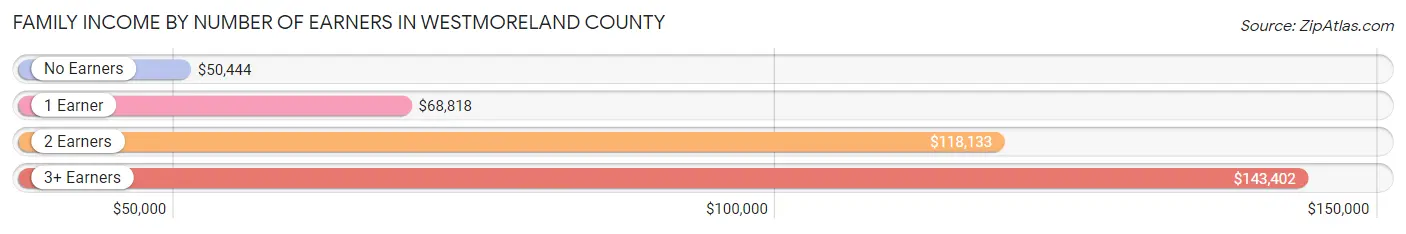
Family Income by Number of Earners in Westmoreland County
The median family income in Westmoreland County is $91,249, with families comprising 3+ earners (11,222) having the highest median family income of $143,402, while families with no earners (18,564) have the lowest median family income of $50,444, accounting for 11.6% and 19.2% of families, respectively.
| Number of Earners | # Families | Median Income |
| No Earners | 18,564 (19.2%) | $50,444 |
| 1 Earner | 27,498 (28.5%) | $68,818 |
| 2 Earners | 39,240 (40.6%) | $118,133 |
| 3+ Earners | 11,222 (11.6%) | $143,402 |
| Total | 96,524 (100.0%) | $91,249 |
Household Income in Westmoreland County
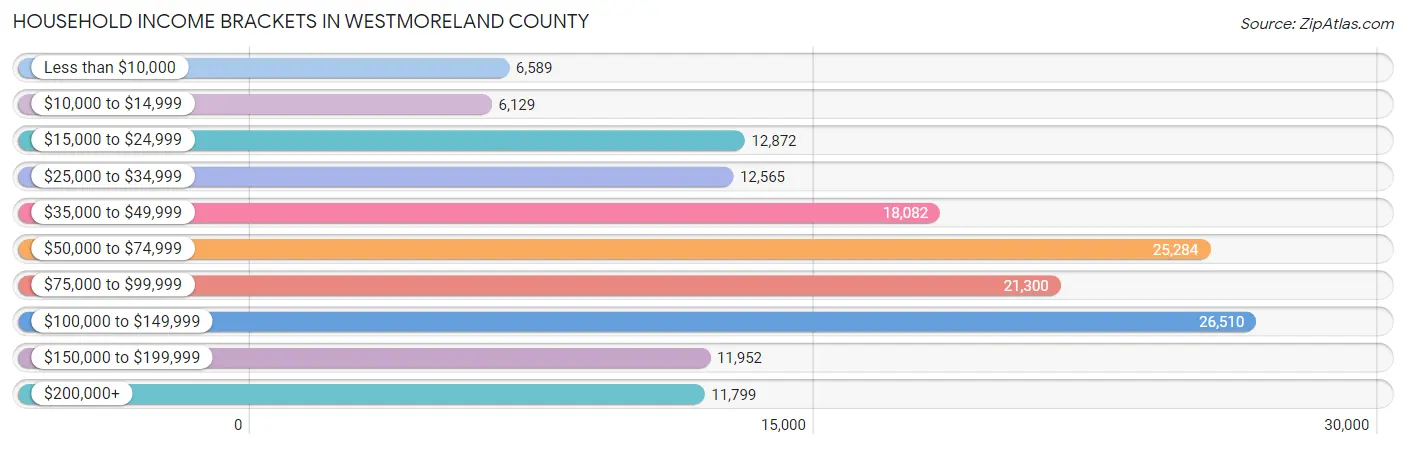
Household Income Brackets in Westmoreland County
With 26,510 households falling in the category, the $100,000 to $149,999 income range is the most frequent in Westmoreland County, accounting for 17.3% of all households. In contrast, only 6,129 households (4.0%) fall into the $10,000 to $14,999 income bracket, making it the least populous group.
| Income Bracket | # Households | % Households |
| Less than $10,000 | 6,589 | 4.3% |
| $10,000 to $14,999 | 6,129 | 4.0% |
| $15,000 to $24,999 | 12,872 | 8.4% |
| $25,000 to $34,999 | 12,565 | 8.2% |
| $35,000 to $49,999 | 18,082 | 11.8% |
| $50,000 to $74,999 | 25,284 | 16.5% |
| $75,000 to $99,999 | 21,300 | 13.9% |
| $100,000 to $149,999 | 26,510 | 17.3% |
| $150,000 to $199,999 | 11,952 | 7.8% |
| $200,000+ | 11,799 | 7.7% |
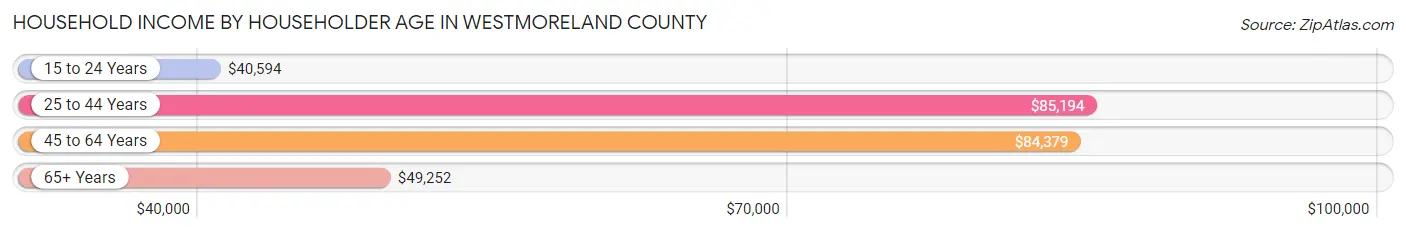
Household Income by Householder Age in Westmoreland County
The median household income in Westmoreland County is $69,454, with the highest median household income of $85,194 found in the 25 to 44 years age bracket for the primary householder. A total of 37,934 households (24.8%) fall into this category. Meanwhile, the 15 to 24 years age bracket for the primary householder has the lowest median household income of $40,594, with 3,496 households (2.3%) in this group.
| Income Bracket | # Households | Median Income |
| 15 to 24 Years | 3,496 (2.3%) | $40,594 |
| 25 to 44 Years | 37,934 (24.8%) | $85,194 |
| 45 to 64 Years | 59,319 (38.7%) | $84,379 |
| 65+ Years | 52,488 (34.3%) | $49,252 |
| Total | 153,237 (100.0%) | $69,454 |
Poverty in Westmoreland County
Income Below Poverty by Sex and Age in Westmoreland County
With 8.5% poverty level for males and 10.9% for females among the residents of Westmoreland County, under 5 year old males and 5 year old females are the most vulnerable to poverty, with 1,082 males (14.1%) and 402 females (22.7%) in their respective age groups living below the poverty level.
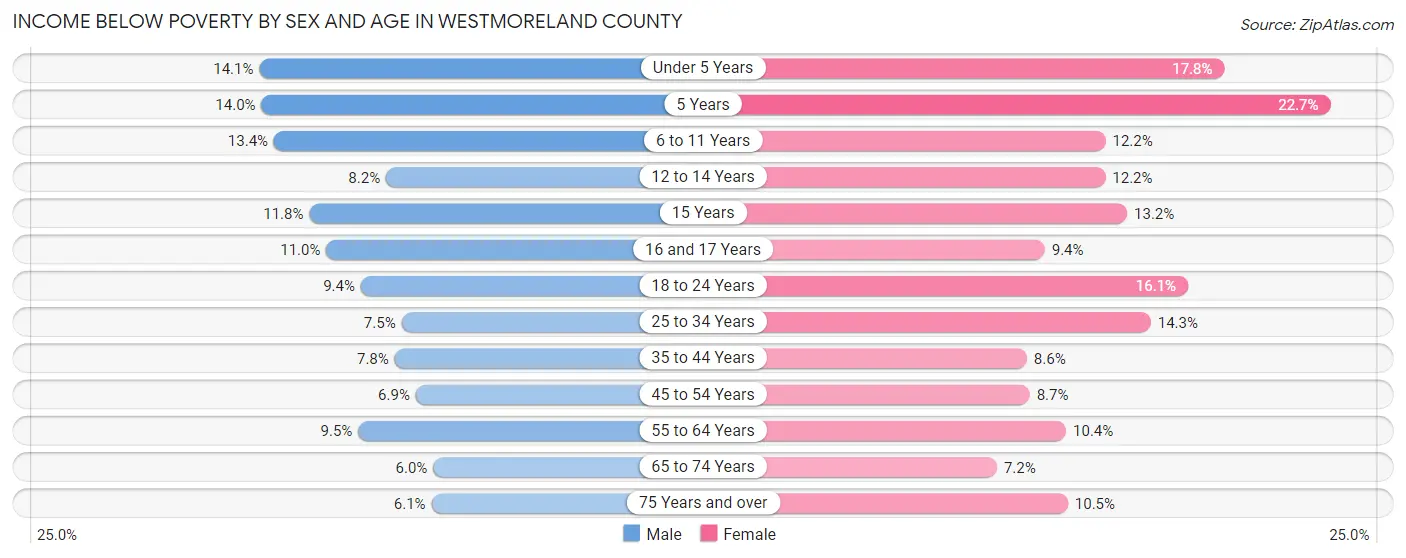
| Age Bracket | Male | Female |
| Under 5 Years | 1,082 (14.1%) | 1,325 (17.7%) |
| 5 Years | 206 (14.0%) | 402 (22.7%) |
| 6 to 11 Years | 1,451 (13.4%) | 1,270 (12.2%) |
| 12 to 14 Years | 500 (8.2%) | 700 (12.2%) |
| 15 Years | 282 (11.8%) | 251 (13.2%) |
| 16 and 17 Years | 433 (11.0%) | 377 (9.4%) |
| 18 to 24 Years | 1,152 (9.4%) | 1,754 (16.1%) |
| 25 to 34 Years | 1,451 (7.5%) | 2,618 (14.3%) |
| 35 to 44 Years | 1,575 (7.8%) | 1,664 (8.6%) |
| 45 to 54 Years | 1,591 (6.9%) | 1,999 (8.7%) |
| 55 to 64 Years | 2,671 (9.5%) | 2,961 (10.4%) |
| 65 to 74 Years | 1,366 (6.0%) | 1,769 (7.2%) |
| 75 Years and over | 844 (6.1%) | 2,084 (10.5%) |
| Total | 14,604 (8.5%) | 19,174 (10.9%) |
Income Above Poverty by Sex and Age in Westmoreland County
According to the poverty statistics in Westmoreland County, males aged 65 to 74 years and females aged 65 to 74 years are the age groups that are most secure financially, with 94.0% of males and 92.8% of females in these age groups living above the poverty line.
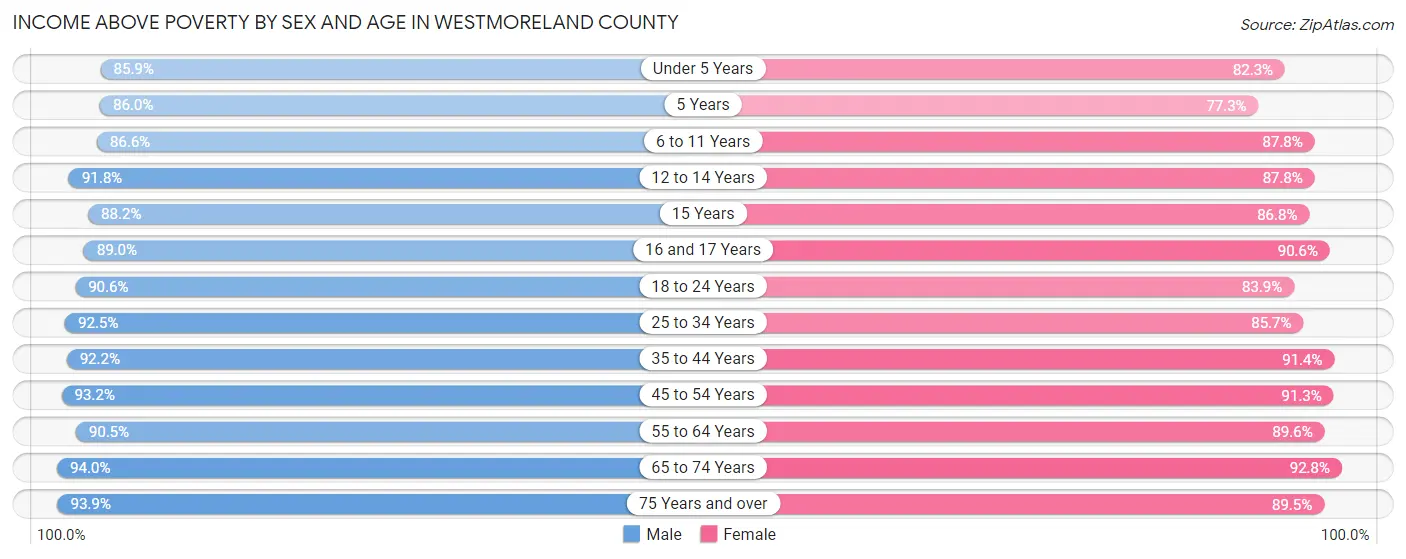
| Age Bracket | Male | Female |
| Under 5 Years | 6,587 (85.9%) | 6,139 (82.3%) |
| 5 Years | 1,264 (86.0%) | 1,371 (77.3%) |
| 6 to 11 Years | 9,357 (86.6%) | 9,102 (87.8%) |
| 12 to 14 Years | 5,575 (91.8%) | 5,022 (87.8%) |
| 15 Years | 2,109 (88.2%) | 1,645 (86.8%) |
| 16 and 17 Years | 3,505 (89.0%) | 3,624 (90.6%) |
| 18 to 24 Years | 11,097 (90.6%) | 9,169 (83.9%) |
| 25 to 34 Years | 17,874 (92.5%) | 15,636 (85.7%) |
| 35 to 44 Years | 18,533 (92.2%) | 17,703 (91.4%) |
| 45 to 54 Years | 21,642 (93.1%) | 20,927 (91.3%) |
| 55 to 64 Years | 25,398 (90.5%) | 25,490 (89.6%) |
| 65 to 74 Years | 21,235 (94.0%) | 22,794 (92.8%) |
| 75 Years and over | 12,938 (93.9%) | 17,781 (89.5%) |
| Total | 157,114 (91.5%) | 156,403 (89.1%) |
Income Below Poverty Among Married-Couple Families in Westmoreland County
The poverty statistics for married-couple families in Westmoreland County show that 2.8% or 2,128 of the total 76,786 families live below the poverty line. Families with 5 or more children have the highest poverty rate of 13.2%, comprising of 30 families. On the other hand, families with no children have the lowest poverty rate of 2.3%, which includes 1,164 families.
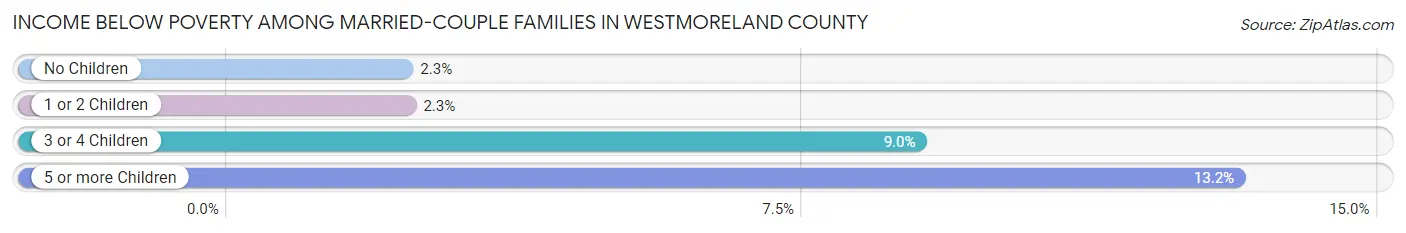
| Children | Above Poverty | Below Poverty |
| No Children | 49,653 (97.7%) | 1,164 (2.3%) |
| 1 or 2 Children | 20,236 (97.7%) | 482 (2.3%) |
| 3 or 4 Children | 4,571 (91.0%) | 452 (9.0%) |
| 5 or more Children | 198 (86.8%) | 30 (13.2%) |
| Total | 74,658 (97.2%) | 2,128 (2.8%) |
Income Below Poverty Among Single-Parent Households in Westmoreland County
According to the poverty data in Westmoreland County, 10.6% or 634 single-father households and 22.7% or 3,118 single-mother households are living below the poverty line. Among single-father households, those with 5 or more children have the highest poverty rate, with 19 households (100.0%) experiencing poverty. Likewise, among single-mother households, those with 5 or more children have the highest poverty rate, with 23 households (76.7%) falling below the poverty line.
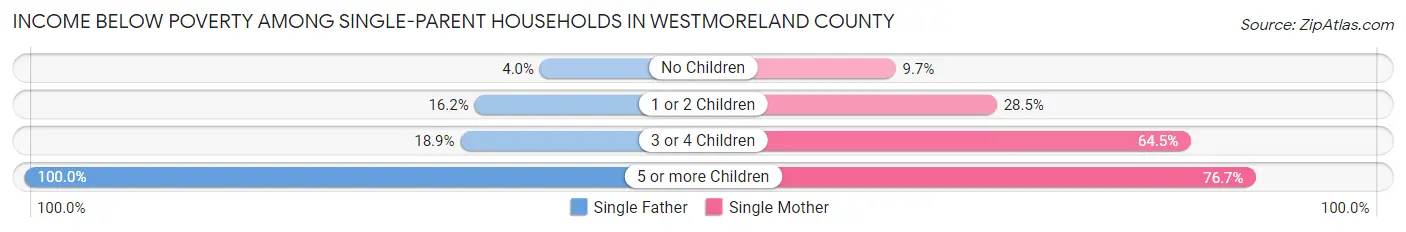
| Children | Single Father | Single Mother |
| No Children | 119 (4.0%) | 612 (9.7%) |
| 1 or 2 Children | 437 (16.2%) | 1,803 (28.5%) |
| 3 or 4 Children | 59 (18.9%) | 680 (64.5%) |
| 5 or more Children | 19 (100.0%) | 23 (76.7%) |
| Total | 634 (10.6%) | 3,118 (22.7%) |
Income Below Poverty Among Married-Couple vs Single-Parent Households in Westmoreland County
The poverty data for Westmoreland County shows that 2,128 of the married-couple family households (2.8%) and 3,752 of the single-parent households (19.0%) are living below the poverty level. Within the married-couple family households, those with 5 or more children have the highest poverty rate, with 30 households (13.2%) falling below the poverty line. Among the single-parent households, those with 5 or more children have the highest poverty rate, with 42 household (85.7%) living below poverty.
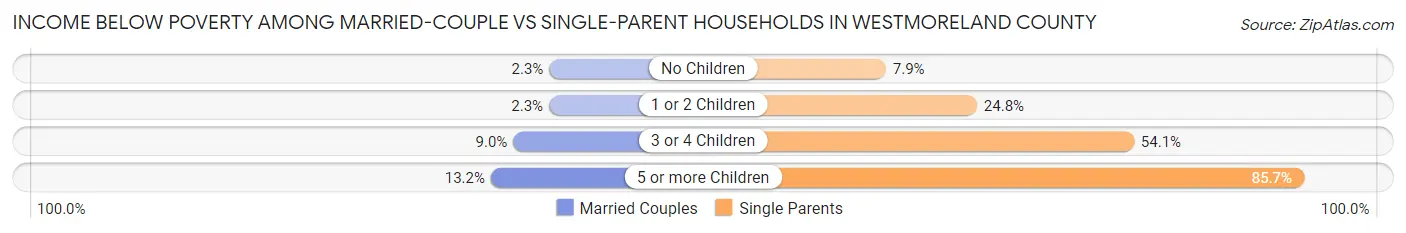
| Children | Married-Couple Families | Single-Parent Households |
| No Children | 1,164 (2.3%) | 731 (7.9%) |
| 1 or 2 Children | 482 (2.3%) | 2,240 (24.8%) |
| 3 or 4 Children | 452 (9.0%) | 739 (54.1%) |
| 5 or more Children | 30 (13.2%) | 42 (85.7%) |
| Total | 2,128 (2.8%) | 3,752 (19.0%) |
Race in Westmoreland County
The most populous races in Westmoreland County are White / Caucasian (329,734 | 93.0%), Two or more Races (10,737 | 3.0%), and Black / African American (8,809 | 2.5%).
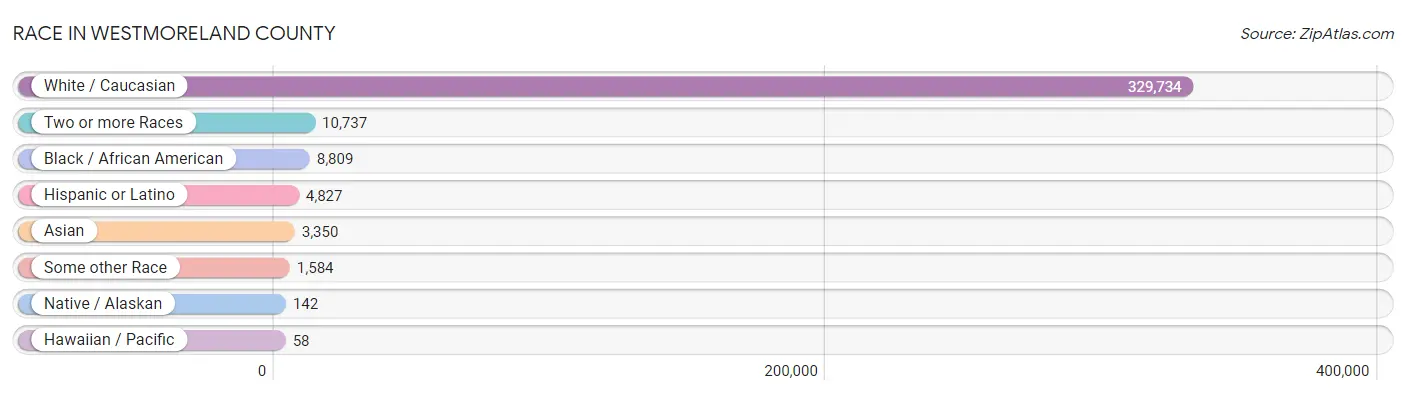
| Race | # Population | % Population |
| Asian | 3,350 | 0.9% |
| Black / African American | 8,809 | 2.5% |
| Hawaiian / Pacific | 58 | 0.0% |
| Hispanic or Latino | 4,827 | 1.4% |
| Native / Alaskan | 142 | 0.0% |
| White / Caucasian | 329,734 | 93.0% |
| Two or more Races | 10,737 | 3.0% |
| Some other Race | 1,584 | 0.4% |
| Total | 354,414 | 100.0% |
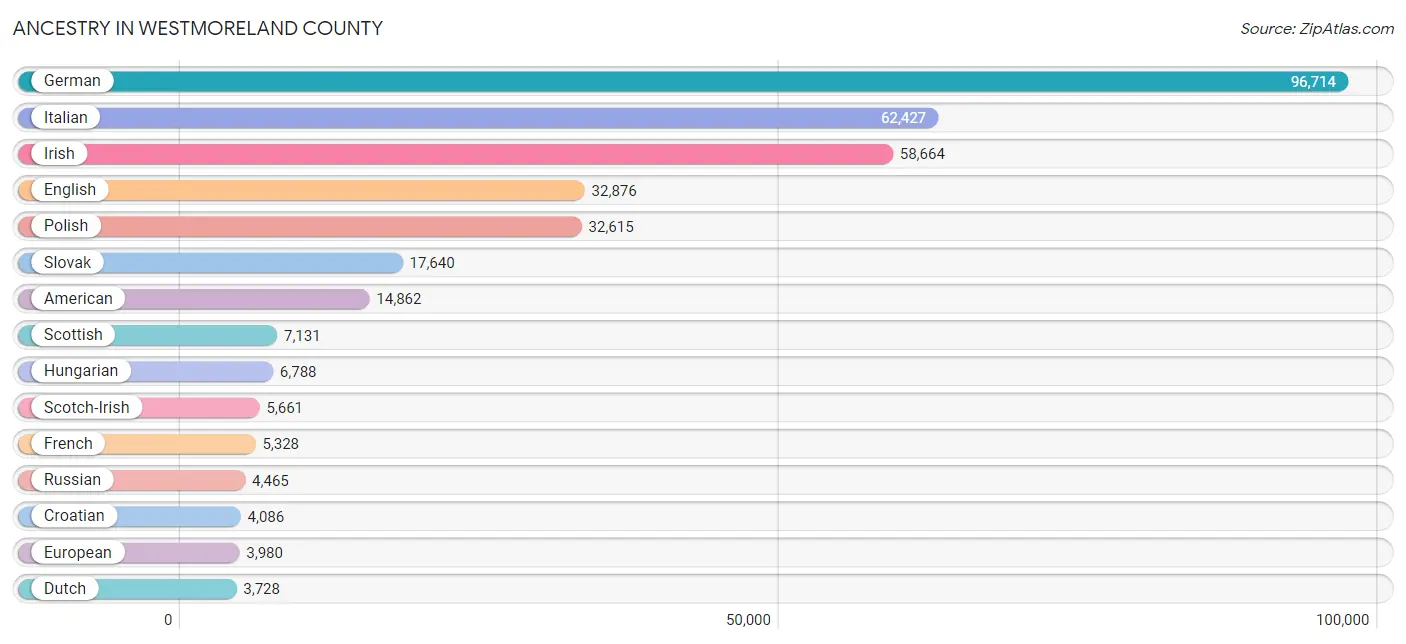
Ancestry in Westmoreland County
The most populous ancestries reported in Westmoreland County are German (96,714 | 27.3%), Italian (62,427 | 17.6%), Irish (58,664 | 16.6%), English (32,876 | 9.3%), and Polish (32,615 | 9.2%), together accounting for 79.9% of all Westmoreland County residents.
| Ancestry | # Population | % Population |
| African | 394 | 0.1% |
| Alaskan Athabascan | 15 | 0.0% |
| Albanian | 54 | 0.0% |
| Alsatian | 5 | 0.0% |
| American | 14,862 | 4.2% |
| Apache | 26 | 0.0% |
| Arab | 1,627 | 0.5% |
| Argentinean | 26 | 0.0% |
| Armenian | 44 | 0.0% |
| Australian | 30 | 0.0% |
| Austrian | 1,722 | 0.5% |
| Barbadian | 33 | 0.0% |
| Belgian | 475 | 0.1% |
| Bhutanese | 324 | 0.1% |
| Blackfeet | 91 | 0.0% |
| Bolivian | 36 | 0.0% |
| Brazilian | 21 | 0.0% |
| British | 1,274 | 0.4% |
| Bulgarian | 49 | 0.0% |
| Burmese | 712 | 0.2% |
| Cajun | 12 | 0.0% |
| Canadian | 151 | 0.0% |
| Carpatho Rusyn | 240 | 0.1% |
| Celtic | 71 | 0.0% |
| Central American | 264 | 0.1% |
| Central American Indian | 5 | 0.0% |
| Cherokee | 538 | 0.2% |
| Cheyenne | 1 | 0.0% |
| Chilean | 33 | 0.0% |
| Chinese | 12 | 0.0% |
| Chippewa | 66 | 0.0% |
| Choctaw | 82 | 0.0% |
| Colombian | 24 | 0.0% |
| Croatian | 4,086 | 1.1% |
| Cuban | 276 | 0.1% |
| Cypriot | 28 | 0.0% |
| Czech | 3,137 | 0.9% |
| Czechoslovakian | 1,083 | 0.3% |
| Danish | 355 | 0.1% |
| Delaware | 23 | 0.0% |
| Dominican | 216 | 0.1% |
| Dutch | 3,728 | 1.1% |
| Dutch West Indian | 15 | 0.0% |
| Eastern European | 2,299 | 0.6% |
| Egyptian | 24 | 0.0% |
| English | 32,876 | 9.3% |
| European | 3,980 | 1.1% |
| Filipino | 34 | 0.0% |
| Finnish | 199 | 0.1% |
| French | 5,328 | 1.5% |
| French Canadian | 593 | 0.2% |
| German | 96,714 | 27.3% |
| Ghanaian | 66 | 0.0% |
| Greek | 1,393 | 0.4% |
| Guamanian / Chamorro | 28 | 0.0% |
| Guatemalan | 108 | 0.0% |
| Guyanese | 3 | 0.0% |
| Haitian | 43 | 0.0% |
| Honduran | 24 | 0.0% |
| Hungarian | 6,788 | 1.9% |
| Icelander | 27 | 0.0% |
| Indian (Asian) | 1,224 | 0.4% |
| Iranian | 25 | 0.0% |
| Iraqi | 17 | 0.0% |
| Irish | 58,664 | 16.6% |
| Iroquois | 62 | 0.0% |
| Israeli | 54 | 0.0% |
| Italian | 62,427 | 17.6% |
| Jamaican | 74 | 0.0% |
| Korean | 676 | 0.2% |
| Laotian | 5 | 0.0% |
| Latvian | 21 | 0.0% |
| Lebanese | 624 | 0.2% |
| Lithuanian | 1,079 | 0.3% |
| Luxembourger | 9 | 0.0% |
| Macedonian | 75 | 0.0% |
| Maltese | 36 | 0.0% |
| Mexican | 1,721 | 0.5% |
| Native Hawaiian | 190 | 0.1% |
| Navajo | 27 | 0.0% |
| New Zealander | 6 | 0.0% |
| Nicaraguan | 8 | 0.0% |
| Nigerian | 23 | 0.0% |
| Northern European | 362 | 0.1% |
| Norwegian | 1,012 | 0.3% |
| Pakistani | 66 | 0.0% |
| Panamanian | 94 | 0.0% |
| Paraguayan | 21 | 0.0% |
| Pennsylvania German | 1,750 | 0.5% |
| Peruvian | 68 | 0.0% |
| Polish | 32,615 | 9.2% |
| Portuguese | 221 | 0.1% |
| Puerto Rican | 1,364 | 0.4% |
| Romanian | 324 | 0.1% |
| Russian | 4,465 | 1.3% |
| Salvadoran | 30 | 0.0% |
| Samoan | 23 | 0.0% |
| Scandinavian | 329 | 0.1% |
| Scotch-Irish | 5,661 | 1.6% |
| Scottish | 7,131 | 2.0% |
| Seminole | 1 | 0.0% |
| Serbian | 1,745 | 0.5% |
| Sioux | 11 | 0.0% |
| Slavic | 1,138 | 0.3% |
| Slovak | 17,640 | 5.0% |
| Slovene | 1,158 | 0.3% |
| South African | 52 | 0.0% |
| South American | 385 | 0.1% |
| South American Indian | 18 | 0.0% |
| Soviet Union | 13 | 0.0% |
| Spaniard | 148 | 0.0% |
| Spanish | 336 | 0.1% |
| Sri Lankan | 487 | 0.1% |
| Subsaharan African | 584 | 0.2% |
| Swedish | 3,200 | 0.9% |
| Swiss | 505 | 0.1% |
| Syrian | 886 | 0.3% |
| Thai | 1,109 | 0.3% |
| Tlingit-Haida | 15 | 0.0% |
| Trinidadian and Tobagonian | 1 | 0.0% |
| Turkish | 103 | 0.0% |
| Ukrainian | 3,460 | 1.0% |
| Uruguayan | 34 | 0.0% |
| Venezuelan | 143 | 0.0% |
| Welsh | 3,562 | 1.0% |
| West Indian | 26 | 0.0% |
| Yugoslavian | 443 | 0.1% | View All 127 Rows |
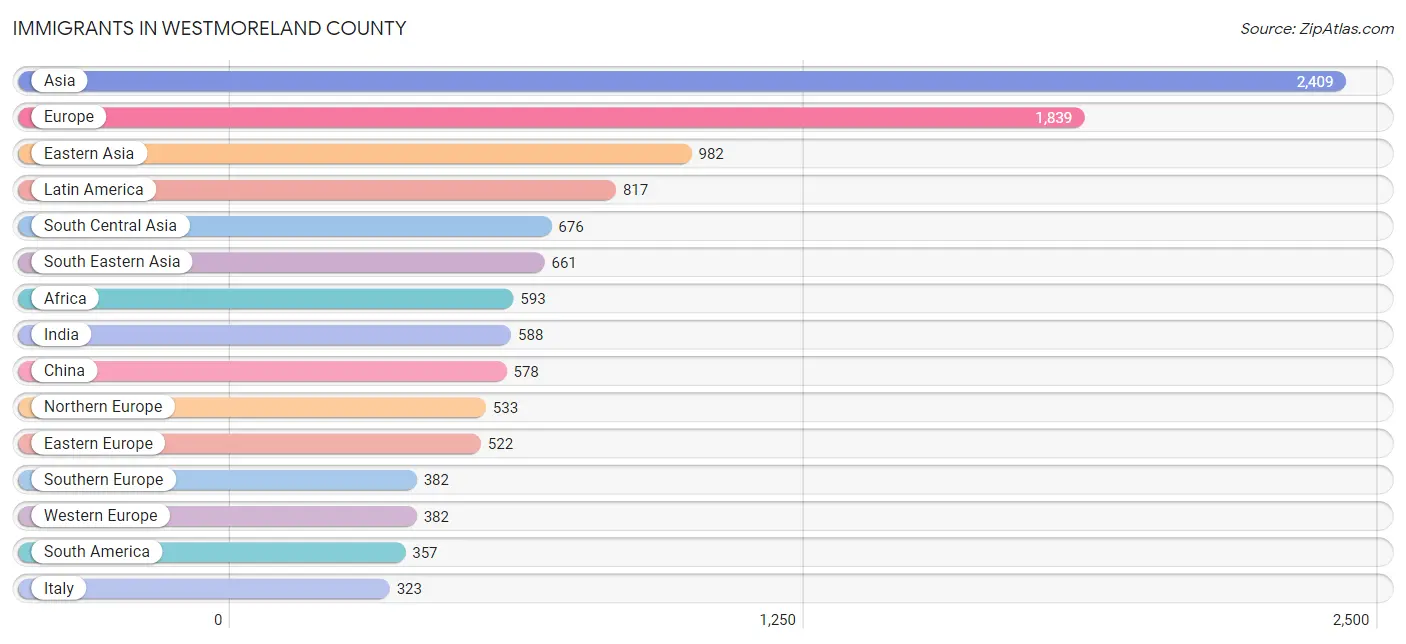
Immigrants in Westmoreland County
The most numerous immigrant groups reported in Westmoreland County came from Asia (2,409 | 0.7%), Europe (1,839 | 0.5%), Eastern Asia (982 | 0.3%), Latin America (817 | 0.2%), and South Central Asia (676 | 0.2%), together accounting for 1.9% of all Westmoreland County residents.
| Immigration Origin | # Population | % Population |
| Africa | 593 | 0.2% |
| Argentina | 17 | 0.0% |
| Asia | 2,409 | 0.7% |
| Australia | 26 | 0.0% |
| Austria | 18 | 0.0% |
| Bahamas | 19 | 0.0% |
| Bangladesh | 41 | 0.0% |
| Belarus | 15 | 0.0% |
| Bolivia | 16 | 0.0% |
| Bosnia and Herzegovina | 13 | 0.0% |
| Brazil | 47 | 0.0% |
| Bulgaria | 15 | 0.0% |
| Cameroon | 59 | 0.0% |
| Canada | 204 | 0.1% |
| Caribbean | 215 | 0.1% |
| Central America | 245 | 0.1% |
| Chile | 12 | 0.0% |
| China | 578 | 0.2% |
| Colombia | 62 | 0.0% |
| Cuba | 10 | 0.0% |
| Czechoslovakia | 61 | 0.0% |
| Denmark | 11 | 0.0% |
| Dominican Republic | 131 | 0.0% |
| Eastern Africa | 169 | 0.1% |
| Eastern Asia | 982 | 0.3% |
| Eastern Europe | 522 | 0.2% |
| Egypt | 16 | 0.0% |
| England | 258 | 0.1% |
| Europe | 1,839 | 0.5% |
| France | 41 | 0.0% |
| Germany | 253 | 0.1% |
| Ghana | 90 | 0.0% |
| Greece | 44 | 0.0% |
| Guatemala | 26 | 0.0% |
| Guyana | 41 | 0.0% |
| Haiti | 13 | 0.0% |
| Hong Kong | 8 | 0.0% |
| Hungary | 21 | 0.0% |
| India | 588 | 0.2% |
| Indonesia | 5 | 0.0% |
| Iraq | 15 | 0.0% |
| Ireland | 48 | 0.0% |
| Italy | 323 | 0.1% |
| Japan | 137 | 0.0% |
| Kazakhstan | 10 | 0.0% |
| Korea | 267 | 0.1% |
| Latin America | 817 | 0.2% |
| Latvia | 10 | 0.0% |
| Liberia | 67 | 0.0% |
| Mexico | 197 | 0.1% |
| Middle Africa | 73 | 0.0% |
| Netherlands | 70 | 0.0% |
| Nicaragua | 22 | 0.0% |
| Northern Africa | 40 | 0.0% |
| Northern Europe | 533 | 0.2% |
| Norway | 5 | 0.0% |
| Oceania | 27 | 0.0% |
| Pakistan | 37 | 0.0% |
| Peru | 31 | 0.0% |
| Philippines | 314 | 0.1% |
| Poland | 82 | 0.0% |
| Romania | 91 | 0.0% |
| Russia | 171 | 0.1% |
| Scotland | 3 | 0.0% |
| Sierra Leone | 4 | 0.0% |
| South Africa | 24 | 0.0% |
| South America | 357 | 0.1% |
| South Central Asia | 676 | 0.2% |
| South Eastern Asia | 661 | 0.2% |
| Southern Europe | 382 | 0.1% |
| Spain | 15 | 0.0% |
| Sweden | 28 | 0.0% |
| Syria | 26 | 0.0% |
| Taiwan | 123 | 0.0% |
| Thailand | 43 | 0.0% |
| Trinidad and Tobago | 21 | 0.0% |
| Turkey | 22 | 0.0% |
| Ukraine | 43 | 0.0% |
| Uruguay | 27 | 0.0% |
| Venezuela | 83 | 0.0% |
| Vietnam | 299 | 0.1% |
| Western Africa | 161 | 0.1% |
| Western Asia | 84 | 0.0% |
| Western Europe | 382 | 0.1% |
| Zaire | 14 | 0.0% |
| Zimbabwe | 15 | 0.0% | View All 86 Rows |
Sex and Age in Westmoreland County
Sex and Age in Westmoreland County
The most populous age groups in Westmoreland County are 55 to 59 Years (14,178 | 8.1%) for men and 60 to 64 Years (15,305 | 8.5%) for women.
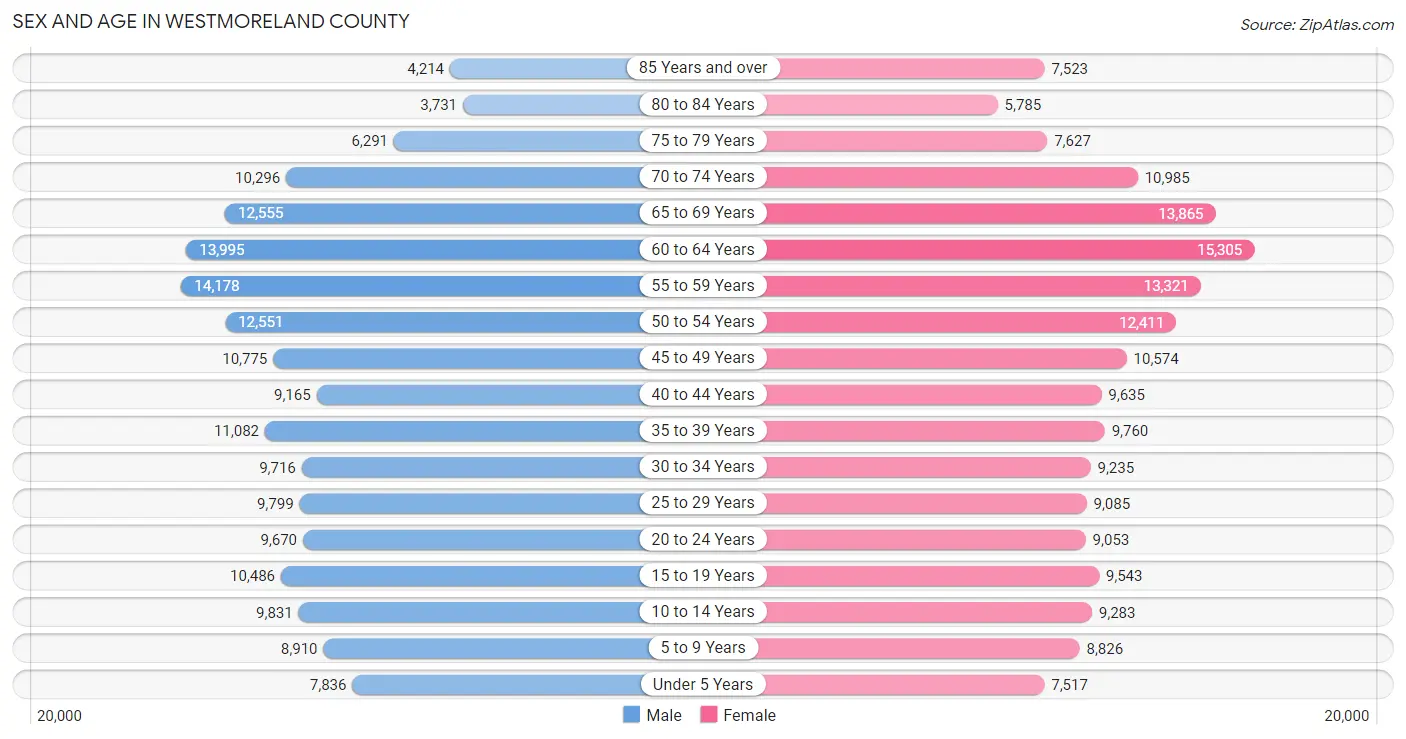
| Age Bracket | Male | Female |
| Under 5 Years | 7,836 (4.5%) | 7,517 (4.2%) |
| 5 to 9 Years | 8,910 (5.1%) | 8,826 (4.9%) |
| 10 to 14 Years | 9,831 (5.6%) | 9,283 (5.2%) |
| 15 to 19 Years | 10,486 (6.0%) | 9,543 (5.3%) |
| 20 to 24 Years | 9,670 (5.5%) | 9,053 (5.1%) |
| 25 to 29 Years | 9,799 (5.6%) | 9,085 (5.1%) |
| 30 to 34 Years | 9,716 (5.6%) | 9,235 (5.1%) |
| 35 to 39 Years | 11,082 (6.3%) | 9,760 (5.4%) |
| 40 to 44 Years | 9,165 (5.2%) | 9,635 (5.4%) |
| 45 to 49 Years | 10,775 (6.1%) | 10,574 (5.9%) |
| 50 to 54 Years | 12,551 (7.2%) | 12,411 (6.9%) |
| 55 to 59 Years | 14,178 (8.1%) | 13,321 (7.4%) |
| 60 to 64 Years | 13,995 (8.0%) | 15,305 (8.5%) |
| 65 to 69 Years | 12,555 (7.2%) | 13,865 (7.7%) |
| 70 to 74 Years | 10,296 (5.9%) | 10,985 (6.1%) |
| 75 to 79 Years | 6,291 (3.6%) | 7,627 (4.3%) |
| 80 to 84 Years | 3,731 (2.1%) | 5,785 (3.2%) |
| 85 Years and over | 4,214 (2.4%) | 7,523 (4.2%) |
| Total | 175,081 (100.0%) | 179,333 (100.0%) |
Families and Households in Westmoreland County
Median Family Size in Westmoreland County
The median family size in Westmoreland County is 2.84 persons per family, with married-couple families (76,786 | 79.5%) accounting for the largest median family size of 2.9 persons per family. On the other hand, single male/father families (5,989 | 6.2%) represent the smallest median family size with 2.53 persons per family.
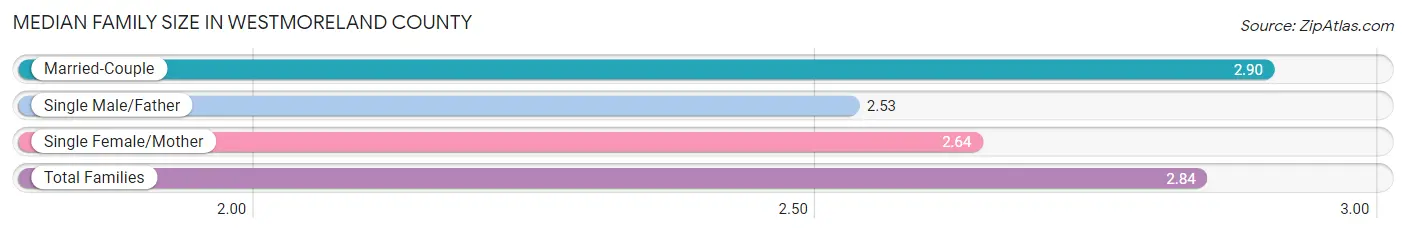
| Family Type | # Families | Family Size |
| Married-Couple | 76,786 (79.5%) | 2.90 |
| Single Male/Father | 5,989 (6.2%) | 2.53 |
| Single Female/Mother | 13,749 (14.2%) | 2.64 |
| Total Families | 96,524 (100.0%) | 2.84 |
Median Household Size in Westmoreland County
The median household size in Westmoreland County is 2.26 persons per household, with married-couple households (76,786 | 50.1%) accounting for the largest median household size of 2.92 persons per household. non-family households (56,713 | 37.0%) represent the smallest median household size with 1.17 persons per household.
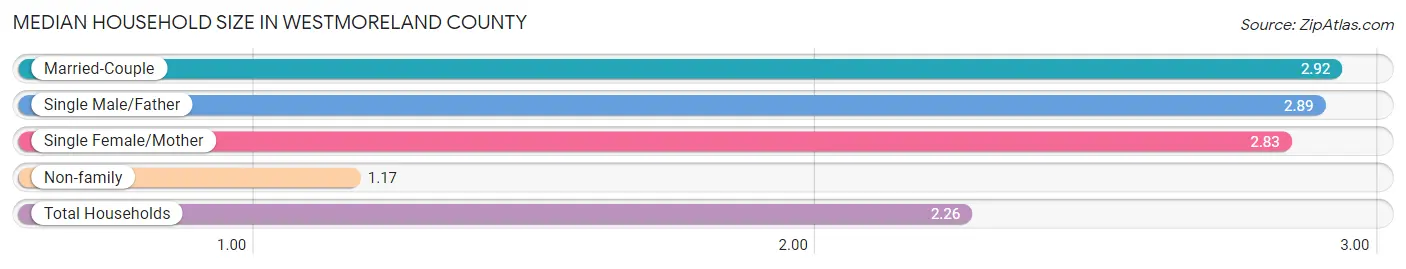
| Household Type | # Households | Household Size |
| Married-Couple | 76,786 (50.1%) | 2.92 |
| Single Male/Father | 5,989 (3.9%) | 2.89 |
| Single Female/Mother | 13,749 (9.0%) | 2.83 |
| Non-family | 56,713 (37.0%) | 1.17 |
| Total Households | 153,237 (100.0%) | 2.26 |
Household Size by Marriage Status in Westmoreland County
Out of a total of 153,237 households in Westmoreland County, 96,524 (63.0%) are family households, while 56,713 (37.0%) are nonfamily households. The most numerous type of family households are 2-person households, comprising 50,468, and the most common type of nonfamily households are 1-person households, comprising 48,600.
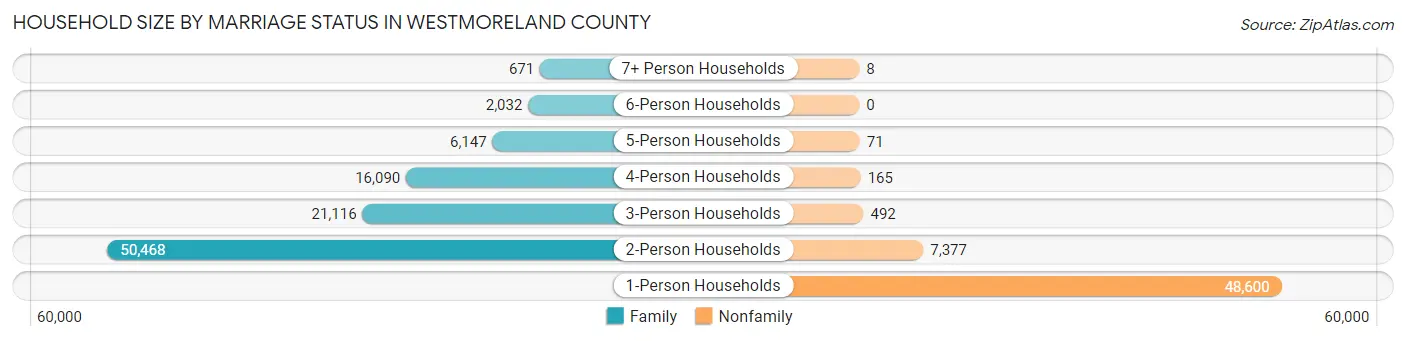
| Household Size | Family Households | Nonfamily Households |
| 1-Person Households | - | 48,600 (31.7%) |
| 2-Person Households | 50,468 (32.9%) | 7,377 (4.8%) |
| 3-Person Households | 21,116 (13.8%) | 492 (0.3%) |
| 4-Person Households | 16,090 (10.5%) | 165 (0.1%) |
| 5-Person Households | 6,147 (4.0%) | 71 (0.1%) |
| 6-Person Households | 2,032 (1.3%) | 0 (0.0%) |
| 7+ Person Households | 671 (0.4%) | 8 (0.0%) |
| Total | 96,524 (63.0%) | 56,713 (37.0%) |
Female Fertility in Westmoreland County
Fertility by Age in Westmoreland County
Average fertility rate in Westmoreland County is 53.0 births per 1,000 women. Women in the age bracket of 20 to 34 years have the highest fertility rate with 104.0 births per 1,000 women. Women in the age bracket of 20 to 34 years acount for 77.2% of all women with births.
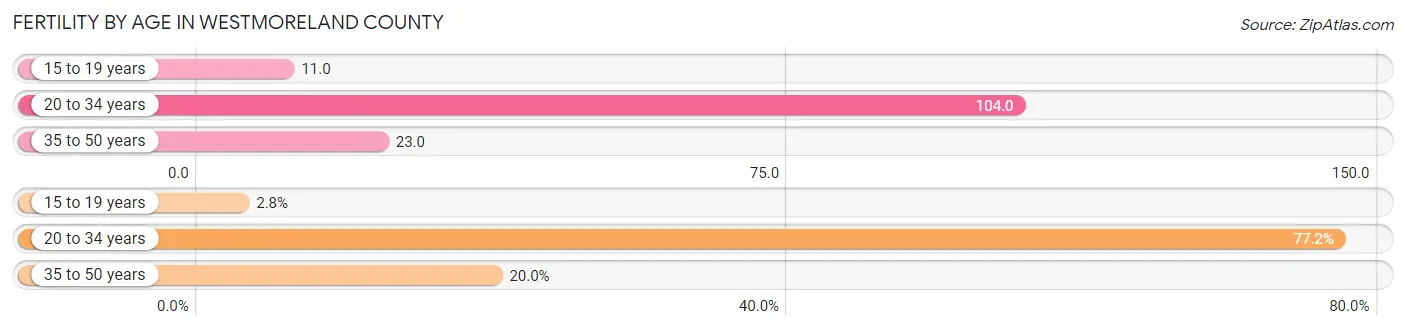
| Age Bracket | Women with Births | Births / 1,000 Women |
| 15 to 19 years | 103 (2.8%) | 11.0 |
| 20 to 34 years | 2,837 (77.2%) | 104.0 |
| 35 to 50 years | 734 (20.0%) | 23.0 |
| Total | 3,674 (100.0%) | 53.0 |
Fertility by Age by Marriage Status in Westmoreland County
68.7% of women with births (3,674) in Westmoreland County are married. The highest percentage of unmarried women with births falls into 15 to 19 years age bracket with 97.1% of them unmarried at the time of birth, while the lowest percentage of unmarried women with births belong to 35 to 50 years age bracket with 5.0% of them unmarried.
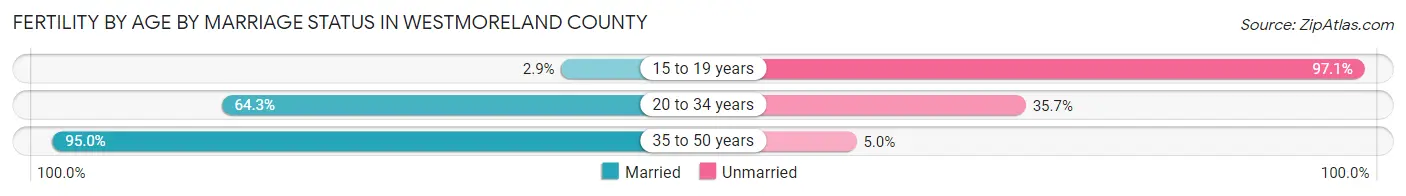
| Age Bracket | Married | Unmarried |
| 15 to 19 years | 3 (2.9%) | 100 (97.1%) |
| 20 to 34 years | 1,824 (64.3%) | 1,013 (35.7%) |
| 35 to 50 years | 697 (95.0%) | 37 (5.0%) |
| Total | 2,524 (68.7%) | 1,150 (31.3%) |
Fertility by Education in Westmoreland County
Average fertility rate in Westmoreland County is 53.0 births per 1,000 women. Women with the education attainment of graduate degree have the highest fertility rate of 72.0 births per 1,000 women, while women with the education attainment of less than high school have the lowest fertility at 21.0 births per 1,000 women. Women with the education attainment of college or associate's degree represent 30.8% of all women with births.
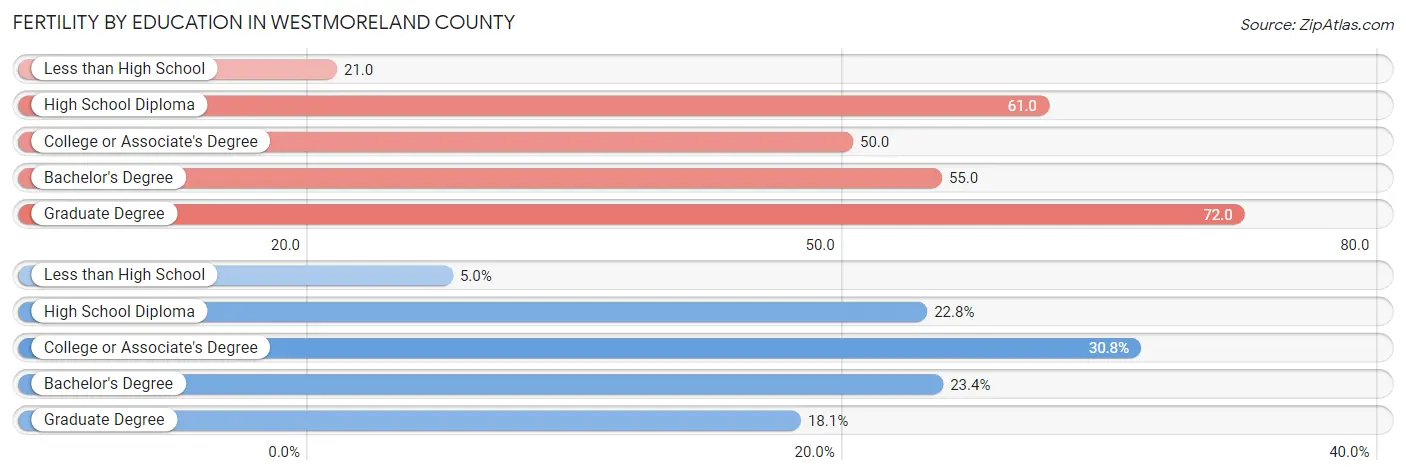
| Educational Attainment | Women with Births | Births / 1,000 Women |
| Less than High School | 184 (5.0%) | 21.0 |
| High School Diploma | 837 (22.8%) | 61.0 |
| College or Associate's Degree | 1,131 (30.8%) | 50.0 |
| Bachelor's Degree | 859 (23.4%) | 55.0 |
| Graduate Degree | 663 (18.0%) | 72.0 |
| Total | 3,674 (100.0%) | 53.0 |
Fertility by Education by Marriage Status in Westmoreland County
31.3% of women with births in Westmoreland County are unmarried. Women with the educational attainment of graduate degree are most likely to be married with 100.0% of them married at childbirth, while women with the educational attainment of less than high school are least likely to be married with 83.2% of them unmarried at childbirth.
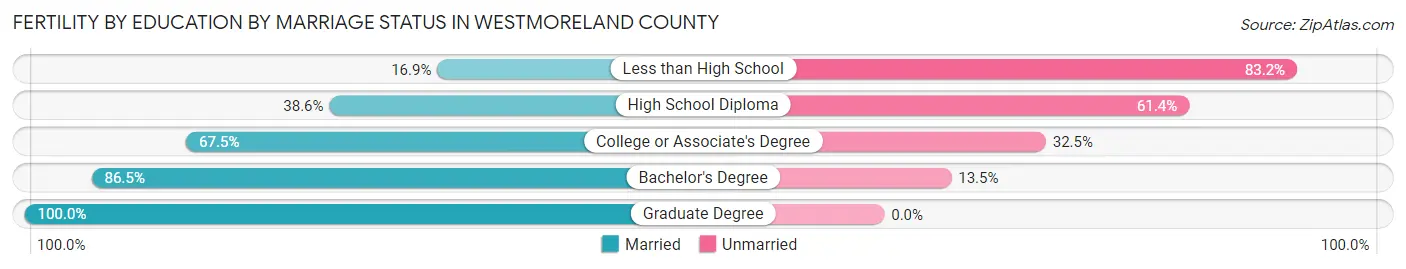
| Educational Attainment | Married | Unmarried |
| Less than High School | 31 (16.9%) | 153 (83.2%) |
| High School Diploma | 323 (38.6%) | 514 (61.4%) |
| College or Associate's Degree | 763 (67.5%) | 368 (32.5%) |
| Bachelor's Degree | 743 (86.5%) | 116 (13.5%) |
| Graduate Degree | 663 (100.0%) | 0 (0.0%) |
| Total | 2,524 (68.7%) | 1,150 (31.3%) |
Employment Characteristics in Westmoreland County
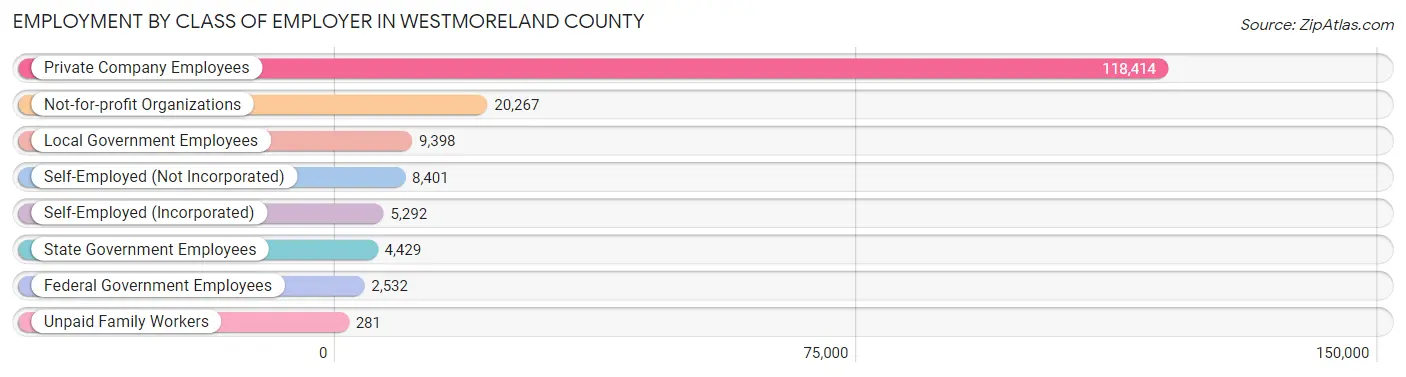
Employment by Class of Employer in Westmoreland County
Among the 169,014 employed individuals in Westmoreland County, private company employees (118,414 | 70.1%), not-for-profit organizations (20,267 | 12.0%), and local government employees (9,398 | 5.6%) make up the most common classes of employment.
| Employer Class | # Employees | % Employees |
| Private Company Employees | 118,414 | 70.1% |
| Self-Employed (Incorporated) | 5,292 | 3.1% |
| Self-Employed (Not Incorporated) | 8,401 | 5.0% |
| Not-for-profit Organizations | 20,267 | 12.0% |
| Local Government Employees | 9,398 | 5.6% |
| State Government Employees | 4,429 | 2.6% |
| Federal Government Employees | 2,532 | 1.5% |
| Unpaid Family Workers | 281 | 0.2% |
| Total | 169,014 | 100.0% |
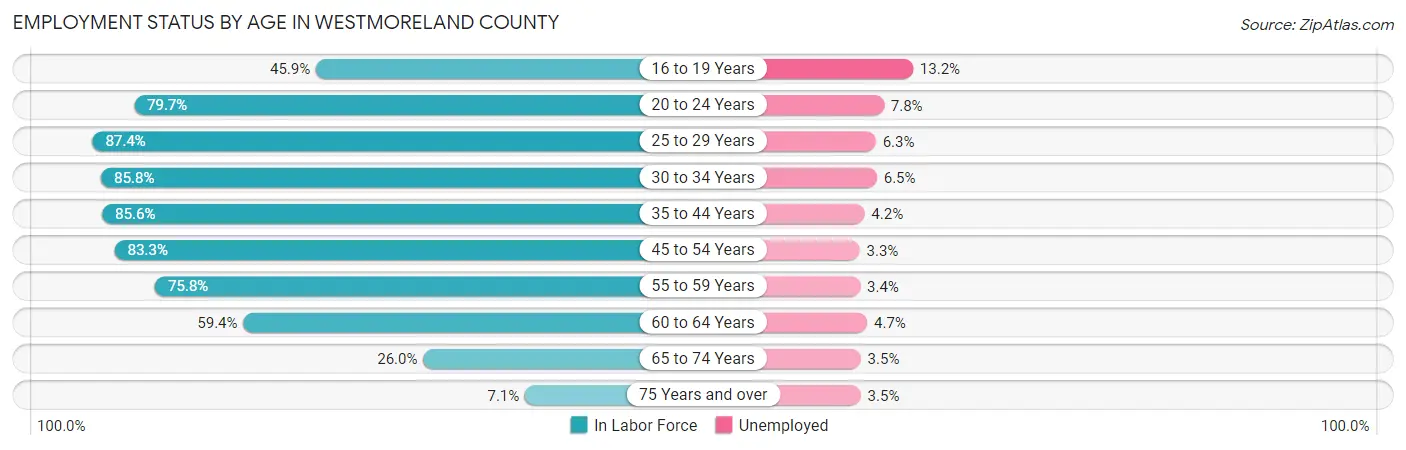
Employment Status by Age in Westmoreland County
According to the labor force statistics for Westmoreland County, out of the total population over 16 years of age (297,917), 60.6% or 180,538 individuals are in the labor force, with 5.0% or 9,027 of them unemployed. The age group with the highest labor force participation rate is 25 to 29 years, with 87.4% or 16,505 individuals in the labor force. Within the labor force, the 16 to 19 years age range has the highest percentage of unemployed individuals, with 13.2% or 953 of them being unemployed.
| Age Bracket | In Labor Force | Unemployed |
| 16 to 19 Years | 7,222 (45.9%) | 953 (13.2%) |
| 20 to 24 Years | 14,922 (79.7%) | 1,164 (7.8%) |
| 25 to 29 Years | 16,505 (87.4%) | 1,040 (6.3%) |
| 30 to 34 Years | 16,260 (85.8%) | 1,057 (6.5%) |
| 35 to 44 Years | 33,934 (85.6%) | 1,425 (4.2%) |
| 45 to 54 Years | 38,577 (83.3%) | 1,273 (3.3%) |
| 55 to 59 Years | 20,844 (75.8%) | 709 (3.4%) |
| 60 to 64 Years | 17,404 (59.4%) | 818 (4.7%) |
| 65 to 74 Years | 12,402 (26.0%) | 434 (3.5%) |
| 75 Years and over | 2,497 (7.1%) | 87 (3.5%) |
| Total | 180,538 (60.6%) | 9,027 (5.0%) |
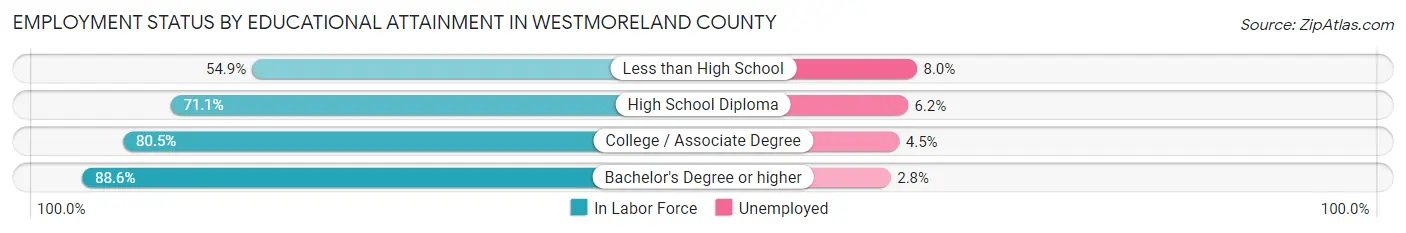
Employment Status by Educational Attainment in Westmoreland County
According to labor force statistics for Westmoreland County, 79.5% of individuals (143,567) out of the total population between 25 and 64 years of age (180,587) are in the labor force, with 4.4% or 6,317 of them being unemployed. The group with the highest labor force participation rate are those with the educational attainment of bachelor's degree or higher, with 88.6% or 55,673 individuals in the labor force. Within the labor force, individuals with less than high school education have the highest percentage of unemployment, with 8.0% or 298 of them being unemployed.
| Educational Attainment | In Labor Force | Unemployed |
| Less than High School | 3,725 (54.9%) | 543 (8.0%) |
| High School Diploma | 39,480 (71.1%) | 3,443 (6.2%) |
| College / Associate Degree | 44,628 (80.5%) | 2,495 (4.5%) |
| Bachelor's Degree or higher | 55,673 (88.6%) | 1,759 (2.8%) |
| Total | 143,567 (79.5%) | 7,946 (4.4%) |
Employment Occupations by Sex in Westmoreland County
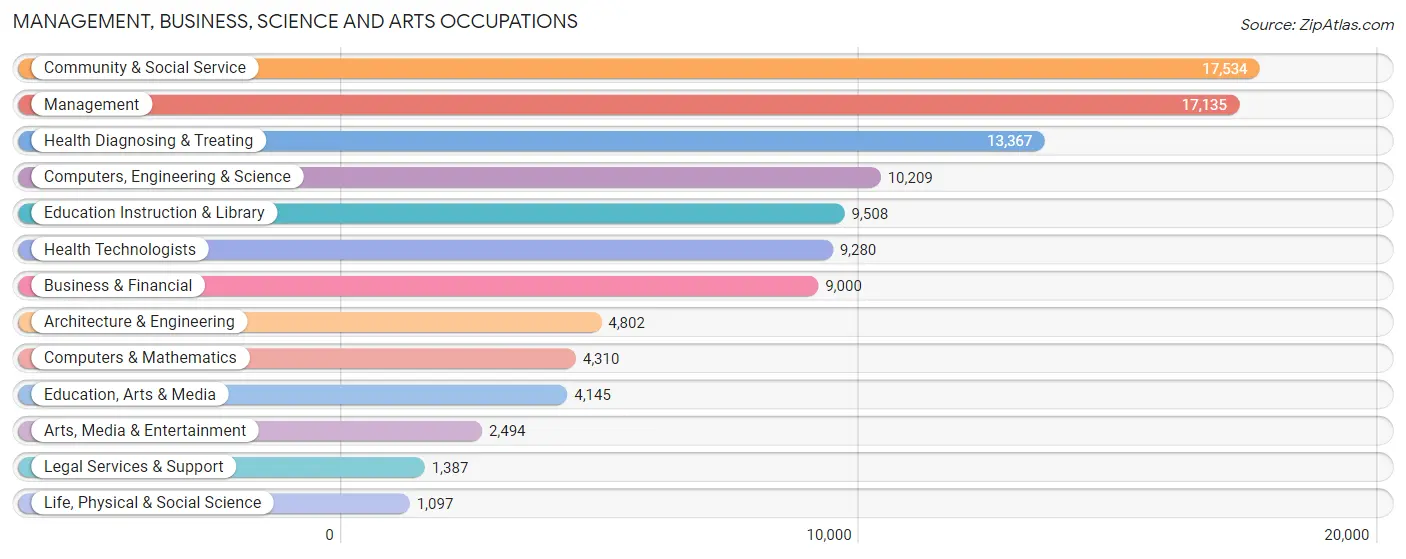
Management, Business, Science and Arts Occupations
The most common Management, Business, Science and Arts occupations in Westmoreland County are Community & Social Service (17,534 | 10.2%), Management (17,135 | 10.0%), Health Diagnosing & Treating (13,367 | 7.8%), Computers, Engineering & Science (10,209 | 5.9%), and Education Instruction & Library (9,508 | 5.5%).
Management, Business, Science and Arts Occupations by Sex
Within the Management, Business, Science and Arts occupations in Westmoreland County, the most male-oriented occupations are Architecture & Engineering (89.0%), Computers, Engineering & Science (80.9%), and Computers & Mathematics (78.2%), while the most female-oriented occupations are Health Diagnosing & Treating (78.8%), Health Technologists (77.6%), and Education Instruction & Library (72.9%).
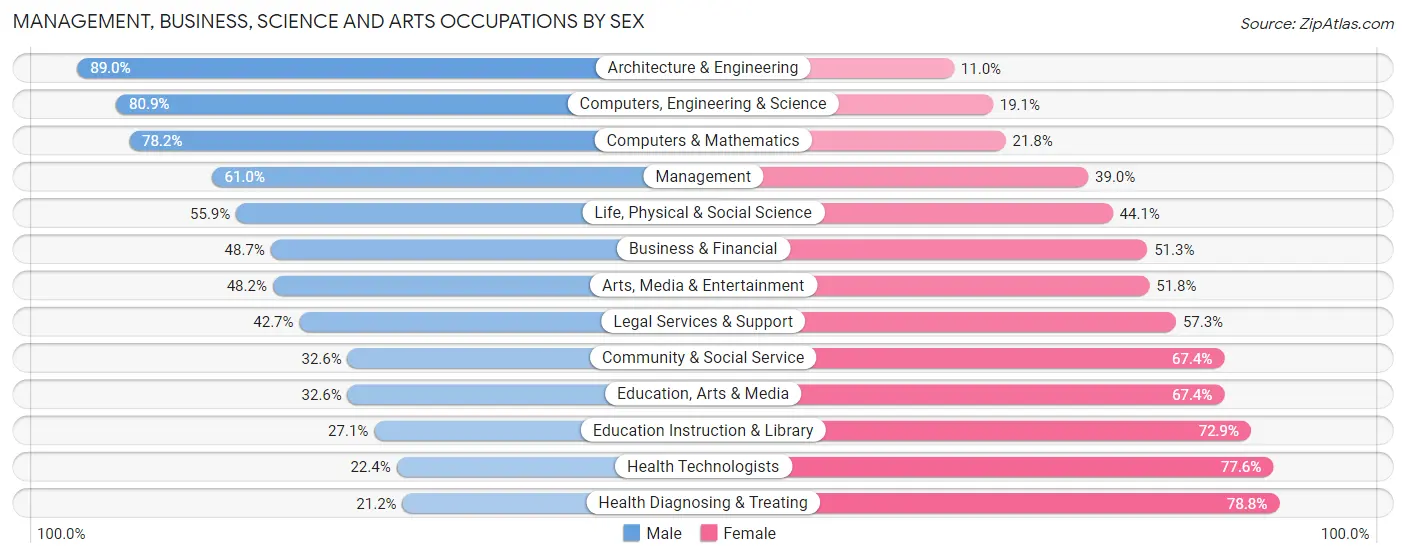
| Occupation | Male | Female |
| Management | 10,453 (61.0%) | 6,682 (39.0%) |
| Business & Financial | 4,380 (48.7%) | 4,620 (51.3%) |
| Computers, Engineering & Science | 8,258 (80.9%) | 1,951 (19.1%) |
| Computers & Mathematics | 3,371 (78.2%) | 939 (21.8%) |
| Architecture & Engineering | 4,274 (89.0%) | 528 (11.0%) |
| Life, Physical & Social Science | 613 (55.9%) | 484 (44.1%) |
| Community & Social Service | 5,722 (32.6%) | 11,812 (67.4%) |
| Education, Arts & Media | 1,352 (32.6%) | 2,793 (67.4%) |
| Legal Services & Support | 592 (42.7%) | 795 (57.3%) |
| Education Instruction & Library | 2,575 (27.1%) | 6,933 (72.9%) |
| Arts, Media & Entertainment | 1,203 (48.2%) | 1,291 (51.8%) |
| Health Diagnosing & Treating | 2,833 (21.2%) | 10,534 (78.8%) |
| Health Technologists | 2,081 (22.4%) | 7,199 (77.6%) |
| Total (Category) | 31,646 (47.1%) | 35,599 (52.9%) |
| Total (Overall) | 91,630 (53.4%) | 79,982 (46.6%) |
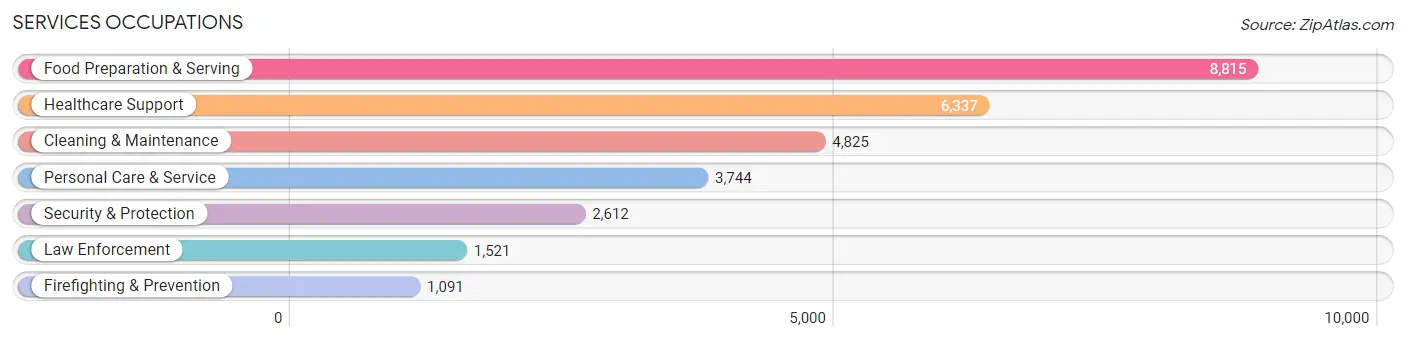
Services Occupations
The most common Services occupations in Westmoreland County are Food Preparation & Serving (8,815 | 5.1%), Healthcare Support (6,337 | 3.7%), Cleaning & Maintenance (4,825 | 2.8%), Personal Care & Service (3,744 | 2.2%), and Security & Protection (2,612 | 1.5%).
Services Occupations by Sex
Within the Services occupations in Westmoreland County, the most male-oriented occupations are Law Enforcement (88.0%), Security & Protection (80.3%), and Firefighting & Prevention (69.6%), while the most female-oriented occupations are Healthcare Support (87.9%), Personal Care & Service (77.0%), and Food Preparation & Serving (67.5%).
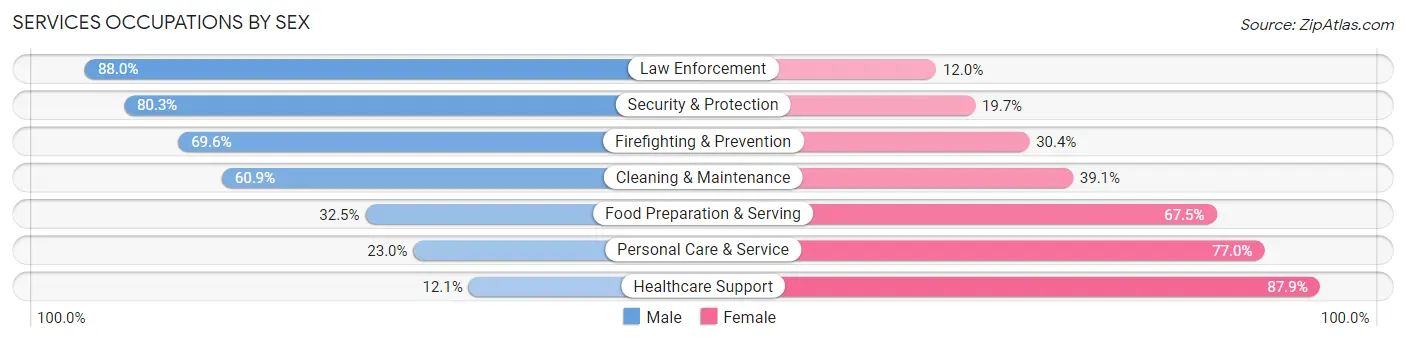
| Occupation | Male | Female |
| Healthcare Support | 766 (12.1%) | 5,571 (87.9%) |
| Security & Protection | 2,098 (80.3%) | 514 (19.7%) |
| Firefighting & Prevention | 759 (69.6%) | 332 (30.4%) |
| Law Enforcement | 1,339 (88.0%) | 182 (12.0%) |
| Food Preparation & Serving | 2,867 (32.5%) | 5,948 (67.5%) |
| Cleaning & Maintenance | 2,940 (60.9%) | 1,885 (39.1%) |
| Personal Care & Service | 862 (23.0%) | 2,882 (77.0%) |
| Total (Category) | 9,533 (36.2%) | 16,800 (63.8%) |
| Total (Overall) | 91,630 (53.4%) | 79,982 (46.6%) |
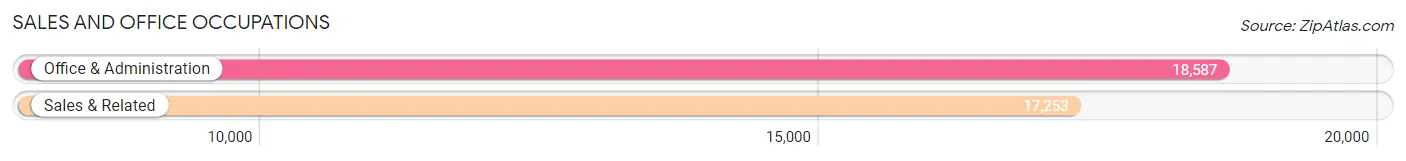
Sales and Office Occupations
The most common Sales and Office occupations in Westmoreland County are Office & Administration (18,587 | 10.8%), and Sales & Related (17,253 | 10.1%).
Sales and Office Occupations by Sex
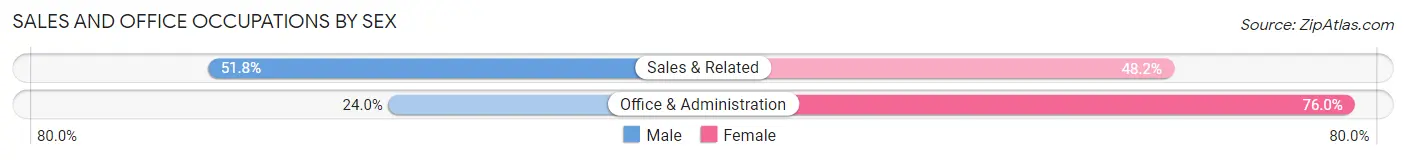
| Occupation | Male | Female |
| Sales & Related | 8,940 (51.8%) | 8,313 (48.2%) |
| Office & Administration | 4,459 (24.0%) | 14,128 (76.0%) |
| Total (Category) | 13,399 (37.4%) | 22,441 (62.6%) |
| Total (Overall) | 91,630 (53.4%) | 79,982 (46.6%) |
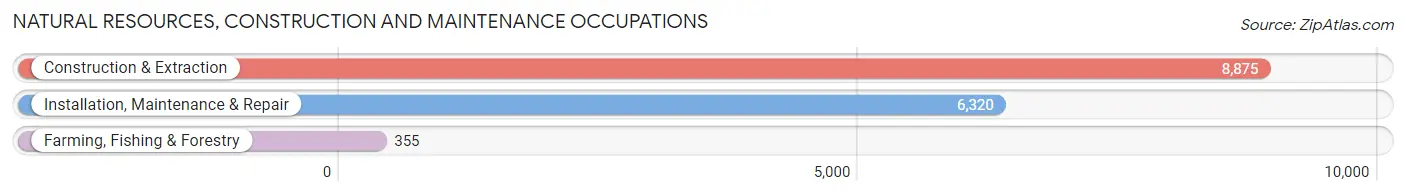
Natural Resources, Construction and Maintenance Occupations
The most common Natural Resources, Construction and Maintenance occupations in Westmoreland County are Construction & Extraction (8,875 | 5.2%), Installation, Maintenance & Repair (6,320 | 3.7%), and Farming, Fishing & Forestry (355 | 0.2%).
Natural Resources, Construction and Maintenance Occupations by Sex
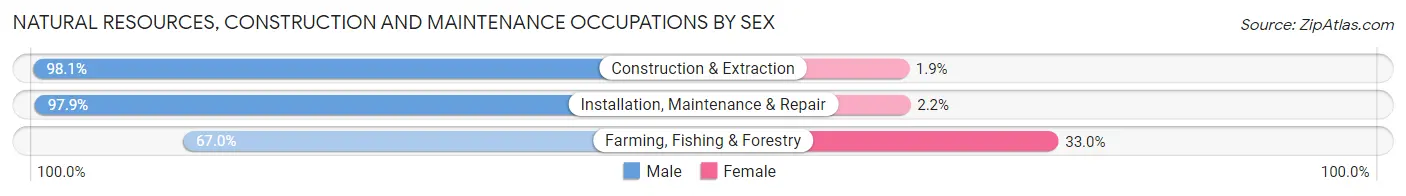
| Occupation | Male | Female |
| Farming, Fishing & Forestry | 238 (67.0%) | 117 (33.0%) |
| Construction & Extraction | 8,710 (98.1%) | 165 (1.9%) |
| Installation, Maintenance & Repair | 6,184 (97.9%) | 136 (2.1%) |
| Total (Category) | 15,132 (97.3%) | 418 (2.7%) |
| Total (Overall) | 91,630 (53.4%) | 79,982 (46.6%) |
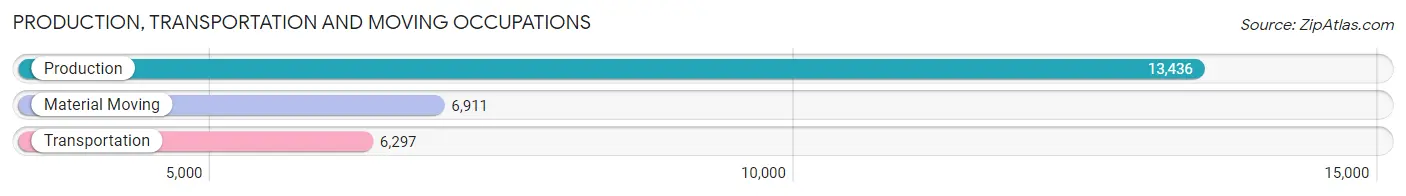
Production, Transportation and Moving Occupations
The most common Production, Transportation and Moving occupations in Westmoreland County are Production (13,436 | 7.8%), Material Moving (6,911 | 4.0%), and Transportation (6,297 | 3.7%).
Production, Transportation and Moving Occupations by Sex
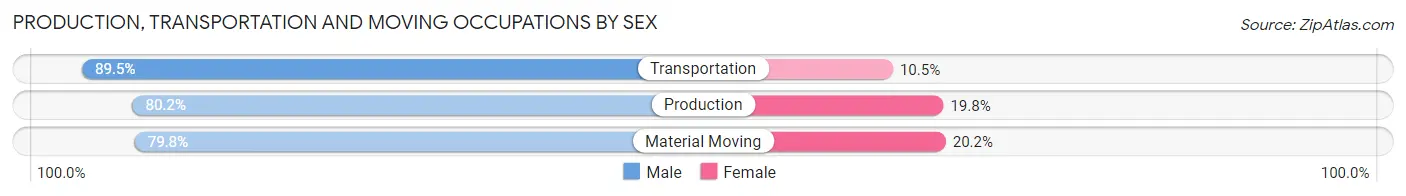
| Occupation | Male | Female |
| Production | 10,774 (80.2%) | 2,662 (19.8%) |
| Transportation | 5,633 (89.5%) | 664 (10.5%) |
| Material Moving | 5,513 (79.8%) | 1,398 (20.2%) |
| Total (Category) | 21,920 (82.3%) | 4,724 (17.7%) |
| Total (Overall) | 91,630 (53.4%) | 79,982 (46.6%) |
Employment Industries by Sex in Westmoreland County
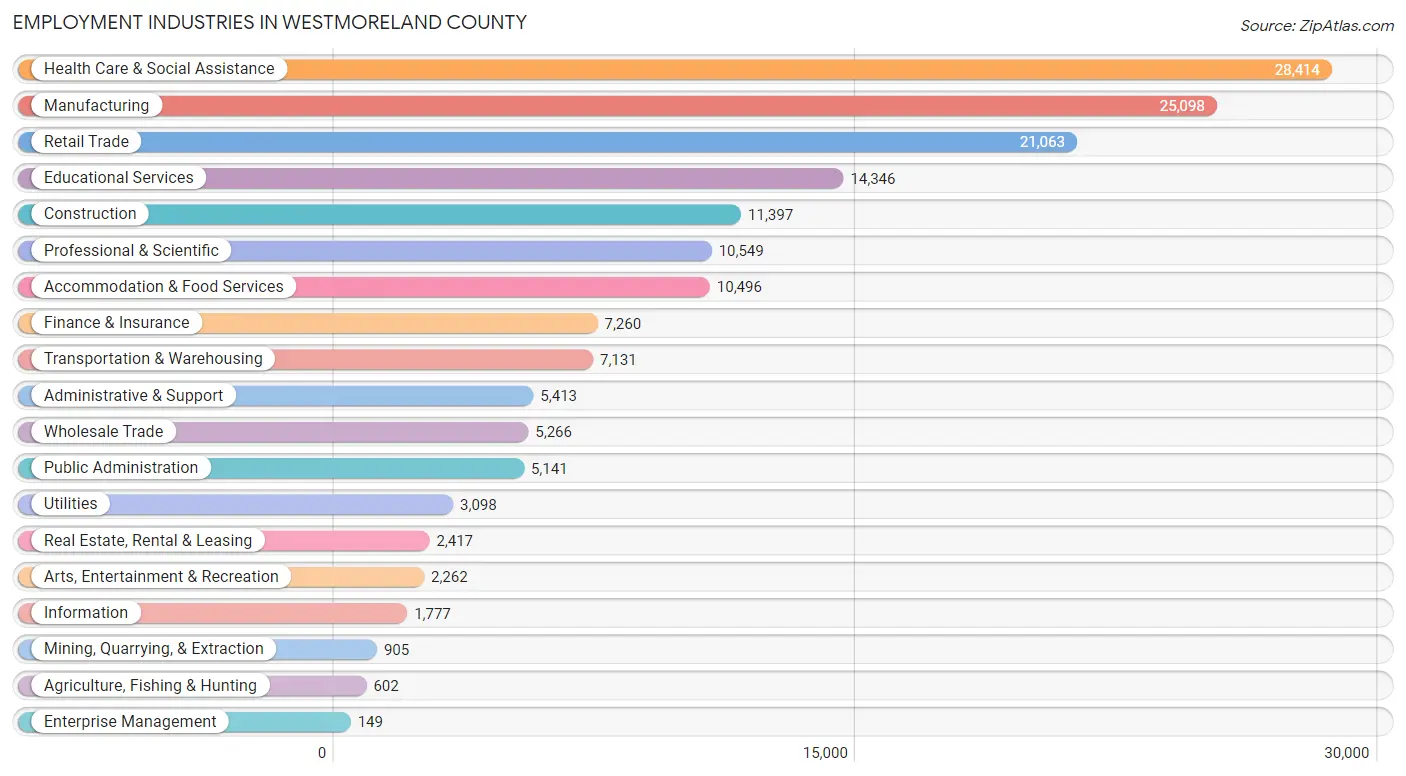
Employment Industries in Westmoreland County
The major employment industries in Westmoreland County include Health Care & Social Assistance (28,414 | 16.6%), Manufacturing (25,098 | 14.6%), Retail Trade (21,063 | 12.3%), Educational Services (14,346 | 8.4%), and Construction (11,397 | 6.6%).
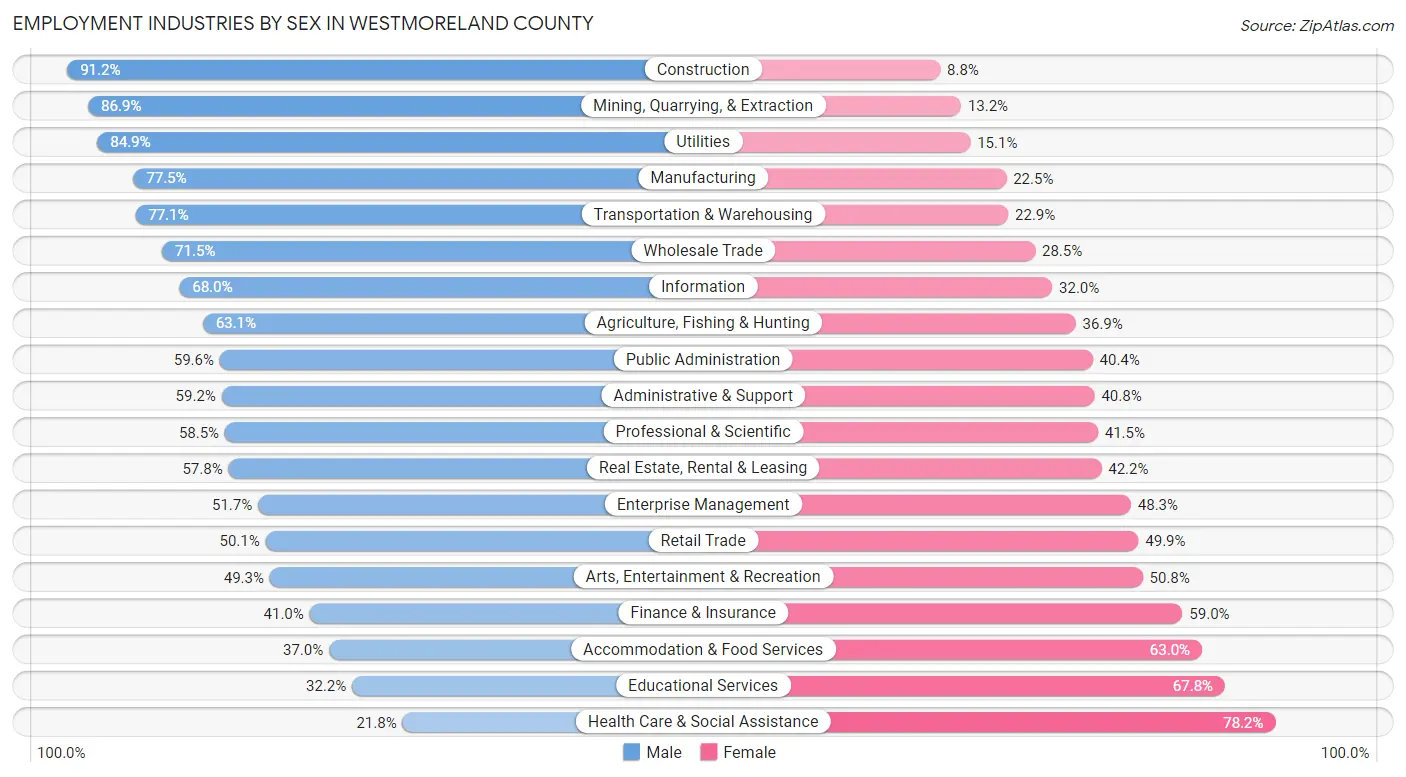
Employment Industries by Sex in Westmoreland County
The Westmoreland County industries that see more men than women are Construction (91.2%), Mining, Quarrying, & Extraction (86.9%), and Utilities (84.9%), whereas the industries that tend to have a higher number of women are Health Care & Social Assistance (78.2%), Educational Services (67.8%), and Accommodation & Food Services (63.0%).
| Industry | Male | Female |
| Agriculture, Fishing & Hunting | 380 (63.1%) | 222 (36.9%) |
| Mining, Quarrying, & Extraction | 786 (86.9%) | 119 (13.2%) |
| Construction | 10,391 (91.2%) | 1,006 (8.8%) |
| Manufacturing | 19,446 (77.5%) | 5,652 (22.5%) |
| Wholesale Trade | 3,766 (71.5%) | 1,500 (28.5%) |
| Retail Trade | 10,558 (50.1%) | 10,505 (49.9%) |
| Transportation & Warehousing | 5,497 (77.1%) | 1,634 (22.9%) |
| Utilities | 2,631 (84.9%) | 467 (15.1%) |
| Information | 1,208 (68.0%) | 569 (32.0%) |
| Finance & Insurance | 2,977 (41.0%) | 4,283 (59.0%) |
| Real Estate, Rental & Leasing | 1,397 (57.8%) | 1,020 (42.2%) |
| Professional & Scientific | 6,174 (58.5%) | 4,375 (41.5%) |
| Enterprise Management | 77 (51.7%) | 72 (48.3%) |
| Administrative & Support | 3,205 (59.2%) | 2,208 (40.8%) |
| Educational Services | 4,622 (32.2%) | 9,724 (67.8%) |
| Health Care & Social Assistance | 6,188 (21.8%) | 22,226 (78.2%) |
| Arts, Entertainment & Recreation | 1,114 (49.2%) | 1,148 (50.7%) |
| Accommodation & Food Services | 3,881 (37.0%) | 6,615 (63.0%) |
| Public Administration | 3,064 (59.6%) | 2,077 (40.4%) |
| Total | 91,630 (53.4%) | 79,982 (46.6%) |
Education in Westmoreland County
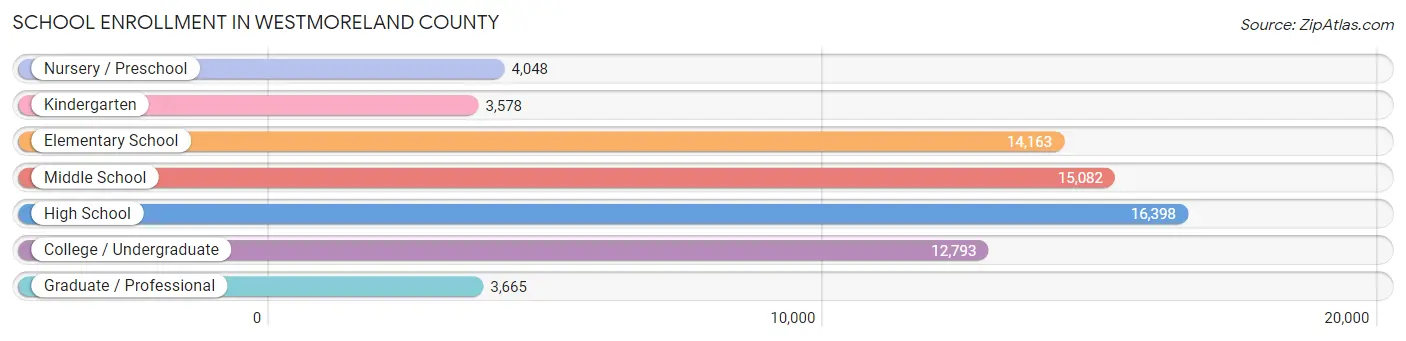
School Enrollment in Westmoreland County
The most common levels of schooling among the 69,727 students in Westmoreland County are high school (16,398 | 23.5%), middle school (15,082 | 21.6%), and elementary school (14,163 | 20.3%).
| School Level | # Students | % Students |
| Nursery / Preschool | 4,048 | 5.8% |
| Kindergarten | 3,578 | 5.1% |
| Elementary School | 14,163 | 20.3% |
| Middle School | 15,082 | 21.6% |
| High School | 16,398 | 23.5% |
| College / Undergraduate | 12,793 | 18.3% |
| Graduate / Professional | 3,665 | 5.3% |
| Total | 69,727 | 100.0% |
School Enrollment by Age by Funding Source in Westmoreland County
Out of a total of 69,727 students who are enrolled in schools in Westmoreland County, 13,318 (19.1%) attend a private institution, while the remaining 56,409 (80.9%) are enrolled in public schools. The age group of 3 to 4 year olds has the highest likelihood of being enrolled in private schools, with 1,270 (43.9% in the age bracket) enrolled. Conversely, the age group of 15 to 17 year olds has the lowest likelihood of being enrolled in a private school, with 11,289 (93.0% in the age bracket) attending a public institution.
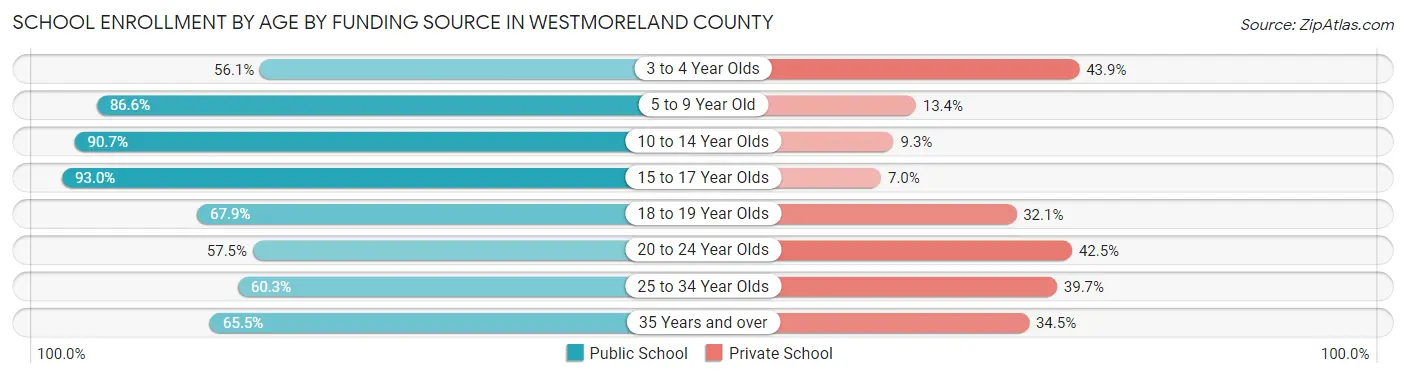
| Age Bracket | Public School | Private School |
| 3 to 4 Year Olds | 1,624 (56.1%) | 1,270 (43.9%) |
| 5 to 9 Year Old | 14,556 (86.6%) | 2,260 (13.4%) |
| 10 to 14 Year Olds | 17,080 (90.7%) | 1,752 (9.3%) |
| 15 to 17 Year Olds | 11,289 (93.0%) | 844 (7.0%) |
| 18 to 19 Year Olds | 3,877 (67.9%) | 1,836 (32.1%) |
| 20 to 24 Year Olds | 4,311 (57.5%) | 3,189 (42.5%) |
| 25 to 34 Year Olds | 1,561 (60.3%) | 1,028 (39.7%) |
| 35 Years and over | 2,128 (65.5%) | 1,122 (34.5%) |
| Total | 56,409 (80.9%) | 13,318 (19.1%) |
Educational Attainment by Field of Study in Westmoreland County
Business (16,835 | 19.0%), education (14,726 | 16.6%), science & technology (11,058 | 12.5%), engineering (7,305 | 8.3%), and arts & humanities (5,053 | 5.7%) are the most common fields of study among 88,534 individuals in Westmoreland County who have obtained a bachelor's degree or higher.
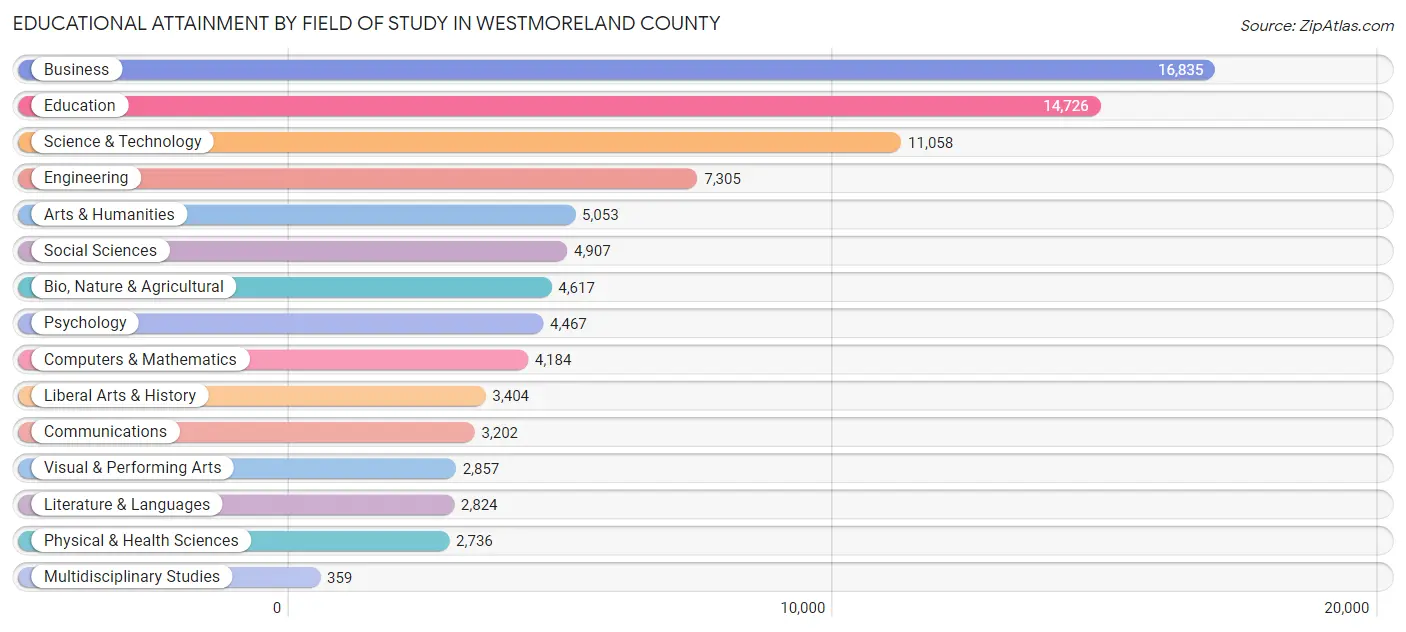
| Field of Study | # Graduates | % Graduates |
| Computers & Mathematics | 4,184 | 4.7% |
| Bio, Nature & Agricultural | 4,617 | 5.2% |
| Physical & Health Sciences | 2,736 | 3.1% |
| Psychology | 4,467 | 5.1% |
| Social Sciences | 4,907 | 5.5% |
| Engineering | 7,305 | 8.3% |
| Multidisciplinary Studies | 359 | 0.4% |
| Science & Technology | 11,058 | 12.5% |
| Business | 16,835 | 19.0% |
| Education | 14,726 | 16.6% |
| Literature & Languages | 2,824 | 3.2% |
| Liberal Arts & History | 3,404 | 3.8% |
| Visual & Performing Arts | 2,857 | 3.2% |
| Communications | 3,202 | 3.6% |
| Arts & Humanities | 5,053 | 5.7% |
| Total | 88,534 | 100.0% |
Transportation & Commute in Westmoreland County
Vehicle Availability by Sex in Westmoreland County
The most prevalent vehicle ownership categories in Westmoreland County are males with 2 vehicles (40,727, accounting for 45.4%) and females with 2 vehicles (34,983, making up 52.3%).
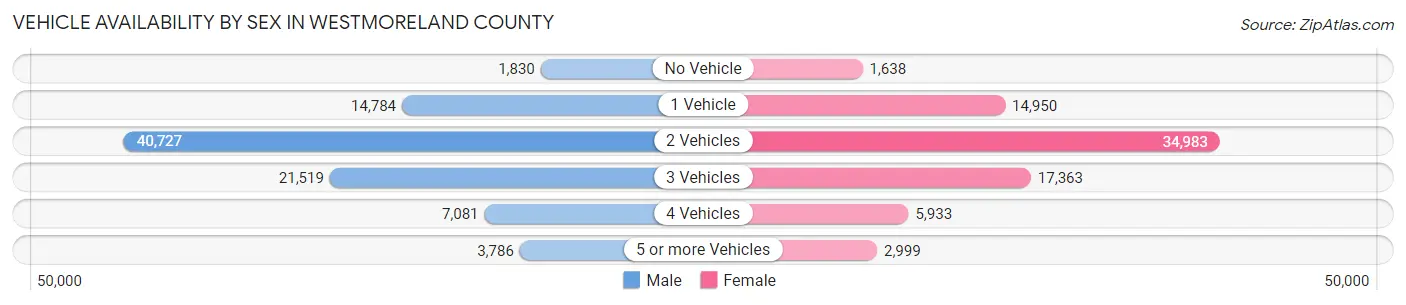
| Vehicles Available | Male | Female |
| No Vehicle | 1,830 (2.0%) | 1,638 (2.1%) |
| 1 Vehicle | 14,784 (16.5%) | 14,950 (19.2%) |
| 2 Vehicles | 40,727 (45.4%) | 34,983 (44.9%) |
| 3 Vehicles | 21,519 (24.0%) | 17,363 (22.3%) |
| 4 Vehicles | 7,081 (7.9%) | 5,933 (7.6%) |
| 5 or more Vehicles | 3,786 (4.2%) | 2,999 (3.8%) |
| Total | 89,727 (100.0%) | 77,866 (100.0%) |
Commute Time in Westmoreland County
The most frequently occuring commute durations in Westmoreland County are 15 to 19 minutes (22,122 commuters, 14.6%), 10 to 14 minutes (19,806 commuters, 13.1%), and 20 to 24 minutes (19,384 commuters, 12.8%).
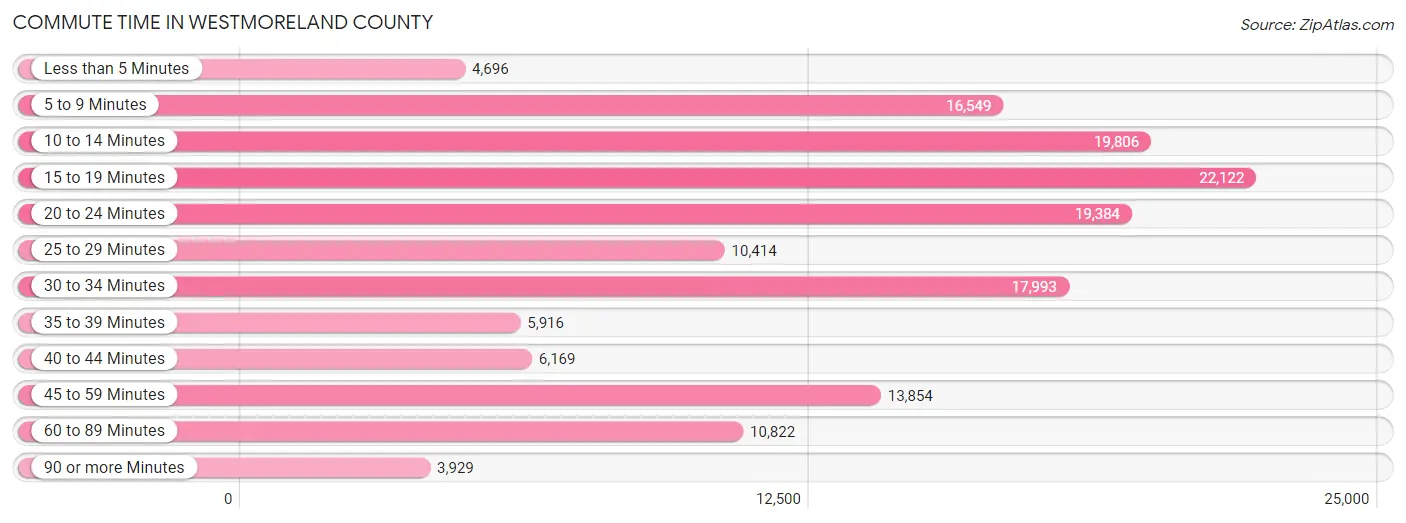
| Commute Time | # Commuters | % Commuters |
| Less than 5 Minutes | 4,696 | 3.1% |
| 5 to 9 Minutes | 16,549 | 10.9% |
| 10 to 14 Minutes | 19,806 | 13.1% |
| 15 to 19 Minutes | 22,122 | 14.6% |
| 20 to 24 Minutes | 19,384 | 12.8% |
| 25 to 29 Minutes | 10,414 | 6.9% |
| 30 to 34 Minutes | 17,993 | 11.9% |
| 35 to 39 Minutes | 5,916 | 3.9% |
| 40 to 44 Minutes | 6,169 | 4.1% |
| 45 to 59 Minutes | 13,854 | 9.1% |
| 60 to 89 Minutes | 10,822 | 7.1% |
| 90 or more Minutes | 3,929 | 2.6% |
Commute Time by Sex in Westmoreland County
The most common commute times in Westmoreland County are 15 to 19 minutes (11,555 commuters, 14.1%) for males and 15 to 19 minutes (10,567 commuters, 15.2%) for females.
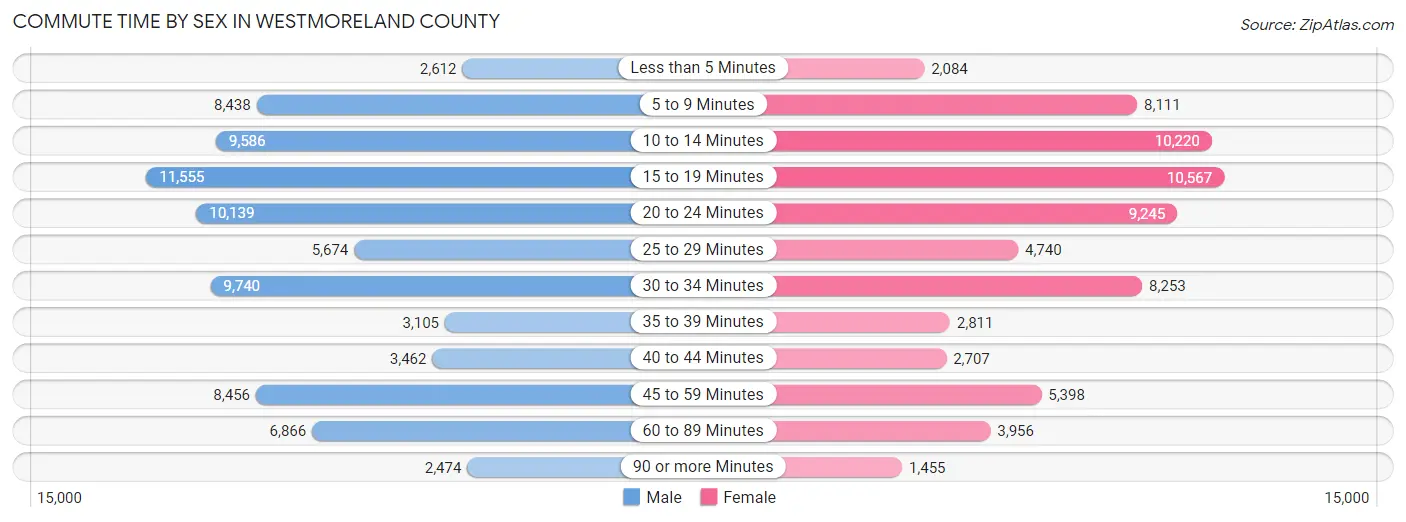
| Commute Time | Male | Female |
| Less than 5 Minutes | 2,612 (3.2%) | 2,084 (3.0%) |
| 5 to 9 Minutes | 8,438 (10.3%) | 8,111 (11.7%) |
| 10 to 14 Minutes | 9,586 (11.7%) | 10,220 (14.7%) |
| 15 to 19 Minutes | 11,555 (14.1%) | 10,567 (15.2%) |
| 20 to 24 Minutes | 10,139 (12.3%) | 9,245 (13.3%) |
| 25 to 29 Minutes | 5,674 (6.9%) | 4,740 (6.8%) |
| 30 to 34 Minutes | 9,740 (11.9%) | 8,253 (11.9%) |
| 35 to 39 Minutes | 3,105 (3.8%) | 2,811 (4.0%) |
| 40 to 44 Minutes | 3,462 (4.2%) | 2,707 (3.9%) |
| 45 to 59 Minutes | 8,456 (10.3%) | 5,398 (7.8%) |
| 60 to 89 Minutes | 6,866 (8.4%) | 3,956 (5.7%) |
| 90 or more Minutes | 2,474 (3.0%) | 1,455 (2.1%) |
Time of Departure to Work by Sex in Westmoreland County
The most frequent times of departure to work in Westmoreland County are 7:00 AM to 7:29 AM (10,681, 13.0%) for males and 7:00 AM to 7:29 AM (10,310, 14.8%) for females.
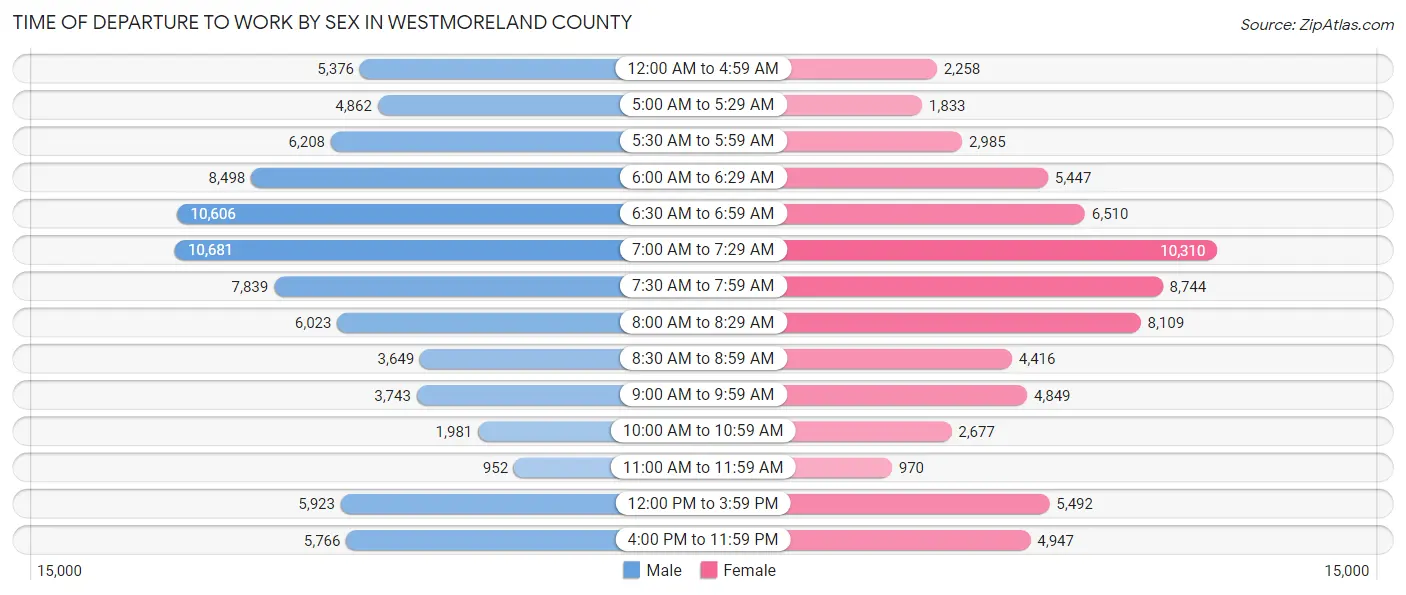
| Time of Departure | Male | Female |
| 12:00 AM to 4:59 AM | 5,376 (6.6%) | 2,258 (3.3%) |
| 5:00 AM to 5:29 AM | 4,862 (5.9%) | 1,833 (2.6%) |
| 5:30 AM to 5:59 AM | 6,208 (7.6%) | 2,985 (4.3%) |
| 6:00 AM to 6:29 AM | 8,498 (10.3%) | 5,447 (7.8%) |
| 6:30 AM to 6:59 AM | 10,606 (12.9%) | 6,510 (9.4%) |
| 7:00 AM to 7:29 AM | 10,681 (13.0%) | 10,310 (14.8%) |
| 7:30 AM to 7:59 AM | 7,839 (9.6%) | 8,744 (12.6%) |
| 8:00 AM to 8:29 AM | 6,023 (7.3%) | 8,109 (11.7%) |
| 8:30 AM to 8:59 AM | 3,649 (4.4%) | 4,416 (6.4%) |
| 9:00 AM to 9:59 AM | 3,743 (4.6%) | 4,849 (7.0%) |
| 10:00 AM to 10:59 AM | 1,981 (2.4%) | 2,677 (3.8%) |
| 11:00 AM to 11:59 AM | 952 (1.2%) | 970 (1.4%) |
| 12:00 PM to 3:59 PM | 5,923 (7.2%) | 5,492 (7.9%) |
| 4:00 PM to 11:59 PM | 5,766 (7.0%) | 4,947 (7.1%) |
| Total | 82,107 (100.0%) | 69,547 (100.0%) |
Housing Occupancy in Westmoreland County
Occupancy by Ownership in Westmoreland County
Of the total 153,237 dwellings in Westmoreland County, owner-occupied units account for 119,358 (77.9%), while renter-occupied units make up 33,879 (22.1%).
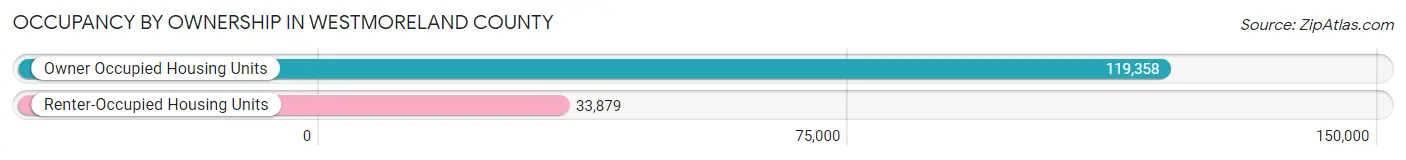
| Occupancy | # Housing Units | % Housing Units |
| Owner Occupied Housing Units | 119,358 | 77.9% |
| Renter-Occupied Housing Units | 33,879 | 22.1% |
| Total Occupied Housing Units | 153,237 | 100.0% |
Occupancy by Household Size in Westmoreland County
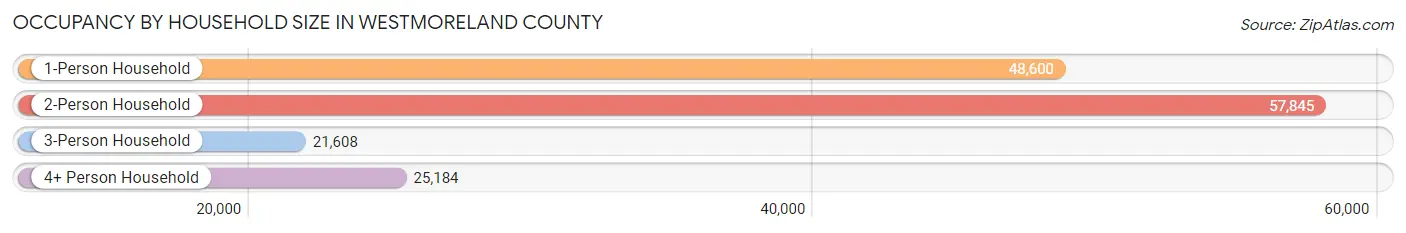
| Household Size | # Housing Units | % Housing Units |
| 1-Person Household | 48,600 | 31.7% |
| 2-Person Household | 57,845 | 37.8% |
| 3-Person Household | 21,608 | 14.1% |
| 4+ Person Household | 25,184 | 16.4% |
| Total Housing Units | 153,237 | 100.0% |
Occupancy by Ownership by Household Size in Westmoreland County
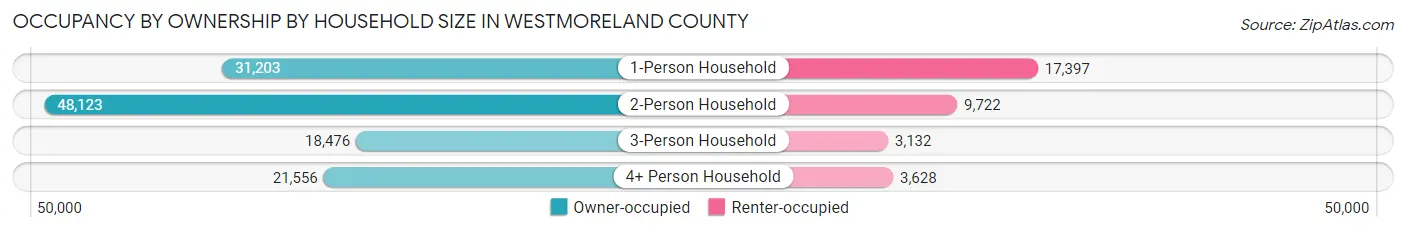
| Household Size | Owner-occupied | Renter-occupied |
| 1-Person Household | 31,203 (64.2%) | 17,397 (35.8%) |
| 2-Person Household | 48,123 (83.2%) | 9,722 (16.8%) |
| 3-Person Household | 18,476 (85.5%) | 3,132 (14.5%) |
| 4+ Person Household | 21,556 (85.6%) | 3,628 (14.4%) |
| Total Housing Units | 119,358 (77.9%) | 33,879 (22.1%) |
Occupancy by Educational Attainment in Westmoreland County
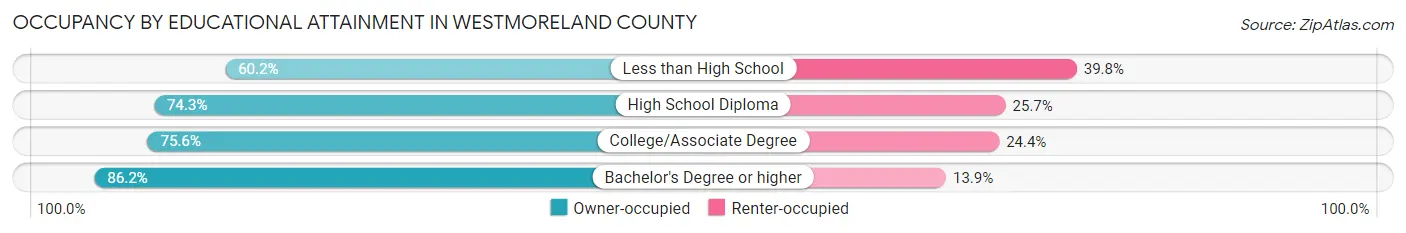
| Household Size | Owner-occupied | Renter-occupied |
| Less than High School | 3,866 (60.2%) | 2,554 (39.8%) |
| High School Diploma | 38,884 (74.3%) | 13,419 (25.7%) |
| College/Associate Degree | 34,568 (75.6%) | 11,148 (24.4%) |
| Bachelor's Degree or higher | 42,040 (86.2%) | 6,758 (13.9%) |
Occupancy by Age of Householder in Westmoreland County
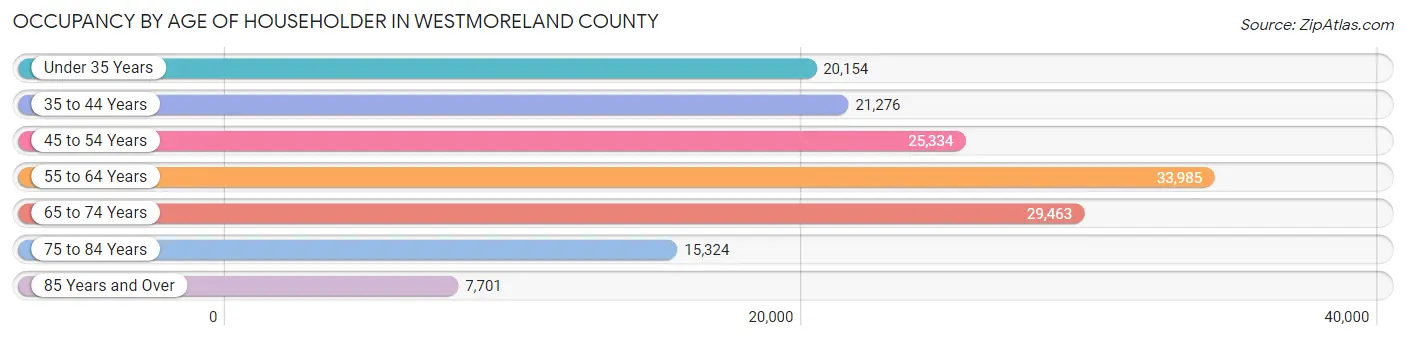
| Age Bracket | # Households | % Households |
| Under 35 Years | 20,154 | 13.2% |
| 35 to 44 Years | 21,276 | 13.9% |
| 45 to 54 Years | 25,334 | 16.5% |
| 55 to 64 Years | 33,985 | 22.2% |
| 65 to 74 Years | 29,463 | 19.2% |
| 75 to 84 Years | 15,324 | 10.0% |
| 85 Years and Over | 7,701 | 5.0% |
| Total | 153,237 | 100.0% |
Housing Finances in Westmoreland County
Median Income by Occupancy in Westmoreland County
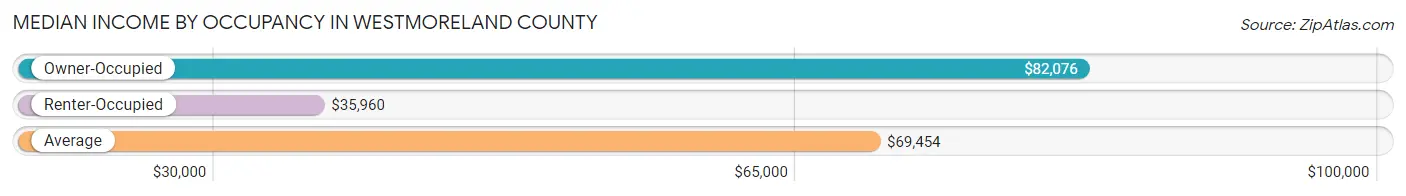
| Occupancy Type | # Households | Median Income |
| Owner-Occupied | 119,358 (77.9%) | $82,076 |
| Renter-Occupied | 33,879 (22.1%) | $35,960 |
| Average | 153,237 (100.0%) | $69,454 |
Occupancy by Householder Income Bracket in Westmoreland County
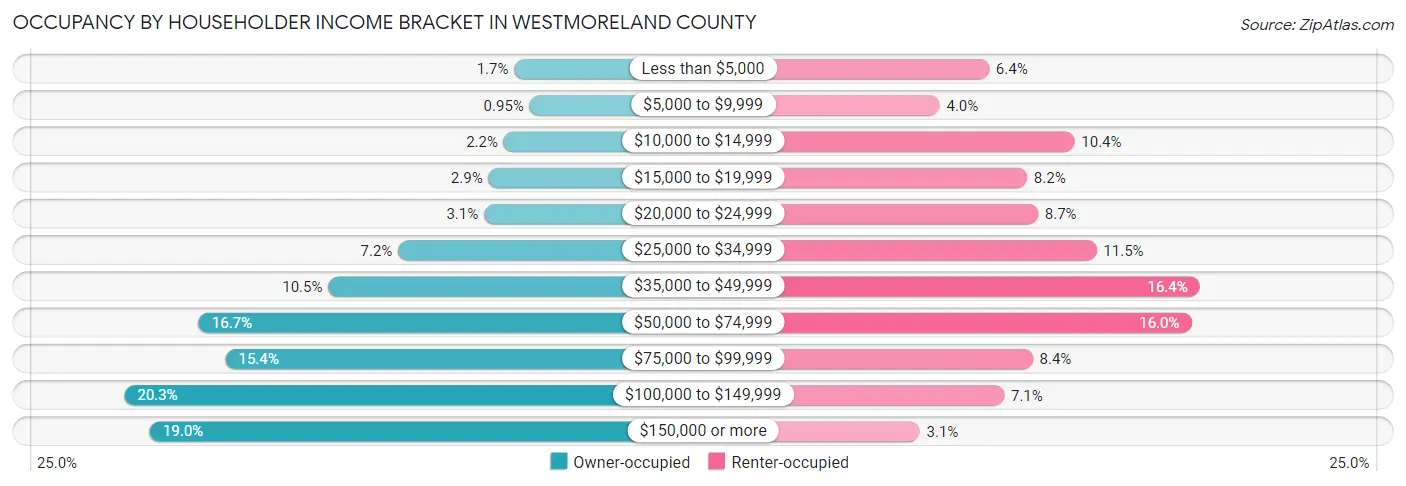
| Income Bracket | Owner-occupied | Renter-occupied |
| Less than $5,000 | 2,006 (1.7%) | 2,151 (6.4%) |
| $5,000 to $9,999 | 1,128 (0.9%) | 1,356 (4.0%) |
| $10,000 to $14,999 | 2,601 (2.2%) | 3,529 (10.4%) |
| $15,000 to $19,999 | 3,468 (2.9%) | 2,766 (8.2%) |
| $20,000 to $24,999 | 3,720 (3.1%) | 2,940 (8.7%) |
| $25,000 to $34,999 | 8,609 (7.2%) | 3,887 (11.5%) |
| $35,000 to $49,999 | 12,585 (10.5%) | 5,550 (16.4%) |
| $50,000 to $74,999 | 19,936 (16.7%) | 5,417 (16.0%) |
| $75,000 to $99,999 | 18,416 (15.4%) | 2,855 (8.4%) |
| $100,000 to $149,999 | 24,173 (20.3%) | 2,396 (7.1%) |
| $150,000 or more | 22,716 (19.0%) | 1,032 (3.0%) |
| Total | 119,358 (100.0%) | 33,879 (100.0%) |
Monthly Housing Cost Tiers in Westmoreland County
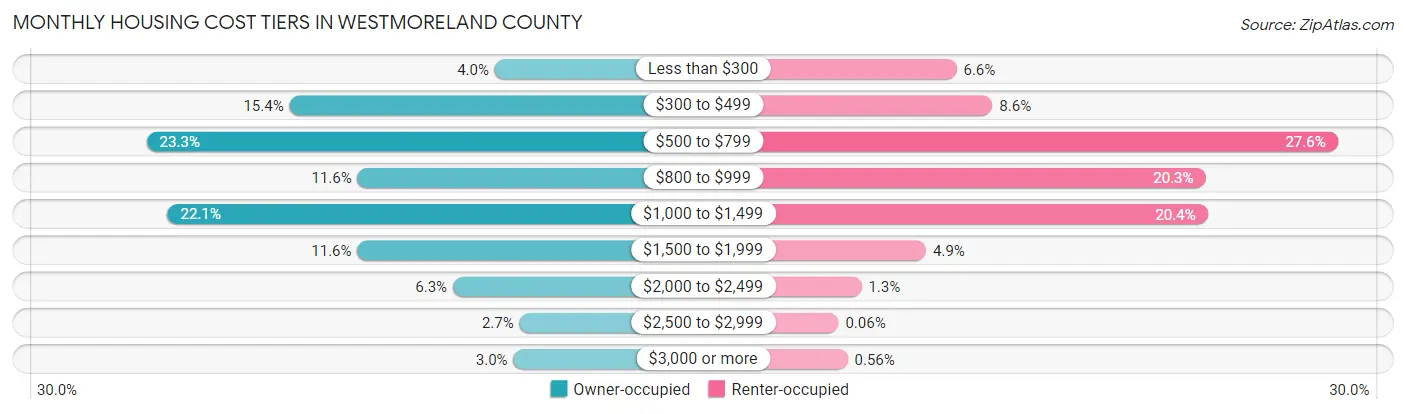
| Monthly Cost | Owner-occupied | Renter-occupied |
| Less than $300 | 4,808 (4.0%) | 2,228 (6.6%) |
| $300 to $499 | 18,349 (15.4%) | 2,899 (8.6%) |
| $500 to $799 | 27,764 (23.3%) | 9,357 (27.6%) |
| $800 to $999 | 13,862 (11.6%) | 6,883 (20.3%) |
| $1,000 to $1,499 | 26,378 (22.1%) | 6,924 (20.4%) |
| $1,500 to $1,999 | 13,869 (11.6%) | 1,659 (4.9%) |
| $2,000 to $2,499 | 7,572 (6.3%) | 452 (1.3%) |
| $2,500 to $2,999 | 3,174 (2.7%) | 20 (0.1%) |
| $3,000 or more | 3,582 (3.0%) | 189 (0.6%) |
| Total | 119,358 (100.0%) | 33,879 (100.0%) |
Physical Housing Characteristics in Westmoreland County
Housing Structures in Westmoreland County
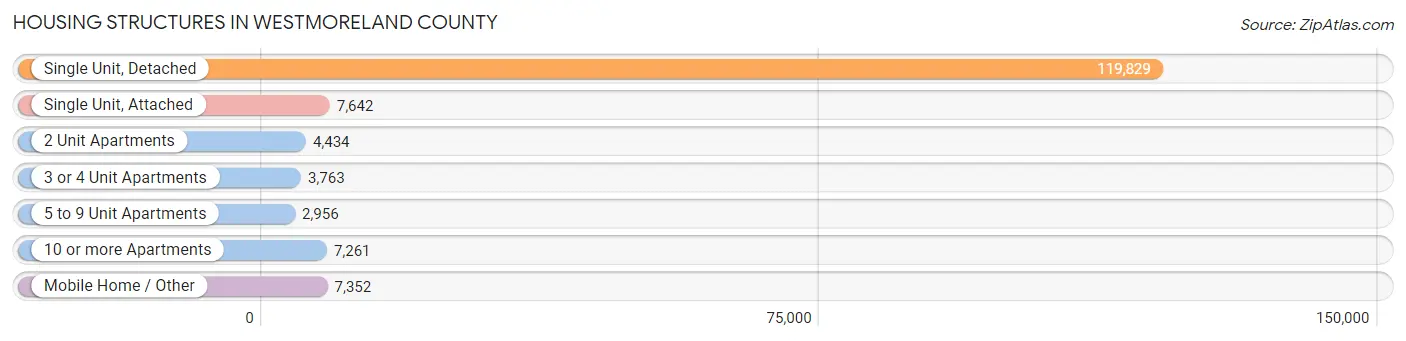
| Structure Type | # Housing Units | % Housing Units |
| Single Unit, Detached | 119,829 | 78.2% |
| Single Unit, Attached | 7,642 | 5.0% |
| 2 Unit Apartments | 4,434 | 2.9% |
| 3 or 4 Unit Apartments | 3,763 | 2.5% |
| 5 to 9 Unit Apartments | 2,956 | 1.9% |
| 10 or more Apartments | 7,261 | 4.7% |
| Mobile Home / Other | 7,352 | 4.8% |
| Total | 153,237 | 100.0% |
Housing Structures by Occupancy in Westmoreland County
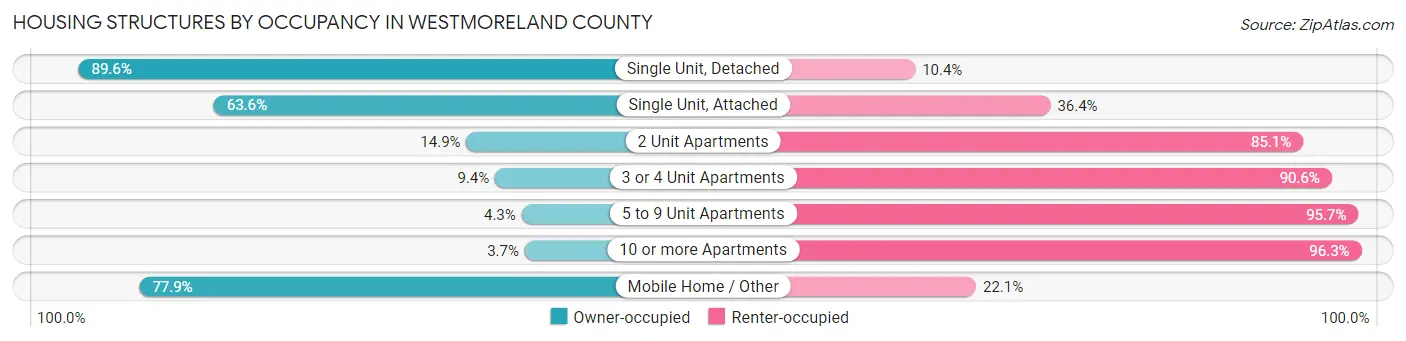
| Structure Type | Owner-occupied | Renter-occupied |
| Single Unit, Detached | 107,364 (89.6%) | 12,465 (10.4%) |
| Single Unit, Attached | 4,857 (63.6%) | 2,785 (36.4%) |
| 2 Unit Apartments | 662 (14.9%) | 3,772 (85.1%) |
| 3 or 4 Unit Apartments | 354 (9.4%) | 3,409 (90.6%) |
| 5 to 9 Unit Apartments | 127 (4.3%) | 2,829 (95.7%) |
| 10 or more Apartments | 268 (3.7%) | 6,993 (96.3%) |
| Mobile Home / Other | 5,726 (77.9%) | 1,626 (22.1%) |
| Total | 119,358 (77.9%) | 33,879 (22.1%) |
Housing Structures by Number of Rooms in Westmoreland County
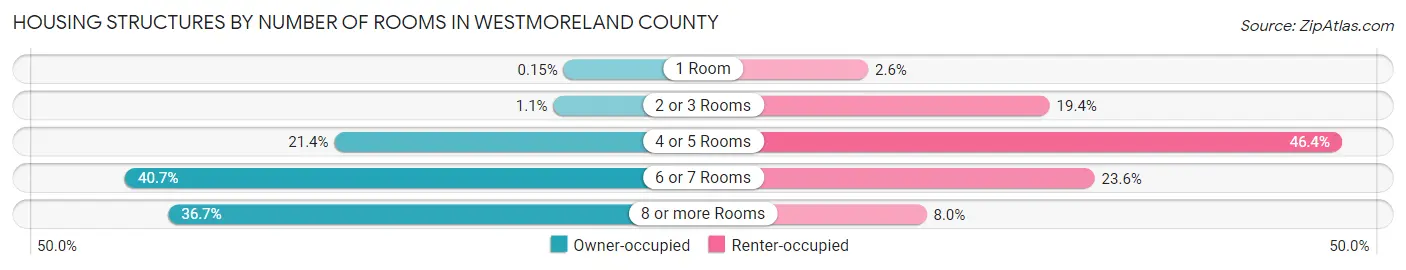
| Number of Rooms | Owner-occupied | Renter-occupied |
| 1 Room | 185 (0.2%) | 884 (2.6%) |
| 2 or 3 Rooms | 1,306 (1.1%) | 6,574 (19.4%) |
| 4 or 5 Rooms | 25,483 (21.3%) | 15,724 (46.4%) |
| 6 or 7 Rooms | 48,582 (40.7%) | 7,983 (23.6%) |
| 8 or more Rooms | 43,802 (36.7%) | 2,714 (8.0%) |
| Total | 119,358 (100.0%) | 33,879 (100.0%) |
Housing Structure by Heating Type in Westmoreland County
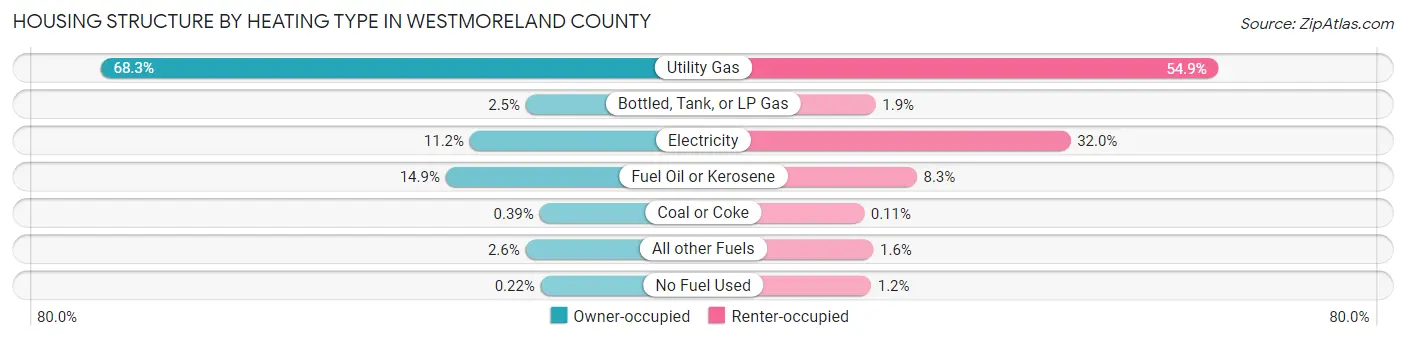
| Heating Type | Owner-occupied | Renter-occupied |
| Utility Gas | 81,461 (68.2%) | 18,614 (54.9%) |
| Bottled, Tank, or LP Gas | 2,990 (2.5%) | 644 (1.9%) |
| Electricity | 13,330 (11.2%) | 10,849 (32.0%) |
| Fuel Oil or Kerosene | 17,790 (14.9%) | 2,803 (8.3%) |
| Coal or Coke | 471 (0.4%) | 38 (0.1%) |
| All other Fuels | 3,058 (2.6%) | 525 (1.5%) |
| No Fuel Used | 258 (0.2%) | 406 (1.2%) |
| Total | 119,358 (100.0%) | 33,879 (100.0%) |
Household Vehicle Usage in Westmoreland County
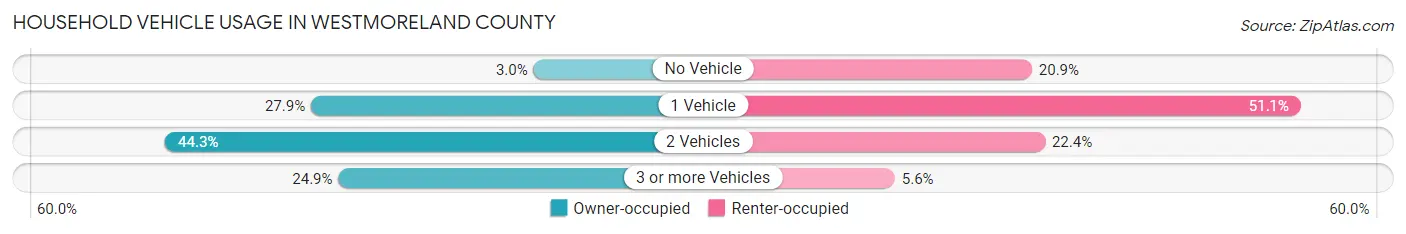
| Vehicles per Household | Owner-occupied | Renter-occupied |
| No Vehicle | 3,569 (3.0%) | 7,094 (20.9%) |
| 1 Vehicle | 33,320 (27.9%) | 17,301 (51.1%) |
| 2 Vehicles | 52,814 (44.3%) | 7,591 (22.4%) |
| 3 or more Vehicles | 29,655 (24.8%) | 1,893 (5.6%) |
| Total | 119,358 (100.0%) | 33,879 (100.0%) |
Real Estate & Mortgages in Westmoreland County
Real Estate and Mortgage Overview in Westmoreland County
| Characteristic | Without Mortgage | With Mortgage |
| Housing Units | 54,325 | 65,033 |
| Median Property Value | $167,500 | $194,400 |
| Median Household Income | $59,657 | $15,745 |
| Monthly Housing Costs | $547 | $3,472 |
| Real Estate Taxes | $2,267 | $1,079 |
Property Value by Mortgage Status in Westmoreland County
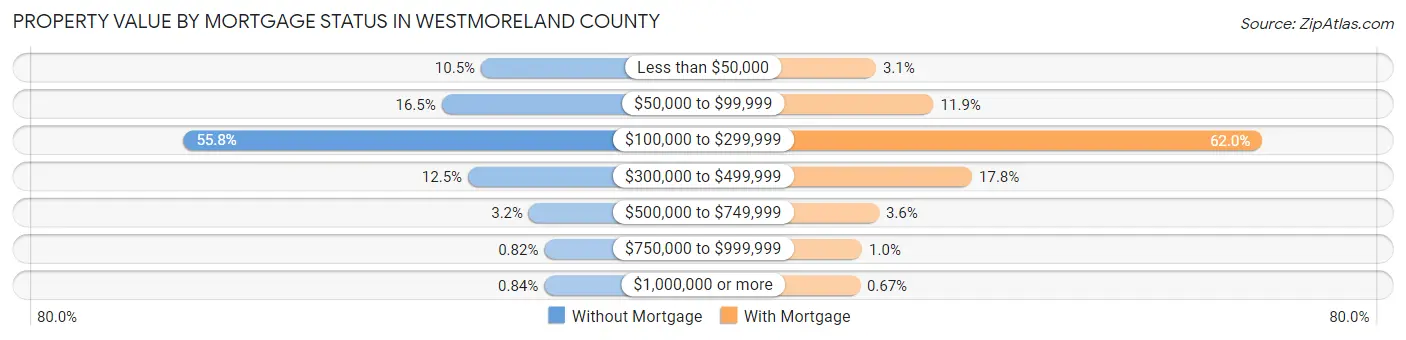
| Property Value | Without Mortgage | With Mortgage |
| Less than $50,000 | 5,686 (10.5%) | 2,025 (3.1%) |
| $50,000 to $99,999 | 8,945 (16.5%) | 7,742 (11.9%) |
| $100,000 to $299,999 | 30,309 (55.8%) | 40,300 (62.0%) |
| $300,000 to $499,999 | 6,763 (12.4%) | 11,550 (17.8%) |
| $500,000 to $749,999 | 1,716 (3.2%) | 2,328 (3.6%) |
| $750,000 to $999,999 | 447 (0.8%) | 655 (1.0%) |
| $1,000,000 or more | 459 (0.8%) | 433 (0.7%) |
| Total | 54,325 (100.0%) | 65,033 (100.0%) |
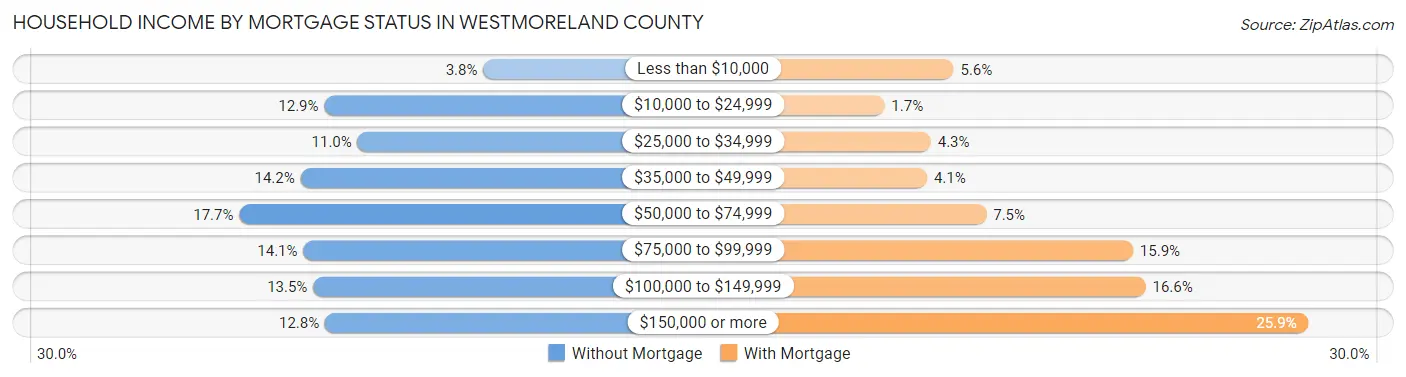
Household Income by Mortgage Status in Westmoreland County
| Household Income | Without Mortgage | With Mortgage |
| Less than $10,000 | 2,061 (3.8%) | 3,640 (5.6%) |
| $10,000 to $24,999 | 6,994 (12.9%) | 1,073 (1.7%) |
| $25,000 to $34,999 | 5,957 (11.0%) | 2,795 (4.3%) |
| $35,000 to $49,999 | 7,730 (14.2%) | 2,652 (4.1%) |
| $50,000 to $74,999 | 9,630 (17.7%) | 4,855 (7.5%) |
| $75,000 to $99,999 | 7,641 (14.1%) | 10,306 (15.9%) |
| $100,000 to $149,999 | 7,341 (13.5%) | 10,775 (16.6%) |
| $150,000 or more | 6,971 (12.8%) | 16,832 (25.9%) |
| Total | 54,325 (100.0%) | 65,033 (100.0%) |
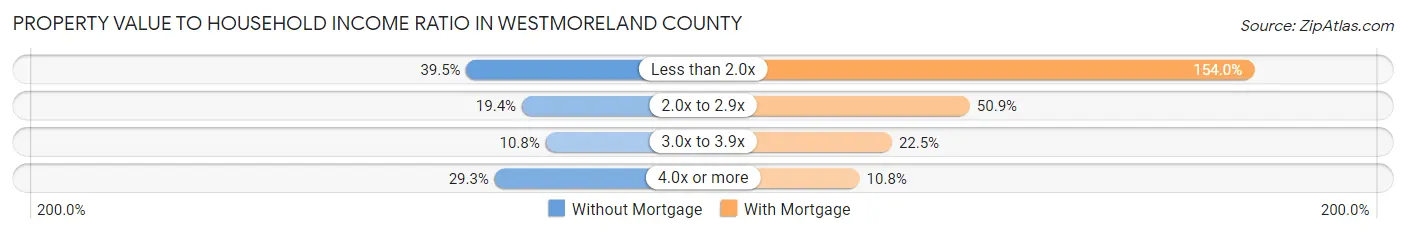
Property Value to Household Income Ratio in Westmoreland County
| Value-to-Income Ratio | Without Mortgage | With Mortgage |
| Less than 2.0x | 21,466 (39.5%) | 100,158 (154.0%) |
| 2.0x to 2.9x | 10,524 (19.4%) | 33,069 (50.8%) |
| 3.0x to 3.9x | 5,849 (10.8%) | 14,655 (22.5%) |
| 4.0x or more | 15,888 (29.2%) | 7,030 (10.8%) |
| Total | 54,325 (100.0%) | 65,033 (100.0%) |
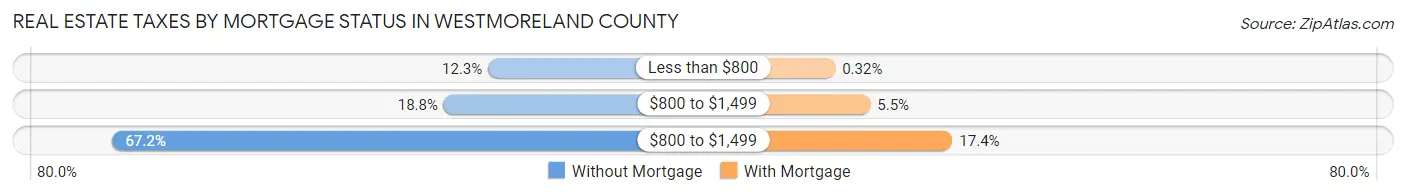
Real Estate Taxes by Mortgage Status in Westmoreland County
| Property Taxes | Without Mortgage | With Mortgage |
| Less than $800 | 6,666 (12.3%) | 209 (0.3%) |
| $800 to $1,499 | 10,185 (18.8%) | 3,542 (5.4%) |
| $800 to $1,499 | 36,480 (67.1%) | 11,340 (17.4%) |
| Total | 54,325 (100.0%) | 65,033 (100.0%) |
Health & Disability in Westmoreland County
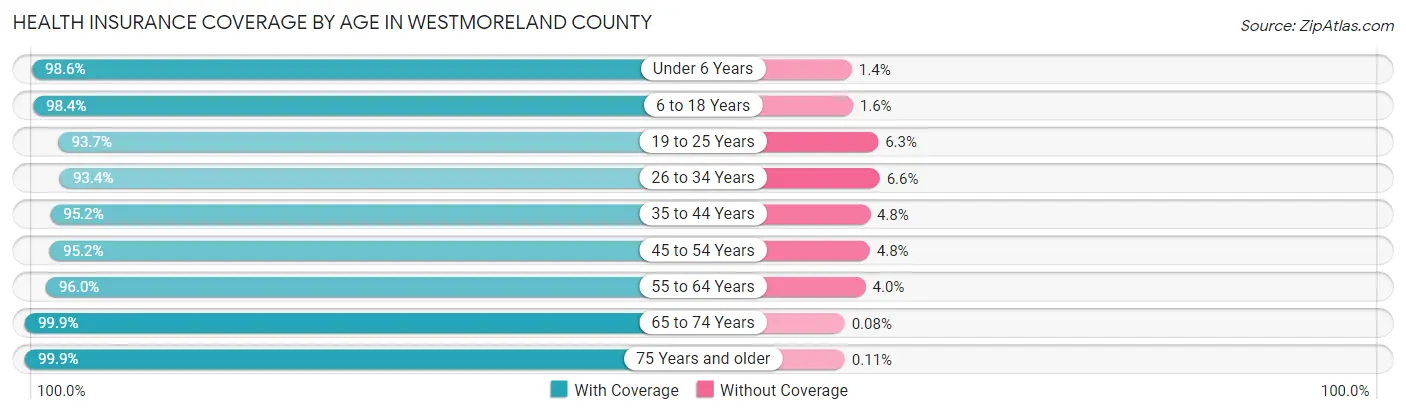
Health Insurance Coverage by Age in Westmoreland County
| Age Bracket | With Coverage | Without Coverage |
| Under 6 Years | 18,350 (98.6%) | 265 (1.4%) |
| 6 to 18 Years | 49,039 (98.4%) | 790 (1.6%) |
| 19 to 25 Years | 24,306 (93.7%) | 1,643 (6.3%) |
| 26 to 34 Years | 31,680 (93.4%) | 2,242 (6.6%) |
| 35 to 44 Years | 37,573 (95.2%) | 1,890 (4.8%) |
| 45 to 54 Years | 43,956 (95.2%) | 2,195 (4.8%) |
| 55 to 64 Years | 54,269 (96.0%) | 2,251 (4.0%) |
| 65 to 74 Years | 47,125 (99.9%) | 39 (0.1%) |
| 75 Years and older | 33,610 (99.9%) | 37 (0.1%) |
| Total | 339,908 (96.8%) | 11,352 (3.2%) |
Health Insurance Coverage by Citizenship Status in Westmoreland County
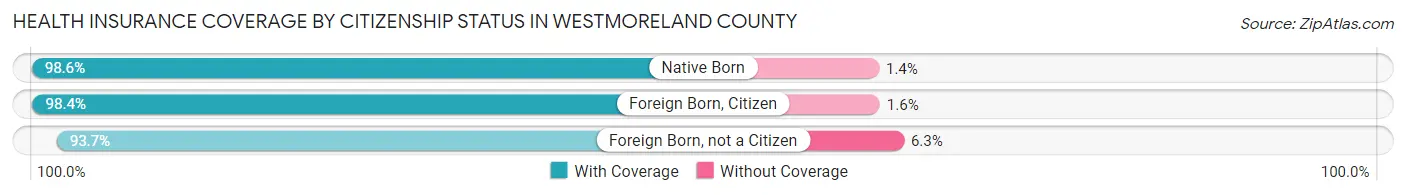
| Citizenship Status | With Coverage | Without Coverage |
| Native Born | 18,350 (98.6%) | 265 (1.4%) |
| Foreign Born, Citizen | 49,039 (98.4%) | 790 (1.6%) |
| Foreign Born, not a Citizen | 24,306 (93.7%) | 1,643 (6.3%) |
Health Insurance Coverage by Household Income in Westmoreland County
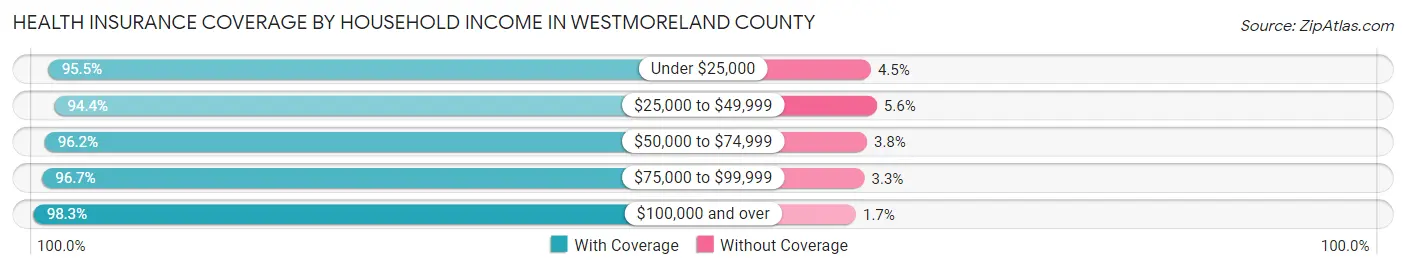
| Household Income | With Coverage | Without Coverage |
| Under $25,000 | 36,357 (95.5%) | 1,727 (4.5%) |
| $25,000 to $49,999 | 49,718 (94.4%) | 2,971 (5.6%) |
| $50,000 to $74,999 | 51,693 (96.2%) | 2,036 (3.8%) |
| $75,000 to $99,999 | 50,345 (96.7%) | 1,733 (3.3%) |
| $100,000 and over | 147,492 (98.3%) | 2,591 (1.7%) |
Public vs Private Health Insurance Coverage by Age in Westmoreland County
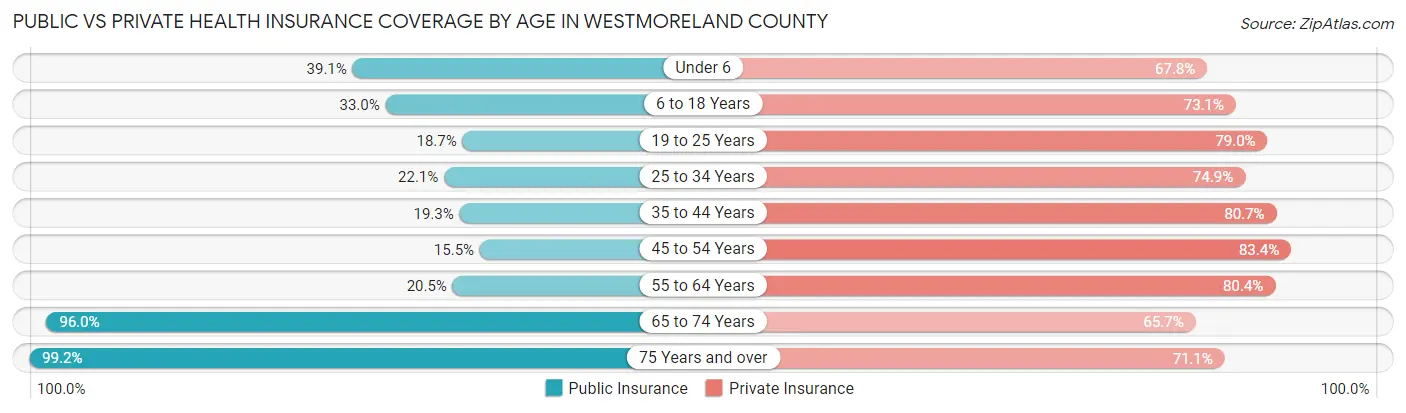
| Age Bracket | Public Insurance | Private Insurance |
| Under 6 | 7,283 (39.1%) | 12,623 (67.8%) |
| 6 to 18 Years | 16,446 (33.0%) | 36,447 (73.1%) |
| 19 to 25 Years | 4,854 (18.7%) | 20,501 (79.0%) |
| 25 to 34 Years | 7,507 (22.1%) | 25,391 (74.9%) |
| 35 to 44 Years | 7,606 (19.3%) | 31,835 (80.7%) |
| 45 to 54 Years | 7,151 (15.5%) | 38,478 (83.4%) |
| 55 to 64 Years | 11,612 (20.5%) | 45,457 (80.4%) |
| 65 to 74 Years | 45,258 (96.0%) | 30,970 (65.7%) |
| 75 Years and over | 33,361 (99.2%) | 23,916 (71.1%) |
| Total | 141,078 (40.2%) | 265,618 (75.6%) |
Disability Status by Sex by Age in Westmoreland County
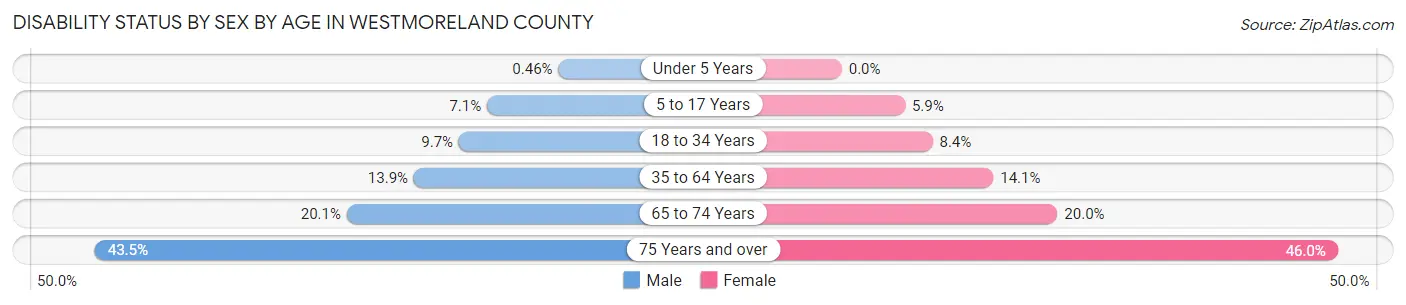
| Age Bracket | Male | Female |
| Under 5 Years | 36 (0.5%) | 0 (0.0%) |
| 5 to 17 Years | 1,774 (7.1%) | 1,407 (5.9%) |
| 18 to 34 Years | 3,198 (9.7%) | 2,601 (8.4%) |
| 35 to 64 Years | 9,901 (13.9%) | 9,948 (14.1%) |
| 65 to 74 Years | 4,542 (20.1%) | 4,914 (20.0%) |
| 75 Years and over | 5,992 (43.5%) | 9,141 (46.0%) |
Disability Class by Sex by Age in Westmoreland County
Disability Class: Hearing Difficulty
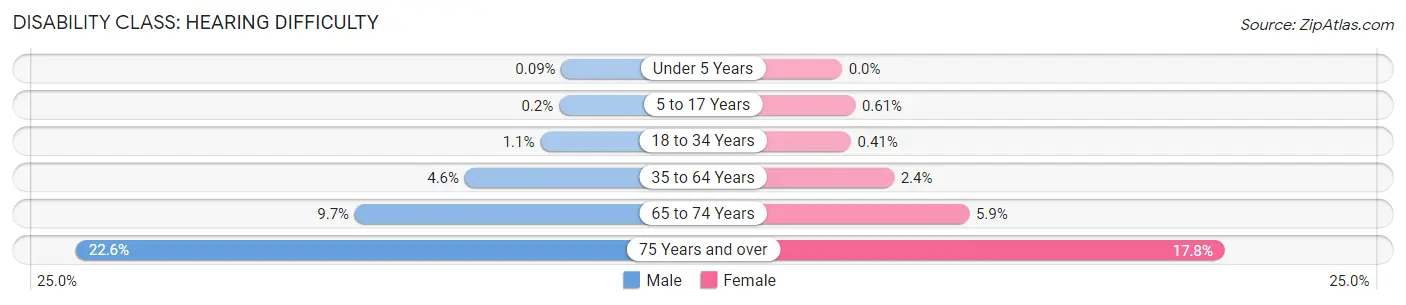
| Age Bracket | Male | Female |
| Under 5 Years | 7 (0.1%) | 0 (0.0%) |
| 5 to 17 Years | 50 (0.2%) | 146 (0.6%) |
| 18 to 34 Years | 354 (1.1%) | 127 (0.4%) |
| 35 to 64 Years | 3,260 (4.6%) | 1,703 (2.4%) |
| 65 to 74 Years | 2,185 (9.7%) | 1,450 (5.9%) |
| 75 Years and over | 3,118 (22.6%) | 3,531 (17.8%) |
Disability Class: Vision Difficulty
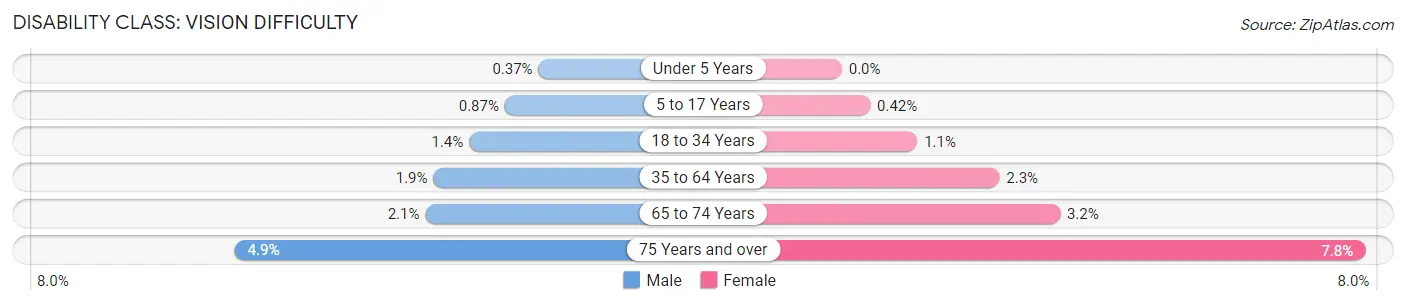
| Age Bracket | Male | Female |
| Under 5 Years | 29 (0.4%) | 0 (0.0%) |
| 5 to 17 Years | 217 (0.9%) | 101 (0.4%) |
| 18 to 34 Years | 461 (1.4%) | 345 (1.1%) |
| 35 to 64 Years | 1,377 (1.9%) | 1,653 (2.3%) |
| 65 to 74 Years | 464 (2.1%) | 797 (3.2%) |
| 75 Years and over | 672 (4.9%) | 1,543 (7.8%) |
Disability Class: Cognitive Difficulty
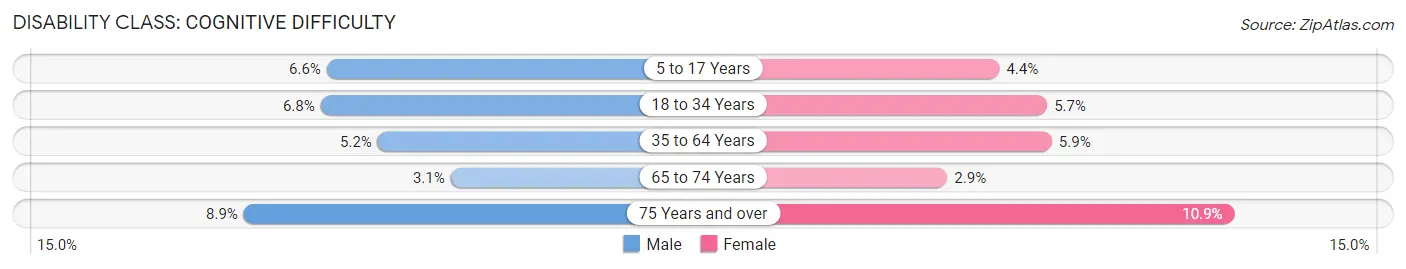
| Age Bracket | Male | Female |
| 5 to 17 Years | 1,651 (6.6%) | 1,055 (4.4%) |
| 18 to 34 Years | 2,231 (6.8%) | 1,766 (5.7%) |
| 35 to 64 Years | 3,693 (5.2%) | 4,140 (5.9%) |
| 65 to 74 Years | 710 (3.1%) | 722 (2.9%) |
| 75 Years and over | 1,226 (8.9%) | 2,172 (10.9%) |
Disability Class: Ambulatory Difficulty
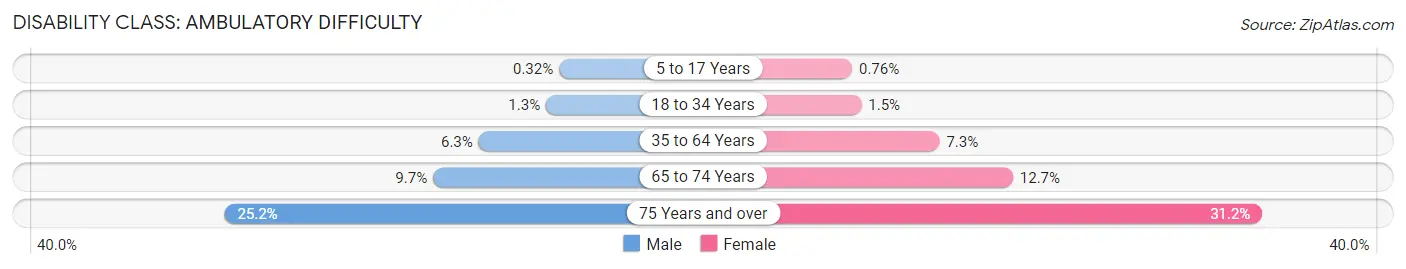
| Age Bracket | Male | Female |
| 5 to 17 Years | 80 (0.3%) | 182 (0.8%) |
| 18 to 34 Years | 425 (1.3%) | 447 (1.5%) |
| 35 to 64 Years | 4,492 (6.3%) | 5,128 (7.2%) |
| 65 to 74 Years | 2,188 (9.7%) | 3,120 (12.7%) |
| 75 Years and over | 3,468 (25.2%) | 6,199 (31.2%) |
Disability Class: Self-Care Difficulty
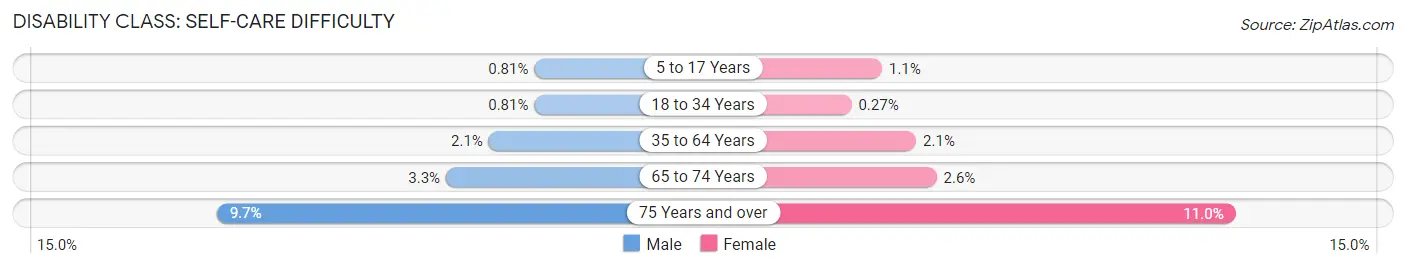
| Age Bracket | Male | Female |
| 5 to 17 Years | 204 (0.8%) | 269 (1.1%) |
| 18 to 34 Years | 267 (0.8%) | 82 (0.3%) |
| 35 to 64 Years | 1,484 (2.1%) | 1,467 (2.1%) |
| 65 to 74 Years | 740 (3.3%) | 649 (2.6%) |
| 75 Years and over | 1,330 (9.7%) | 2,178 (11.0%) |
Technology Access in Westmoreland County
Computing Device Access in Westmoreland County
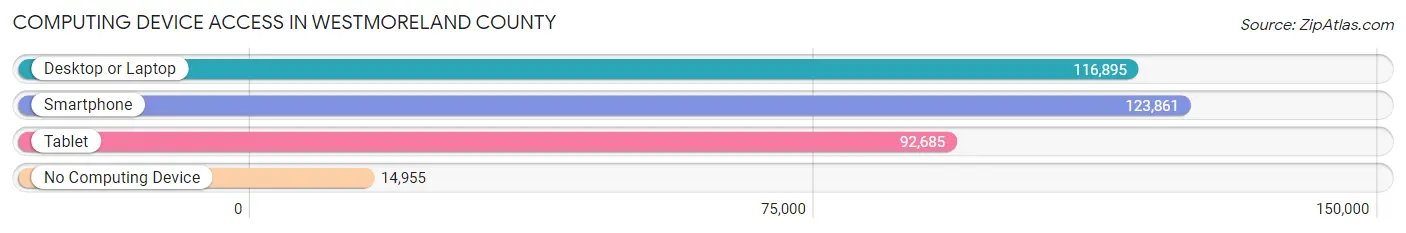
| Device Type | # Households | % Households |
| Desktop or Laptop | 116,895 | 76.3% |
| Smartphone | 123,861 | 80.8% |
| Tablet | 92,685 | 60.5% |
| No Computing Device | 14,955 | 9.8% |
| Total | 153,237 | 100.0% |
Internet Access in Westmoreland County
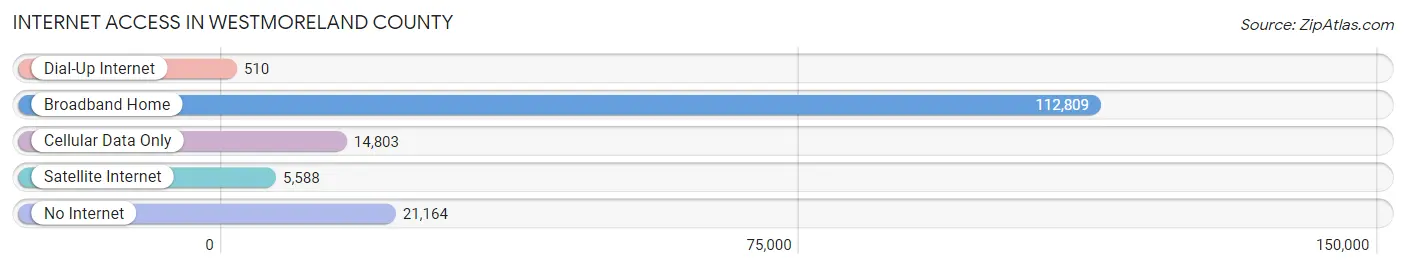
| Internet Type | # Households | % Households |
| Dial-Up Internet | 510 | 0.3% |
| Broadband Home | 112,809 | 73.6% |
| Cellular Data Only | 14,803 | 9.7% |
| Satellite Internet | 5,588 | 3.6% |
| No Internet | 21,164 | 13.8% |
| Total | 153,237 | 100.0% |
Westmoreland County Summary
Westmoreland County, Pennsylvania is located in the southwestern corner of the state, and is part of the Pittsburgh metropolitan area. It is bordered by Allegheny, Armstrong, Fayette, Indiana, and Washington counties. The county seat is Greensburg, and the county has a population of 365,169 as of the 2010 census.
History
Westmoreland County was formed in 1773 from part of Bedford County. It was named after Westmorland, a county in England. The county was originally part of the disputed territory that was claimed by both Pennsylvania and Virginia. The dispute was settled in 1780, when the two states agreed to divide the land along the Mason-Dixon Line.
The county was home to several Native American tribes, including the Shawnee, Delaware, and Iroquois. The first European settlers arrived in the area in the late 17th century. The county was an important center of the iron and steel industry in the 19th and 20th centuries.
Geography
Westmoreland County is located in the southwestern corner of Pennsylvania. It is bordered by Allegheny, Armstrong, Fayette, Indiana, and Washington counties. The county has a total area of 891 square miles, of which 887 square miles is land and 4 square miles is water.
The county is located in the Allegheny Plateau region of Pennsylvania. The terrain is mostly hilly, with some flat areas in the valleys. The highest point in the county is Chestnut Ridge, which has an elevation of 2,845 feet.
The county is home to several rivers, including the Allegheny, Kiskiminetas, Loyalhanna, and Youghiogheny. The county also contains several lakes, including Donegal, Loyalhanna, and Twin Lakes.
Economy
Westmoreland County has a diverse economy. The county is home to several large employers, including Excela Health, Westmoreland County Community College, and Westmoreland County Courthouse. The county is also home to several manufacturing companies, including Alcoa, Armstrong World Industries, and Westinghouse Electric.
The county is also home to several tourist attractions, including the Westmoreland County Historical Society, the Westmoreland Museum of American Art, and the Westmoreland County Fair.
Demographics
As of the 2010 census, Westmoreland County had a population of 365,169. The racial makeup of the county was 95.3% White, 2.3% African American, 0.3% Native American, 0.7% Asian, 0.1% Pacific Islander, 0.5% from other races, and 0.8% from two or more races. Hispanic or Latino of any race were 1.7% of the population.
The median income for a household in the county was $45,945, and the median income for a family was $54,945. The per capita income for the county was $22,945. About 8.3% of families and 11.2% of the population were below the poverty line, including 15.2% of those under age 18 and 8.2% of those age 65 or over.
Common Questions
What is Per Capita Income in Westmoreland County?
Per Capita income in Westmoreland County is $40,193.
What is the Median Family Income in Westmoreland County?
Median Family Income in Westmoreland County is $91,249.
What is the Median Household income in Westmoreland County?
Median Household Income in Westmoreland County is $69,454.
What is Income or Wage Gap in Westmoreland County?
Income or Wage Gap in Westmoreland County is 35.9%.
Women in Westmoreland County earn 64.1 cents for every dollar earned by a man.
What is Family Income Deficit in Westmoreland County?
Family Income Deficit in Westmoreland County is $11,159.
Families that are below poverty line in Westmoreland County earn $11,159 less on average than the poverty threshold level.
What is Inequality or Gini Index in Westmoreland County?
Inequality or Gini Index in Westmoreland County is 0.45.
What is the Total Population of Westmoreland County?
Total Population of Westmoreland County is 354,414.
What is the Total Male Population of Westmoreland County?
Total Male Population of Westmoreland County is 175,081.
What is the Total Female Population of Westmoreland County?
Total Female Population of Westmoreland County is 179,333.
What is the Ratio of Males per 100 Females in Westmoreland County?
There are 97.63 Males per 100 Females in Westmoreland County.
What is the Ratio of Females per 100 Males in Westmoreland County?
There are 102.43 Females per 100 Males in Westmoreland County.
What is the Median Population Age in Westmoreland County?
Median Population Age in Westmoreland County is 47.2 Years.
What is the Average Family Size in Westmoreland County
Average Family Size in Westmoreland County is 2.8 People.
What is the Average Household Size in Westmoreland County
Average Household Size in Westmoreland County is 2.3 People.
How Large is the Labor Force in Westmoreland County?
There are 180,538 People in the Labor Forcein in Westmoreland County.
What is the Percentage of People in the Labor Force in Westmoreland County?
60.6% of People are in the Labor Force in Westmoreland County.
What is the Unemployment Rate in Westmoreland County?
Unemployment Rate in Westmoreland County is 5.0%.