Northampton County, PA Map & Demographics
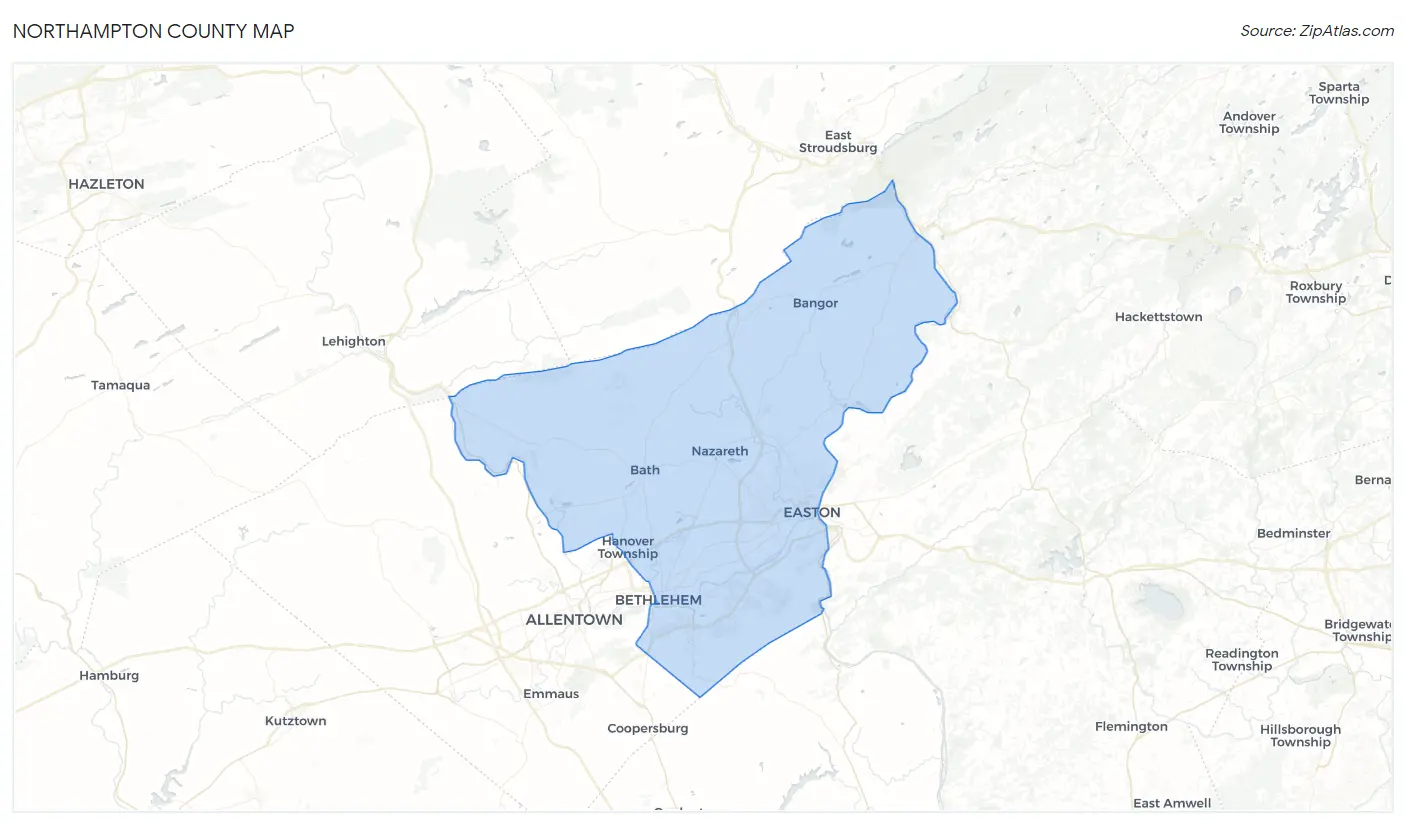
Northampton County Map
Northampton County Overview
$42,643
PER CAPITA INCOME
$101,606
AVG FAMILY INCOME
$82,201
AVG HOUSEHOLD INCOME
31.6%
WAGE / INCOME GAP [ % ]
68.4¢/ $1
WAGE / INCOME GAP [ $ ]
$10,391
FAMILY INCOME DEFICIT
0.45
INEQUALITY / GINI INDEX
314,299
TOTAL POPULATION
155,709
MALE POPULATION
158,590
FEMALE POPULATION
98.18
MALES / 100 FEMALES
101.85
FEMALES / 100 MALES
41.9
MEDIAN AGE
3.0
AVG FAMILY SIZE
2.5
AVG HOUSEHOLD SIZE
163,565
LABOR FORCE [ PEOPLE ]
62.7%
PERCENT IN LABOR FORCE
4.6%
UNEMPLOYMENT RATE
Income in Northampton County
Income Overview in Northampton County
Per Capita Income in Northampton County is $42,643, while median incomes of families and households are $101,606 and $82,201 respectively.
| Characteristic | Number | Measure |
| Per Capita Income | 314,299 | $42,643 |
| Median Family Income | 80,718 | $101,606 |
| Mean Family Income | 80,718 | $127,290 |
| Median Household Income | 120,384 | $82,201 |
| Mean Household Income | 120,384 | $108,291 |
| Income Deficit | 80,718 | $10,391 |
| Wage / Income Gap (%) | 314,299 | 31.64% |
| Wage / Income Gap ($) | 314,299 | 68.36¢ per $1 |
| Gini / Inequality Index | 314,299 | 0.45 |
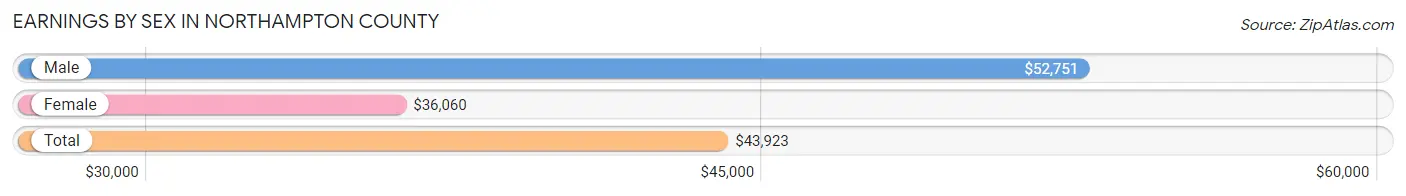
Earnings by Sex in Northampton County
Average Earnings in Northampton County are $43,923, $52,751 for men and $36,060 for women, a difference of 31.6%.
| Sex | Number | Average Earnings |
| Male | 91,401 (52.8%) | $52,751 |
| Female | 81,700 (47.2%) | $36,060 |
| Total | 173,101 (100.0%) | $43,923 |
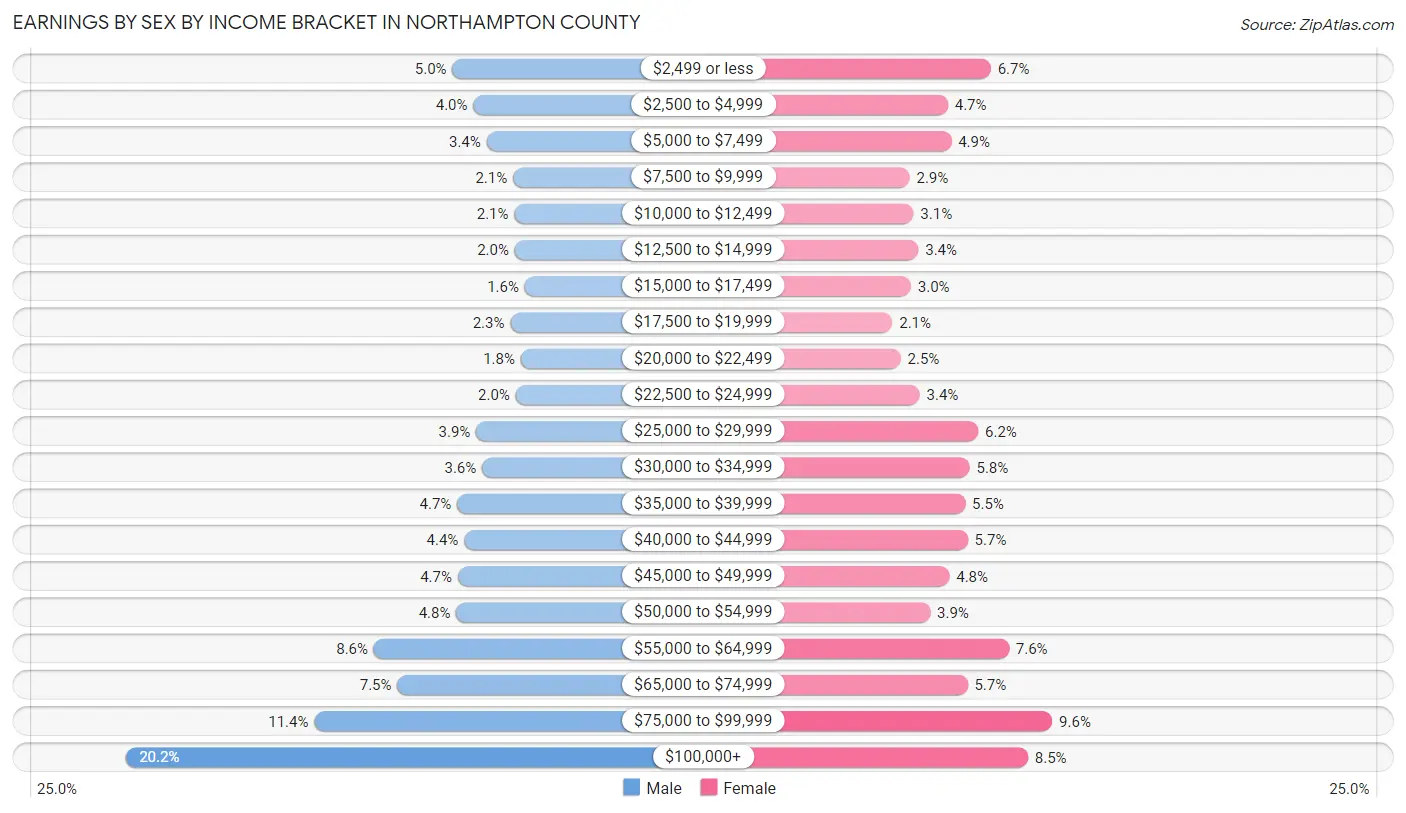
Earnings by Sex by Income Bracket in Northampton County
The most common earnings brackets in Northampton County are $100,000+ for men (18,496 | 20.2%) and $75,000 to $99,999 for women (7,857 | 9.6%).
| Income | Male | Female |
| $2,499 or less | 4,536 (5.0%) | 5,510 (6.7%) |
| $2,500 to $4,999 | 3,637 (4.0%) | 3,868 (4.7%) |
| $5,000 to $7,499 | 3,074 (3.4%) | 3,999 (4.9%) |
| $7,500 to $9,999 | 1,941 (2.1%) | 2,406 (2.9%) |
| $10,000 to $12,499 | 1,882 (2.1%) | 2,547 (3.1%) |
| $12,500 to $14,999 | 1,862 (2.0%) | 2,736 (3.4%) |
| $15,000 to $17,499 | 1,433 (1.6%) | 2,454 (3.0%) |
| $17,500 to $19,999 | 2,055 (2.2%) | 1,740 (2.1%) |
| $20,000 to $22,499 | 1,610 (1.8%) | 2,058 (2.5%) |
| $22,500 to $24,999 | 1,828 (2.0%) | 2,787 (3.4%) |
| $25,000 to $29,999 | 3,516 (3.8%) | 5,027 (6.1%) |
| $30,000 to $34,999 | 3,264 (3.6%) | 4,696 (5.8%) |
| $35,000 to $39,999 | 4,328 (4.7%) | 4,530 (5.5%) |
| $40,000 to $44,999 | 4,033 (4.4%) | 4,624 (5.7%) |
| $45,000 to $49,999 | 4,305 (4.7%) | 3,923 (4.8%) |
| $50,000 to $54,999 | 4,365 (4.8%) | 3,187 (3.9%) |
| $55,000 to $64,999 | 7,893 (8.6%) | 6,202 (7.6%) |
| $65,000 to $74,999 | 6,892 (7.5%) | 4,620 (5.7%) |
| $75,000 to $99,999 | 10,451 (11.4%) | 7,857 (9.6%) |
| $100,000+ | 18,496 (20.2%) | 6,929 (8.5%) |
| Total | 91,401 (100.0%) | 81,700 (100.0%) |
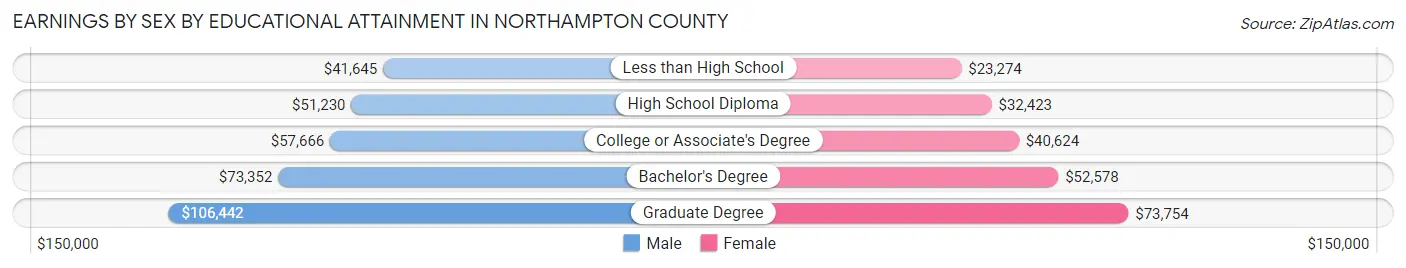
Earnings by Sex by Educational Attainment in Northampton County
Average earnings in Northampton County are $60,596 for men and $42,740 for women, a difference of 29.5%. Men with an educational attainment of graduate degree enjoy the highest average annual earnings of $106,442, while those with less than high school education earn the least with $41,645. Women with an educational attainment of graduate degree earn the most with the average annual earnings of $73,754, while those with less than high school education have the smallest earnings of $23,274.
| Educational Attainment | Male Income | Female Income |
| Less than High School | $41,645 | $23,274 |
| High School Diploma | $51,230 | $32,423 |
| College or Associate's Degree | $57,666 | $40,624 |
| Bachelor's Degree | $73,352 | $52,578 |
| Graduate Degree | $106,442 | $73,754 |
| Total | $60,596 | $42,740 |
Family Income in Northampton County
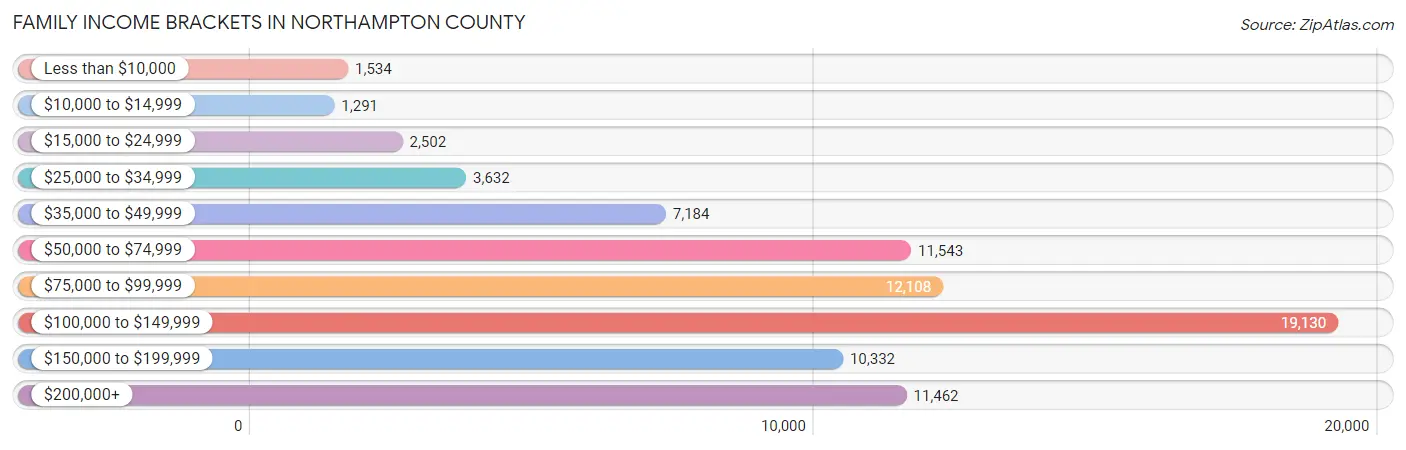
Family Income Brackets in Northampton County
According to the Northampton County family income data, there are 19,130 families falling into the $100,000 to $149,999 income range, which is the most common income bracket and makes up 23.7% of all families. Conversely, the $10,000 to $14,999 income bracket is the least frequent group with only 1,291 families (1.6%) belonging to this category.
| Income Bracket | # Families | % Families |
| Less than $10,000 | 1,534 | 1.9% |
| $10,000 to $14,999 | 1,291 | 1.6% |
| $15,000 to $24,999 | 2,502 | 3.1% |
| $25,000 to $34,999 | 3,632 | 4.5% |
| $35,000 to $49,999 | 7,184 | 8.9% |
| $50,000 to $74,999 | 11,543 | 14.3% |
| $75,000 to $99,999 | 12,108 | 15.0% |
| $100,000 to $149,999 | 19,130 | 23.7% |
| $150,000 to $199,999 | 10,332 | 12.8% |
| $200,000+ | 11,462 | 14.2% |
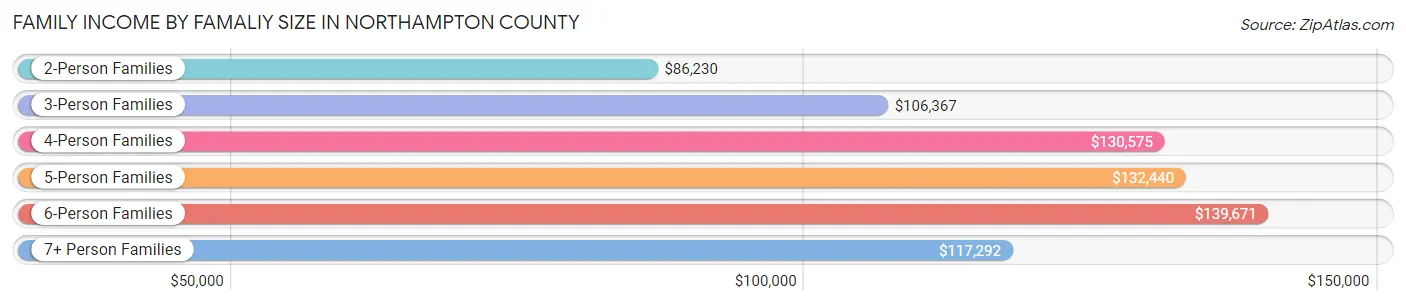
Family Income by Famaliy Size in Northampton County
6-person families (1,877 | 2.3%) account for the highest median family income in Northampton County with $139,671 per family, while 2-person families (39,512 | 48.9%) have the highest median income of $43,115 per family member.
| Income Bracket | # Families | Median Income |
| 2-Person Families | 39,512 (48.9%) | $86,230 |
| 3-Person Families | 17,880 (22.2%) | $106,367 |
| 4-Person Families | 14,727 (18.2%) | $130,575 |
| 5-Person Families | 5,548 (6.9%) | $132,440 |
| 6-Person Families | 1,877 (2.3%) | $139,671 |
| 7+ Person Families | 1,174 (1.5%) | $117,292 |
| Total | 80,718 (100.0%) | $101,606 |
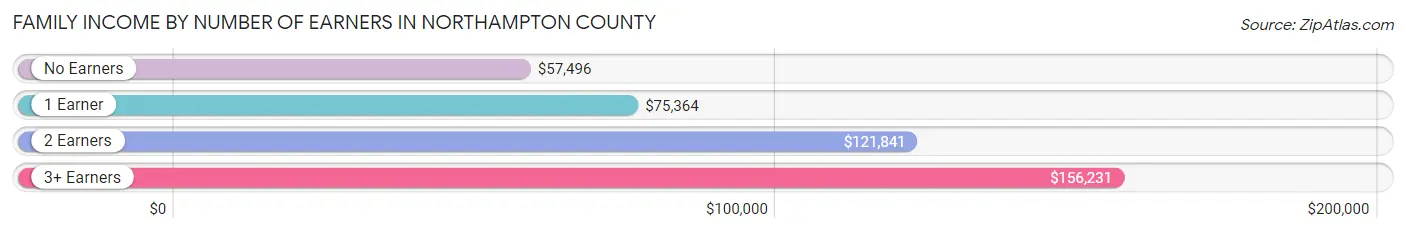
Family Income by Number of Earners in Northampton County
The median family income in Northampton County is $101,606, with families comprising 3+ earners (11,331) having the highest median family income of $156,231, while families with no earners (13,123) have the lowest median family income of $57,496, accounting for 14.0% and 16.3% of families, respectively.
| Number of Earners | # Families | Median Income |
| No Earners | 13,123 (16.3%) | $57,496 |
| 1 Earner | 22,322 (27.7%) | $75,364 |
| 2 Earners | 33,942 (42.0%) | $121,841 |
| 3+ Earners | 11,331 (14.0%) | $156,231 |
| Total | 80,718 (100.0%) | $101,606 |
Household Income in Northampton County
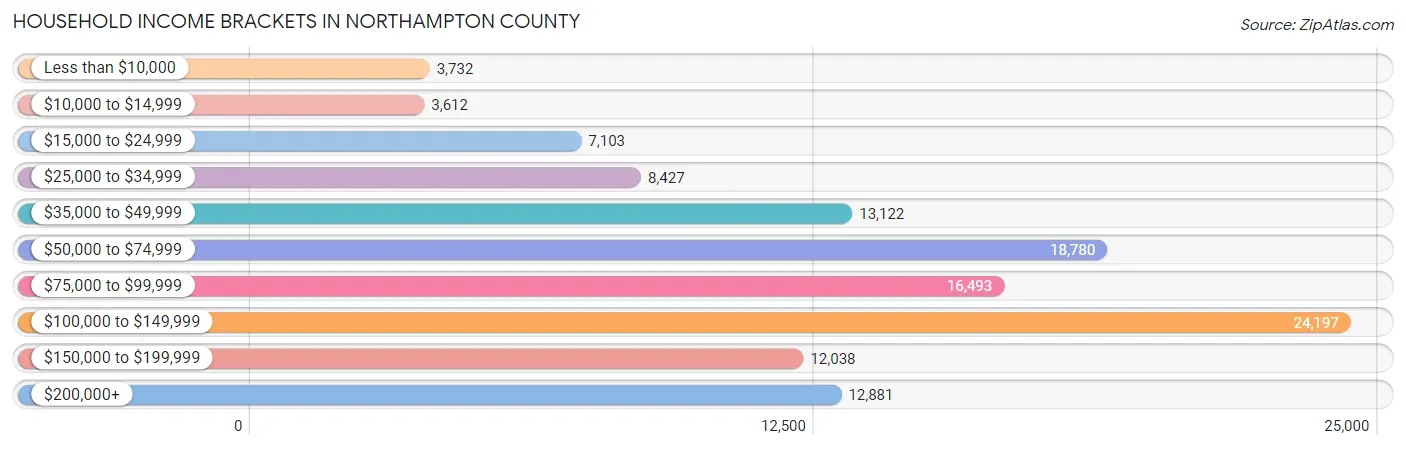
Household Income Brackets in Northampton County
With 24,197 households falling in the category, the $100,000 to $149,999 income range is the most frequent in Northampton County, accounting for 20.1% of all households. In contrast, only 3,612 households (3.0%) fall into the $10,000 to $14,999 income bracket, making it the least populous group.
| Income Bracket | # Households | % Households |
| Less than $10,000 | 3,732 | 3.1% |
| $10,000 to $14,999 | 3,612 | 3.0% |
| $15,000 to $24,999 | 7,103 | 5.9% |
| $25,000 to $34,999 | 8,427 | 7.0% |
| $35,000 to $49,999 | 13,122 | 10.9% |
| $50,000 to $74,999 | 18,780 | 15.6% |
| $75,000 to $99,999 | 16,493 | 13.7% |
| $100,000 to $149,999 | 24,197 | 20.1% |
| $150,000 to $199,999 | 12,038 | 10.0% |
| $200,000+ | 12,881 | 10.7% |
Household Income by Householder Age in Northampton County
The median household income in Northampton County is $82,201, with the highest median household income of $106,592 found in the 45 to 64 years age bracket for the primary householder. A total of 46,837 households (38.9%) fall into this category. Meanwhile, the 15 to 24 years age bracket for the primary householder has the lowest median household income of $56,364, with 2,556 households (2.1%) in this group.
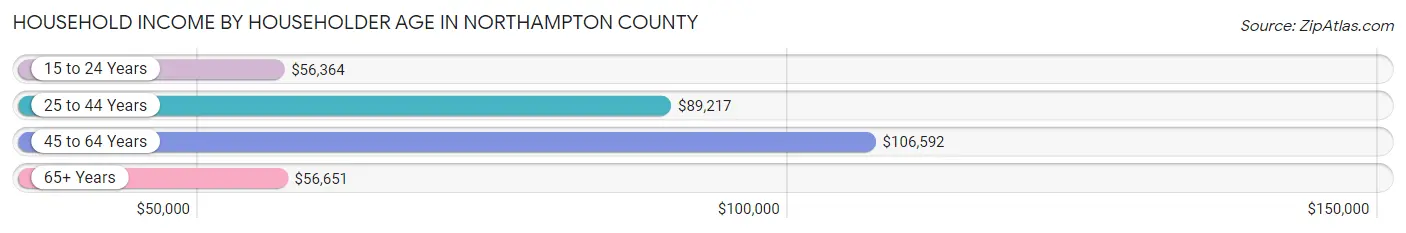
| Income Bracket | # Households | Median Income |
| 15 to 24 Years | 2,556 (2.1%) | $56,364 |
| 25 to 44 Years | 33,639 (27.9%) | $89,217 |
| 45 to 64 Years | 46,837 (38.9%) | $106,592 |
| 65+ Years | 37,352 (31.0%) | $56,651 |
| Total | 120,384 (100.0%) | $82,201 |
Poverty in Northampton County
Income Below Poverty by Sex and Age in Northampton County
With 8.6% poverty level for males and 9.8% for females among the residents of Northampton County, 18 to 24 year old males and 12 to 14 year old females are the most vulnerable to poverty, with 2,091 males (16.2%) and 1,073 females (17.6%) in their respective age groups living below the poverty level.
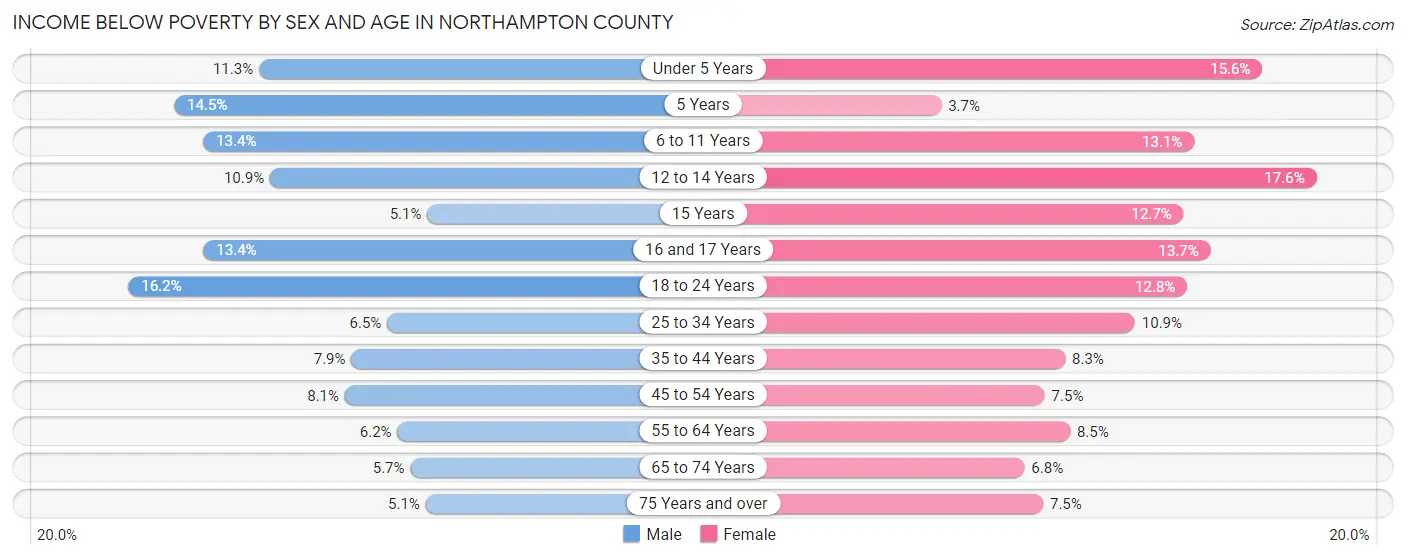
| Age Bracket | Male | Female |
| Under 5 Years | 826 (11.3%) | 1,112 (15.6%) |
| 5 Years | 183 (14.4%) | 45 (3.7%) |
| 6 to 11 Years | 1,382 (13.4%) | 1,196 (13.1%) |
| 12 to 14 Years | 655 (10.9%) | 1,073 (17.6%) |
| 15 Years | 95 (5.1%) | 255 (12.7%) |
| 16 and 17 Years | 553 (13.4%) | 507 (13.7%) |
| 18 to 24 Years | 2,091 (16.2%) | 1,476 (12.8%) |
| 25 to 34 Years | 1,243 (6.5%) | 1,965 (10.9%) |
| 35 to 44 Years | 1,462 (7.9%) | 1,530 (8.3%) |
| 45 to 54 Years | 1,610 (8.1%) | 1,492 (7.5%) |
| 55 to 64 Years | 1,343 (6.2%) | 1,887 (8.5%) |
| 65 to 74 Years | 921 (5.7%) | 1,207 (6.8%) |
| 75 Years and over | 529 (5.1%) | 1,130 (7.5%) |
| Total | 12,893 (8.6%) | 14,875 (9.8%) |
Income Above Poverty by Sex and Age in Northampton County
According to the poverty statistics in Northampton County, males aged 15 years and females aged 5 years are the age groups that are most secure financially, with 95.0% of males and 96.3% of females in these age groups living above the poverty line.
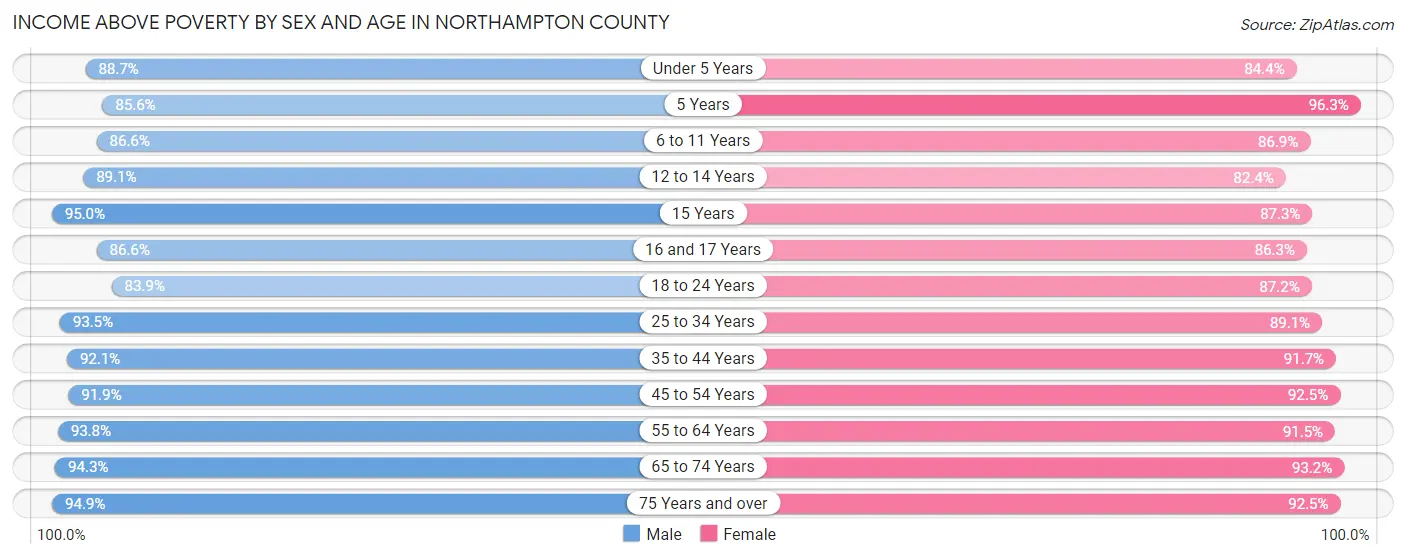
| Age Bracket | Male | Female |
| Under 5 Years | 6,482 (88.7%) | 6,011 (84.4%) |
| 5 Years | 1,083 (85.6%) | 1,175 (96.3%) |
| 6 to 11 Years | 8,955 (86.6%) | 7,946 (86.9%) |
| 12 to 14 Years | 5,357 (89.1%) | 5,017 (82.4%) |
| 15 Years | 1,787 (95.0%) | 1,754 (87.3%) |
| 16 and 17 Years | 3,586 (86.6%) | 3,197 (86.3%) |
| 18 to 24 Years | 10,860 (83.9%) | 10,034 (87.2%) |
| 25 to 34 Years | 17,775 (93.5%) | 16,098 (89.1%) |
| 35 to 44 Years | 17,123 (92.1%) | 16,935 (91.7%) |
| 45 to 54 Years | 18,239 (91.9%) | 18,316 (92.5%) |
| 55 to 64 Years | 20,450 (93.8%) | 20,386 (91.5%) |
| 65 to 74 Years | 15,288 (94.3%) | 16,604 (93.2%) |
| 75 Years and over | 9,820 (94.9%) | 13,996 (92.5%) |
| Total | 136,805 (91.4%) | 137,469 (90.2%) |
Income Below Poverty Among Married-Couple Families in Northampton County
The poverty statistics for married-couple families in Northampton County show that 2.5% or 1,549 of the total 61,253 families live below the poverty line. Families with 5 or more children have the highest poverty rate of 24.2%, comprising of 112 families. On the other hand, families with 1 or 2 children have the lowest poverty rate of 1.8%, which includes 337 families.
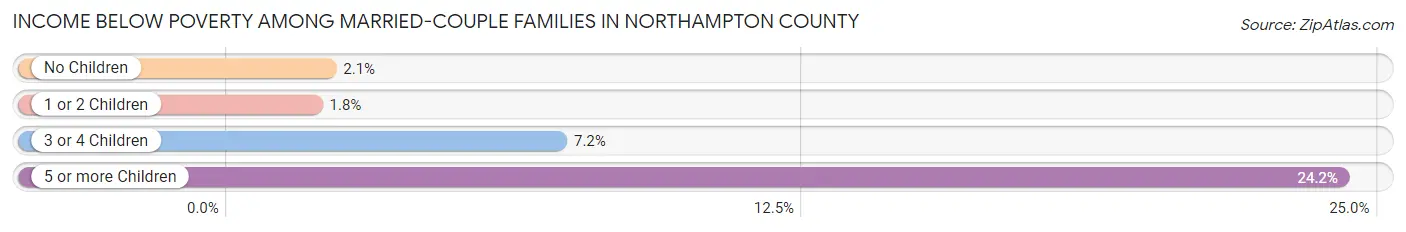
| Children | Above Poverty | Below Poverty |
| No Children | 37,837 (97.9%) | 828 (2.1%) |
| 1 or 2 Children | 17,988 (98.2%) | 337 (1.8%) |
| 3 or 4 Children | 3,528 (92.8%) | 272 (7.2%) |
| 5 or more Children | 351 (75.8%) | 112 (24.2%) |
| Total | 59,704 (97.5%) | 1,549 (2.5%) |
Income Below Poverty Among Single-Parent Households in Northampton County
According to the poverty data in Northampton County, 10.1% or 562 single-father households and 20.5% or 2,844 single-mother households are living below the poverty line. Among single-father households, those with 3 or 4 children have the highest poverty rate, with 136 households (37.0%) experiencing poverty. Likewise, among single-mother households, those with 5 or more children have the highest poverty rate, with 48 households (71.6%) falling below the poverty line.
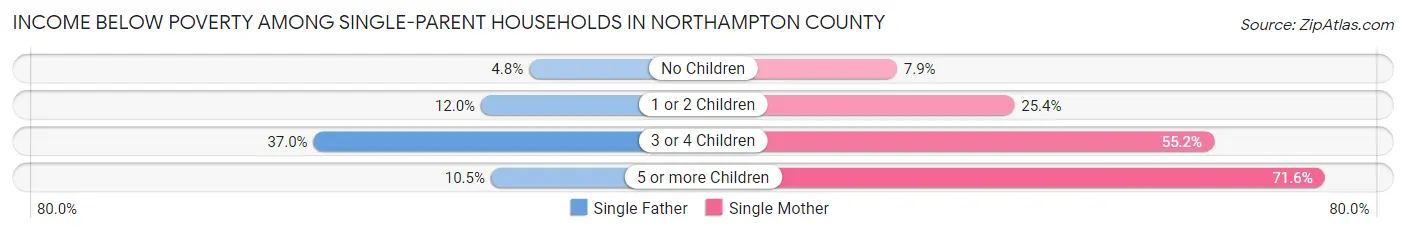
| Children | Single Father | Single Mother |
| No Children | 135 (4.8%) | 484 (7.9%) |
| 1 or 2 Children | 283 (12.0%) | 1,653 (25.4%) |
| 3 or 4 Children | 136 (37.0%) | 659 (55.1%) |
| 5 or more Children | 8 (10.5%) | 48 (71.6%) |
| Total | 562 (10.1%) | 2,844 (20.5%) |
Income Below Poverty Among Married-Couple vs Single-Parent Households in Northampton County
The poverty data for Northampton County shows that 1,549 of the married-couple family households (2.5%) and 3,406 of the single-parent households (17.5%) are living below the poverty level. Within the married-couple family households, those with 5 or more children have the highest poverty rate, with 112 households (24.2%) falling below the poverty line. Among the single-parent households, those with 3 or 4 children have the highest poverty rate, with 795 household (50.9%) living below poverty.
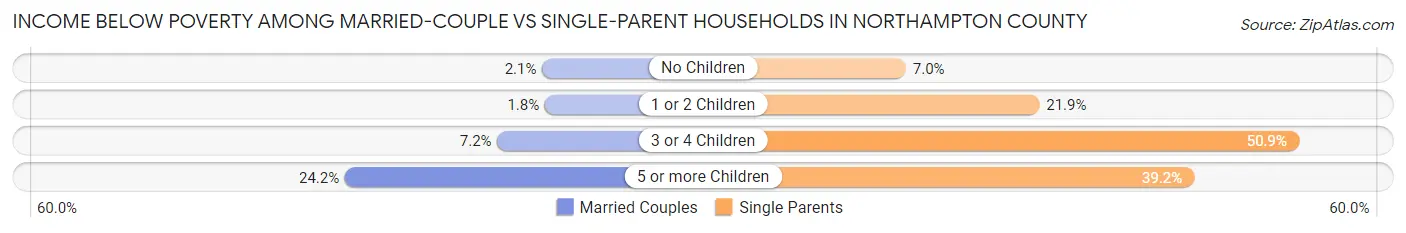
| Children | Married-Couple Families | Single-Parent Households |
| No Children | 828 (2.1%) | 619 (7.0%) |
| 1 or 2 Children | 337 (1.8%) | 1,936 (21.9%) |
| 3 or 4 Children | 272 (7.2%) | 795 (50.9%) |
| 5 or more Children | 112 (24.2%) | 56 (39.2%) |
| Total | 1,549 (2.5%) | 3,406 (17.5%) |
Race in Northampton County
The most populous races in Northampton County are White / Caucasian (248,000 | 78.9%), Hispanic or Latino (46,200 | 14.7%), and Two or more Races (22,237 | 7.1%).
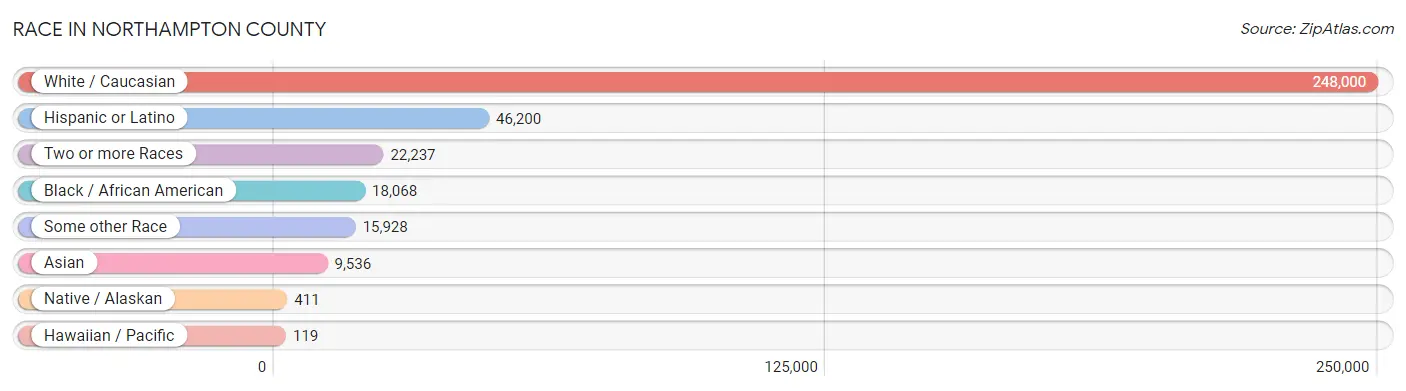
| Race | # Population | % Population |
| Asian | 9,536 | 3.0% |
| Black / African American | 18,068 | 5.8% |
| Hawaiian / Pacific | 119 | 0.0% |
| Hispanic or Latino | 46,200 | 14.7% |
| Native / Alaskan | 411 | 0.1% |
| White / Caucasian | 248,000 | 78.9% |
| Two or more Races | 22,237 | 7.1% |
| Some other Race | 15,928 | 5.1% |
| Total | 314,299 | 100.0% |
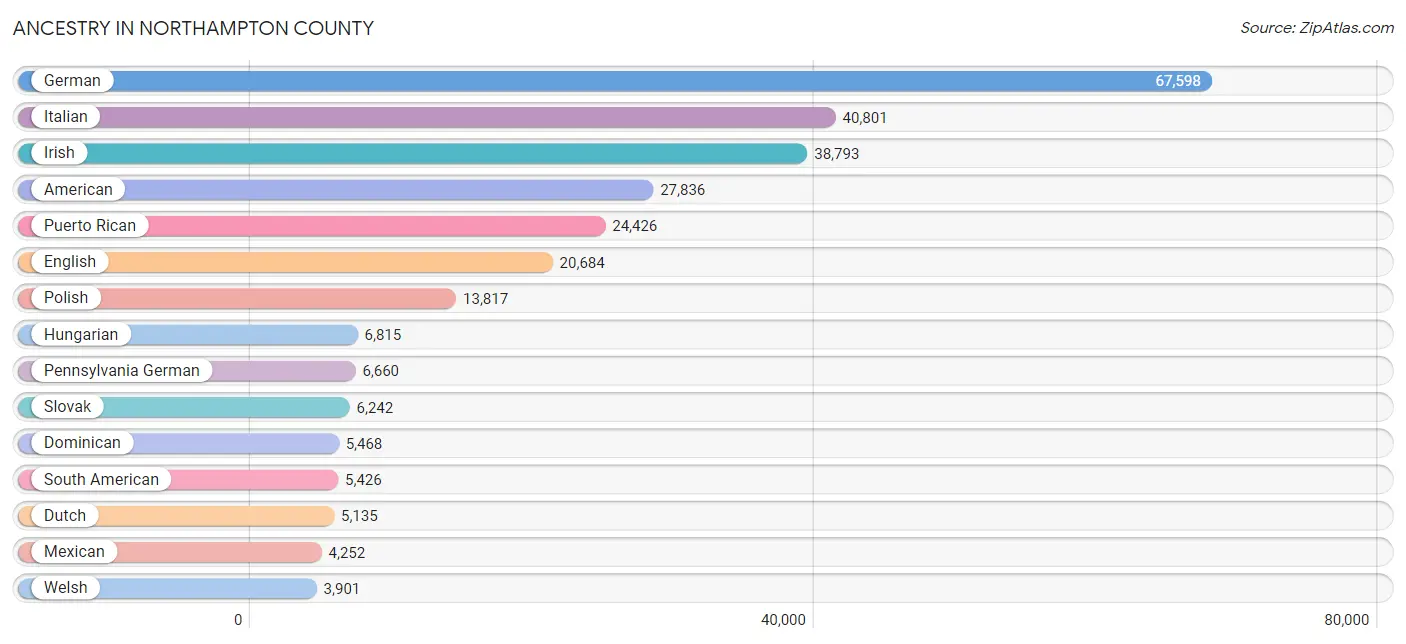
Ancestry in Northampton County
The most populous ancestries reported in Northampton County are German (67,598 | 21.5%), Italian (40,801 | 13.0%), Irish (38,793 | 12.3%), American (27,836 | 8.9%), and Puerto Rican (24,426 | 7.8%), together accounting for 63.5% of all Northampton County residents.
| Ancestry | # Population | % Population |
| Afghan | 63 | 0.0% |
| African | 1,279 | 0.4% |
| Alaska Native | 35 | 0.0% |
| Albanian | 183 | 0.1% |
| Alsatian | 10 | 0.0% |
| American | 27,836 | 8.9% |
| Apache | 47 | 0.0% |
| Arab | 2,169 | 0.7% |
| Argentinean | 109 | 0.0% |
| Armenian | 121 | 0.0% |
| Australian | 112 | 0.0% |
| Austrian | 3,040 | 1.0% |
| Barbadian | 5 | 0.0% |
| Belgian | 193 | 0.1% |
| Bermudan | 7 | 0.0% |
| Bhutanese | 322 | 0.1% |
| Blackfeet | 99 | 0.0% |
| Bolivian | 80 | 0.0% |
| Brazilian | 235 | 0.1% |
| British | 1,243 | 0.4% |
| British West Indian | 256 | 0.1% |
| Bulgarian | 314 | 0.1% |
| Burmese | 558 | 0.2% |
| Canadian | 594 | 0.2% |
| Cape Verdean | 18 | 0.0% |
| Carpatho Rusyn | 5 | 0.0% |
| Celtic | 7 | 0.0% |
| Central American | 3,279 | 1.0% |
| Central American Indian | 489 | 0.2% |
| Cherokee | 382 | 0.1% |
| Chilean | 135 | 0.0% |
| Chinese | 7 | 0.0% |
| Chippewa | 26 | 0.0% |
| Colombian | 1,908 | 0.6% |
| Costa Rican | 243 | 0.1% |
| Croatian | 411 | 0.1% |
| Crow | 7 | 0.0% |
| Cuban | 588 | 0.2% |
| Czech | 618 | 0.2% |
| Czechoslovakian | 525 | 0.2% |
| Danish | 267 | 0.1% |
| Delaware | 25 | 0.0% |
| Dominican | 5,468 | 1.7% |
| Dutch | 5,135 | 1.6% |
| Eastern European | 1,064 | 0.3% |
| Ecuadorian | 1,342 | 0.4% |
| Egyptian | 281 | 0.1% |
| English | 20,684 | 6.6% |
| Estonian | 11 | 0.0% |
| Ethiopian | 56 | 0.0% |
| European | 3,307 | 1.1% |
| Filipino | 202 | 0.1% |
| Finnish | 175 | 0.1% |
| French | 3,504 | 1.1% |
| French American Indian | 3 | 0.0% |
| French Canadian | 631 | 0.2% |
| German | 67,598 | 21.5% |
| Ghanaian | 84 | 0.0% |
| Greek | 1,977 | 0.6% |
| Guamanian / Chamorro | 7 | 0.0% |
| Guatemalan | 1,279 | 0.4% |
| Guyanese | 169 | 0.1% |
| Haitian | 867 | 0.3% |
| Honduran | 631 | 0.2% |
| Hungarian | 6,815 | 2.2% |
| Icelander | 11 | 0.0% |
| Indian (Asian) | 3,164 | 1.0% |
| Iranian | 125 | 0.0% |
| Irish | 38,793 | 12.3% |
| Iroquois | 38 | 0.0% |
| Israeli | 49 | 0.0% |
| Italian | 40,801 | 13.0% |
| Jamaican | 1,753 | 0.6% |
| Japanese | 20 | 0.0% |
| Jordanian | 12 | 0.0% |
| Kenyan | 111 | 0.0% |
| Korean | 1,794 | 0.6% |
| Laotian | 20 | 0.0% |
| Latvian | 21 | 0.0% |
| Lebanese | 951 | 0.3% |
| Liberian | 47 | 0.0% |
| Lithuanian | 1,116 | 0.4% |
| Macedonian | 67 | 0.0% |
| Malaysian | 16 | 0.0% |
| Maltese | 29 | 0.0% |
| Mexican | 4,252 | 1.3% |
| Mexican American Indian | 310 | 0.1% |
| Moroccan | 33 | 0.0% |
| Native Hawaiian | 58 | 0.0% |
| Navajo | 20 | 0.0% |
| New Zealander | 29 | 0.0% |
| Nicaraguan | 106 | 0.0% |
| Nigerian | 171 | 0.1% |
| Northern European | 452 | 0.1% |
| Norwegian | 1,138 | 0.4% |
| Okinawan | 21 | 0.0% |
| Pakistani | 107 | 0.0% |
| Panamanian | 271 | 0.1% |
| Pennsylvania German | 6,660 | 2.1% |
| Peruvian | 1,080 | 0.3% |
| Pima | 15 | 0.0% |
| Polish | 13,817 | 4.4% |
| Portuguese | 1,802 | 0.6% |
| Pueblo | 7 | 0.0% |
| Puerto Rican | 24,426 | 7.8% |
| Romanian | 356 | 0.1% |
| Russian | 3,620 | 1.1% |
| Salvadoran | 749 | 0.2% |
| Samoan | 1 | 0.0% |
| Scandinavian | 386 | 0.1% |
| Scotch-Irish | 1,416 | 0.4% |
| Scottish | 3,085 | 1.0% |
| Seminole | 10 | 0.0% |
| Senegalese | 9 | 0.0% |
| Serbian | 75 | 0.0% |
| Sioux | 30 | 0.0% |
| Slavic | 324 | 0.1% |
| Slovak | 6,242 | 2.0% |
| Slovene | 291 | 0.1% |
| South African | 21 | 0.0% |
| South American | 5,426 | 1.7% |
| Spaniard | 732 | 0.2% |
| Spanish | 552 | 0.2% |
| Spanish American | 17 | 0.0% |
| Sri Lankan | 1,145 | 0.4% |
| Subsaharan African | 2,200 | 0.7% |
| Swedish | 1,605 | 0.5% |
| Swiss | 936 | 0.3% |
| Syrian | 717 | 0.2% |
| Thai | 3,589 | 1.1% |
| Tongan | 108 | 0.0% |
| Trinidadian and Tobagonian | 348 | 0.1% |
| Turkish | 744 | 0.2% |
| Ugandan | 35 | 0.0% |
| Ukrainian | 3,432 | 1.1% |
| Uruguayan | 248 | 0.1% |
| Venezuelan | 419 | 0.1% |
| Welsh | 3,901 | 1.2% |
| West Indian | 290 | 0.1% |
| Yugoslavian | 393 | 0.1% | View All 140 Rows |
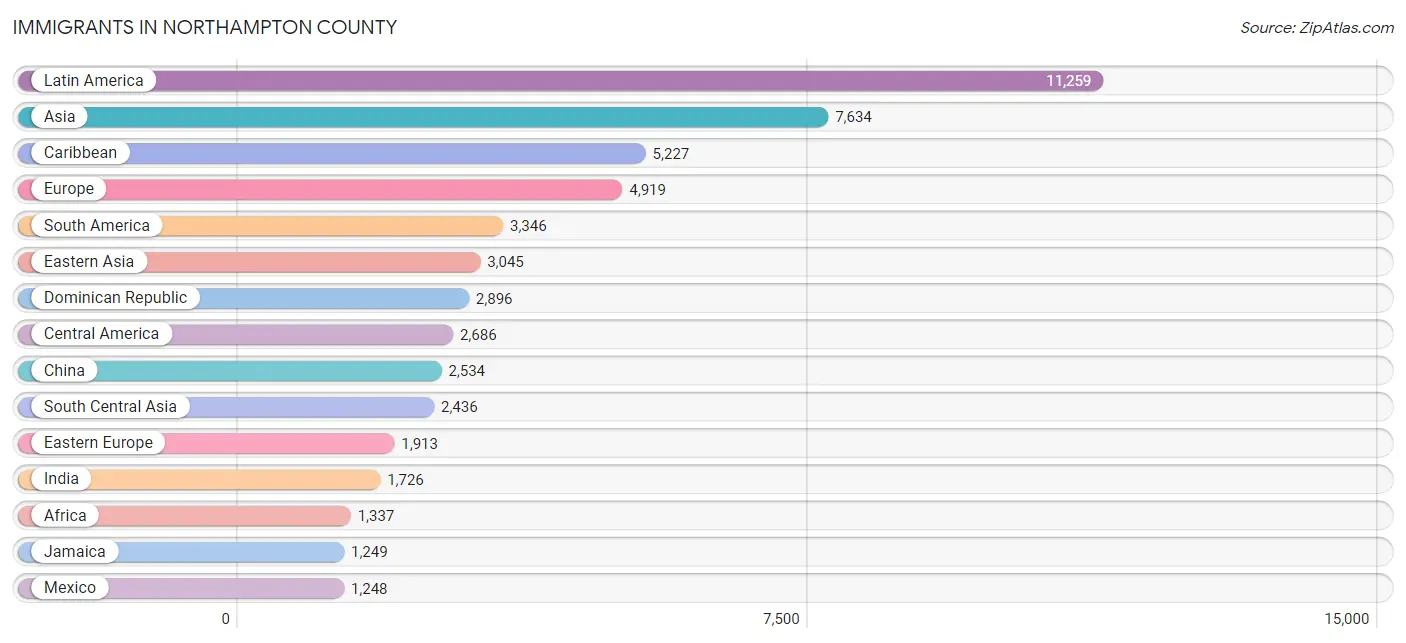
Immigrants in Northampton County
The most numerous immigrant groups reported in Northampton County came from Latin America (11,259 | 3.6%), Asia (7,634 | 2.4%), Caribbean (5,227 | 1.7%), Europe (4,919 | 1.6%), and South America (3,346 | 1.1%), together accounting for 10.3% of all Northampton County residents.
| Immigration Origin | # Population | % Population |
| Afghanistan | 63 | 0.0% |
| Africa | 1,337 | 0.4% |
| Albania | 61 | 0.0% |
| Argentina | 4 | 0.0% |
| Armenia | 89 | 0.0% |
| Asia | 7,634 | 2.4% |
| Australia | 84 | 0.0% |
| Austria | 46 | 0.0% |
| Azores | 17 | 0.0% |
| Bahamas | 23 | 0.0% |
| Barbados | 5 | 0.0% |
| Belarus | 10 | 0.0% |
| Belgium | 24 | 0.0% |
| Bolivia | 72 | 0.0% |
| Bosnia and Herzegovina | 8 | 0.0% |
| Brazil | 320 | 0.1% |
| Bulgaria | 175 | 0.1% |
| Cambodia | 16 | 0.0% |
| Cameroon | 257 | 0.1% |
| Canada | 627 | 0.2% |
| Caribbean | 5,227 | 1.7% |
| Central America | 2,686 | 0.9% |
| Chile | 13 | 0.0% |
| China | 2,534 | 0.8% |
| Colombia | 1,176 | 0.4% |
| Costa Rica | 218 | 0.1% |
| Croatia | 51 | 0.0% |
| Cuba | 48 | 0.0% |
| Czechoslovakia | 44 | 0.0% |
| Dominican Republic | 2,896 | 0.9% |
| Eastern Africa | 288 | 0.1% |
| Eastern Asia | 3,045 | 1.0% |
| Eastern Europe | 1,913 | 0.6% |
| Ecuador | 516 | 0.2% |
| Egypt | 108 | 0.0% |
| El Salvador | 378 | 0.1% |
| England | 475 | 0.2% |
| Eritrea | 26 | 0.0% |
| Ethiopia | 67 | 0.0% |
| Europe | 4,919 | 1.6% |
| France | 212 | 0.1% |
| Germany | 415 | 0.1% |
| Ghana | 117 | 0.0% |
| Greece | 193 | 0.1% |
| Grenada | 149 | 0.1% |
| Guatemala | 454 | 0.1% |
| Guyana | 186 | 0.1% |
| Haiti | 412 | 0.1% |
| Honduras | 162 | 0.1% |
| Hong Kong | 49 | 0.0% |
| Hungary | 129 | 0.0% |
| India | 1,726 | 0.5% |
| Iran | 60 | 0.0% |
| Ireland | 243 | 0.1% |
| Israel | 20 | 0.0% |
| Italy | 396 | 0.1% |
| Jamaica | 1,249 | 0.4% |
| Japan | 89 | 0.0% |
| Kazakhstan | 23 | 0.0% |
| Kenya | 142 | 0.1% |
| Korea | 422 | 0.1% |
| Latin America | 11,259 | 3.6% |
| Lebanon | 226 | 0.1% |
| Liberia | 126 | 0.0% |
| Mexico | 1,248 | 0.4% |
| Middle Africa | 265 | 0.1% |
| Morocco | 166 | 0.1% |
| Netherlands | 82 | 0.0% |
| Nicaragua | 51 | 0.0% |
| Nigeria | 101 | 0.0% |
| North Macedonia | 68 | 0.0% |
| Northern Africa | 287 | 0.1% |
| Northern Europe | 1,080 | 0.3% |
| Norway | 56 | 0.0% |
| Oceania | 136 | 0.0% |
| Pakistan | 426 | 0.1% |
| Panama | 175 | 0.1% |
| Peru | 391 | 0.1% |
| Philippines | 658 | 0.2% |
| Poland | 661 | 0.2% |
| Portugal | 480 | 0.2% |
| Romania | 98 | 0.0% |
| Russia | 347 | 0.1% |
| Saudi Arabia | 23 | 0.0% |
| Scotland | 83 | 0.0% |
| Senegal | 9 | 0.0% |
| Serbia | 5 | 0.0% |
| Singapore | 38 | 0.0% |
| South Africa | 8 | 0.0% |
| South America | 3,346 | 1.1% |
| South Central Asia | 2,436 | 0.8% |
| South Eastern Asia | 1,159 | 0.4% |
| Southern Europe | 1,095 | 0.4% |
| Spain | 26 | 0.0% |
| St. Vincent and the Grenadines | 11 | 0.0% |
| Sweden | 10 | 0.0% |
| Switzerland | 27 | 0.0% |
| Syria | 185 | 0.1% |
| Taiwan | 457 | 0.2% |
| Thailand | 61 | 0.0% |
| Trinidad and Tobago | 374 | 0.1% |
| Turkey | 386 | 0.1% |
| Uganda | 53 | 0.0% |
| Ukraine | 203 | 0.1% |
| Uruguay | 209 | 0.1% |
| Uzbekistan | 65 | 0.0% |
| Venezuela | 431 | 0.1% |
| Vietnam | 386 | 0.1% |
| Western Africa | 413 | 0.1% |
| Western Asia | 983 | 0.3% |
| Western Europe | 806 | 0.3% | View All 111 Rows |
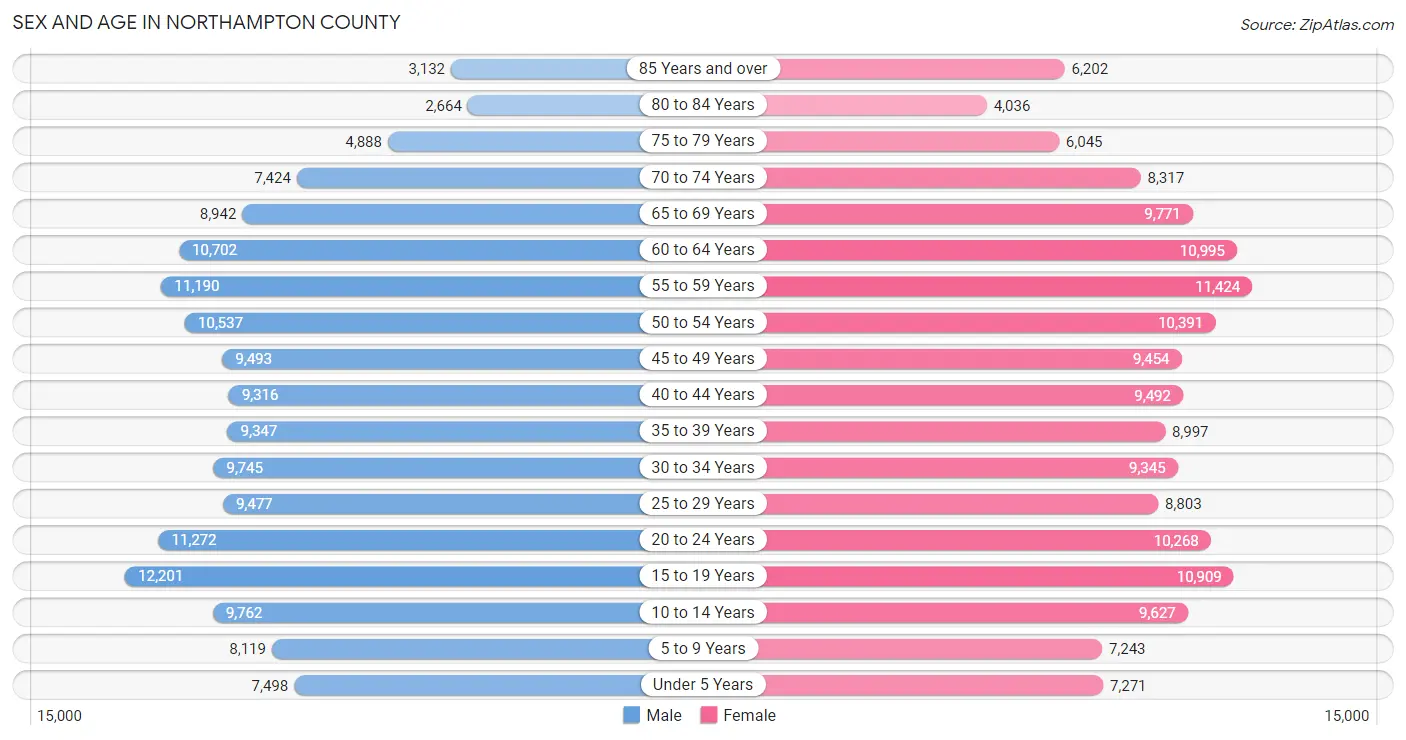
Sex and Age in Northampton County
Sex and Age in Northampton County
The most populous age groups in Northampton County are 15 to 19 Years (12,201 | 7.8%) for men and 55 to 59 Years (11,424 | 7.2%) for women.
| Age Bracket | Male | Female |
| Under 5 Years | 7,498 (4.8%) | 7,271 (4.6%) |
| 5 to 9 Years | 8,119 (5.2%) | 7,243 (4.6%) |
| 10 to 14 Years | 9,762 (6.3%) | 9,627 (6.1%) |
| 15 to 19 Years | 12,201 (7.8%) | 10,909 (6.9%) |
| 20 to 24 Years | 11,272 (7.2%) | 10,268 (6.5%) |
| 25 to 29 Years | 9,477 (6.1%) | 8,803 (5.6%) |
| 30 to 34 Years | 9,745 (6.3%) | 9,345 (5.9%) |
| 35 to 39 Years | 9,347 (6.0%) | 8,997 (5.7%) |
| 40 to 44 Years | 9,316 (6.0%) | 9,492 (6.0%) |
| 45 to 49 Years | 9,493 (6.1%) | 9,454 (6.0%) |
| 50 to 54 Years | 10,537 (6.8%) | 10,391 (6.6%) |
| 55 to 59 Years | 11,190 (7.2%) | 11,424 (7.2%) |
| 60 to 64 Years | 10,702 (6.9%) | 10,995 (6.9%) |
| 65 to 69 Years | 8,942 (5.7%) | 9,771 (6.2%) |
| 70 to 74 Years | 7,424 (4.8%) | 8,317 (5.2%) |
| 75 to 79 Years | 4,888 (3.1%) | 6,045 (3.8%) |
| 80 to 84 Years | 2,664 (1.7%) | 4,036 (2.5%) |
| 85 Years and over | 3,132 (2.0%) | 6,202 (3.9%) |
| Total | 155,709 (100.0%) | 158,590 (100.0%) |
Families and Households in Northampton County
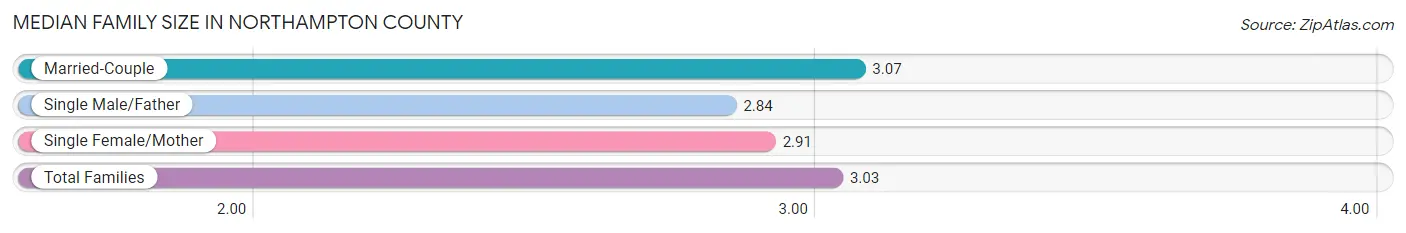
Median Family Size in Northampton County
The median family size in Northampton County is 3.03 persons per family, with married-couple families (61,253 | 75.9%) accounting for the largest median family size of 3.07 persons per family. On the other hand, single male/father families (5,592 | 6.9%) represent the smallest median family size with 2.84 persons per family.
| Family Type | # Families | Family Size |
| Married-Couple | 61,253 (75.9%) | 3.07 |
| Single Male/Father | 5,592 (6.9%) | 2.84 |
| Single Female/Mother | 13,873 (17.2%) | 2.91 |
| Total Families | 80,718 (100.0%) | 3.03 |
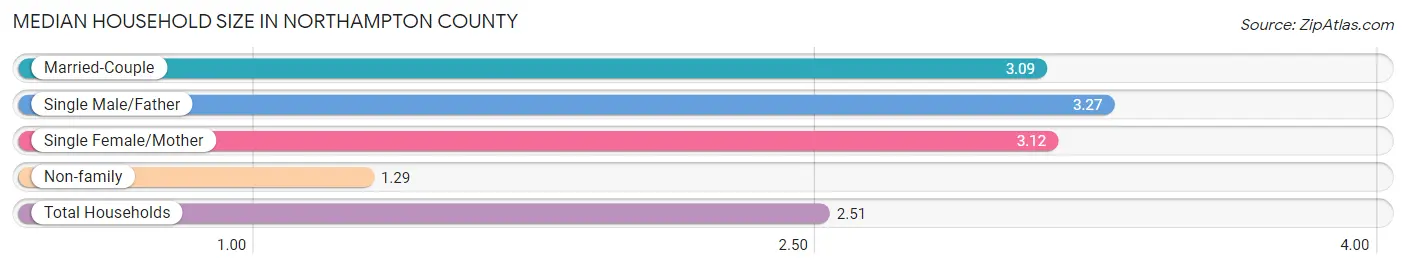
Median Household Size in Northampton County
The median household size in Northampton County is 2.51 persons per household, with single male/father households (5,592 | 4.6%) accounting for the largest median household size of 3.27 persons per household. non-family households (39,666 | 33.0%) represent the smallest median household size with 1.29 persons per household.
| Household Type | # Households | Household Size |
| Married-Couple | 61,253 (50.9%) | 3.09 |
| Single Male/Father | 5,592 (4.6%) | 3.27 |
| Single Female/Mother | 13,873 (11.5%) | 3.12 |
| Non-family | 39,666 (33.0%) | 1.29 |
| Total Households | 120,384 (100.0%) | 2.51 |
Household Size by Marriage Status in Northampton County
Out of a total of 120,384 households in Northampton County, 80,718 (67.0%) are family households, while 39,666 (33.0%) are nonfamily households. The most numerous type of family households are 2-person households, comprising 37,447, and the most common type of nonfamily households are 1-person households, comprising 31,698.
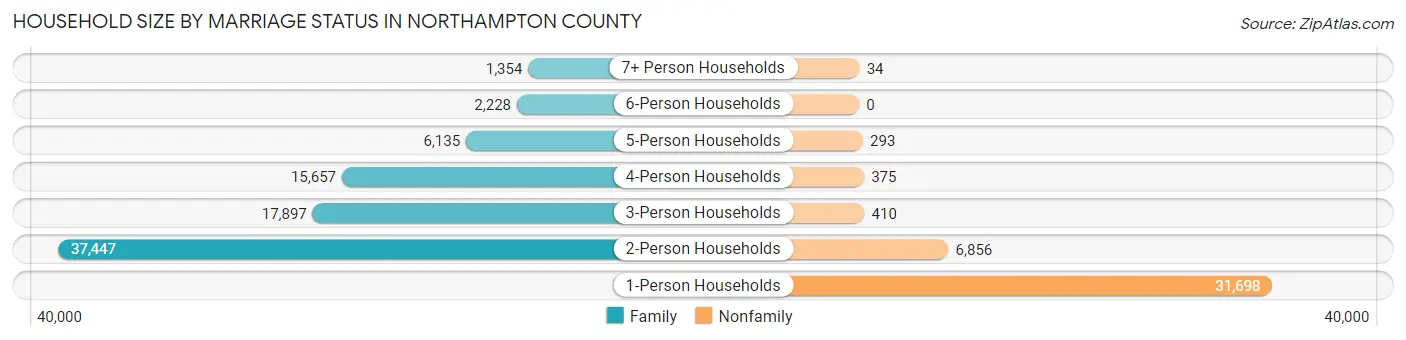
| Household Size | Family Households | Nonfamily Households |
| 1-Person Households | - | 31,698 (26.3%) |
| 2-Person Households | 37,447 (31.1%) | 6,856 (5.7%) |
| 3-Person Households | 17,897 (14.9%) | 410 (0.3%) |
| 4-Person Households | 15,657 (13.0%) | 375 (0.3%) |
| 5-Person Households | 6,135 (5.1%) | 293 (0.2%) |
| 6-Person Households | 2,228 (1.8%) | 0 (0.0%) |
| 7+ Person Households | 1,354 (1.1%) | 34 (0.0%) |
| Total | 80,718 (67.0%) | 39,666 (33.0%) |
Female Fertility in Northampton County
Fertility by Age in Northampton County
Average fertility rate in Northampton County is 45.0 births per 1,000 women. Women in the age bracket of 20 to 34 years have the highest fertility rate with 65.0 births per 1,000 women. Women in the age bracket of 20 to 34 years acount for 59.1% of all women with births.
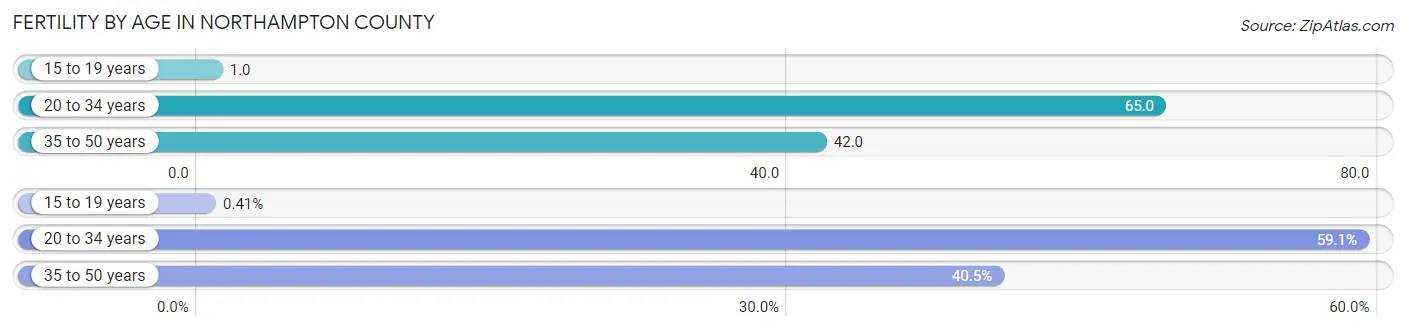
| Age Bracket | Women with Births | Births / 1,000 Women |
| 15 to 19 years | 13 (0.4%) | 1.0 |
| 20 to 34 years | 1,855 (59.1%) | 65.0 |
| 35 to 50 years | 1,272 (40.5%) | 42.0 |
| Total | 3,140 (100.0%) | 45.0 |
Fertility by Age by Marriage Status in Northampton County
73.3% of women with births (3,140) in Northampton County are married. The highest percentage of unmarried women with births falls into 15 to 19 years age bracket with 100.0% of them unmarried at the time of birth, while the lowest percentage of unmarried women with births belong to 35 to 50 years age bracket with 21.9% of them unmarried.
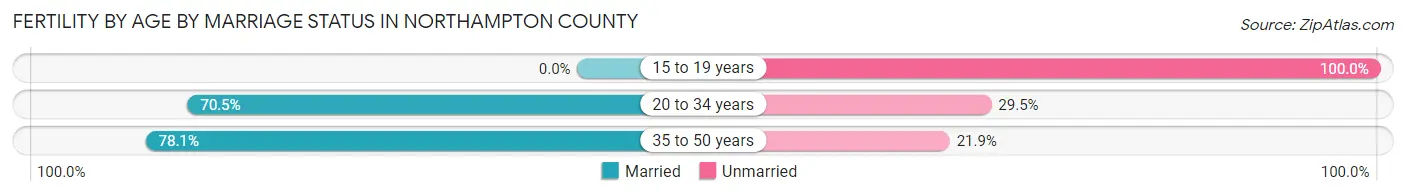
| Age Bracket | Married | Unmarried |
| 15 to 19 years | 0 (0.0%) | 13 (100.0%) |
| 20 to 34 years | 1,308 (70.5%) | 547 (29.5%) |
| 35 to 50 years | 993 (78.1%) | 279 (21.9%) |
| Total | 2,302 (73.3%) | 838 (26.7%) |
Fertility by Education in Northampton County
Average fertility rate in Northampton County is 45.0 births per 1,000 women. Women with the education attainment of graduate degree have the highest fertility rate of 67.0 births per 1,000 women, while women with the education attainment of less than high school have the lowest fertility at 21.0 births per 1,000 women. Women with the education attainment of college or associate's degree represent 27.6% of all women with births.
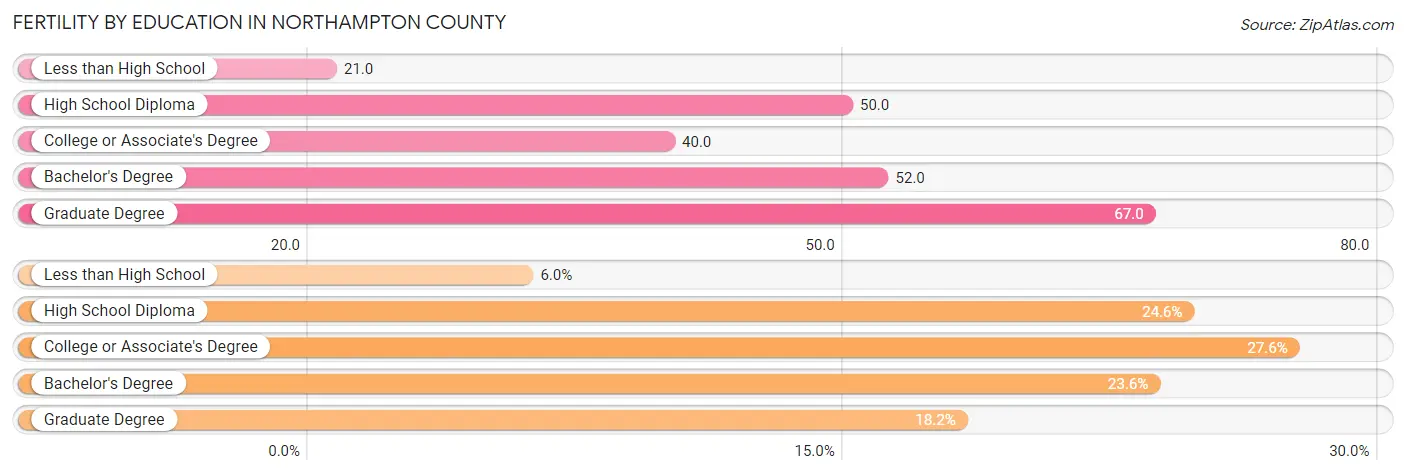
| Educational Attainment | Women with Births | Births / 1,000 Women |
| Less than High School | 189 (6.0%) | 21.0 |
| High School Diploma | 772 (24.6%) | 50.0 |
| College or Associate's Degree | 865 (27.6%) | 40.0 |
| Bachelor's Degree | 742 (23.6%) | 52.0 |
| Graduate Degree | 572 (18.2%) | 67.0 |
| Total | 3,140 (100.0%) | 45.0 |
Fertility by Education by Marriage Status in Northampton County
26.7% of women with births in Northampton County are unmarried. Women with the educational attainment of graduate degree are most likely to be married with 96.0% of them married at childbirth, while women with the educational attainment of high school diploma are least likely to be married with 53.0% of them unmarried at childbirth.
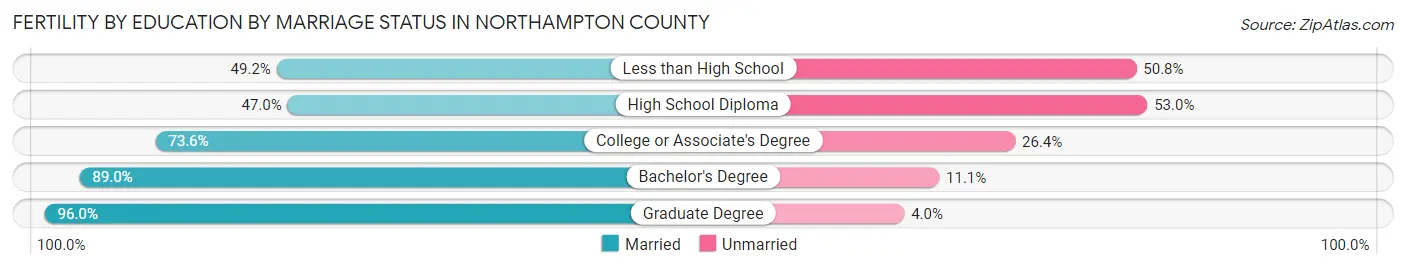
| Educational Attainment | Married | Unmarried |
| Less than High School | 93 (49.2%) | 96 (50.8%) |
| High School Diploma | 363 (47.0%) | 409 (53.0%) |
| College or Associate's Degree | 637 (73.6%) | 228 (26.4%) |
| Bachelor's Degree | 660 (88.9%) | 82 (11.1%) |
| Graduate Degree | 549 (96.0%) | 23 (4.0%) |
| Total | 2,302 (73.3%) | 838 (26.7%) |
Employment Characteristics in Northampton County
Employment by Class of Employer in Northampton County
Among the 153,491 employed individuals in Northampton County, private company employees (107,495 | 70.0%), not-for-profit organizations (18,950 | 12.3%), and local government employees (10,164 | 6.6%) make up the most common classes of employment.
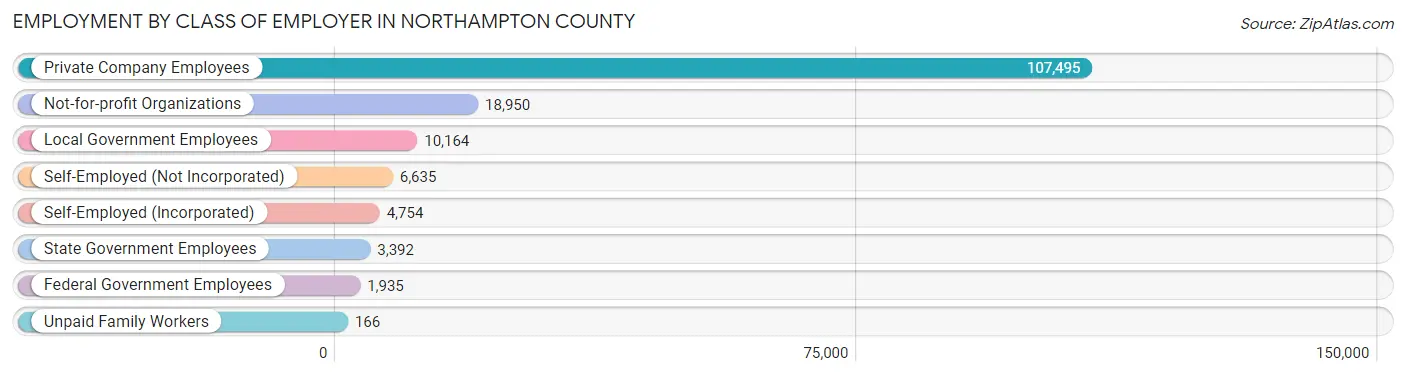
| Employer Class | # Employees | % Employees |
| Private Company Employees | 107,495 | 70.0% |
| Self-Employed (Incorporated) | 4,754 | 3.1% |
| Self-Employed (Not Incorporated) | 6,635 | 4.3% |
| Not-for-profit Organizations | 18,950 | 12.3% |
| Local Government Employees | 10,164 | 6.6% |
| State Government Employees | 3,392 | 2.2% |
| Federal Government Employees | 1,935 | 1.3% |
| Unpaid Family Workers | 166 | 0.1% |
| Total | 153,491 | 100.0% |
Employment Status by Age in Northampton County
According to the labor force statistics for Northampton County, out of the total population over 16 years of age (260,869), 62.7% or 163,565 individuals are in the labor force, with 4.6% or 7,524 of them unemployed. The age group with the highest labor force participation rate is 30 to 34 years, with 87.1% or 16,627 individuals in the labor force. Within the labor force, the 16 to 19 years age range has the highest percentage of unemployed individuals, with 12.8% or 1,062 of them being unemployed.
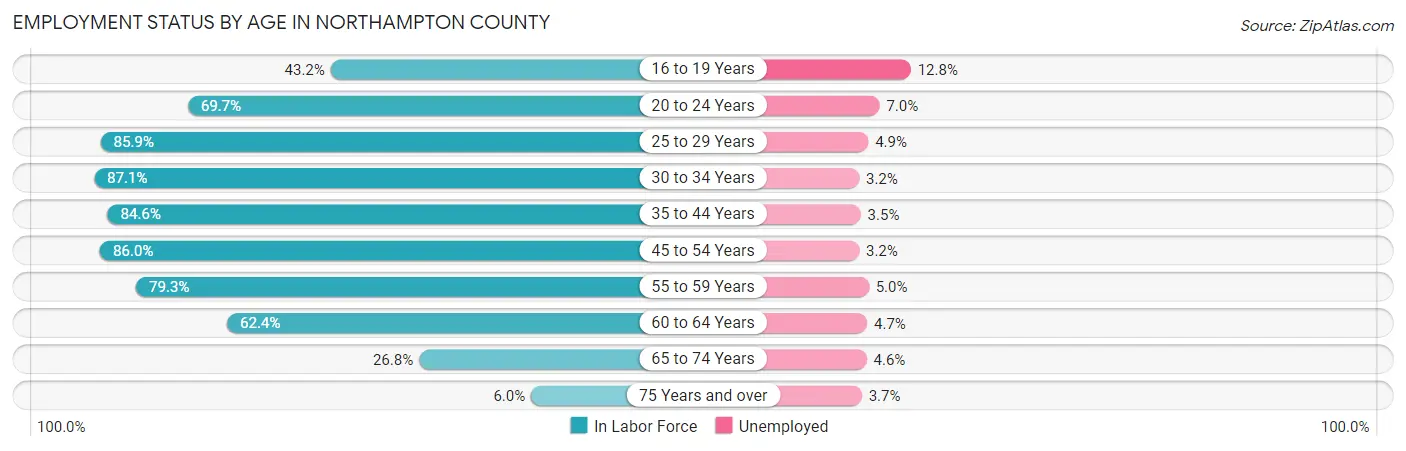
| Age Bracket | In Labor Force | Unemployed |
| 16 to 19 Years | 8,294 (43.2%) | 1,062 (12.8%) |
| 20 to 24 Years | 15,013 (69.7%) | 1,051 (7.0%) |
| 25 to 29 Years | 15,703 (85.9%) | 769 (4.9%) |
| 30 to 34 Years | 16,627 (87.1%) | 532 (3.2%) |
| 35 to 44 Years | 31,431 (84.6%) | 1,100 (3.5%) |
| 45 to 54 Years | 34,292 (86.0%) | 1,097 (3.2%) |
| 55 to 59 Years | 17,933 (79.3%) | 897 (5.0%) |
| 60 to 64 Years | 13,539 (62.4%) | 636 (4.7%) |
| 65 to 74 Years | 9,234 (26.8%) | 425 (4.6%) |
| 75 Years and over | 1,618 (6.0%) | 60 (3.7%) |
| Total | 163,565 (62.7%) | 7,524 (4.6%) |
Employment Status by Educational Attainment in Northampton County
According to labor force statistics for Northampton County, 81.6% of individuals (129,506) out of the total population between 25 and 64 years of age (158,708) are in the labor force, with 3.9% or 5,051 of them being unemployed. The group with the highest labor force participation rate are those with the educational attainment of bachelor's degree or higher, with 89.8% or 50,204 individuals in the labor force. Within the labor force, individuals with less than high school education have the highest percentage of unemployment, with 7.4% or 490 of them being unemployed.
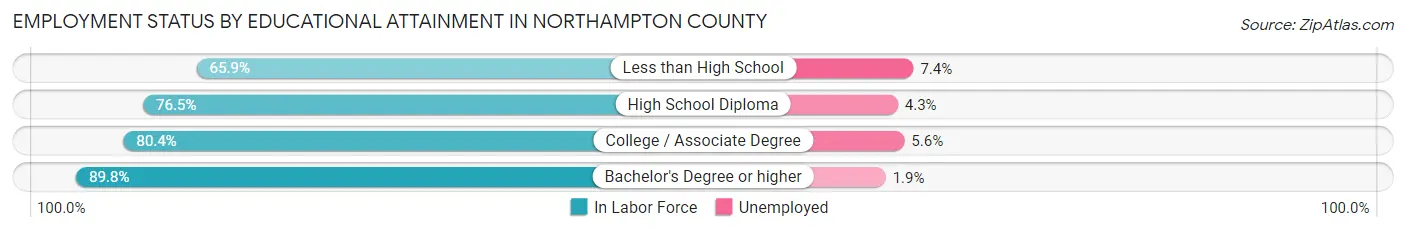
| Educational Attainment | In Labor Force | Unemployed |
| Less than High School | 6,616 (65.9%) | 743 (7.4%) |
| High School Diploma | 37,164 (76.5%) | 2,089 (4.3%) |
| College / Associate Degree | 35,522 (80.4%) | 2,474 (5.6%) |
| Bachelor's Degree or higher | 50,204 (89.8%) | 1,062 (1.9%) |
| Total | 129,506 (81.6%) | 6,190 (3.9%) |
Employment Occupations by Sex in Northampton County
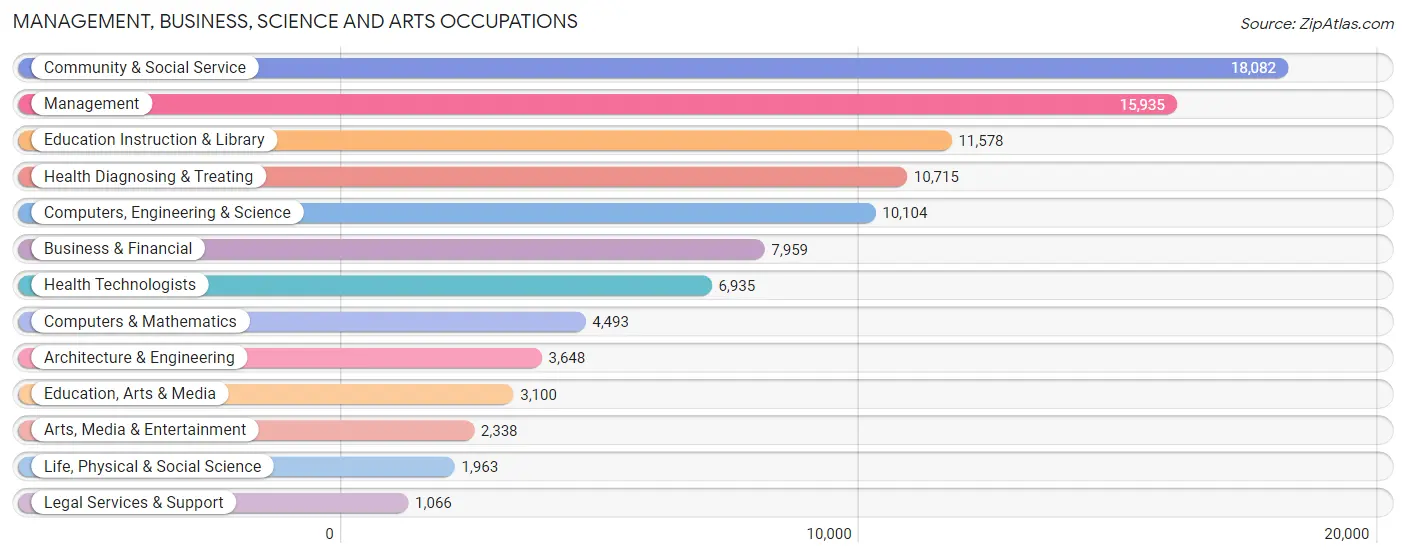
Management, Business, Science and Arts Occupations
The most common Management, Business, Science and Arts occupations in Northampton County are Community & Social Service (18,082 | 11.6%), Management (15,935 | 10.2%), Education Instruction & Library (11,578 | 7.4%), Health Diagnosing & Treating (10,715 | 6.9%), and Computers, Engineering & Science (10,104 | 6.5%).
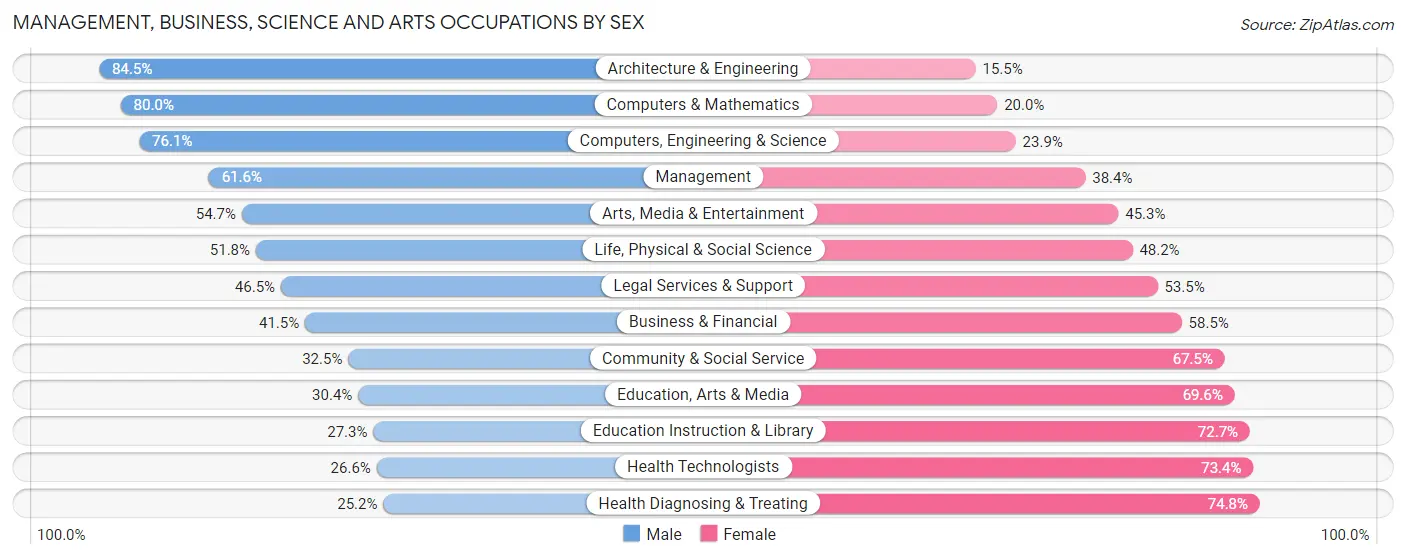
Management, Business, Science and Arts Occupations by Sex
Within the Management, Business, Science and Arts occupations in Northampton County, the most male-oriented occupations are Architecture & Engineering (84.5%), Computers & Mathematics (80.0%), and Computers, Engineering & Science (76.1%), while the most female-oriented occupations are Health Diagnosing & Treating (74.8%), Health Technologists (73.4%), and Education Instruction & Library (72.7%).
| Occupation | Male | Female |
| Management | 9,815 (61.6%) | 6,120 (38.4%) |
| Business & Financial | 3,302 (41.5%) | 4,657 (58.5%) |
| Computers, Engineering & Science | 7,691 (76.1%) | 2,413 (23.9%) |
| Computers & Mathematics | 3,593 (80.0%) | 900 (20.0%) |
| Architecture & Engineering | 3,082 (84.5%) | 566 (15.5%) |
| Life, Physical & Social Science | 1,016 (51.8%) | 947 (48.2%) |
| Community & Social Service | 5,874 (32.5%) | 12,208 (67.5%) |
| Education, Arts & Media | 943 (30.4%) | 2,157 (69.6%) |
| Legal Services & Support | 496 (46.5%) | 570 (53.5%) |
| Education Instruction & Library | 3,156 (27.3%) | 8,422 (72.7%) |
| Arts, Media & Entertainment | 1,279 (54.7%) | 1,059 (45.3%) |
| Health Diagnosing & Treating | 2,698 (25.2%) | 8,017 (74.8%) |
| Health Technologists | 1,842 (26.6%) | 5,093 (73.4%) |
| Total (Category) | 29,380 (46.8%) | 33,415 (53.2%) |
| Total (Overall) | 81,907 (52.5%) | 73,989 (47.5%) |
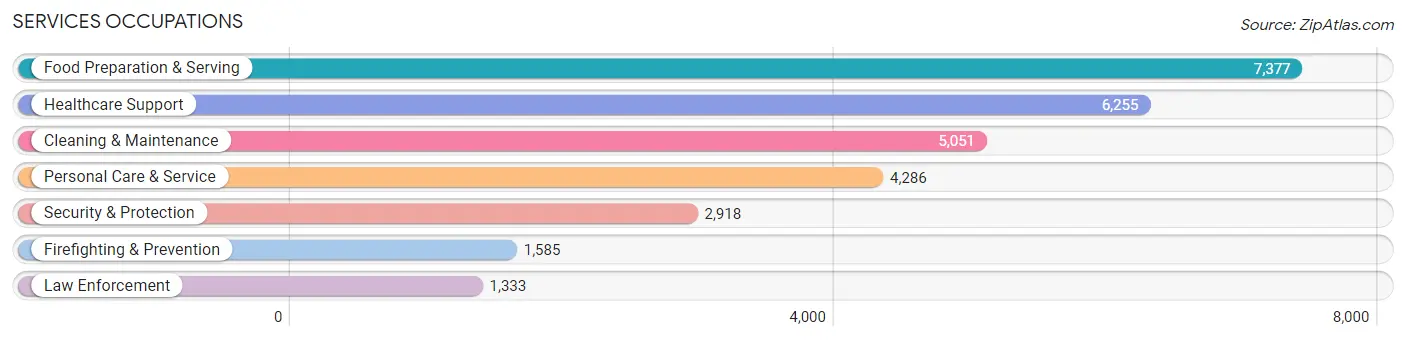
Services Occupations
The most common Services occupations in Northampton County are Food Preparation & Serving (7,377 | 4.7%), Healthcare Support (6,255 | 4.0%), Cleaning & Maintenance (5,051 | 3.2%), Personal Care & Service (4,286 | 2.8%), and Security & Protection (2,918 | 1.9%).
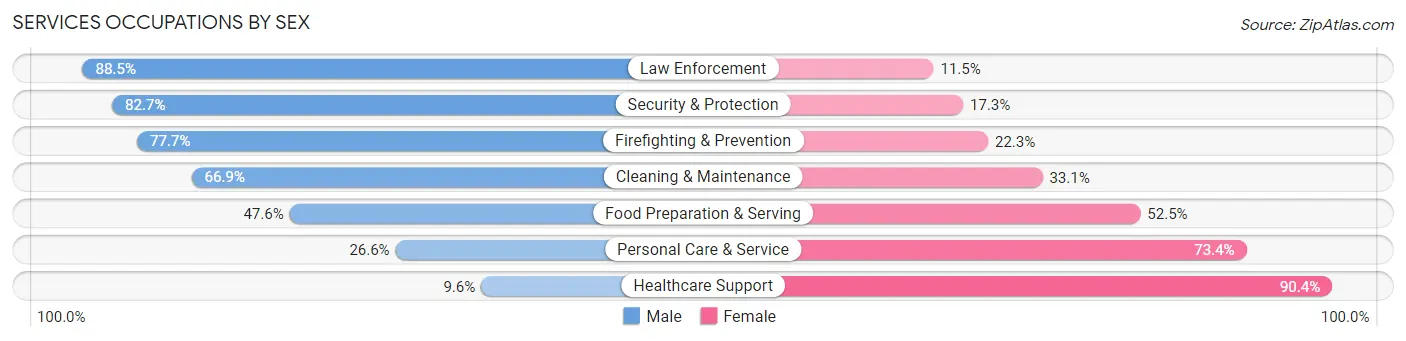
Services Occupations by Sex
Within the Services occupations in Northampton County, the most male-oriented occupations are Law Enforcement (88.5%), Security & Protection (82.7%), and Firefighting & Prevention (77.7%), while the most female-oriented occupations are Healthcare Support (90.4%), Personal Care & Service (73.4%), and Food Preparation & Serving (52.4%).
| Occupation | Male | Female |
| Healthcare Support | 602 (9.6%) | 5,653 (90.4%) |
| Security & Protection | 2,412 (82.7%) | 506 (17.3%) |
| Firefighting & Prevention | 1,232 (77.7%) | 353 (22.3%) |
| Law Enforcement | 1,180 (88.5%) | 153 (11.5%) |
| Food Preparation & Serving | 3,508 (47.5%) | 3,869 (52.4%) |
| Cleaning & Maintenance | 3,381 (66.9%) | 1,670 (33.1%) |
| Personal Care & Service | 1,139 (26.6%) | 3,147 (73.4%) |
| Total (Category) | 11,042 (42.6%) | 14,845 (57.4%) |
| Total (Overall) | 81,907 (52.5%) | 73,989 (47.5%) |
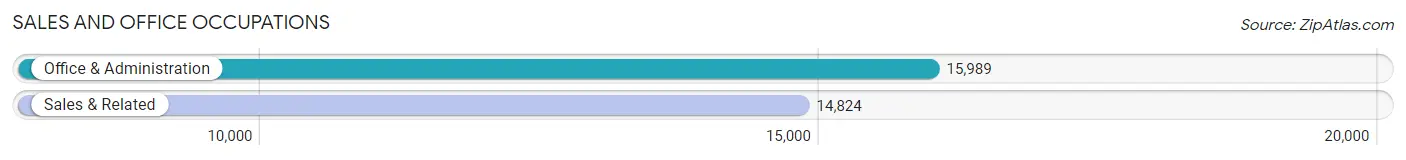
Sales and Office Occupations
The most common Sales and Office occupations in Northampton County are Office & Administration (15,989 | 10.3%), and Sales & Related (14,824 | 9.5%).
Sales and Office Occupations by Sex
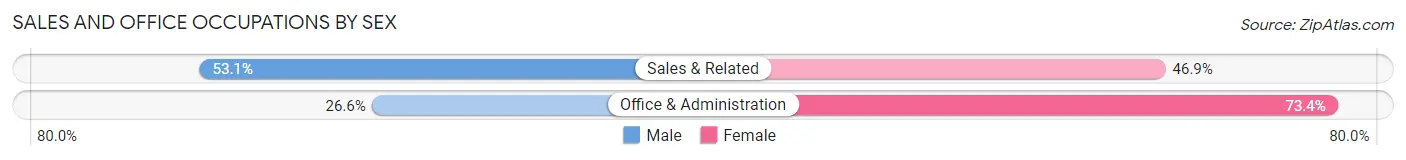
| Occupation | Male | Female |
| Sales & Related | 7,867 (53.1%) | 6,957 (46.9%) |
| Office & Administration | 4,257 (26.6%) | 11,732 (73.4%) |
| Total (Category) | 12,124 (39.4%) | 18,689 (60.7%) |
| Total (Overall) | 81,907 (52.5%) | 73,989 (47.5%) |
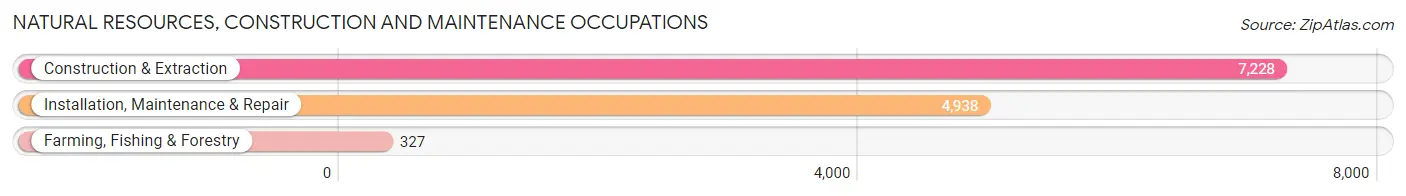
Natural Resources, Construction and Maintenance Occupations
The most common Natural Resources, Construction and Maintenance occupations in Northampton County are Construction & Extraction (7,228 | 4.6%), Installation, Maintenance & Repair (4,938 | 3.2%), and Farming, Fishing & Forestry (327 | 0.2%).
Natural Resources, Construction and Maintenance Occupations by Sex
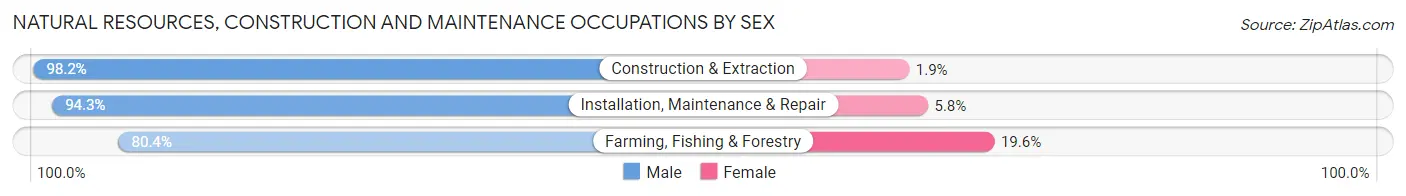
| Occupation | Male | Female |
| Farming, Fishing & Forestry | 263 (80.4%) | 64 (19.6%) |
| Construction & Extraction | 7,094 (98.2%) | 134 (1.8%) |
| Installation, Maintenance & Repair | 4,654 (94.3%) | 284 (5.8%) |
| Total (Category) | 12,011 (96.1%) | 482 (3.9%) |
| Total (Overall) | 81,907 (52.5%) | 73,989 (47.5%) |
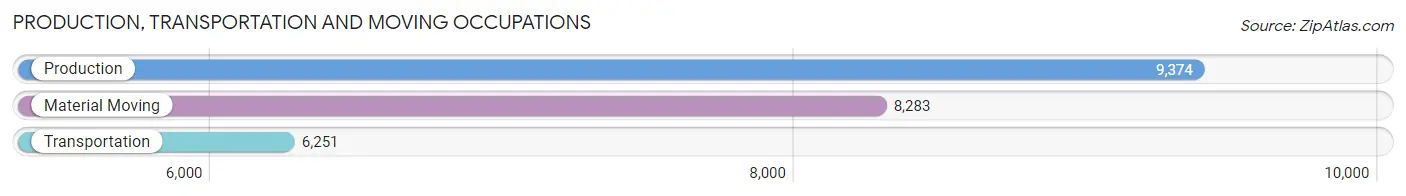
Production, Transportation and Moving Occupations
The most common Production, Transportation and Moving occupations in Northampton County are Production (9,374 | 6.0%), Material Moving (8,283 | 5.3%), and Transportation (6,251 | 4.0%).
Production, Transportation and Moving Occupations by Sex
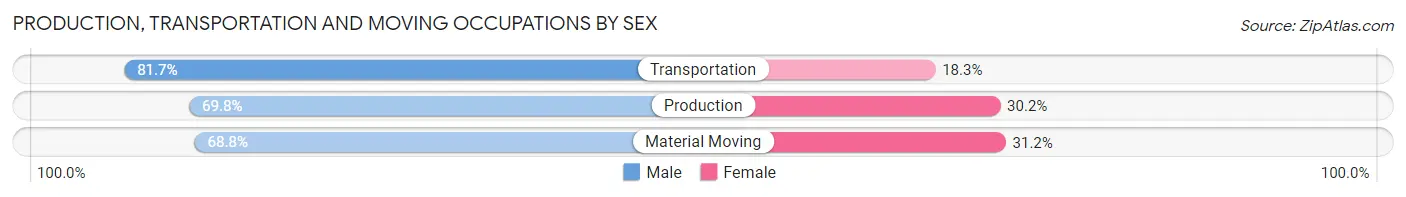
| Occupation | Male | Female |
| Production | 6,543 (69.8%) | 2,831 (30.2%) |
| Transportation | 5,108 (81.7%) | 1,143 (18.3%) |
| Material Moving | 5,699 (68.8%) | 2,584 (31.2%) |
| Total (Category) | 17,350 (72.6%) | 6,558 (27.4%) |
| Total (Overall) | 81,907 (52.5%) | 73,989 (47.5%) |
Employment Industries by Sex in Northampton County
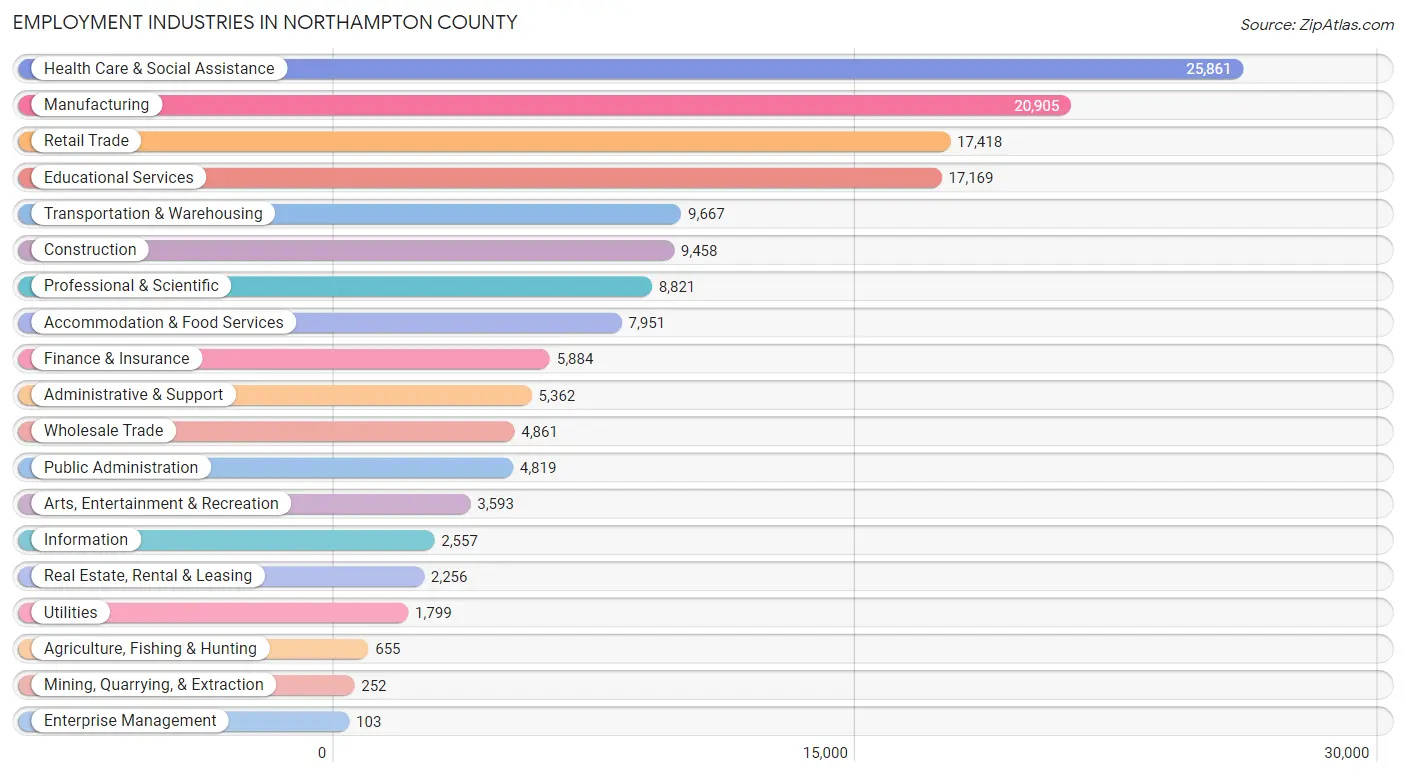
Employment Industries in Northampton County
The major employment industries in Northampton County include Health Care & Social Assistance (25,861 | 16.6%), Manufacturing (20,905 | 13.4%), Retail Trade (17,418 | 11.2%), Educational Services (17,169 | 11.0%), and Transportation & Warehousing (9,667 | 6.2%).
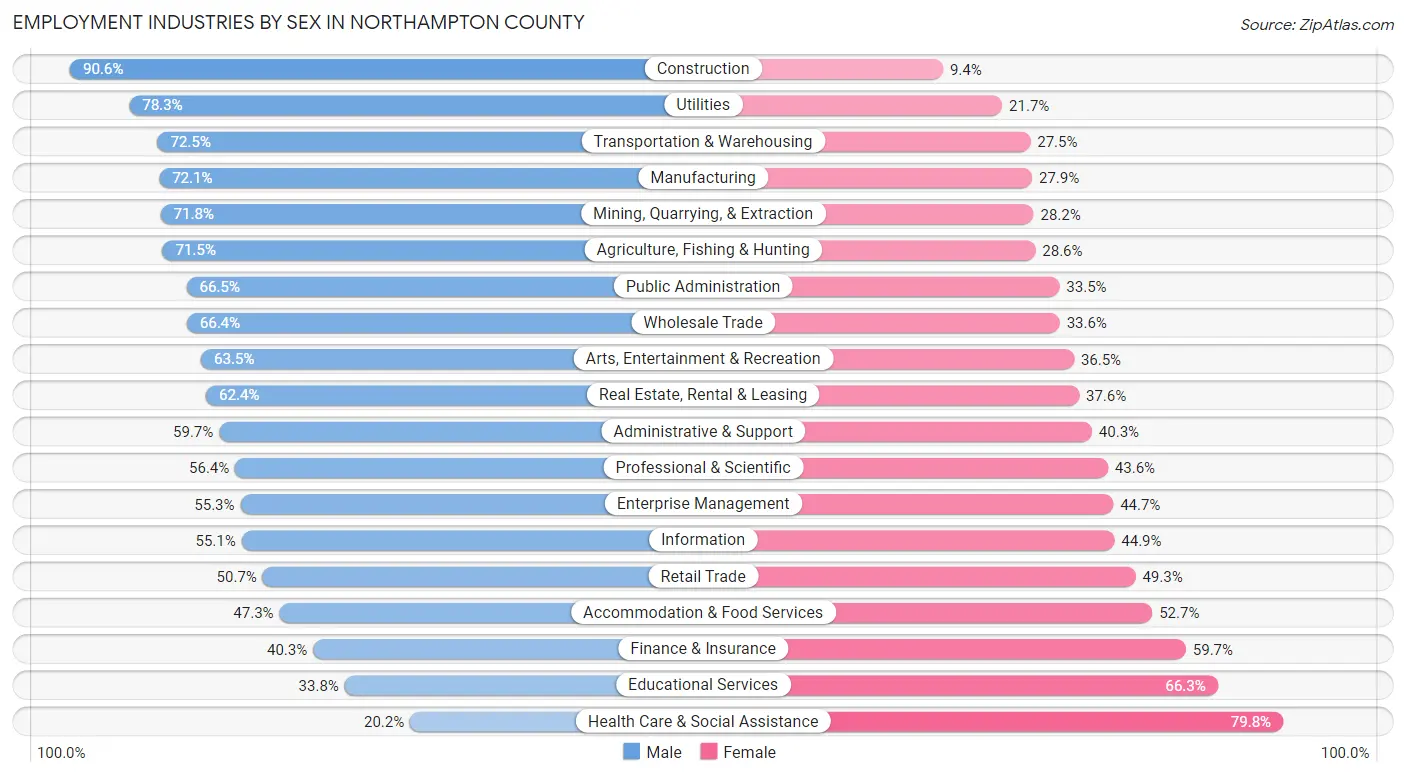
Employment Industries by Sex in Northampton County
The Northampton County industries that see more men than women are Construction (90.6%), Utilities (78.3%), and Transportation & Warehousing (72.5%), whereas the industries that tend to have a higher number of women are Health Care & Social Assistance (79.8%), Educational Services (66.2%), and Finance & Insurance (59.7%).
| Industry | Male | Female |
| Agriculture, Fishing & Hunting | 468 (71.5%) | 187 (28.5%) |
| Mining, Quarrying, & Extraction | 181 (71.8%) | 71 (28.2%) |
| Construction | 8,567 (90.6%) | 891 (9.4%) |
| Manufacturing | 15,079 (72.1%) | 5,826 (27.9%) |
| Wholesale Trade | 3,228 (66.4%) | 1,633 (33.6%) |
| Retail Trade | 8,835 (50.7%) | 8,583 (49.3%) |
| Transportation & Warehousing | 7,008 (72.5%) | 2,659 (27.5%) |
| Utilities | 1,409 (78.3%) | 390 (21.7%) |
| Information | 1,409 (55.1%) | 1,148 (44.9%) |
| Finance & Insurance | 2,371 (40.3%) | 3,513 (59.7%) |
| Real Estate, Rental & Leasing | 1,408 (62.4%) | 848 (37.6%) |
| Professional & Scientific | 4,978 (56.4%) | 3,843 (43.6%) |
| Enterprise Management | 57 (55.3%) | 46 (44.7%) |
| Administrative & Support | 3,203 (59.7%) | 2,159 (40.3%) |
| Educational Services | 5,795 (33.8%) | 11,374 (66.2%) |
| Health Care & Social Assistance | 5,229 (20.2%) | 20,632 (79.8%) |
| Arts, Entertainment & Recreation | 2,280 (63.5%) | 1,313 (36.5%) |
| Accommodation & Food Services | 3,758 (47.3%) | 4,193 (52.7%) |
| Public Administration | 3,203 (66.5%) | 1,616 (33.5%) |
| Total | 81,907 (52.5%) | 73,989 (47.5%) |
Education in Northampton County
School Enrollment in Northampton County
The most common levels of schooling among the 75,593 students in Northampton County are college / undergraduate (20,311 | 26.9%), high school (16,228 | 21.5%), and middle school (15,254 | 20.2%).
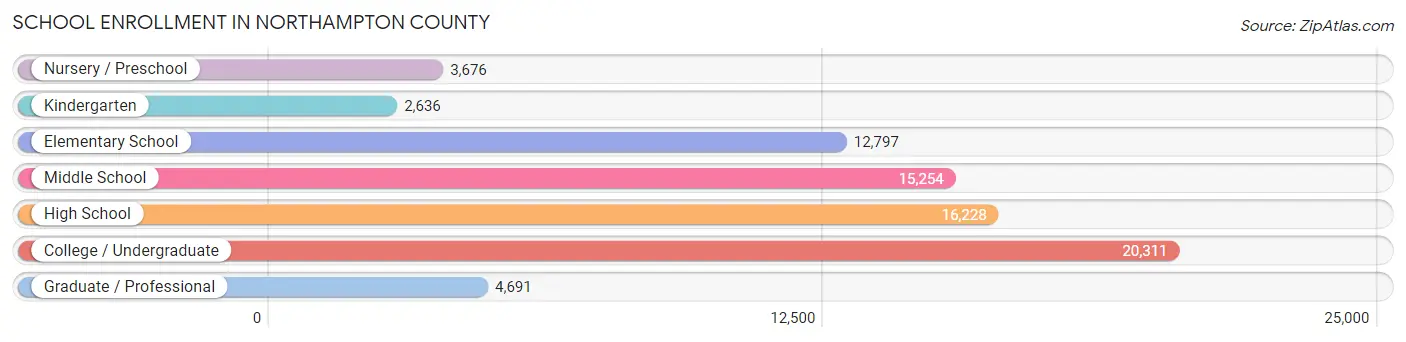
| School Level | # Students | % Students |
| Nursery / Preschool | 3,676 | 4.9% |
| Kindergarten | 2,636 | 3.5% |
| Elementary School | 12,797 | 16.9% |
| Middle School | 15,254 | 20.2% |
| High School | 16,228 | 21.5% |
| College / Undergraduate | 20,311 | 26.9% |
| Graduate / Professional | 4,691 | 6.2% |
| Total | 75,593 | 100.0% |
School Enrollment by Age by Funding Source in Northampton County
Out of a total of 75,593 students who are enrolled in schools in Northampton County, 19,957 (26.4%) attend a private institution, while the remaining 55,636 (73.6%) are enrolled in public schools. The age group of 20 to 24 year olds has the highest likelihood of being enrolled in private schools, with 5,853 (55.9% in the age bracket) enrolled. Conversely, the age group of 15 to 17 year olds has the lowest likelihood of being enrolled in a private school, with 10,723 (92.2% in the age bracket) attending a public institution.
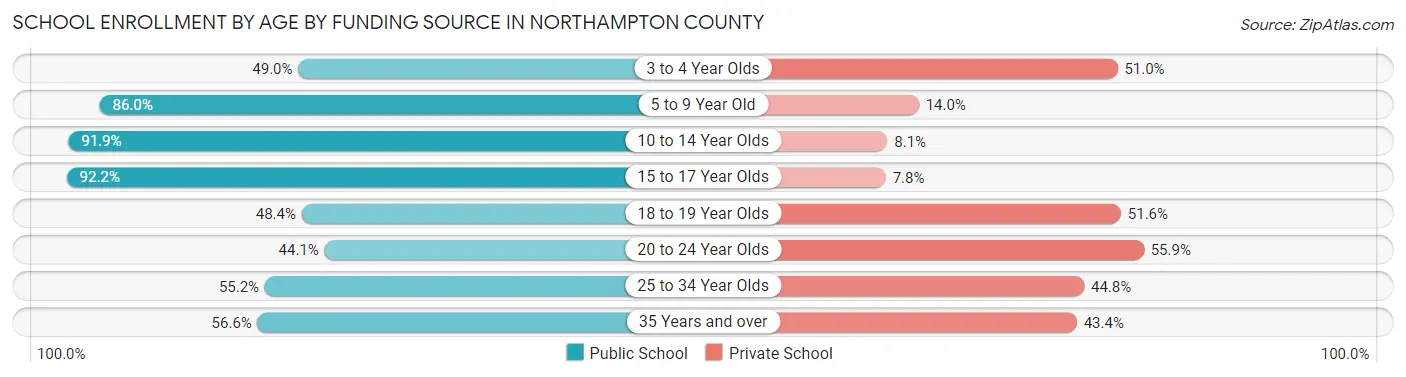
| Age Bracket | Public School | Private School |
| 3 to 4 Year Olds | 1,342 (49.0%) | 1,396 (51.0%) |
| 5 to 9 Year Old | 12,681 (86.0%) | 2,059 (14.0%) |
| 10 to 14 Year Olds | 17,544 (91.9%) | 1,554 (8.1%) |
| 15 to 17 Year Olds | 10,723 (92.2%) | 911 (7.8%) |
| 18 to 19 Year Olds | 4,545 (48.4%) | 4,852 (51.6%) |
| 20 to 24 Year Olds | 4,620 (44.1%) | 5,853 (55.9%) |
| 25 to 34 Year Olds | 2,376 (55.2%) | 1,926 (44.8%) |
| 35 Years and over | 1,817 (56.6%) | 1,394 (43.4%) |
| Total | 55,636 (73.6%) | 19,957 (26.4%) |
Educational Attainment by Field of Study in Northampton County
Business (14,942 | 19.1%), education (11,954 | 15.3%), science & technology (7,556 | 9.7%), engineering (6,434 | 8.2%), and social sciences (5,223 | 6.7%) are the most common fields of study among 78,188 individuals in Northampton County who have obtained a bachelor's degree or higher.
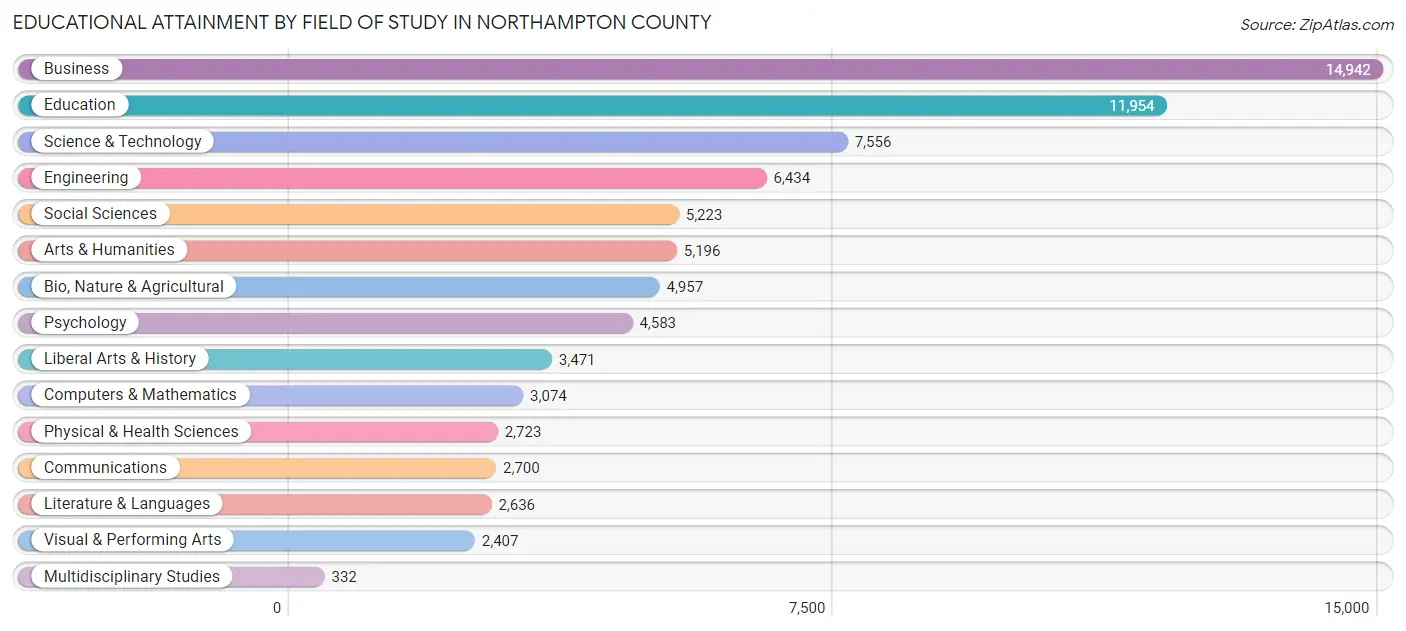
| Field of Study | # Graduates | % Graduates |
| Computers & Mathematics | 3,074 | 3.9% |
| Bio, Nature & Agricultural | 4,957 | 6.3% |
| Physical & Health Sciences | 2,723 | 3.5% |
| Psychology | 4,583 | 5.9% |
| Social Sciences | 5,223 | 6.7% |
| Engineering | 6,434 | 8.2% |
| Multidisciplinary Studies | 332 | 0.4% |
| Science & Technology | 7,556 | 9.7% |
| Business | 14,942 | 19.1% |
| Education | 11,954 | 15.3% |
| Literature & Languages | 2,636 | 3.4% |
| Liberal Arts & History | 3,471 | 4.4% |
| Visual & Performing Arts | 2,407 | 3.1% |
| Communications | 2,700 | 3.5% |
| Arts & Humanities | 5,196 | 6.7% |
| Total | 78,188 | 100.0% |
Transportation & Commute in Northampton County
Vehicle Availability by Sex in Northampton County
The most prevalent vehicle ownership categories in Northampton County are males with 2 vehicles (33,708, accounting for 42.2%) and females with 2 vehicles (29,286, making up 47.4%).
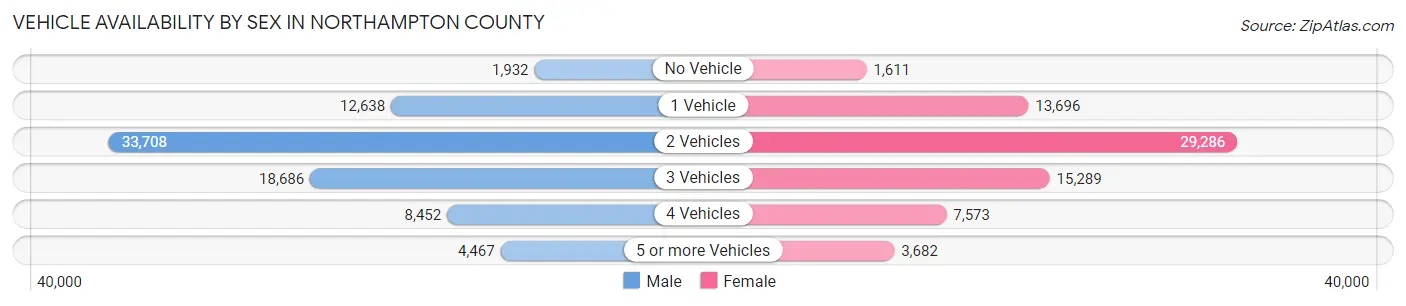
| Vehicles Available | Male | Female |
| No Vehicle | 1,932 (2.4%) | 1,611 (2.3%) |
| 1 Vehicle | 12,638 (15.8%) | 13,696 (19.3%) |
| 2 Vehicles | 33,708 (42.2%) | 29,286 (41.2%) |
| 3 Vehicles | 18,686 (23.4%) | 15,289 (21.5%) |
| 4 Vehicles | 8,452 (10.6%) | 7,573 (10.6%) |
| 5 or more Vehicles | 4,467 (5.6%) | 3,682 (5.2%) |
| Total | 79,883 (100.0%) | 71,137 (100.0%) |
Commute Time in Northampton County
The most frequently occuring commute durations in Northampton County are 20 to 24 minutes (21,503 commuters, 15.8%), 15 to 19 minutes (21,053 commuters, 15.4%), and 10 to 14 minutes (18,777 commuters, 13.8%).
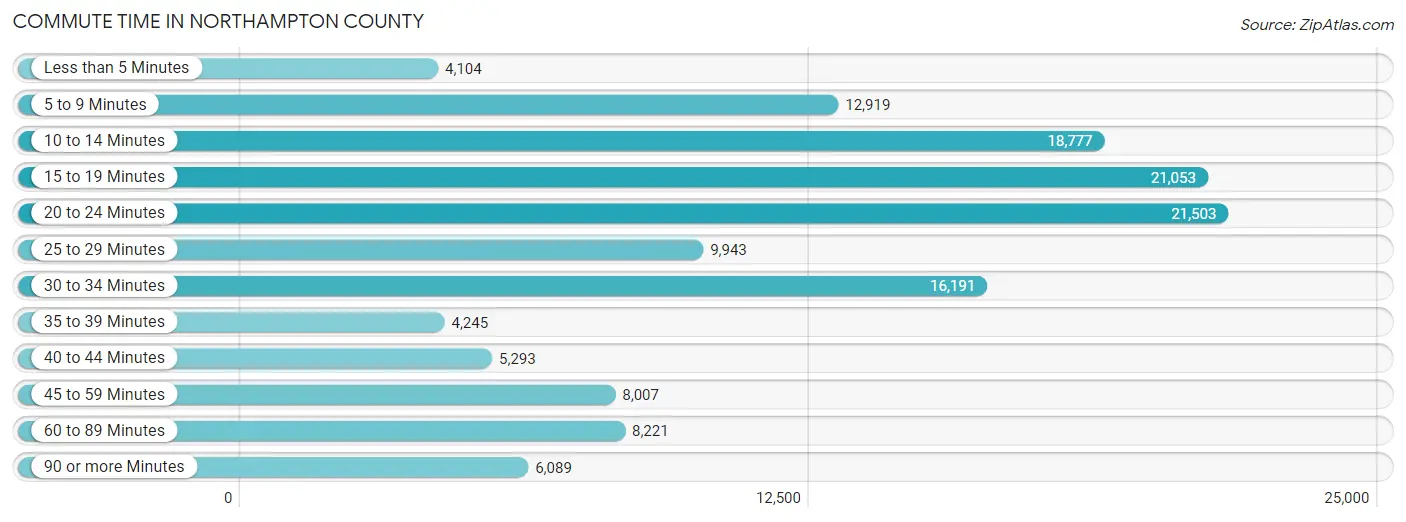
| Commute Time | # Commuters | % Commuters |
| Less than 5 Minutes | 4,104 | 3.0% |
| 5 to 9 Minutes | 12,919 | 9.5% |
| 10 to 14 Minutes | 18,777 | 13.8% |
| 15 to 19 Minutes | 21,053 | 15.4% |
| 20 to 24 Minutes | 21,503 | 15.8% |
| 25 to 29 Minutes | 9,943 | 7.3% |
| 30 to 34 Minutes | 16,191 | 11.9% |
| 35 to 39 Minutes | 4,245 | 3.1% |
| 40 to 44 Minutes | 5,293 | 3.9% |
| 45 to 59 Minutes | 8,007 | 5.9% |
| 60 to 89 Minutes | 8,221 | 6.0% |
| 90 or more Minutes | 6,089 | 4.5% |
Commute Time by Sex in Northampton County
The most common commute times in Northampton County are 15 to 19 minutes (11,032 commuters, 15.3%) for males and 20 to 24 minutes (10,558 commuters, 16.5%) for females.
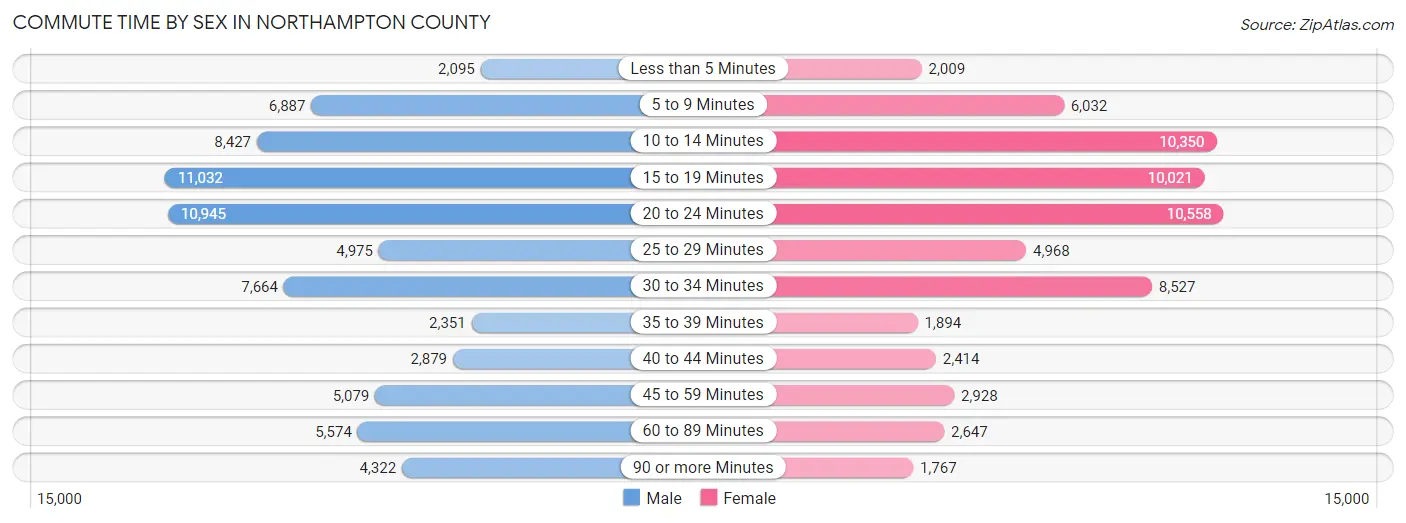
| Commute Time | Male | Female |
| Less than 5 Minutes | 2,095 (2.9%) | 2,009 (3.1%) |
| 5 to 9 Minutes | 6,887 (9.5%) | 6,032 (9.4%) |
| 10 to 14 Minutes | 8,427 (11.7%) | 10,350 (16.1%) |
| 15 to 19 Minutes | 11,032 (15.3%) | 10,021 (15.6%) |
| 20 to 24 Minutes | 10,945 (15.1%) | 10,558 (16.5%) |
| 25 to 29 Minutes | 4,975 (6.9%) | 4,968 (7.7%) |
| 30 to 34 Minutes | 7,664 (10.6%) | 8,527 (13.3%) |
| 35 to 39 Minutes | 2,351 (3.3%) | 1,894 (2.9%) |
| 40 to 44 Minutes | 2,879 (4.0%) | 2,414 (3.8%) |
| 45 to 59 Minutes | 5,079 (7.0%) | 2,928 (4.6%) |
| 60 to 89 Minutes | 5,574 (7.7%) | 2,647 (4.1%) |
| 90 or more Minutes | 4,322 (6.0%) | 1,767 (2.8%) |
Time of Departure to Work by Sex in Northampton County
The most frequent times of departure to work in Northampton County are 7:00 AM to 7:29 AM (9,876, 13.7%) for males and 7:00 AM to 7:29 AM (9,843, 15.3%) for females.
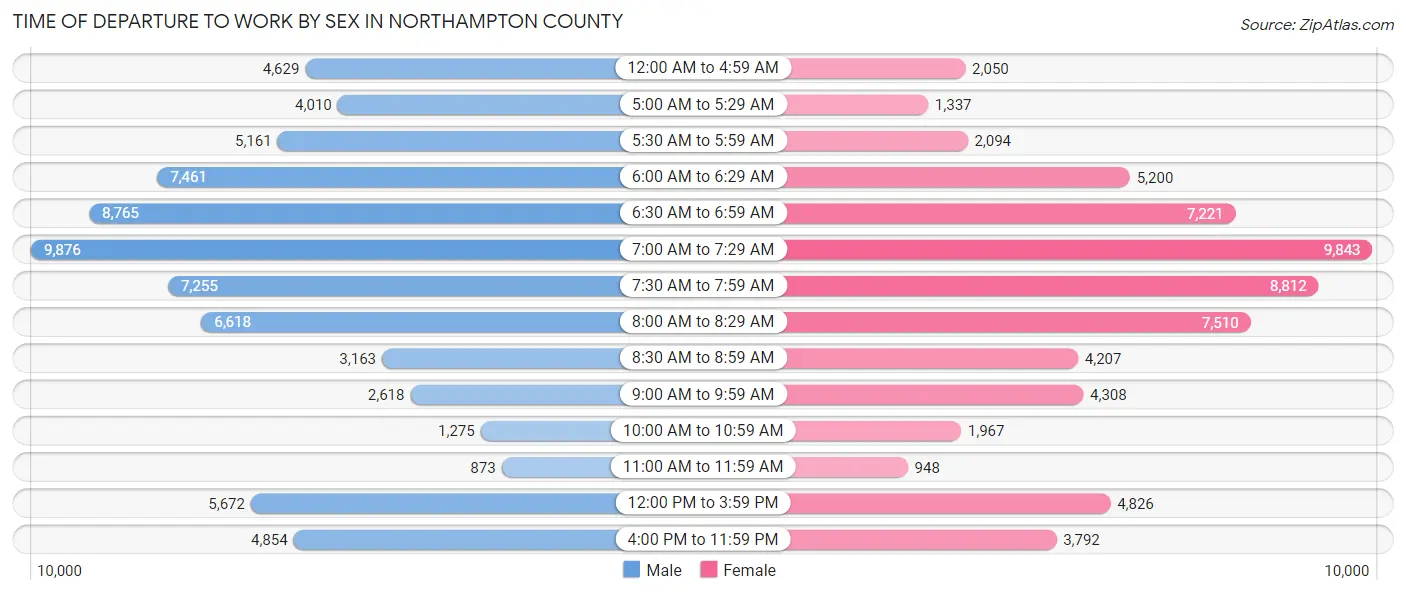
| Time of Departure | Male | Female |
| 12:00 AM to 4:59 AM | 4,629 (6.4%) | 2,050 (3.2%) |
| 5:00 AM to 5:29 AM | 4,010 (5.6%) | 1,337 (2.1%) |
| 5:30 AM to 5:59 AM | 5,161 (7.1%) | 2,094 (3.3%) |
| 6:00 AM to 6:29 AM | 7,461 (10.3%) | 5,200 (8.1%) |
| 6:30 AM to 6:59 AM | 8,765 (12.1%) | 7,221 (11.3%) |
| 7:00 AM to 7:29 AM | 9,876 (13.7%) | 9,843 (15.3%) |
| 7:30 AM to 7:59 AM | 7,255 (10.0%) | 8,812 (13.7%) |
| 8:00 AM to 8:29 AM | 6,618 (9.2%) | 7,510 (11.7%) |
| 8:30 AM to 8:59 AM | 3,163 (4.4%) | 4,207 (6.6%) |
| 9:00 AM to 9:59 AM | 2,618 (3.6%) | 4,308 (6.7%) |
| 10:00 AM to 10:59 AM | 1,275 (1.8%) | 1,967 (3.1%) |
| 11:00 AM to 11:59 AM | 873 (1.2%) | 948 (1.5%) |
| 12:00 PM to 3:59 PM | 5,672 (7.9%) | 4,826 (7.5%) |
| 4:00 PM to 11:59 PM | 4,854 (6.7%) | 3,792 (5.9%) |
| Total | 72,230 (100.0%) | 64,115 (100.0%) |
Housing Occupancy in Northampton County
Occupancy by Ownership in Northampton County
Of the total 120,384 dwellings in Northampton County, owner-occupied units account for 85,375 (70.9%), while renter-occupied units make up 35,009 (29.1%).
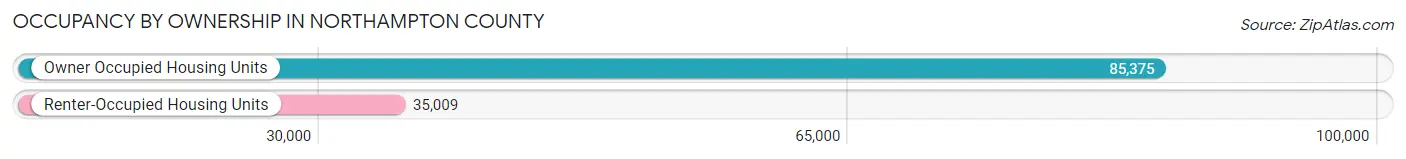
| Occupancy | # Housing Units | % Housing Units |
| Owner Occupied Housing Units | 85,375 | 70.9% |
| Renter-Occupied Housing Units | 35,009 | 29.1% |
| Total Occupied Housing Units | 120,384 | 100.0% |
Occupancy by Household Size in Northampton County
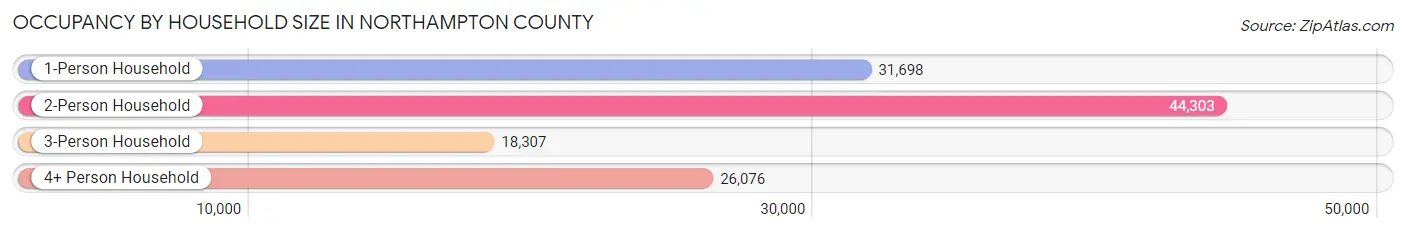
| Household Size | # Housing Units | % Housing Units |
| 1-Person Household | 31,698 | 26.3% |
| 2-Person Household | 44,303 | 36.8% |
| 3-Person Household | 18,307 | 15.2% |
| 4+ Person Household | 26,076 | 21.7% |
| Total Housing Units | 120,384 | 100.0% |
Occupancy by Ownership by Household Size in Northampton County
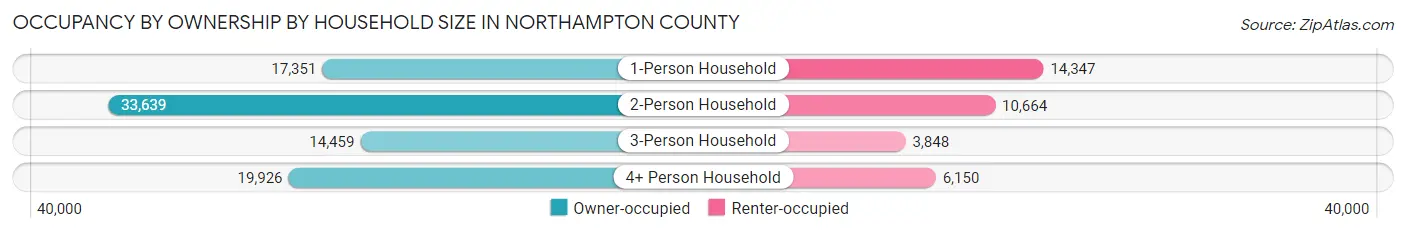
| Household Size | Owner-occupied | Renter-occupied |
| 1-Person Household | 17,351 (54.7%) | 14,347 (45.3%) |
| 2-Person Household | 33,639 (75.9%) | 10,664 (24.1%) |
| 3-Person Household | 14,459 (79.0%) | 3,848 (21.0%) |
| 4+ Person Household | 19,926 (76.4%) | 6,150 (23.6%) |
| Total Housing Units | 85,375 (70.9%) | 35,009 (29.1%) |
Occupancy by Educational Attainment in Northampton County
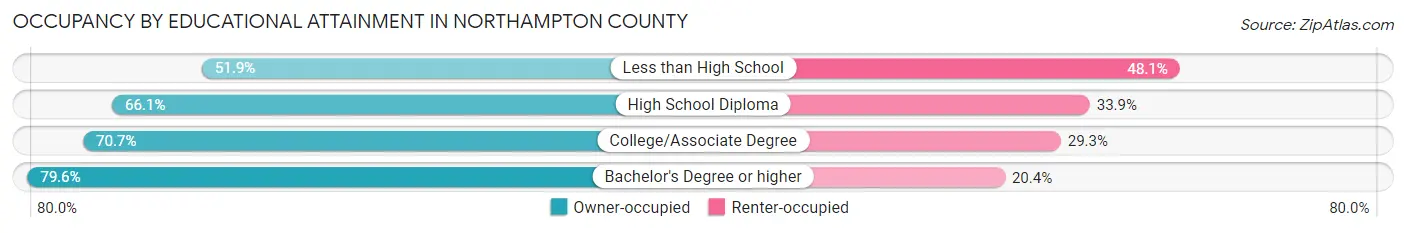
| Household Size | Owner-occupied | Renter-occupied |
| Less than High School | 4,981 (51.9%) | 4,621 (48.1%) |
| High School Diploma | 23,925 (66.1%) | 12,259 (33.9%) |
| College/Associate Degree | 23,058 (70.7%) | 9,552 (29.3%) |
| Bachelor's Degree or higher | 33,411 (79.6%) | 8,577 (20.4%) |
Occupancy by Age of Householder in Northampton County
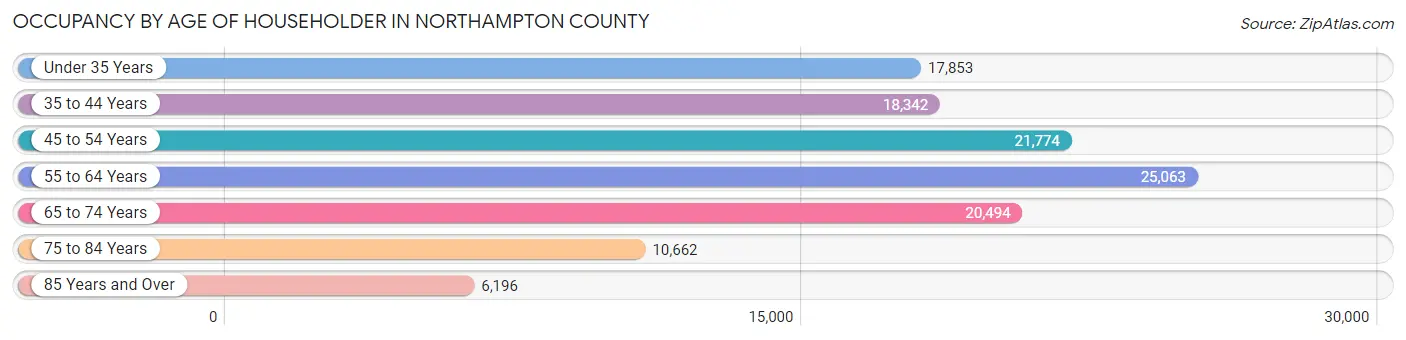
| Age Bracket | # Households | % Households |
| Under 35 Years | 17,853 | 14.8% |
| 35 to 44 Years | 18,342 | 15.2% |
| 45 to 54 Years | 21,774 | 18.1% |
| 55 to 64 Years | 25,063 | 20.8% |
| 65 to 74 Years | 20,494 | 17.0% |
| 75 to 84 Years | 10,662 | 8.9% |
| 85 Years and Over | 6,196 | 5.1% |
| Total | 120,384 | 100.0% |
Housing Finances in Northampton County
Median Income by Occupancy in Northampton County
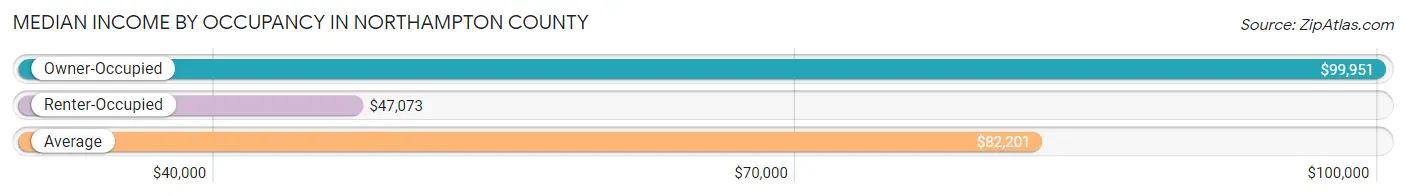
| Occupancy Type | # Households | Median Income |
| Owner-Occupied | 85,375 (70.9%) | $99,951 |
| Renter-Occupied | 35,009 (29.1%) | $47,073 |
| Average | 120,384 (100.0%) | $82,201 |
Occupancy by Householder Income Bracket in Northampton County
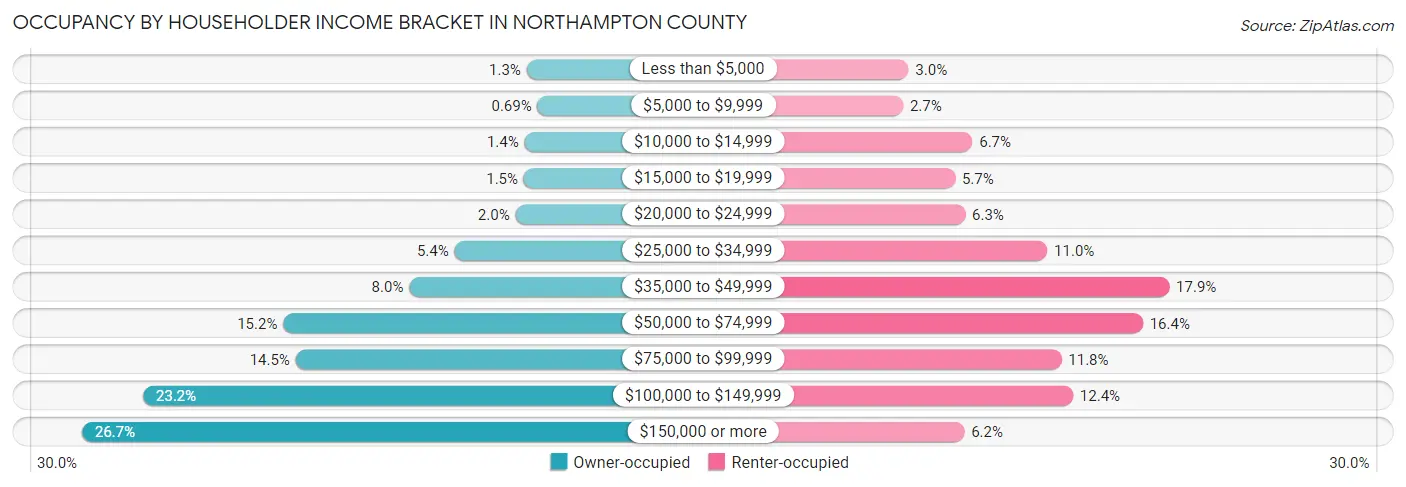
| Income Bracket | Owner-occupied | Renter-occupied |
| Less than $5,000 | 1,119 (1.3%) | 1,056 (3.0%) |
| $5,000 to $9,999 | 588 (0.7%) | 950 (2.7%) |
| $10,000 to $14,999 | 1,222 (1.4%) | 2,334 (6.7%) |
| $15,000 to $19,999 | 1,255 (1.5%) | 1,987 (5.7%) |
| $20,000 to $24,999 | 1,666 (1.9%) | 2,190 (6.3%) |
| $25,000 to $34,999 | 4,638 (5.4%) | 3,832 (11.0%) |
| $35,000 to $49,999 | 6,849 (8.0%) | 6,275 (17.9%) |
| $50,000 to $74,999 | 12,990 (15.2%) | 5,745 (16.4%) |
| $75,000 to $99,999 | 12,384 (14.5%) | 4,117 (11.8%) |
| $100,000 to $149,999 | 19,841 (23.2%) | 4,349 (12.4%) |
| $150,000 or more | 22,823 (26.7%) | 2,174 (6.2%) |
| Total | 85,375 (100.0%) | 35,009 (100.0%) |
Monthly Housing Cost Tiers in Northampton County
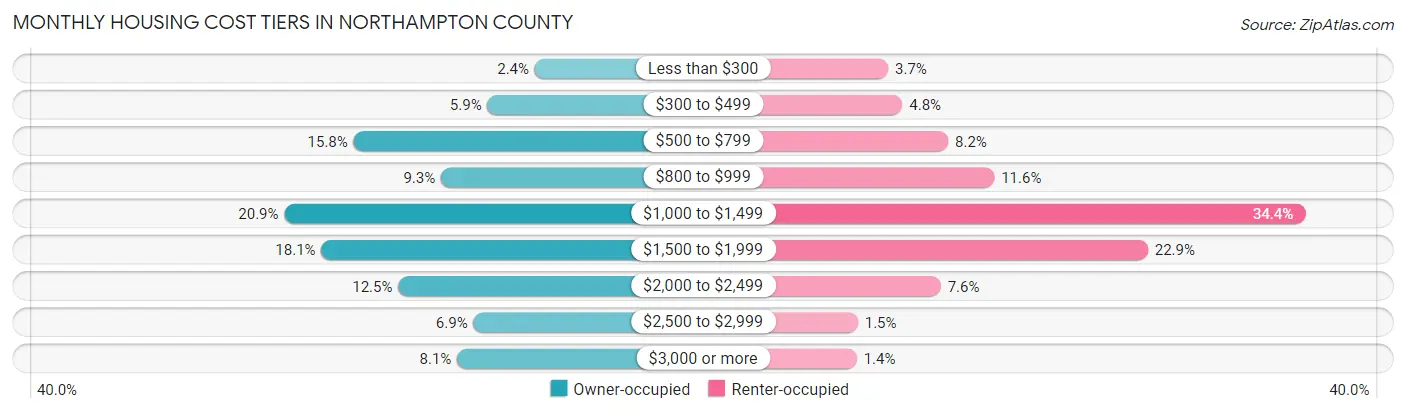
| Monthly Cost | Owner-occupied | Renter-occupied |
| Less than $300 | 2,068 (2.4%) | 1,306 (3.7%) |
| $300 to $499 | 5,043 (5.9%) | 1,675 (4.8%) |
| $500 to $799 | 13,461 (15.8%) | 2,853 (8.2%) |
| $800 to $999 | 7,967 (9.3%) | 4,045 (11.6%) |
| $1,000 to $1,499 | 17,815 (20.9%) | 12,058 (34.4%) |
| $1,500 to $1,999 | 15,491 (18.1%) | 8,002 (22.9%) |
| $2,000 to $2,499 | 10,655 (12.5%) | 2,665 (7.6%) |
| $2,500 to $2,999 | 5,925 (6.9%) | 526 (1.5%) |
| $3,000 or more | 6,950 (8.1%) | 498 (1.4%) |
| Total | 85,375 (100.0%) | 35,009 (100.0%) |
Physical Housing Characteristics in Northampton County
Housing Structures in Northampton County
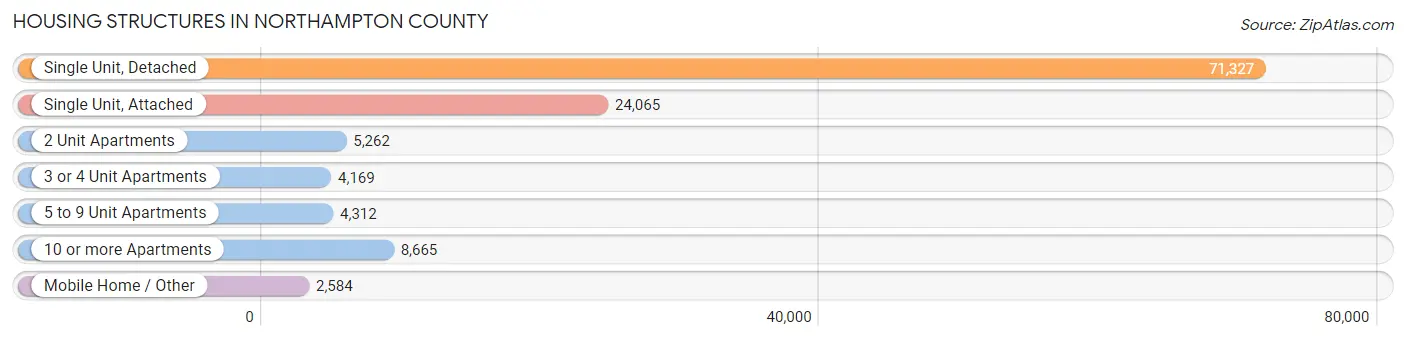
| Structure Type | # Housing Units | % Housing Units |
| Single Unit, Detached | 71,327 | 59.3% |
| Single Unit, Attached | 24,065 | 20.0% |
| 2 Unit Apartments | 5,262 | 4.4% |
| 3 or 4 Unit Apartments | 4,169 | 3.5% |
| 5 to 9 Unit Apartments | 4,312 | 3.6% |
| 10 or more Apartments | 8,665 | 7.2% |
| Mobile Home / Other | 2,584 | 2.1% |
| Total | 120,384 | 100.0% |
Housing Structures by Occupancy in Northampton County
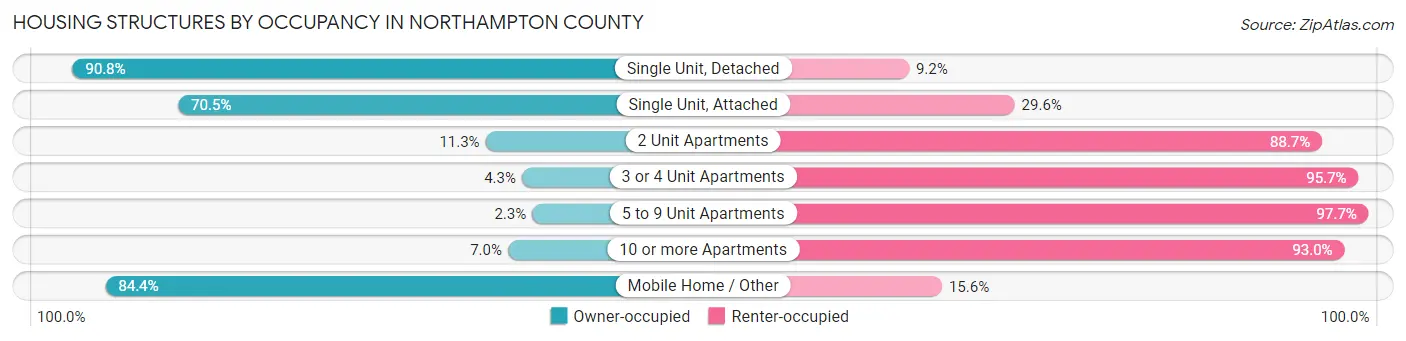
| Structure Type | Owner-occupied | Renter-occupied |
| Single Unit, Detached | 64,766 (90.8%) | 6,561 (9.2%) |
| Single Unit, Attached | 16,954 (70.5%) | 7,111 (29.5%) |
| 2 Unit Apartments | 593 (11.3%) | 4,669 (88.7%) |
| 3 or 4 Unit Apartments | 178 (4.3%) | 3,991 (95.7%) |
| 5 to 9 Unit Apartments | 99 (2.3%) | 4,213 (97.7%) |
| 10 or more Apartments | 603 (7.0%) | 8,062 (93.0%) |
| Mobile Home / Other | 2,182 (84.4%) | 402 (15.6%) |
| Total | 85,375 (70.9%) | 35,009 (29.1%) |
Housing Structures by Number of Rooms in Northampton County
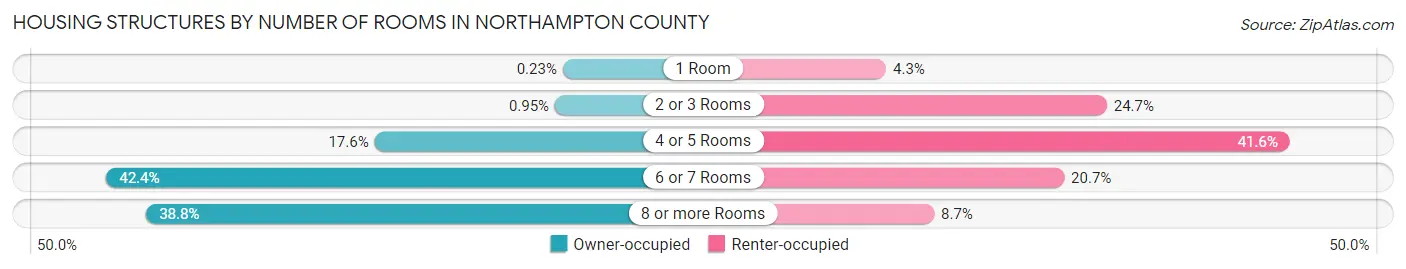
| Number of Rooms | Owner-occupied | Renter-occupied |
| 1 Room | 193 (0.2%) | 1,496 (4.3%) |
| 2 or 3 Rooms | 813 (0.9%) | 8,641 (24.7%) |
| 4 or 5 Rooms | 15,059 (17.6%) | 14,563 (41.6%) |
| 6 or 7 Rooms | 36,229 (42.4%) | 7,260 (20.7%) |
| 8 or more Rooms | 33,081 (38.8%) | 3,049 (8.7%) |
| Total | 85,375 (100.0%) | 35,009 (100.0%) |
Housing Structure by Heating Type in Northampton County
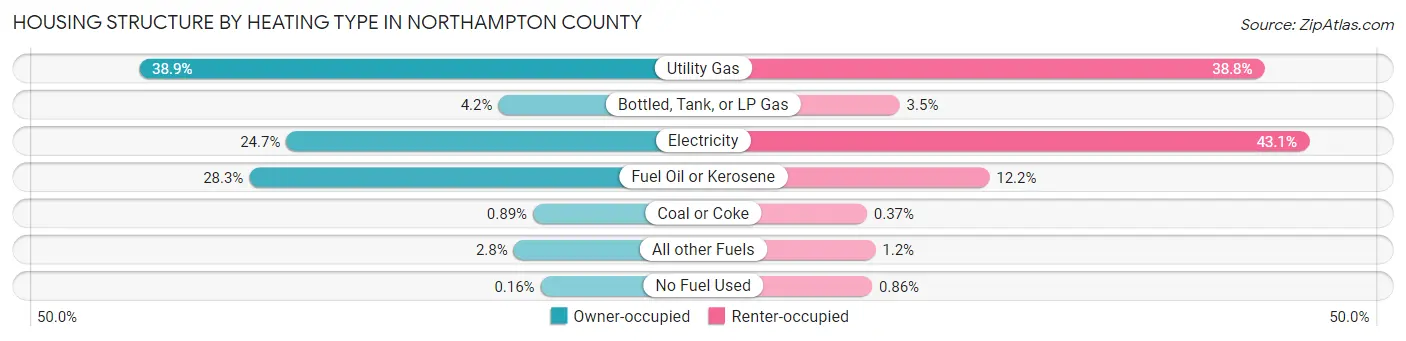
| Heating Type | Owner-occupied | Renter-occupied |
| Utility Gas | 33,234 (38.9%) | 13,574 (38.8%) |
| Bottled, Tank, or LP Gas | 3,614 (4.2%) | 1,240 (3.5%) |
| Electricity | 21,108 (24.7%) | 15,075 (43.1%) |
| Fuel Oil or Kerosene | 24,158 (28.3%) | 4,272 (12.2%) |
| Coal or Coke | 764 (0.9%) | 130 (0.4%) |
| All other Fuels | 2,360 (2.8%) | 417 (1.2%) |
| No Fuel Used | 137 (0.2%) | 301 (0.9%) |
| Total | 85,375 (100.0%) | 35,009 (100.0%) |
Household Vehicle Usage in Northampton County
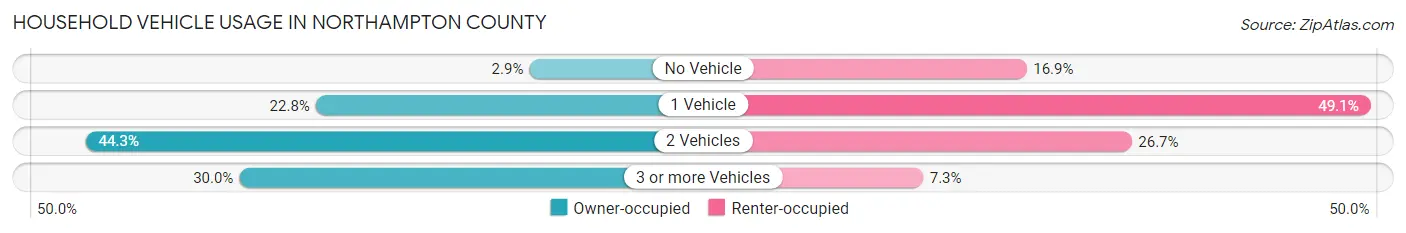
| Vehicles per Household | Owner-occupied | Renter-occupied |
| No Vehicle | 2,465 (2.9%) | 5,927 (16.9%) |
| 1 Vehicle | 19,494 (22.8%) | 17,177 (49.1%) |
| 2 Vehicles | 37,831 (44.3%) | 9,360 (26.7%) |
| 3 or more Vehicles | 25,585 (30.0%) | 2,545 (7.3%) |
| Total | 85,375 (100.0%) | 35,009 (100.0%) |
Real Estate & Mortgages in Northampton County
Real Estate and Mortgage Overview in Northampton County
| Characteristic | Without Mortgage | With Mortgage |
| Housing Units | 32,545 | 52,830 |
| Median Property Value | $245,500 | $276,800 |
| Median Household Income | $73,965 | $16,718 |
| Monthly Housing Costs | $722 | $6,797 |
| Real Estate Taxes | $4,309 | $590 |
Property Value by Mortgage Status in Northampton County
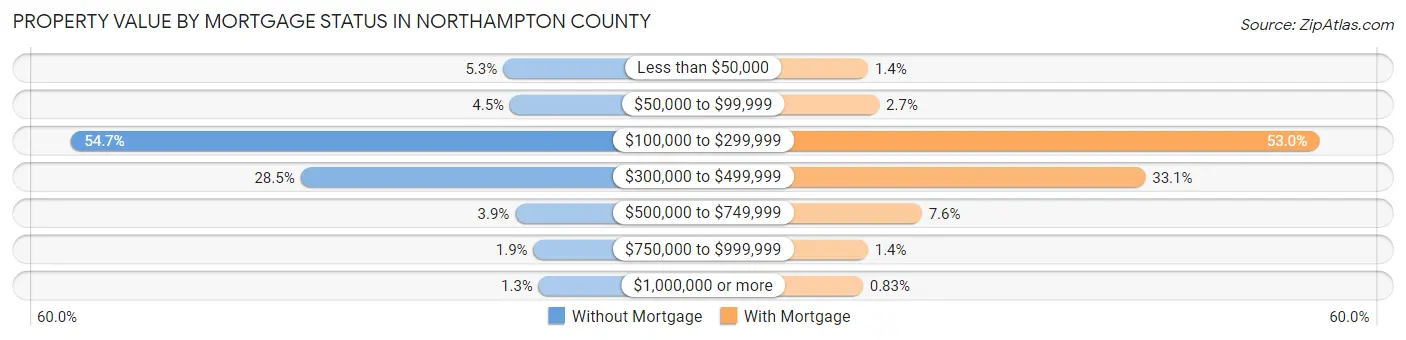
| Property Value | Without Mortgage | With Mortgage |
| Less than $50,000 | 1,733 (5.3%) | 750 (1.4%) |
| $50,000 to $99,999 | 1,474 (4.5%) | 1,428 (2.7%) |
| $100,000 to $299,999 | 17,787 (54.6%) | 27,983 (53.0%) |
| $300,000 to $499,999 | 9,264 (28.5%) | 17,493 (33.1%) |
| $500,000 to $749,999 | 1,278 (3.9%) | 3,995 (7.6%) |
| $750,000 to $999,999 | 603 (1.8%) | 742 (1.4%) |
| $1,000,000 or more | 406 (1.3%) | 439 (0.8%) |
| Total | 32,545 (100.0%) | 52,830 (100.0%) |
Household Income by Mortgage Status in Northampton County
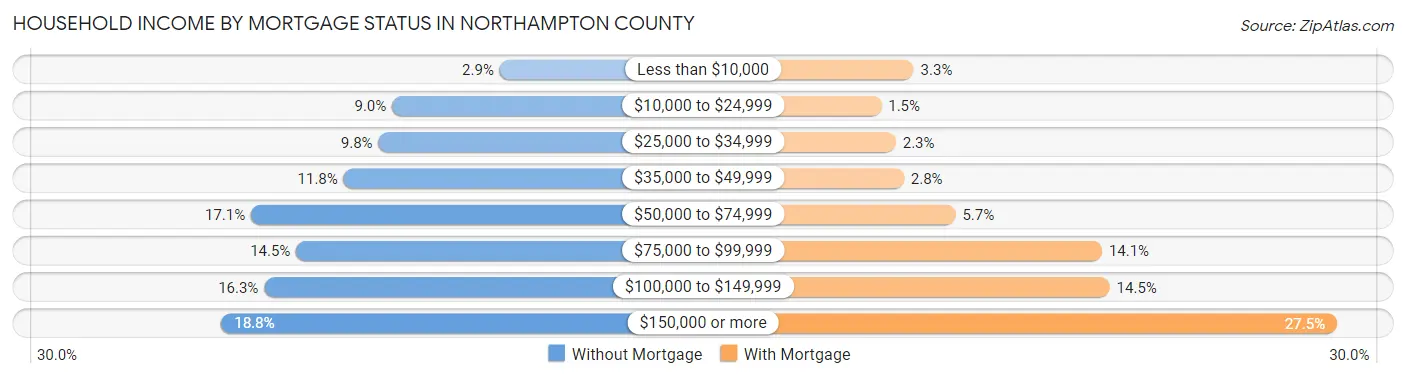
| Household Income | Without Mortgage | With Mortgage |
| Less than $10,000 | 929 (2.9%) | 1,753 (3.3%) |
| $10,000 to $24,999 | 2,930 (9.0%) | 778 (1.5%) |
| $25,000 to $34,999 | 3,182 (9.8%) | 1,213 (2.3%) |
| $35,000 to $49,999 | 3,830 (11.8%) | 1,456 (2.8%) |
| $50,000 to $74,999 | 5,551 (17.1%) | 3,019 (5.7%) |
| $75,000 to $99,999 | 4,711 (14.5%) | 7,439 (14.1%) |
| $100,000 to $149,999 | 5,307 (16.3%) | 7,673 (14.5%) |
| $150,000 or more | 6,105 (18.8%) | 14,534 (27.5%) |
| Total | 32,545 (100.0%) | 52,830 (100.0%) |
Property Value to Household Income Ratio in Northampton County
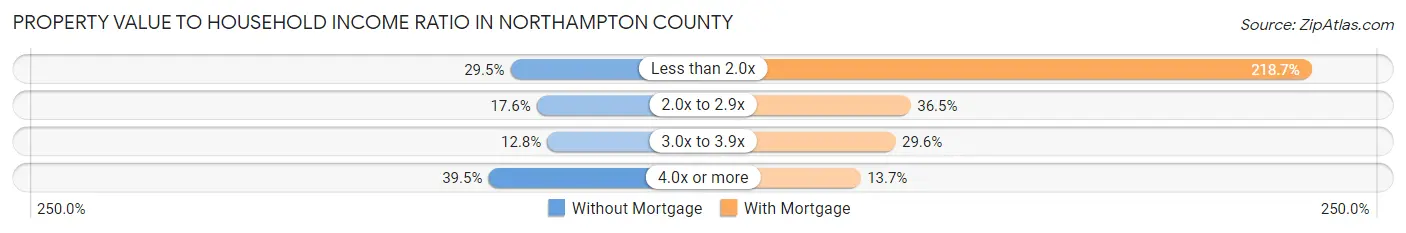
| Value-to-Income Ratio | Without Mortgage | With Mortgage |
| Less than 2.0x | 9,604 (29.5%) | 115,532 (218.7%) |
| 2.0x to 2.9x | 5,727 (17.6%) | 19,277 (36.5%) |
| 3.0x to 3.9x | 4,152 (12.8%) | 15,629 (29.6%) |
| 4.0x or more | 12,856 (39.5%) | 7,257 (13.7%) |
| Total | 32,545 (100.0%) | 52,830 (100.0%) |
Real Estate Taxes by Mortgage Status in Northampton County
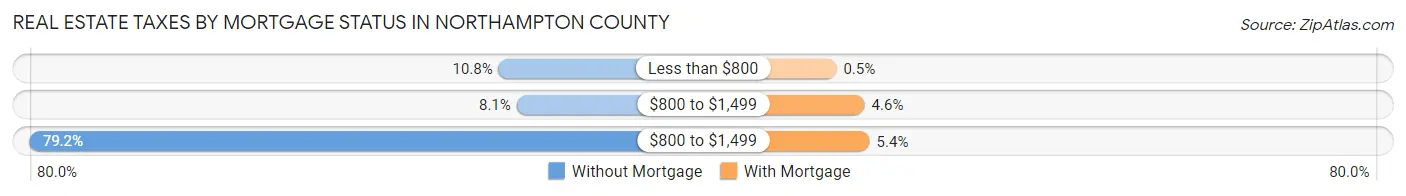
| Property Taxes | Without Mortgage | With Mortgage |
| Less than $800 | 3,500 (10.7%) | 262 (0.5%) |
| $800 to $1,499 | 2,638 (8.1%) | 2,442 (4.6%) |
| $800 to $1,499 | 25,789 (79.2%) | 2,829 (5.3%) |
| Total | 32,545 (100.0%) | 52,830 (100.0%) |
Health & Disability in Northampton County
Health Insurance Coverage by Age in Northampton County
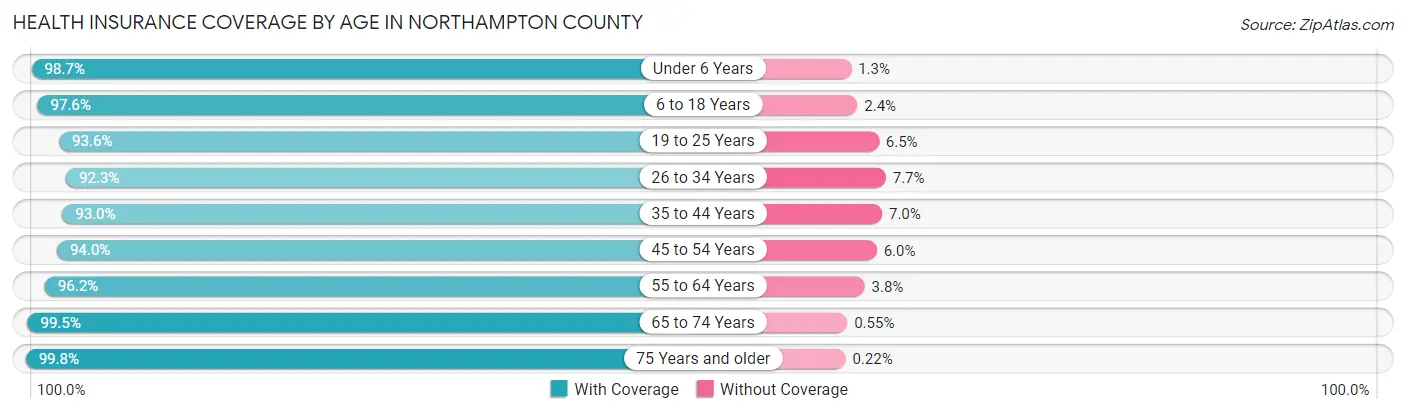
| Age Bracket | With Coverage | Without Coverage |
| Under 6 Years | 17,098 (98.7%) | 223 (1.3%) |
| 6 to 18 Years | 48,729 (97.6%) | 1,212 (2.4%) |
| 19 to 25 Years | 28,502 (93.5%) | 1,966 (6.5%) |
| 26 to 34 Years | 30,701 (92.3%) | 2,574 (7.7%) |
| 35 to 44 Years | 34,442 (93.0%) | 2,610 (7.0%) |
| 45 to 54 Years | 37,253 (94.0%) | 2,394 (6.0%) |
| 55 to 64 Years | 42,395 (96.2%) | 1,671 (3.8%) |
| 65 to 74 Years | 33,834 (99.5%) | 186 (0.5%) |
| 75 Years and older | 25,418 (99.8%) | 57 (0.2%) |
| Total | 298,372 (95.9%) | 12,893 (4.1%) |
Health Insurance Coverage by Citizenship Status in Northampton County
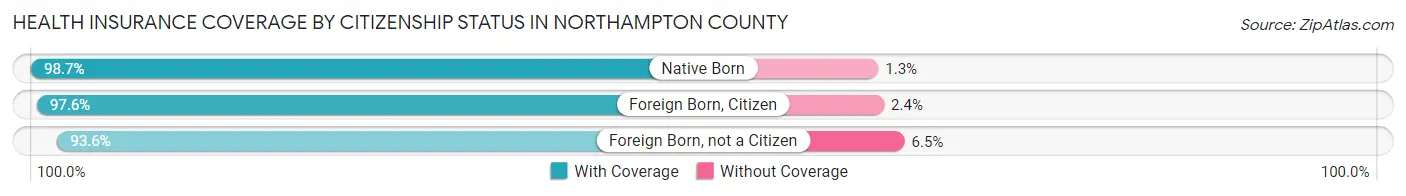
| Citizenship Status | With Coverage | Without Coverage |
| Native Born | 17,098 (98.7%) | 223 (1.3%) |
| Foreign Born, Citizen | 48,729 (97.6%) | 1,212 (2.4%) |
| Foreign Born, not a Citizen | 28,502 (93.5%) | 1,966 (6.5%) |
Health Insurance Coverage by Household Income in Northampton County
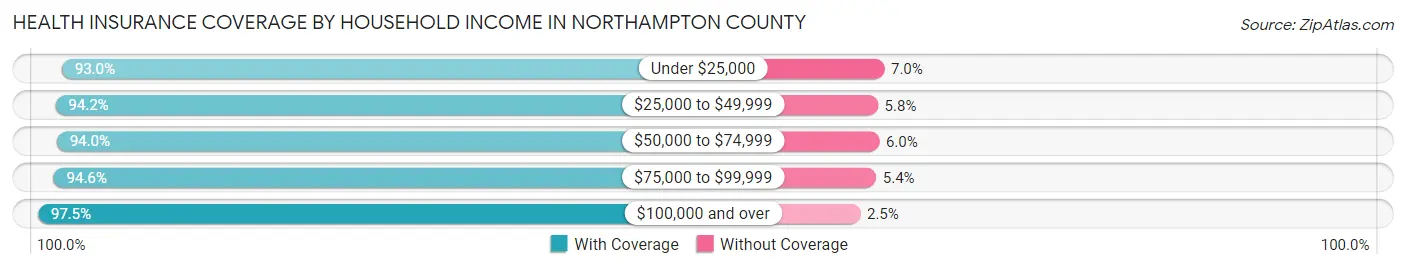
| Household Income | With Coverage | Without Coverage |
| Under $25,000 | 21,872 (93.0%) | 1,642 (7.0%) |
| $25,000 to $49,999 | 40,488 (94.2%) | 2,482 (5.8%) |
| $50,000 to $74,999 | 39,930 (94.0%) | 2,562 (6.0%) |
| $75,000 to $99,999 | 39,183 (94.6%) | 2,256 (5.4%) |
| $100,000 and over | 147,969 (97.5%) | 3,769 (2.5%) |
Public vs Private Health Insurance Coverage by Age in Northampton County
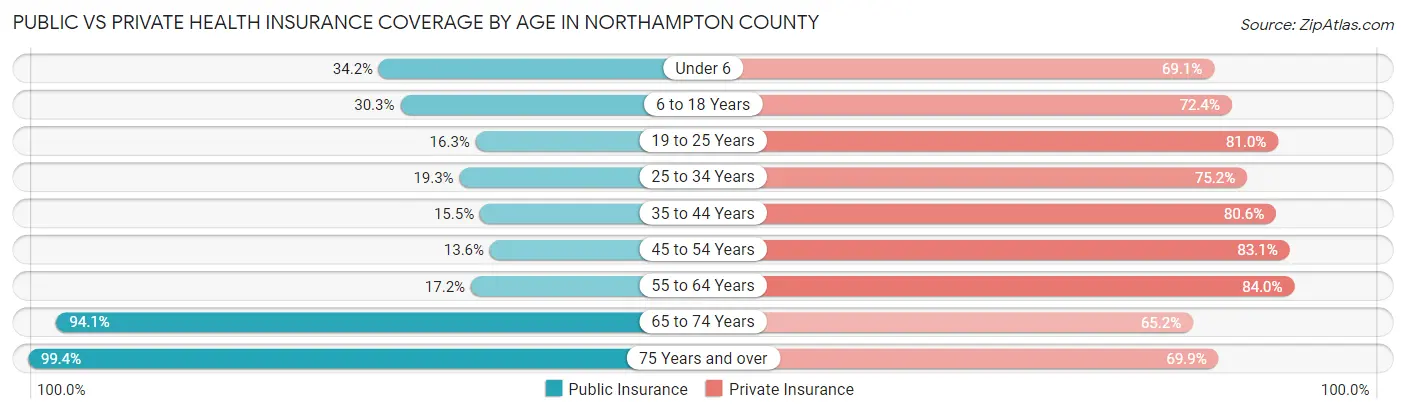
| Age Bracket | Public Insurance | Private Insurance |
| Under 6 | 5,931 (34.2%) | 11,966 (69.1%) |
| 6 to 18 Years | 15,117 (30.3%) | 36,144 (72.4%) |
| 19 to 25 Years | 4,960 (16.3%) | 24,675 (81.0%) |
| 25 to 34 Years | 6,420 (19.3%) | 25,025 (75.2%) |
| 35 to 44 Years | 5,732 (15.5%) | 29,867 (80.6%) |
| 45 to 54 Years | 5,406 (13.6%) | 32,947 (83.1%) |
| 55 to 64 Years | 7,561 (17.2%) | 37,015 (84.0%) |
| 65 to 74 Years | 32,008 (94.1%) | 22,173 (65.2%) |
| 75 Years and over | 25,321 (99.4%) | 17,814 (69.9%) |
| Total | 108,456 (34.8%) | 237,626 (76.3%) |
Disability Status by Sex by Age in Northampton County
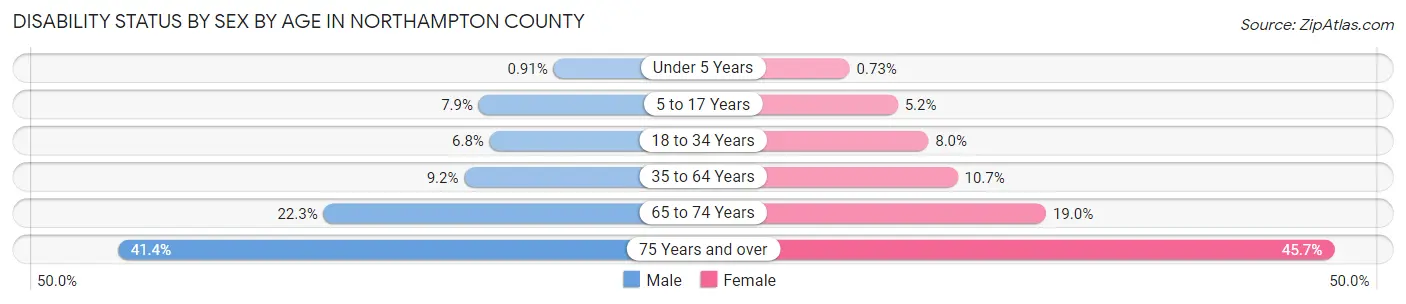
| Age Bracket | Male | Female |
| Under 5 Years | 68 (0.9%) | 53 (0.7%) |
| 5 to 17 Years | 1,879 (7.9%) | 1,173 (5.2%) |
| 18 to 34 Years | 2,475 (6.8%) | 2,690 (8.0%) |
| 35 to 64 Years | 5,531 (9.2%) | 6,505 (10.7%) |
| 65 to 74 Years | 3,608 (22.3%) | 3,376 (19.0%) |
| 75 Years and over | 4,279 (41.3%) | 6,910 (45.7%) |
Disability Class by Sex by Age in Northampton County
Disability Class: Hearing Difficulty
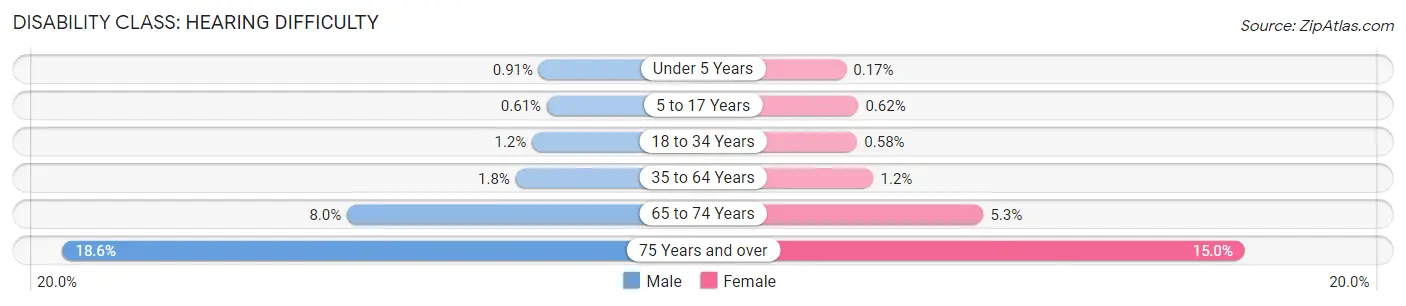
| Age Bracket | Male | Female |
| Under 5 Years | 68 (0.9%) | 12 (0.2%) |
| 5 to 17 Years | 147 (0.6%) | 141 (0.6%) |
| 18 to 34 Years | 420 (1.2%) | 196 (0.6%) |
| 35 to 64 Years | 1,063 (1.8%) | 714 (1.2%) |
| 65 to 74 Years | 1,301 (8.0%) | 937 (5.3%) |
| 75 Years and over | 1,924 (18.6%) | 2,263 (15.0%) |
Disability Class: Vision Difficulty
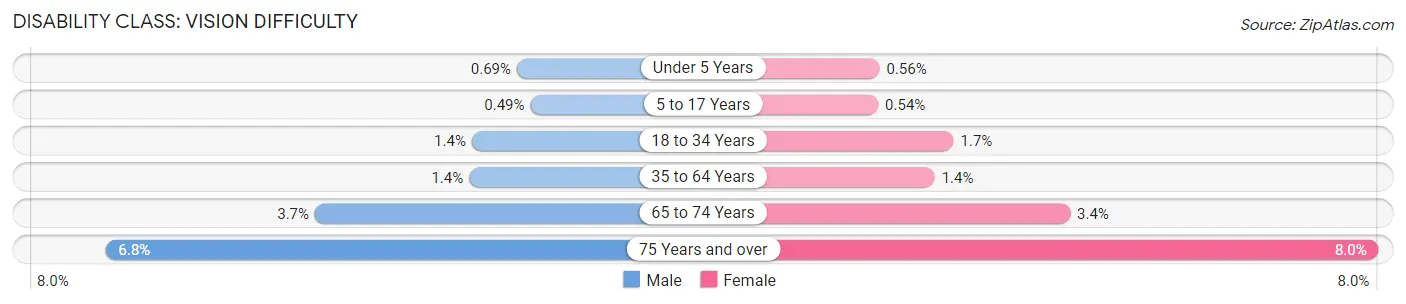
| Age Bracket | Male | Female |
| Under 5 Years | 52 (0.7%) | 41 (0.6%) |
| 5 to 17 Years | 117 (0.5%) | 122 (0.5%) |
| 18 to 34 Years | 493 (1.4%) | 555 (1.7%) |
| 35 to 64 Years | 844 (1.4%) | 834 (1.4%) |
| 65 to 74 Years | 598 (3.7%) | 603 (3.4%) |
| 75 Years and over | 704 (6.8%) | 1,205 (8.0%) |
Disability Class: Cognitive Difficulty
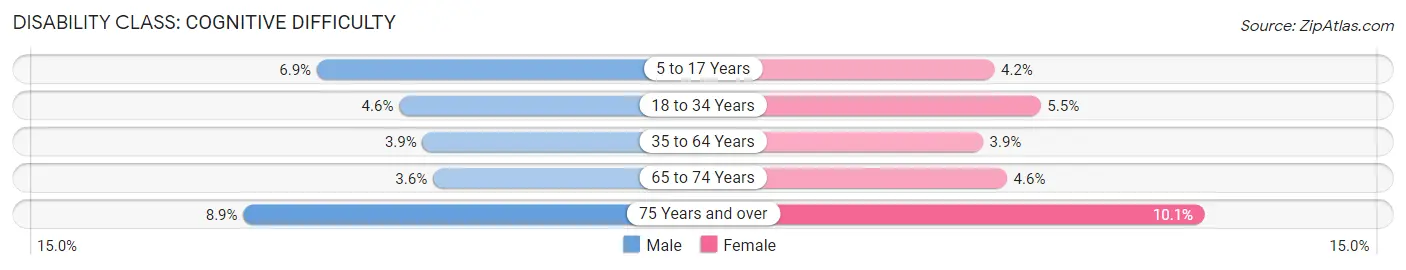
| Age Bracket | Male | Female |
| 5 to 17 Years | 1,641 (6.9%) | 960 (4.2%) |
| 18 to 34 Years | 1,654 (4.6%) | 1,852 (5.5%) |
| 35 to 64 Years | 2,359 (3.9%) | 2,373 (3.9%) |
| 65 to 74 Years | 588 (3.6%) | 818 (4.6%) |
| 75 Years and over | 922 (8.9%) | 1,529 (10.1%) |
Disability Class: Ambulatory Difficulty
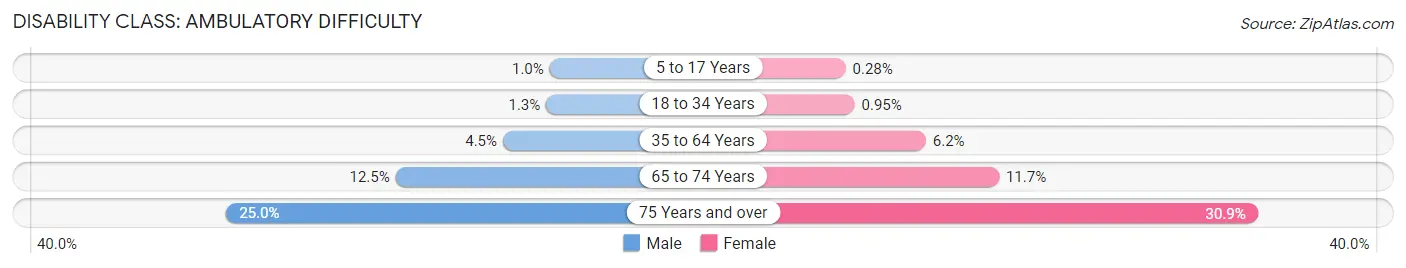
| Age Bracket | Male | Female |
| 5 to 17 Years | 243 (1.0%) | 64 (0.3%) |
| 18 to 34 Years | 462 (1.3%) | 319 (0.9%) |
| 35 to 64 Years | 2,705 (4.5%) | 3,779 (6.2%) |
| 65 to 74 Years | 2,019 (12.5%) | 2,078 (11.7%) |
| 75 Years and over | 2,590 (25.0%) | 4,670 (30.9%) |
Disability Class: Self-Care Difficulty
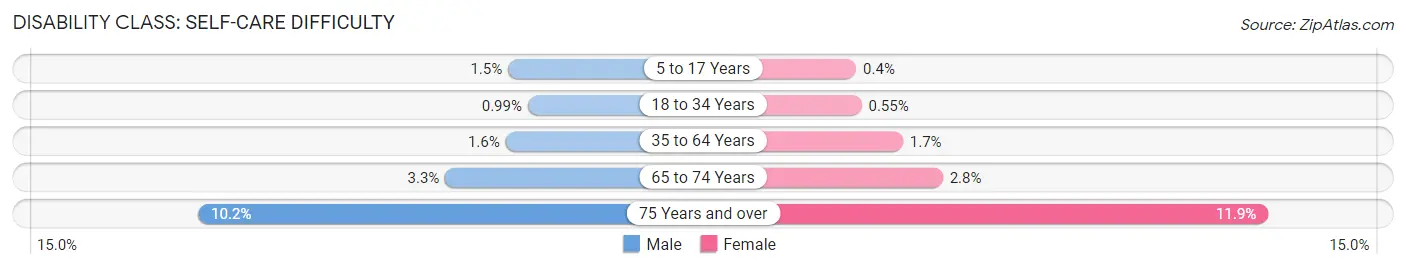
| Age Bracket | Male | Female |
| 5 to 17 Years | 368 (1.5%) | 90 (0.4%) |
| 18 to 34 Years | 359 (1.0%) | 185 (0.5%) |
| 35 to 64 Years | 971 (1.6%) | 1,029 (1.7%) |
| 65 to 74 Years | 533 (3.3%) | 500 (2.8%) |
| 75 Years and over | 1,053 (10.2%) | 1,795 (11.9%) |
Technology Access in Northampton County
Computing Device Access in Northampton County
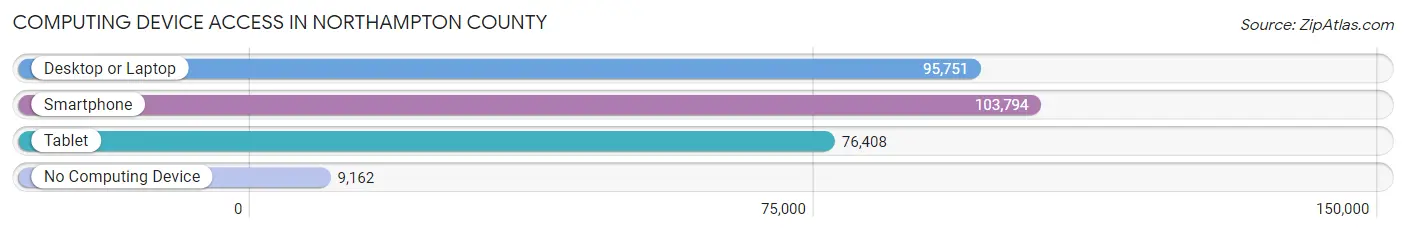
| Device Type | # Households | % Households |
| Desktop or Laptop | 95,751 | 79.5% |
| Smartphone | 103,794 | 86.2% |
| Tablet | 76,408 | 63.5% |
| No Computing Device | 9,162 | 7.6% |
| Total | 120,384 | 100.0% |
Internet Access in Northampton County
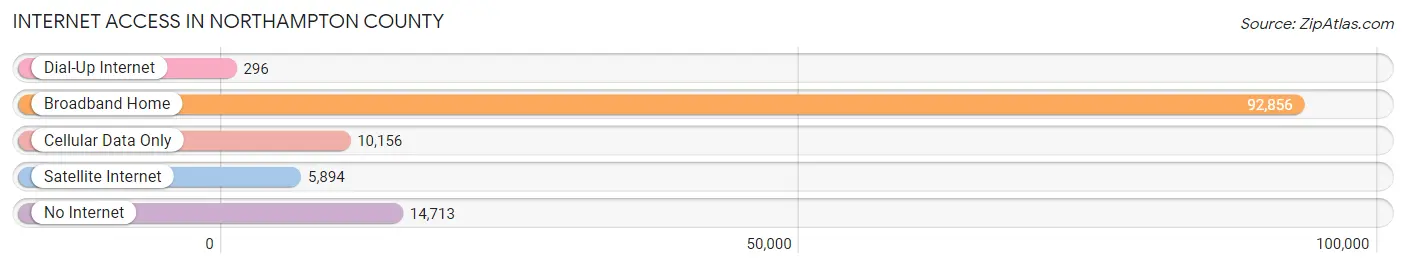
| Internet Type | # Households | % Households |
| Dial-Up Internet | 296 | 0.3% |
| Broadband Home | 92,856 | 77.1% |
| Cellular Data Only | 10,156 | 8.4% |
| Satellite Internet | 5,894 | 4.9% |
| No Internet | 14,713 | 12.2% |
| Total | 120,384 | 100.0% |
Northampton County Summary
Northampton County is located in the eastern part of Pennsylvania, in the Lehigh Valley region. It is bordered by Lehigh County to the north, Carbon County to the west, Monroe County to the east, and Warren County, New Jersey to the south. The county seat is Easton, and the county is home to a population of over 300,000 people.
Geography
Northampton County is located in the Lehigh Valley region of Pennsylvania, and is bordered by Lehigh County to the north, Carbon County to the west, Monroe County to the east, and Warren County, New Jersey to the south. The county is divided into three distinct regions: the Lehigh Valley, the Slate Belt, and the Blue Mountain. The Lehigh Valley is the most populous region of the county, and is home to the cities of Easton, Bethlehem, and Allentown. The Slate Belt is located in the northern part of the county, and is home to the towns of Bangor, Pen Argyl, and Wind Gap. The Blue Mountain region is located in the southern part of the county, and is home to the towns of Nazareth, Bath, and Hellertown.
The county is home to several rivers, including the Lehigh River, the Delaware River, and the Bushkill Creek. The Lehigh River is the largest river in the county, and is a major source of recreation and transportation. The Delaware River forms the eastern border of the county, and is a major source of water for the region. The Bushkill Creek is a tributary of the Lehigh River, and is a popular destination for fishing and canoeing.
History
Northampton County was formed in 1752, when it was separated from Bucks County. The county was named after the city of Northampton, England, and was originally part of Bucks County. The county seat was originally located in Easton, and the county was divided into three townships: Easton, Bethlehem, and Allentown.
The county was an important center of industry during the Industrial Revolution, and was home to several iron and steel mills. The Bethlehem Steel Corporation was one of the largest employers in the county, and was a major contributor to the economy. The county was also home to several coal mines, and was a major producer of coal for the region.
The county was also an important center of agriculture, and was home to several farms and orchards. The county was home to several wineries, and was a major producer of wine for the region.
Economy
Northampton County is home to a diverse economy, and is home to several major industries. The county is home to several manufacturing companies, including Crayola, Air Products, and B. Braun Medical. The county is also home to several healthcare companies, including St. Luke’s University Health Network and Lehigh Valley Health Network. The county is also home to several retail companies, including Walmart, Target, and Lowe’s.
The county is also home to several educational institutions, including Lehigh University, Lafayette College, and Northampton Community College. The county is also home to several tourist attractions, including the Crayola Factory, the National Canal Museum, and the Lehigh Valley Zoo.
Demographics
As of the 2010 census, Northampton County had a population of 297,735 people. The population was spread out, with 24.3% under the age of 18, 10.3% from 18 to 24, 28.2% from 25 to 44, 24.2% from 45 to 64, and 12.9% who were 65 years of age or older. The median age was 37.3 years.
The racial makeup of the county was 87.2% White, 6.3% African American, 0.3% Native American, 2.2% Asian, 0.1% Pacific Islander, 1.7% from other races, and 2.3% from two or more races. Hispanic or Latino of any race were 5.2% of the population.
The median income for a household in the county was $50,945, and the median income for a family was $62,917. The per capita income for the county was $25,945. About 8.2% of families and 11.2% of the population were below the poverty line, including 15.2% of those under age 18 and 7.2% of those age 65 or over.
Common Questions
What is Per Capita Income in Northampton County?
Per Capita income in Northampton County is $42,643.
What is the Median Family Income in Northampton County?
Median Family Income in Northampton County is $101,606.
What is the Median Household income in Northampton County?
Median Household Income in Northampton County is $82,201.
What is Income or Wage Gap in Northampton County?
Income or Wage Gap in Northampton County is 31.6%.
Women in Northampton County earn 68.4 cents for every dollar earned by a man.
What is Family Income Deficit in Northampton County?
Family Income Deficit in Northampton County is $10,391.
Families that are below poverty line in Northampton County earn $10,391 less on average than the poverty threshold level.
What is Inequality or Gini Index in Northampton County?
Inequality or Gini Index in Northampton County is 0.45.
What is the Total Population of Northampton County?
Total Population of Northampton County is 314,299.
What is the Total Male Population of Northampton County?
Total Male Population of Northampton County is 155,709.
What is the Total Female Population of Northampton County?
Total Female Population of Northampton County is 158,590.
What is the Ratio of Males per 100 Females in Northampton County?
There are 98.18 Males per 100 Females in Northampton County.
What is the Ratio of Females per 100 Males in Northampton County?
There are 101.85 Females per 100 Males in Northampton County.
What is the Median Population Age in Northampton County?
Median Population Age in Northampton County is 41.9 Years.
What is the Average Family Size in Northampton County
Average Family Size in Northampton County is 3.0 People.
What is the Average Household Size in Northampton County
Average Household Size in Northampton County is 2.5 People.
How Large is the Labor Force in Northampton County?
There are 163,565 People in the Labor Forcein in Northampton County.
What is the Percentage of People in the Labor Force in Northampton County?
62.7% of People are in the Labor Force in Northampton County.
What is the Unemployment Rate in Northampton County?
Unemployment Rate in Northampton County is 4.6%.