Lawrence County, PA Map & Demographics
Lawrence County Map
Lawrence County Overview
$32,319
PER CAPITA INCOME
$76,710
AVG FAMILY INCOME
$57,585
AVG HOUSEHOLD INCOME
31.2%
WAGE / INCOME GAP [ % ]
68.8¢/ $1
WAGE / INCOME GAP [ $ ]
$10,209
FAMILY INCOME DEFICIT
0.44
INEQUALITY / GINI INDEX
85,907
TOTAL POPULATION
41,879
MALE POPULATION
44,028
FEMALE POPULATION
95.12
MALES / 100 FEMALES
105.13
FEMALES / 100 MALES
45.0
MEDIAN AGE
2.9
AVG FAMILY SIZE
2.3
AVG HOUSEHOLD SIZE
41,695
LABOR FORCE [ PEOPLE ]
58.7%
PERCENT IN LABOR FORCE
6.8%
UNEMPLOYMENT RATE
Income in Lawrence County
Income Overview in Lawrence County
Per Capita Income in Lawrence County is $32,319, while median incomes of families and households are $76,710 and $57,585 respectively.
| Characteristic | Number | Measure |
| Per Capita Income | 85,907 | $32,319 |
| Median Family Income | 22,927 | $76,710 |
| Mean Family Income | 22,927 | $91,227 |
| Median Household Income | 35,933 | $57,585 |
| Mean Household Income | 35,933 | $75,513 |
| Income Deficit | 22,927 | $10,209 |
| Wage / Income Gap (%) | 85,907 | 31.21% |
| Wage / Income Gap ($) | 85,907 | 68.79¢ per $1 |
| Gini / Inequality Index | 85,907 | 0.44 |
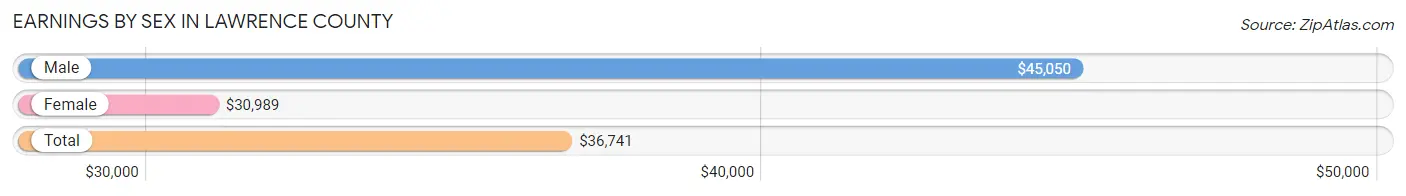
Earnings by Sex in Lawrence County
Average Earnings in Lawrence County are $36,741, $45,050 for men and $30,989 for women, a difference of 31.2%.
| Sex | Number | Average Earnings |
| Male | 22,779 (52.5%) | $45,050 |
| Female | 20,603 (47.5%) | $30,989 |
| Total | 43,382 (100.0%) | $36,741 |
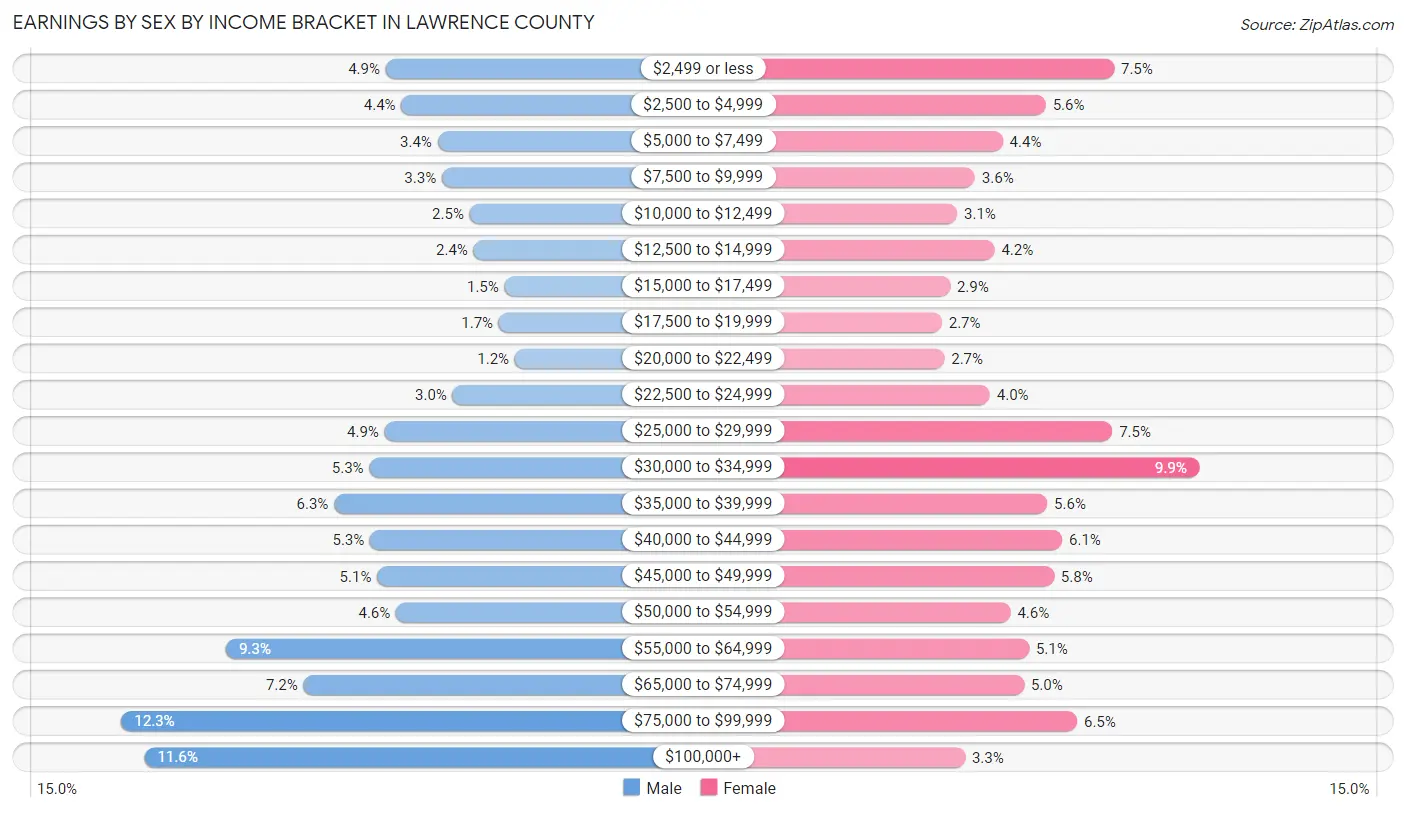
Earnings by Sex by Income Bracket in Lawrence County
The most common earnings brackets in Lawrence County are $75,000 to $99,999 for men (2,797 | 12.3%) and $30,000 to $34,999 for women (2,038 | 9.9%).
| Income | Male | Female |
| $2,499 or less | 1,105 (4.9%) | 1,548 (7.5%) |
| $2,500 to $4,999 | 1,005 (4.4%) | 1,152 (5.6%) |
| $5,000 to $7,499 | 773 (3.4%) | 902 (4.4%) |
| $7,500 to $9,999 | 745 (3.3%) | 742 (3.6%) |
| $10,000 to $12,499 | 568 (2.5%) | 638 (3.1%) |
| $12,500 to $14,999 | 542 (2.4%) | 855 (4.2%) |
| $15,000 to $17,499 | 343 (1.5%) | 598 (2.9%) |
| $17,500 to $19,999 | 380 (1.7%) | 550 (2.7%) |
| $20,000 to $22,499 | 279 (1.2%) | 565 (2.7%) |
| $22,500 to $24,999 | 676 (3.0%) | 829 (4.0%) |
| $25,000 to $29,999 | 1,111 (4.9%) | 1,538 (7.5%) |
| $30,000 to $34,999 | 1,209 (5.3%) | 2,038 (9.9%) |
| $35,000 to $39,999 | 1,434 (6.3%) | 1,159 (5.6%) |
| $40,000 to $44,999 | 1,205 (5.3%) | 1,247 (6.0%) |
| $45,000 to $49,999 | 1,159 (5.1%) | 1,200 (5.8%) |
| $50,000 to $54,999 | 1,039 (4.6%) | 947 (4.6%) |
| $55,000 to $64,999 | 2,128 (9.3%) | 1,054 (5.1%) |
| $65,000 to $74,999 | 1,632 (7.2%) | 1,026 (5.0%) |
| $75,000 to $99,999 | 2,797 (12.3%) | 1,332 (6.5%) |
| $100,000+ | 2,649 (11.6%) | 683 (3.3%) |
| Total | 22,779 (100.0%) | 20,603 (100.0%) |
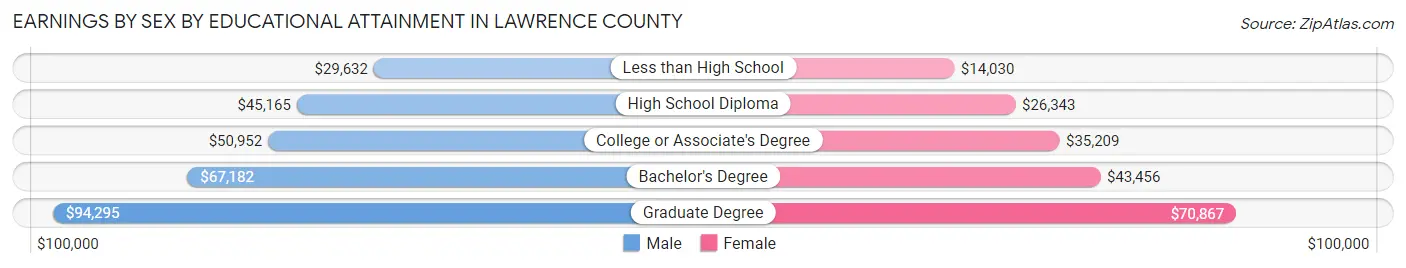
Earnings by Sex by Educational Attainment in Lawrence County
Average earnings in Lawrence County are $50,910 for men and $34,150 for women, a difference of 32.9%. Men with an educational attainment of graduate degree enjoy the highest average annual earnings of $94,295, while those with less than high school education earn the least with $29,632. Women with an educational attainment of graduate degree earn the most with the average annual earnings of $70,867, while those with less than high school education have the smallest earnings of $14,030.
| Educational Attainment | Male Income | Female Income |
| Less than High School | $29,632 | $14,030 |
| High School Diploma | $45,165 | $26,343 |
| College or Associate's Degree | $50,952 | $35,209 |
| Bachelor's Degree | $67,182 | $43,456 |
| Graduate Degree | $94,295 | $70,867 |
| Total | $50,910 | $34,150 |
Family Income in Lawrence County
Family Income Brackets in Lawrence County
According to the Lawrence County family income data, there are 4,769 families falling into the $100,000 to $149,999 income range, which is the most common income bracket and makes up 20.8% of all families. Conversely, the $10,000 to $14,999 income bracket is the least frequent group with only 321 families (1.4%) belonging to this category.
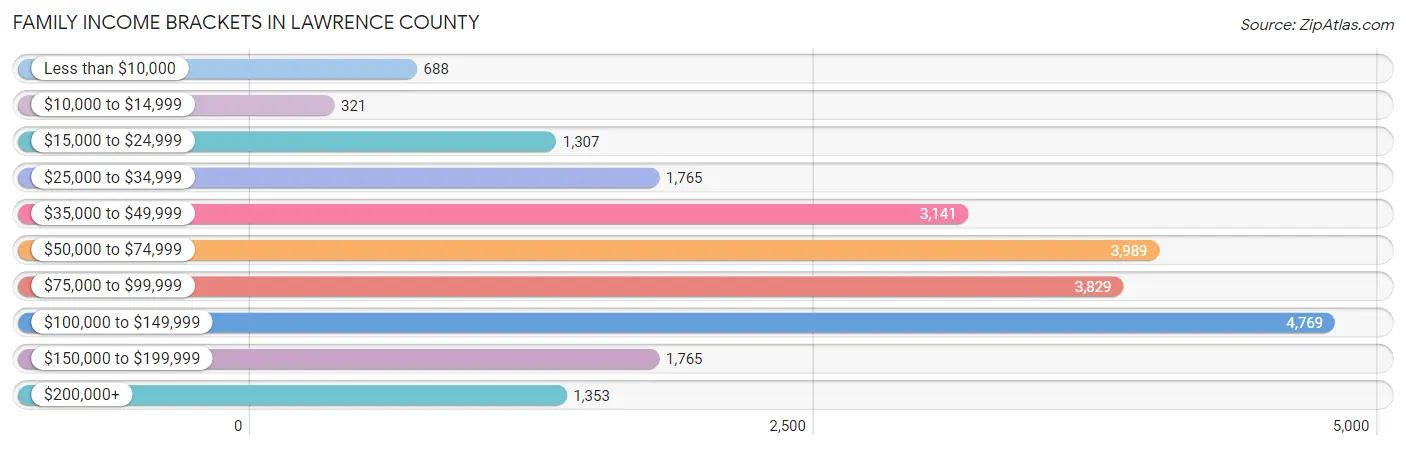
| Income Bracket | # Families | % Families |
| Less than $10,000 | 688 | 3.0% |
| $10,000 to $14,999 | 321 | 1.4% |
| $15,000 to $24,999 | 1,307 | 5.7% |
| $25,000 to $34,999 | 1,765 | 7.7% |
| $35,000 to $49,999 | 3,141 | 13.7% |
| $50,000 to $74,999 | 3,989 | 17.4% |
| $75,000 to $99,999 | 3,829 | 16.7% |
| $100,000 to $149,999 | 4,769 | 20.8% |
| $150,000 to $199,999 | 1,765 | 7.7% |
| $200,000+ | 1,353 | 5.9% |
Family Income by Famaliy Size in Lawrence County
5-person families (1,369 | 6.0%) account for the highest median family income in Lawrence County with $101,615 per family, while 2-person families (12,371 | 54.0%) have the highest median income of $31,970 per family member.
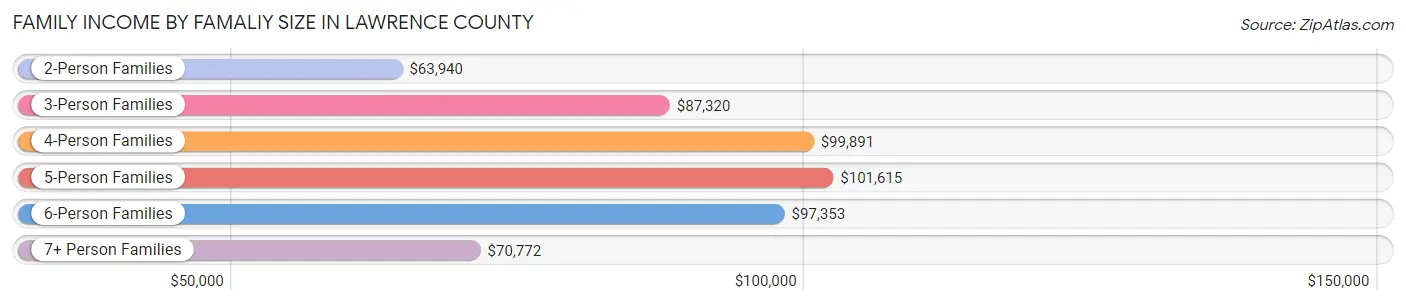
| Income Bracket | # Families | Median Income |
| 2-Person Families | 12,371 (54.0%) | $63,940 |
| 3-Person Families | 4,876 (21.3%) | $87,320 |
| 4-Person Families | 3,428 (14.9%) | $99,891 |
| 5-Person Families | 1,369 (6.0%) | $101,615 |
| 6-Person Families | 522 (2.3%) | $97,353 |
| 7+ Person Families | 361 (1.6%) | $70,772 |
| Total | 22,927 (100.0%) | $76,710 |
Family Income by Number of Earners in Lawrence County
The median family income in Lawrence County is $76,710, with families comprising 3+ earners (2,223) having the highest median family income of $140,951, while families with no earners (4,059) have the lowest median family income of $40,396, accounting for 9.7% and 17.7% of families, respectively.
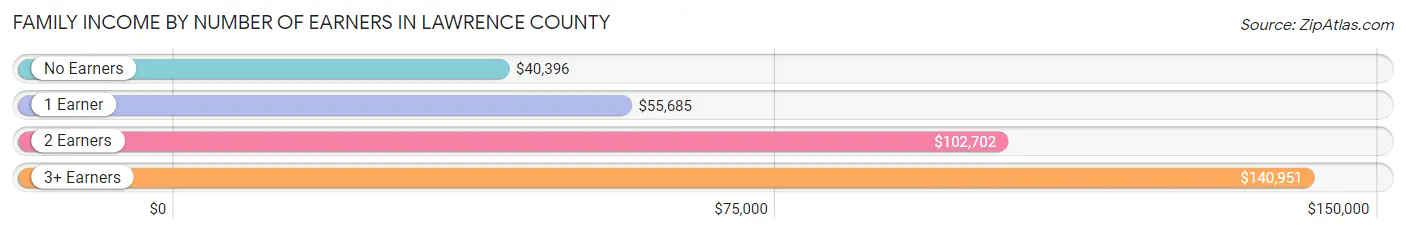
| Number of Earners | # Families | Median Income |
| No Earners | 4,059 (17.7%) | $40,396 |
| 1 Earner | 8,021 (35.0%) | $55,685 |
| 2 Earners | 8,624 (37.6%) | $102,702 |
| 3+ Earners | 2,223 (9.7%) | $140,951 |
| Total | 22,927 (100.0%) | $76,710 |
Household Income in Lawrence County
Household Income Brackets in Lawrence County
With 6,109 households falling in the category, the $50,000 to $74,999 income range is the most frequent in Lawrence County, accounting for 17.0% of all households. In contrast, only 1,473 households (4.1%) fall into the $200,000+ income bracket, making it the least populous group.
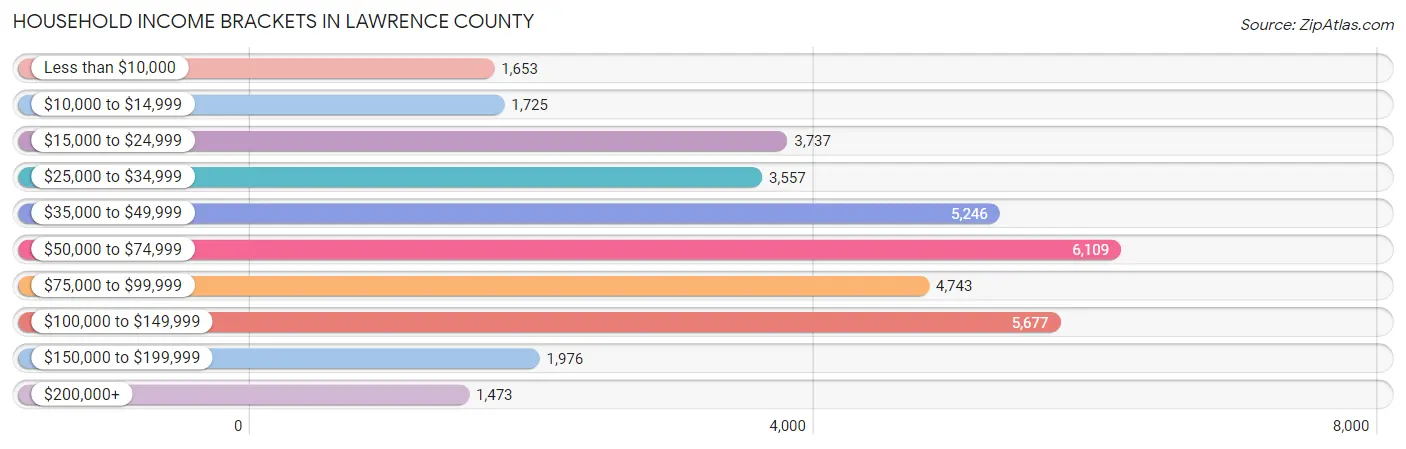
| Income Bracket | # Households | % Households |
| Less than $10,000 | 1,653 | 4.6% |
| $10,000 to $14,999 | 1,725 | 4.8% |
| $15,000 to $24,999 | 3,737 | 10.4% |
| $25,000 to $34,999 | 3,557 | 9.9% |
| $35,000 to $49,999 | 5,246 | 14.6% |
| $50,000 to $74,999 | 6,109 | 17.0% |
| $75,000 to $99,999 | 4,743 | 13.2% |
| $100,000 to $149,999 | 5,677 | 15.8% |
| $150,000 to $199,999 | 1,976 | 5.5% |
| $200,000+ | 1,473 | 4.1% |
Household Income by Householder Age in Lawrence County
The median household income in Lawrence County is $57,585, with the highest median household income of $71,380 found in the 25 to 44 years age bracket for the primary householder. A total of 9,023 households (25.1%) fall into this category. Meanwhile, the 65+ years age bracket for the primary householder has the lowest median household income of $42,369, with 12,258 households (34.1%) in this group.
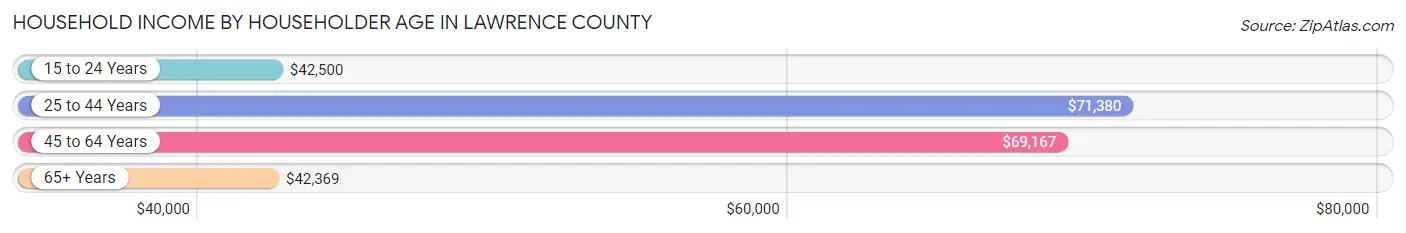
| Income Bracket | # Households | Median Income |
| 15 to 24 Years | 918 (2.5%) | $42,500 |
| 25 to 44 Years | 9,023 (25.1%) | $71,380 |
| 45 to 64 Years | 13,734 (38.2%) | $69,167 |
| 65+ Years | 12,258 (34.1%) | $42,369 |
| Total | 35,933 (100.0%) | $57,585 |
Poverty in Lawrence County
Income Below Poverty by Sex and Age in Lawrence County
With 10.6% poverty level for males and 14.0% for females among the residents of Lawrence County, 5 year old males and 5 year old females are the most vulnerable to poverty, with 113 males (35.4%) and 130 females (29.9%) in their respective age groups living below the poverty level.
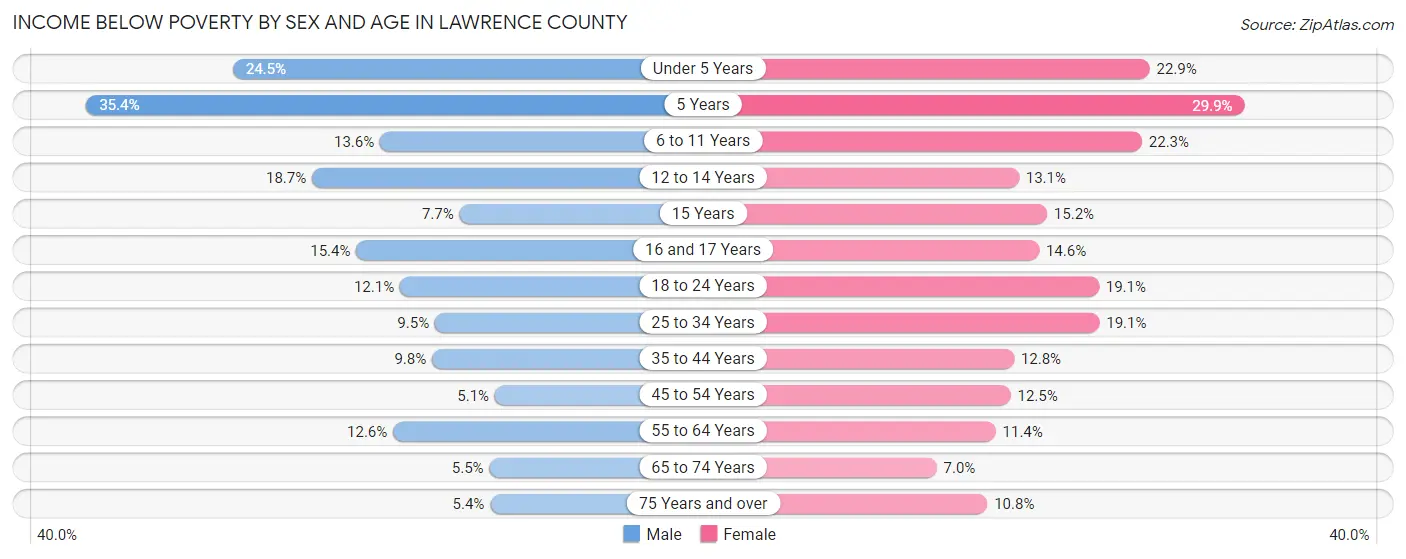
| Age Bracket | Male | Female |
| Under 5 Years | 523 (24.5%) | 472 (22.9%) |
| 5 Years | 113 (35.4%) | 130 (29.9%) |
| 6 to 11 Years | 367 (13.6%) | 614 (22.3%) |
| 12 to 14 Years | 307 (18.7%) | 187 (13.1%) |
| 15 Years | 38 (7.7%) | 69 (15.2%) |
| 16 and 17 Years | 166 (15.4%) | 165 (14.6%) |
| 18 to 24 Years | 366 (12.1%) | 579 (19.1%) |
| 25 to 34 Years | 467 (9.5%) | 866 (19.1%) |
| 35 to 44 Years | 442 (9.8%) | 601 (12.8%) |
| 45 to 54 Years | 272 (5.1%) | 660 (12.5%) |
| 55 to 64 Years | 797 (12.6%) | 756 (11.4%) |
| 65 to 74 Years | 281 (5.5%) | 406 (7.0%) |
| 75 Years and over | 169 (5.4%) | 509 (10.8%) |
| Total | 4,308 (10.6%) | 6,014 (14.0%) |
Income Above Poverty by Sex and Age in Lawrence County
According to the poverty statistics in Lawrence County, males aged 45 to 54 years and females aged 65 to 74 years are the age groups that are most secure financially, with 94.9% of males and 93.0% of females in these age groups living above the poverty line.
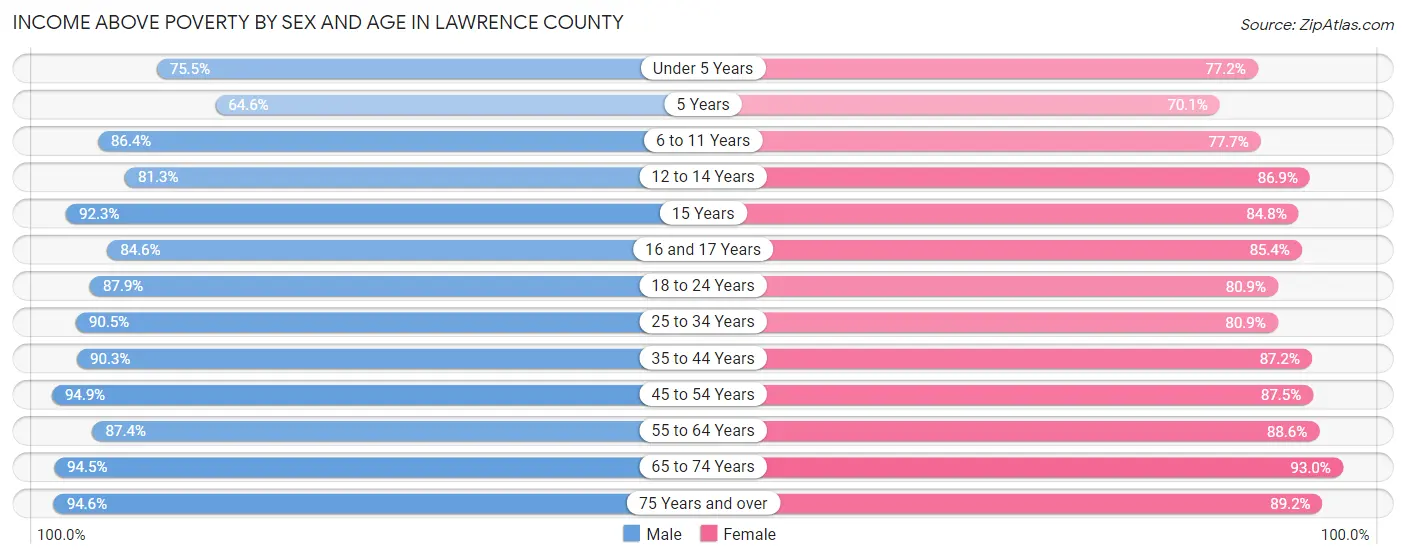
| Age Bracket | Male | Female |
| Under 5 Years | 1,608 (75.5%) | 1,594 (77.1%) |
| 5 Years | 206 (64.6%) | 305 (70.1%) |
| 6 to 11 Years | 2,329 (86.4%) | 2,142 (77.7%) |
| 12 to 14 Years | 1,338 (81.3%) | 1,236 (86.9%) |
| 15 Years | 455 (92.3%) | 384 (84.8%) |
| 16 and 17 Years | 914 (84.6%) | 962 (85.4%) |
| 18 to 24 Years | 2,651 (87.9%) | 2,456 (80.9%) |
| 25 to 34 Years | 4,432 (90.5%) | 3,664 (80.9%) |
| 35 to 44 Years | 4,093 (90.2%) | 4,101 (87.2%) |
| 45 to 54 Years | 5,086 (94.9%) | 4,606 (87.5%) |
| 55 to 64 Years | 5,507 (87.4%) | 5,865 (88.6%) |
| 65 to 74 Years | 4,841 (94.5%) | 5,361 (93.0%) |
| 75 Years and over | 2,946 (94.6%) | 4,204 (89.2%) |
| Total | 36,406 (89.4%) | 36,880 (86.0%) |
Income Below Poverty Among Married-Couple Families in Lawrence County
The poverty statistics for married-couple families in Lawrence County show that 3.2% or 525 of the total 16,629 families live below the poverty line. Families with 5 or more children have the highest poverty rate of 23.2%, comprising of 51 families. On the other hand, families with no children have the lowest poverty rate of 2.9%, which includes 324 families.
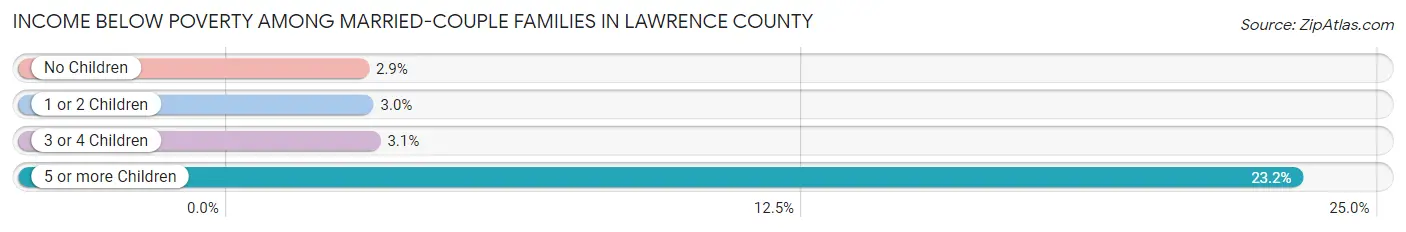
| Children | Above Poverty | Below Poverty |
| No Children | 11,041 (97.2%) | 324 (2.9%) |
| 1 or 2 Children | 3,987 (97.1%) | 121 (2.9%) |
| 3 or 4 Children | 907 (96.9%) | 29 (3.1%) |
| 5 or more Children | 169 (76.8%) | 51 (23.2%) |
| Total | 16,104 (96.8%) | 525 (3.2%) |
Income Below Poverty Among Single-Parent Households in Lawrence County
According to the poverty data in Lawrence County, 10.1% or 192 single-father households and 26.3% or 1,156 single-mother households are living below the poverty line. Among single-father households, those with 1 or 2 children have the highest poverty rate, with 148 households (16.4%) experiencing poverty. Likewise, among single-mother households, those with 5 or more children have the highest poverty rate, with 30 households (100.0%) falling below the poverty line.
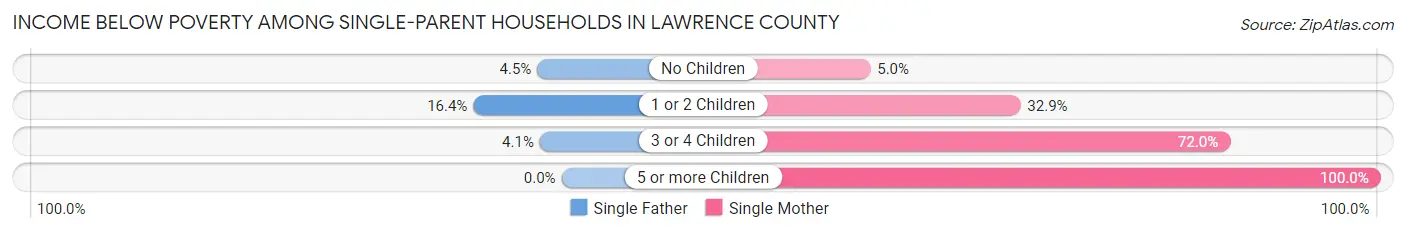
| Children | Single Father | Single Mother |
| No Children | 35 (4.5%) | 91 (5.0%) |
| 1 or 2 Children | 148 (16.4%) | 668 (32.9%) |
| 3 or 4 Children | 9 (4.1%) | 367 (72.0%) |
| 5 or more Children | 0 (0.0%) | 30 (100.0%) |
| Total | 192 (10.1%) | 1,156 (26.3%) |
Income Below Poverty Among Married-Couple vs Single-Parent Households in Lawrence County
The poverty data for Lawrence County shows that 525 of the married-couple family households (3.2%) and 1,348 of the single-parent households (21.4%) are living below the poverty level. Within the married-couple family households, those with 5 or more children have the highest poverty rate, with 51 households (23.2%) falling below the poverty line. Among the single-parent households, those with 5 or more children have the highest poverty rate, with 30 household (100.0%) living below poverty.
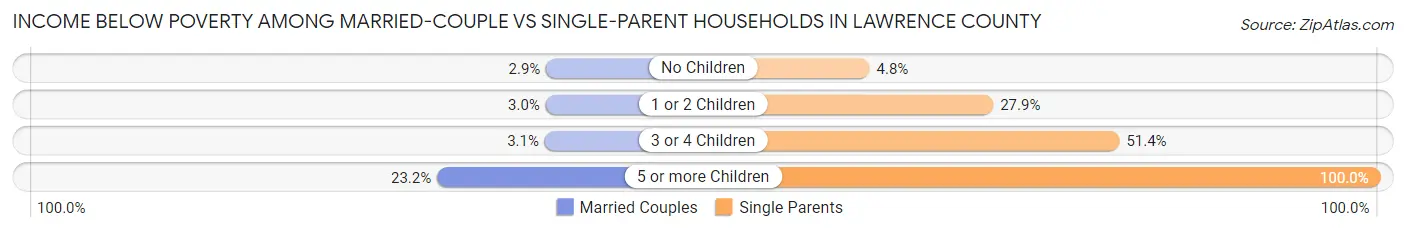
| Children | Married-Couple Families | Single-Parent Households |
| No Children | 324 (2.9%) | 126 (4.8%) |
| 1 or 2 Children | 121 (2.9%) | 816 (27.9%) |
| 3 or 4 Children | 29 (3.1%) | 376 (51.4%) |
| 5 or more Children | 51 (23.2%) | 30 (100.0%) |
| Total | 525 (3.2%) | 1,348 (21.4%) |
Race in Lawrence County
The most populous races in Lawrence County are White / Caucasian (78,443 | 91.3%), Two or more Races (3,528 | 4.1%), and Black / African American (3,324 | 3.9%).
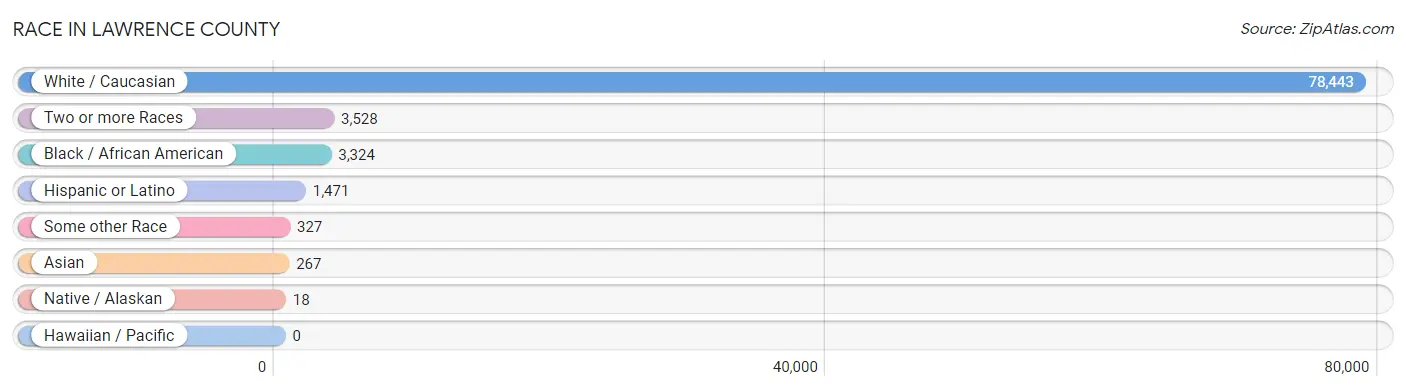
| Race | # Population | % Population |
| Asian | 267 | 0.3% |
| Black / African American | 3,324 | 3.9% |
| Hawaiian / Pacific | 0 | 0.0% |
| Hispanic or Latino | 1,471 | 1.7% |
| Native / Alaskan | 18 | 0.0% |
| White / Caucasian | 78,443 | 91.3% |
| Two or more Races | 3,528 | 4.1% |
| Some other Race | 327 | 0.4% |
| Total | 85,907 | 100.0% |
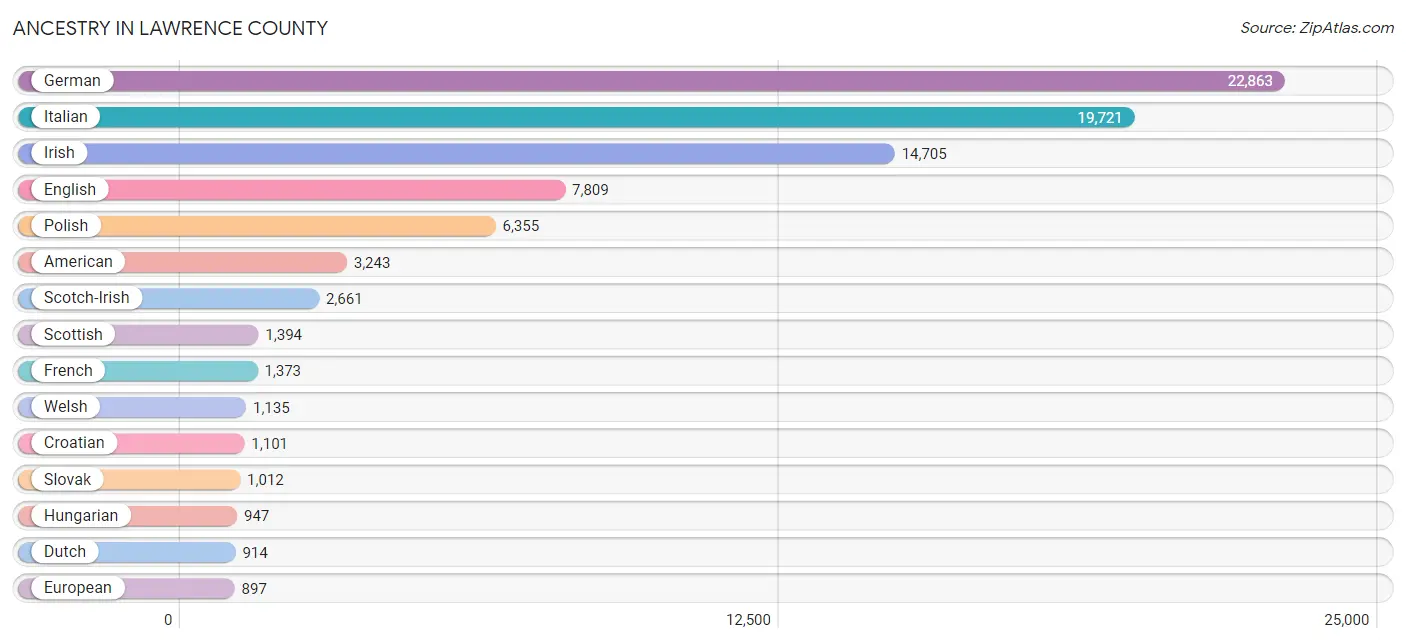
Ancestry in Lawrence County
The most populous ancestries reported in Lawrence County are German (22,863 | 26.6%), Italian (19,721 | 23.0%), Irish (14,705 | 17.1%), English (7,809 | 9.1%), and Polish (6,355 | 7.4%), together accounting for 83.2% of all Lawrence County residents.
| Ancestry | # Population | % Population |
| African | 208 | 0.2% |
| Albanian | 2 | 0.0% |
| American | 3,243 | 3.8% |
| Arab | 792 | 0.9% |
| Armenian | 25 | 0.0% |
| Australian | 9 | 0.0% |
| Austrian | 191 | 0.2% |
| Bahamian | 17 | 0.0% |
| Belgian | 79 | 0.1% |
| Bhutanese | 37 | 0.0% |
| Blackfeet | 42 | 0.1% |
| Bolivian | 9 | 0.0% |
| Brazilian | 104 | 0.1% |
| British | 204 | 0.2% |
| Bulgarian | 2 | 0.0% |
| Burmese | 108 | 0.1% |
| Canadian | 117 | 0.1% |
| Central American | 82 | 0.1% |
| Cherokee | 215 | 0.3% |
| Chinese | 25 | 0.0% |
| Colombian | 36 | 0.0% |
| Croatian | 1,101 | 1.3% |
| Cuban | 78 | 0.1% |
| Czech | 258 | 0.3% |
| Czechoslovakian | 178 | 0.2% |
| Danish | 24 | 0.0% |
| Delaware | 17 | 0.0% |
| Dominican | 74 | 0.1% |
| Dutch | 914 | 1.1% |
| Eastern European | 311 | 0.4% |
| Ecuadorian | 5 | 0.0% |
| English | 7,809 | 9.1% |
| European | 897 | 1.0% |
| Finnish | 137 | 0.2% |
| French | 1,373 | 1.6% |
| French Canadian | 131 | 0.2% |
| German | 22,863 | 26.6% |
| Greek | 535 | 0.6% |
| Guamanian / Chamorro | 7 | 0.0% |
| Haitian | 11 | 0.0% |
| Honduran | 40 | 0.1% |
| Hopi | 7 | 0.0% |
| Hungarian | 947 | 1.1% |
| Indian (Asian) | 185 | 0.2% |
| Iranian | 11 | 0.0% |
| Irish | 14,705 | 17.1% |
| Iroquois | 10 | 0.0% |
| Italian | 19,721 | 23.0% |
| Jamaican | 10 | 0.0% |
| Kiowa | 4 | 0.0% |
| Korean | 211 | 0.3% |
| Lebanese | 332 | 0.4% |
| Lithuanian | 98 | 0.1% |
| Macedonian | 12 | 0.0% |
| Malaysian | 17 | 0.0% |
| Mexican | 347 | 0.4% |
| Native Hawaiian | 17 | 0.0% |
| Nigerian | 5 | 0.0% |
| Northern European | 29 | 0.0% |
| Norwegian | 67 | 0.1% |
| Pakistani | 18 | 0.0% |
| Palestinian | 8 | 0.0% |
| Panamanian | 39 | 0.1% |
| Pennsylvania German | 527 | 0.6% |
| Polish | 6,355 | 7.4% |
| Portuguese | 8 | 0.0% |
| Puerto Rican | 704 | 0.8% |
| Romanian | 344 | 0.4% |
| Russian | 610 | 0.7% |
| Salvadoran | 3 | 0.0% |
| Samoan | 11 | 0.0% |
| Scandinavian | 170 | 0.2% |
| Scotch-Irish | 2,661 | 3.1% |
| Scottish | 1,394 | 1.6% |
| Serbian | 186 | 0.2% |
| Sioux | 1 | 0.0% |
| Slavic | 150 | 0.2% |
| Slovak | 1,012 | 1.2% |
| Slovene | 109 | 0.1% |
| South African | 11 | 0.0% |
| South American | 50 | 0.1% |
| Spaniard | 8 | 0.0% |
| Spanish | 46 | 0.1% |
| Spanish American | 8 | 0.0% |
| Sri Lankan | 55 | 0.1% |
| Subsaharan African | 230 | 0.3% |
| Swedish | 574 | 0.7% |
| Swiss | 117 | 0.1% |
| Syrian | 422 | 0.5% |
| Thai | 82 | 0.1% |
| Ukrainian | 275 | 0.3% |
| Welsh | 1,135 | 1.3% |
| Yugoslavian | 48 | 0.1% | View All 93 Rows |
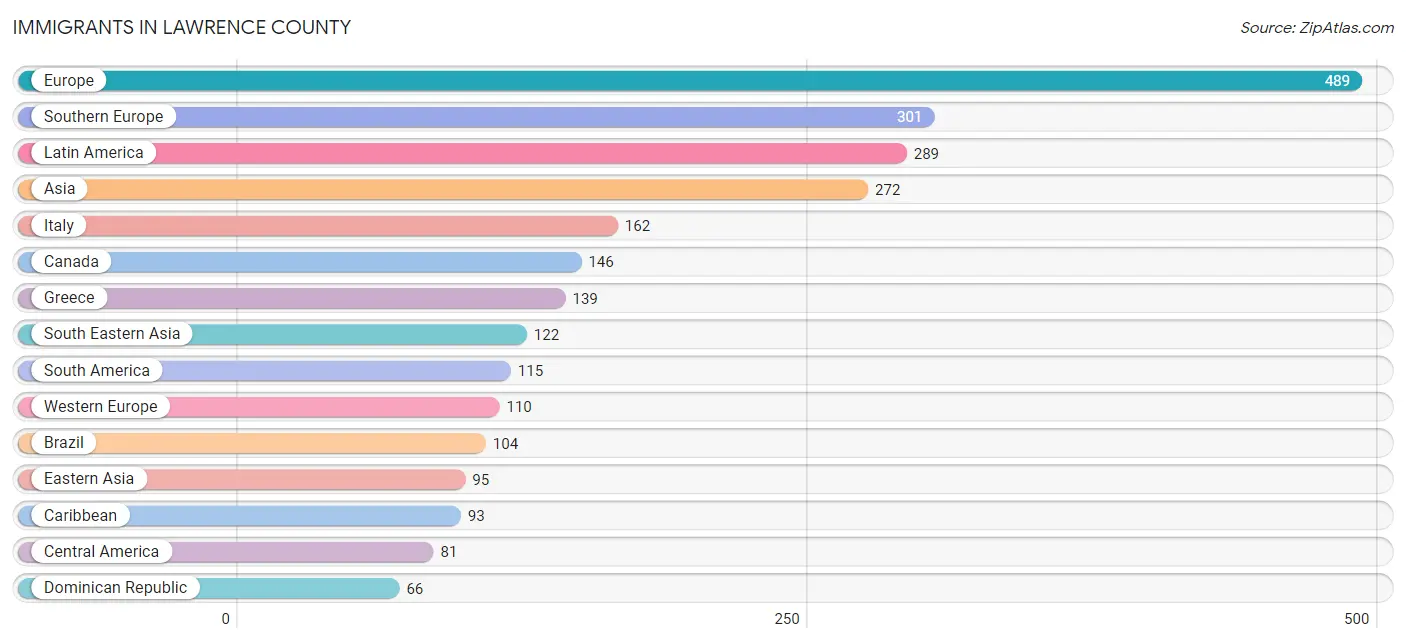
Immigrants in Lawrence County
The most numerous immigrant groups reported in Lawrence County came from Europe (489 | 0.6%), Southern Europe (301 | 0.4%), Latin America (289 | 0.3%), Asia (272 | 0.3%), and Italy (162 | 0.2%), together accounting for 1.8% of all Lawrence County residents.
| Immigration Origin | # Population | % Population |
| Africa | 12 | 0.0% |
| Asia | 272 | 0.3% |
| Austria | 50 | 0.1% |
| Bahamas | 17 | 0.0% |
| Bolivia | 9 | 0.0% |
| Brazil | 104 | 0.1% |
| Canada | 146 | 0.2% |
| Caribbean | 93 | 0.1% |
| Central America | 81 | 0.1% |
| China | 26 | 0.0% |
| Cuba | 10 | 0.0% |
| Dominican Republic | 66 | 0.1% |
| Eastern Africa | 3 | 0.0% |
| Eastern Asia | 95 | 0.1% |
| Eastern Europe | 38 | 0.0% |
| Ecuador | 2 | 0.0% |
| Egypt | 9 | 0.0% |
| England | 21 | 0.0% |
| Europe | 489 | 0.6% |
| France | 4 | 0.0% |
| Germany | 56 | 0.1% |
| Greece | 139 | 0.2% |
| Guatemala | 8 | 0.0% |
| Honduras | 17 | 0.0% |
| Hungary | 4 | 0.0% |
| India | 26 | 0.0% |
| Iran | 8 | 0.0% |
| Italy | 162 | 0.2% |
| Japan | 4 | 0.0% |
| Korea | 65 | 0.1% |
| Laos | 17 | 0.0% |
| Latin America | 289 | 0.3% |
| Lebanon | 9 | 0.0% |
| Mexico | 56 | 0.1% |
| Nepal | 4 | 0.0% |
| Northern Africa | 9 | 0.0% |
| Northern Europe | 40 | 0.1% |
| Philippines | 41 | 0.1% |
| Poland | 25 | 0.0% |
| Romania | 2 | 0.0% |
| Russia | 7 | 0.0% |
| Scotland | 13 | 0.0% |
| South America | 115 | 0.1% |
| South Central Asia | 38 | 0.0% |
| South Eastern Asia | 122 | 0.1% |
| Southern Europe | 301 | 0.4% |
| Thailand | 18 | 0.0% |
| Uganda | 3 | 0.0% |
| Vietnam | 39 | 0.1% |
| Western Asia | 9 | 0.0% |
| Western Europe | 110 | 0.1% | View All 51 Rows |
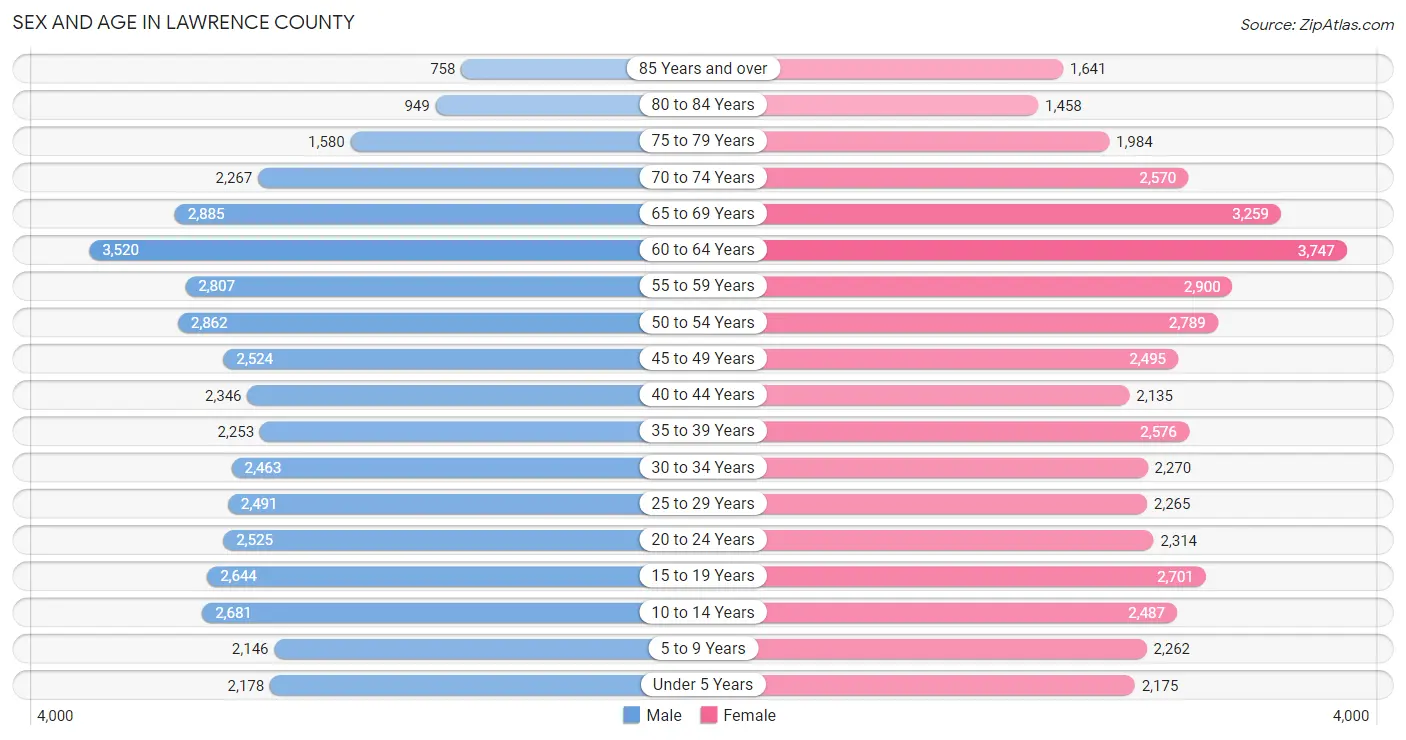
Sex and Age in Lawrence County
Sex and Age in Lawrence County
The most populous age groups in Lawrence County are 60 to 64 Years (3,520 | 8.4%) for men and 60 to 64 Years (3,747 | 8.5%) for women.
| Age Bracket | Male | Female |
| Under 5 Years | 2,178 (5.2%) | 2,175 (4.9%) |
| 5 to 9 Years | 2,146 (5.1%) | 2,262 (5.1%) |
| 10 to 14 Years | 2,681 (6.4%) | 2,487 (5.7%) |
| 15 to 19 Years | 2,644 (6.3%) | 2,701 (6.1%) |
| 20 to 24 Years | 2,525 (6.0%) | 2,314 (5.3%) |
| 25 to 29 Years | 2,491 (5.9%) | 2,265 (5.1%) |
| 30 to 34 Years | 2,463 (5.9%) | 2,270 (5.2%) |
| 35 to 39 Years | 2,253 (5.4%) | 2,576 (5.9%) |
| 40 to 44 Years | 2,346 (5.6%) | 2,135 (4.9%) |
| 45 to 49 Years | 2,524 (6.0%) | 2,495 (5.7%) |
| 50 to 54 Years | 2,862 (6.8%) | 2,789 (6.3%) |
| 55 to 59 Years | 2,807 (6.7%) | 2,900 (6.6%) |
| 60 to 64 Years | 3,520 (8.4%) | 3,747 (8.5%) |
| 65 to 69 Years | 2,885 (6.9%) | 3,259 (7.4%) |
| 70 to 74 Years | 2,267 (5.4%) | 2,570 (5.8%) |
| 75 to 79 Years | 1,580 (3.8%) | 1,984 (4.5%) |
| 80 to 84 Years | 949 (2.3%) | 1,458 (3.3%) |
| 85 Years and over | 758 (1.8%) | 1,641 (3.7%) |
| Total | 41,879 (100.0%) | 44,028 (100.0%) |
Families and Households in Lawrence County
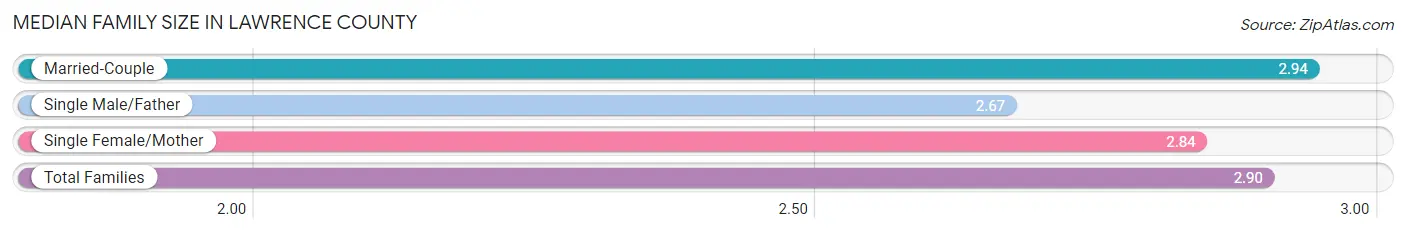
Median Family Size in Lawrence County
The median family size in Lawrence County is 2.90 persons per family, with married-couple families (16,629 | 72.5%) accounting for the largest median family size of 2.94 persons per family. On the other hand, single male/father families (1,896 | 8.3%) represent the smallest median family size with 2.67 persons per family.
| Family Type | # Families | Family Size |
| Married-Couple | 16,629 (72.5%) | 2.94 |
| Single Male/Father | 1,896 (8.3%) | 2.67 |
| Single Female/Mother | 4,402 (19.2%) | 2.84 |
| Total Families | 22,927 (100.0%) | 2.90 |
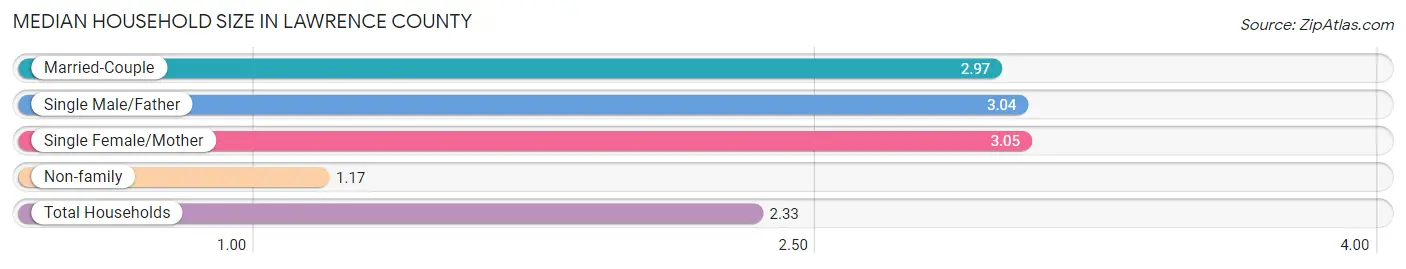
Median Household Size in Lawrence County
The median household size in Lawrence County is 2.33 persons per household, with single female/mother households (4,402 | 12.2%) accounting for the largest median household size of 3.05 persons per household. non-family households (13,006 | 36.2%) represent the smallest median household size with 1.17 persons per household.
| Household Type | # Households | Household Size |
| Married-Couple | 16,629 (46.3%) | 2.97 |
| Single Male/Father | 1,896 (5.3%) | 3.04 |
| Single Female/Mother | 4,402 (12.2%) | 3.05 |
| Non-family | 13,006 (36.2%) | 1.17 |
| Total Households | 35,933 (100.0%) | 2.33 |
Household Size by Marriage Status in Lawrence County
Out of a total of 35,933 households in Lawrence County, 22,927 (63.8%) are family households, while 13,006 (36.2%) are nonfamily households. The most numerous type of family households are 2-person households, comprising 11,563, and the most common type of nonfamily households are 1-person households, comprising 11,377.
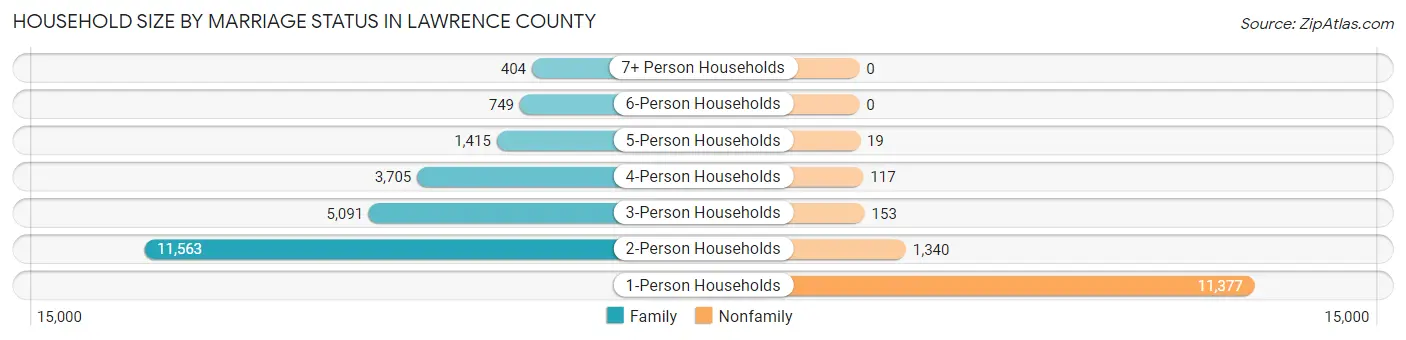
| Household Size | Family Households | Nonfamily Households |
| 1-Person Households | - | 11,377 (31.7%) |
| 2-Person Households | 11,563 (32.2%) | 1,340 (3.7%) |
| 3-Person Households | 5,091 (14.2%) | 153 (0.4%) |
| 4-Person Households | 3,705 (10.3%) | 117 (0.3%) |
| 5-Person Households | 1,415 (3.9%) | 19 (0.1%) |
| 6-Person Households | 749 (2.1%) | 0 (0.0%) |
| 7+ Person Households | 404 (1.1%) | 0 (0.0%) |
| Total | 22,927 (63.8%) | 13,006 (36.2%) |
Female Fertility in Lawrence County
Fertility by Age in Lawrence County
Average fertility rate in Lawrence County is 53.0 births per 1,000 women. Women in the age bracket of 20 to 34 years have the highest fertility rate with 104.0 births per 1,000 women. Women in the age bracket of 20 to 34 years acount for 78.2% of all women with births.
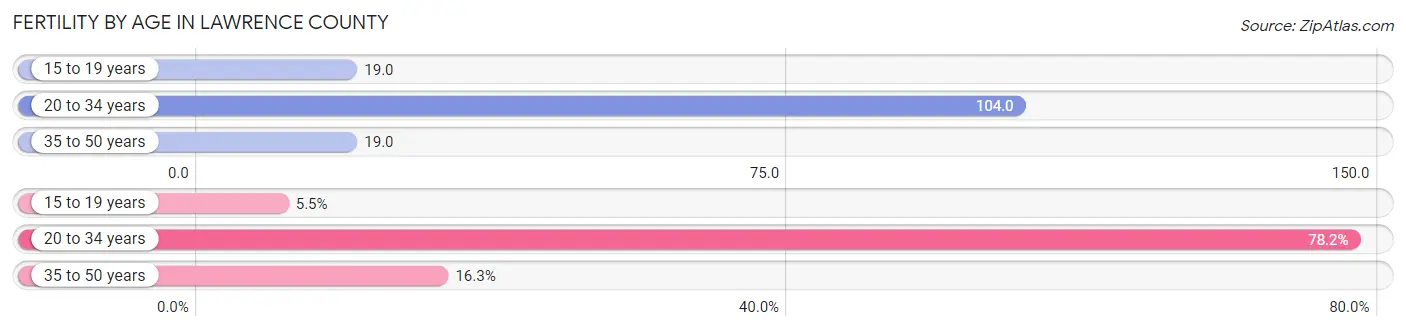
| Age Bracket | Women with Births | Births / 1,000 Women |
| 15 to 19 years | 50 (5.5%) | 19.0 |
| 20 to 34 years | 714 (78.2%) | 104.0 |
| 35 to 50 years | 149 (16.3%) | 19.0 |
| Total | 913 (100.0%) | 53.0 |
Fertility by Age by Marriage Status in Lawrence County
50.4% of women with births (913) in Lawrence County are married. The highest percentage of unmarried women with births falls into 15 to 19 years age bracket with 100.0% of them unmarried at the time of birth, while the lowest percentage of unmarried women with births belong to 35 to 50 years age bracket with 22.8% of them unmarried.
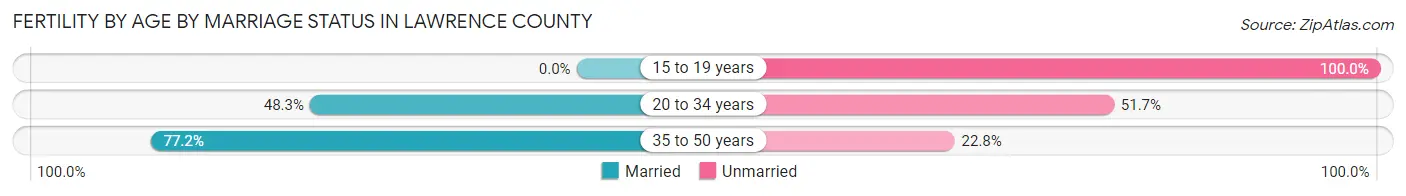
| Age Bracket | Married | Unmarried |
| 15 to 19 years | 0 (0.0%) | 50 (100.0%) |
| 20 to 34 years | 345 (48.3%) | 369 (51.7%) |
| 35 to 50 years | 115 (77.2%) | 34 (22.8%) |
| Total | 460 (50.4%) | 453 (49.6%) |
Fertility by Education in Lawrence County
Average fertility rate in Lawrence County is 53.0 births per 1,000 women. Women with the education attainment of high school diploma have the highest fertility rate of 80.0 births per 1,000 women, while women with the education attainment of less than high school have the lowest fertility at 34.0 births per 1,000 women. Women with the education attainment of high school diploma represent 41.4% of all women with births.
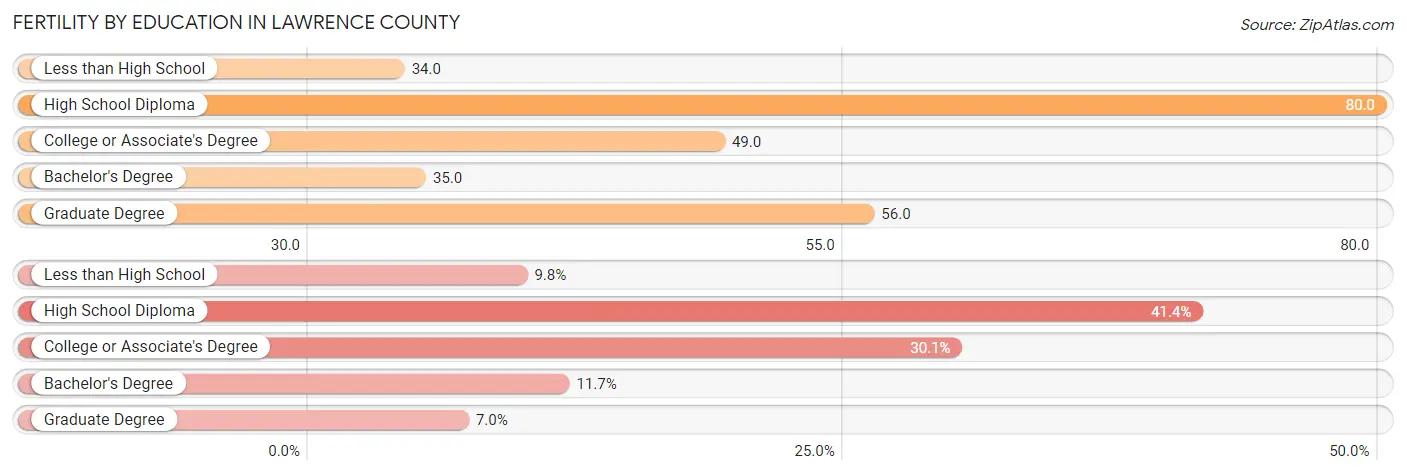
| Educational Attainment | Women with Births | Births / 1,000 Women |
| Less than High School | 89 (9.8%) | 34.0 |
| High School Diploma | 378 (41.4%) | 80.0 |
| College or Associate's Degree | 275 (30.1%) | 49.0 |
| Bachelor's Degree | 107 (11.7%) | 35.0 |
| Graduate Degree | 64 (7.0%) | 56.0 |
| Total | 913 (100.0%) | 53.0 |
Fertility by Education by Marriage Status in Lawrence County
49.6% of women with births in Lawrence County are unmarried. Women with the educational attainment of bachelor's degree are most likely to be married with 100.0% of them married at childbirth, while women with the educational attainment of high school diploma are least likely to be married with 63.0% of them unmarried at childbirth.
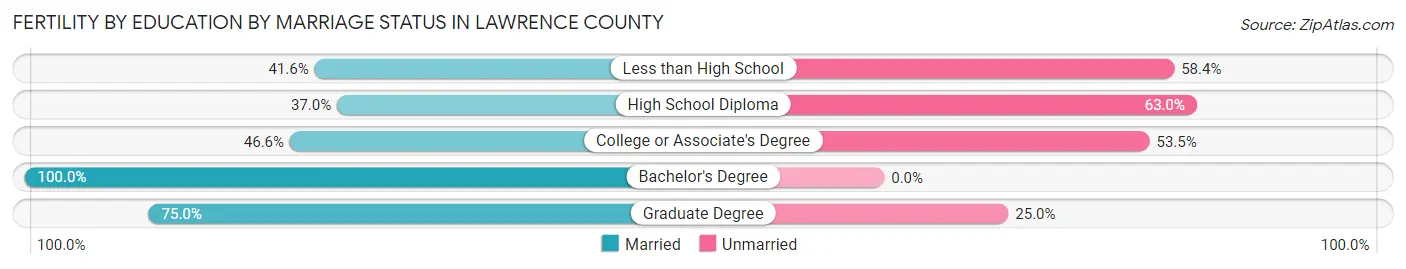
| Educational Attainment | Married | Unmarried |
| Less than High School | 37 (41.6%) | 52 (58.4%) |
| High School Diploma | 140 (37.0%) | 238 (63.0%) |
| College or Associate's Degree | 128 (46.6%) | 147 (53.4%) |
| Bachelor's Degree | 107 (100.0%) | 0 (0.0%) |
| Graduate Degree | 48 (75.0%) | 16 (25.0%) |
| Total | 460 (50.4%) | 453 (49.6%) |
Employment Characteristics in Lawrence County
Employment by Class of Employer in Lawrence County
Among the 38,089 employed individuals in Lawrence County, private company employees (26,980 | 70.8%), not-for-profit organizations (3,881 | 10.2%), and local government employees (2,359 | 6.2%) make up the most common classes of employment.
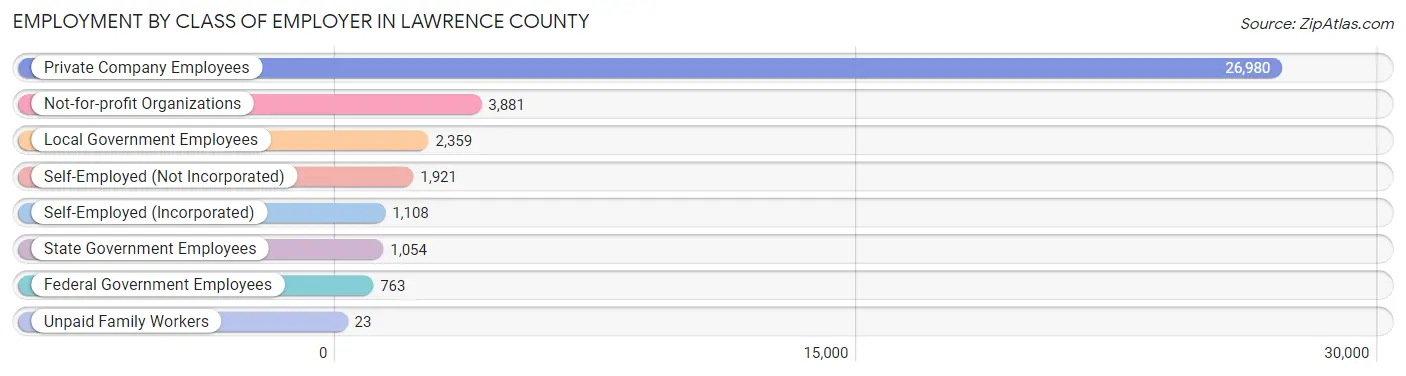
| Employer Class | # Employees | % Employees |
| Private Company Employees | 26,980 | 70.8% |
| Self-Employed (Incorporated) | 1,108 | 2.9% |
| Self-Employed (Not Incorporated) | 1,921 | 5.0% |
| Not-for-profit Organizations | 3,881 | 10.2% |
| Local Government Employees | 2,359 | 6.2% |
| State Government Employees | 1,054 | 2.8% |
| Federal Government Employees | 763 | 2.0% |
| Unpaid Family Workers | 23 | 0.1% |
| Total | 38,089 | 100.0% |
Employment Status by Age in Lawrence County
According to the labor force statistics for Lawrence County, out of the total population over 16 years of age (71,031), 58.7% or 41,695 individuals are in the labor force, with 6.8% or 2,835 of them unemployed. The age group with the highest labor force participation rate is 30 to 34 years, with 86.5% or 4,094 individuals in the labor force. Within the labor force, the 16 to 19 years age range has the highest percentage of unemployed individuals, with 13.7% or 257 of them being unemployed.
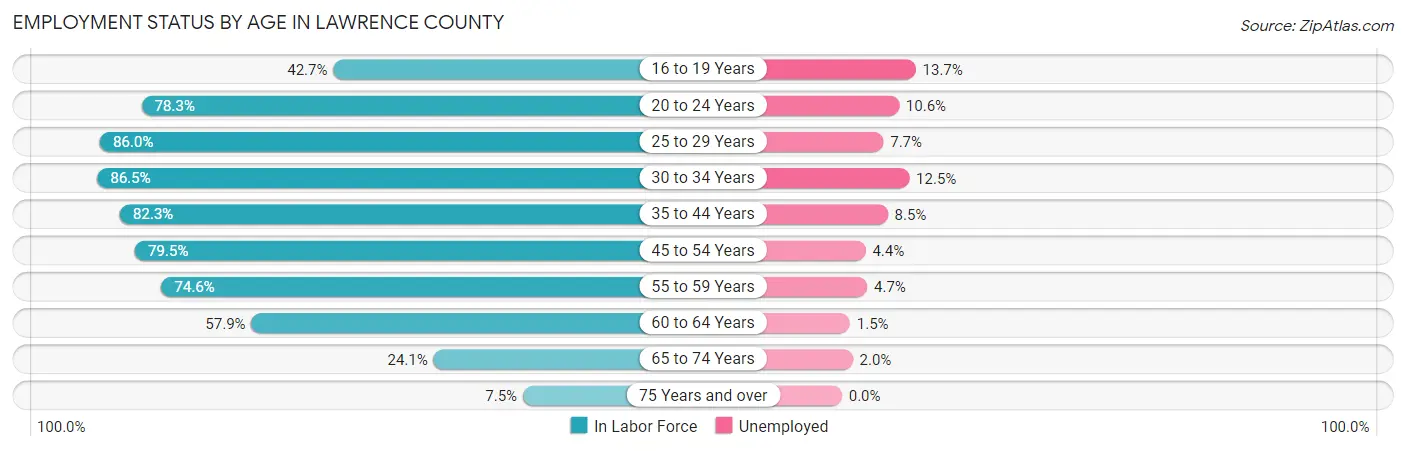
| Age Bracket | In Labor Force | Unemployed |
| 16 to 19 Years | 1,878 (42.7%) | 257 (13.7%) |
| 20 to 24 Years | 3,789 (78.3%) | 402 (10.6%) |
| 25 to 29 Years | 4,090 (86.0%) | 315 (7.7%) |
| 30 to 34 Years | 4,094 (86.5%) | 512 (12.5%) |
| 35 to 44 Years | 7,662 (82.3%) | 651 (8.5%) |
| 45 to 54 Years | 8,483 (79.5%) | 373 (4.4%) |
| 55 to 59 Years | 4,257 (74.6%) | 200 (4.7%) |
| 60 to 64 Years | 4,208 (57.9%) | 63 (1.5%) |
| 65 to 74 Years | 2,646 (24.1%) | 53 (2.0%) |
| 75 Years and over | 628 (7.5%) | 0 (0.0%) |
| Total | 41,695 (58.7%) | 2,835 (6.8%) |
Employment Status by Educational Attainment in Lawrence County
According to labor force statistics for Lawrence County, 77.3% of individuals (32,808) out of the total population between 25 and 64 years of age (42,443) are in the labor force, with 6.4% or 2,100 of them being unemployed. The group with the highest labor force participation rate are those with the educational attainment of bachelor's degree or higher, with 90.0% or 9,265 individuals in the labor force. Within the labor force, individuals with less than high school education have the highest percentage of unemployment, with 23.0% or 356 of them being unemployed.
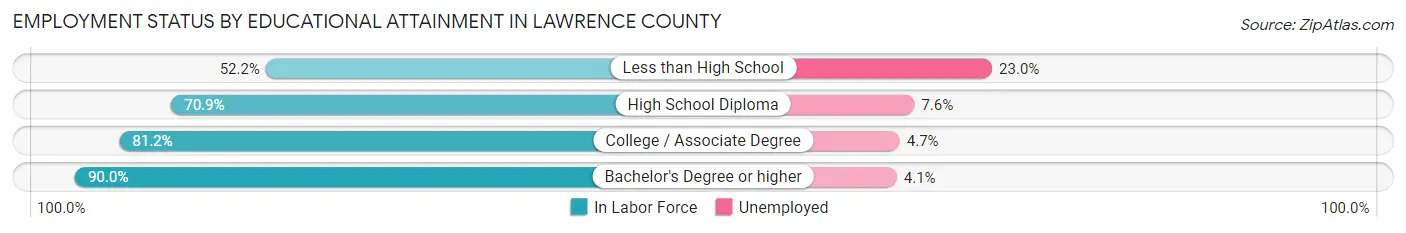
| Educational Attainment | In Labor Force | Unemployed |
| Less than High School | 1,550 (52.2%) | 683 (23.0%) |
| High School Diploma | 11,686 (70.9%) | 1,253 (7.6%) |
| College / Associate Degree | 10,310 (81.2%) | 597 (4.7%) |
| Bachelor's Degree or higher | 9,265 (90.0%) | 422 (4.1%) |
| Total | 32,808 (77.3%) | 2,716 (6.4%) |
Employment Occupations by Sex in Lawrence County
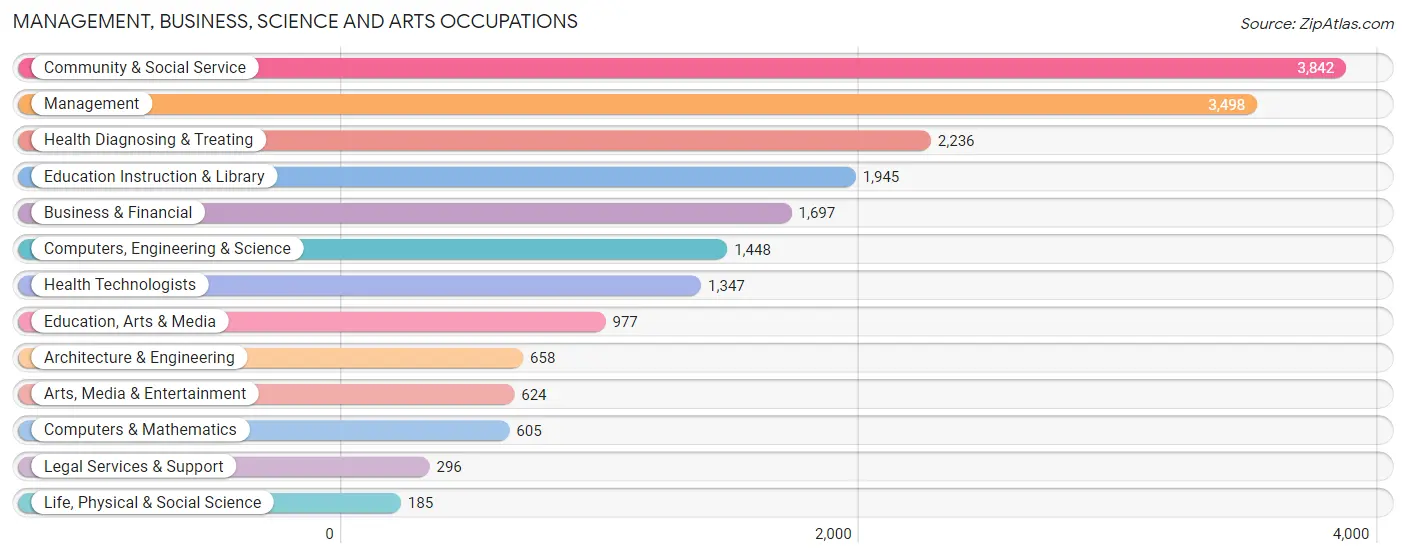
Management, Business, Science and Arts Occupations
The most common Management, Business, Science and Arts occupations in Lawrence County are Community & Social Service (3,842 | 9.9%), Management (3,498 | 9.0%), Health Diagnosing & Treating (2,236 | 5.8%), Education Instruction & Library (1,945 | 5.0%), and Business & Financial (1,697 | 4.4%).
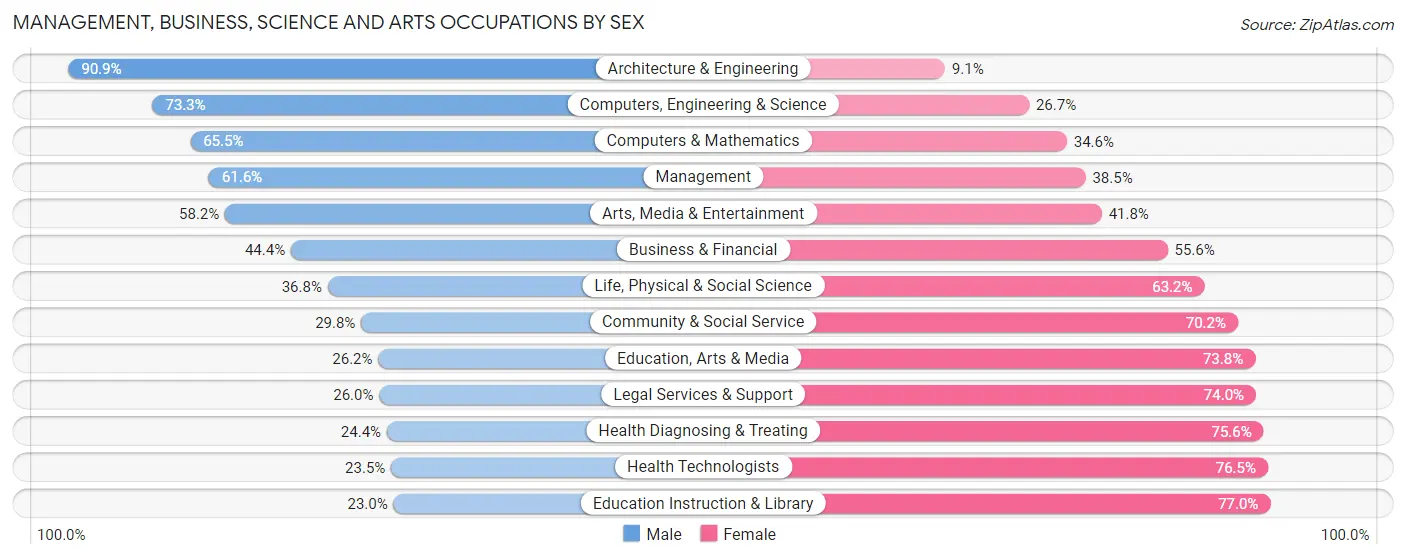
Management, Business, Science and Arts Occupations by Sex
Within the Management, Business, Science and Arts occupations in Lawrence County, the most male-oriented occupations are Architecture & Engineering (90.9%), Computers, Engineering & Science (73.3%), and Computers & Mathematics (65.4%), while the most female-oriented occupations are Education Instruction & Library (77.0%), Health Technologists (76.5%), and Health Diagnosing & Treating (75.6%).
| Occupation | Male | Female |
| Management | 2,153 (61.6%) | 1,345 (38.5%) |
| Business & Financial | 754 (44.4%) | 943 (55.6%) |
| Computers, Engineering & Science | 1,062 (73.3%) | 386 (26.7%) |
| Computers & Mathematics | 396 (65.4%) | 209 (34.5%) |
| Architecture & Engineering | 598 (90.9%) | 60 (9.1%) |
| Life, Physical & Social Science | 68 (36.8%) | 117 (63.2%) |
| Community & Social Service | 1,144 (29.8%) | 2,698 (70.2%) |
| Education, Arts & Media | 256 (26.2%) | 721 (73.8%) |
| Legal Services & Support | 77 (26.0%) | 219 (74.0%) |
| Education Instruction & Library | 448 (23.0%) | 1,497 (77.0%) |
| Arts, Media & Entertainment | 363 (58.2%) | 261 (41.8%) |
| Health Diagnosing & Treating | 546 (24.4%) | 1,690 (75.6%) |
| Health Technologists | 317 (23.5%) | 1,030 (76.5%) |
| Total (Category) | 5,659 (44.5%) | 7,062 (55.5%) |
| Total (Overall) | 20,509 (52.7%) | 18,377 (47.3%) |
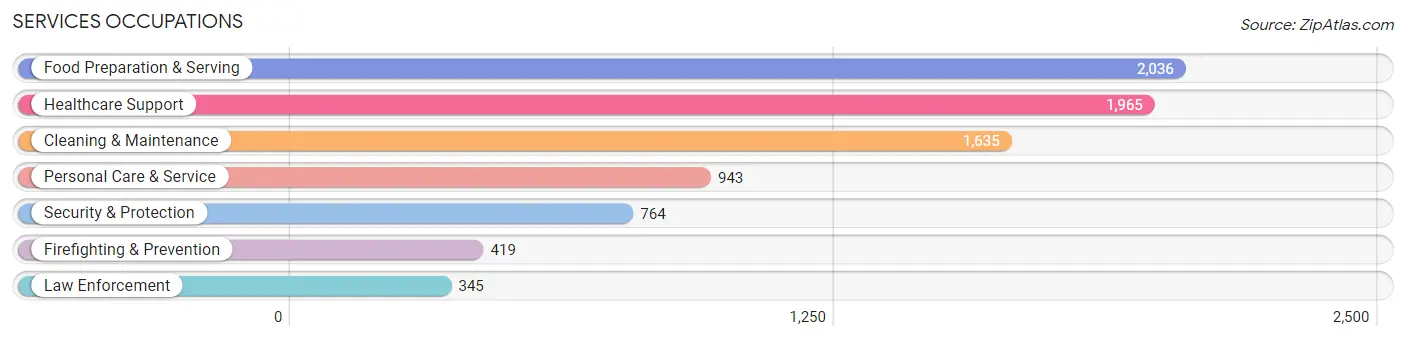
Services Occupations
The most common Services occupations in Lawrence County are Food Preparation & Serving (2,036 | 5.2%), Healthcare Support (1,965 | 5.1%), Cleaning & Maintenance (1,635 | 4.2%), Personal Care & Service (943 | 2.4%), and Security & Protection (764 | 2.0%).
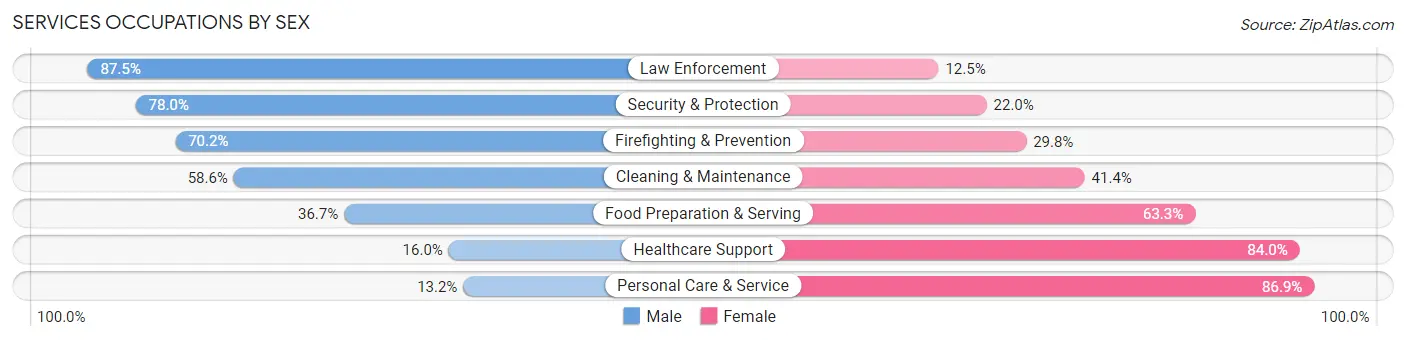
Services Occupations by Sex
Within the Services occupations in Lawrence County, the most male-oriented occupations are Law Enforcement (87.5%), Security & Protection (78.0%), and Firefighting & Prevention (70.2%), while the most female-oriented occupations are Personal Care & Service (86.9%), Healthcare Support (84.0%), and Food Preparation & Serving (63.3%).
| Occupation | Male | Female |
| Healthcare Support | 315 (16.0%) | 1,650 (84.0%) |
| Security & Protection | 596 (78.0%) | 168 (22.0%) |
| Firefighting & Prevention | 294 (70.2%) | 125 (29.8%) |
| Law Enforcement | 302 (87.5%) | 43 (12.5%) |
| Food Preparation & Serving | 748 (36.7%) | 1,288 (63.3%) |
| Cleaning & Maintenance | 958 (58.6%) | 677 (41.4%) |
| Personal Care & Service | 124 (13.2%) | 819 (86.9%) |
| Total (Category) | 2,741 (37.3%) | 4,602 (62.7%) |
| Total (Overall) | 20,509 (52.7%) | 18,377 (47.3%) |
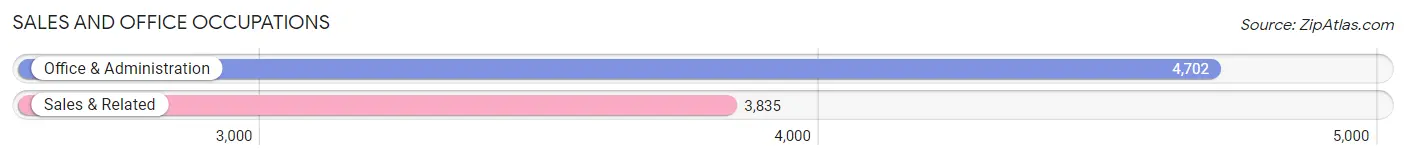
Sales and Office Occupations
The most common Sales and Office occupations in Lawrence County are Office & Administration (4,702 | 12.1%), and Sales & Related (3,835 | 9.9%).
Sales and Office Occupations by Sex
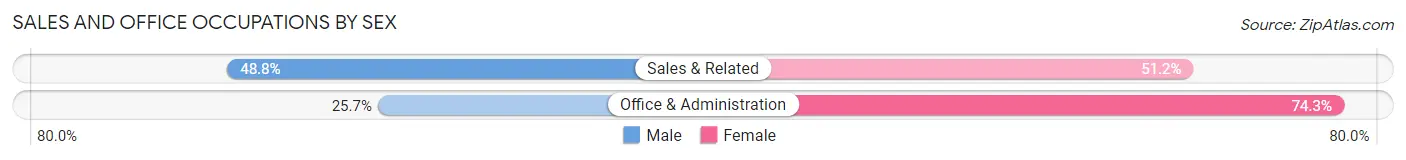
| Occupation | Male | Female |
| Sales & Related | 1,872 (48.8%) | 1,963 (51.2%) |
| Office & Administration | 1,207 (25.7%) | 3,495 (74.3%) |
| Total (Category) | 3,079 (36.1%) | 5,458 (63.9%) |
| Total (Overall) | 20,509 (52.7%) | 18,377 (47.3%) |
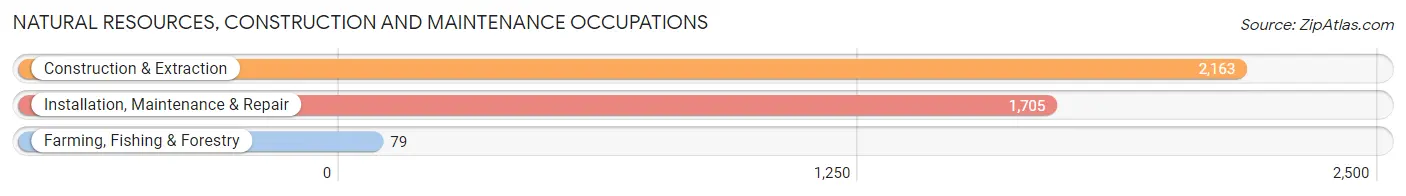
Natural Resources, Construction and Maintenance Occupations
The most common Natural Resources, Construction and Maintenance occupations in Lawrence County are Construction & Extraction (2,163 | 5.6%), Installation, Maintenance & Repair (1,705 | 4.4%), and Farming, Fishing & Forestry (79 | 0.2%).
Natural Resources, Construction and Maintenance Occupations by Sex
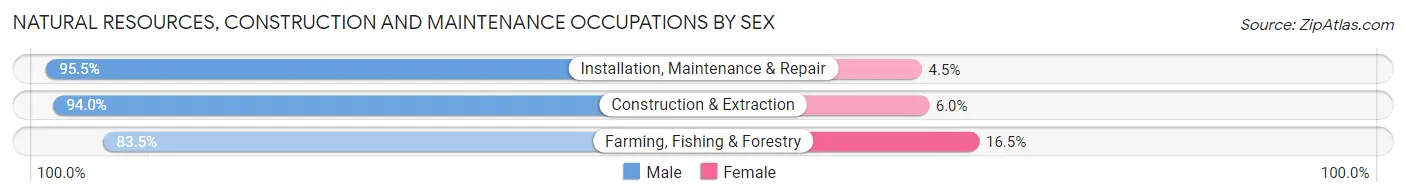
| Occupation | Male | Female |
| Farming, Fishing & Forestry | 66 (83.5%) | 13 (16.5%) |
| Construction & Extraction | 2,033 (94.0%) | 130 (6.0%) |
| Installation, Maintenance & Repair | 1,628 (95.5%) | 77 (4.5%) |
| Total (Category) | 3,727 (94.4%) | 220 (5.6%) |
| Total (Overall) | 20,509 (52.7%) | 18,377 (47.3%) |
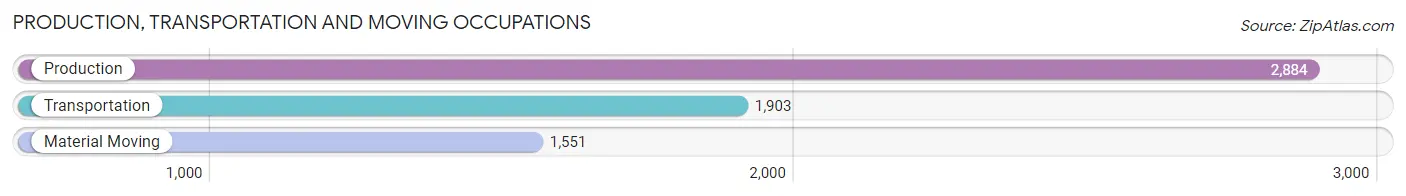
Production, Transportation and Moving Occupations
The most common Production, Transportation and Moving occupations in Lawrence County are Production (2,884 | 7.4%), Transportation (1,903 | 4.9%), and Material Moving (1,551 | 4.0%).
Production, Transportation and Moving Occupations by Sex
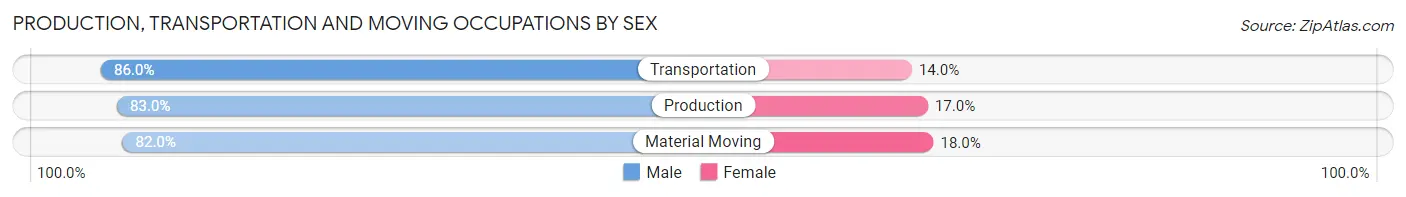
| Occupation | Male | Female |
| Production | 2,395 (83.0%) | 489 (17.0%) |
| Transportation | 1,636 (86.0%) | 267 (14.0%) |
| Material Moving | 1,272 (82.0%) | 279 (18.0%) |
| Total (Category) | 5,303 (83.7%) | 1,035 (16.3%) |
| Total (Overall) | 20,509 (52.7%) | 18,377 (47.3%) |
Employment Industries by Sex in Lawrence County
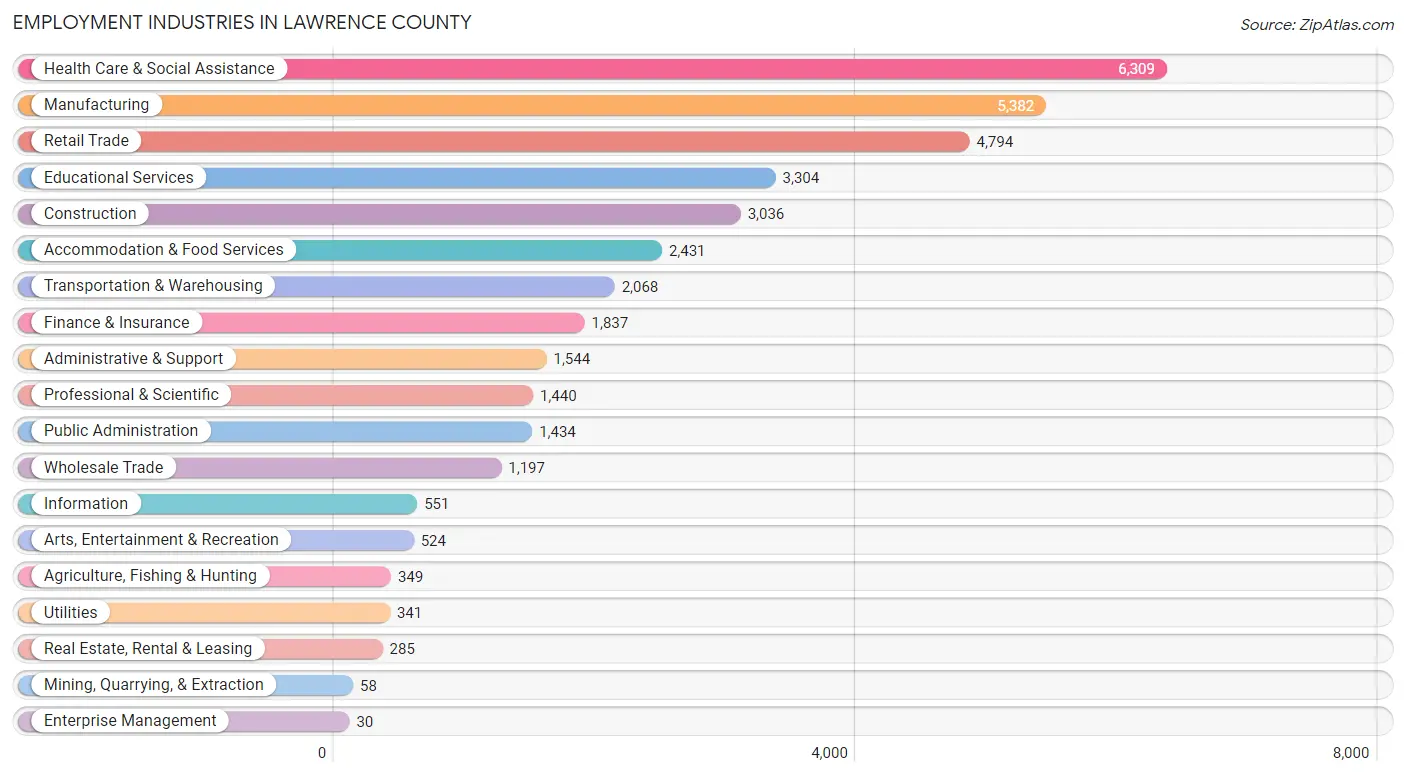
Employment Industries in Lawrence County
The major employment industries in Lawrence County include Health Care & Social Assistance (6,309 | 16.2%), Manufacturing (5,382 | 13.8%), Retail Trade (4,794 | 12.3%), Educational Services (3,304 | 8.5%), and Construction (3,036 | 7.8%).
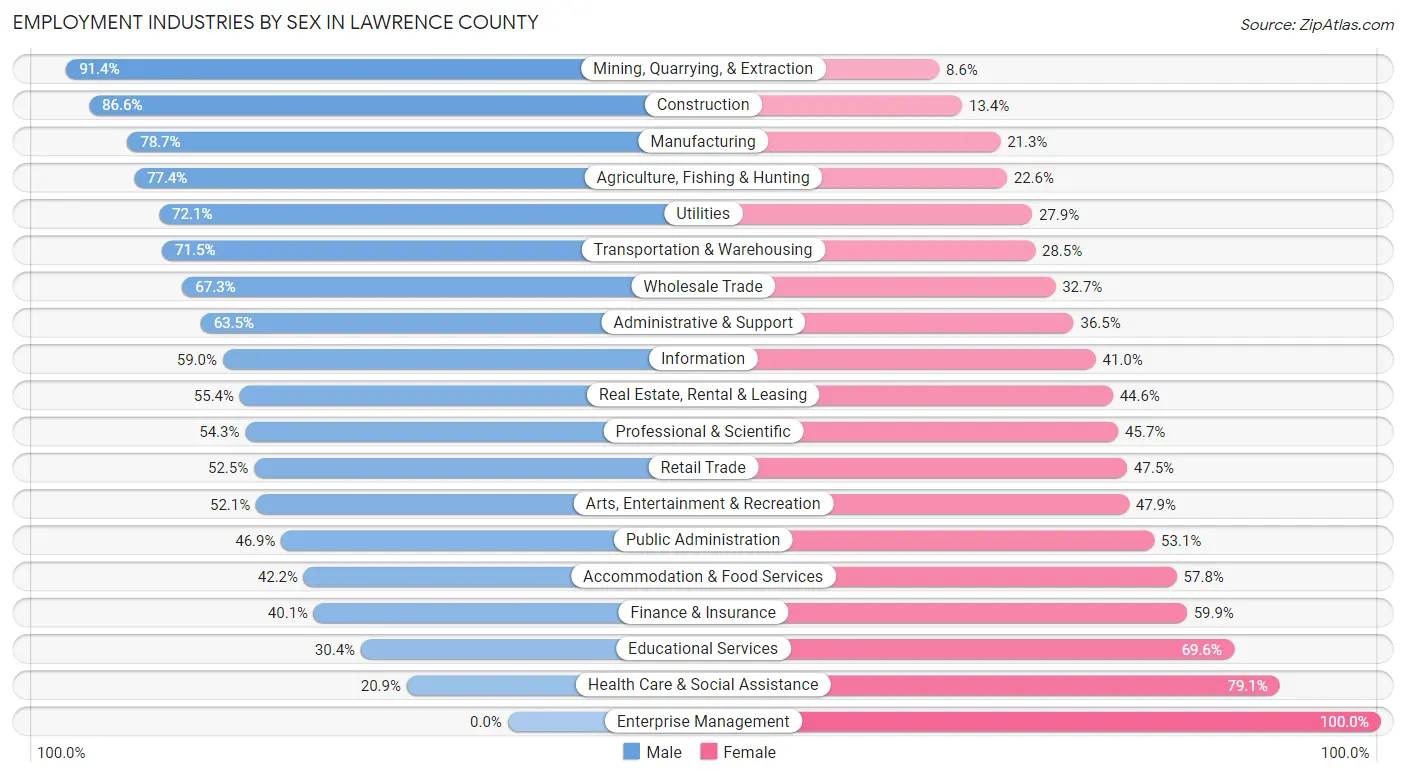
Employment Industries by Sex in Lawrence County
The Lawrence County industries that see more men than women are Mining, Quarrying, & Extraction (91.4%), Construction (86.6%), and Manufacturing (78.7%), whereas the industries that tend to have a higher number of women are Enterprise Management (100.0%), Health Care & Social Assistance (79.1%), and Educational Services (69.6%).
| Industry | Male | Female |
| Agriculture, Fishing & Hunting | 270 (77.4%) | 79 (22.6%) |
| Mining, Quarrying, & Extraction | 53 (91.4%) | 5 (8.6%) |
| Construction | 2,630 (86.6%) | 406 (13.4%) |
| Manufacturing | 4,237 (78.7%) | 1,145 (21.3%) |
| Wholesale Trade | 806 (67.3%) | 391 (32.7%) |
| Retail Trade | 2,517 (52.5%) | 2,277 (47.5%) |
| Transportation & Warehousing | 1,479 (71.5%) | 589 (28.5%) |
| Utilities | 246 (72.1%) | 95 (27.9%) |
| Information | 325 (59.0%) | 226 (41.0%) |
| Finance & Insurance | 737 (40.1%) | 1,100 (59.9%) |
| Real Estate, Rental & Leasing | 158 (55.4%) | 127 (44.6%) |
| Professional & Scientific | 782 (54.3%) | 658 (45.7%) |
| Enterprise Management | 0 (0.0%) | 30 (100.0%) |
| Administrative & Support | 981 (63.5%) | 563 (36.5%) |
| Educational Services | 1,004 (30.4%) | 2,300 (69.6%) |
| Health Care & Social Assistance | 1,318 (20.9%) | 4,991 (79.1%) |
| Arts, Entertainment & Recreation | 273 (52.1%) | 251 (47.9%) |
| Accommodation & Food Services | 1,026 (42.2%) | 1,405 (57.8%) |
| Public Administration | 672 (46.9%) | 762 (53.1%) |
| Total | 20,509 (52.7%) | 18,377 (47.3%) |
Education in Lawrence County
School Enrollment in Lawrence County
The most common levels of schooling among the 17,629 students in Lawrence County are high school (4,270 | 24.2%), middle school (4,047 | 23.0%), and elementary school (3,701 | 21.0%).
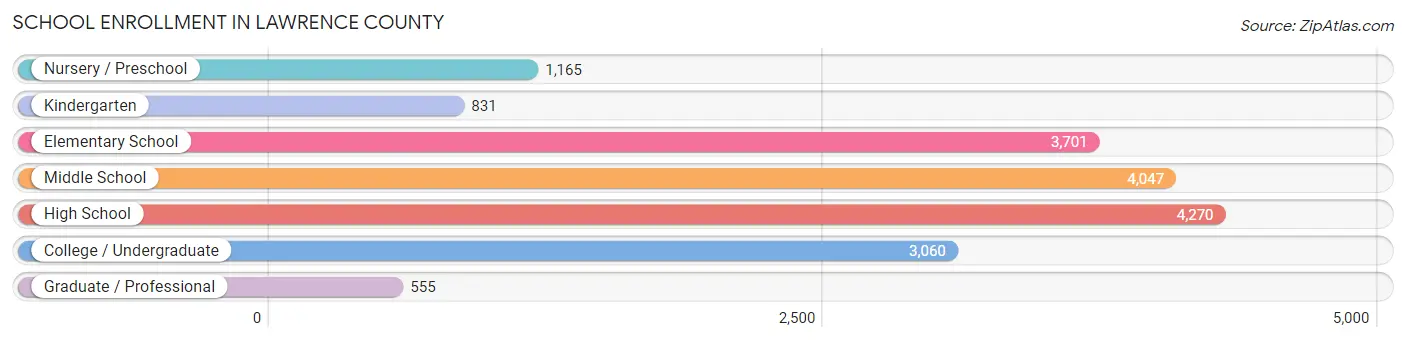
| School Level | # Students | % Students |
| Nursery / Preschool | 1,165 | 6.6% |
| Kindergarten | 831 | 4.7% |
| Elementary School | 3,701 | 21.0% |
| Middle School | 4,047 | 23.0% |
| High School | 4,270 | 24.2% |
| College / Undergraduate | 3,060 | 17.4% |
| Graduate / Professional | 555 | 3.2% |
| Total | 17,629 | 100.0% |
School Enrollment by Age by Funding Source in Lawrence County
Out of a total of 17,629 students who are enrolled in schools in Lawrence County, 2,591 (14.7%) attend a private institution, while the remaining 15,038 (85.3%) are enrolled in public schools. The age group of 20 to 24 year olds has the highest likelihood of being enrolled in private schools, with 808 (44.7% in the age bracket) enrolled. Conversely, the age group of 15 to 17 year olds has the lowest likelihood of being enrolled in a private school, with 2,896 (95.6% in the age bracket) attending a public institution.
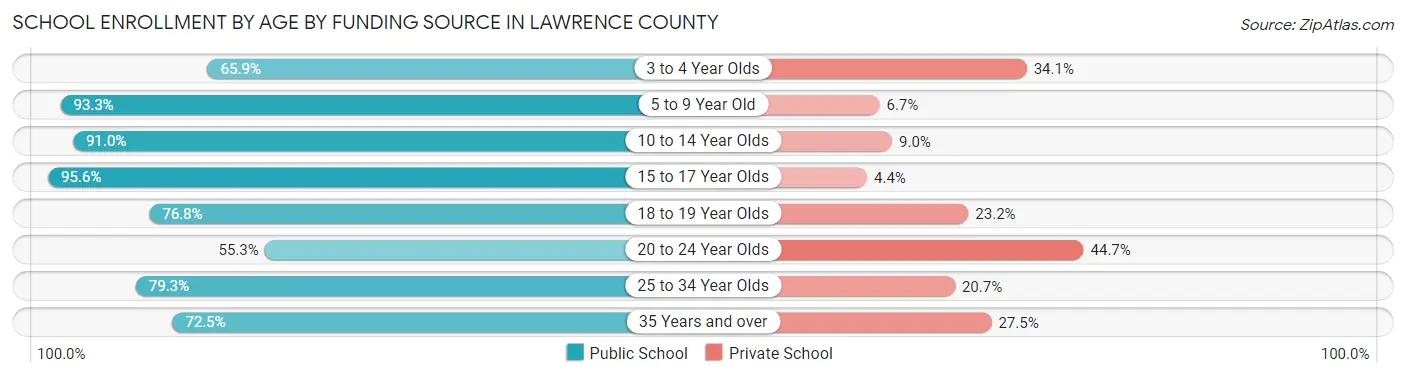
| Age Bracket | Public School | Private School |
| 3 to 4 Year Olds | 570 (65.9%) | 295 (34.1%) |
| 5 to 9 Year Old | 3,925 (93.3%) | 281 (6.7%) |
| 10 to 14 Year Olds | 4,678 (91.0%) | 464 (9.0%) |
| 15 to 17 Year Olds | 2,896 (95.6%) | 132 (4.4%) |
| 18 to 19 Year Olds | 1,130 (76.8%) | 342 (23.2%) |
| 20 to 24 Year Olds | 1,000 (55.3%) | 808 (44.7%) |
| 25 to 34 Year Olds | 455 (79.3%) | 119 (20.7%) |
| 35 Years and over | 387 (72.5%) | 147 (27.5%) |
| Total | 15,038 (85.3%) | 2,591 (14.7%) |
Educational Attainment by Field of Study in Lawrence County
Business (2,946 | 20.0%), education (2,831 | 19.2%), science & technology (1,767 | 12.0%), arts & humanities (1,349 | 9.1%), and bio, nature & agricultural (967 | 6.6%) are the most common fields of study among 14,769 individuals in Lawrence County who have obtained a bachelor's degree or higher.
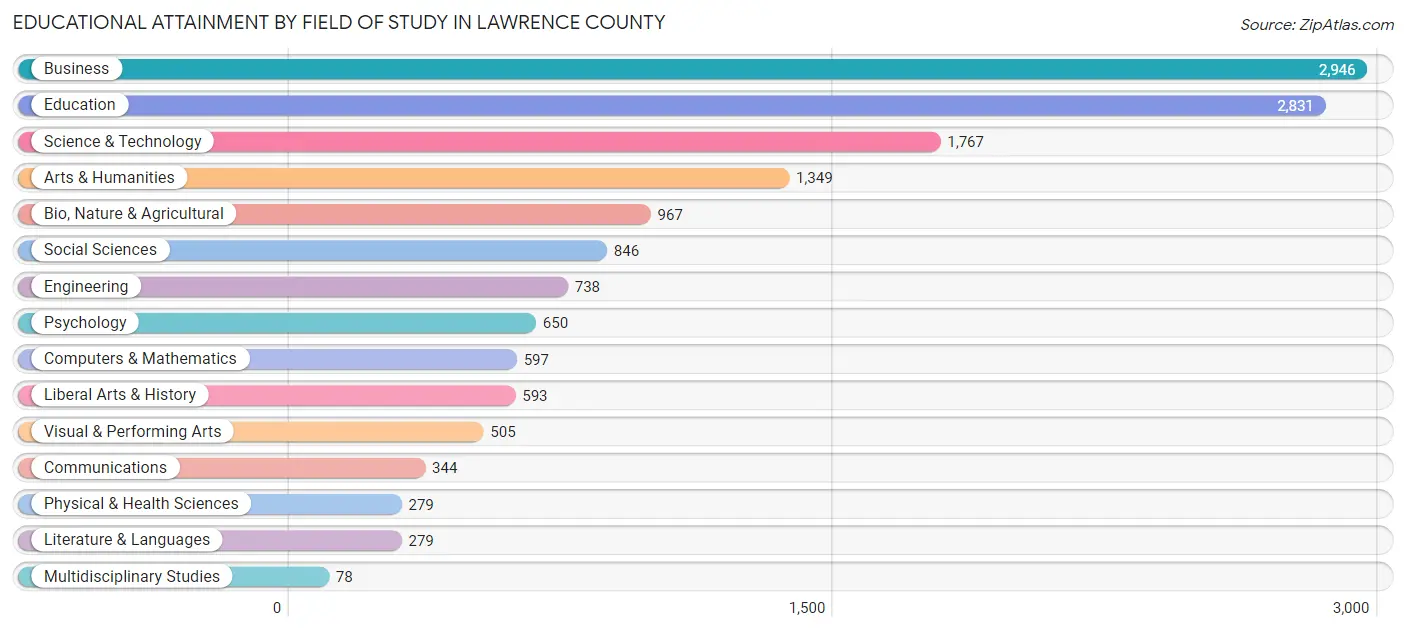
| Field of Study | # Graduates | % Graduates |
| Computers & Mathematics | 597 | 4.0% |
| Bio, Nature & Agricultural | 967 | 6.6% |
| Physical & Health Sciences | 279 | 1.9% |
| Psychology | 650 | 4.4% |
| Social Sciences | 846 | 5.7% |
| Engineering | 738 | 5.0% |
| Multidisciplinary Studies | 78 | 0.5% |
| Science & Technology | 1,767 | 12.0% |
| Business | 2,946 | 20.0% |
| Education | 2,831 | 19.2% |
| Literature & Languages | 279 | 1.9% |
| Liberal Arts & History | 593 | 4.0% |
| Visual & Performing Arts | 505 | 3.4% |
| Communications | 344 | 2.3% |
| Arts & Humanities | 1,349 | 9.1% |
| Total | 14,769 | 100.0% |
Transportation & Commute in Lawrence County
Vehicle Availability by Sex in Lawrence County
The most prevalent vehicle ownership categories in Lawrence County are males with 2 vehicles (8,339, accounting for 42.3%) and females with 2 vehicles (7,608, making up 47.0%).
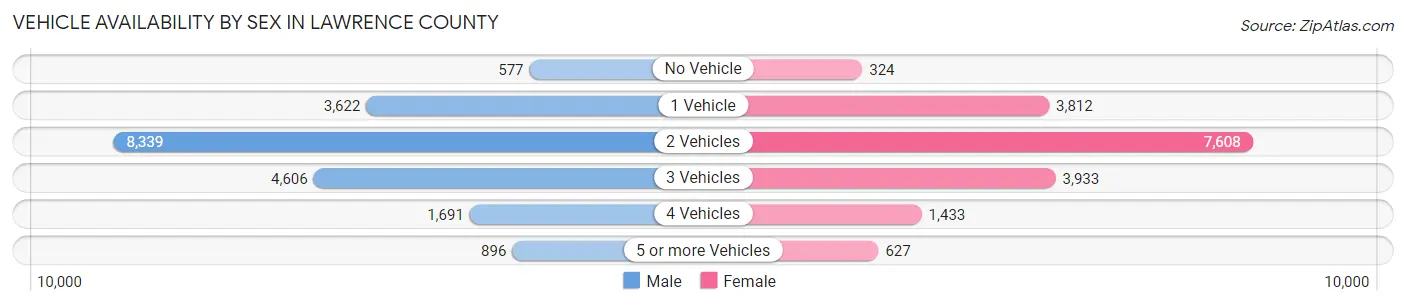
| Vehicles Available | Male | Female |
| No Vehicle | 577 (2.9%) | 324 (1.8%) |
| 1 Vehicle | 3,622 (18.4%) | 3,812 (21.5%) |
| 2 Vehicles | 8,339 (42.3%) | 7,608 (42.9%) |
| 3 Vehicles | 4,606 (23.3%) | 3,933 (22.2%) |
| 4 Vehicles | 1,691 (8.6%) | 1,433 (8.1%) |
| 5 or more Vehicles | 896 (4.5%) | 627 (3.5%) |
| Total | 19,731 (100.0%) | 17,737 (100.0%) |
Commute Time in Lawrence County
The most frequently occuring commute durations in Lawrence County are 10 to 14 minutes (5,479 commuters, 15.9%), 15 to 19 minutes (4,970 commuters, 14.5%), and 5 to 9 minutes (4,926 commuters, 14.3%).
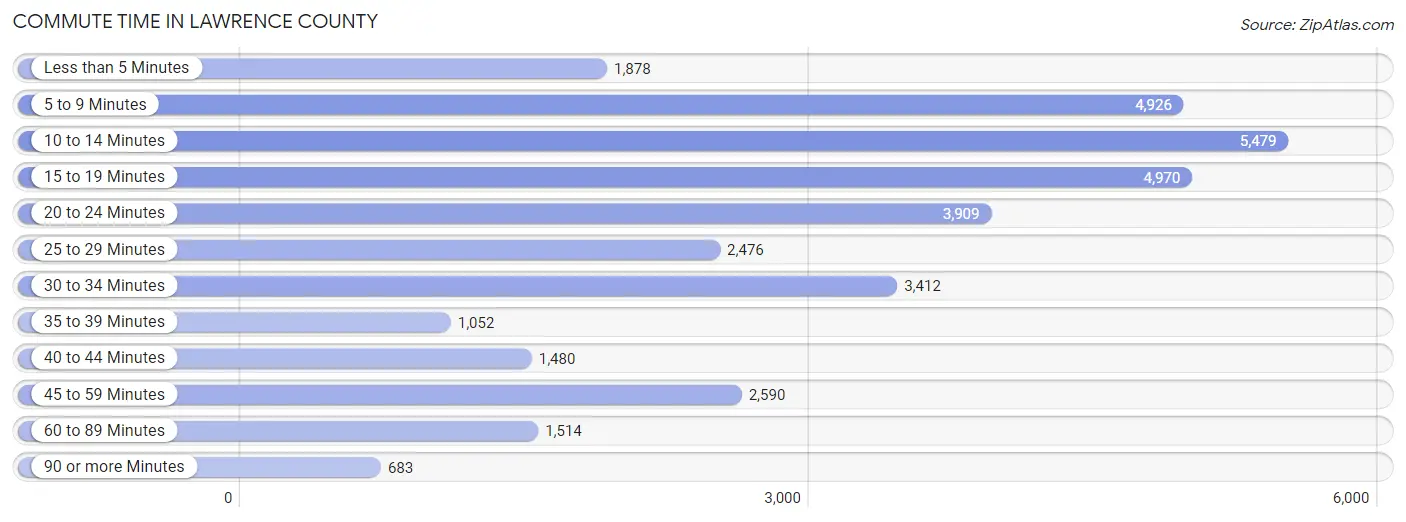
| Commute Time | # Commuters | % Commuters |
| Less than 5 Minutes | 1,878 | 5.5% |
| 5 to 9 Minutes | 4,926 | 14.3% |
| 10 to 14 Minutes | 5,479 | 15.9% |
| 15 to 19 Minutes | 4,970 | 14.5% |
| 20 to 24 Minutes | 3,909 | 11.4% |
| 25 to 29 Minutes | 2,476 | 7.2% |
| 30 to 34 Minutes | 3,412 | 9.9% |
| 35 to 39 Minutes | 1,052 | 3.1% |
| 40 to 44 Minutes | 1,480 | 4.3% |
| 45 to 59 Minutes | 2,590 | 7.5% |
| 60 to 89 Minutes | 1,514 | 4.4% |
| 90 or more Minutes | 683 | 2.0% |
Commute Time by Sex in Lawrence County
The most common commute times in Lawrence County are 10 to 14 minutes (2,832 commuters, 15.4%) for males and 10 to 14 minutes (2,647 commuters, 16.6%) for females.
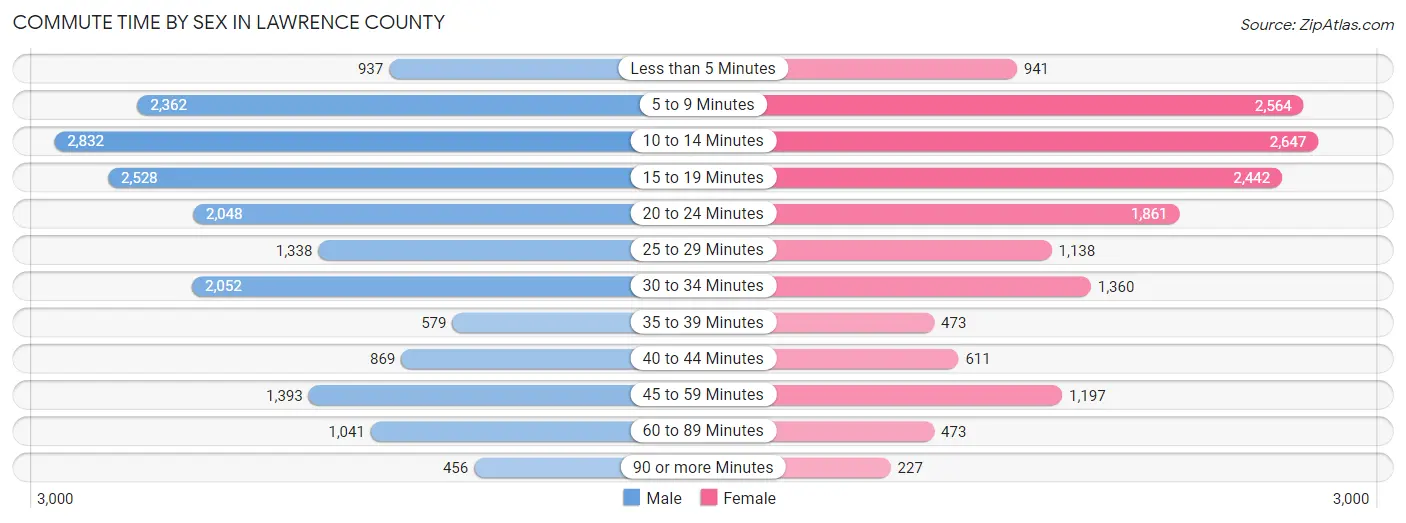
| Commute Time | Male | Female |
| Less than 5 Minutes | 937 (5.1%) | 941 (5.9%) |
| 5 to 9 Minutes | 2,362 (12.8%) | 2,564 (16.1%) |
| 10 to 14 Minutes | 2,832 (15.4%) | 2,647 (16.6%) |
| 15 to 19 Minutes | 2,528 (13.7%) | 2,442 (15.3%) |
| 20 to 24 Minutes | 2,048 (11.1%) | 1,861 (11.7%) |
| 25 to 29 Minutes | 1,338 (7.3%) | 1,138 (7.1%) |
| 30 to 34 Minutes | 2,052 (11.1%) | 1,360 (8.5%) |
| 35 to 39 Minutes | 579 (3.1%) | 473 (3.0%) |
| 40 to 44 Minutes | 869 (4.7%) | 611 (3.8%) |
| 45 to 59 Minutes | 1,393 (7.6%) | 1,197 (7.5%) |
| 60 to 89 Minutes | 1,041 (5.7%) | 473 (3.0%) |
| 90 or more Minutes | 456 (2.5%) | 227 (1.4%) |
Time of Departure to Work by Sex in Lawrence County
The most frequent times of departure to work in Lawrence County are 6:30 AM to 6:59 AM (2,209, 12.0%) for males and 7:30 AM to 7:59 AM (2,522, 15.8%) for females.
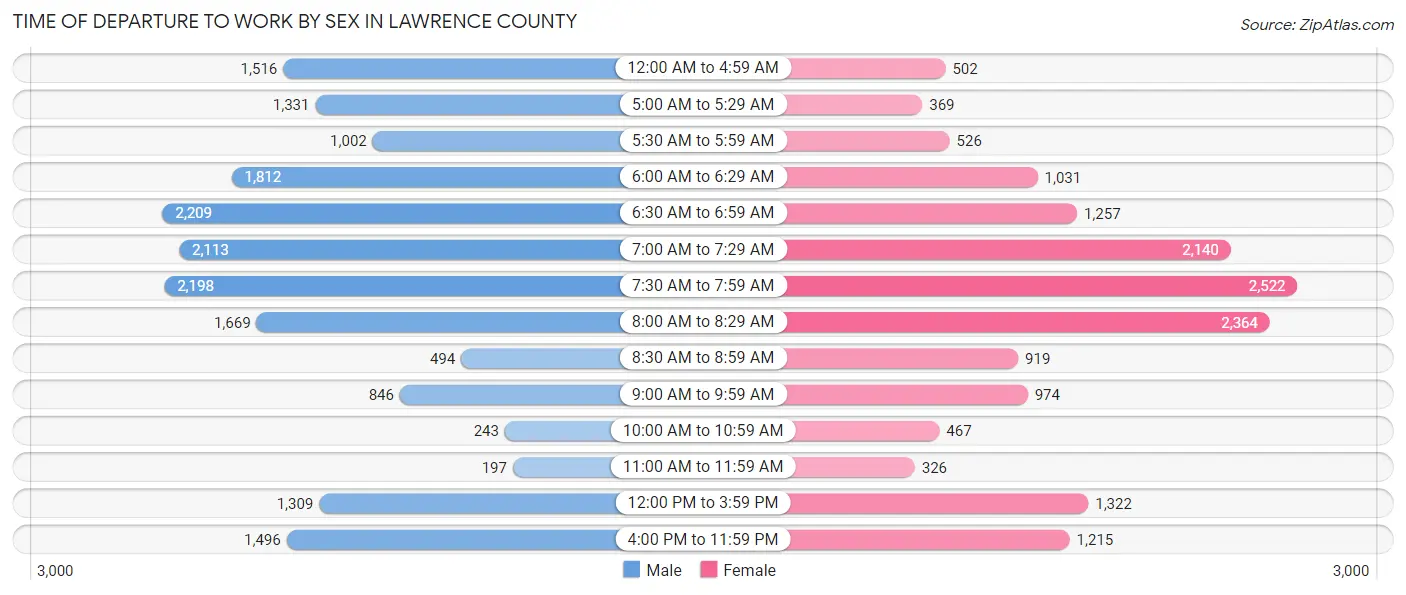
| Time of Departure | Male | Female |
| 12:00 AM to 4:59 AM | 1,516 (8.2%) | 502 (3.2%) |
| 5:00 AM to 5:29 AM | 1,331 (7.2%) | 369 (2.3%) |
| 5:30 AM to 5:59 AM | 1,002 (5.4%) | 526 (3.3%) |
| 6:00 AM to 6:29 AM | 1,812 (9.8%) | 1,031 (6.5%) |
| 6:30 AM to 6:59 AM | 2,209 (12.0%) | 1,257 (7.9%) |
| 7:00 AM to 7:29 AM | 2,113 (11.5%) | 2,140 (13.4%) |
| 7:30 AM to 7:59 AM | 2,198 (11.9%) | 2,522 (15.8%) |
| 8:00 AM to 8:29 AM | 1,669 (9.0%) | 2,364 (14.8%) |
| 8:30 AM to 8:59 AM | 494 (2.7%) | 919 (5.8%) |
| 9:00 AM to 9:59 AM | 846 (4.6%) | 974 (6.1%) |
| 10:00 AM to 10:59 AM | 243 (1.3%) | 467 (2.9%) |
| 11:00 AM to 11:59 AM | 197 (1.1%) | 326 (2.1%) |
| 12:00 PM to 3:59 PM | 1,309 (7.1%) | 1,322 (8.3%) |
| 4:00 PM to 11:59 PM | 1,496 (8.1%) | 1,215 (7.6%) |
| Total | 18,435 (100.0%) | 15,934 (100.0%) |
Housing Occupancy in Lawrence County
Occupancy by Ownership in Lawrence County
Of the total 35,933 dwellings in Lawrence County, owner-occupied units account for 26,785 (74.5%), while renter-occupied units make up 9,148 (25.5%).
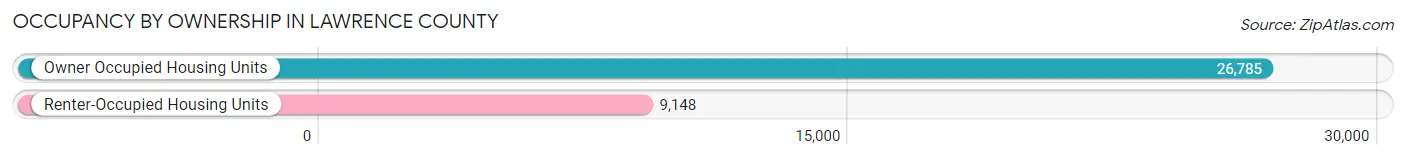
| Occupancy | # Housing Units | % Housing Units |
| Owner Occupied Housing Units | 26,785 | 74.5% |
| Renter-Occupied Housing Units | 9,148 | 25.5% |
| Total Occupied Housing Units | 35,933 | 100.0% |
Occupancy by Household Size in Lawrence County
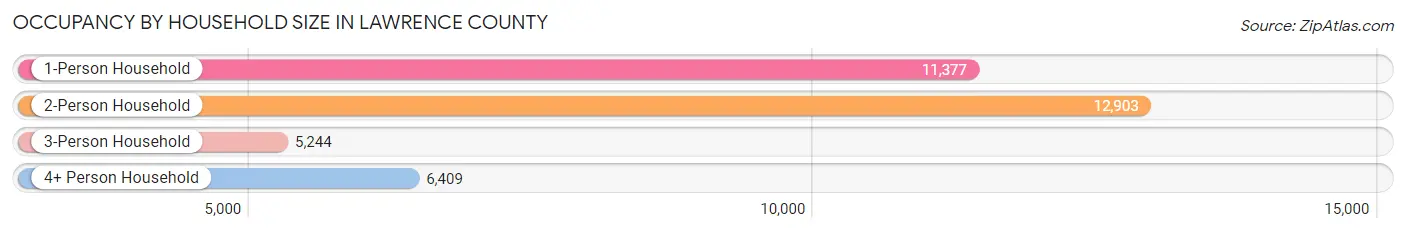
| Household Size | # Housing Units | % Housing Units |
| 1-Person Household | 11,377 | 31.7% |
| 2-Person Household | 12,903 | 35.9% |
| 3-Person Household | 5,244 | 14.6% |
| 4+ Person Household | 6,409 | 17.8% |
| Total Housing Units | 35,933 | 100.0% |
Occupancy by Ownership by Household Size in Lawrence County
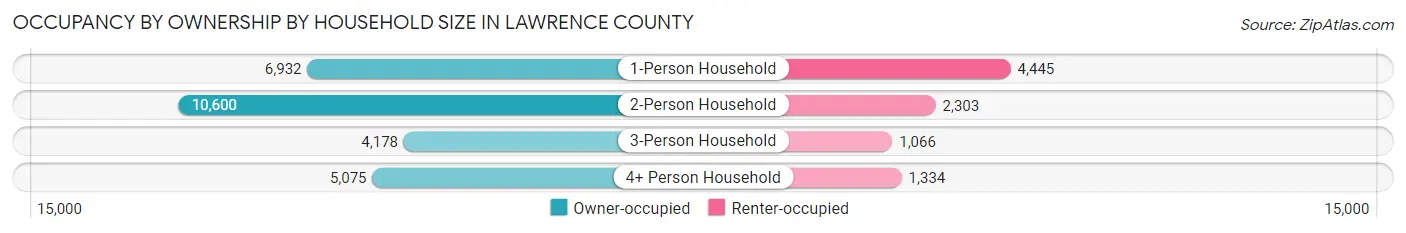
| Household Size | Owner-occupied | Renter-occupied |
| 1-Person Household | 6,932 (60.9%) | 4,445 (39.1%) |
| 2-Person Household | 10,600 (82.2%) | 2,303 (17.8%) |
| 3-Person Household | 4,178 (79.7%) | 1,066 (20.3%) |
| 4+ Person Household | 5,075 (79.2%) | 1,334 (20.8%) |
| Total Housing Units | 26,785 (74.5%) | 9,148 (25.5%) |
Occupancy by Educational Attainment in Lawrence County
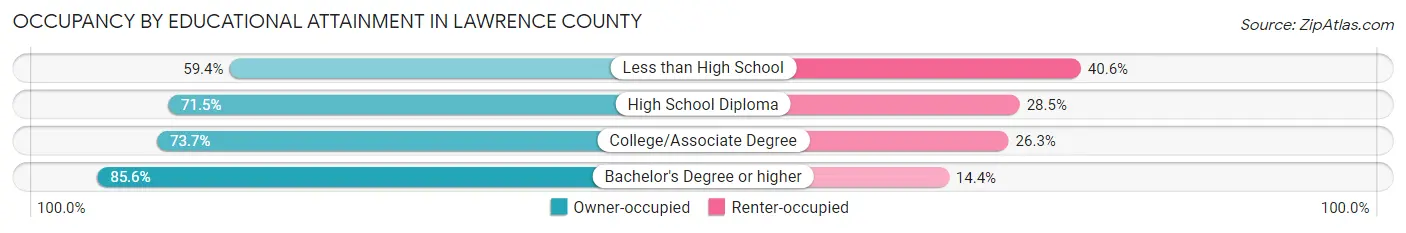
| Household Size | Owner-occupied | Renter-occupied |
| Less than High School | 1,578 (59.4%) | 1,078 (40.6%) |
| High School Diploma | 10,265 (71.5%) | 4,083 (28.5%) |
| College/Associate Degree | 7,825 (73.7%) | 2,788 (26.3%) |
| Bachelor's Degree or higher | 7,117 (85.6%) | 1,199 (14.4%) |
Occupancy by Age of Householder in Lawrence County
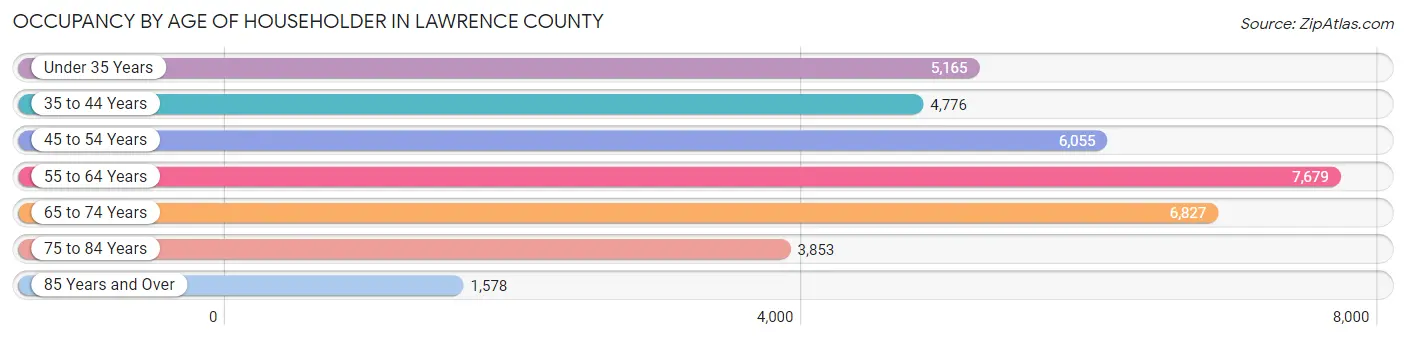
| Age Bracket | # Households | % Households |
| Under 35 Years | 5,165 | 14.4% |
| 35 to 44 Years | 4,776 | 13.3% |
| 45 to 54 Years | 6,055 | 16.9% |
| 55 to 64 Years | 7,679 | 21.4% |
| 65 to 74 Years | 6,827 | 19.0% |
| 75 to 84 Years | 3,853 | 10.7% |
| 85 Years and Over | 1,578 | 4.4% |
| Total | 35,933 | 100.0% |
Housing Finances in Lawrence County
Median Income by Occupancy in Lawrence County
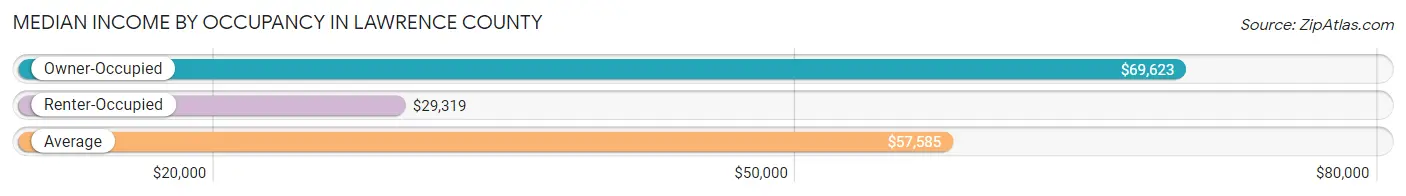
| Occupancy Type | # Households | Median Income |
| Owner-Occupied | 26,785 (74.5%) | $69,623 |
| Renter-Occupied | 9,148 (25.5%) | $29,319 |
| Average | 35,933 (100.0%) | $57,585 |
Occupancy by Householder Income Bracket in Lawrence County
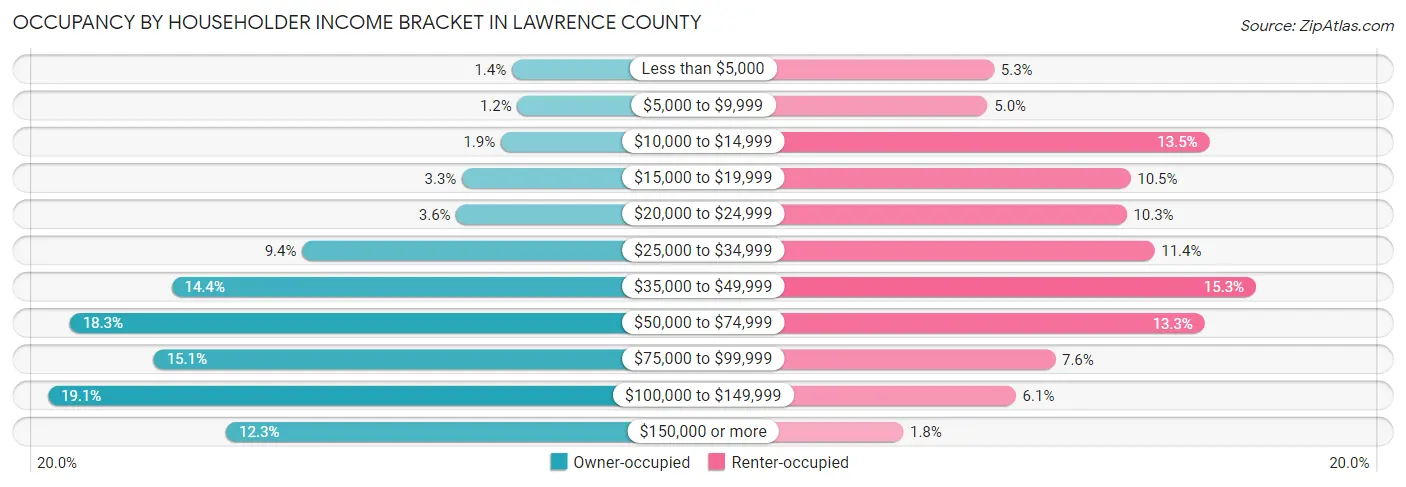
| Income Bracket | Owner-occupied | Renter-occupied |
| Less than $5,000 | 384 (1.4%) | 482 (5.3%) |
| $5,000 to $9,999 | 328 (1.2%) | 459 (5.0%) |
| $10,000 to $14,999 | 496 (1.8%) | 1,233 (13.5%) |
| $15,000 to $19,999 | 891 (3.3%) | 958 (10.5%) |
| $20,000 to $24,999 | 950 (3.5%) | 944 (10.3%) |
| $25,000 to $34,999 | 2,523 (9.4%) | 1,041 (11.4%) |
| $35,000 to $49,999 | 3,858 (14.4%) | 1,395 (15.2%) |
| $50,000 to $74,999 | 4,897 (18.3%) | 1,217 (13.3%) |
| $75,000 to $99,999 | 4,039 (15.1%) | 695 (7.6%) |
| $100,000 to $149,999 | 5,119 (19.1%) | 558 (6.1%) |
| $150,000 or more | 3,300 (12.3%) | 166 (1.8%) |
| Total | 26,785 (100.0%) | 9,148 (100.0%) |
Monthly Housing Cost Tiers in Lawrence County
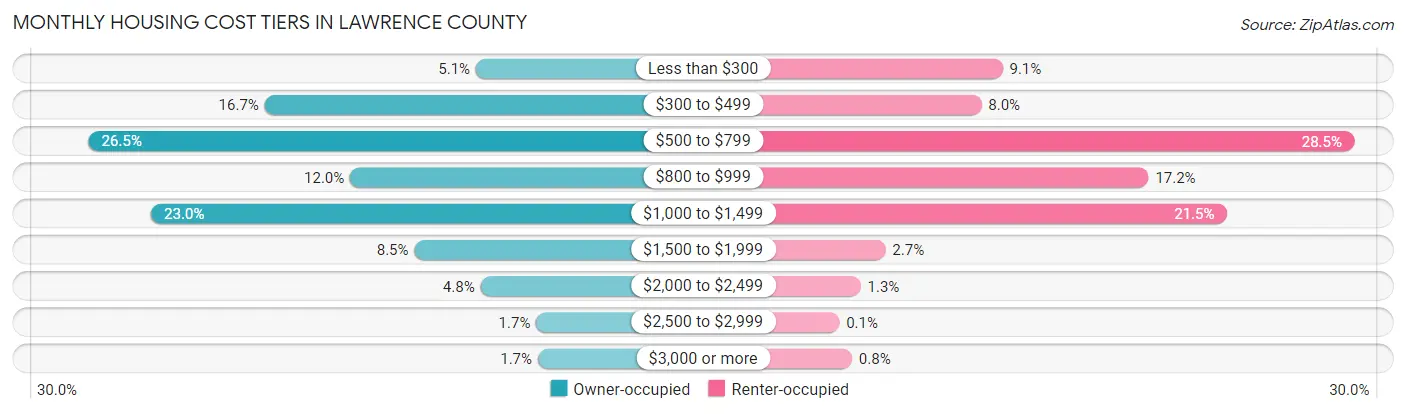
| Monthly Cost | Owner-occupied | Renter-occupied |
| Less than $300 | 1,358 (5.1%) | 834 (9.1%) |
| $300 to $499 | 4,485 (16.7%) | 727 (8.0%) |
| $500 to $799 | 7,091 (26.5%) | 2,609 (28.5%) |
| $800 to $999 | 3,219 (12.0%) | 1,572 (17.2%) |
| $1,000 to $1,499 | 6,163 (23.0%) | 1,965 (21.5%) |
| $1,500 to $1,999 | 2,269 (8.5%) | 242 (2.6%) |
| $2,000 to $2,499 | 1,292 (4.8%) | 117 (1.3%) |
| $2,500 to $2,999 | 465 (1.7%) | 9 (0.1%) |
| $3,000 or more | 443 (1.7%) | 73 (0.8%) |
| Total | 26,785 (100.0%) | 9,148 (100.0%) |
Physical Housing Characteristics in Lawrence County
Housing Structures in Lawrence County
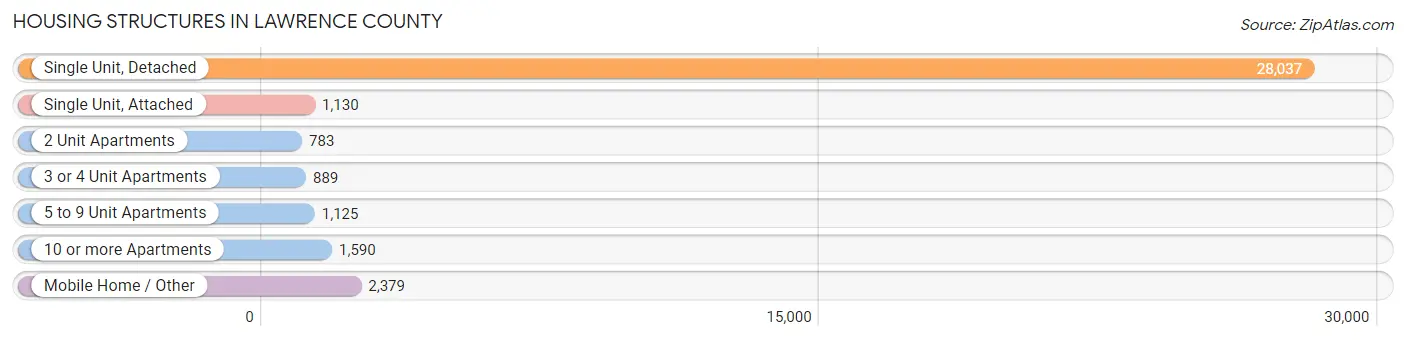
| Structure Type | # Housing Units | % Housing Units |
| Single Unit, Detached | 28,037 | 78.0% |
| Single Unit, Attached | 1,130 | 3.1% |
| 2 Unit Apartments | 783 | 2.2% |
| 3 or 4 Unit Apartments | 889 | 2.5% |
| 5 to 9 Unit Apartments | 1,125 | 3.1% |
| 10 or more Apartments | 1,590 | 4.4% |
| Mobile Home / Other | 2,379 | 6.6% |
| Total | 35,933 | 100.0% |
Housing Structures by Occupancy in Lawrence County
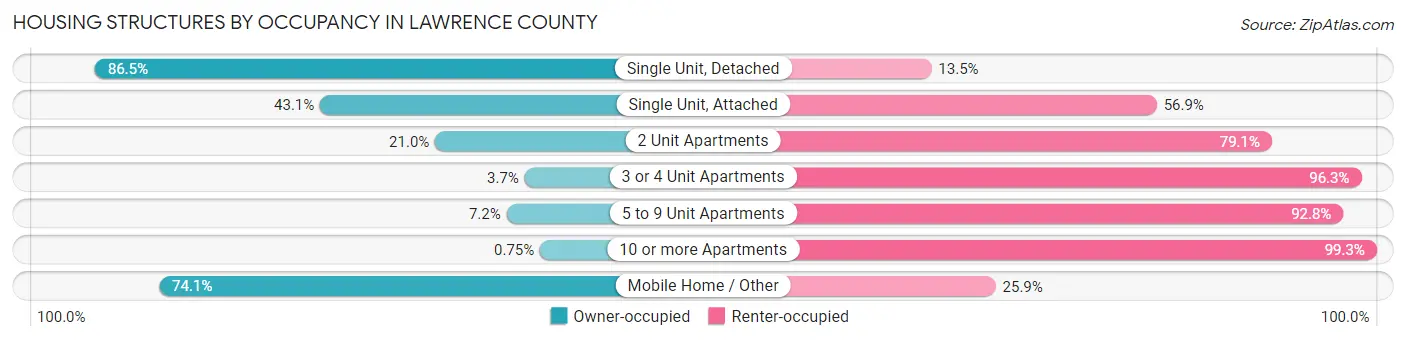
| Structure Type | Owner-occupied | Renter-occupied |
| Single Unit, Detached | 24,245 (86.5%) | 3,792 (13.5%) |
| Single Unit, Attached | 487 (43.1%) | 643 (56.9%) |
| 2 Unit Apartments | 164 (20.9%) | 619 (79.0%) |
| 3 or 4 Unit Apartments | 33 (3.7%) | 856 (96.3%) |
| 5 to 9 Unit Apartments | 81 (7.2%) | 1,044 (92.8%) |
| 10 or more Apartments | 12 (0.7%) | 1,578 (99.3%) |
| Mobile Home / Other | 1,763 (74.1%) | 616 (25.9%) |
| Total | 26,785 (74.5%) | 9,148 (25.5%) |
Housing Structures by Number of Rooms in Lawrence County
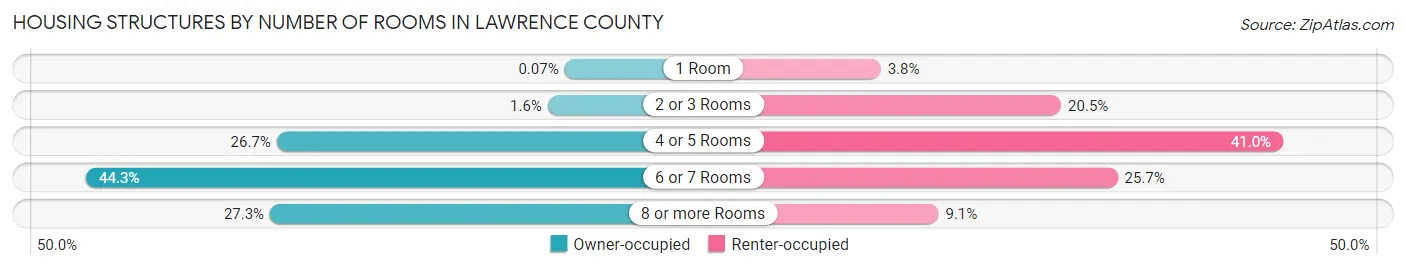
| Number of Rooms | Owner-occupied | Renter-occupied |
| 1 Room | 18 (0.1%) | 345 (3.8%) |
| 2 or 3 Rooms | 435 (1.6%) | 1,872 (20.5%) |
| 4 or 5 Rooms | 7,149 (26.7%) | 3,748 (41.0%) |
| 6 or 7 Rooms | 11,869 (44.3%) | 2,349 (25.7%) |
| 8 or more Rooms | 7,314 (27.3%) | 834 (9.1%) |
| Total | 26,785 (100.0%) | 9,148 (100.0%) |
Housing Structure by Heating Type in Lawrence County
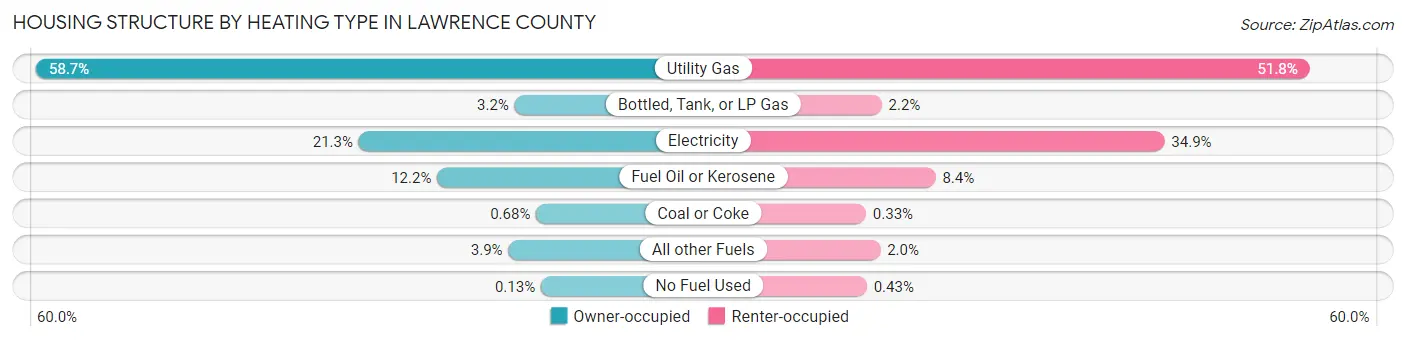
| Heating Type | Owner-occupied | Renter-occupied |
| Utility Gas | 15,721 (58.7%) | 4,736 (51.8%) |
| Bottled, Tank, or LP Gas | 852 (3.2%) | 197 (2.1%) |
| Electricity | 5,693 (21.2%) | 3,196 (34.9%) |
| Fuel Oil or Kerosene | 3,258 (12.2%) | 768 (8.4%) |
| Coal or Coke | 183 (0.7%) | 30 (0.3%) |
| All other Fuels | 1,044 (3.9%) | 182 (2.0%) |
| No Fuel Used | 34 (0.1%) | 39 (0.4%) |
| Total | 26,785 (100.0%) | 9,148 (100.0%) |
Household Vehicle Usage in Lawrence County
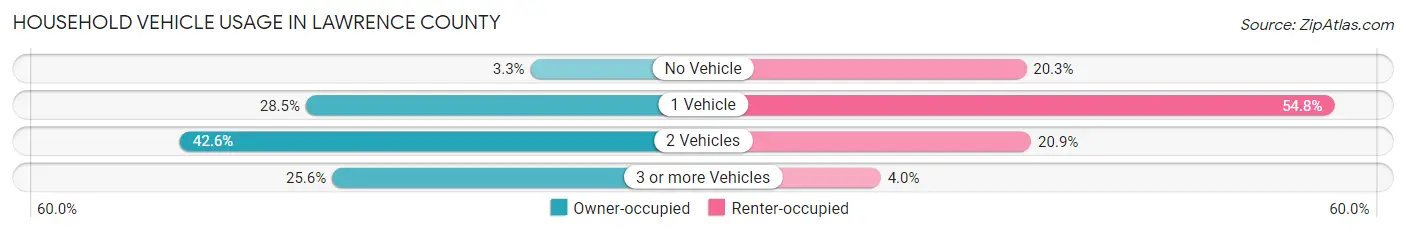
| Vehicles per Household | Owner-occupied | Renter-occupied |
| No Vehicle | 894 (3.3%) | 1,859 (20.3%) |
| 1 Vehicle | 7,635 (28.5%) | 5,014 (54.8%) |
| 2 Vehicles | 11,411 (42.6%) | 1,908 (20.9%) |
| 3 or more Vehicles | 6,845 (25.6%) | 367 (4.0%) |
| Total | 26,785 (100.0%) | 9,148 (100.0%) |
Real Estate & Mortgages in Lawrence County
Real Estate and Mortgage Overview in Lawrence County
| Characteristic | Without Mortgage | With Mortgage |
| Housing Units | 12,584 | 14,201 |
| Median Property Value | $113,100 | $144,600 |
| Median Household Income | $50,000 | $2,352 |
| Monthly Housing Costs | $522 | $436 |
| Real Estate Taxes | $1,705 | $126 |
Property Value by Mortgage Status in Lawrence County
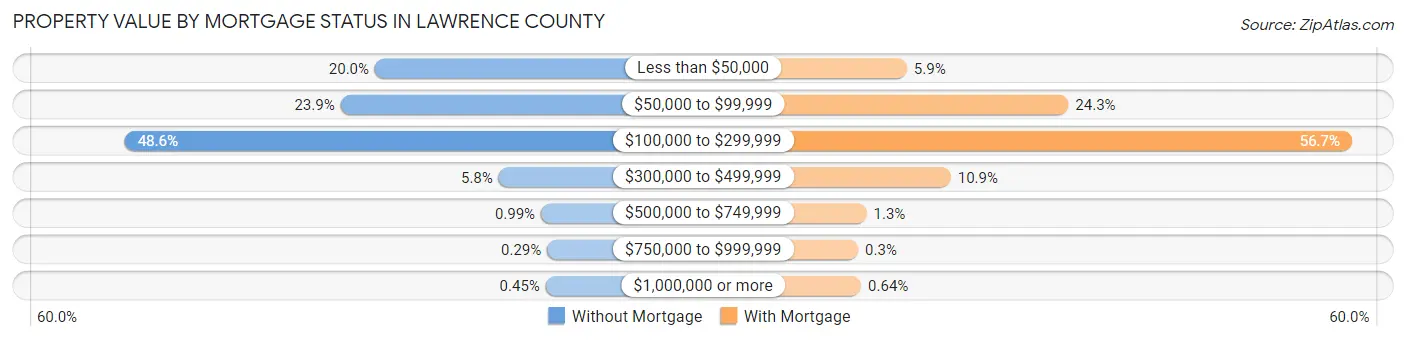
| Property Value | Without Mortgage | With Mortgage |
| Less than $50,000 | 2,513 (20.0%) | 834 (5.9%) |
| $50,000 to $99,999 | 3,008 (23.9%) | 3,455 (24.3%) |
| $100,000 to $299,999 | 6,110 (48.5%) | 8,054 (56.7%) |
| $300,000 to $499,999 | 734 (5.8%) | 1,546 (10.9%) |
| $500,000 to $749,999 | 125 (1.0%) | 179 (1.3%) |
| $750,000 to $999,999 | 37 (0.3%) | 42 (0.3%) |
| $1,000,000 or more | 57 (0.4%) | 91 (0.6%) |
| Total | 12,584 (100.0%) | 14,201 (100.0%) |
Household Income by Mortgage Status in Lawrence County
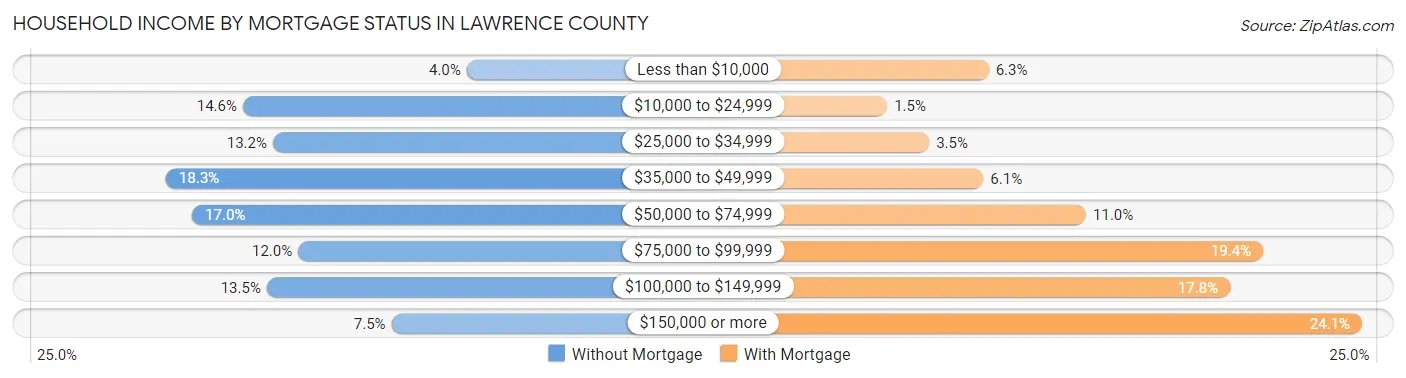
| Household Income | Without Mortgage | With Mortgage |
| Less than $10,000 | 497 (4.0%) | 900 (6.3%) |
| $10,000 to $24,999 | 1,838 (14.6%) | 215 (1.5%) |
| $25,000 to $34,999 | 1,658 (13.2%) | 499 (3.5%) |
| $35,000 to $49,999 | 2,299 (18.3%) | 865 (6.1%) |
| $50,000 to $74,999 | 2,142 (17.0%) | 1,559 (11.0%) |
| $75,000 to $99,999 | 1,507 (12.0%) | 2,755 (19.4%) |
| $100,000 to $149,999 | 1,695 (13.5%) | 2,532 (17.8%) |
| $150,000 or more | 948 (7.5%) | 3,424 (24.1%) |
| Total | 12,584 (100.0%) | 14,201 (100.0%) |
Property Value to Household Income Ratio in Lawrence County
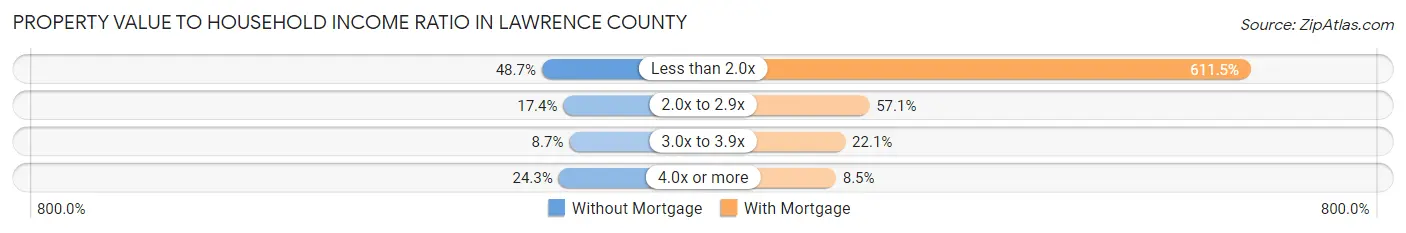
| Value-to-Income Ratio | Without Mortgage | With Mortgage |
| Less than 2.0x | 6,125 (48.7%) | 86,839 (611.5%) |
| 2.0x to 2.9x | 2,186 (17.4%) | 8,115 (57.1%) |
| 3.0x to 3.9x | 1,092 (8.7%) | 3,142 (22.1%) |
| 4.0x or more | 3,056 (24.3%) | 1,207 (8.5%) |
| Total | 12,584 (100.0%) | 14,201 (100.0%) |
Real Estate Taxes by Mortgage Status in Lawrence County
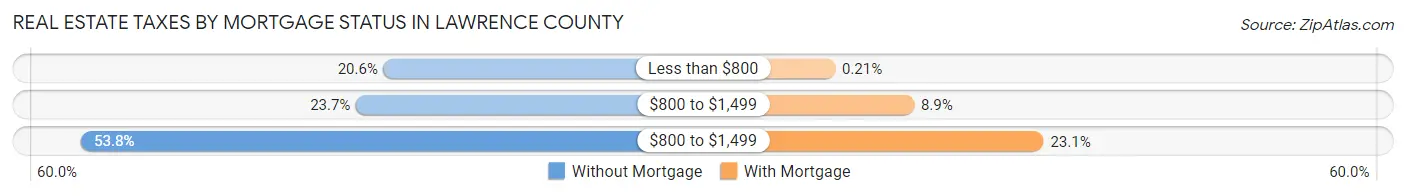
| Property Taxes | Without Mortgage | With Mortgage |
| Less than $800 | 2,597 (20.6%) | 30 (0.2%) |
| $800 to $1,499 | 2,978 (23.7%) | 1,259 (8.9%) |
| $800 to $1,499 | 6,770 (53.8%) | 3,275 (23.1%) |
| Total | 12,584 (100.0%) | 14,201 (100.0%) |
Health & Disability in Lawrence County
Health Insurance Coverage by Age in Lawrence County
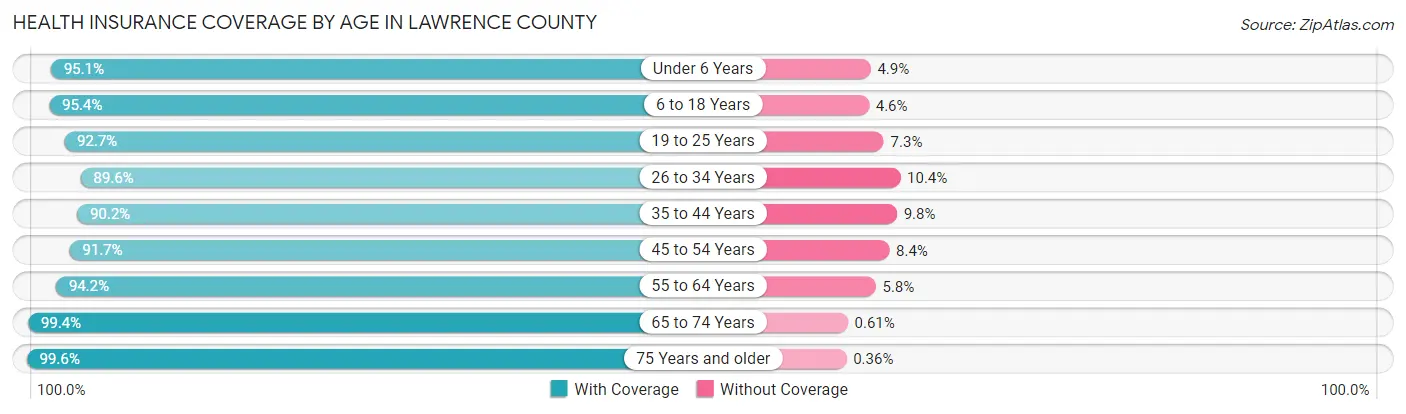
| Age Bracket | With Coverage | Without Coverage |
| Under 6 Years | 4,975 (95.1%) | 255 (4.9%) |
| 6 to 18 Years | 12,390 (95.4%) | 594 (4.6%) |
| 19 to 25 Years | 6,328 (92.7%) | 501 (7.3%) |
| 26 to 34 Years | 7,575 (89.6%) | 880 (10.4%) |
| 35 to 44 Years | 8,335 (90.2%) | 902 (9.8%) |
| 45 to 54 Years | 9,737 (91.6%) | 887 (8.4%) |
| 55 to 64 Years | 12,172 (94.2%) | 753 (5.8%) |
| 65 to 74 Years | 10,823 (99.4%) | 66 (0.6%) |
| 75 Years and older | 7,800 (99.6%) | 28 (0.4%) |
| Total | 80,135 (94.3%) | 4,866 (5.7%) |
Health Insurance Coverage by Citizenship Status in Lawrence County
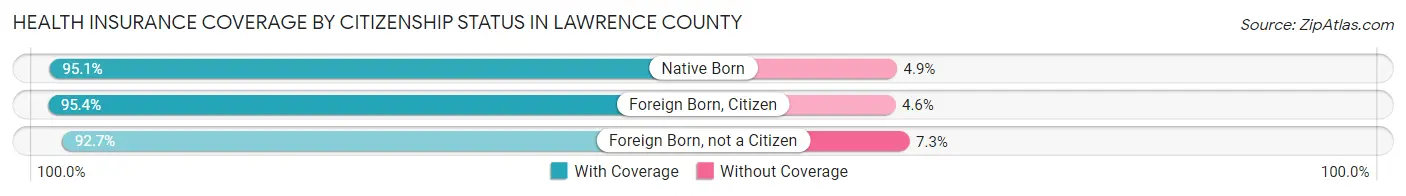
| Citizenship Status | With Coverage | Without Coverage |
| Native Born | 4,975 (95.1%) | 255 (4.9%) |
| Foreign Born, Citizen | 12,390 (95.4%) | 594 (4.6%) |
| Foreign Born, not a Citizen | 6,328 (92.7%) | 501 (7.3%) |
Health Insurance Coverage by Household Income in Lawrence County
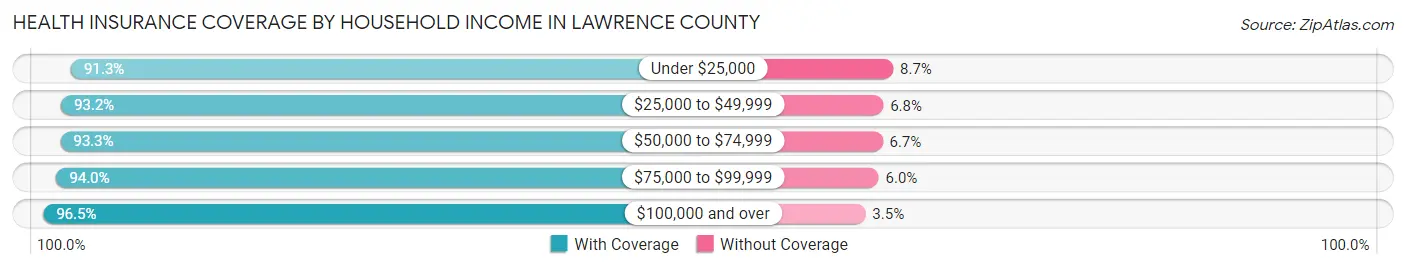
| Household Income | With Coverage | Without Coverage |
| Under $25,000 | 9,785 (91.3%) | 930 (8.7%) |
| $25,000 to $49,999 | 16,370 (93.2%) | 1,198 (6.8%) |
| $50,000 to $74,999 | 13,647 (93.3%) | 978 (6.7%) |
| $75,000 to $99,999 | 11,732 (94.0%) | 743 (6.0%) |
| $100,000 and over | 27,355 (96.5%) | 990 (3.5%) |
Public vs Private Health Insurance Coverage by Age in Lawrence County
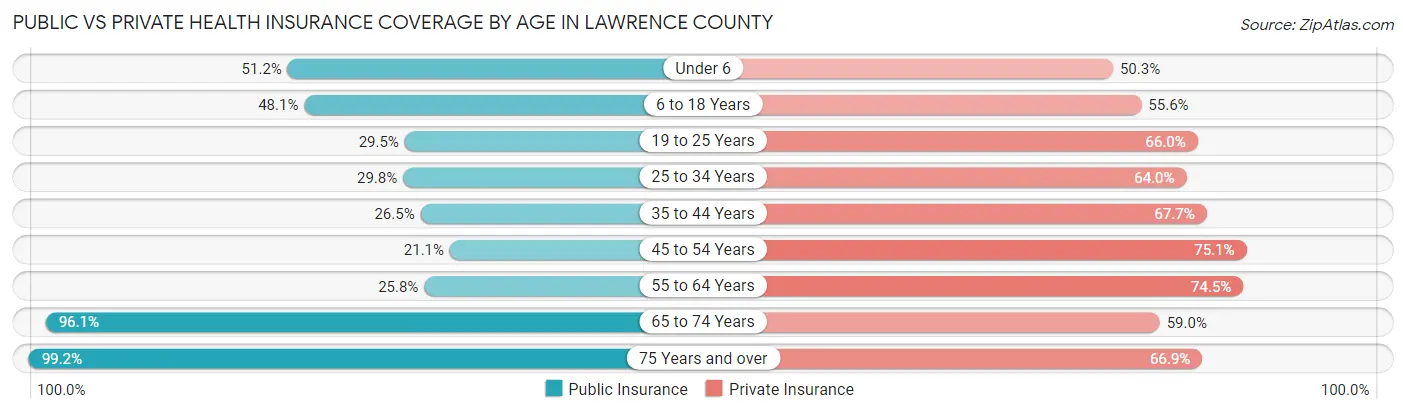
| Age Bracket | Public Insurance | Private Insurance |
| Under 6 | 2,676 (51.2%) | 2,633 (50.3%) |
| 6 to 18 Years | 6,245 (48.1%) | 7,221 (55.6%) |
| 19 to 25 Years | 2,011 (29.4%) | 4,510 (66.0%) |
| 25 to 34 Years | 2,515 (29.7%) | 5,407 (63.9%) |
| 35 to 44 Years | 2,450 (26.5%) | 6,254 (67.7%) |
| 45 to 54 Years | 2,239 (21.1%) | 7,975 (75.1%) |
| 55 to 64 Years | 3,338 (25.8%) | 9,628 (74.5%) |
| 65 to 74 Years | 10,462 (96.1%) | 6,426 (59.0%) |
| 75 Years and over | 7,768 (99.2%) | 5,235 (66.9%) |
| Total | 39,704 (46.7%) | 55,289 (65.0%) |
Disability Status by Sex by Age in Lawrence County
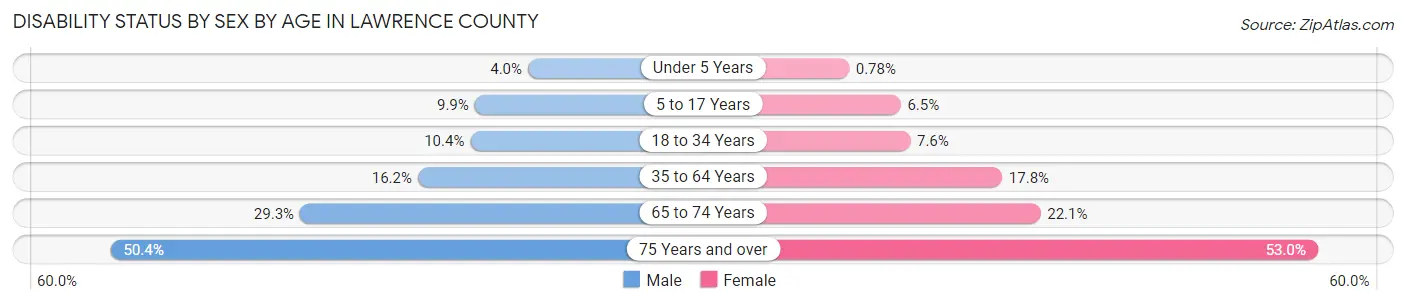
| Age Bracket | Male | Female |
| Under 5 Years | 86 (4.0%) | 17 (0.8%) |
| 5 to 17 Years | 632 (9.9%) | 413 (6.5%) |
| 18 to 34 Years | 878 (10.4%) | 604 (7.6%) |
| 35 to 64 Years | 2,625 (16.2%) | 2,957 (17.8%) |
| 65 to 74 Years | 1,503 (29.3%) | 1,275 (22.1%) |
| 75 Years and over | 1,571 (50.4%) | 2,498 (53.0%) |
Disability Class by Sex by Age in Lawrence County
Disability Class: Hearing Difficulty
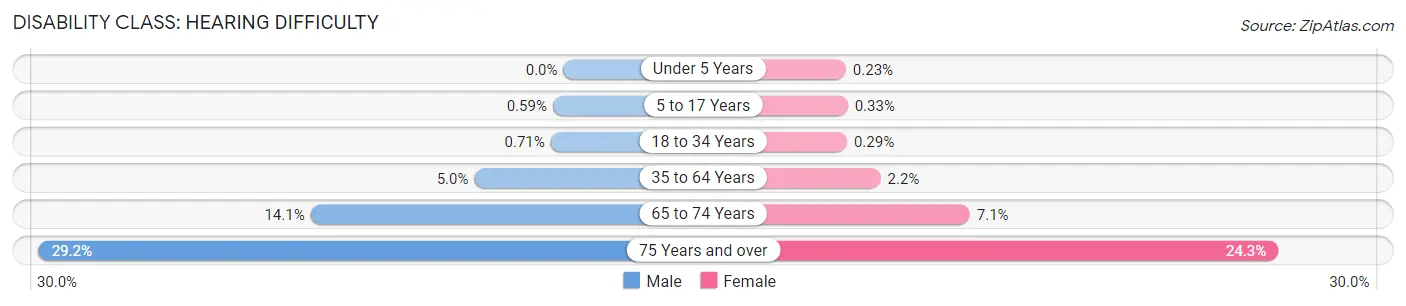
| Age Bracket | Male | Female |
| Under 5 Years | 0 (0.0%) | 5 (0.2%) |
| 5 to 17 Years | 38 (0.6%) | 21 (0.3%) |
| 18 to 34 Years | 60 (0.7%) | 23 (0.3%) |
| 35 to 64 Years | 803 (5.0%) | 358 (2.2%) |
| 65 to 74 Years | 721 (14.1%) | 411 (7.1%) |
| 75 Years and over | 910 (29.2%) | 1,145 (24.3%) |
Disability Class: Vision Difficulty
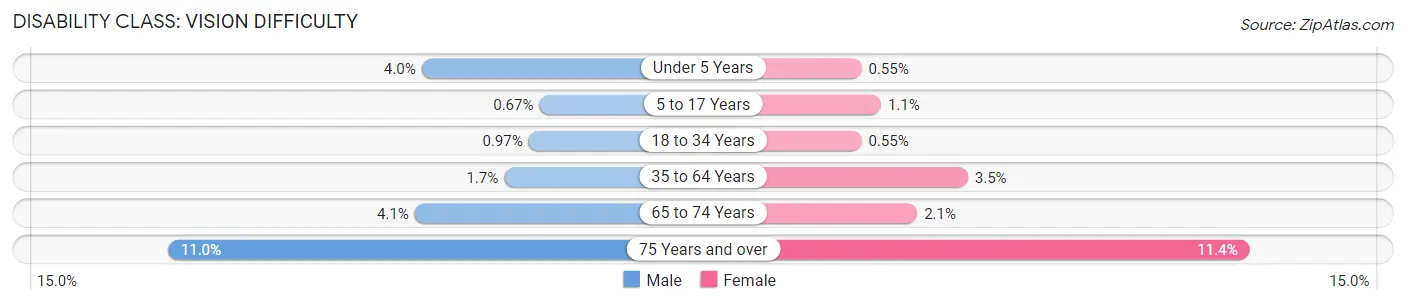
| Age Bracket | Male | Female |
| Under 5 Years | 86 (4.0%) | 12 (0.5%) |
| 5 to 17 Years | 43 (0.7%) | 69 (1.1%) |
| 18 to 34 Years | 82 (1.0%) | 44 (0.5%) |
| 35 to 64 Years | 267 (1.7%) | 582 (3.5%) |
| 65 to 74 Years | 212 (4.1%) | 121 (2.1%) |
| 75 Years and over | 343 (11.0%) | 535 (11.4%) |
Disability Class: Cognitive Difficulty
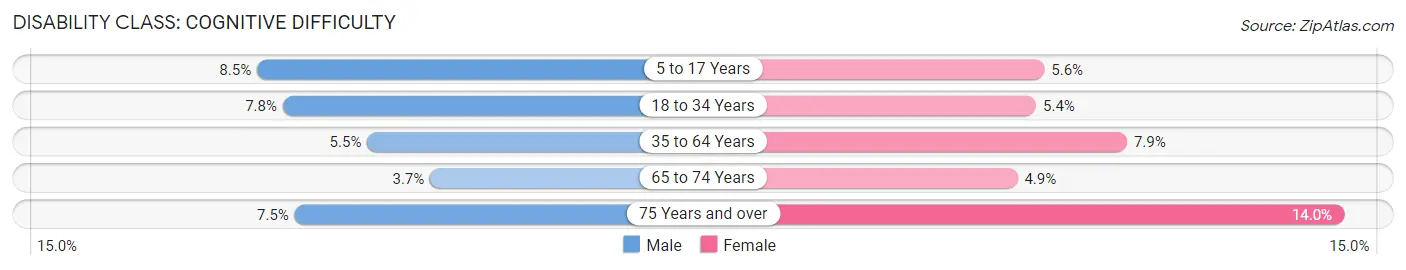
| Age Bracket | Male | Female |
| 5 to 17 Years | 546 (8.5%) | 357 (5.6%) |
| 18 to 34 Years | 661 (7.8%) | 430 (5.4%) |
| 35 to 64 Years | 885 (5.5%) | 1,317 (7.9%) |
| 65 to 74 Years | 190 (3.7%) | 282 (4.9%) |
| 75 Years and over | 233 (7.5%) | 659 (14.0%) |
Disability Class: Ambulatory Difficulty
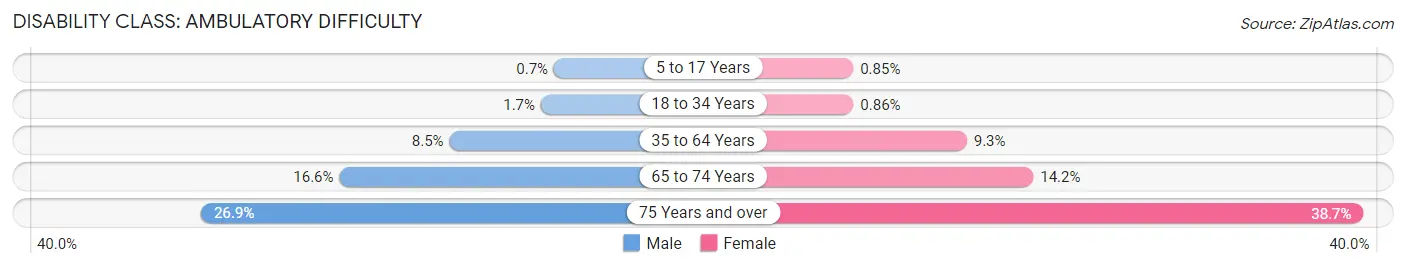
| Age Bracket | Male | Female |
| 5 to 17 Years | 45 (0.7%) | 54 (0.9%) |
| 18 to 34 Years | 141 (1.7%) | 68 (0.9%) |
| 35 to 64 Years | 1,370 (8.5%) | 1,539 (9.3%) |
| 65 to 74 Years | 852 (16.6%) | 820 (14.2%) |
| 75 Years and over | 838 (26.9%) | 1,825 (38.7%) |
Disability Class: Self-Care Difficulty
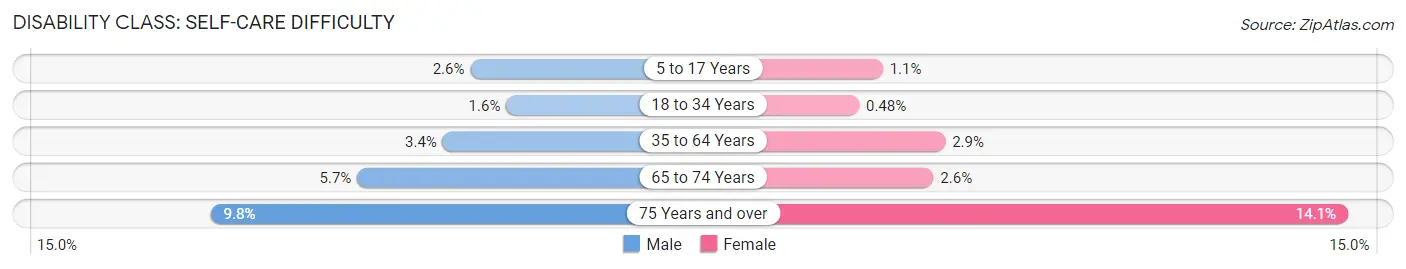
| Age Bracket | Male | Female |
| 5 to 17 Years | 166 (2.6%) | 72 (1.1%) |
| 18 to 34 Years | 135 (1.6%) | 38 (0.5%) |
| 35 to 64 Years | 544 (3.4%) | 477 (2.9%) |
| 65 to 74 Years | 294 (5.7%) | 147 (2.5%) |
| 75 Years and over | 306 (9.8%) | 664 (14.1%) |
Technology Access in Lawrence County
Computing Device Access in Lawrence County
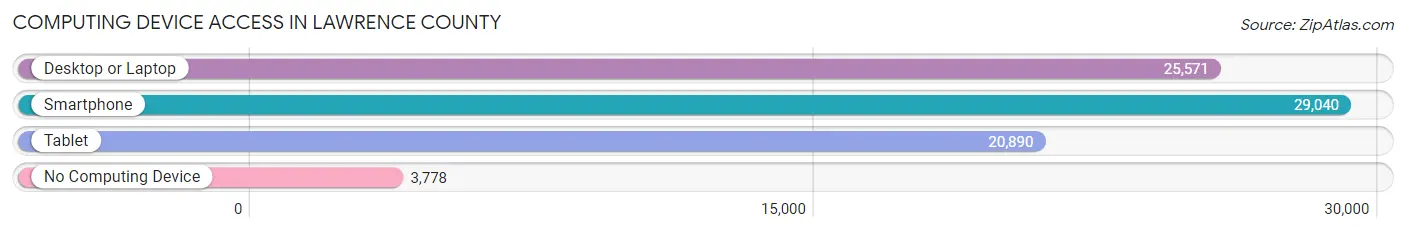
| Device Type | # Households | % Households |
| Desktop or Laptop | 25,571 | 71.2% |
| Smartphone | 29,040 | 80.8% |
| Tablet | 20,890 | 58.1% |
| No Computing Device | 3,778 | 10.5% |
| Total | 35,933 | 100.0% |
Internet Access in Lawrence County
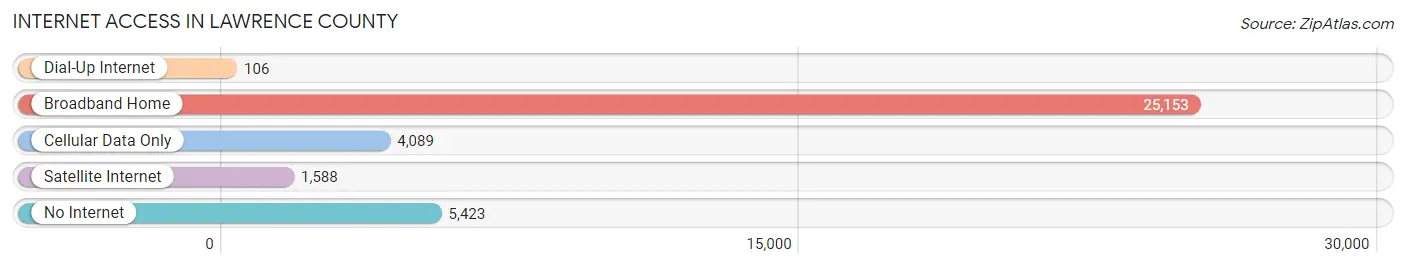
| Internet Type | # Households | % Households |
| Dial-Up Internet | 106 | 0.3% |
| Broadband Home | 25,153 | 70.0% |
| Cellular Data Only | 4,089 | 11.4% |
| Satellite Internet | 1,588 | 4.4% |
| No Internet | 5,423 | 15.1% |
| Total | 35,933 | 100.0% |
Lawrence County Summary
Lawrence County, Pennsylvania is located in the southwestern corner of the state, and is part of the Pittsburgh metropolitan area. It is bordered by Beaver County to the north, Butler County to the east, and Mercer County to the south. The county seat is New Castle, and the county is named for Captain James Lawrence, a naval hero of the War of 1812.
Geography
Lawrence County is located in the southwestern corner of Pennsylvania, and is part of the Pittsburgh metropolitan area. It is bordered by Beaver County to the north, Butler County to the east, and Mercer County to the south. The county is mostly rural, with rolling hills and valleys. The Mahoning River runs through the county, and there are several small lakes and ponds. The county is home to Moraine State Park, which is a popular destination for outdoor recreation.
The total area of Lawrence County is 437 square miles, of which 434 square miles is land and 3 square miles is water. The county has a population of 91,108, with a population density of 209 people per square mile.
Economy
Lawrence County has a diverse economy, with a mix of manufacturing, agriculture, and service industries. The county is home to several large employers, including the Lawrence County Courthouse, the New Castle School District, and the Ellwood City Medical Center. The county is also home to several manufacturing companies, including Ellwood City Forge, which produces steel products, and the New Castle Foundry, which produces cast iron products.
Agriculture is also an important part of the county's economy. The county is home to several large farms, and the county produces a variety of crops, including corn, soybeans, wheat, and hay. Livestock production is also important, with the county producing beef, pork, and poultry.
Demographics
As of the 2010 census, the population of Lawrence County was 91,108. The racial makeup of the county was 95.3% White, 2.3% African American, 0.3% Native American, 0.5% Asian, 0.1% Pacific Islander, 0.6% from other races, and 0.9% from two or more races. Hispanic or Latino of any race were 1.7% of the population.
The median household income in Lawrence County was $41,945, and the median family income was $50,945. The per capita income was $20,945. About 11.3% of the population was below the poverty line.
The largest cities in Lawrence County are New Castle, Ellwood City, and New Beaver. The county is served by the New Castle Area School District, the Ellwood City Area School District, and the New Beaver Area School District. The county is also home to several colleges and universities, including Slippery Rock University, Geneva College, and the University of Pittsburgh at Bradford.
Common Questions
What is Per Capita Income in Lawrence County?
Per Capita income in Lawrence County is $32,319.
What is the Median Family Income in Lawrence County?
Median Family Income in Lawrence County is $76,710.
What is the Median Household income in Lawrence County?
Median Household Income in Lawrence County is $57,585.
What is Income or Wage Gap in Lawrence County?
Income or Wage Gap in Lawrence County is 31.2%.
Women in Lawrence County earn 68.8 cents for every dollar earned by a man.
What is Family Income Deficit in Lawrence County?
Family Income Deficit in Lawrence County is $10,209.
Families that are below poverty line in Lawrence County earn $10,209 less on average than the poverty threshold level.
What is Inequality or Gini Index in Lawrence County?
Inequality or Gini Index in Lawrence County is 0.44.
What is the Total Population of Lawrence County?
Total Population of Lawrence County is 85,907.
What is the Total Male Population of Lawrence County?
Total Male Population of Lawrence County is 41,879.
What is the Total Female Population of Lawrence County?
Total Female Population of Lawrence County is 44,028.
What is the Ratio of Males per 100 Females in Lawrence County?
There are 95.12 Males per 100 Females in Lawrence County.
What is the Ratio of Females per 100 Males in Lawrence County?
There are 105.13 Females per 100 Males in Lawrence County.
What is the Median Population Age in Lawrence County?
Median Population Age in Lawrence County is 45.0 Years.
What is the Average Family Size in Lawrence County
Average Family Size in Lawrence County is 2.9 People.
What is the Average Household Size in Lawrence County
Average Household Size in Lawrence County is 2.3 People.
How Large is the Labor Force in Lawrence County?
There are 41,695 People in the Labor Forcein in Lawrence County.
What is the Percentage of People in the Labor Force in Lawrence County?
58.7% of People are in the Labor Force in Lawrence County.
What is the Unemployment Rate in Lawrence County?
Unemployment Rate in Lawrence County is 6.8%.