Indiana County, PA Map & Demographics
Indiana County Map
Indiana County Overview
$30,494
PER CAPITA INCOME
$78,873
AVG FAMILY INCOME
$57,170
AVG HOUSEHOLD INCOME
46.5%
WAGE / INCOME GAP [ % ]
53.5¢/ $1
WAGE / INCOME GAP [ $ ]
$10,759
FAMILY INCOME DEFICIT
0.45
INEQUALITY / GINI INDEX
83,394
TOTAL POPULATION
41,593
MALE POPULATION
41,801
FEMALE POPULATION
99.50
MALES / 100 FEMALES
100.50
FEMALES / 100 MALES
39.6
MEDIAN AGE
3.1
AVG FAMILY SIZE
2.4
AVG HOUSEHOLD SIZE
39,122
LABOR FORCE [ PEOPLE ]
55.6%
PERCENT IN LABOR FORCE
6.5%
UNEMPLOYMENT RATE
Income in Indiana County
Income Overview in Indiana County
Per Capita Income in Indiana County is $30,494, while median incomes of families and households are $78,873 and $57,170 respectively.
| Characteristic | Number | Measure |
| Per Capita Income | 83,394 | $30,494 |
| Median Family Income | 19,462 | $78,873 |
| Mean Family Income | 19,462 | $93,819 |
| Median Household Income | 32,285 | $57,170 |
| Mean Household Income | 32,285 | $75,448 |
| Income Deficit | 19,462 | $10,759 |
| Wage / Income Gap (%) | 83,394 | 46.50% |
| Wage / Income Gap ($) | 83,394 | 53.50¢ per $1 |
| Gini / Inequality Index | 83,394 | 0.45 |
Earnings by Sex in Indiana County
Average Earnings in Indiana County are $29,442, $39,770 for men and $21,277 for women, a difference of 46.5%.
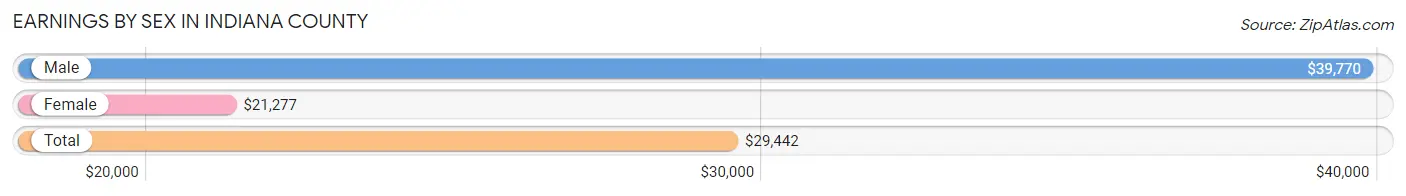
| Sex | Number | Average Earnings |
| Male | 22,759 (52.2%) | $39,770 |
| Female | 20,818 (47.8%) | $21,277 |
| Total | 43,577 (100.0%) | $29,442 |
Earnings by Sex by Income Bracket in Indiana County
The most common earnings brackets in Indiana County are $75,000 to $99,999 for men (2,595 | 11.4%) and $2,499 or less for women (2,325 | 11.2%).
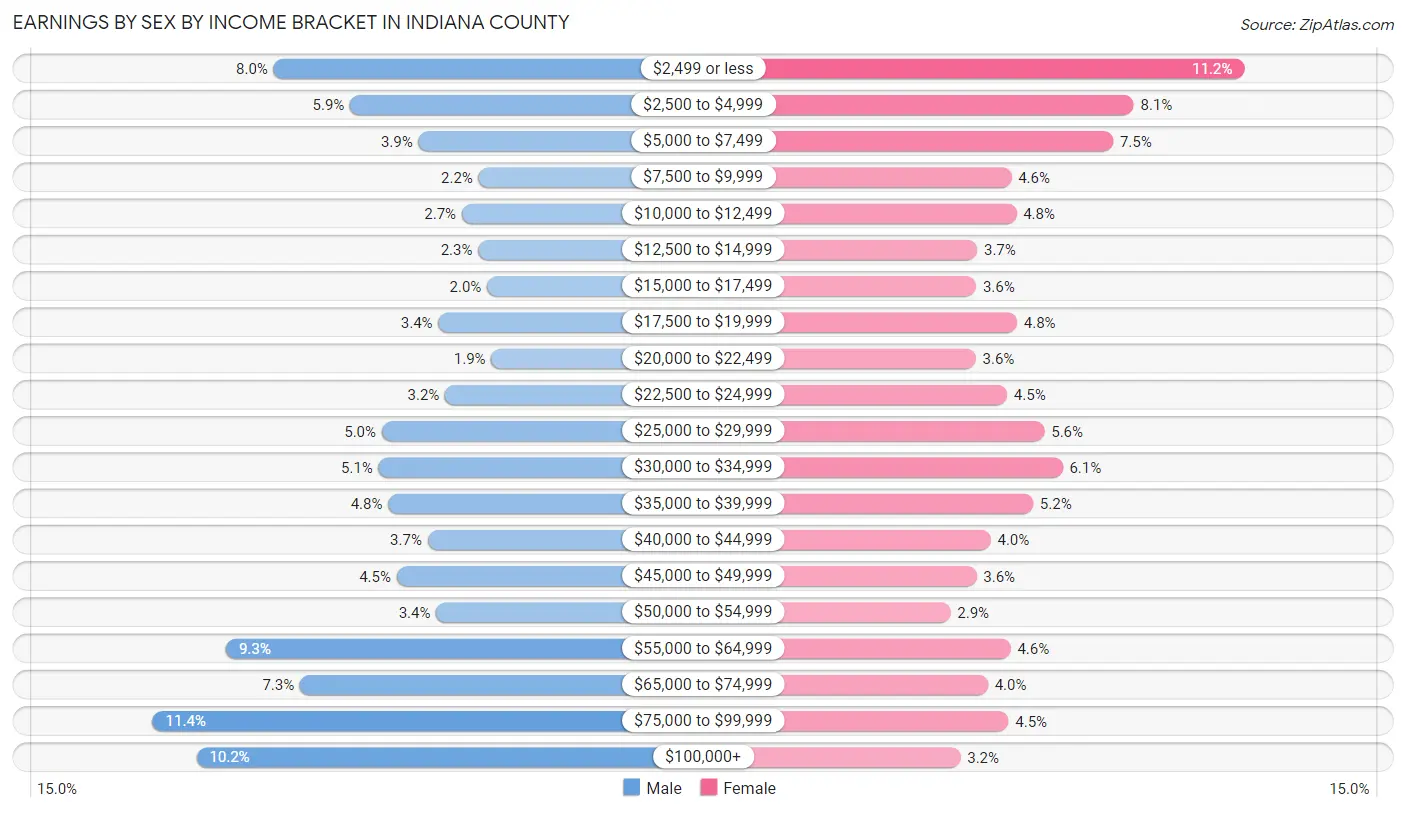
| Income | Male | Female |
| $2,499 or less | 1,821 (8.0%) | 2,325 (11.2%) |
| $2,500 to $4,999 | 1,331 (5.9%) | 1,677 (8.1%) |
| $5,000 to $7,499 | 894 (3.9%) | 1,557 (7.5%) |
| $7,500 to $9,999 | 510 (2.2%) | 962 (4.6%) |
| $10,000 to $12,499 | 617 (2.7%) | 991 (4.8%) |
| $12,500 to $14,999 | 512 (2.2%) | 762 (3.7%) |
| $15,000 to $17,499 | 455 (2.0%) | 755 (3.6%) |
| $17,500 to $19,999 | 766 (3.4%) | 995 (4.8%) |
| $20,000 to $22,499 | 428 (1.9%) | 754 (3.6%) |
| $22,500 to $24,999 | 723 (3.2%) | 936 (4.5%) |
| $25,000 to $29,999 | 1,128 (5.0%) | 1,156 (5.6%) |
| $30,000 to $34,999 | 1,150 (5.1%) | 1,262 (6.1%) |
| $35,000 to $39,999 | 1,088 (4.8%) | 1,089 (5.2%) |
| $40,000 to $44,999 | 835 (3.7%) | 842 (4.0%) |
| $45,000 to $49,999 | 1,033 (4.5%) | 758 (3.6%) |
| $50,000 to $54,999 | 780 (3.4%) | 606 (2.9%) |
| $55,000 to $64,999 | 2,126 (9.3%) | 957 (4.6%) |
| $65,000 to $74,999 | 1,652 (7.3%) | 824 (4.0%) |
| $75,000 to $99,999 | 2,595 (11.4%) | 946 (4.5%) |
| $100,000+ | 2,315 (10.2%) | 664 (3.2%) |
| Total | 22,759 (100.0%) | 20,818 (100.0%) |
Earnings by Sex by Educational Attainment in Indiana County
Average earnings in Indiana County are $53,642 for men and $31,221 for women, a difference of 41.8%. Men with an educational attainment of graduate degree enjoy the highest average annual earnings of $66,583, while those with less than high school education earn the least with $39,345. Women with an educational attainment of graduate degree earn the most with the average annual earnings of $59,394, while those with less than high school education have the smallest earnings of $19,142.
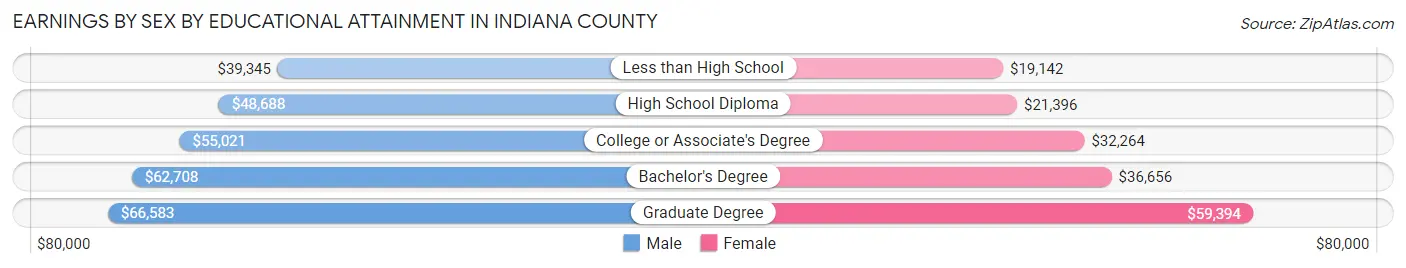
| Educational Attainment | Male Income | Female Income |
| Less than High School | $39,345 | $19,142 |
| High School Diploma | $48,688 | $21,396 |
| College or Associate's Degree | $55,021 | $32,264 |
| Bachelor's Degree | $62,708 | $36,656 |
| Graduate Degree | $66,583 | $59,394 |
| Total | $53,642 | $31,221 |
Family Income in Indiana County
Family Income Brackets in Indiana County
According to the Indiana County family income data, there are 3,990 families falling into the $100,000 to $149,999 income range, which is the most common income bracket and makes up 20.5% of all families. Conversely, the $10,000 to $14,999 income bracket is the least frequent group with only 370 families (1.9%) belonging to this category.
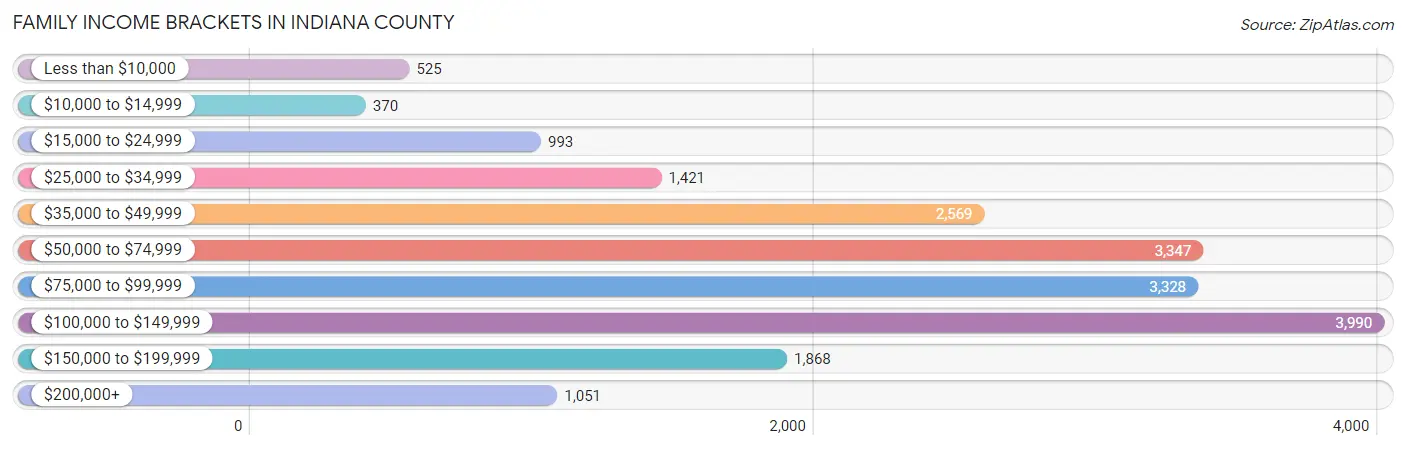
| Income Bracket | # Families | % Families |
| Less than $10,000 | 525 | 2.7% |
| $10,000 to $14,999 | 370 | 1.9% |
| $15,000 to $24,999 | 993 | 5.1% |
| $25,000 to $34,999 | 1,421 | 7.3% |
| $35,000 to $49,999 | 2,569 | 13.2% |
| $50,000 to $74,999 | 3,347 | 17.2% |
| $75,000 to $99,999 | 3,328 | 17.1% |
| $100,000 to $149,999 | 3,990 | 20.5% |
| $150,000 to $199,999 | 1,868 | 9.6% |
| $200,000+ | 1,051 | 5.4% |
Family Income by Famaliy Size in Indiana County
7+ person families (238 | 1.2%) account for the highest median family income in Indiana County with $110,417 per family, while 2-person families (10,725 | 55.1%) have the highest median income of $33,066 per family member.
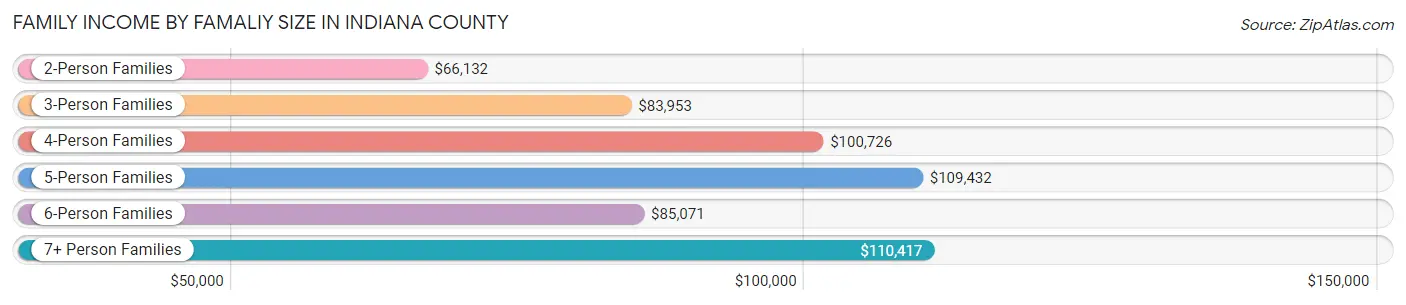
| Income Bracket | # Families | Median Income |
| 2-Person Families | 10,725 (55.1%) | $66,132 |
| 3-Person Families | 3,982 (20.5%) | $83,953 |
| 4-Person Families | 3,012 (15.5%) | $100,726 |
| 5-Person Families | 1,141 (5.9%) | $109,432 |
| 6-Person Families | 364 (1.9%) | $85,071 |
| 7+ Person Families | 238 (1.2%) | $110,417 |
| Total | 19,462 (100.0%) | $78,873 |
Family Income by Number of Earners in Indiana County
The median family income in Indiana County is $78,873, with families comprising 3+ earners (2,098) having the highest median family income of $128,049, while families with no earners (4,340) have the lowest median family income of $47,289, accounting for 10.8% and 22.3% of families, respectively.
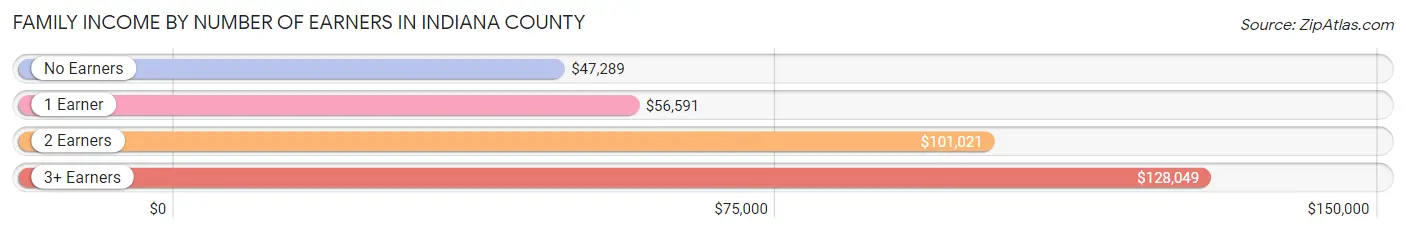
| Number of Earners | # Families | Median Income |
| No Earners | 4,340 (22.3%) | $47,289 |
| 1 Earner | 5,554 (28.5%) | $56,591 |
| 2 Earners | 7,470 (38.4%) | $101,021 |
| 3+ Earners | 2,098 (10.8%) | $128,049 |
| Total | 19,462 (100.0%) | $78,873 |
Household Income in Indiana County
Household Income Brackets in Indiana County
With 5,295 households falling in the category, the $50,000 to $74,999 income range is the most frequent in Indiana County, accounting for 16.4% of all households. In contrast, only 1,162 households (3.6%) fall into the $200,000+ income bracket, making it the least populous group.
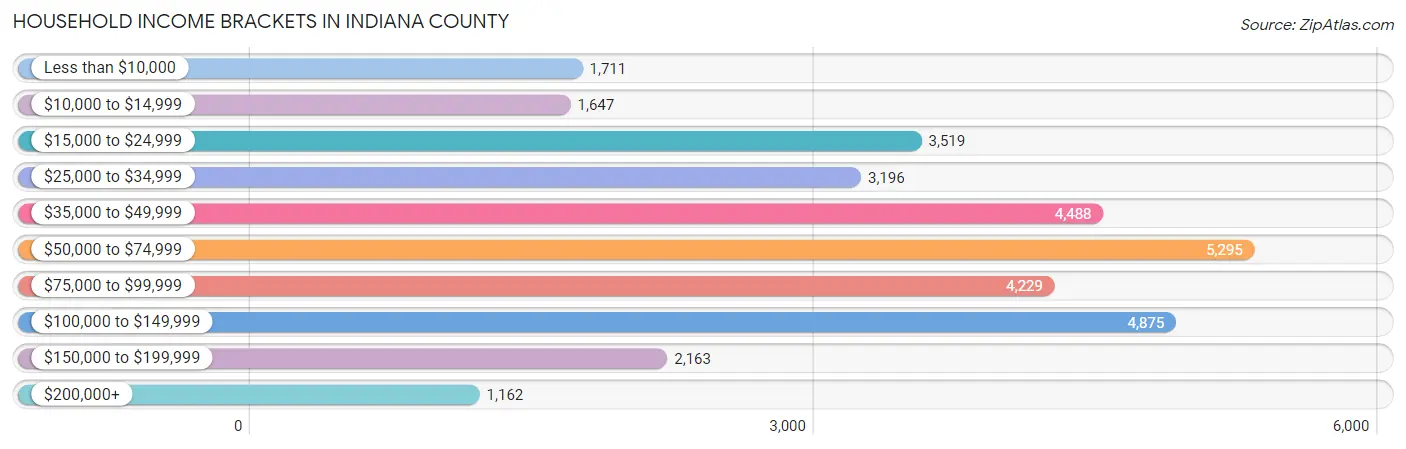
| Income Bracket | # Households | % Households |
| Less than $10,000 | 1,711 | 5.3% |
| $10,000 to $14,999 | 1,647 | 5.1% |
| $15,000 to $24,999 | 3,519 | 10.9% |
| $25,000 to $34,999 | 3,196 | 9.9% |
| $35,000 to $49,999 | 4,488 | 13.9% |
| $50,000 to $74,999 | 5,295 | 16.4% |
| $75,000 to $99,999 | 4,229 | 13.1% |
| $100,000 to $149,999 | 4,875 | 15.1% |
| $150,000 to $199,999 | 2,163 | 6.7% |
| $200,000+ | 1,162 | 3.6% |
Household Income by Householder Age in Indiana County
The median household income in Indiana County is $57,170, with the highest median household income of $73,817 found in the 45 to 64 years age bracket for the primary householder. A total of 11,516 households (35.7%) fall into this category. Meanwhile, the 15 to 24 years age bracket for the primary householder has the lowest median household income of $24,678, with 1,792 households (5.6%) in this group.
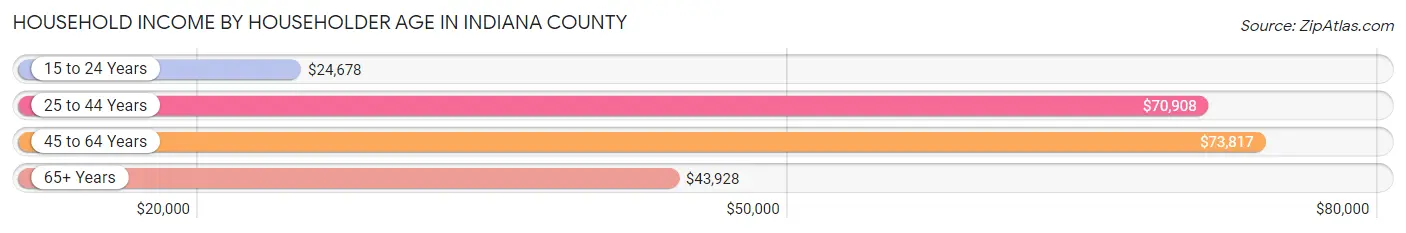
| Income Bracket | # Households | Median Income |
| 15 to 24 Years | 1,792 (5.6%) | $24,678 |
| 25 to 44 Years | 8,468 (26.2%) | $70,908 |
| 45 to 64 Years | 11,516 (35.7%) | $73,817 |
| 65+ Years | 10,509 (32.6%) | $43,928 |
| Total | 32,285 (100.0%) | $57,170 |
Poverty in Indiana County
Income Below Poverty by Sex and Age in Indiana County
With 11.3% poverty level for males and 14.6% for females among the residents of Indiana County, under 5 year old males and 18 to 24 year old females are the most vulnerable to poverty, with 415 males (21.9%) and 1,399 females (27.7%) in their respective age groups living below the poverty level.
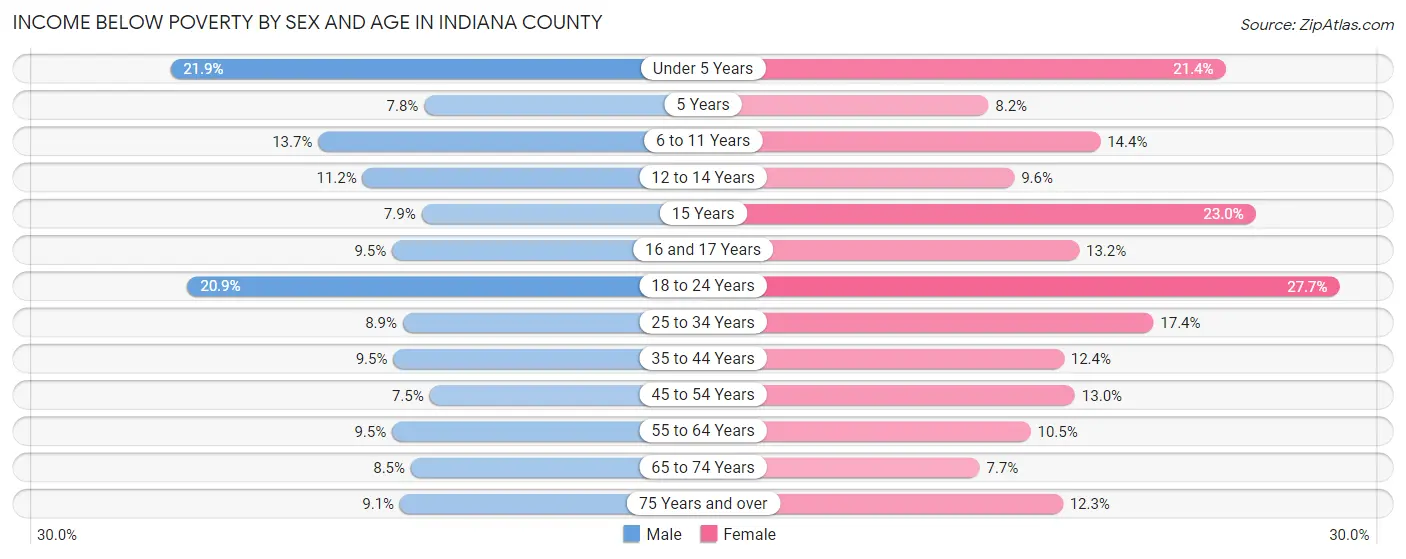
| Age Bracket | Male | Female |
| Under 5 Years | 415 (21.9%) | 393 (21.4%) |
| 5 Years | 31 (7.7%) | 35 (8.2%) |
| 6 to 11 Years | 348 (13.7%) | 329 (14.4%) |
| 12 to 14 Years | 135 (11.2%) | 130 (9.6%) |
| 15 Years | 38 (7.9%) | 91 (23.0%) |
| 16 and 17 Years | 87 (9.5%) | 123 (13.2%) |
| 18 to 24 Years | 985 (20.9%) | 1,399 (27.7%) |
| 25 to 34 Years | 398 (8.9%) | 685 (17.3%) |
| 35 to 44 Years | 401 (9.5%) | 507 (12.4%) |
| 45 to 54 Years | 341 (7.4%) | 582 (13.0%) |
| 55 to 64 Years | 549 (9.5%) | 612 (10.5%) |
| 65 to 74 Years | 398 (8.5%) | 366 (7.7%) |
| 75 Years and over | 249 (9.1%) | 473 (12.3%) |
| Total | 4,375 (11.3%) | 5,725 (14.6%) |
Income Above Poverty by Sex and Age in Indiana County
According to the poverty statistics in Indiana County, males aged 45 to 54 years and females aged 65 to 74 years are the age groups that are most secure financially, with 92.5% of males and 92.3% of females in these age groups living above the poverty line.
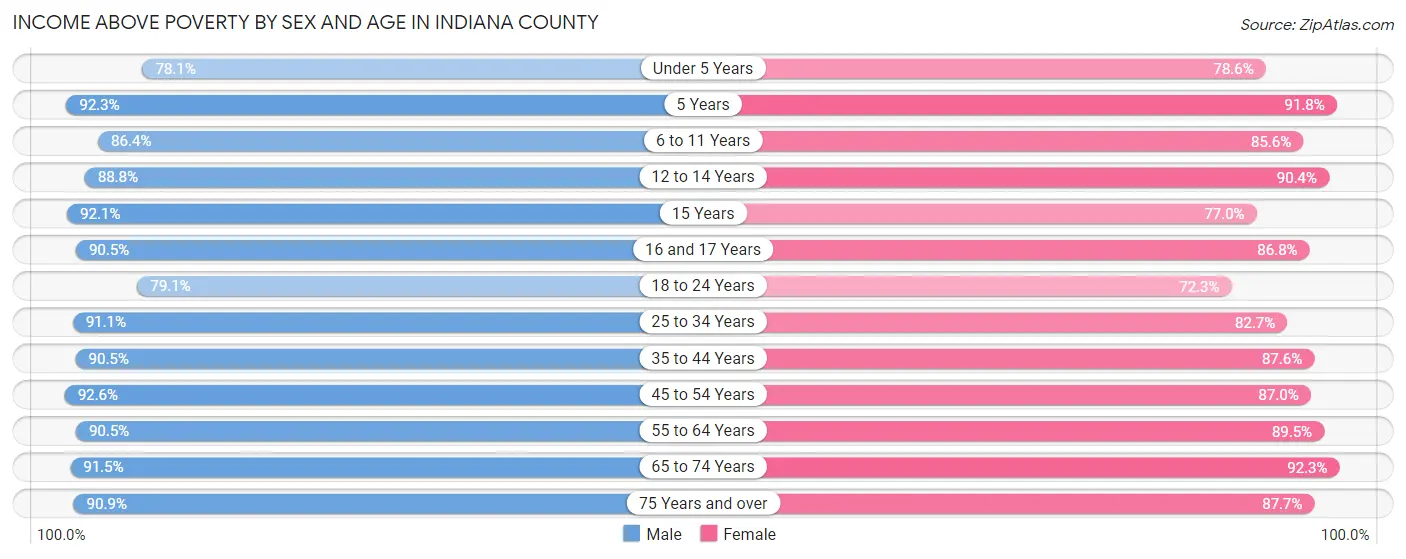
| Age Bracket | Male | Female |
| Under 5 Years | 1,481 (78.1%) | 1,447 (78.6%) |
| 5 Years | 369 (92.2%) | 394 (91.8%) |
| 6 to 11 Years | 2,201 (86.4%) | 1,958 (85.6%) |
| 12 to 14 Years | 1,073 (88.8%) | 1,224 (90.4%) |
| 15 Years | 443 (92.1%) | 304 (77.0%) |
| 16 and 17 Years | 825 (90.5%) | 808 (86.8%) |
| 18 to 24 Years | 3,720 (79.1%) | 3,651 (72.3%) |
| 25 to 34 Years | 4,056 (91.1%) | 3,263 (82.7%) |
| 35 to 44 Years | 3,833 (90.5%) | 3,594 (87.6%) |
| 45 to 54 Years | 4,234 (92.5%) | 3,902 (87.0%) |
| 55 to 64 Years | 5,205 (90.5%) | 5,213 (89.5%) |
| 65 to 74 Years | 4,288 (91.5%) | 4,408 (92.3%) |
| 75 Years and over | 2,488 (90.9%) | 3,372 (87.7%) |
| Total | 34,216 (88.7%) | 33,538 (85.4%) |
Income Below Poverty Among Married-Couple Families in Indiana County
The poverty statistics for married-couple families in Indiana County show that 4.6% or 716 of the total 15,443 families live below the poverty line. Families with 5 or more children have the highest poverty rate of 31.4%, comprising of 55 families. On the other hand, families with 1 or 2 children have the lowest poverty rate of 3.6%, which includes 136 families.
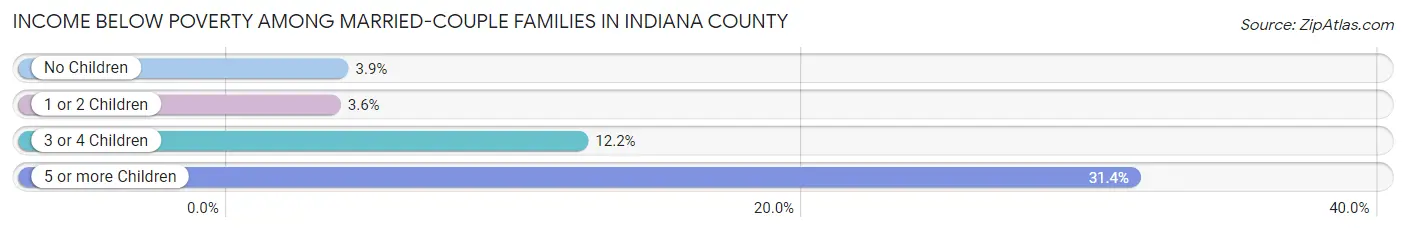
| Children | Above Poverty | Below Poverty |
| No Children | 10,064 (96.2%) | 403 (3.8%) |
| 1 or 2 Children | 3,665 (96.4%) | 136 (3.6%) |
| 3 or 4 Children | 878 (87.8%) | 122 (12.2%) |
| 5 or more Children | 120 (68.6%) | 55 (31.4%) |
| Total | 14,727 (95.4%) | 716 (4.6%) |
Income Below Poverty Among Single-Parent Households in Indiana County
According to the poverty data in Indiana County, 10.8% or 160 single-father households and 19.4% or 493 single-mother households are living below the poverty line. Among single-father households, those with 1 or 2 children have the highest poverty rate, with 123 households (18.9%) experiencing poverty. Likewise, among single-mother households, those with 3 or 4 children have the highest poverty rate, with 57 households (44.9%) falling below the poverty line.
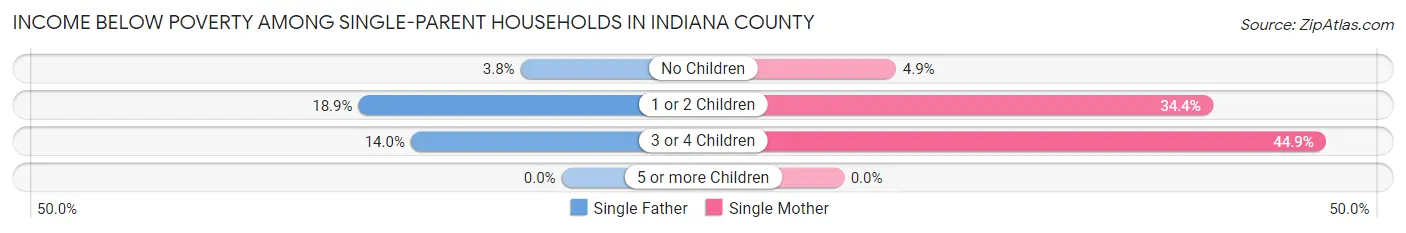
| Children | Single Father | Single Mother |
| No Children | 29 (3.8%) | 65 (4.9%) |
| 1 or 2 Children | 123 (18.9%) | 371 (34.4%) |
| 3 or 4 Children | 8 (14.0%) | 57 (44.9%) |
| 5 or more Children | 0 (0.0%) | 0 (0.0%) |
| Total | 160 (10.8%) | 493 (19.4%) |
Income Below Poverty Among Married-Couple vs Single-Parent Households in Indiana County
The poverty data for Indiana County shows that 716 of the married-couple family households (4.6%) and 653 of the single-parent households (16.3%) are living below the poverty level. Within the married-couple family households, those with 5 or more children have the highest poverty rate, with 55 households (31.4%) falling below the poverty line. Among the single-parent households, those with 3 or 4 children have the highest poverty rate, with 65 household (35.3%) living below poverty.
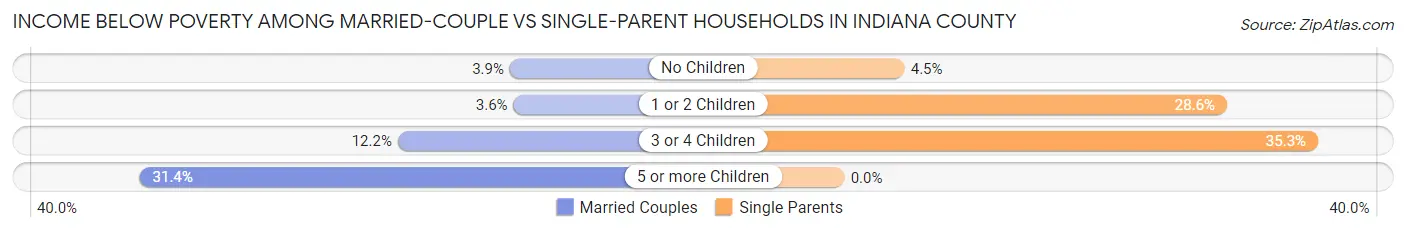
| Children | Married-Couple Families | Single-Parent Households |
| No Children | 403 (3.8%) | 94 (4.5%) |
| 1 or 2 Children | 136 (3.6%) | 494 (28.5%) |
| 3 or 4 Children | 122 (12.2%) | 65 (35.3%) |
| 5 or more Children | 55 (31.4%) | 0 (0.0%) |
| Total | 716 (4.6%) | 653 (16.3%) |
Race in Indiana County
The most populous races in Indiana County are White / Caucasian (77,644 | 93.1%), Two or more Races (2,745 | 3.3%), and Black / African American (1,881 | 2.3%).
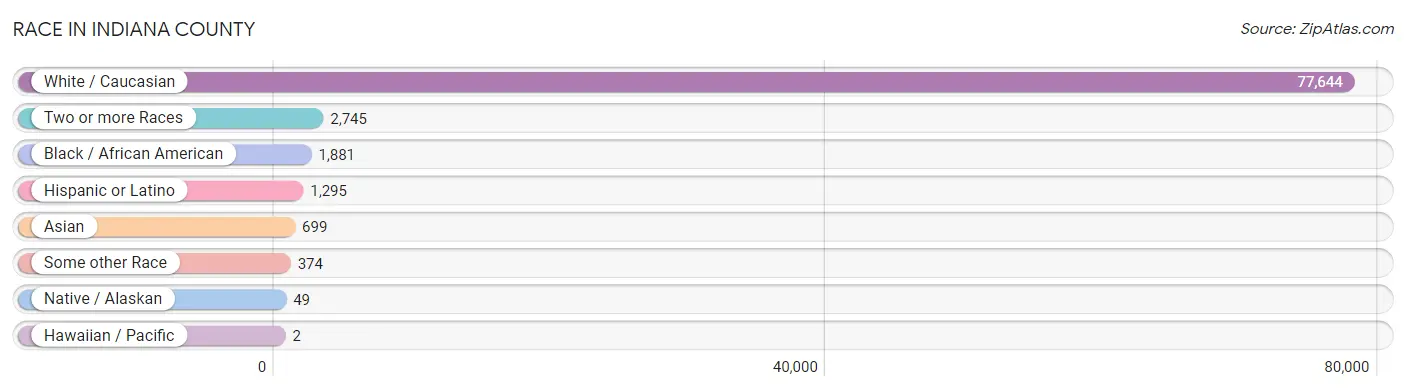
| Race | # Population | % Population |
| Asian | 699 | 0.8% |
| Black / African American | 1,881 | 2.3% |
| Hawaiian / Pacific | 2 | 0.0% |
| Hispanic or Latino | 1,295 | 1.5% |
| Native / Alaskan | 49 | 0.1% |
| White / Caucasian | 77,644 | 93.1% |
| Two or more Races | 2,745 | 3.3% |
| Some other Race | 374 | 0.4% |
| Total | 83,394 | 100.0% |
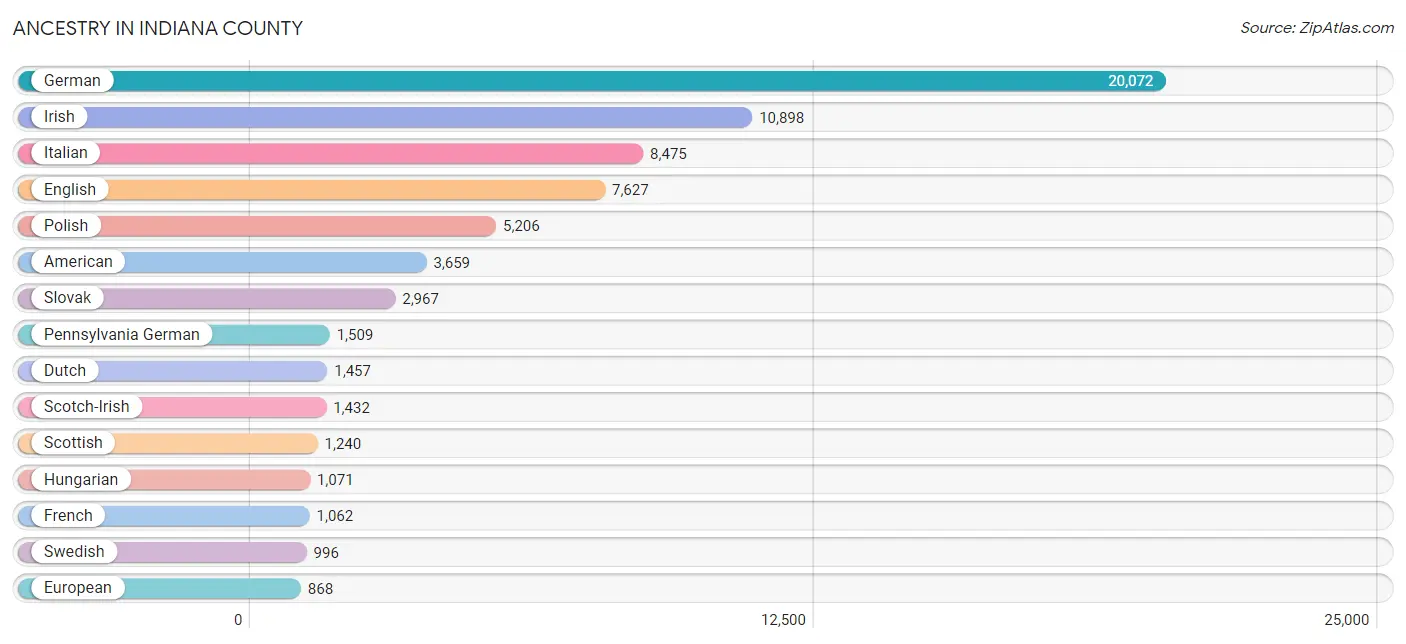
Ancestry in Indiana County
The most populous ancestries reported in Indiana County are German (20,072 | 24.1%), Irish (10,898 | 13.1%), Italian (8,475 | 10.2%), English (7,627 | 9.1%), and Polish (5,206 | 6.2%), together accounting for 62.7% of all Indiana County residents.
| Ancestry | # Population | % Population |
| African | 40 | 0.1% |
| Alsatian | 3 | 0.0% |
| American | 3,659 | 4.4% |
| Arab | 277 | 0.3% |
| Argentinean | 8 | 0.0% |
| Armenian | 13 | 0.0% |
| Austrian | 158 | 0.2% |
| Basque | 48 | 0.1% |
| Belgian | 49 | 0.1% |
| Bhutanese | 108 | 0.1% |
| Blackfeet | 21 | 0.0% |
| Brazilian | 13 | 0.0% |
| British | 296 | 0.4% |
| Burmese | 96 | 0.1% |
| Canadian | 174 | 0.2% |
| Carpatho Rusyn | 9 | 0.0% |
| Celtic | 3 | 0.0% |
| Central American | 123 | 0.2% |
| Central American Indian | 21 | 0.0% |
| Cherokee | 115 | 0.1% |
| Chippewa | 1 | 0.0% |
| Choctaw | 3 | 0.0% |
| Colombian | 38 | 0.1% |
| Cree | 2 | 0.0% |
| Croatian | 249 | 0.3% |
| Cuban | 132 | 0.2% |
| Czech | 303 | 0.4% |
| Czechoslovakian | 333 | 0.4% |
| Danish | 10 | 0.0% |
| Dominican | 39 | 0.1% |
| Dutch | 1,457 | 1.8% |
| Eastern European | 383 | 0.5% |
| Egyptian | 122 | 0.2% |
| English | 7,627 | 9.1% |
| European | 868 | 1.0% |
| Finnish | 50 | 0.1% |
| French | 1,062 | 1.3% |
| French American Indian | 14 | 0.0% |
| French Canadian | 144 | 0.2% |
| German | 20,072 | 24.1% |
| Greek | 178 | 0.2% |
| Guamanian / Chamorro | 2 | 0.0% |
| Guatemalan | 99 | 0.1% |
| Haitian | 67 | 0.1% |
| Hopi | 1 | 0.0% |
| Hungarian | 1,071 | 1.3% |
| Indian (Asian) | 203 | 0.2% |
| Iranian | 47 | 0.1% |
| Irish | 10,898 | 13.1% |
| Iroquois | 33 | 0.0% |
| Israeli | 20 | 0.0% |
| Italian | 8,475 | 10.2% |
| Jamaican | 29 | 0.0% |
| Kenyan | 17 | 0.0% |
| Korean | 202 | 0.2% |
| Laotian | 16 | 0.0% |
| Latvian | 16 | 0.0% |
| Lebanese | 26 | 0.0% |
| Lithuanian | 108 | 0.1% |
| Lumbee | 1 | 0.0% |
| Macedonian | 7 | 0.0% |
| Mexican | 428 | 0.5% |
| Native Hawaiian | 2 | 0.0% |
| Nicaraguan | 24 | 0.0% |
| Nigerian | 272 | 0.3% |
| Northern European | 48 | 0.1% |
| Norwegian | 135 | 0.2% |
| Pennsylvania German | 1,509 | 1.8% |
| Peruvian | 8 | 0.0% |
| Polish | 5,206 | 6.2% |
| Portuguese | 39 | 0.1% |
| Puerto Rican | 256 | 0.3% |
| Romanian | 21 | 0.0% |
| Russian | 588 | 0.7% |
| Scandinavian | 133 | 0.2% |
| Scotch-Irish | 1,432 | 1.7% |
| Scottish | 1,240 | 1.5% |
| Serbian | 46 | 0.1% |
| Sioux | 1 | 0.0% |
| Slavic | 95 | 0.1% |
| Slovak | 2,967 | 3.6% |
| Slovene | 117 | 0.1% |
| South American | 59 | 0.1% |
| Spaniard | 20 | 0.0% |
| Spanish | 184 | 0.2% |
| Spanish American | 9 | 0.0% |
| Sri Lankan | 23 | 0.0% |
| Subsaharan African | 329 | 0.4% |
| Swedish | 996 | 1.2% |
| Swiss | 308 | 0.4% |
| Syrian | 33 | 0.0% |
| Thai | 355 | 0.4% |
| Tohono O'Odham | 7 | 0.0% |
| Turkish | 126 | 0.2% |
| Ukrainian | 418 | 0.5% |
| Venezuelan | 5 | 0.0% |
| Welsh | 769 | 0.9% |
| West Indian | 16 | 0.0% |
| Yugoslavian | 7 | 0.0% | View All 99 Rows |
Immigrants in Indiana County
The most numerous immigrant groups reported in Indiana County came from Asia (833 | 1.0%), South Central Asia (443 | 0.5%), India (319 | 0.4%), Latin America (271 | 0.3%), and Western Asia (216 | 0.3%), together accounting for 2.5% of all Indiana County residents.
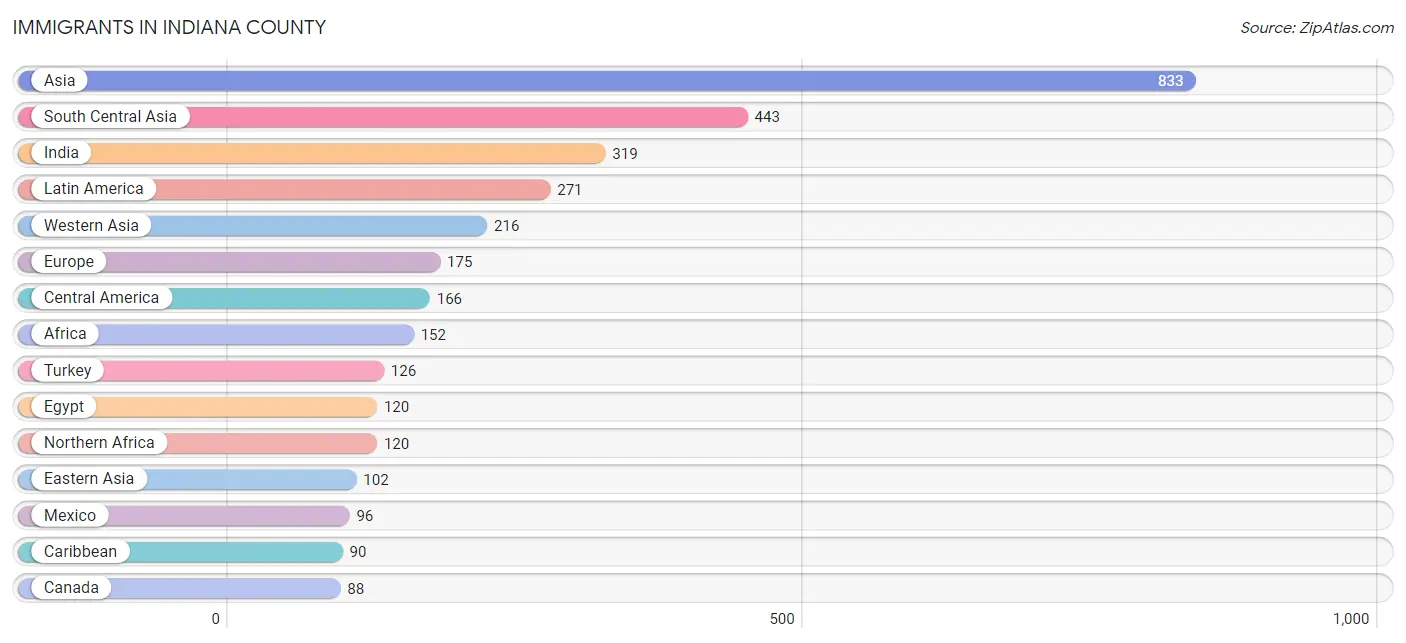
| Immigration Origin | # Population | % Population |
| Africa | 152 | 0.2% |
| Argentina | 8 | 0.0% |
| Asia | 833 | 1.0% |
| Austria | 1 | 0.0% |
| Brazil | 7 | 0.0% |
| Canada | 88 | 0.1% |
| Caribbean | 90 | 0.1% |
| Central America | 166 | 0.2% |
| China | 87 | 0.1% |
| Dominican Republic | 8 | 0.0% |
| Eastern Africa | 15 | 0.0% |
| Eastern Asia | 102 | 0.1% |
| Eastern Europe | 61 | 0.1% |
| Egypt | 120 | 0.1% |
| England | 10 | 0.0% |
| Europe | 175 | 0.2% |
| France | 16 | 0.0% |
| Germany | 32 | 0.0% |
| Ghana | 17 | 0.0% |
| Guatemala | 46 | 0.1% |
| Haiti | 44 | 0.1% |
| India | 319 | 0.4% |
| Indonesia | 46 | 0.1% |
| Iran | 47 | 0.1% |
| Ireland | 2 | 0.0% |
| Italy | 18 | 0.0% |
| Jamaica | 37 | 0.0% |
| Japan | 3 | 0.0% |
| Jordan | 10 | 0.0% |
| Kenya | 15 | 0.0% |
| Korea | 12 | 0.0% |
| Latin America | 271 | 0.3% |
| Latvia | 16 | 0.0% |
| Mexico | 96 | 0.1% |
| Nicaragua | 24 | 0.0% |
| Northern Africa | 120 | 0.1% |
| Northern Europe | 47 | 0.1% |
| Pakistan | 77 | 0.1% |
| Philippines | 20 | 0.0% |
| Poland | 4 | 0.0% |
| Romania | 18 | 0.0% |
| Russia | 7 | 0.0% |
| Saudi Arabia | 80 | 0.1% |
| South America | 15 | 0.0% |
| South Central Asia | 443 | 0.5% |
| South Eastern Asia | 72 | 0.1% |
| Southern Europe | 18 | 0.0% |
| Taiwan | 16 | 0.0% |
| Trinidad and Tobago | 1 | 0.0% |
| Turkey | 126 | 0.2% |
| Vietnam | 6 | 0.0% |
| Western Africa | 17 | 0.0% |
| Western Asia | 216 | 0.3% |
| Western Europe | 49 | 0.1% | View All 54 Rows |
Sex and Age in Indiana County
Sex and Age in Indiana County
The most populous age groups in Indiana County are 20 to 24 Years (4,674 | 11.2%) for men and 20 to 24 Years (4,498 | 10.8%) for women.
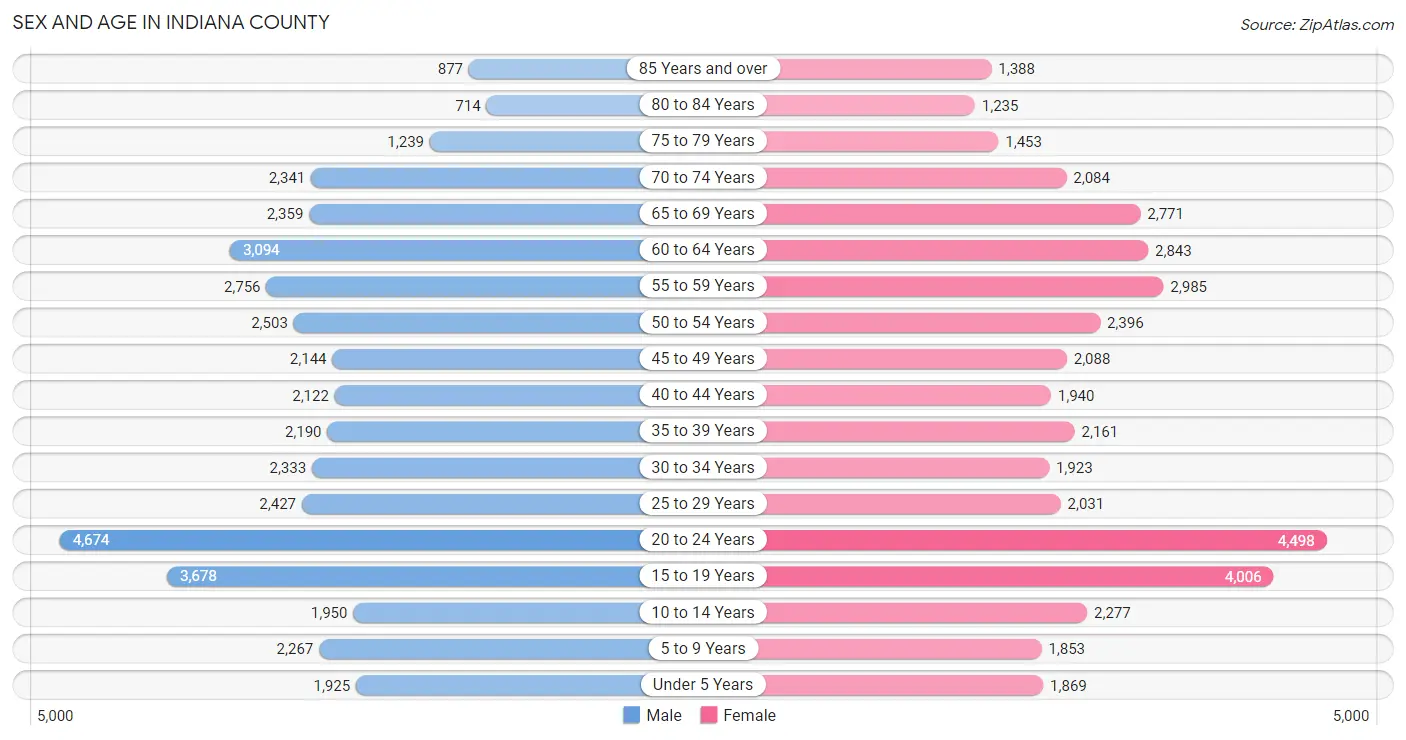
| Age Bracket | Male | Female |
| Under 5 Years | 1,925 (4.6%) | 1,869 (4.5%) |
| 5 to 9 Years | 2,267 (5.4%) | 1,853 (4.4%) |
| 10 to 14 Years | 1,950 (4.7%) | 2,277 (5.4%) |
| 15 to 19 Years | 3,678 (8.8%) | 4,006 (9.6%) |
| 20 to 24 Years | 4,674 (11.2%) | 4,498 (10.8%) |
| 25 to 29 Years | 2,427 (5.8%) | 2,031 (4.9%) |
| 30 to 34 Years | 2,333 (5.6%) | 1,923 (4.6%) |
| 35 to 39 Years | 2,190 (5.3%) | 2,161 (5.2%) |
| 40 to 44 Years | 2,122 (5.1%) | 1,940 (4.6%) |
| 45 to 49 Years | 2,144 (5.1%) | 2,088 (5.0%) |
| 50 to 54 Years | 2,503 (6.0%) | 2,396 (5.7%) |
| 55 to 59 Years | 2,756 (6.6%) | 2,985 (7.1%) |
| 60 to 64 Years | 3,094 (7.4%) | 2,843 (6.8%) |
| 65 to 69 Years | 2,359 (5.7%) | 2,771 (6.6%) |
| 70 to 74 Years | 2,341 (5.6%) | 2,084 (5.0%) |
| 75 to 79 Years | 1,239 (3.0%) | 1,453 (3.5%) |
| 80 to 84 Years | 714 (1.7%) | 1,235 (2.9%) |
| 85 Years and over | 877 (2.1%) | 1,388 (3.3%) |
| Total | 41,593 (100.0%) | 41,801 (100.0%) |
Families and Households in Indiana County
Median Family Size in Indiana County
The median family size in Indiana County is 3.08 persons per family, with married-couple families (15,443 | 79.3%) accounting for the largest median family size of 3.12 persons per family. On the other hand, single male/father families (1,475 | 7.6%) represent the smallest median family size with 2.84 persons per family.
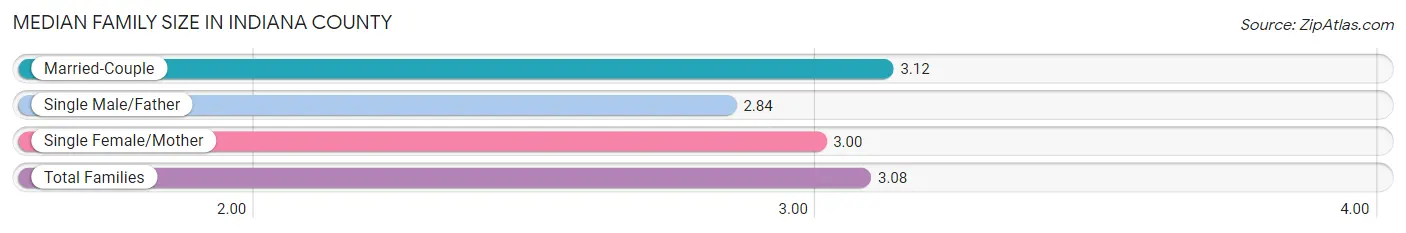
| Family Type | # Families | Family Size |
| Married-Couple | 15,443 (79.3%) | 3.12 |
| Single Male/Father | 1,475 (7.6%) | 2.84 |
| Single Female/Mother | 2,544 (13.1%) | 3.00 |
| Total Families | 19,462 (100.0%) | 3.08 |
Median Household Size in Indiana County
The median household size in Indiana County is 2.41 persons per household, with single male/father households (1,475 | 4.6%) accounting for the largest median household size of 3.26 persons per household. non-family households (12,823 | 39.7%) represent the smallest median household size with 1.28 persons per household.
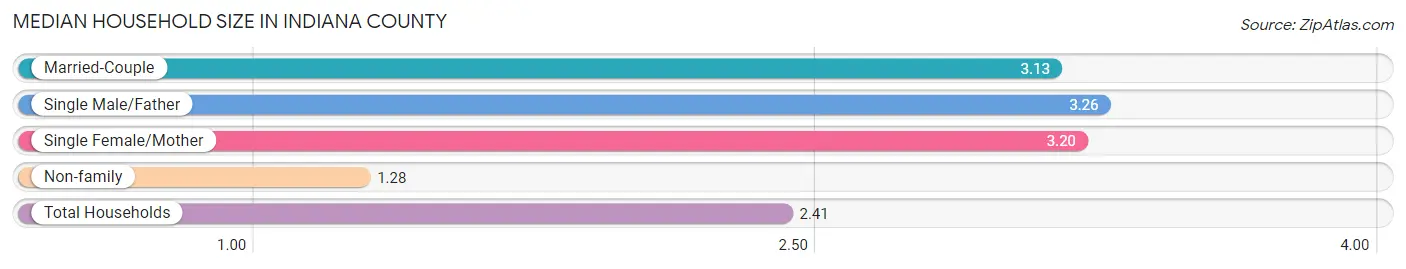
| Household Type | # Households | Household Size |
| Married-Couple | 15,443 (47.8%) | 3.13 |
| Single Male/Father | 1,475 (4.6%) | 3.26 |
| Single Female/Mother | 2,544 (7.9%) | 3.20 |
| Non-family | 12,823 (39.7%) | 1.28 |
| Total Households | 32,285 (100.0%) | 2.41 |
Household Size by Marriage Status in Indiana County
Out of a total of 32,285 households in Indiana County, 19,462 (60.3%) are family households, while 12,823 (39.7%) are nonfamily households. The most numerous type of family households are 2-person households, comprising 10,313, and the most common type of nonfamily households are 1-person households, comprising 10,453.
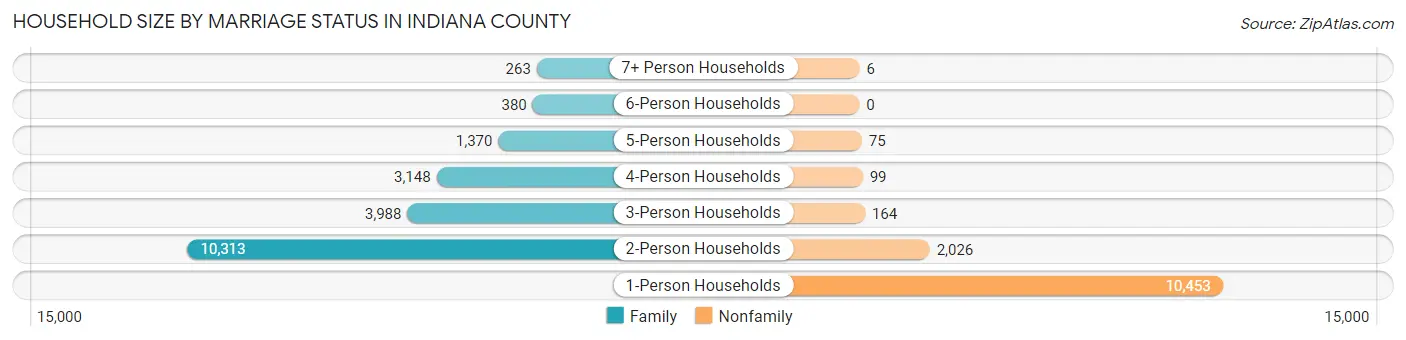
| Household Size | Family Households | Nonfamily Households |
| 1-Person Households | - | 10,453 (32.4%) |
| 2-Person Households | 10,313 (31.9%) | 2,026 (6.3%) |
| 3-Person Households | 3,988 (12.3%) | 164 (0.5%) |
| 4-Person Households | 3,148 (9.8%) | 99 (0.3%) |
| 5-Person Households | 1,370 (4.2%) | 75 (0.2%) |
| 6-Person Households | 380 (1.2%) | 0 (0.0%) |
| 7+ Person Households | 263 (0.8%) | 6 (0.0%) |
| Total | 19,462 (60.3%) | 12,823 (39.7%) |
Female Fertility in Indiana County
Fertility by Age in Indiana County
Average fertility rate in Indiana County is 49.0 births per 1,000 women. Women in the age bracket of 20 to 34 years have the highest fertility rate with 90.0 births per 1,000 women. Women in the age bracket of 20 to 34 years acount for 81.7% of all women with births.
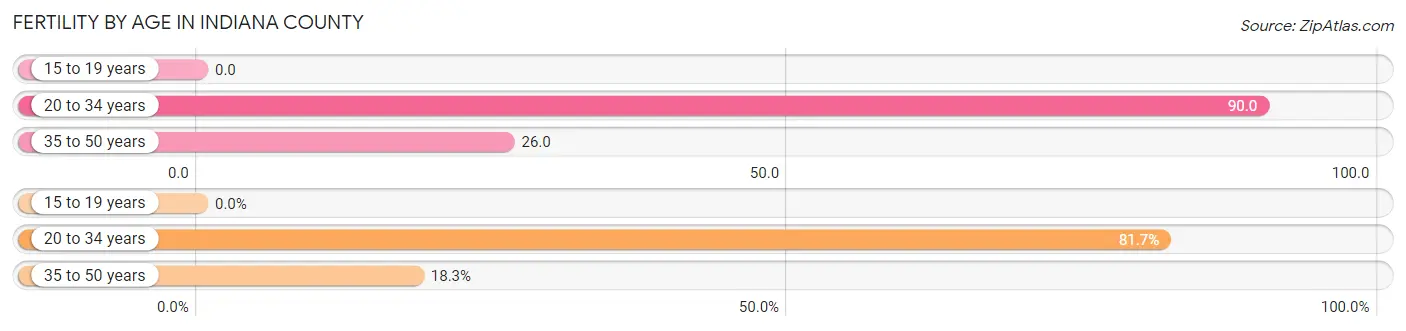
| Age Bracket | Women with Births | Births / 1,000 Women |
| 15 to 19 years | 0 (0.0%) | 0.0 |
| 20 to 34 years | 763 (81.7%) | 90.0 |
| 35 to 50 years | 171 (18.3%) | 26.0 |
| Total | 934 (100.0%) | 49.0 |
Fertility by Age by Marriage Status in Indiana County
55.5% of women with births (934) in Indiana County are married. The highest percentage of unmarried women with births falls into 20 to 34 years age bracket with 53.5% of them unmarried at the time of birth, while the lowest percentage of unmarried women with births belong to 35 to 50 years age bracket with 4.7% of them unmarried.
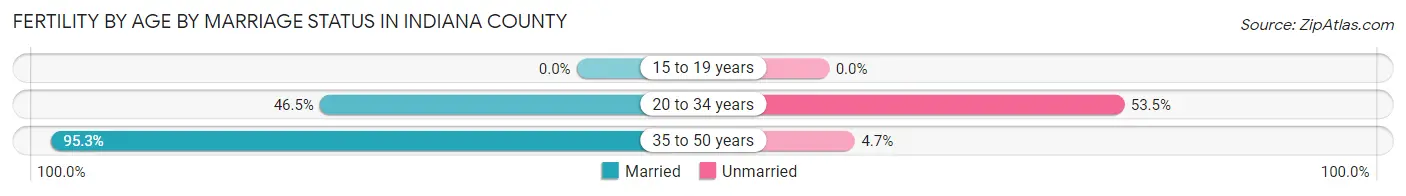
| Age Bracket | Married | Unmarried |
| 15 to 19 years | 0 (0.0%) | 0 (0.0%) |
| 20 to 34 years | 355 (46.5%) | 408 (53.5%) |
| 35 to 50 years | 163 (95.3%) | 8 (4.7%) |
| Total | 518 (55.5%) | 416 (44.5%) |
Fertility by Education in Indiana County
Average fertility rate in Indiana County is 49.0 births per 1,000 women. Women with the education attainment of less than high school have the highest fertility rate of 93.0 births per 1,000 women, while women with the education attainment of college or associate's degree have the lowest fertility at 26.0 births per 1,000 women. Women with the education attainment of less than high school represent 27.9% of all women with births.
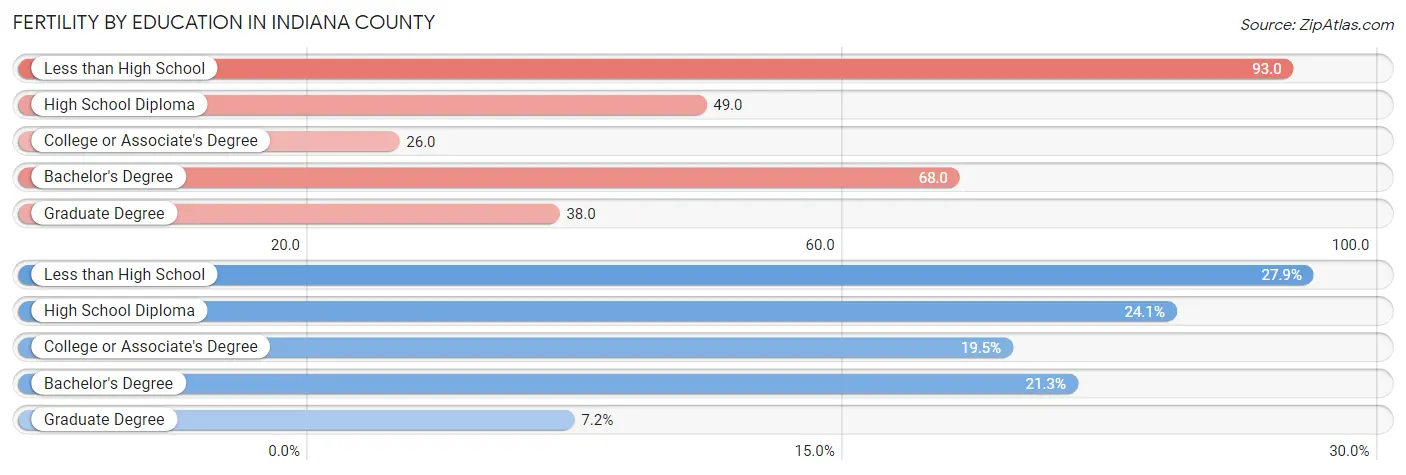
| Educational Attainment | Women with Births | Births / 1,000 Women |
| Less than High School | 261 (27.9%) | 93.0 |
| High School Diploma | 225 (24.1%) | 49.0 |
| College or Associate's Degree | 182 (19.5%) | 26.0 |
| Bachelor's Degree | 199 (21.3%) | 68.0 |
| Graduate Degree | 67 (7.2%) | 38.0 |
| Total | 934 (100.0%) | 49.0 |
Fertility by Education by Marriage Status in Indiana County
44.5% of women with births in Indiana County are unmarried. Women with the educational attainment of graduate degree are most likely to be married with 97.0% of them married at childbirth, while women with the educational attainment of high school diploma are least likely to be married with 72.9% of them unmarried at childbirth.
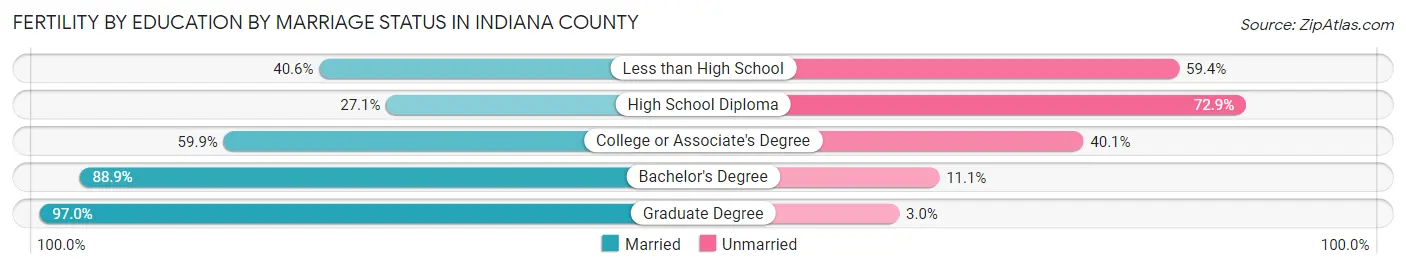
| Educational Attainment | Married | Unmarried |
| Less than High School | 106 (40.6%) | 155 (59.4%) |
| High School Diploma | 61 (27.1%) | 164 (72.9%) |
| College or Associate's Degree | 109 (59.9%) | 73 (40.1%) |
| Bachelor's Degree | 177 (88.9%) | 22 (11.1%) |
| Graduate Degree | 65 (97.0%) | 2 (3.0%) |
| Total | 518 (55.5%) | 416 (44.5%) |
Employment Characteristics in Indiana County
Employment by Class of Employer in Indiana County
Among the 35,567 employed individuals in Indiana County, private company employees (24,263 | 68.2%), not-for-profit organizations (3,169 | 8.9%), and state government employees (2,609 | 7.3%) make up the most common classes of employment.
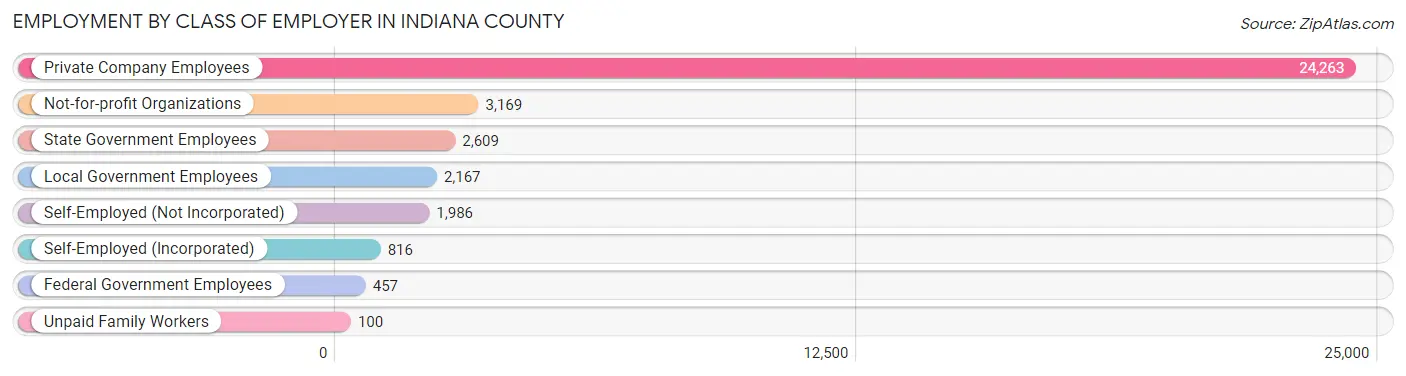
| Employer Class | # Employees | % Employees |
| Private Company Employees | 24,263 | 68.2% |
| Self-Employed (Incorporated) | 816 | 2.3% |
| Self-Employed (Not Incorporated) | 1,986 | 5.6% |
| Not-for-profit Organizations | 3,169 | 8.9% |
| Local Government Employees | 2,167 | 6.1% |
| State Government Employees | 2,609 | 7.3% |
| Federal Government Employees | 457 | 1.3% |
| Unpaid Family Workers | 100 | 0.3% |
| Total | 35,567 | 100.0% |
Employment Status by Age in Indiana County
According to the labor force statistics for Indiana County, out of the total population over 16 years of age (70,363), 55.6% or 39,122 individuals are in the labor force, with 6.5% or 2,543 of them unemployed. The age group with the highest labor force participation rate is 25 to 29 years, with 82.9% or 3,696 individuals in the labor force. Within the labor force, the 16 to 19 years age range has the highest percentage of unemployed individuals, with 16.4% or 484 of them being unemployed.
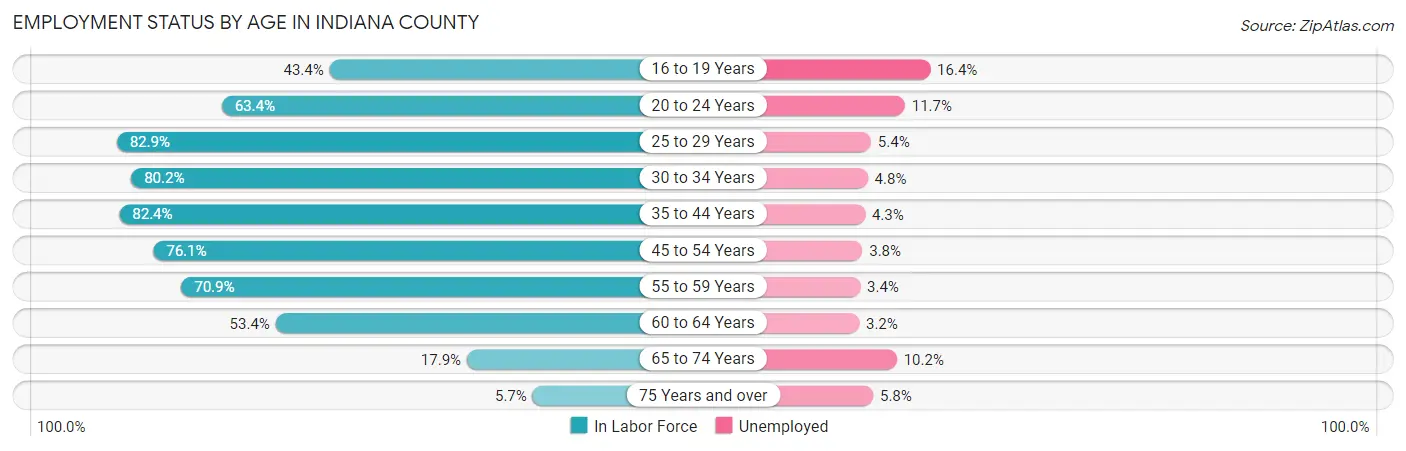
| Age Bracket | In Labor Force | Unemployed |
| 16 to 19 Years | 2,949 (43.4%) | 484 (16.4%) |
| 20 to 24 Years | 5,815 (63.4%) | 680 (11.7%) |
| 25 to 29 Years | 3,696 (82.9%) | 200 (5.4%) |
| 30 to 34 Years | 3,413 (80.2%) | 164 (4.8%) |
| 35 to 44 Years | 6,932 (82.4%) | 298 (4.3%) |
| 45 to 54 Years | 6,949 (76.1%) | 264 (3.8%) |
| 55 to 59 Years | 4,070 (70.9%) | 138 (3.4%) |
| 60 to 64 Years | 3,170 (53.4%) | 101 (3.2%) |
| 65 to 74 Years | 1,710 (17.9%) | 174 (10.2%) |
| 75 Years and over | 394 (5.7%) | 23 (5.8%) |
| Total | 39,122 (55.6%) | 2,543 (6.5%) |
Employment Status by Educational Attainment in Indiana County
According to labor force statistics for Indiana County, 74.4% of individuals (28,224) out of the total population between 25 and 64 years of age (37,936) are in the labor force, with 4.1% or 1,157 of them being unemployed. The group with the highest labor force participation rate are those with the educational attainment of bachelor's degree or higher, with 85.4% or 9,473 individuals in the labor force. Within the labor force, individuals with less than high school education have the highest percentage of unemployment, with 8.8% or 115 of them being unemployed.
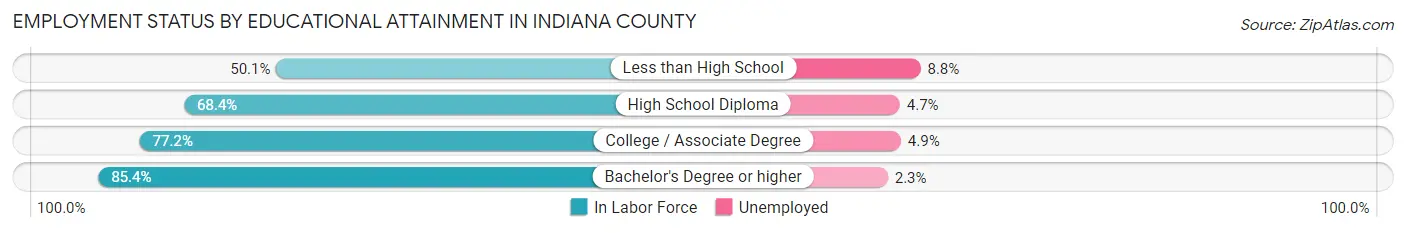
| Educational Attainment | In Labor Force | Unemployed |
| Less than High School | 1,302 (50.1%) | 229 (8.8%) |
| High School Diploma | 9,807 (68.4%) | 674 (4.7%) |
| College / Associate Degree | 7,648 (77.2%) | 485 (4.9%) |
| Bachelor's Degree or higher | 9,473 (85.4%) | 255 (2.3%) |
| Total | 28,224 (74.4%) | 1,555 (4.1%) |
Employment Occupations by Sex in Indiana County
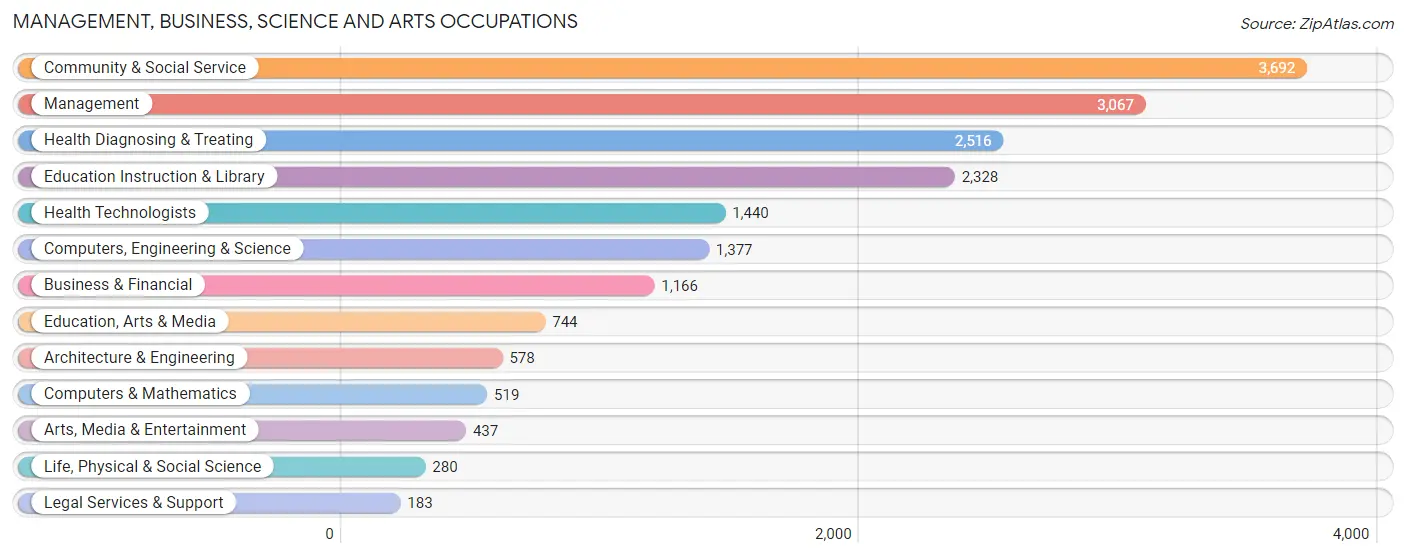
Management, Business, Science and Arts Occupations
The most common Management, Business, Science and Arts occupations in Indiana County are Community & Social Service (3,692 | 10.1%), Management (3,067 | 8.4%), Health Diagnosing & Treating (2,516 | 6.9%), Education Instruction & Library (2,328 | 6.4%), and Health Technologists (1,440 | 3.9%).
Management, Business, Science and Arts Occupations by Sex
Within the Management, Business, Science and Arts occupations in Indiana County, the most male-oriented occupations are Architecture & Engineering (81.7%), Computers, Engineering & Science (67.6%), and Computers & Mathematics (59.3%), while the most female-oriented occupations are Health Diagnosing & Treating (76.2%), Education, Arts & Media (75.3%), and Health Technologists (68.6%).
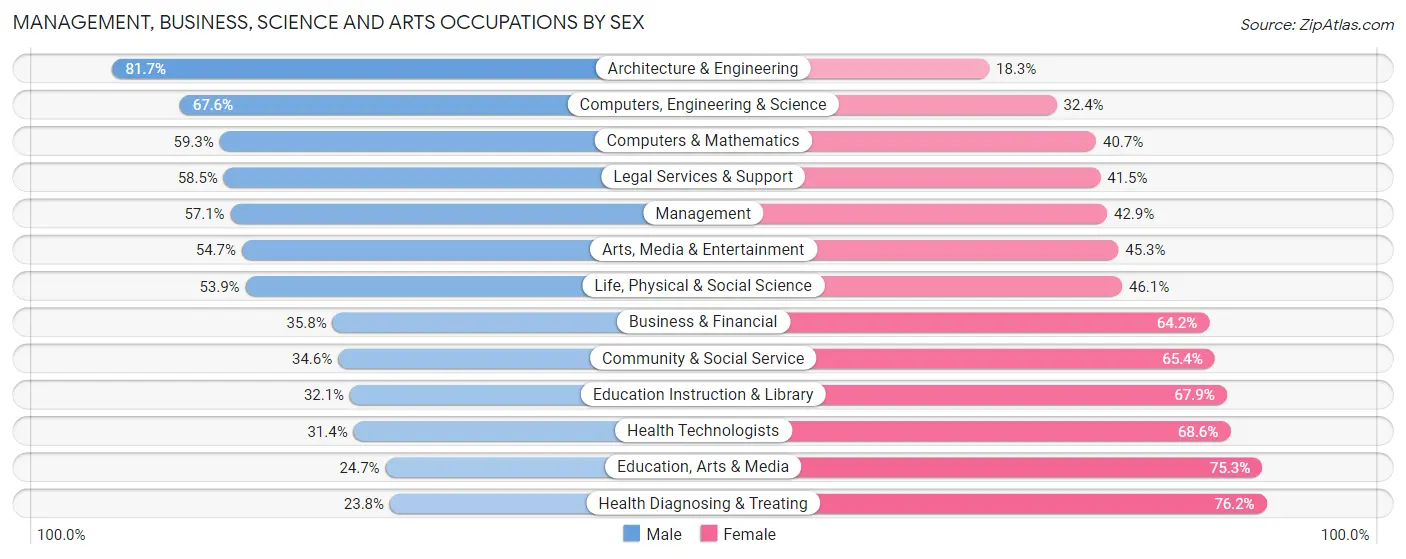
| Occupation | Male | Female |
| Management | 1,750 (57.1%) | 1,317 (42.9%) |
| Business & Financial | 417 (35.8%) | 749 (64.2%) |
| Computers, Engineering & Science | 931 (67.6%) | 446 (32.4%) |
| Computers & Mathematics | 308 (59.3%) | 211 (40.7%) |
| Architecture & Engineering | 472 (81.7%) | 106 (18.3%) |
| Life, Physical & Social Science | 151 (53.9%) | 129 (46.1%) |
| Community & Social Service | 1,278 (34.6%) | 2,414 (65.4%) |
| Education, Arts & Media | 184 (24.7%) | 560 (75.3%) |
| Legal Services & Support | 107 (58.5%) | 76 (41.5%) |
| Education Instruction & Library | 748 (32.1%) | 1,580 (67.9%) |
| Arts, Media & Entertainment | 239 (54.7%) | 198 (45.3%) |
| Health Diagnosing & Treating | 599 (23.8%) | 1,917 (76.2%) |
| Health Technologists | 452 (31.4%) | 988 (68.6%) |
| Total (Category) | 4,975 (42.1%) | 6,843 (57.9%) |
| Total (Overall) | 18,980 (52.0%) | 17,528 (48.0%) |
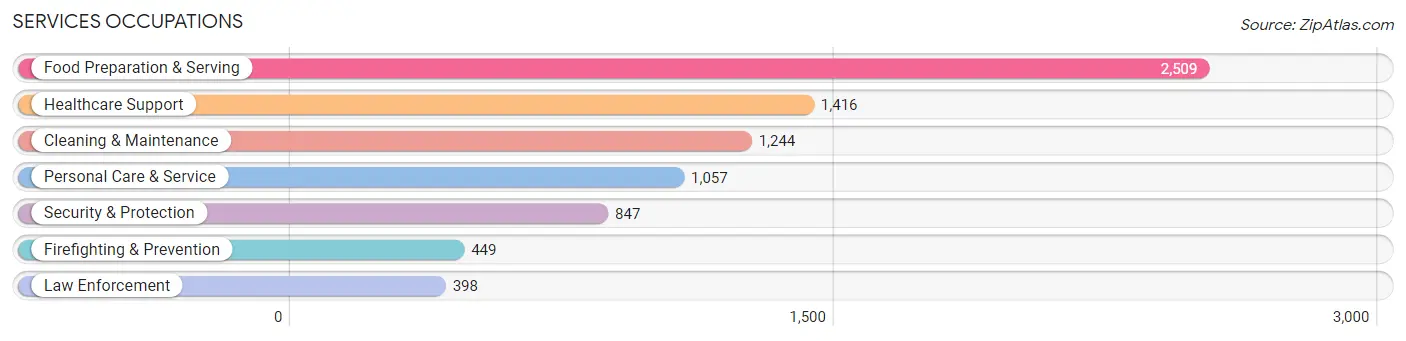
Services Occupations
The most common Services occupations in Indiana County are Food Preparation & Serving (2,509 | 6.9%), Healthcare Support (1,416 | 3.9%), Cleaning & Maintenance (1,244 | 3.4%), Personal Care & Service (1,057 | 2.9%), and Security & Protection (847 | 2.3%).
Services Occupations by Sex
Within the Services occupations in Indiana County, the most male-oriented occupations are Law Enforcement (87.4%), Security & Protection (64.6%), and Cleaning & Maintenance (60.1%), while the most female-oriented occupations are Healthcare Support (90.4%), Personal Care & Service (70.9%), and Food Preparation & Serving (60.8%).
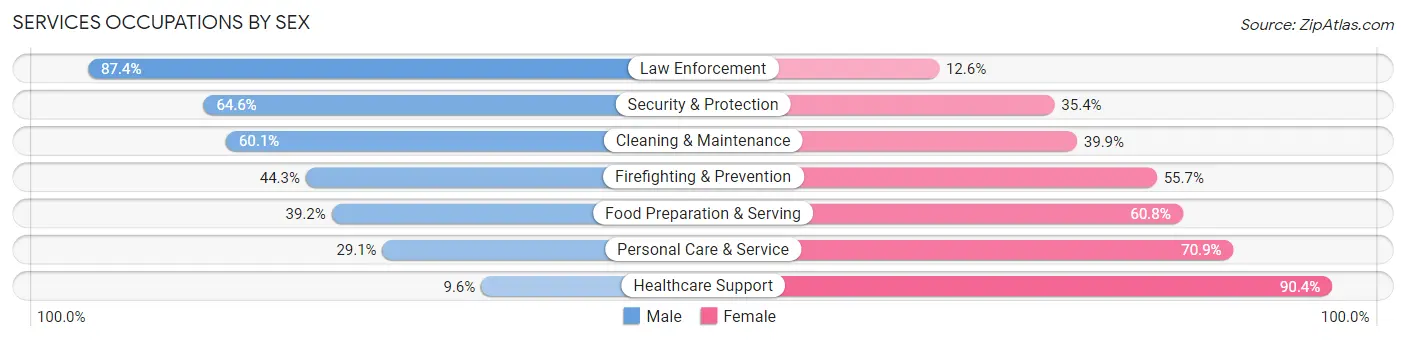
| Occupation | Male | Female |
| Healthcare Support | 136 (9.6%) | 1,280 (90.4%) |
| Security & Protection | 547 (64.6%) | 300 (35.4%) |
| Firefighting & Prevention | 199 (44.3%) | 250 (55.7%) |
| Law Enforcement | 348 (87.4%) | 50 (12.6%) |
| Food Preparation & Serving | 984 (39.2%) | 1,525 (60.8%) |
| Cleaning & Maintenance | 748 (60.1%) | 496 (39.9%) |
| Personal Care & Service | 308 (29.1%) | 749 (70.9%) |
| Total (Category) | 2,723 (38.5%) | 4,350 (61.5%) |
| Total (Overall) | 18,980 (52.0%) | 17,528 (48.0%) |
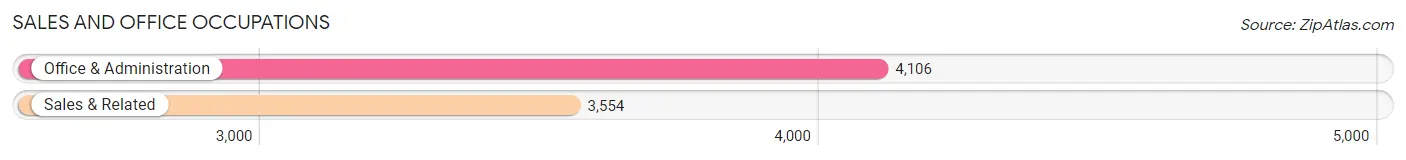
Sales and Office Occupations
The most common Sales and Office occupations in Indiana County are Office & Administration (4,106 | 11.3%), and Sales & Related (3,554 | 9.7%).
Sales and Office Occupations by Sex
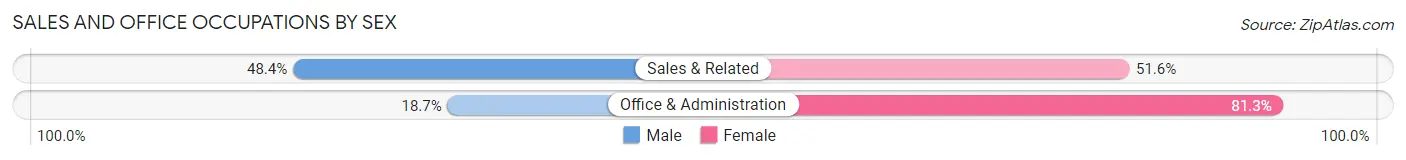
| Occupation | Male | Female |
| Sales & Related | 1,719 (48.4%) | 1,835 (51.6%) |
| Office & Administration | 766 (18.7%) | 3,340 (81.3%) |
| Total (Category) | 2,485 (32.4%) | 5,175 (67.6%) |
| Total (Overall) | 18,980 (52.0%) | 17,528 (48.0%) |
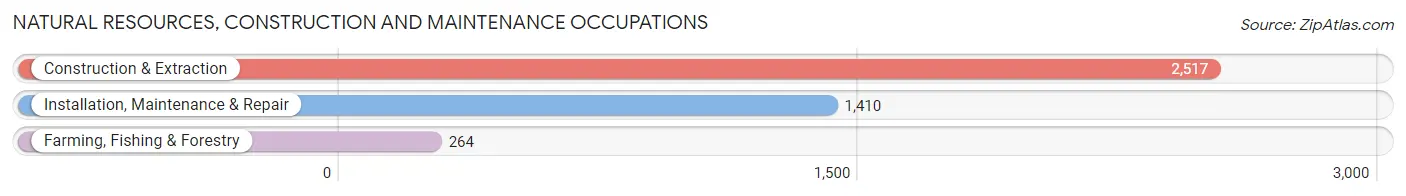
Natural Resources, Construction and Maintenance Occupations
The most common Natural Resources, Construction and Maintenance occupations in Indiana County are Construction & Extraction (2,517 | 6.9%), Installation, Maintenance & Repair (1,410 | 3.9%), and Farming, Fishing & Forestry (264 | 0.7%).
Natural Resources, Construction and Maintenance Occupations by Sex
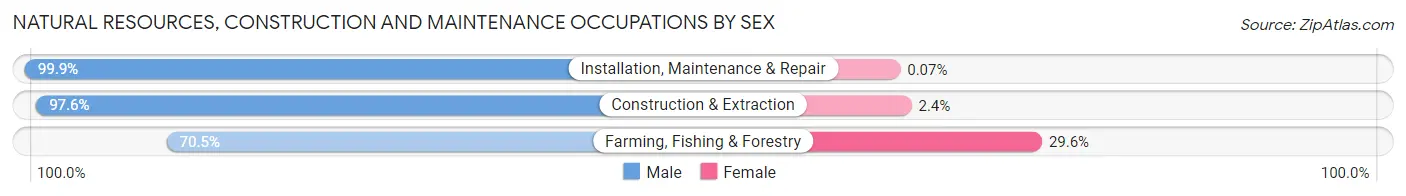
| Occupation | Male | Female |
| Farming, Fishing & Forestry | 186 (70.5%) | 78 (29.5%) |
| Construction & Extraction | 2,456 (97.6%) | 61 (2.4%) |
| Installation, Maintenance & Repair | 1,409 (99.9%) | 1 (0.1%) |
| Total (Category) | 4,051 (96.7%) | 140 (3.3%) |
| Total (Overall) | 18,980 (52.0%) | 17,528 (48.0%) |
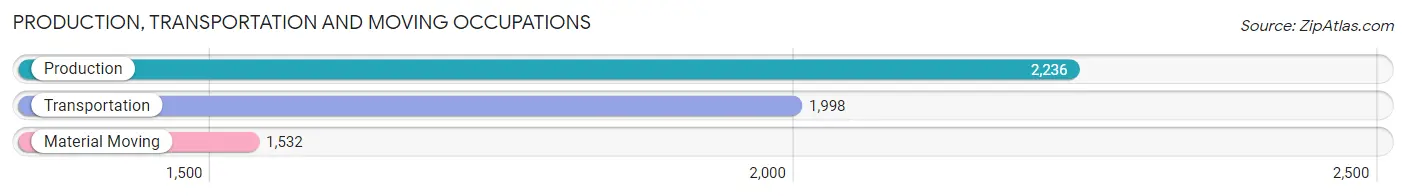
Production, Transportation and Moving Occupations
The most common Production, Transportation and Moving occupations in Indiana County are Production (2,236 | 6.1%), Transportation (1,998 | 5.5%), and Material Moving (1,532 | 4.2%).
Production, Transportation and Moving Occupations by Sex
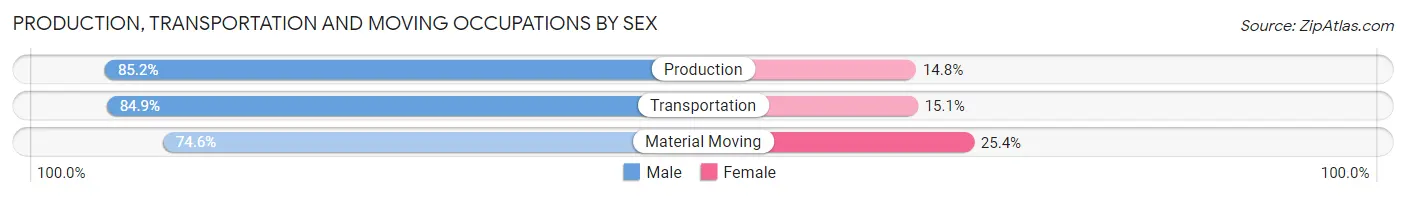
| Occupation | Male | Female |
| Production | 1,906 (85.2%) | 330 (14.8%) |
| Transportation | 1,697 (84.9%) | 301 (15.1%) |
| Material Moving | 1,143 (74.6%) | 389 (25.4%) |
| Total (Category) | 4,746 (82.3%) | 1,020 (17.7%) |
| Total (Overall) | 18,980 (52.0%) | 17,528 (48.0%) |
Employment Industries by Sex in Indiana County
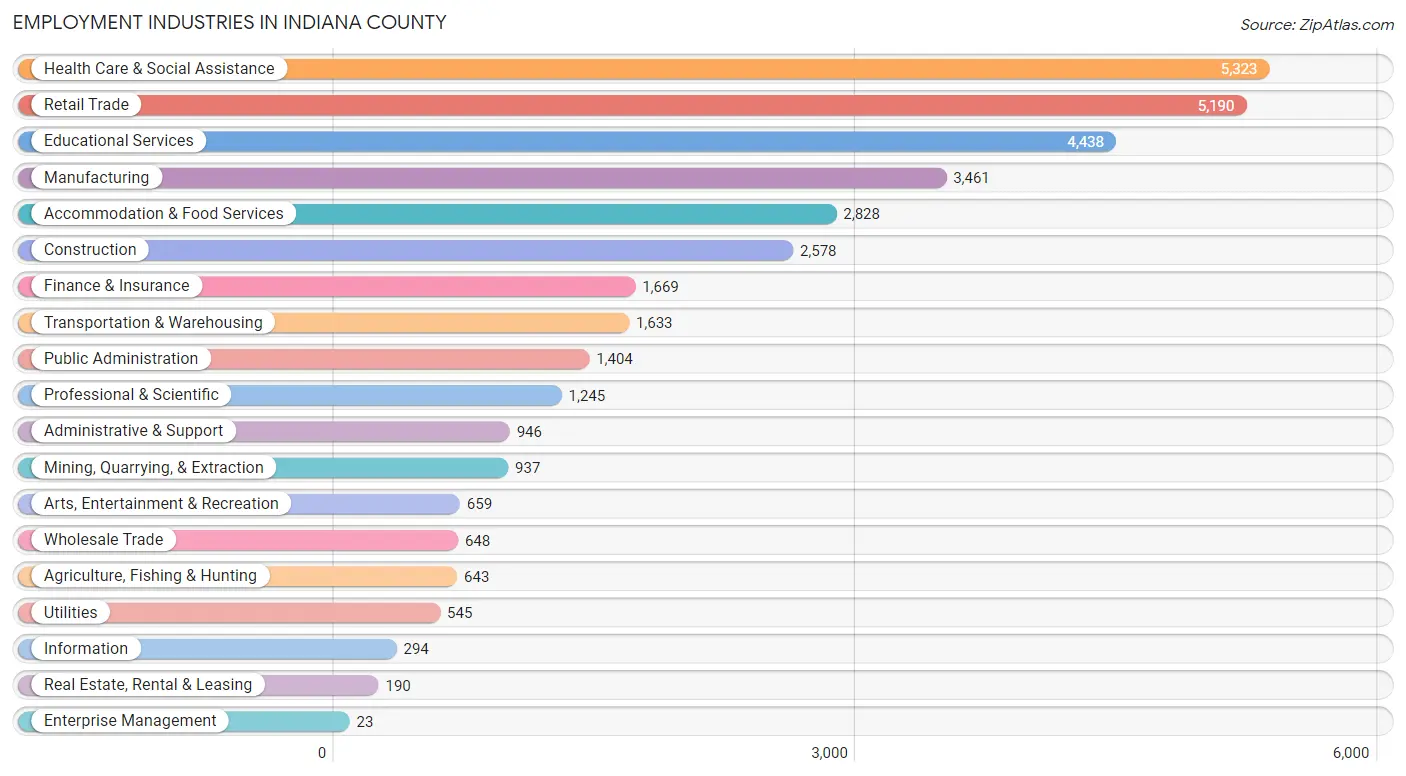
Employment Industries in Indiana County
The major employment industries in Indiana County include Health Care & Social Assistance (5,323 | 14.6%), Retail Trade (5,190 | 14.2%), Educational Services (4,438 | 12.2%), Manufacturing (3,461 | 9.5%), and Accommodation & Food Services (2,828 | 7.7%).
Employment Industries by Sex in Indiana County
The Indiana County industries that see more men than women are Mining, Quarrying, & Extraction (94.1%), Construction (93.0%), and Utilities (89.2%), whereas the industries that tend to have a higher number of women are Health Care & Social Assistance (77.4%), Educational Services (70.1%), and Finance & Insurance (67.2%).
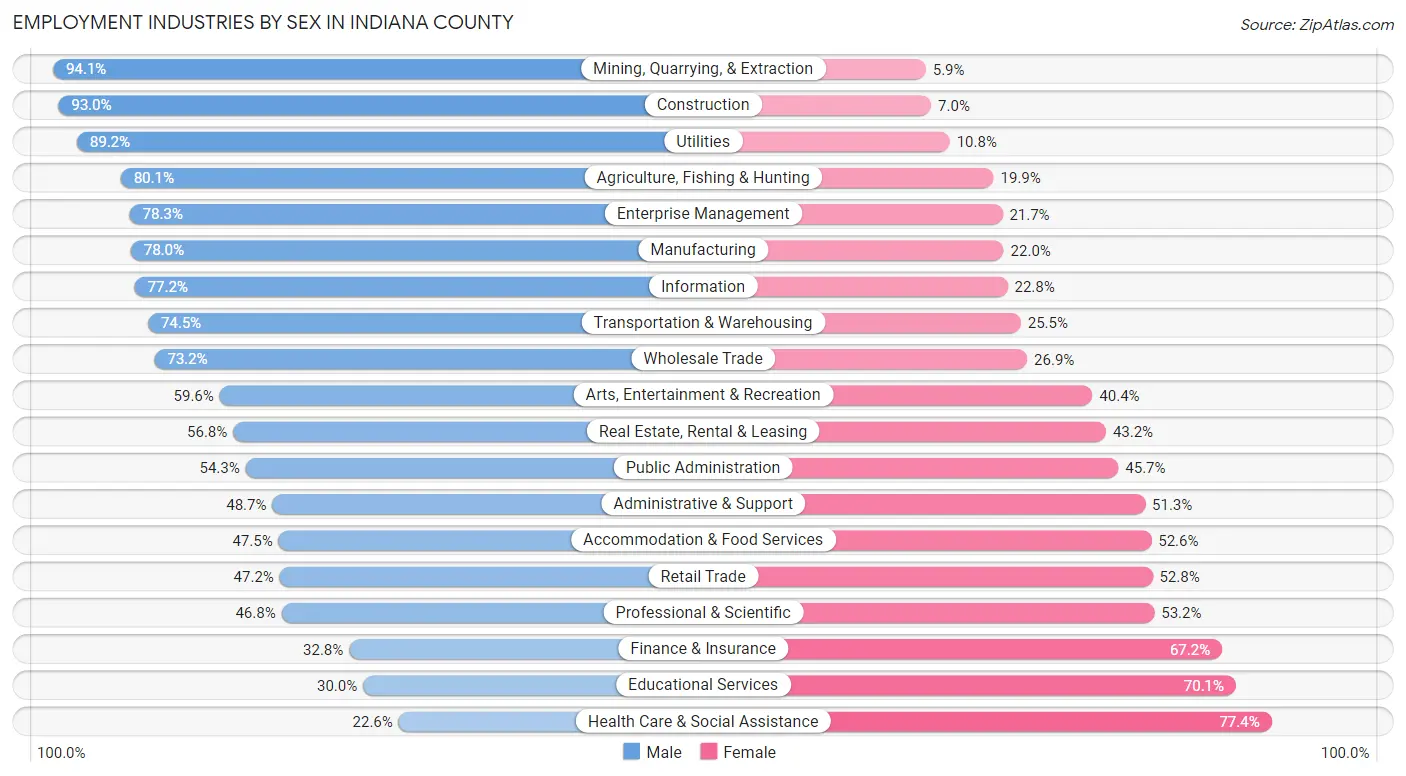
| Industry | Male | Female |
| Agriculture, Fishing & Hunting | 515 (80.1%) | 128 (19.9%) |
| Mining, Quarrying, & Extraction | 882 (94.1%) | 55 (5.9%) |
| Construction | 2,398 (93.0%) | 180 (7.0%) |
| Manufacturing | 2,700 (78.0%) | 761 (22.0%) |
| Wholesale Trade | 474 (73.2%) | 174 (26.9%) |
| Retail Trade | 2,450 (47.2%) | 2,740 (52.8%) |
| Transportation & Warehousing | 1,216 (74.5%) | 417 (25.5%) |
| Utilities | 486 (89.2%) | 59 (10.8%) |
| Information | 227 (77.2%) | 67 (22.8%) |
| Finance & Insurance | 548 (32.8%) | 1,121 (67.2%) |
| Real Estate, Rental & Leasing | 108 (56.8%) | 82 (43.2%) |
| Professional & Scientific | 583 (46.8%) | 662 (53.2%) |
| Enterprise Management | 18 (78.3%) | 5 (21.7%) |
| Administrative & Support | 461 (48.7%) | 485 (51.3%) |
| Educational Services | 1,329 (29.9%) | 3,109 (70.1%) |
| Health Care & Social Assistance | 1,202 (22.6%) | 4,121 (77.4%) |
| Arts, Entertainment & Recreation | 393 (59.6%) | 266 (40.4%) |
| Accommodation & Food Services | 1,342 (47.4%) | 1,486 (52.5%) |
| Public Administration | 762 (54.3%) | 642 (45.7%) |
| Total | 18,980 (52.0%) | 17,528 (48.0%) |
Education in Indiana County
School Enrollment in Indiana County
The most common levels of schooling among the 22,002 students in Indiana County are college / undergraduate (9,273 | 42.1%), high school (3,557 | 16.2%), and middle school (3,204 | 14.6%).
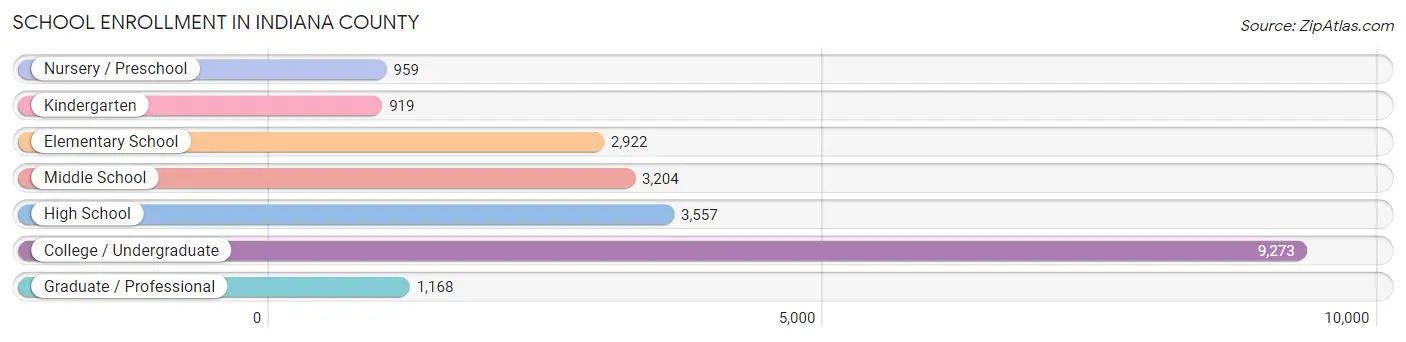
| School Level | # Students | % Students |
| Nursery / Preschool | 959 | 4.4% |
| Kindergarten | 919 | 4.2% |
| Elementary School | 2,922 | 13.3% |
| Middle School | 3,204 | 14.6% |
| High School | 3,557 | 16.2% |
| College / Undergraduate | 9,273 | 42.1% |
| Graduate / Professional | 1,168 | 5.3% |
| Total | 22,002 | 100.0% |
School Enrollment by Age by Funding Source in Indiana County
Out of a total of 22,002 students who are enrolled in schools in Indiana County, 4,312 (19.6%) attend a private institution, while the remaining 17,690 (80.4%) are enrolled in public schools. The age group of 3 to 4 year olds has the highest likelihood of being enrolled in private schools, with 321 (45.2% in the age bracket) enrolled. Conversely, the age group of 15 to 17 year olds has the lowest likelihood of being enrolled in a private school, with 2,188 (92.2% in the age bracket) attending a public institution.
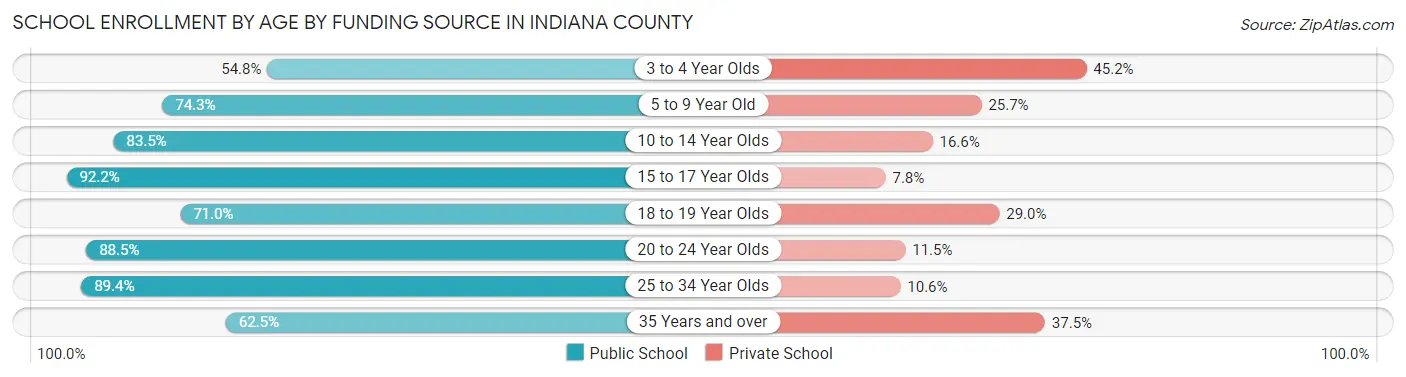
| Age Bracket | Public School | Private School |
| 3 to 4 Year Olds | 389 (54.8%) | 321 (45.2%) |
| 5 to 9 Year Old | 2,666 (74.3%) | 920 (25.7%) |
| 10 to 14 Year Olds | 3,303 (83.5%) | 655 (16.6%) |
| 15 to 17 Year Olds | 2,188 (92.2%) | 185 (7.8%) |
| 18 to 19 Year Olds | 2,957 (71.0%) | 1,207 (29.0%) |
| 20 to 24 Year Olds | 4,788 (88.5%) | 621 (11.5%) |
| 25 to 34 Year Olds | 915 (89.4%) | 108 (10.6%) |
| 35 Years and over | 487 (62.5%) | 292 (37.5%) |
| Total | 17,690 (80.4%) | 4,312 (19.6%) |
Educational Attainment by Field of Study in Indiana County
Education (3,144 | 20.3%), business (2,430 | 15.7%), social sciences (1,900 | 12.3%), science & technology (1,871 | 12.1%), and bio, nature & agricultural (838 | 5.4%) are the most common fields of study among 15,447 individuals in Indiana County who have obtained a bachelor's degree or higher.
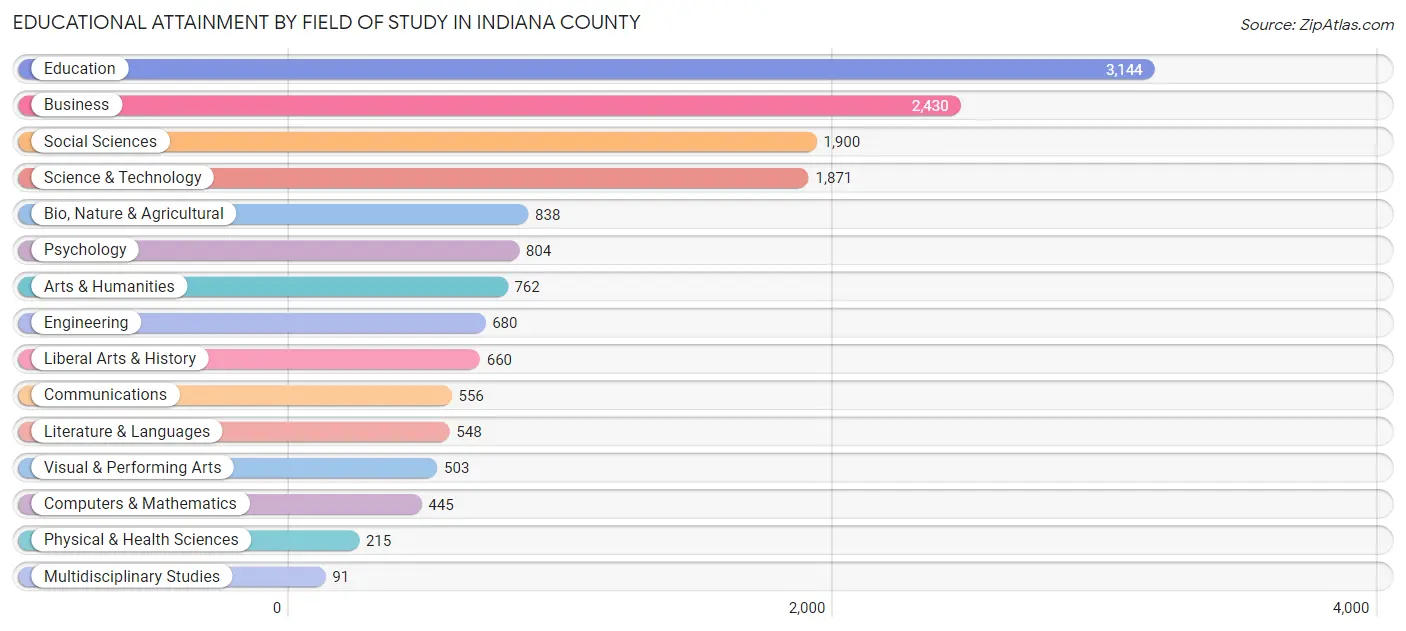
| Field of Study | # Graduates | % Graduates |
| Computers & Mathematics | 445 | 2.9% |
| Bio, Nature & Agricultural | 838 | 5.4% |
| Physical & Health Sciences | 215 | 1.4% |
| Psychology | 804 | 5.2% |
| Social Sciences | 1,900 | 12.3% |
| Engineering | 680 | 4.4% |
| Multidisciplinary Studies | 91 | 0.6% |
| Science & Technology | 1,871 | 12.1% |
| Business | 2,430 | 15.7% |
| Education | 3,144 | 20.3% |
| Literature & Languages | 548 | 3.5% |
| Liberal Arts & History | 660 | 4.3% |
| Visual & Performing Arts | 503 | 3.3% |
| Communications | 556 | 3.6% |
| Arts & Humanities | 762 | 4.9% |
| Total | 15,447 | 100.0% |
Transportation & Commute in Indiana County
Vehicle Availability by Sex in Indiana County
The most prevalent vehicle ownership categories in Indiana County are males with 2 vehicles (7,240, accounting for 40.0%) and females with 2 vehicles (6,837, making up 43.7%).
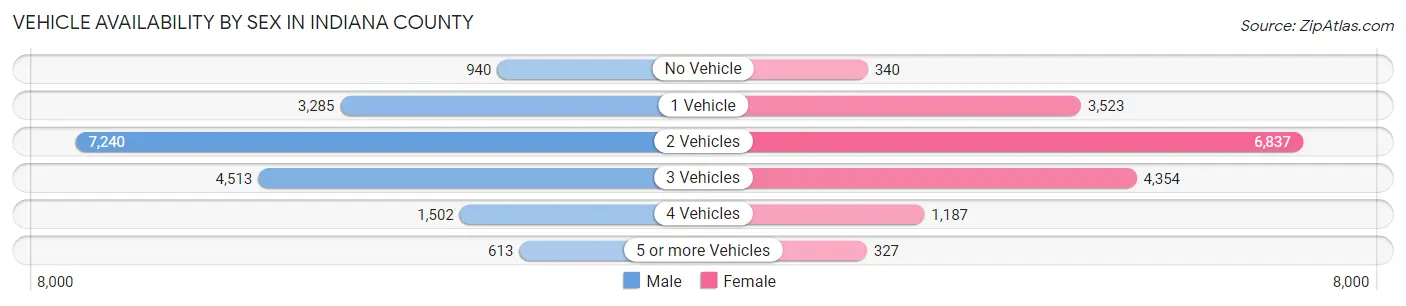
| Vehicles Available | Male | Female |
| No Vehicle | 940 (5.2%) | 340 (2.1%) |
| 1 Vehicle | 3,285 (18.2%) | 3,523 (21.3%) |
| 2 Vehicles | 7,240 (40.0%) | 6,837 (41.3%) |
| 3 Vehicles | 4,513 (24.9%) | 4,354 (26.3%) |
| 4 Vehicles | 1,502 (8.3%) | 1,187 (7.2%) |
| 5 or more Vehicles | 613 (3.4%) | 327 (2.0%) |
| Total | 18,093 (100.0%) | 16,568 (100.0%) |
Commute Time in Indiana County
The most frequently occuring commute durations in Indiana County are 5 to 9 minutes (5,245 commuters, 15.9%), 15 to 19 minutes (4,874 commuters, 14.8%), and 10 to 14 minutes (4,739 commuters, 14.3%).
| Commute Time | # Commuters | % Commuters |
| Less than 5 Minutes | 2,284 | 6.9% |
| 5 to 9 Minutes | 5,245 | 15.9% |
| 10 to 14 Minutes | 4,739 | 14.3% |
| 15 to 19 Minutes | 4,874 | 14.8% |
| 20 to 24 Minutes | 3,451 | 10.4% |
| 25 to 29 Minutes | 1,996 | 6.0% |
| 30 to 34 Minutes | 3,485 | 10.6% |
| 35 to 39 Minutes | 866 | 2.6% |
| 40 to 44 Minutes | 838 | 2.5% |
| 45 to 59 Minutes | 2,032 | 6.2% |
| 60 to 89 Minutes | 2,116 | 6.4% |
| 90 or more Minutes | 1,087 | 3.3% |
Commute Time by Sex in Indiana County
The most common commute times in Indiana County are 15 to 19 minutes (2,482 commuters, 14.2%) for males and 5 to 9 minutes (2,983 commuters, 19.2%) for females.
| Commute Time | Male | Female |
| Less than 5 Minutes | 1,114 (6.4%) | 1,170 (7.5%) |
| 5 to 9 Minutes | 2,262 (13.0%) | 2,983 (19.2%) |
| 10 to 14 Minutes | 2,184 (12.5%) | 2,555 (16.4%) |
| 15 to 19 Minutes | 2,482 (14.2%) | 2,392 (15.4%) |
| 20 to 24 Minutes | 1,584 (9.1%) | 1,867 (12.0%) |
| 25 to 29 Minutes | 941 (5.4%) | 1,055 (6.8%) |
| 30 to 34 Minutes | 1,946 (11.2%) | 1,539 (9.9%) |
| 35 to 39 Minutes | 542 (3.1%) | 324 (2.1%) |
| 40 to 44 Minutes | 516 (3.0%) | 322 (2.1%) |
| 45 to 59 Minutes | 1,456 (8.3%) | 576 (3.7%) |
| 60 to 89 Minutes | 1,480 (8.5%) | 636 (4.1%) |
| 90 or more Minutes | 946 (5.4%) | 141 (0.9%) |
Time of Departure to Work by Sex in Indiana County
The most frequent times of departure to work in Indiana County are 7:00 AM to 7:29 AM (2,194, 12.6%) for males and 7:30 AM to 7:59 AM (2,260, 14.5%) for females.
| Time of Departure | Male | Female |
| 12:00 AM to 4:59 AM | 2,113 (12.1%) | 458 (2.9%) |
| 5:00 AM to 5:29 AM | 1,099 (6.3%) | 327 (2.1%) |
| 5:30 AM to 5:59 AM | 1,252 (7.2%) | 679 (4.4%) |
| 6:00 AM to 6:29 AM | 1,980 (11.3%) | 829 (5.3%) |
| 6:30 AM to 6:59 AM | 1,558 (8.9%) | 1,539 (9.9%) |
| 7:00 AM to 7:29 AM | 2,194 (12.6%) | 1,728 (11.1%) |
| 7:30 AM to 7:59 AM | 1,559 (8.9%) | 2,260 (14.5%) |
| 8:00 AM to 8:29 AM | 1,235 (7.1%) | 1,685 (10.8%) |
| 8:30 AM to 8:59 AM | 922 (5.3%) | 1,136 (7.3%) |
| 9:00 AM to 9:59 AM | 571 (3.3%) | 796 (5.1%) |
| 10:00 AM to 10:59 AM | 203 (1.2%) | 619 (4.0%) |
| 11:00 AM to 11:59 AM | 193 (1.1%) | 340 (2.2%) |
| 12:00 PM to 3:59 PM | 1,473 (8.4%) | 2,043 (13.1%) |
| 4:00 PM to 11:59 PM | 1,101 (6.3%) | 1,121 (7.2%) |
| Total | 17,453 (100.0%) | 15,560 (100.0%) |
Housing Occupancy in Indiana County
Occupancy by Ownership in Indiana County
Of the total 32,285 dwellings in Indiana County, owner-occupied units account for 23,068 (71.5%), while renter-occupied units make up 9,217 (28.5%).
| Occupancy | # Housing Units | % Housing Units |
| Owner Occupied Housing Units | 23,068 | 71.5% |
| Renter-Occupied Housing Units | 9,217 | 28.5% |
| Total Occupied Housing Units | 32,285 | 100.0% |
Occupancy by Household Size in Indiana County
| Household Size | # Housing Units | % Housing Units |
| 1-Person Household | 10,453 | 32.4% |
| 2-Person Household | 12,339 | 38.2% |
| 3-Person Household | 4,152 | 12.9% |
| 4+ Person Household | 5,341 | 16.5% |
| Total Housing Units | 32,285 | 100.0% |
Occupancy by Ownership by Household Size in Indiana County
| Household Size | Owner-occupied | Renter-occupied |
| 1-Person Household | 5,911 (56.6%) | 4,542 (43.4%) |
| 2-Person Household | 9,742 (78.9%) | 2,597 (21.0%) |
| 3-Person Household | 3,243 (78.1%) | 909 (21.9%) |
| 4+ Person Household | 4,172 (78.1%) | 1,169 (21.9%) |
| Total Housing Units | 23,068 (71.5%) | 9,217 (28.5%) |
Occupancy by Educational Attainment in Indiana County
| Household Size | Owner-occupied | Renter-occupied |
| Less than High School | 1,577 (66.8%) | 785 (33.2%) |
| High School Diploma | 8,839 (72.9%) | 3,289 (27.1%) |
| College/Associate Degree | 6,060 (67.7%) | 2,890 (32.3%) |
| Bachelor's Degree or higher | 6,592 (74.5%) | 2,253 (25.5%) |
Occupancy by Age of Householder in Indiana County
| Age Bracket | # Households | % Households |
| Under 35 Years | 5,761 | 17.8% |
| 35 to 44 Years | 4,499 | 13.9% |
| 45 to 54 Years | 4,795 | 14.8% |
| 55 to 64 Years | 6,721 | 20.8% |
| 65 to 74 Years | 6,014 | 18.6% |
| 75 to 84 Years | 2,835 | 8.8% |
| 85 Years and Over | 1,660 | 5.1% |
| Total | 32,285 | 100.0% |
Housing Finances in Indiana County
Median Income by Occupancy in Indiana County
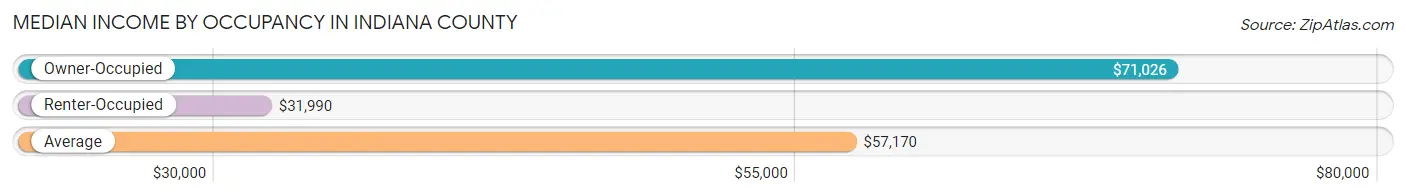
| Occupancy Type | # Households | Median Income |
| Owner-Occupied | 23,068 (71.5%) | $71,026 |
| Renter-Occupied | 9,217 (28.5%) | $31,990 |
| Average | 32,285 (100.0%) | $57,170 |
Occupancy by Householder Income Bracket in Indiana County
| Income Bracket | Owner-occupied | Renter-occupied |
| Less than $5,000 | 454 (2.0%) | 403 (4.4%) |
| $5,000 to $9,999 | 266 (1.1%) | 589 (6.4%) |
| $10,000 to $14,999 | 697 (3.0%) | 950 (10.3%) |
| $15,000 to $19,999 | 708 (3.1%) | 653 (7.1%) |
| $20,000 to $24,999 | 996 (4.3%) | 1,150 (12.5%) |
| $25,000 to $34,999 | 1,963 (8.5%) | 1,220 (13.2%) |
| $35,000 to $49,999 | 3,044 (13.2%) | 1,452 (15.8%) |
| $50,000 to $74,999 | 4,095 (17.7%) | 1,201 (13.0%) |
| $75,000 to $99,999 | 3,614 (15.7%) | 618 (6.7%) |
| $100,000 to $149,999 | 4,079 (17.7%) | 785 (8.5%) |
| $150,000 or more | 3,152 (13.7%) | 196 (2.1%) |
| Total | 23,068 (100.0%) | 9,217 (100.0%) |
Monthly Housing Cost Tiers in Indiana County
| Monthly Cost | Owner-occupied | Renter-occupied |
| Less than $300 | 1,629 (7.1%) | 425 (4.6%) |
| $300 to $499 | 4,664 (20.2%) | 722 (7.8%) |
| $500 to $799 | 6,209 (26.9%) | 3,441 (37.3%) |
| $800 to $999 | 2,342 (10.2%) | 1,895 (20.6%) |
| $1,000 to $1,499 | 4,733 (20.5%) | 1,283 (13.9%) |
| $1,500 to $1,999 | 1,970 (8.5%) | 243 (2.6%) |
| $2,000 to $2,499 | 788 (3.4%) | 78 (0.9%) |
| $2,500 to $2,999 | 354 (1.5%) | 0 (0.0%) |
| $3,000 or more | 379 (1.6%) | 27 (0.3%) |
| Total | 23,068 (100.0%) | 9,217 (100.0%) |
Physical Housing Characteristics in Indiana County
Housing Structures in Indiana County
| Structure Type | # Housing Units | % Housing Units |
| Single Unit, Detached | 22,996 | 71.2% |
| Single Unit, Attached | 1,360 | 4.2% |
| 2 Unit Apartments | 760 | 2.4% |
| 3 or 4 Unit Apartments | 1,094 | 3.4% |
| 5 to 9 Unit Apartments | 975 | 3.0% |
| 10 or more Apartments | 1,866 | 5.8% |
| Mobile Home / Other | 3,234 | 10.0% |
| Total | 32,285 | 100.0% |
Housing Structures by Occupancy in Indiana County
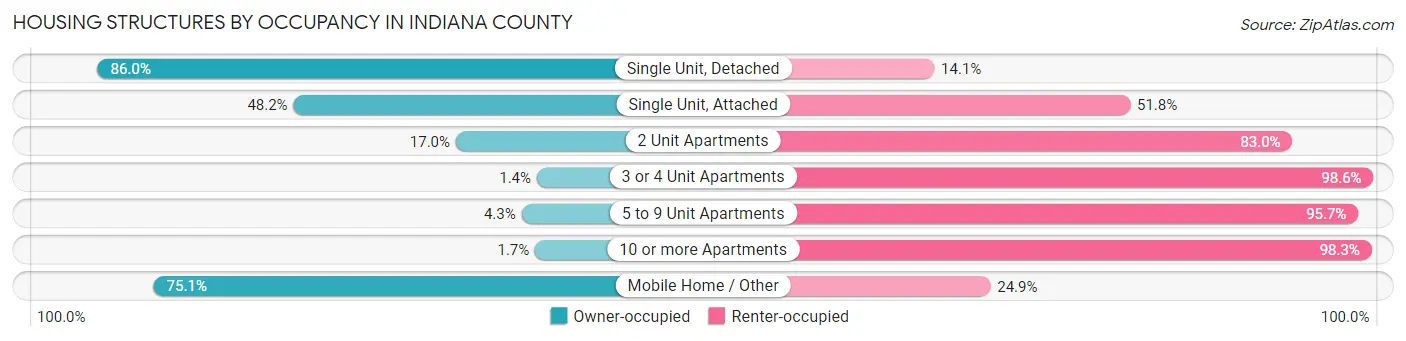
| Structure Type | Owner-occupied | Renter-occupied |
| Single Unit, Detached | 19,764 (86.0%) | 3,232 (14.1%) |
| Single Unit, Attached | 656 (48.2%) | 704 (51.8%) |
| 2 Unit Apartments | 129 (17.0%) | 631 (83.0%) |
| 3 or 4 Unit Apartments | 15 (1.4%) | 1,079 (98.6%) |
| 5 to 9 Unit Apartments | 42 (4.3%) | 933 (95.7%) |
| 10 or more Apartments | 32 (1.7%) | 1,834 (98.3%) |
| Mobile Home / Other | 2,430 (75.1%) | 804 (24.9%) |
| Total | 23,068 (71.5%) | 9,217 (28.5%) |
Housing Structures by Number of Rooms in Indiana County
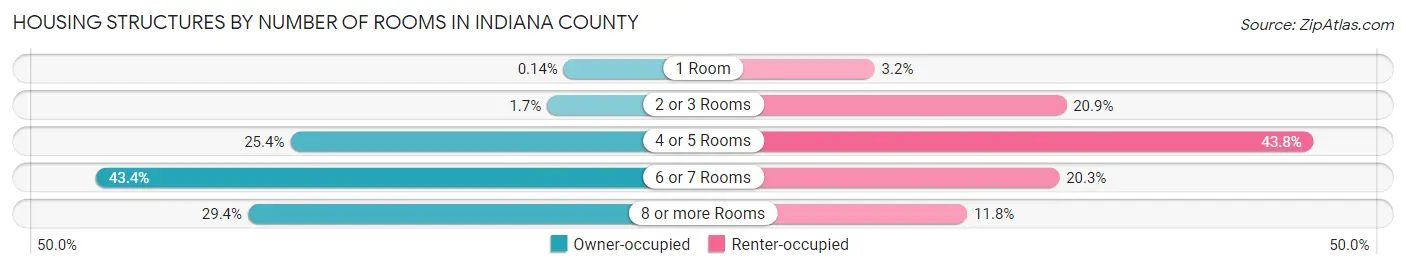
| Number of Rooms | Owner-occupied | Renter-occupied |
| 1 Room | 33 (0.1%) | 296 (3.2%) |
| 2 or 3 Rooms | 388 (1.7%) | 1,929 (20.9%) |
| 4 or 5 Rooms | 5,866 (25.4%) | 4,038 (43.8%) |
| 6 or 7 Rooms | 10,011 (43.4%) | 1,869 (20.3%) |
| 8 or more Rooms | 6,770 (29.3%) | 1,085 (11.8%) |
| Total | 23,068 (100.0%) | 9,217 (100.0%) |
Housing Structure by Heating Type in Indiana County
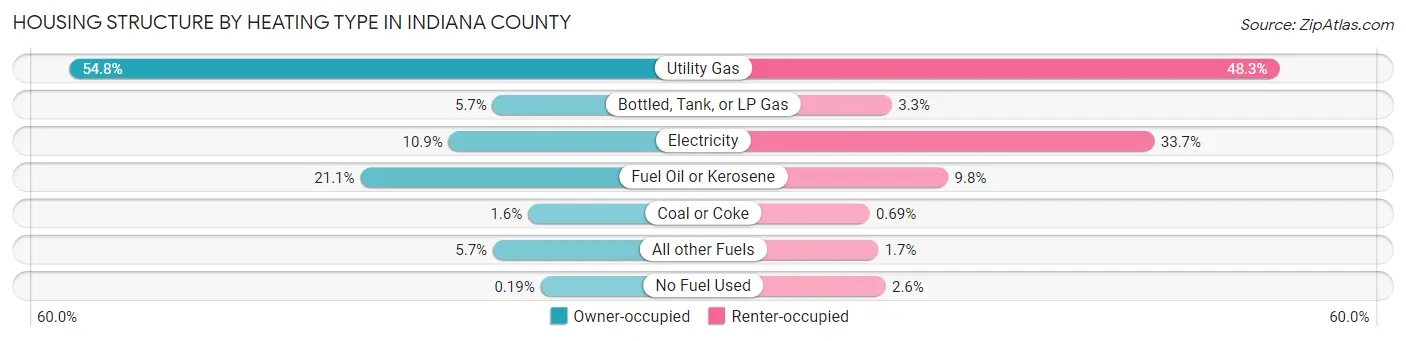
| Heating Type | Owner-occupied | Renter-occupied |
| Utility Gas | 12,645 (54.8%) | 4,448 (48.3%) |
| Bottled, Tank, or LP Gas | 1,325 (5.7%) | 301 (3.3%) |
| Electricity | 2,503 (10.8%) | 3,108 (33.7%) |
| Fuel Oil or Kerosene | 4,860 (21.1%) | 904 (9.8%) |
| Coal or Coke | 377 (1.6%) | 64 (0.7%) |
| All other Fuels | 1,314 (5.7%) | 157 (1.7%) |
| No Fuel Used | 44 (0.2%) | 235 (2.5%) |
| Total | 23,068 (100.0%) | 9,217 (100.0%) |
Household Vehicle Usage in Indiana County
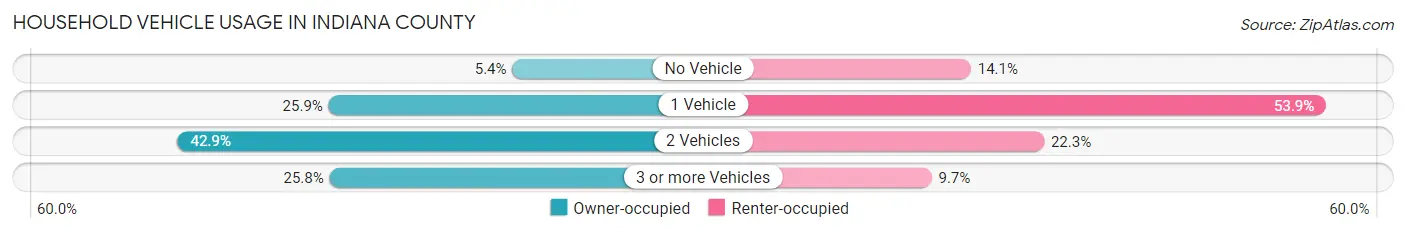
| Vehicles per Household | Owner-occupied | Renter-occupied |
| No Vehicle | 1,236 (5.4%) | 1,300 (14.1%) |
| 1 Vehicle | 5,983 (25.9%) | 4,968 (53.9%) |
| 2 Vehicles | 9,888 (42.9%) | 2,055 (22.3%) |
| 3 or more Vehicles | 5,961 (25.8%) | 894 (9.7%) |
| Total | 23,068 (100.0%) | 9,217 (100.0%) |
Real Estate & Mortgages in Indiana County
Real Estate and Mortgage Overview in Indiana County
| Characteristic | Without Mortgage | With Mortgage |
| Housing Units | 12,229 | 10,839 |
| Median Property Value | $126,600 | $149,900 |
| Median Household Income | $55,428 | $2,037 |
| Monthly Housing Costs | $503 | $359 |
| Real Estate Taxes | $2,189 | $146 |
Property Value by Mortgage Status in Indiana County
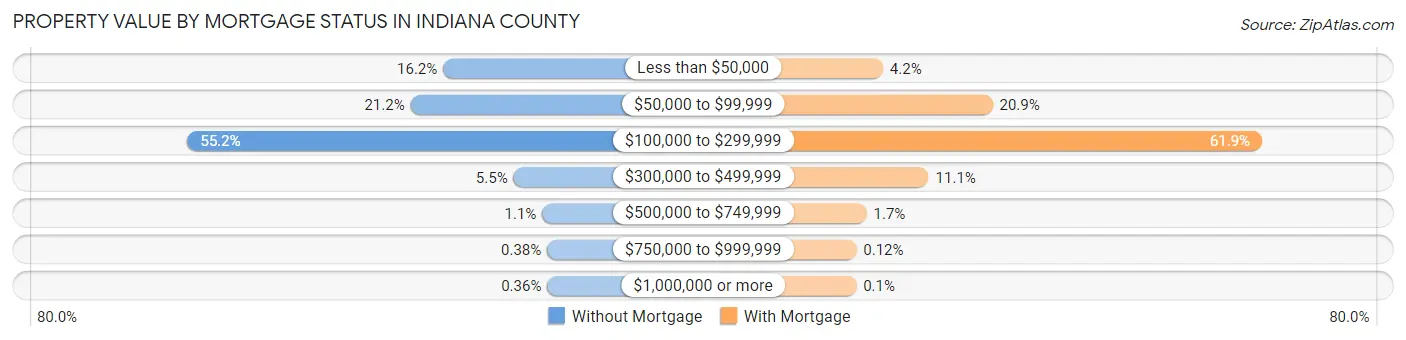
| Property Value | Without Mortgage | With Mortgage |
| Less than $50,000 | 1,985 (16.2%) | 452 (4.2%) |
| $50,000 to $99,999 | 2,592 (21.2%) | 2,262 (20.9%) |
| $100,000 to $299,999 | 6,751 (55.2%) | 6,711 (61.9%) |
| $300,000 to $499,999 | 673 (5.5%) | 1,208 (11.1%) |
| $500,000 to $749,999 | 138 (1.1%) | 182 (1.7%) |
| $750,000 to $999,999 | 46 (0.4%) | 13 (0.1%) |
| $1,000,000 or more | 44 (0.4%) | 11 (0.1%) |
| Total | 12,229 (100.0%) | 10,839 (100.0%) |
Household Income by Mortgage Status in Indiana County
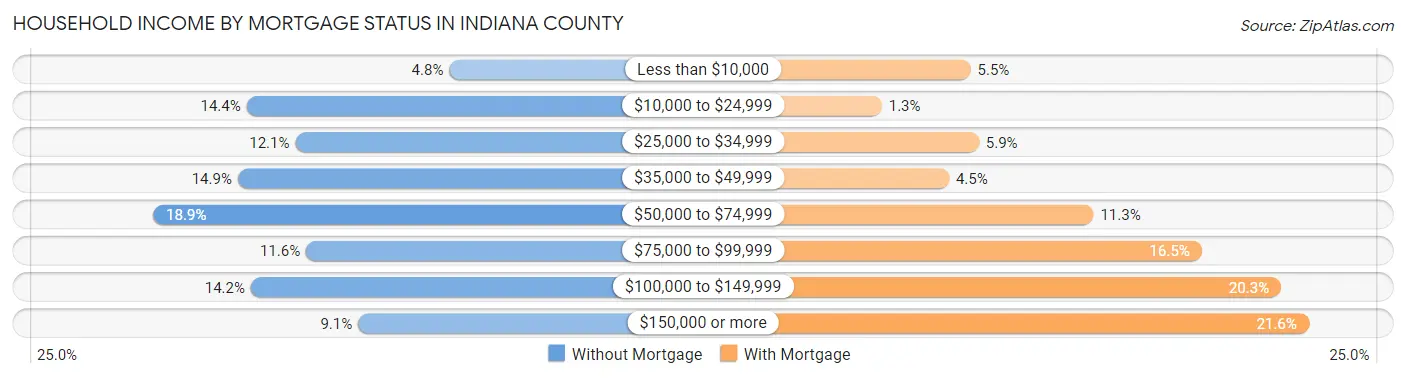
| Household Income | Without Mortgage | With Mortgage |
| Less than $10,000 | 585 (4.8%) | 594 (5.5%) |
| $10,000 to $24,999 | 1,765 (14.4%) | 135 (1.3%) |
| $25,000 to $34,999 | 1,481 (12.1%) | 636 (5.9%) |
| $35,000 to $49,999 | 1,816 (14.8%) | 482 (4.4%) |
| $50,000 to $74,999 | 2,309 (18.9%) | 1,228 (11.3%) |
| $75,000 to $99,999 | 1,418 (11.6%) | 1,786 (16.5%) |
| $100,000 to $149,999 | 1,740 (14.2%) | 2,196 (20.3%) |
| $150,000 or more | 1,115 (9.1%) | 2,339 (21.6%) |
| Total | 12,229 (100.0%) | 10,839 (100.0%) |
Property Value to Household Income Ratio in Indiana County
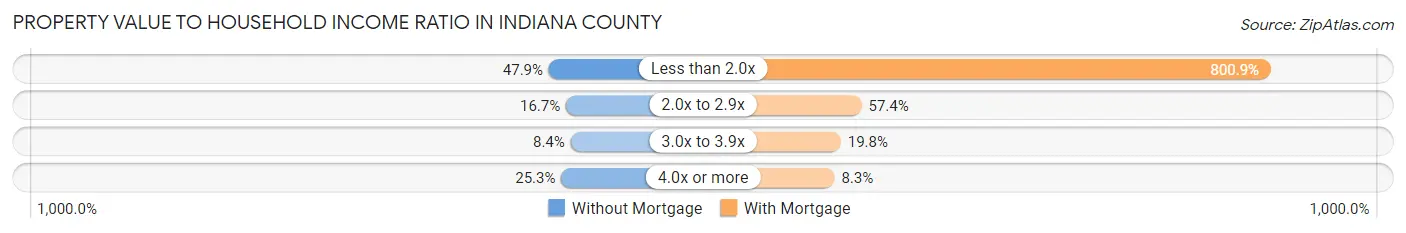
| Value-to-Income Ratio | Without Mortgage | With Mortgage |
| Less than 2.0x | 5,856 (47.9%) | 86,806 (800.9%) |
| 2.0x to 2.9x | 2,041 (16.7%) | 6,224 (57.4%) |
| 3.0x to 3.9x | 1,026 (8.4%) | 2,144 (19.8%) |
| 4.0x or more | 3,092 (25.3%) | 901 (8.3%) |
| Total | 12,229 (100.0%) | 10,839 (100.0%) |
Real Estate Taxes by Mortgage Status in Indiana County
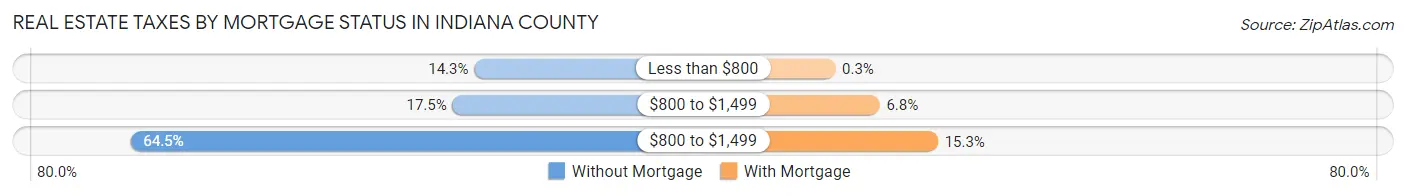
| Property Taxes | Without Mortgage | With Mortgage |
| Less than $800 | 1,747 (14.3%) | 33 (0.3%) |
| $800 to $1,499 | 2,136 (17.5%) | 735 (6.8%) |
| $800 to $1,499 | 7,893 (64.5%) | 1,657 (15.3%) |
| Total | 12,229 (100.0%) | 10,839 (100.0%) |
Health & Disability in Indiana County
Health Insurance Coverage by Age in Indiana County
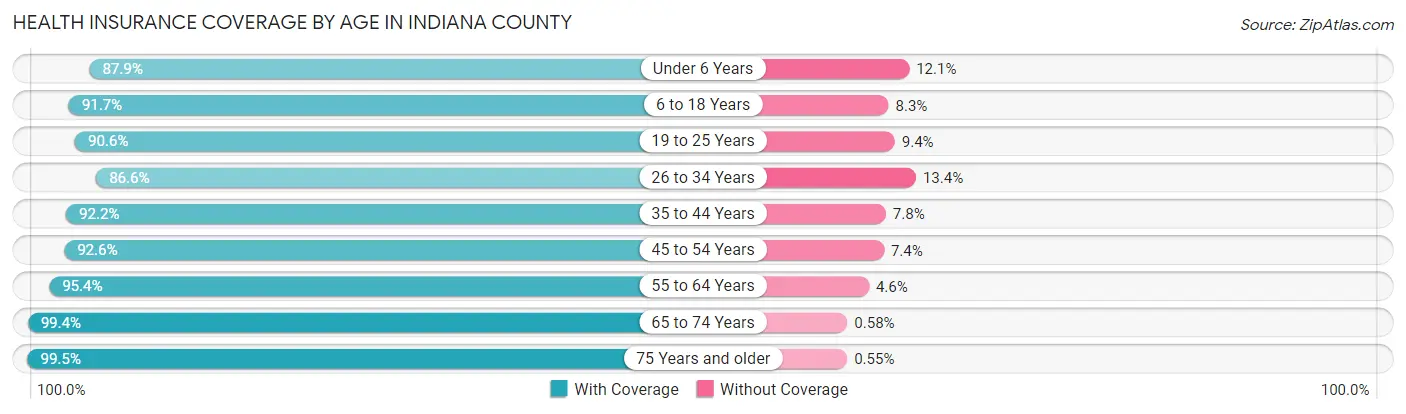
| Age Bracket | With Coverage | Without Coverage |
| Under 6 Years | 4,066 (87.9%) | 560 (12.1%) |
| 6 to 18 Years | 11,680 (91.7%) | 1,052 (8.3%) |
| 19 to 25 Years | 11,306 (90.6%) | 1,176 (9.4%) |
| 26 to 34 Years | 6,285 (86.6%) | 970 (13.4%) |
| 35 to 44 Years | 7,643 (92.2%) | 643 (7.8%) |
| 45 to 54 Years | 8,374 (92.6%) | 669 (7.4%) |
| 55 to 64 Years | 11,046 (95.4%) | 533 (4.6%) |
| 65 to 74 Years | 9,405 (99.4%) | 55 (0.6%) |
| 75 Years and older | 6,546 (99.5%) | 36 (0.5%) |
| Total | 76,351 (93.1%) | 5,694 (6.9%) |
Health Insurance Coverage by Citizenship Status in Indiana County
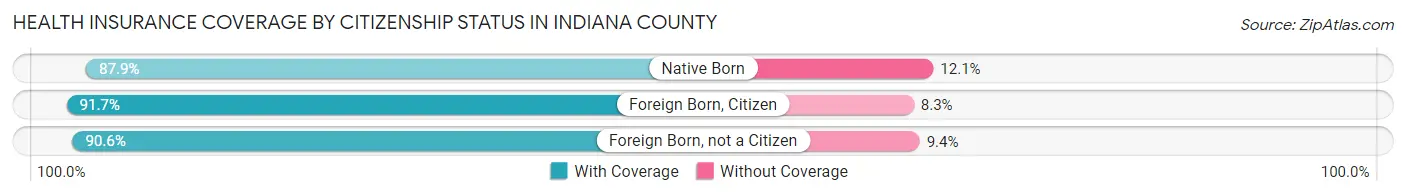
| Citizenship Status | With Coverage | Without Coverage |
| Native Born | 4,066 (87.9%) | 560 (12.1%) |
| Foreign Born, Citizen | 11,680 (91.7%) | 1,052 (8.3%) |
| Foreign Born, not a Citizen | 11,306 (90.6%) | 1,176 (9.4%) |
Health Insurance Coverage by Household Income in Indiana County
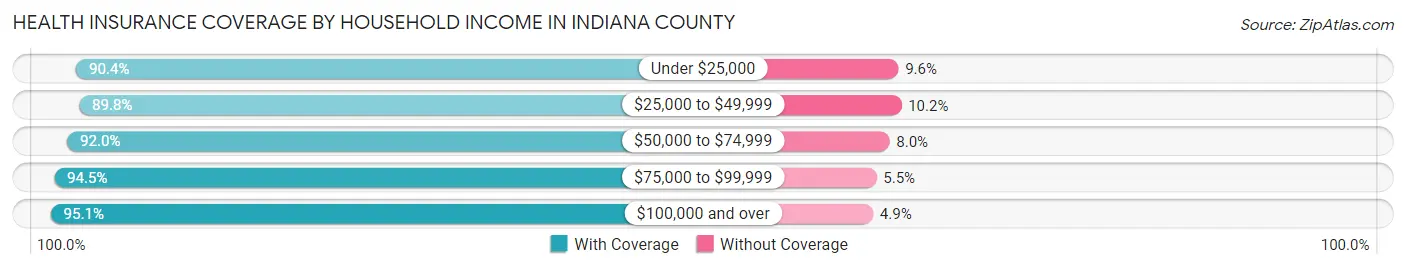
| Household Income | With Coverage | Without Coverage |
| Under $25,000 | 9,660 (90.4%) | 1,030 (9.6%) |
| $25,000 to $49,999 | 14,361 (89.8%) | 1,632 (10.2%) |
| $50,000 to $74,999 | 11,630 (92.0%) | 1,008 (8.0%) |
| $75,000 to $99,999 | 11,610 (94.5%) | 681 (5.5%) |
| $100,000 and over | 24,764 (95.1%) | 1,274 (4.9%) |
Public vs Private Health Insurance Coverage by Age in Indiana County
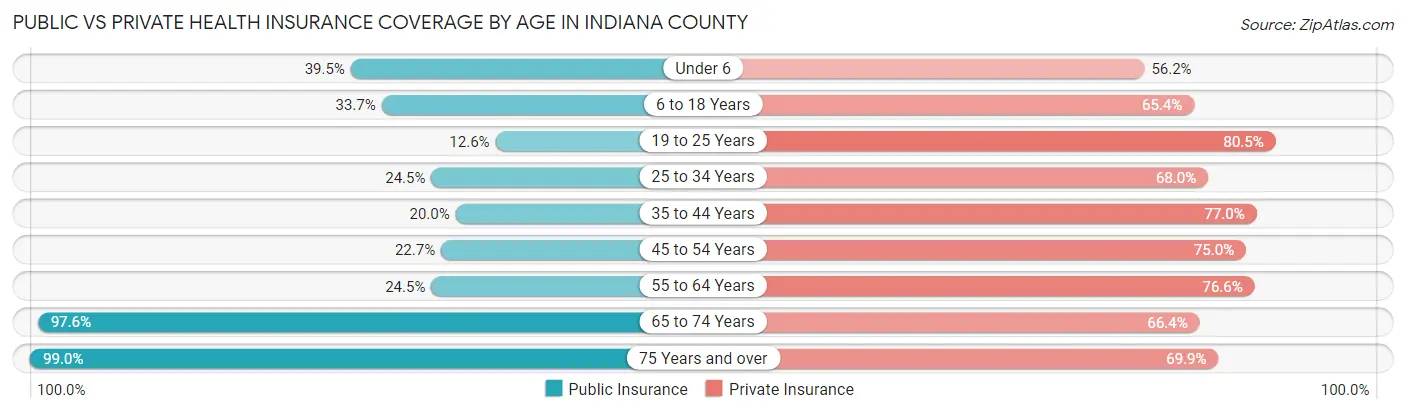
| Age Bracket | Public Insurance | Private Insurance |
| Under 6 | 1,826 (39.5%) | 2,599 (56.2%) |
| 6 to 18 Years | 4,296 (33.7%) | 8,327 (65.4%) |
| 19 to 25 Years | 1,574 (12.6%) | 10,049 (80.5%) |
| 25 to 34 Years | 1,778 (24.5%) | 4,931 (68.0%) |
| 35 to 44 Years | 1,658 (20.0%) | 6,378 (77.0%) |
| 45 to 54 Years | 2,054 (22.7%) | 6,784 (75.0%) |
| 55 to 64 Years | 2,839 (24.5%) | 8,870 (76.6%) |
| 65 to 74 Years | 9,229 (97.6%) | 6,281 (66.4%) |
| 75 Years and over | 6,514 (99.0%) | 4,600 (69.9%) |
| Total | 31,768 (38.7%) | 58,819 (71.7%) |
Disability Status by Sex by Age in Indiana County
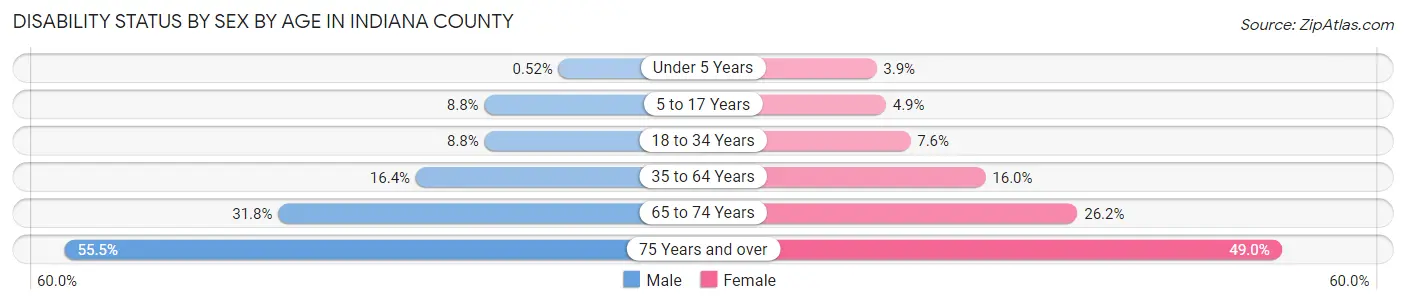
| Age Bracket | Male | Female |
| Under 5 Years | 10 (0.5%) | 72 (3.8%) |
| 5 to 17 Years | 493 (8.8%) | 269 (4.9%) |
| 18 to 34 Years | 975 (8.8%) | 846 (7.6%) |
| 35 to 64 Years | 2,380 (16.4%) | 2,304 (16.0%) |
| 65 to 74 Years | 1,488 (31.8%) | 1,252 (26.2%) |
| 75 Years and over | 1,520 (55.5%) | 1,883 (49.0%) |
Disability Class by Sex by Age in Indiana County
Disability Class: Hearing Difficulty
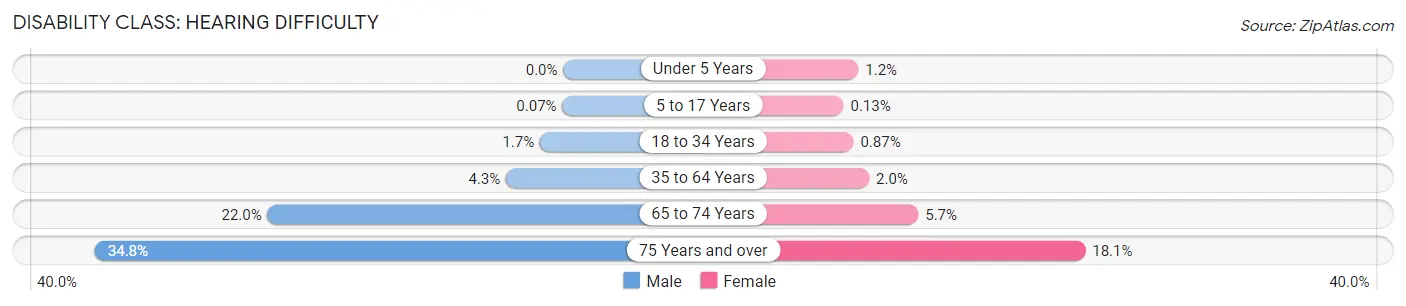
| Age Bracket | Male | Female |
| Under 5 Years | 0 (0.0%) | 23 (1.2%) |
| 5 to 17 Years | 4 (0.1%) | 7 (0.1%) |
| 18 to 34 Years | 192 (1.7%) | 96 (0.9%) |
| 35 to 64 Years | 616 (4.3%) | 292 (2.0%) |
| 65 to 74 Years | 1,029 (22.0%) | 271 (5.7%) |
| 75 Years and over | 952 (34.8%) | 695 (18.1%) |
Disability Class: Vision Difficulty
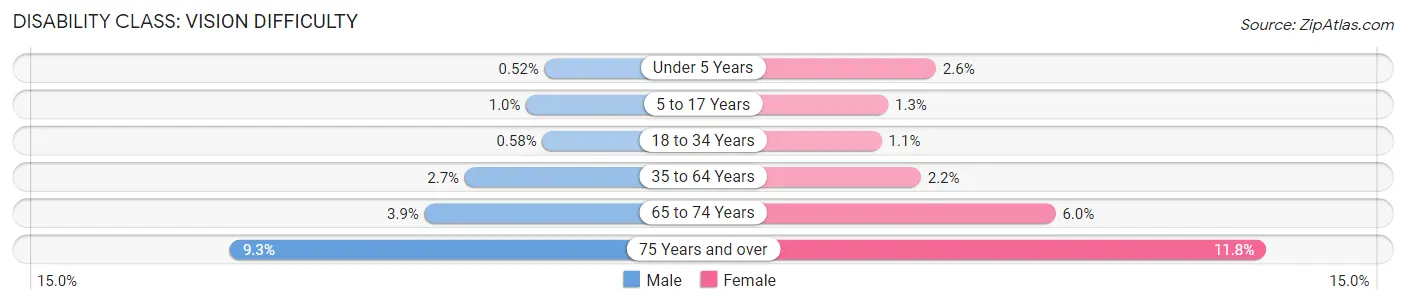
| Age Bracket | Male | Female |
| Under 5 Years | 10 (0.5%) | 49 (2.6%) |
| 5 to 17 Years | 58 (1.0%) | 71 (1.3%) |
| 18 to 34 Years | 65 (0.6%) | 123 (1.1%) |
| 35 to 64 Years | 397 (2.7%) | 317 (2.2%) |
| 65 to 74 Years | 181 (3.9%) | 284 (5.9%) |
| 75 Years and over | 254 (9.3%) | 454 (11.8%) |
Disability Class: Cognitive Difficulty
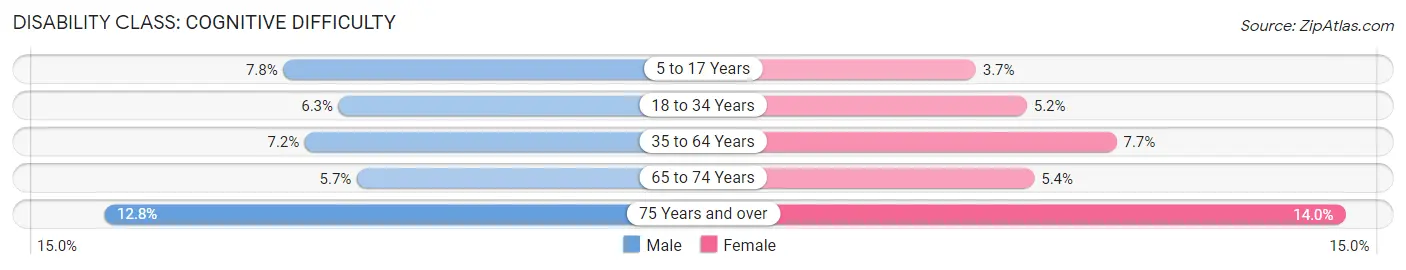
| Age Bracket | Male | Female |
| 5 to 17 Years | 437 (7.8%) | 205 (3.7%) |
| 18 to 34 Years | 694 (6.2%) | 571 (5.1%) |
| 35 to 64 Years | 1,042 (7.2%) | 1,102 (7.6%) |
| 65 to 74 Years | 269 (5.7%) | 256 (5.4%) |
| 75 Years and over | 350 (12.8%) | 539 (14.0%) |
Disability Class: Ambulatory Difficulty
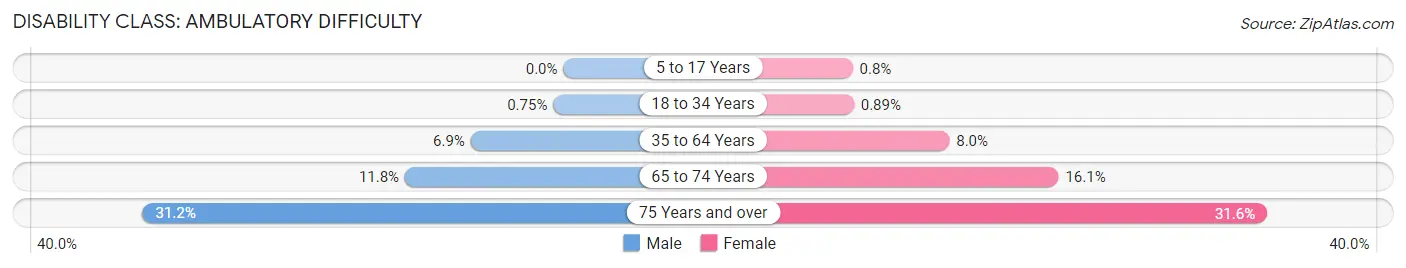
| Age Bracket | Male | Female |
| 5 to 17 Years | 0 (0.0%) | 44 (0.8%) |
| 18 to 34 Years | 83 (0.7%) | 99 (0.9%) |
| 35 to 64 Years | 998 (6.9%) | 1,150 (8.0%) |
| 65 to 74 Years | 551 (11.8%) | 768 (16.1%) |
| 75 Years and over | 855 (31.2%) | 1,214 (31.6%) |
Disability Class: Self-Care Difficulty
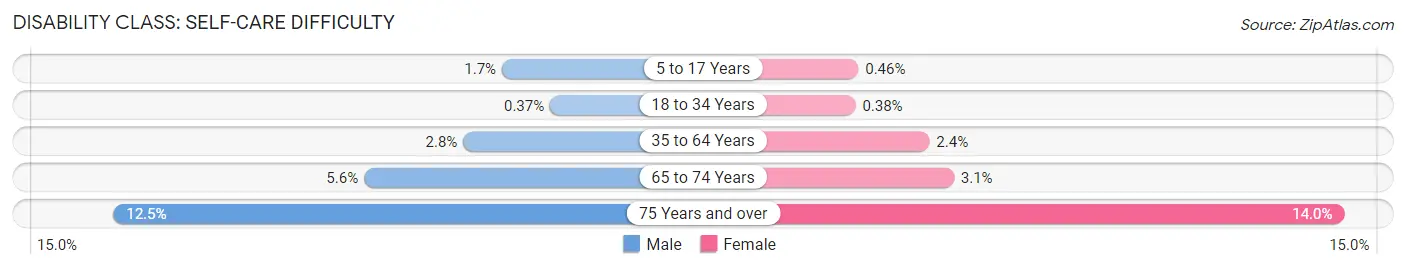
| Age Bracket | Male | Female |
| 5 to 17 Years | 96 (1.7%) | 25 (0.5%) |
| 18 to 34 Years | 41 (0.4%) | 42 (0.4%) |
| 35 to 64 Years | 404 (2.8%) | 351 (2.4%) |
| 65 to 74 Years | 260 (5.6%) | 149 (3.1%) |
| 75 Years and over | 343 (12.5%) | 538 (14.0%) |
Technology Access in Indiana County
Computing Device Access in Indiana County
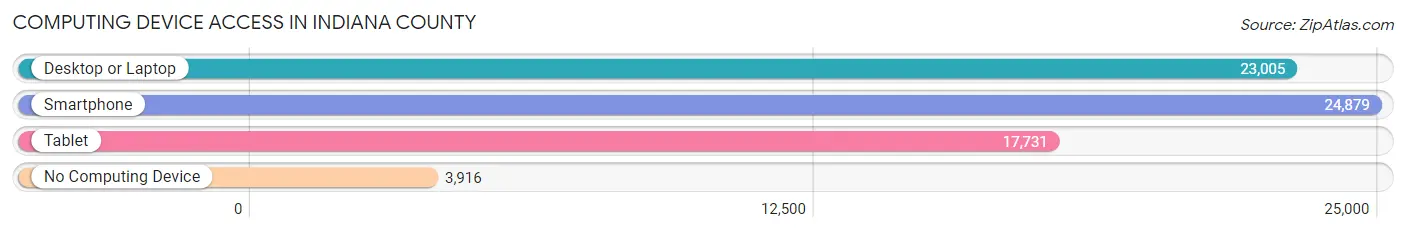
| Device Type | # Households | % Households |
| Desktop or Laptop | 23,005 | 71.3% |
| Smartphone | 24,879 | 77.1% |
| Tablet | 17,731 | 54.9% |
| No Computing Device | 3,916 | 12.1% |
| Total | 32,285 | 100.0% |
Internet Access in Indiana County
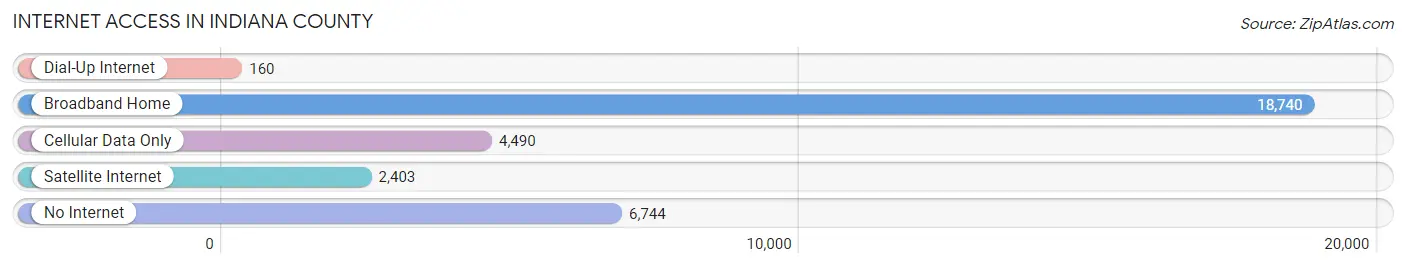
| Internet Type | # Households | % Households |
| Dial-Up Internet | 160 | 0.5% |
| Broadband Home | 18,740 | 58.1% |
| Cellular Data Only | 4,490 | 13.9% |
| Satellite Internet | 2,403 | 7.4% |
| No Internet | 6,744 | 20.9% |
| Total | 32,285 | 100.0% |
Indiana County Summary
Introduction
Indiana County is located in the southwestern corner of Pennsylvania, and is part of the Pittsburgh metropolitan area. It is bordered by Westmoreland County to the north, Armstrong County to the east, Cambria County to the south, and Clearfield County to the west. The county seat is Indiana, and the county was created in 1803 from parts of Westmoreland and Clearfield counties. The county has a total area of 834 square miles, and a population of 88,880 as of the 2010 census.
History
The area that is now Indiana County was originally inhabited by the Shawnee and Delaware Native American tribes. The first European settlers arrived in the area in the late 1700s, and the county was officially established in 1803. The county was named after the Indiana Territory, which was created in 1800.
The county was largely agricultural in the early 19th century, and the first railroad line was built in 1854. The county experienced a period of rapid growth in the late 19th and early 20th centuries, as the coal and steel industries flourished in the area. The county was also home to several glass factories, which produced a variety of products, including bottles, jars, and window glass.
Geography
Indiana County is located in the southwestern corner of Pennsylvania, and is part of the Pittsburgh metropolitan area. It is bordered by Westmoreland County to the north, Armstrong County to the east, Cambria County to the south, and Clearfield County to the west. The county has a total area of 834 square miles, and is mostly rural, with rolling hills and valleys. The county is home to several state parks, including Yellow Creek State Park, Raccoon Creek State Park, and Prince Gallitzin State Park.
Economy
Indiana County’s economy is largely based on agriculture, manufacturing, and tourism. The county is home to several large employers, including Indiana Regional Medical Center, Indiana University of Pennsylvania, and the Indiana County Technology Center. The county is also home to several small businesses, including restaurants, retail stores, and service providers.
The county is home to several large agricultural operations, including dairy farms, beef farms, and poultry farms. The county is also home to several manufacturing companies, including glass factories, steel mills, and paper mills. The county is also home to several tourist attractions, including the Indiana County Historical Museum, the Jimmy Stewart Museum, and the Indiana County Tourist Bureau.
Demographics
As of the 2010 census, the population of Indiana County was 88,880. The population is largely white (93.3%), with small percentages of African Americans (2.7%), Asians (1.2%), and Hispanics (1.2%). The median household income is $45,837, and the median age is 42.7 years.
Conclusion
Indiana County is located in the southwestern corner of Pennsylvania, and is part of the Pittsburgh metropolitan area. It is bordered by Westmoreland County to the north, Armstrong County to the east, Cambria County to the south, and Clearfield County to the west. The county has a total area of 834 square miles, and a population of 88,880 as of the 2010 census. The county’s economy is largely based on agriculture, manufacturing, and tourism, and the population is largely white (93.3%), with small percentages of African Americans (2.7%), Asians (1.2%), and Hispanics (1.2%). Indiana County is a vibrant and diverse community, and is a great place to live, work, and visit.
Common Questions
What is Per Capita Income in Indiana County?
Per Capita income in Indiana County is $30,494.
What is the Median Family Income in Indiana County?
Median Family Income in Indiana County is $78,873.
What is the Median Household income in Indiana County?
Median Household Income in Indiana County is $57,170.
What is Income or Wage Gap in Indiana County?
Income or Wage Gap in Indiana County is 46.5%.
Women in Indiana County earn 53.5 cents for every dollar earned by a man.
What is Family Income Deficit in Indiana County?
Family Income Deficit in Indiana County is $10,759.
Families that are below poverty line in Indiana County earn $10,759 less on average than the poverty threshold level.
What is Inequality or Gini Index in Indiana County?
Inequality or Gini Index in Indiana County is 0.45.
What is the Total Population of Indiana County?
Total Population of Indiana County is 83,394.
What is the Total Male Population of Indiana County?
Total Male Population of Indiana County is 41,593.
What is the Total Female Population of Indiana County?
Total Female Population of Indiana County is 41,801.
What is the Ratio of Males per 100 Females in Indiana County?
There are 99.50 Males per 100 Females in Indiana County.
What is the Ratio of Females per 100 Males in Indiana County?
There are 100.50 Females per 100 Males in Indiana County.
What is the Median Population Age in Indiana County?
Median Population Age in Indiana County is 39.6 Years.
What is the Average Family Size in Indiana County
Average Family Size in Indiana County is 3.1 People.
What is the Average Household Size in Indiana County
Average Household Size in Indiana County is 2.4 People.
How Large is the Labor Force in Indiana County?
There are 39,122 People in the Labor Forcein in Indiana County.
What is the Percentage of People in the Labor Force in Indiana County?
55.6% of People are in the Labor Force in Indiana County.
What is the Unemployment Rate in Indiana County?
Unemployment Rate in Indiana County is 6.5%.