Carbon County, PA Map & Demographics
Carbon County Map
Carbon County Overview
$34,375
PER CAPITA INCOME
$76,535
AVG FAMILY INCOME
$64,538
AVG HOUSEHOLD INCOME
30.6%
WAGE / INCOME GAP [ % ]
69.4¢/ $1
WAGE / INCOME GAP [ $ ]
$11,062
FAMILY INCOME DEFICIT
0.43
INEQUALITY / GINI INDEX
65,018
TOTAL POPULATION
32,644
MALE POPULATION
32,374
FEMALE POPULATION
100.83
MALES / 100 FEMALES
99.17
FEMALES / 100 MALES
46.3
MEDIAN AGE
2.9
AVG FAMILY SIZE
2.4
AVG HOUSEHOLD SIZE
33,068
LABOR FORCE [ PEOPLE ]
61.0%
PERCENT IN LABOR FORCE
6.9%
UNEMPLOYMENT RATE
Income in Carbon County
Income Overview in Carbon County
Per Capita Income in Carbon County is $34,375, while median incomes of families and households are $76,535 and $64,538 respectively.
| Characteristic | Number | Measure |
| Per Capita Income | 65,018 | $34,375 |
| Median Family Income | 16,956 | $76,535 |
| Mean Family Income | 16,956 | $91,720 |
| Median Household Income | 26,662 | $64,538 |
| Mean Household Income | 26,662 | $81,615 |
| Income Deficit | 16,956 | $11,062 |
| Wage / Income Gap (%) | 65,018 | 30.64% |
| Wage / Income Gap ($) | 65,018 | 69.36¢ per $1 |
| Gini / Inequality Index | 65,018 | 0.43 |
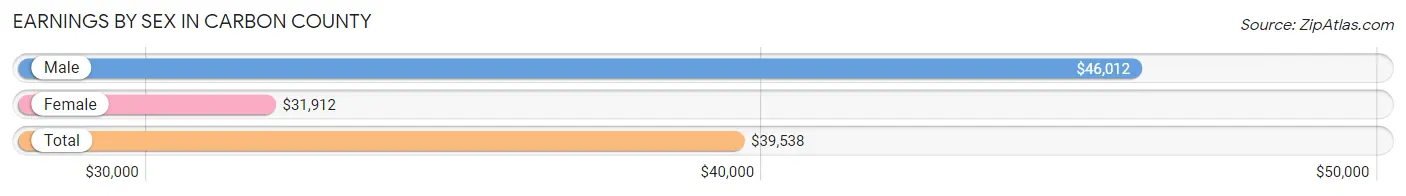
Earnings by Sex in Carbon County
Average Earnings in Carbon County are $39,538, $46,012 for men and $31,912 for women, a difference of 30.6%.
| Sex | Number | Average Earnings |
| Male | 17,831 (52.8%) | $46,012 |
| Female | 15,962 (47.2%) | $31,912 |
| Total | 33,793 (100.0%) | $39,538 |
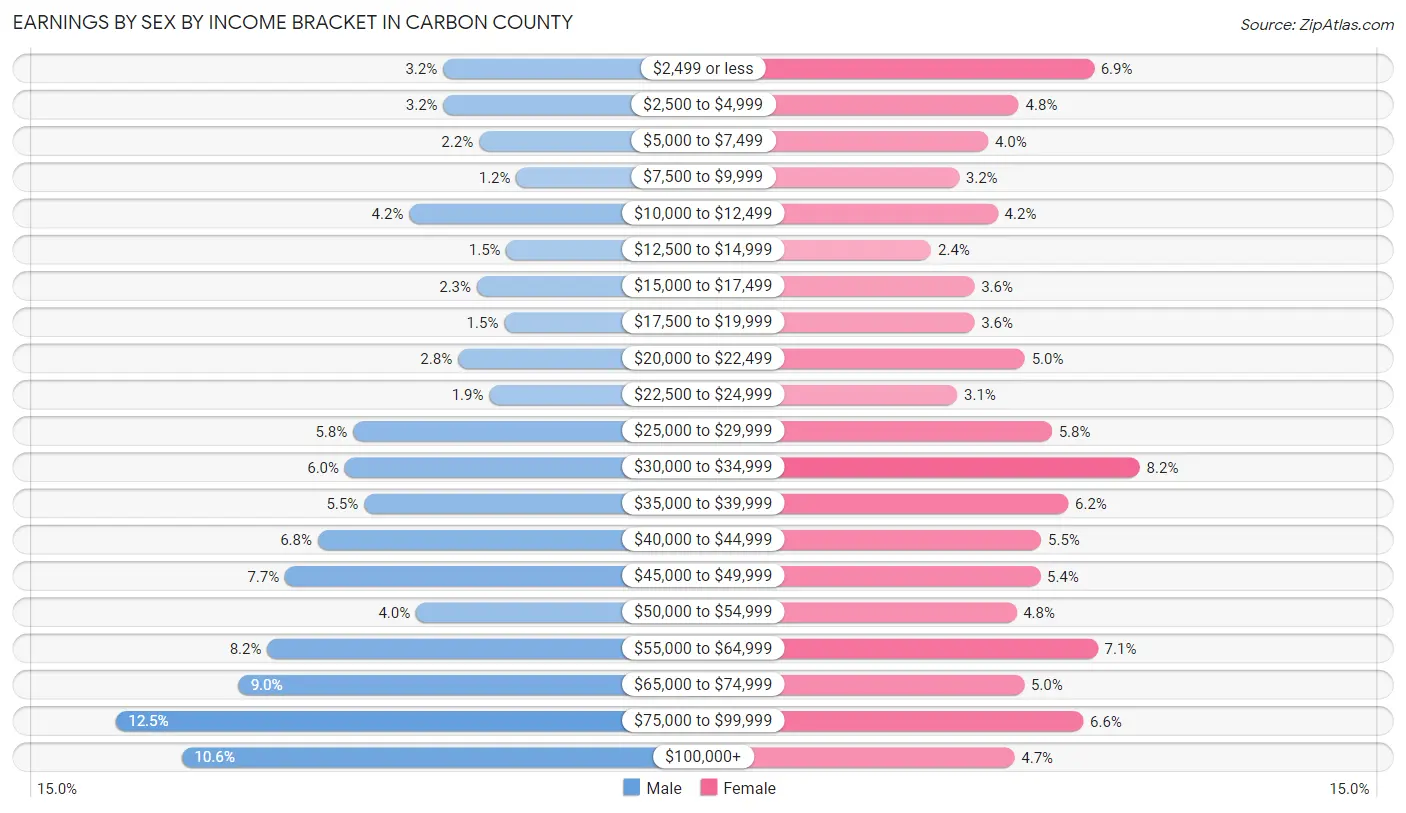
Earnings by Sex by Income Bracket in Carbon County
The most common earnings brackets in Carbon County are $75,000 to $99,999 for men (2,220 | 12.4%) and $30,000 to $34,999 for women (1,314 | 8.2%).
| Income | Male | Female |
| $2,499 or less | 577 (3.2%) | 1,107 (6.9%) |
| $2,500 to $4,999 | 576 (3.2%) | 771 (4.8%) |
| $5,000 to $7,499 | 397 (2.2%) | 633 (4.0%) |
| $7,500 to $9,999 | 210 (1.2%) | 503 (3.2%) |
| $10,000 to $12,499 | 748 (4.2%) | 677 (4.2%) |
| $12,500 to $14,999 | 261 (1.5%) | 379 (2.4%) |
| $15,000 to $17,499 | 409 (2.3%) | 572 (3.6%) |
| $17,500 to $19,999 | 271 (1.5%) | 571 (3.6%) |
| $20,000 to $22,499 | 503 (2.8%) | 798 (5.0%) |
| $22,500 to $24,999 | 346 (1.9%) | 495 (3.1%) |
| $25,000 to $29,999 | 1,029 (5.8%) | 919 (5.8%) |
| $30,000 to $34,999 | 1,069 (6.0%) | 1,314 (8.2%) |
| $35,000 to $39,999 | 974 (5.5%) | 993 (6.2%) |
| $40,000 to $44,999 | 1,206 (6.8%) | 871 (5.5%) |
| $45,000 to $49,999 | 1,369 (7.7%) | 866 (5.4%) |
| $50,000 to $54,999 | 714 (4.0%) | 760 (4.8%) |
| $55,000 to $64,999 | 1,458 (8.2%) | 1,126 (7.0%) |
| $65,000 to $74,999 | 1,606 (9.0%) | 795 (5.0%) |
| $75,000 to $99,999 | 2,220 (12.4%) | 1,060 (6.6%) |
| $100,000+ | 1,888 (10.6%) | 752 (4.7%) |
| Total | 17,831 (100.0%) | 15,962 (100.0%) |
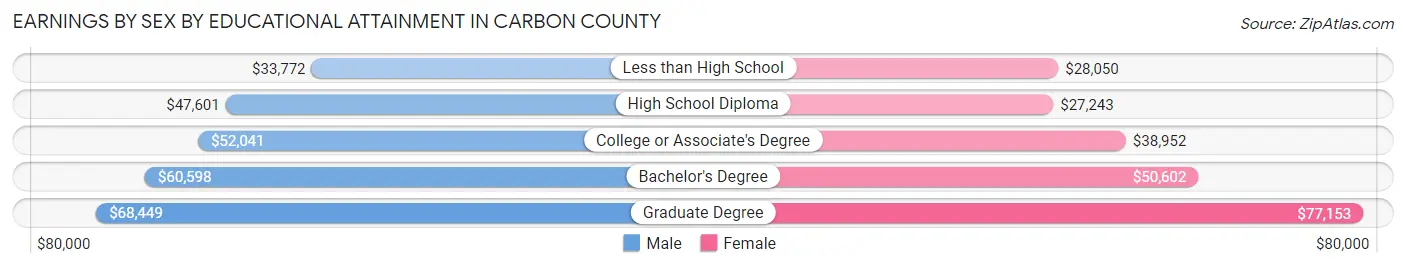
Earnings by Sex by Educational Attainment in Carbon County
Average earnings in Carbon County are $50,111 for men and $35,995 for women, a difference of 28.2%. Men with an educational attainment of graduate degree enjoy the highest average annual earnings of $68,449, while those with less than high school education earn the least with $33,772. Women with an educational attainment of graduate degree earn the most with the average annual earnings of $77,153, while those with high school diploma education have the smallest earnings of $27,243.
| Educational Attainment | Male Income | Female Income |
| Less than High School | $33,772 | $28,050 |
| High School Diploma | $47,601 | $27,243 |
| College or Associate's Degree | $52,041 | $38,952 |
| Bachelor's Degree | $60,598 | $50,602 |
| Graduate Degree | $68,449 | $77,153 |
| Total | $50,111 | $35,995 |
Family Income in Carbon County
Family Income Brackets in Carbon County
According to the Carbon County family income data, there are 3,476 families falling into the $100,000 to $149,999 income range, which is the most common income bracket and makes up 20.5% of all families. Conversely, the $10,000 to $14,999 income bracket is the least frequent group with only 322 families (1.9%) belonging to this category.
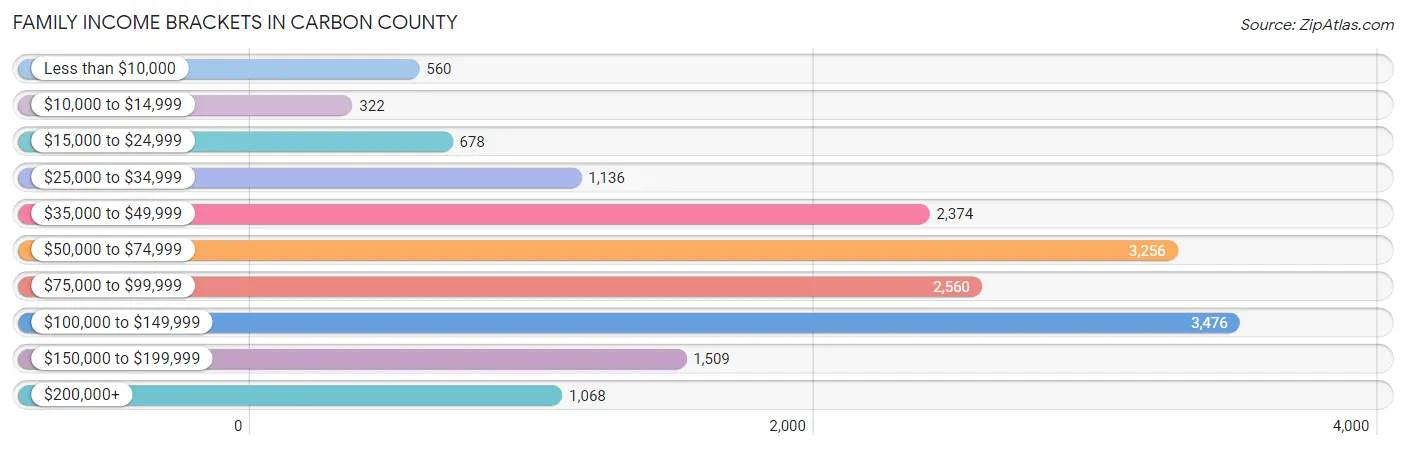
| Income Bracket | # Families | % Families |
| Less than $10,000 | 560 | 3.3% |
| $10,000 to $14,999 | 322 | 1.9% |
| $15,000 to $24,999 | 678 | 4.0% |
| $25,000 to $34,999 | 1,136 | 6.7% |
| $35,000 to $49,999 | 2,374 | 14.0% |
| $50,000 to $74,999 | 3,256 | 19.2% |
| $75,000 to $99,999 | 2,560 | 15.1% |
| $100,000 to $149,999 | 3,476 | 20.5% |
| $150,000 to $199,999 | 1,509 | 8.9% |
| $200,000+ | 1,068 | 6.3% |
Family Income by Famaliy Size in Carbon County
6-person families (313 | 1.8%) account for the highest median family income in Carbon County with $120,208 per family, while 2-person families (8,865 | 52.3%) have the highest median income of $32,967 per family member.
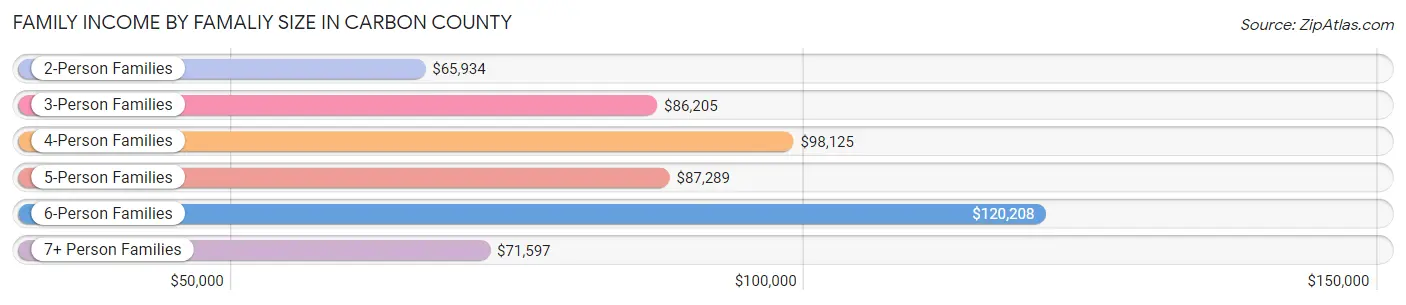
| Income Bracket | # Families | Median Income |
| 2-Person Families | 8,865 (52.3%) | $65,934 |
| 3-Person Families | 4,067 (24.0%) | $86,205 |
| 4-Person Families | 2,366 (14.0%) | $98,125 |
| 5-Person Families | 1,282 (7.6%) | $87,289 |
| 6-Person Families | 313 (1.8%) | $120,208 |
| 7+ Person Families | 63 (0.4%) | $71,597 |
| Total | 16,956 (100.0%) | $76,535 |
Family Income by Number of Earners in Carbon County
The median family income in Carbon County is $76,535, with families comprising 3+ earners (2,150) having the highest median family income of $139,818, while families with no earners (3,183) have the lowest median family income of $42,700, accounting for 12.7% and 18.8% of families, respectively.
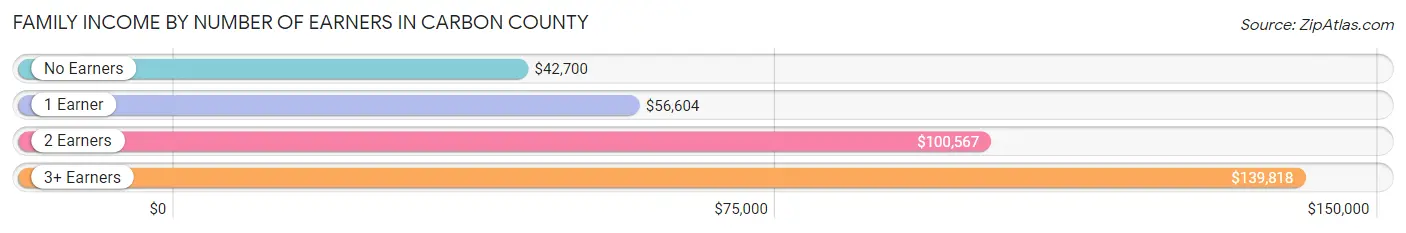
| Number of Earners | # Families | Median Income |
| No Earners | 3,183 (18.8%) | $42,700 |
| 1 Earner | 5,683 (33.5%) | $56,604 |
| 2 Earners | 5,940 (35.0%) | $100,567 |
| 3+ Earners | 2,150 (12.7%) | $139,818 |
| Total | 16,956 (100.0%) | $76,535 |
Household Income in Carbon County
Household Income Brackets in Carbon County
With 4,932 households falling in the category, the $50,000 to $74,999 income range is the most frequent in Carbon County, accounting for 18.5% of all households. In contrast, only 1,066 households (4.0%) fall into the less than $10,000 income bracket, making it the least populous group.
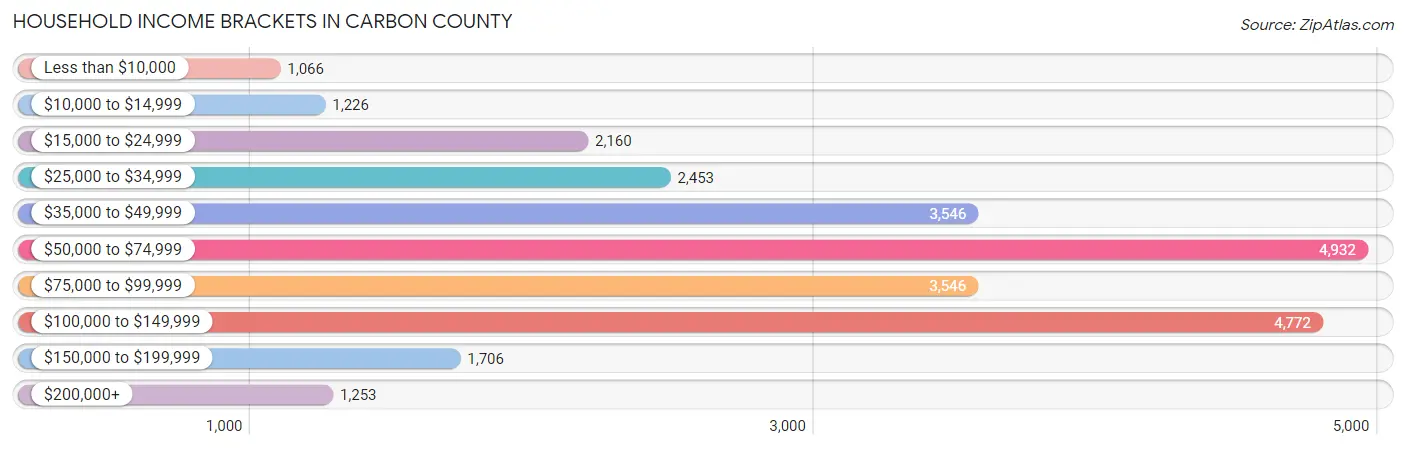
| Income Bracket | # Households | % Households |
| Less than $10,000 | 1,066 | 4.0% |
| $10,000 to $14,999 | 1,226 | 4.6% |
| $15,000 to $24,999 | 2,160 | 8.1% |
| $25,000 to $34,999 | 2,453 | 9.2% |
| $35,000 to $49,999 | 3,546 | 13.3% |
| $50,000 to $74,999 | 4,932 | 18.5% |
| $75,000 to $99,999 | 3,546 | 13.3% |
| $100,000 to $149,999 | 4,772 | 17.9% |
| $150,000 to $199,999 | 1,706 | 6.4% |
| $200,000+ | 1,253 | 4.7% |
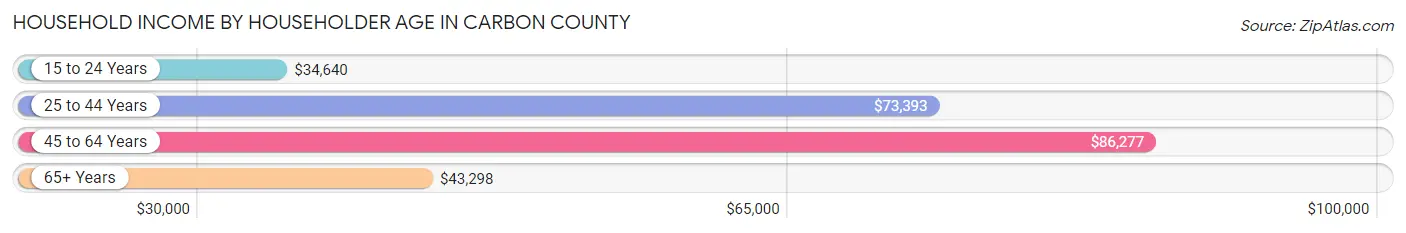
Household Income by Householder Age in Carbon County
The median household income in Carbon County is $64,538, with the highest median household income of $86,277 found in the 45 to 64 years age bracket for the primary householder. A total of 10,604 households (39.8%) fall into this category. Meanwhile, the 15 to 24 years age bracket for the primary householder has the lowest median household income of $34,640, with 693 households (2.6%) in this group.
| Income Bracket | # Households | Median Income |
| 15 to 24 Years | 693 (2.6%) | $34,640 |
| 25 to 44 Years | 6,310 (23.7%) | $73,393 |
| 45 to 64 Years | 10,604 (39.8%) | $86,277 |
| 65+ Years | 9,055 (34.0%) | $43,298 |
| Total | 26,662 (100.0%) | $64,538 |
Poverty in Carbon County
Income Below Poverty by Sex and Age in Carbon County
With 10.1% poverty level for males and 13.5% for females among the residents of Carbon County, under 5 year old males and 15 year old females are the most vulnerable to poverty, with 552 males (37.5%) and 111 females (43.5%) in their respective age groups living below the poverty level.
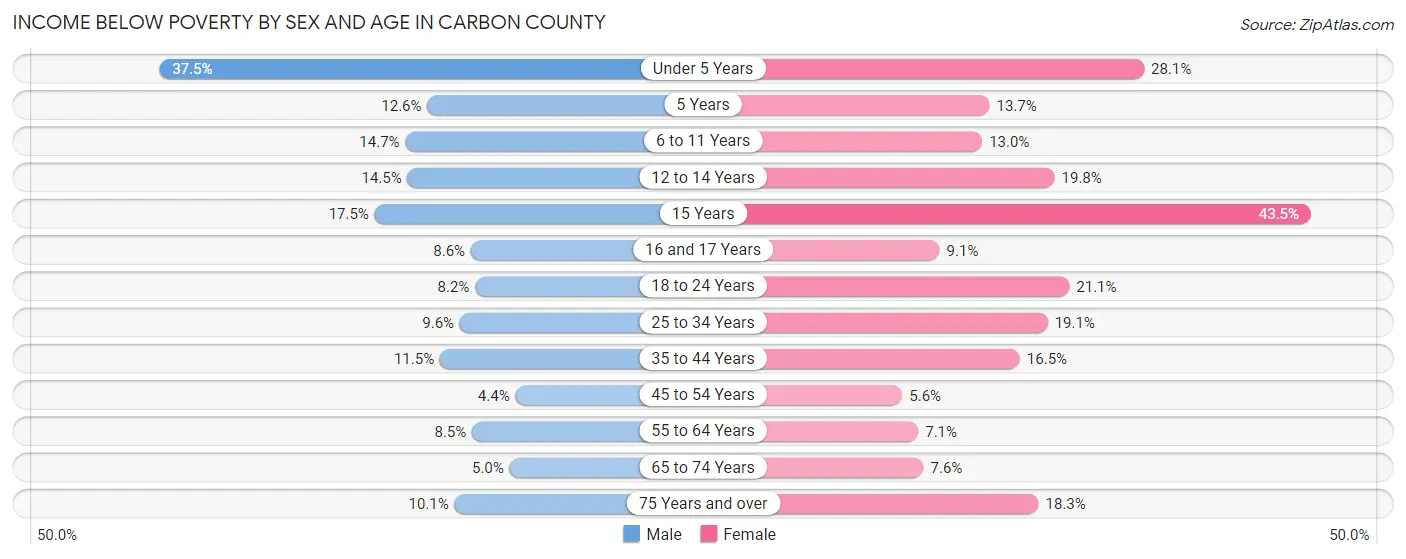
| Age Bracket | Male | Female |
| Under 5 Years | 552 (37.5%) | 407 (28.1%) |
| 5 Years | 39 (12.6%) | 24 (13.7%) |
| 6 to 11 Years | 271 (14.7%) | 265 (13.0%) |
| 12 to 14 Years | 194 (14.5%) | 234 (19.8%) |
| 15 Years | 83 (17.5%) | 111 (43.5%) |
| 16 and 17 Years | 57 (8.6%) | 79 (9.1%) |
| 18 to 24 Years | 198 (8.2%) | 452 (21.1%) |
| 25 to 34 Years | 341 (9.6%) | 648 (19.1%) |
| 35 to 44 Years | 447 (11.5%) | 600 (16.5%) |
| 45 to 54 Years | 202 (4.4%) | 250 (5.6%) |
| 55 to 64 Years | 439 (8.5%) | 366 (7.1%) |
| 65 to 74 Years | 210 (5.0%) | 310 (7.6%) |
| 75 Years and over | 225 (10.1%) | 547 (18.3%) |
| Total | 3,258 (10.1%) | 4,293 (13.5%) |
Income Above Poverty by Sex and Age in Carbon County
According to the poverty statistics in Carbon County, males aged 45 to 54 years and females aged 45 to 54 years are the age groups that are most secure financially, with 95.6% of males and 94.4% of females in these age groups living above the poverty line.
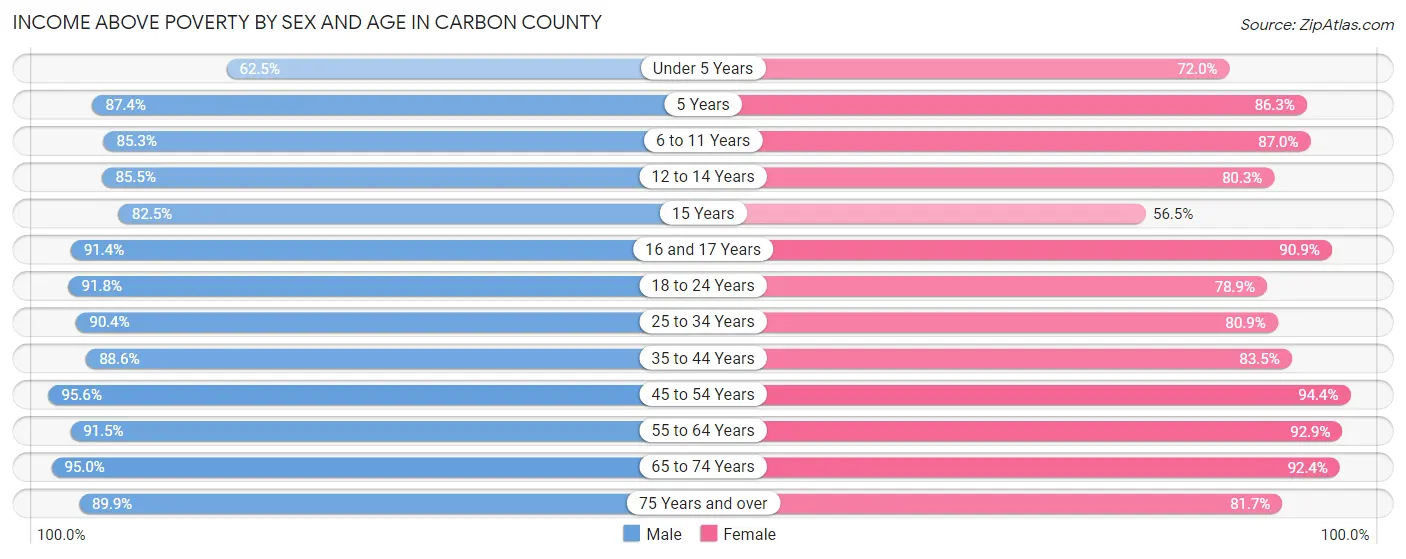
| Age Bracket | Male | Female |
| Under 5 Years | 920 (62.5%) | 1,044 (72.0%) |
| 5 Years | 270 (87.4%) | 151 (86.3%) |
| 6 to 11 Years | 1,577 (85.3%) | 1,768 (87.0%) |
| 12 to 14 Years | 1,148 (85.5%) | 951 (80.2%) |
| 15 Years | 391 (82.5%) | 144 (56.5%) |
| 16 and 17 Years | 607 (91.4%) | 791 (90.9%) |
| 18 to 24 Years | 2,223 (91.8%) | 1,688 (78.9%) |
| 25 to 34 Years | 3,212 (90.4%) | 2,743 (80.9%) |
| 35 to 44 Years | 3,458 (88.5%) | 3,030 (83.5%) |
| 45 to 54 Years | 4,352 (95.6%) | 4,202 (94.4%) |
| 55 to 64 Years | 4,747 (91.5%) | 4,791 (92.9%) |
| 65 to 74 Years | 3,995 (95.0%) | 3,775 (92.4%) |
| 75 Years and over | 2,006 (89.9%) | 2,448 (81.7%) |
| Total | 28,906 (89.9%) | 27,526 (86.5%) |
Income Below Poverty Among Married-Couple Families in Carbon County
The poverty statistics for married-couple families in Carbon County show that 4.5% or 549 of the total 12,286 families live below the poverty line. Families with 3 or 4 children have the highest poverty rate of 21.2%, comprising of 187 families. On the other hand, families with 1 or 2 children have the lowest poverty rate of 3.1%, which includes 98 families.
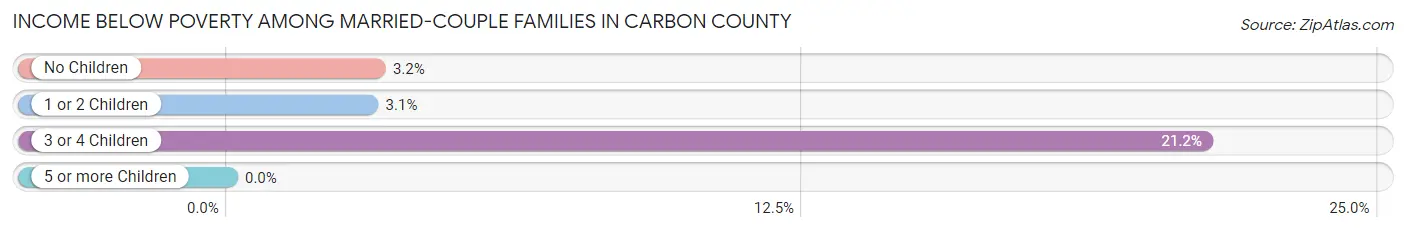
| Children | Above Poverty | Below Poverty |
| No Children | 7,937 (96.8%) | 264 (3.2%) |
| 1 or 2 Children | 3,106 (96.9%) | 98 (3.1%) |
| 3 or 4 Children | 694 (78.8%) | 187 (21.2%) |
| 5 or more Children | 0 (0.0%) | 0 (0.0%) |
| Total | 11,737 (95.5%) | 549 (4.5%) |
Income Below Poverty Among Single-Parent Households in Carbon County
According to the poverty data in Carbon County, 9.7% or 185 single-father households and 24.2% or 670 single-mother households are living below the poverty line. Among single-father households, those with 5 or more children have the highest poverty rate, with 6 households (100.0%) experiencing poverty. Likewise, among single-mother households, those with 3 or 4 children have the highest poverty rate, with 124 households (47.1%) falling below the poverty line.
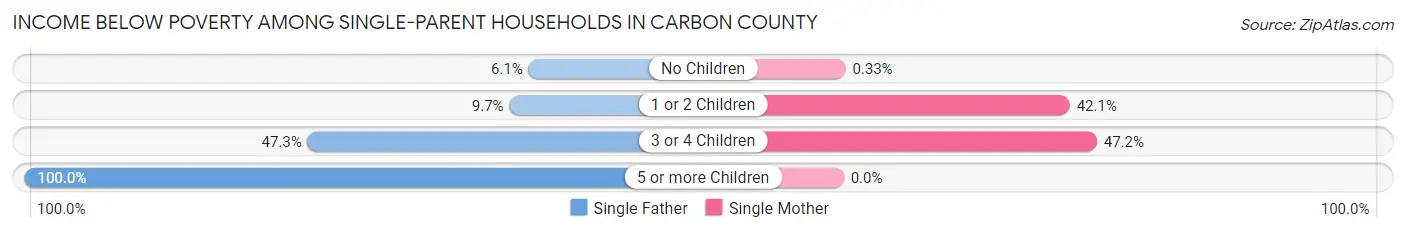
| Children | Single Father | Single Mother |
| No Children | 56 (6.1%) | 4 (0.3%) |
| 1 or 2 Children | 88 (9.7%) | 542 (42.1%) |
| 3 or 4 Children | 35 (47.3%) | 124 (47.1%) |
| 5 or more Children | 6 (100.0%) | 0 (0.0%) |
| Total | 185 (9.7%) | 670 (24.2%) |
Income Below Poverty Among Married-Couple vs Single-Parent Households in Carbon County
The poverty data for Carbon County shows that 549 of the married-couple family households (4.5%) and 855 of the single-parent households (18.3%) are living below the poverty level. Within the married-couple family households, those with 3 or 4 children have the highest poverty rate, with 187 households (21.2%) falling below the poverty line. Among the single-parent households, those with 5 or more children have the highest poverty rate, with 6 household (100.0%) living below poverty.
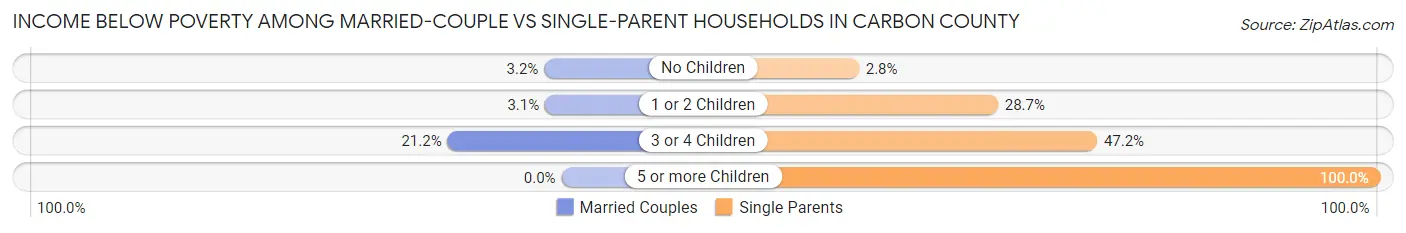
| Children | Married-Couple Families | Single-Parent Households |
| No Children | 264 (3.2%) | 60 (2.8%) |
| 1 or 2 Children | 98 (3.1%) | 630 (28.7%) |
| 3 or 4 Children | 187 (21.2%) | 159 (47.2%) |
| 5 or more Children | 0 (0.0%) | 6 (100.0%) |
| Total | 549 (4.5%) | 855 (18.3%) |
Race in Carbon County
The most populous races in Carbon County are White / Caucasian (59,656 | 91.7%), Hispanic or Latino (3,889 | 6.0%), and Two or more Races (2,835 | 4.4%).
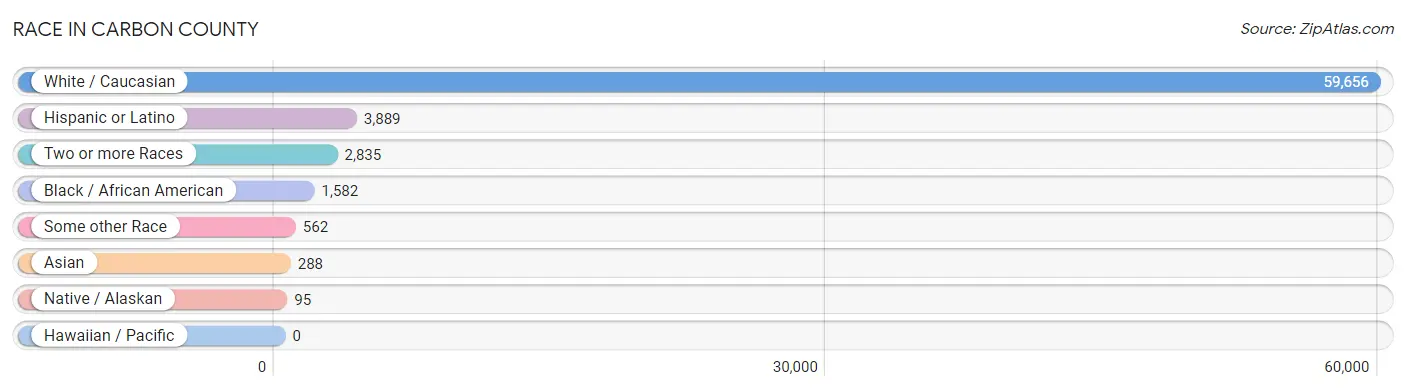
| Race | # Population | % Population |
| Asian | 288 | 0.4% |
| Black / African American | 1,582 | 2.4% |
| Hawaiian / Pacific | 0 | 0.0% |
| Hispanic or Latino | 3,889 | 6.0% |
| Native / Alaskan | 95 | 0.2% |
| White / Caucasian | 59,656 | 91.7% |
| Two or more Races | 2,835 | 4.4% |
| Some other Race | 562 | 0.9% |
| Total | 65,018 | 100.0% |
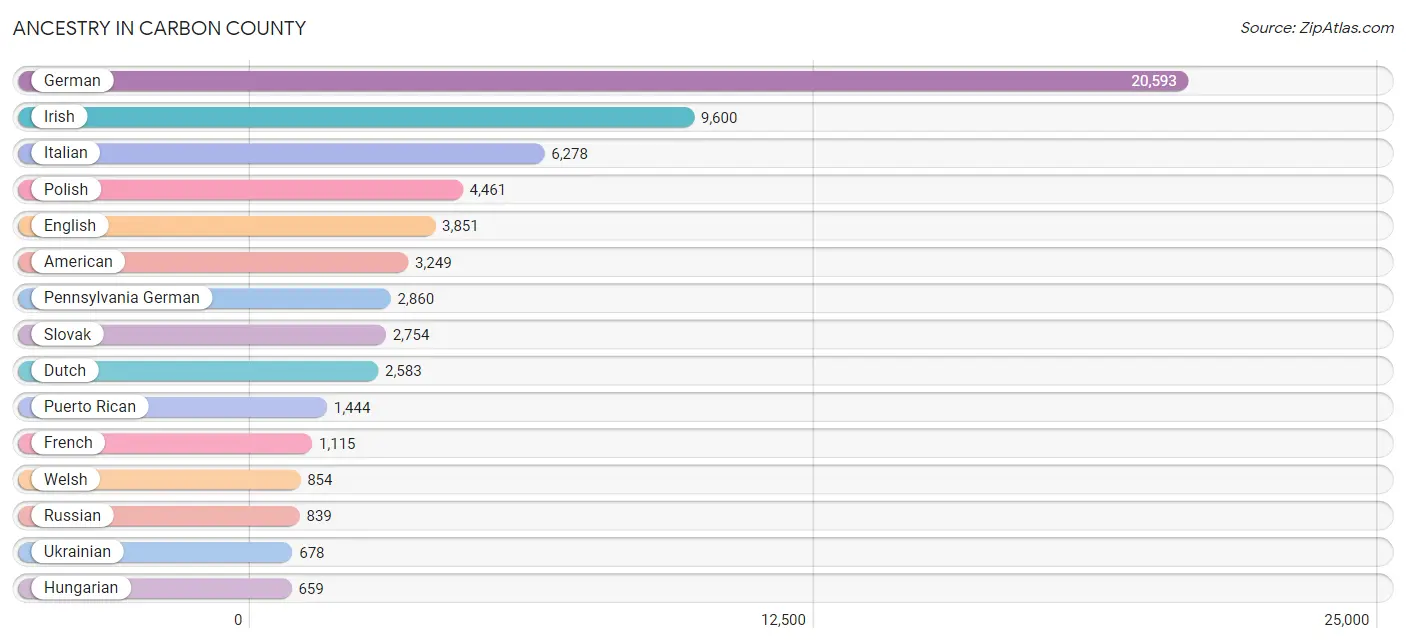
Ancestry in Carbon County
The most populous ancestries reported in Carbon County are German (20,593 | 31.7%), Irish (9,600 | 14.8%), Italian (6,278 | 9.7%), Polish (4,461 | 6.9%), and English (3,851 | 5.9%), together accounting for 68.9% of all Carbon County residents.
| Ancestry | # Population | % Population |
| African | 87 | 0.1% |
| Albanian | 6 | 0.0% |
| American | 3,249 | 5.0% |
| Arab | 191 | 0.3% |
| Armenian | 34 | 0.1% |
| Australian | 13 | 0.0% |
| Austrian | 451 | 0.7% |
| Bhutanese | 12 | 0.0% |
| Blackfeet | 3 | 0.0% |
| British | 292 | 0.4% |
| British West Indian | 3 | 0.0% |
| Burmese | 16 | 0.0% |
| Canadian | 51 | 0.1% |
| Carpatho Rusyn | 15 | 0.0% |
| Central American | 209 | 0.3% |
| Central American Indian | 2 | 0.0% |
| Cherokee | 191 | 0.3% |
| Choctaw | 7 | 0.0% |
| Colombian | 238 | 0.4% |
| Costa Rican | 6 | 0.0% |
| Croatian | 26 | 0.0% |
| Cuban | 122 | 0.2% |
| Czech | 252 | 0.4% |
| Czechoslovakian | 306 | 0.5% |
| Danish | 17 | 0.0% |
| Delaware | 2 | 0.0% |
| Dominican | 345 | 0.5% |
| Dutch | 2,583 | 4.0% |
| Eastern European | 175 | 0.3% |
| Ecuadorian | 8 | 0.0% |
| Egyptian | 55 | 0.1% |
| English | 3,851 | 5.9% |
| Estonian | 36 | 0.1% |
| European | 357 | 0.5% |
| Filipino | 48 | 0.1% |
| Finnish | 12 | 0.0% |
| French | 1,115 | 1.7% |
| French Canadian | 169 | 0.3% |
| German | 20,593 | 31.7% |
| Greek | 383 | 0.6% |
| Guatemalan | 36 | 0.1% |
| Guyanese | 74 | 0.1% |
| Haitian | 44 | 0.1% |
| Hungarian | 659 | 1.0% |
| Indian (Asian) | 59 | 0.1% |
| Irish | 9,600 | 14.8% |
| Iroquois | 8 | 0.0% |
| Italian | 6,278 | 9.7% |
| Jamaican | 108 | 0.2% |
| Kenyan | 15 | 0.0% |
| Korean | 216 | 0.3% |
| Lebanese | 68 | 0.1% |
| Lithuanian | 272 | 0.4% |
| Lumbee | 22 | 0.0% |
| Mexican | 634 | 1.0% |
| Moroccan | 38 | 0.1% |
| Native Hawaiian | 15 | 0.0% |
| Navajo | 4 | 0.0% |
| Nicaraguan | 59 | 0.1% |
| Nigerian | 7 | 0.0% |
| Northern European | 35 | 0.1% |
| Norwegian | 540 | 0.8% |
| Pakistani | 52 | 0.1% |
| Paraguayan | 3 | 0.0% |
| Pennsylvania German | 2,860 | 4.4% |
| Peruvian | 15 | 0.0% |
| Polish | 4,461 | 6.9% |
| Portuguese | 189 | 0.3% |
| Puerto Rican | 1,444 | 2.2% |
| Romanian | 58 | 0.1% |
| Russian | 839 | 1.3% |
| Salvadoran | 108 | 0.2% |
| Scandinavian | 185 | 0.3% |
| Scotch-Irish | 432 | 0.7% |
| Scottish | 552 | 0.9% |
| Serbian | 27 | 0.0% |
| Sioux | 78 | 0.1% |
| Slavic | 166 | 0.3% |
| Slovak | 2,754 | 4.2% |
| South American | 324 | 0.5% |
| Spaniard | 346 | 0.5% |
| Spanish | 97 | 0.2% |
| Spanish American | 11 | 0.0% |
| Sri Lankan | 19 | 0.0% |
| Subsaharan African | 109 | 0.2% |
| Swedish | 122 | 0.2% |
| Swiss | 121 | 0.2% |
| Syrian | 75 | 0.1% |
| Thai | 89 | 0.1% |
| Trinidadian and Tobagonian | 95 | 0.2% |
| Ukrainian | 678 | 1.0% |
| Uruguayan | 60 | 0.1% |
| Welsh | 854 | 1.3% |
| West Indian | 30 | 0.1% |
| Yugoslavian | 6 | 0.0% | View All 95 Rows |
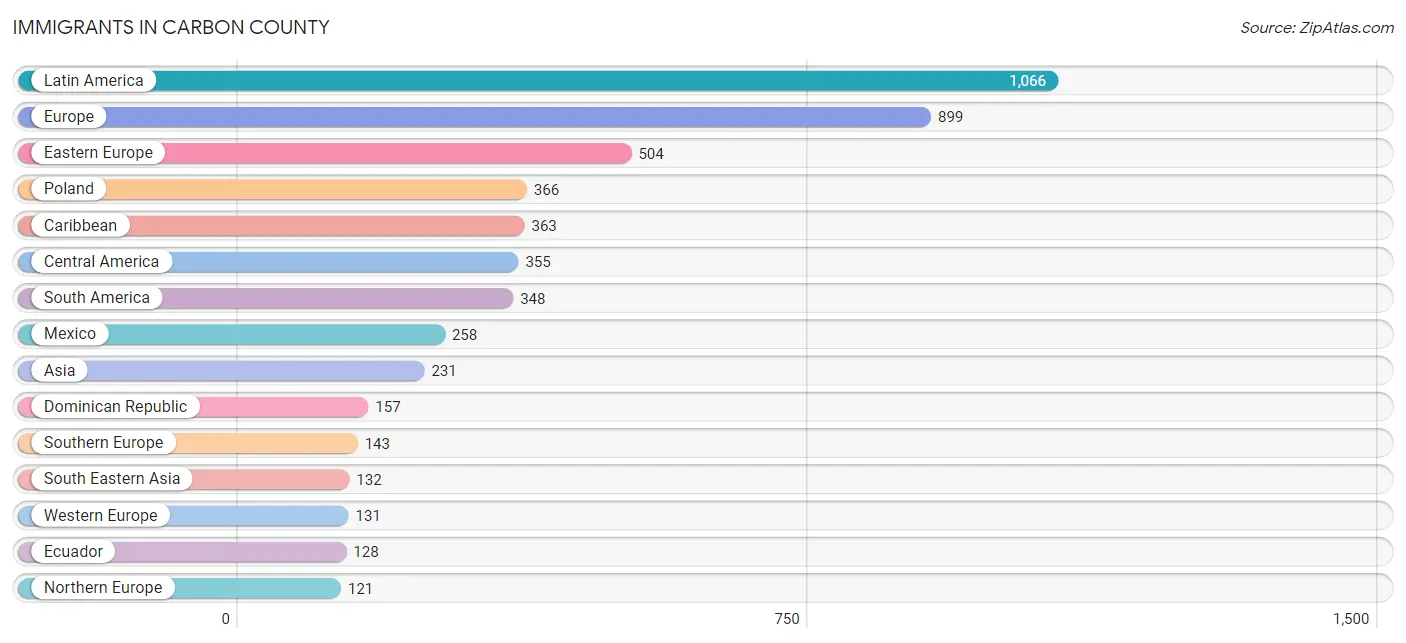
Immigrants in Carbon County
The most numerous immigrant groups reported in Carbon County came from Latin America (1,066 | 1.6%), Europe (899 | 1.4%), Eastern Europe (504 | 0.8%), Poland (366 | 0.6%), and Caribbean (363 | 0.6%), together accounting for 4.9% of all Carbon County residents.
| Immigration Origin | # Population | % Population |
| Africa | 29 | 0.0% |
| Asia | 231 | 0.4% |
| Austria | 14 | 0.0% |
| Canada | 84 | 0.1% |
| Caribbean | 363 | 0.6% |
| Central America | 355 | 0.5% |
| China | 51 | 0.1% |
| Colombia | 81 | 0.1% |
| Costa Rica | 6 | 0.0% |
| Cuba | 9 | 0.0% |
| Dominican Republic | 157 | 0.2% |
| Eastern Africa | 8 | 0.0% |
| Eastern Asia | 84 | 0.1% |
| Eastern Europe | 504 | 0.8% |
| Ecuador | 128 | 0.2% |
| Egypt | 21 | 0.0% |
| El Salvador | 16 | 0.0% |
| England | 58 | 0.1% |
| Europe | 899 | 1.4% |
| Germany | 100 | 0.2% |
| Greece | 15 | 0.0% |
| Guatemala | 6 | 0.0% |
| Guyana | 74 | 0.1% |
| Haiti | 15 | 0.0% |
| Honduras | 35 | 0.1% |
| Hungary | 9 | 0.0% |
| India | 15 | 0.0% |
| Italy | 106 | 0.2% |
| Jamaica | 84 | 0.1% |
| Kenya | 8 | 0.0% |
| Korea | 17 | 0.0% |
| Latin America | 1,066 | 1.6% |
| Lithuania | 12 | 0.0% |
| Mexico | 258 | 0.4% |
| Netherlands | 16 | 0.0% |
| Nicaragua | 34 | 0.1% |
| Northern Africa | 21 | 0.0% |
| Northern Europe | 121 | 0.2% |
| Norway | 42 | 0.1% |
| Peru | 2 | 0.0% |
| Philippines | 73 | 0.1% |
| Poland | 366 | 0.6% |
| Romania | 36 | 0.1% |
| Russia | 64 | 0.1% |
| Serbia | 17 | 0.0% |
| South America | 348 | 0.5% |
| South Central Asia | 15 | 0.0% |
| South Eastern Asia | 132 | 0.2% |
| Southern Europe | 143 | 0.2% |
| Spain | 22 | 0.0% |
| Switzerland | 1 | 0.0% |
| Taiwan | 20 | 0.0% |
| Thailand | 52 | 0.1% |
| Trinidad and Tobago | 95 | 0.2% |
| Uruguay | 60 | 0.1% |
| Vietnam | 7 | 0.0% |
| Western Europe | 131 | 0.2% | View All 57 Rows |
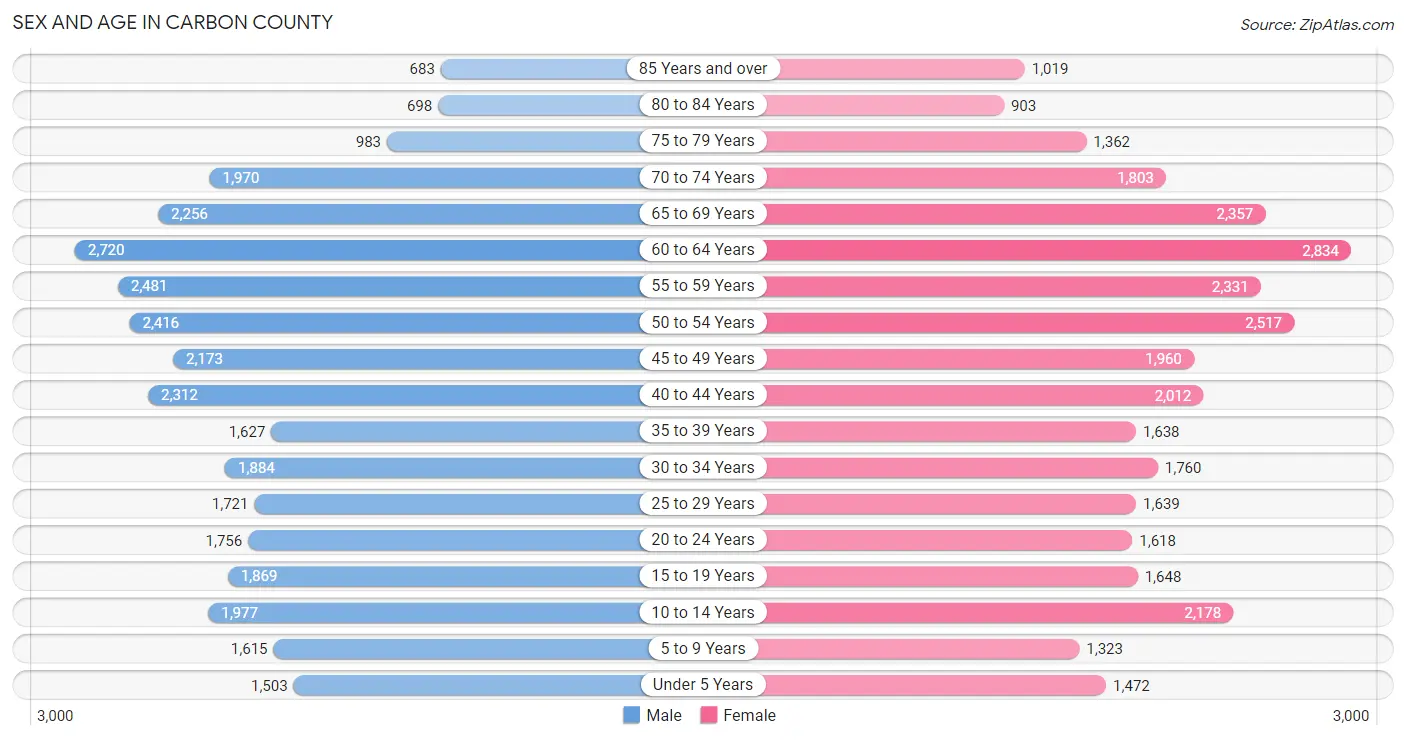
Sex and Age in Carbon County
Sex and Age in Carbon County
The most populous age groups in Carbon County are 60 to 64 Years (2,720 | 8.3%) for men and 60 to 64 Years (2,834 | 8.7%) for women.
| Age Bracket | Male | Female |
| Under 5 Years | 1,503 (4.6%) | 1,472 (4.5%) |
| 5 to 9 Years | 1,615 (5.0%) | 1,323 (4.1%) |
| 10 to 14 Years | 1,977 (6.1%) | 2,178 (6.7%) |
| 15 to 19 Years | 1,869 (5.7%) | 1,648 (5.1%) |
| 20 to 24 Years | 1,756 (5.4%) | 1,618 (5.0%) |
| 25 to 29 Years | 1,721 (5.3%) | 1,639 (5.1%) |
| 30 to 34 Years | 1,884 (5.8%) | 1,760 (5.4%) |
| 35 to 39 Years | 1,627 (5.0%) | 1,638 (5.1%) |
| 40 to 44 Years | 2,312 (7.1%) | 2,012 (6.2%) |
| 45 to 49 Years | 2,173 (6.7%) | 1,960 (6.0%) |
| 50 to 54 Years | 2,416 (7.4%) | 2,517 (7.8%) |
| 55 to 59 Years | 2,481 (7.6%) | 2,331 (7.2%) |
| 60 to 64 Years | 2,720 (8.3%) | 2,834 (8.7%) |
| 65 to 69 Years | 2,256 (6.9%) | 2,357 (7.3%) |
| 70 to 74 Years | 1,970 (6.0%) | 1,803 (5.6%) |
| 75 to 79 Years | 983 (3.0%) | 1,362 (4.2%) |
| 80 to 84 Years | 698 (2.1%) | 903 (2.8%) |
| 85 Years and over | 683 (2.1%) | 1,019 (3.2%) |
| Total | 32,644 (100.0%) | 32,374 (100.0%) |
Families and Households in Carbon County
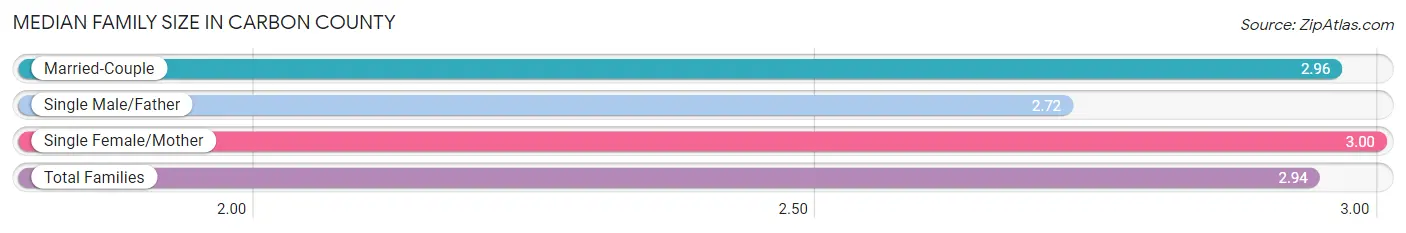
Median Family Size in Carbon County
The median family size in Carbon County is 2.94 persons per family, with single female/mother families (2,766 | 16.3%) accounting for the largest median family size of 3 persons per family. On the other hand, single male/father families (1,904 | 11.2%) represent the smallest median family size with 2.72 persons per family.
| Family Type | # Families | Family Size |
| Married-Couple | 12,286 (72.5%) | 2.96 |
| Single Male/Father | 1,904 (11.2%) | 2.72 |
| Single Female/Mother | 2,766 (16.3%) | 3.00 |
| Total Families | 16,956 (100.0%) | 2.94 |
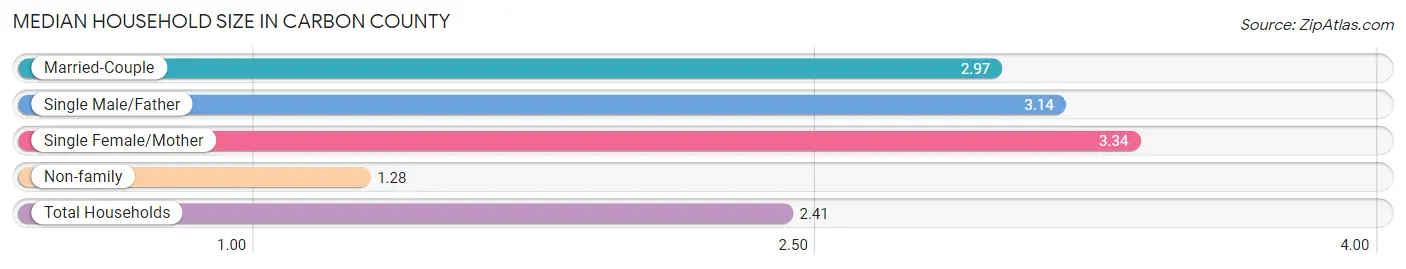
Median Household Size in Carbon County
The median household size in Carbon County is 2.41 persons per household, with single female/mother households (2,766 | 10.4%) accounting for the largest median household size of 3.34 persons per household. non-family households (9,706 | 36.4%) represent the smallest median household size with 1.28 persons per household.
| Household Type | # Households | Household Size |
| Married-Couple | 12,286 (46.1%) | 2.97 |
| Single Male/Father | 1,904 (7.1%) | 3.14 |
| Single Female/Mother | 2,766 (10.4%) | 3.34 |
| Non-family | 9,706 (36.4%) | 1.28 |
| Total Households | 26,662 (100.0%) | 2.41 |
Household Size by Marriage Status in Carbon County
Out of a total of 26,662 households in Carbon County, 16,956 (63.6%) are family households, while 9,706 (36.4%) are nonfamily households. The most numerous type of family households are 2-person households, comprising 8,069, and the most common type of nonfamily households are 1-person households, comprising 7,453.
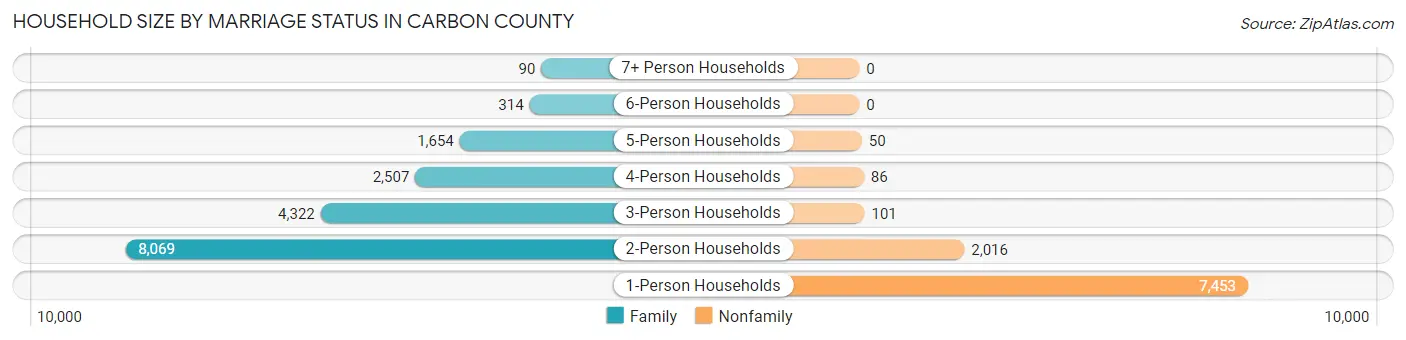
| Household Size | Family Households | Nonfamily Households |
| 1-Person Households | - | 7,453 (28.0%) |
| 2-Person Households | 8,069 (30.3%) | 2,016 (7.6%) |
| 3-Person Households | 4,322 (16.2%) | 101 (0.4%) |
| 4-Person Households | 2,507 (9.4%) | 86 (0.3%) |
| 5-Person Households | 1,654 (6.2%) | 50 (0.2%) |
| 6-Person Households | 314 (1.2%) | 0 (0.0%) |
| 7+ Person Households | 90 (0.3%) | 0 (0.0%) |
| Total | 16,956 (63.6%) | 9,706 (36.4%) |
Female Fertility in Carbon County
Fertility by Age in Carbon County
Average fertility rate in Carbon County is 65.0 births per 1,000 women. Women in the age bracket of 20 to 34 years have the highest fertility rate with 132.0 births per 1,000 women. Women in the age bracket of 20 to 34 years acount for 80.0% of all women with births.
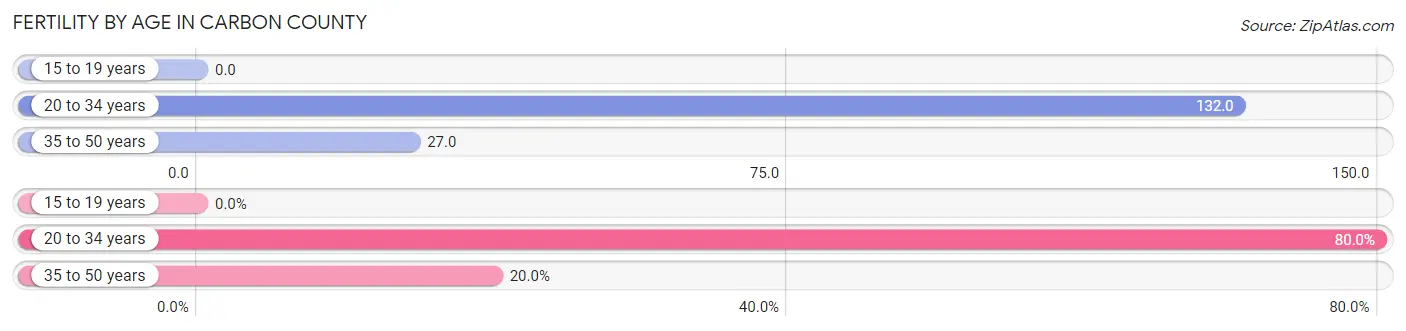
| Age Bracket | Women with Births | Births / 1,000 Women |
| 15 to 19 years | 0 (0.0%) | 0.0 |
| 20 to 34 years | 664 (80.0%) | 132.0 |
| 35 to 50 years | 166 (20.0%) | 27.0 |
| Total | 830 (100.0%) | 65.0 |
Fertility by Age by Marriage Status in Carbon County
64.2% of women with births (830) in Carbon County are married. The highest percentage of unmarried women with births falls into 35 to 50 years age bracket with 63.9% of them unmarried at the time of birth, while the lowest percentage of unmarried women with births belong to 20 to 34 years age bracket with 28.8% of them unmarried.
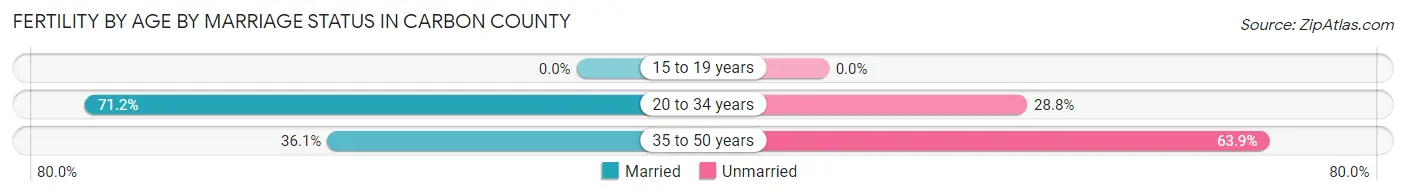
| Age Bracket | Married | Unmarried |
| 15 to 19 years | 0 (0.0%) | 0 (0.0%) |
| 20 to 34 years | 473 (71.2%) | 191 (28.8%) |
| 35 to 50 years | 60 (36.1%) | 106 (63.9%) |
| Total | 533 (64.2%) | 297 (35.8%) |
Fertility by Education in Carbon County
Average fertility rate in Carbon County is 65.0 births per 1,000 women. Women with the education attainment of high school diploma have the highest fertility rate of 80.0 births per 1,000 women, while women with the education attainment of less than high school have the lowest fertility at 42.0 births per 1,000 women. Women with the education attainment of high school diploma represent 39.0% of all women with births.
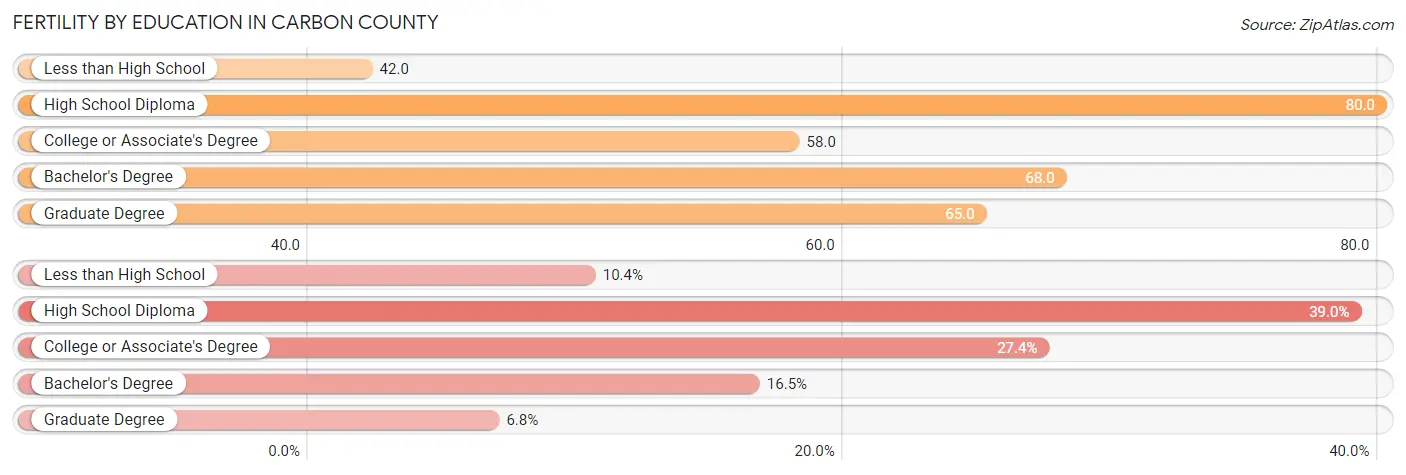
| Educational Attainment | Women with Births | Births / 1,000 Women |
| Less than High School | 86 (10.4%) | 42.0 |
| High School Diploma | 324 (39.0%) | 80.0 |
| College or Associate's Degree | 227 (27.4%) | 58.0 |
| Bachelor's Degree | 137 (16.5%) | 68.0 |
| Graduate Degree | 56 (6.8%) | 65.0 |
| Total | 830 (100.0%) | 65.0 |
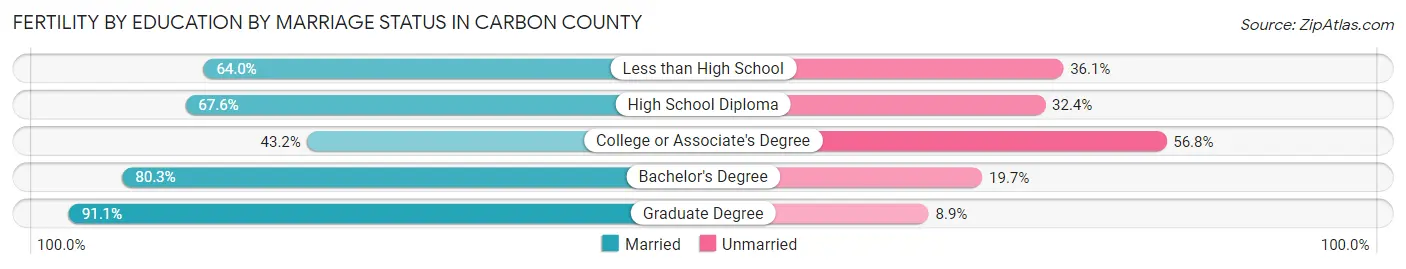
Fertility by Education by Marriage Status in Carbon County
35.8% of women with births in Carbon County are unmarried. Women with the educational attainment of graduate degree are most likely to be married with 91.1% of them married at childbirth, while women with the educational attainment of college or associate's degree are least likely to be married with 56.8% of them unmarried at childbirth.
| Educational Attainment | Married | Unmarried |
| Less than High School | 55 (63.9%) | 31 (36.0%) |
| High School Diploma | 219 (67.6%) | 105 (32.4%) |
| College or Associate's Degree | 98 (43.2%) | 129 (56.8%) |
| Bachelor's Degree | 110 (80.3%) | 27 (19.7%) |
| Graduate Degree | 51 (91.1%) | 5 (8.9%) |
| Total | 533 (64.2%) | 297 (35.8%) |
Employment Characteristics in Carbon County
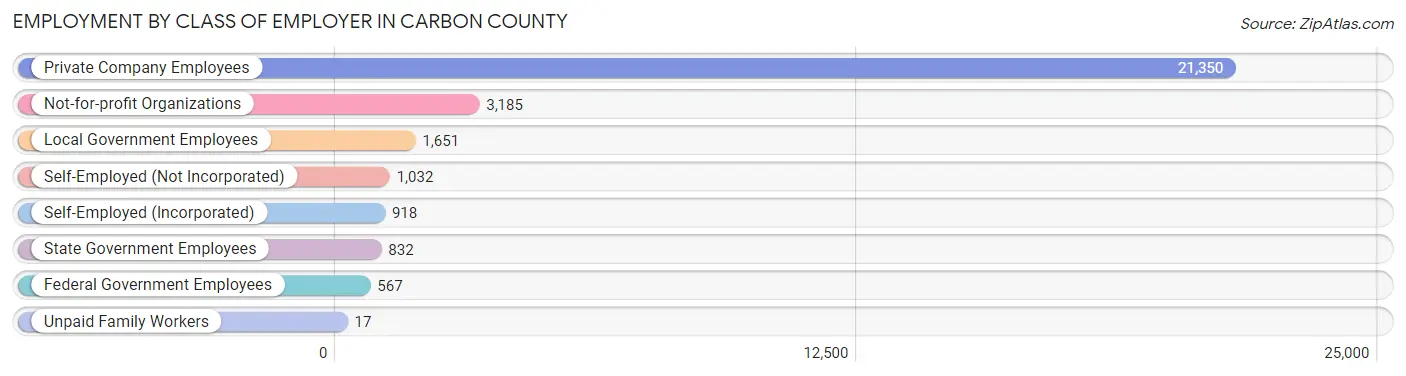
Employment by Class of Employer in Carbon County
Among the 29,552 employed individuals in Carbon County, private company employees (21,350 | 72.3%), not-for-profit organizations (3,185 | 10.8%), and local government employees (1,651 | 5.6%) make up the most common classes of employment.
| Employer Class | # Employees | % Employees |
| Private Company Employees | 21,350 | 72.3% |
| Self-Employed (Incorporated) | 918 | 3.1% |
| Self-Employed (Not Incorporated) | 1,032 | 3.5% |
| Not-for-profit Organizations | 3,185 | 10.8% |
| Local Government Employees | 1,651 | 5.6% |
| State Government Employees | 832 | 2.8% |
| Federal Government Employees | 567 | 1.9% |
| Unpaid Family Workers | 17 | 0.1% |
| Total | 29,552 | 100.0% |
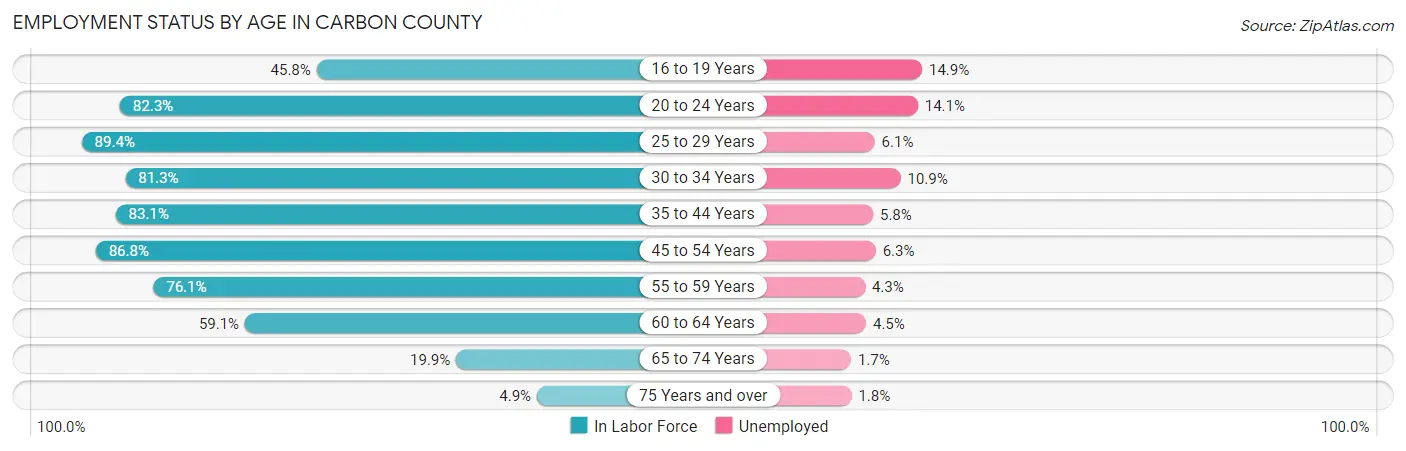
Employment Status by Age in Carbon County
According to the labor force statistics for Carbon County, out of the total population over 16 years of age (54,210), 61.0% or 33,068 individuals are in the labor force, with 6.9% or 2,282 of them unemployed. The age group with the highest labor force participation rate is 25 to 29 years, with 89.4% or 3,004 individuals in the labor force. Within the labor force, the 16 to 19 years age range has the highest percentage of unemployed individuals, with 14.9% or 190 of them being unemployed.
| Age Bracket | In Labor Force | Unemployed |
| 16 to 19 Years | 1,272 (45.8%) | 190 (14.9%) |
| 20 to 24 Years | 2,777 (82.3%) | 392 (14.1%) |
| 25 to 29 Years | 3,004 (89.4%) | 183 (6.1%) |
| 30 to 34 Years | 2,963 (81.3%) | 323 (10.9%) |
| 35 to 44 Years | 6,306 (83.1%) | 366 (5.8%) |
| 45 to 54 Years | 7,869 (86.8%) | 496 (6.3%) |
| 55 to 59 Years | 3,662 (76.1%) | 157 (4.3%) |
| 60 to 64 Years | 3,282 (59.1%) | 148 (4.5%) |
| 65 to 74 Years | 1,669 (19.9%) | 28 (1.7%) |
| 75 Years and over | 277 (4.9%) | 5 (1.8%) |
| Total | 33,068 (61.0%) | 2,282 (6.9%) |
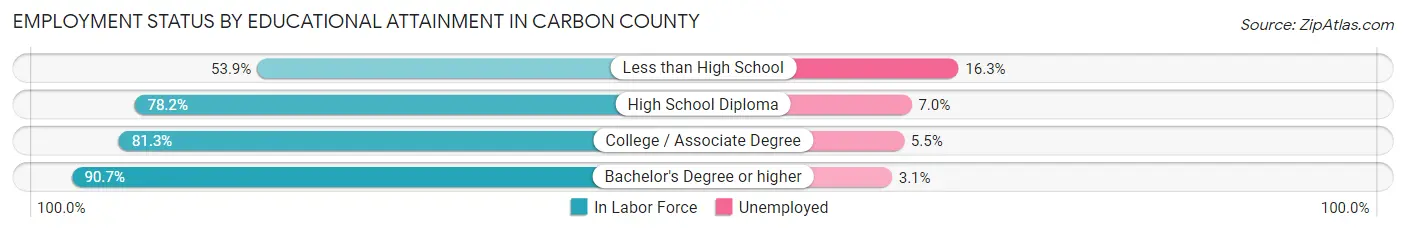
Employment Status by Educational Attainment in Carbon County
According to labor force statistics for Carbon County, 79.6% of individuals (27,084) out of the total population between 25 and 64 years of age (34,025) are in the labor force, with 6.2% or 1,679 of them being unemployed. The group with the highest labor force participation rate are those with the educational attainment of bachelor's degree or higher, with 90.7% or 6,082 individuals in the labor force. Within the labor force, individuals with less than high school education have the highest percentage of unemployment, with 16.3% or 237 of them being unemployed.
| Educational Attainment | In Labor Force | Unemployed |
| Less than High School | 1,457 (53.9%) | 441 (16.3%) |
| High School Diploma | 11,452 (78.2%) | 1,025 (7.0%) |
| College / Associate Degree | 8,107 (81.3%) | 548 (5.5%) |
| Bachelor's Degree or higher | 6,082 (90.7%) | 208 (3.1%) |
| Total | 27,084 (79.6%) | 2,110 (6.2%) |
Employment Occupations by Sex in Carbon County
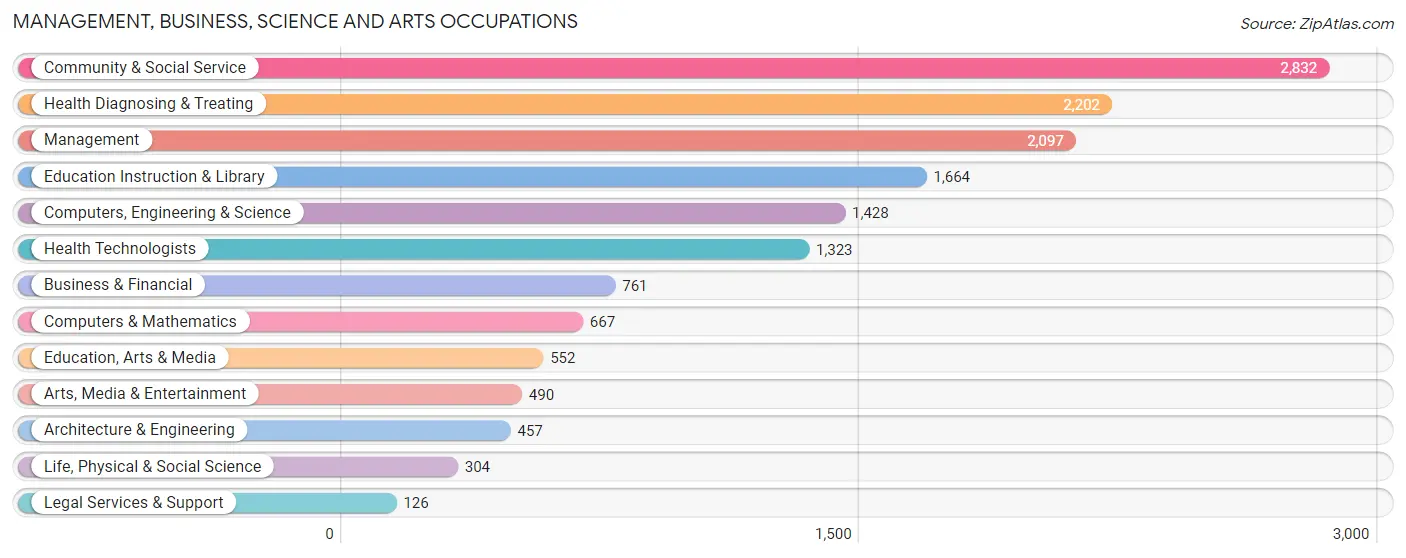
Management, Business, Science and Arts Occupations
The most common Management, Business, Science and Arts occupations in Carbon County are Community & Social Service (2,832 | 9.2%), Health Diagnosing & Treating (2,202 | 7.2%), Management (2,097 | 6.8%), Education Instruction & Library (1,664 | 5.4%), and Computers, Engineering & Science (1,428 | 4.6%).
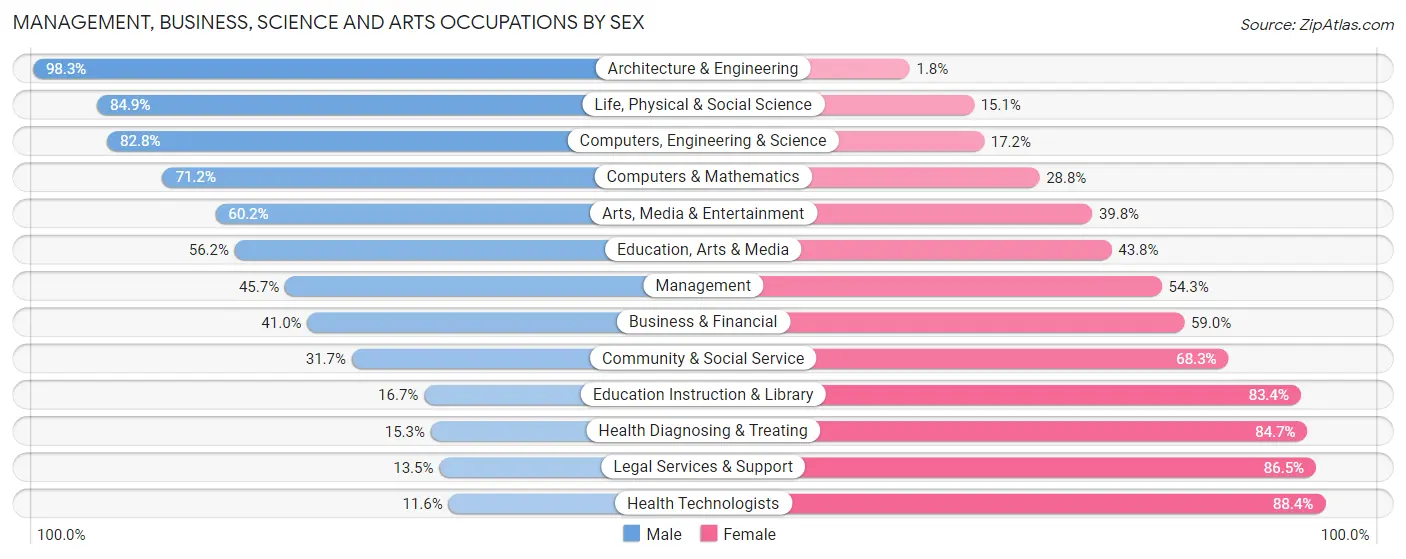
Management, Business, Science and Arts Occupations by Sex
Within the Management, Business, Science and Arts occupations in Carbon County, the most male-oriented occupations are Architecture & Engineering (98.3%), Life, Physical & Social Science (84.9%), and Computers, Engineering & Science (82.8%), while the most female-oriented occupations are Health Technologists (88.4%), Legal Services & Support (86.5%), and Health Diagnosing & Treating (84.7%).
| Occupation | Male | Female |
| Management | 958 (45.7%) | 1,139 (54.3%) |
| Business & Financial | 312 (41.0%) | 449 (59.0%) |
| Computers, Engineering & Science | 1,182 (82.8%) | 246 (17.2%) |
| Computers & Mathematics | 475 (71.2%) | 192 (28.8%) |
| Architecture & Engineering | 449 (98.3%) | 8 (1.8%) |
| Life, Physical & Social Science | 258 (84.9%) | 46 (15.1%) |
| Community & Social Service | 899 (31.7%) | 1,933 (68.3%) |
| Education, Arts & Media | 310 (56.2%) | 242 (43.8%) |
| Legal Services & Support | 17 (13.5%) | 109 (86.5%) |
| Education Instruction & Library | 277 (16.7%) | 1,387 (83.4%) |
| Arts, Media & Entertainment | 295 (60.2%) | 195 (39.8%) |
| Health Diagnosing & Treating | 336 (15.3%) | 1,866 (84.7%) |
| Health Technologists | 153 (11.6%) | 1,170 (88.4%) |
| Total (Category) | 3,687 (39.6%) | 5,633 (60.4%) |
| Total (Overall) | 16,301 (53.0%) | 14,473 (47.0%) |
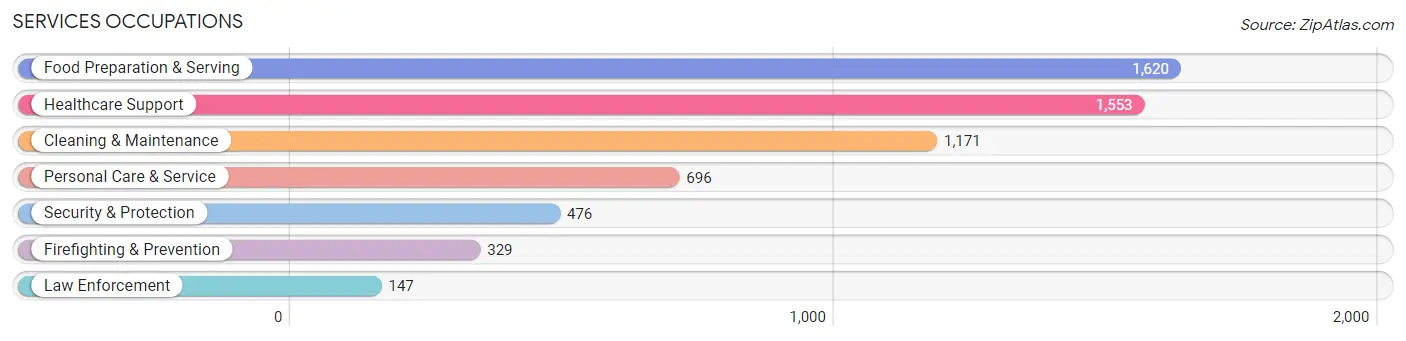
Services Occupations
The most common Services occupations in Carbon County are Food Preparation & Serving (1,620 | 5.3%), Healthcare Support (1,553 | 5.1%), Cleaning & Maintenance (1,171 | 3.8%), Personal Care & Service (696 | 2.3%), and Security & Protection (476 | 1.5%).
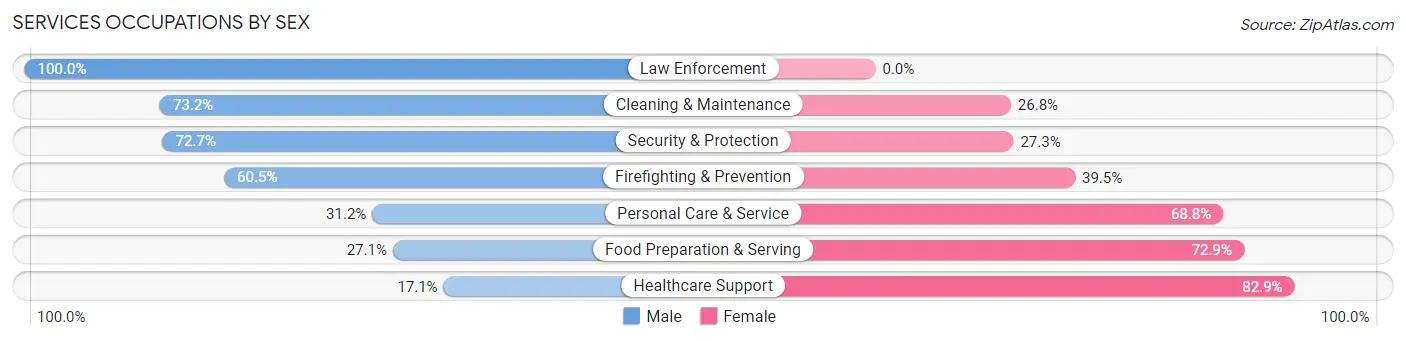
Services Occupations by Sex
Within the Services occupations in Carbon County, the most male-oriented occupations are Law Enforcement (100.0%), Cleaning & Maintenance (73.2%), and Security & Protection (72.7%), while the most female-oriented occupations are Healthcare Support (82.9%), Food Preparation & Serving (72.9%), and Personal Care & Service (68.8%).
| Occupation | Male | Female |
| Healthcare Support | 265 (17.1%) | 1,288 (82.9%) |
| Security & Protection | 346 (72.7%) | 130 (27.3%) |
| Firefighting & Prevention | 199 (60.5%) | 130 (39.5%) |
| Law Enforcement | 147 (100.0%) | 0 (0.0%) |
| Food Preparation & Serving | 439 (27.1%) | 1,181 (72.9%) |
| Cleaning & Maintenance | 857 (73.2%) | 314 (26.8%) |
| Personal Care & Service | 217 (31.2%) | 479 (68.8%) |
| Total (Category) | 2,124 (38.5%) | 3,392 (61.5%) |
| Total (Overall) | 16,301 (53.0%) | 14,473 (47.0%) |
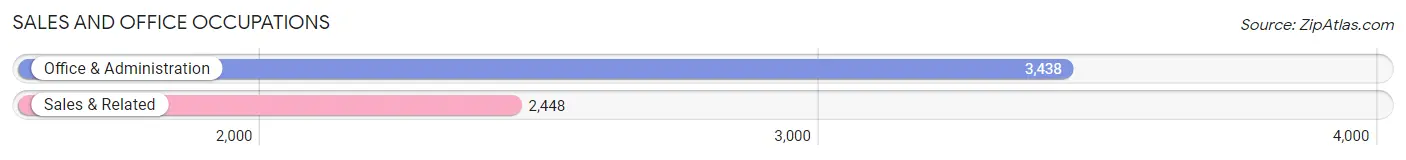
Sales and Office Occupations
The most common Sales and Office occupations in Carbon County are Office & Administration (3,438 | 11.2%), and Sales & Related (2,448 | 8.0%).
Sales and Office Occupations by Sex
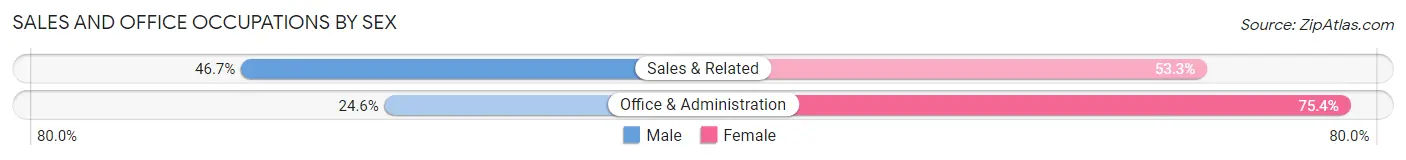
| Occupation | Male | Female |
| Sales & Related | 1,143 (46.7%) | 1,305 (53.3%) |
| Office & Administration | 846 (24.6%) | 2,592 (75.4%) |
| Total (Category) | 1,989 (33.8%) | 3,897 (66.2%) |
| Total (Overall) | 16,301 (53.0%) | 14,473 (47.0%) |
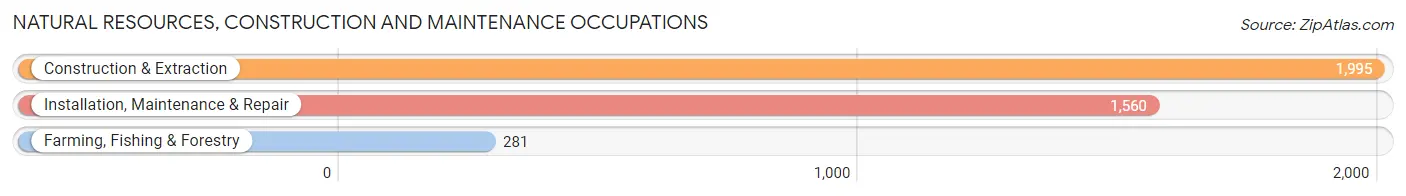
Natural Resources, Construction and Maintenance Occupations
The most common Natural Resources, Construction and Maintenance occupations in Carbon County are Construction & Extraction (1,995 | 6.5%), Installation, Maintenance & Repair (1,560 | 5.1%), and Farming, Fishing & Forestry (281 | 0.9%).
Natural Resources, Construction and Maintenance Occupations by Sex
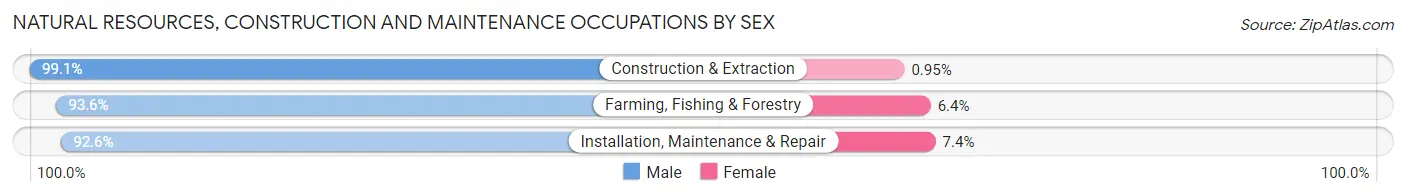
| Occupation | Male | Female |
| Farming, Fishing & Forestry | 263 (93.6%) | 18 (6.4%) |
| Construction & Extraction | 1,976 (99.1%) | 19 (0.9%) |
| Installation, Maintenance & Repair | 1,444 (92.6%) | 116 (7.4%) |
| Total (Category) | 3,683 (96.0%) | 153 (4.0%) |
| Total (Overall) | 16,301 (53.0%) | 14,473 (47.0%) |
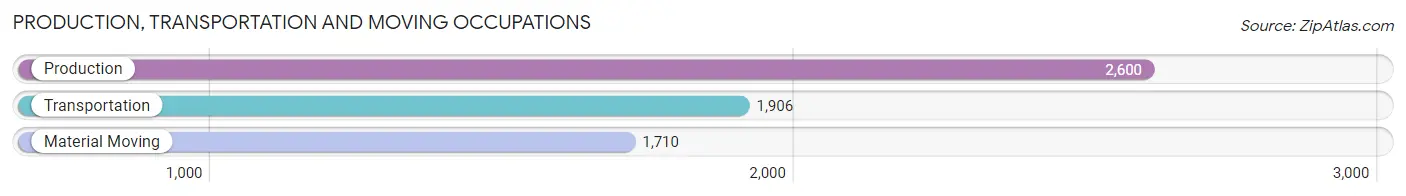
Production, Transportation and Moving Occupations
The most common Production, Transportation and Moving occupations in Carbon County are Production (2,600 | 8.5%), Transportation (1,906 | 6.2%), and Material Moving (1,710 | 5.6%).
Production, Transportation and Moving Occupations by Sex
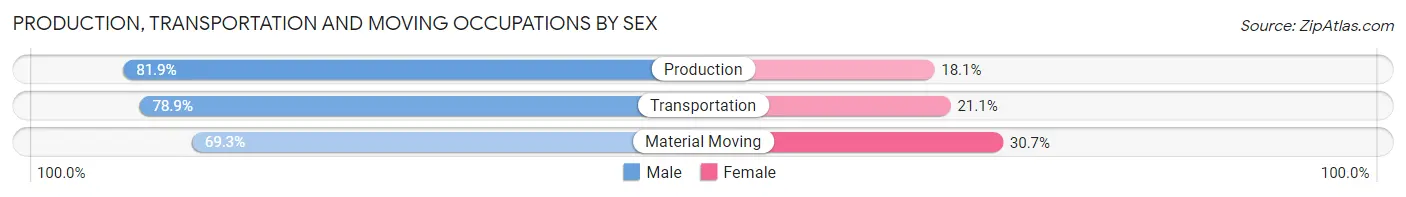
| Occupation | Male | Female |
| Production | 2,129 (81.9%) | 471 (18.1%) |
| Transportation | 1,504 (78.9%) | 402 (21.1%) |
| Material Moving | 1,185 (69.3%) | 525 (30.7%) |
| Total (Category) | 4,818 (77.5%) | 1,398 (22.5%) |
| Total (Overall) | 16,301 (53.0%) | 14,473 (47.0%) |
Employment Industries by Sex in Carbon County
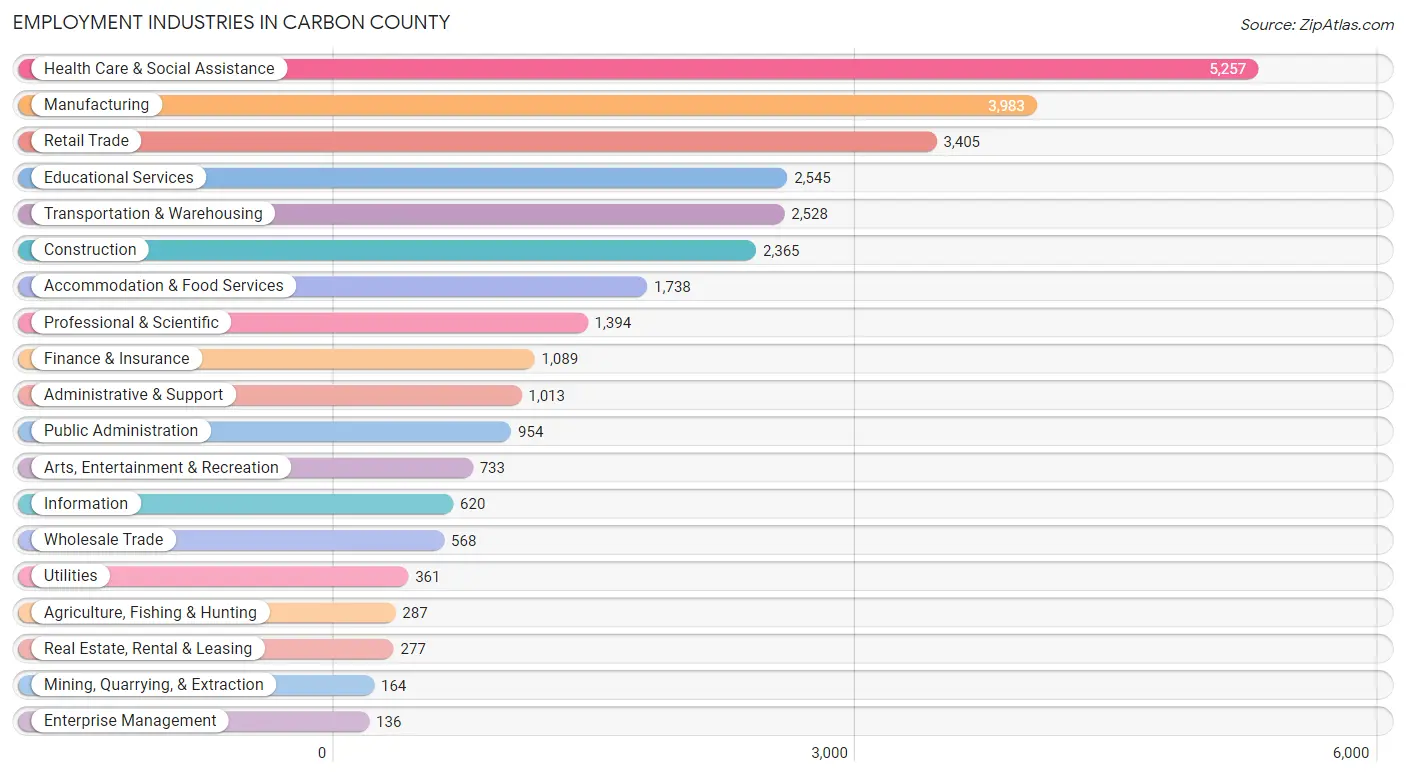
Employment Industries in Carbon County
The major employment industries in Carbon County include Health Care & Social Assistance (5,257 | 17.1%), Manufacturing (3,983 | 12.9%), Retail Trade (3,405 | 11.1%), Educational Services (2,545 | 8.3%), and Transportation & Warehousing (2,528 | 8.2%).
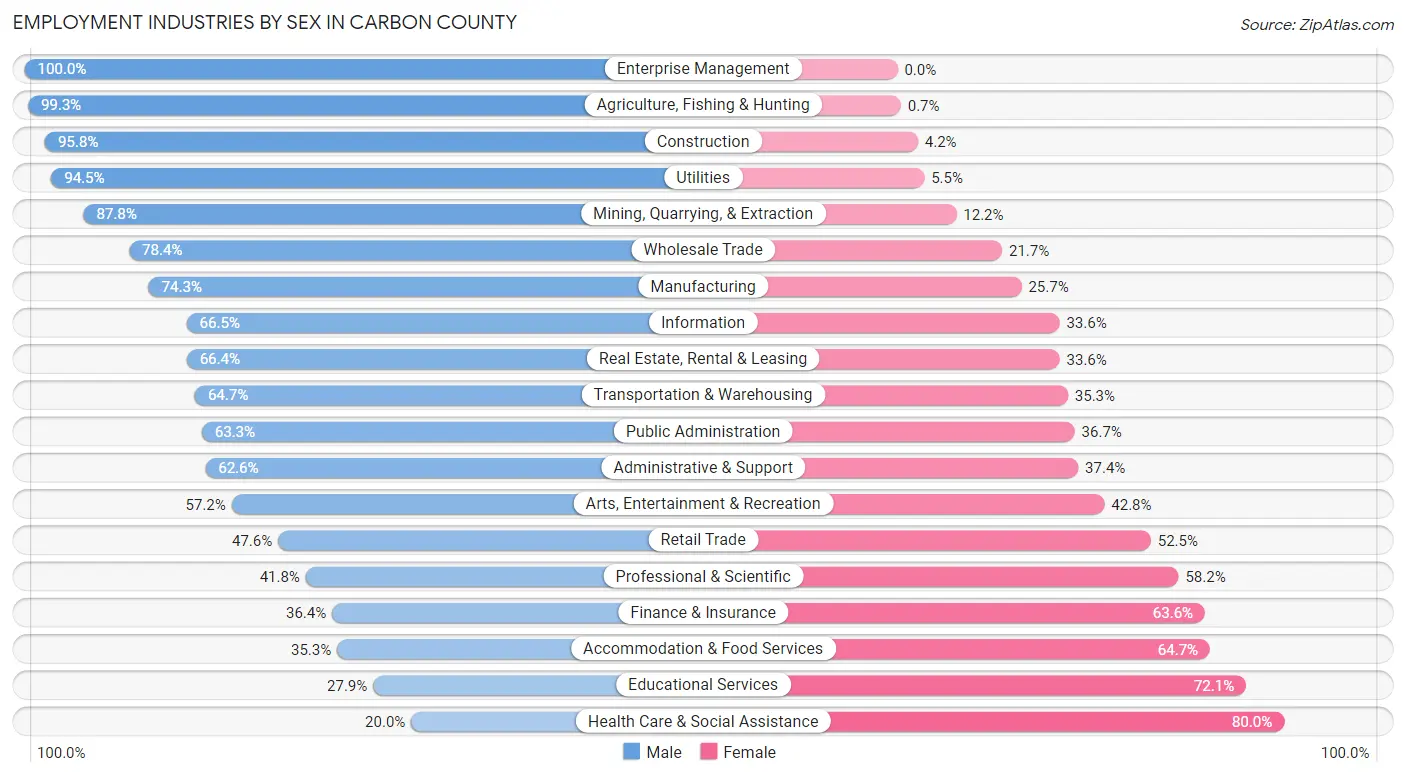
Employment Industries by Sex in Carbon County
The Carbon County industries that see more men than women are Enterprise Management (100.0%), Agriculture, Fishing & Hunting (99.3%), and Construction (95.8%), whereas the industries that tend to have a higher number of women are Health Care & Social Assistance (80.0%), Educational Services (72.1%), and Accommodation & Food Services (64.7%).
| Industry | Male | Female |
| Agriculture, Fishing & Hunting | 285 (99.3%) | 2 (0.7%) |
| Mining, Quarrying, & Extraction | 144 (87.8%) | 20 (12.2%) |
| Construction | 2,265 (95.8%) | 100 (4.2%) |
| Manufacturing | 2,960 (74.3%) | 1,023 (25.7%) |
| Wholesale Trade | 445 (78.3%) | 123 (21.6%) |
| Retail Trade | 1,619 (47.5%) | 1,786 (52.4%) |
| Transportation & Warehousing | 1,636 (64.7%) | 892 (35.3%) |
| Utilities | 341 (94.5%) | 20 (5.5%) |
| Information | 412 (66.4%) | 208 (33.6%) |
| Finance & Insurance | 396 (36.4%) | 693 (63.6%) |
| Real Estate, Rental & Leasing | 184 (66.4%) | 93 (33.6%) |
| Professional & Scientific | 583 (41.8%) | 811 (58.2%) |
| Enterprise Management | 136 (100.0%) | 0 (0.0%) |
| Administrative & Support | 634 (62.6%) | 379 (37.4%) |
| Educational Services | 709 (27.9%) | 1,836 (72.1%) |
| Health Care & Social Assistance | 1,051 (20.0%) | 4,206 (80.0%) |
| Arts, Entertainment & Recreation | 419 (57.2%) | 314 (42.8%) |
| Accommodation & Food Services | 614 (35.3%) | 1,124 (64.7%) |
| Public Administration | 604 (63.3%) | 350 (36.7%) |
| Total | 16,301 (53.0%) | 14,473 (47.0%) |
Education in Carbon County
School Enrollment in Carbon County
The most common levels of schooling among the 11,903 students in Carbon County are middle school (3,490 | 29.3%), high school (3,032 | 25.5%), and elementary school (2,361 | 19.8%).
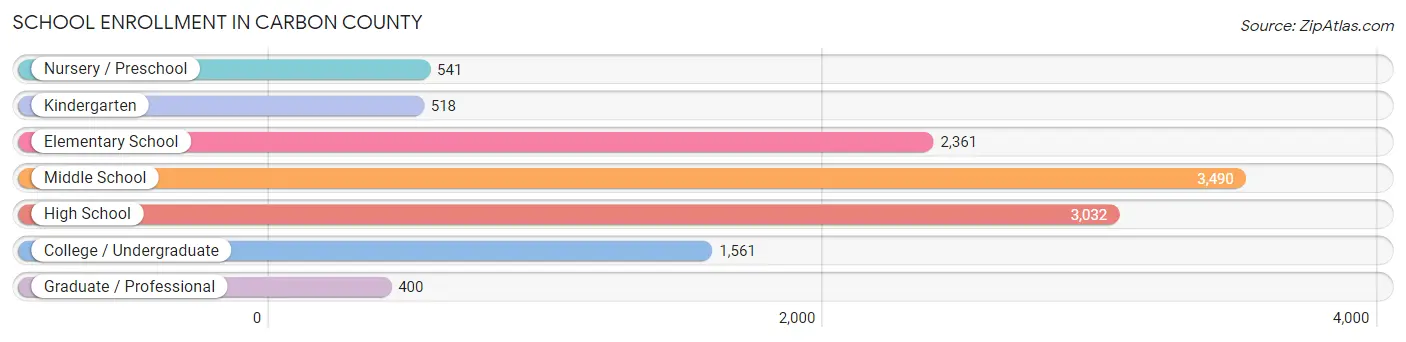
| School Level | # Students | % Students |
| Nursery / Preschool | 541 | 4.5% |
| Kindergarten | 518 | 4.3% |
| Elementary School | 2,361 | 19.8% |
| Middle School | 3,490 | 29.3% |
| High School | 3,032 | 25.5% |
| College / Undergraduate | 1,561 | 13.1% |
| Graduate / Professional | 400 | 3.4% |
| Total | 11,903 | 100.0% |
School Enrollment by Age by Funding Source in Carbon County
Out of a total of 11,903 students who are enrolled in schools in Carbon County, 1,452 (12.2%) attend a private institution, while the remaining 10,451 (87.8%) are enrolled in public schools. The age group of 3 to 4 year olds has the highest likelihood of being enrolled in private schools, with 163 (40.6% in the age bracket) enrolled. Conversely, the age group of 10 to 14 year olds has the lowest likelihood of being enrolled in a private school, with 3,869 (94.0% in the age bracket) attending a public institution.
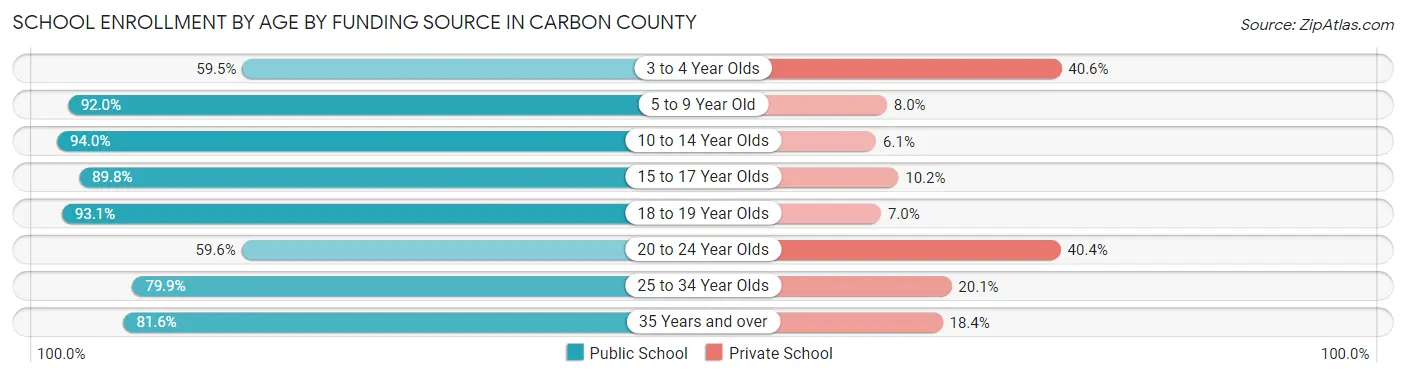
| Age Bracket | Public School | Private School |
| 3 to 4 Year Olds | 239 (59.5%) | 163 (40.6%) |
| 5 to 9 Year Old | 2,493 (92.0%) | 218 (8.0%) |
| 10 to 14 Year Olds | 3,869 (94.0%) | 249 (6.0%) |
| 15 to 17 Year Olds | 1,908 (89.8%) | 216 (10.2%) |
| 18 to 19 Year Olds | 643 (93.0%) | 48 (7.0%) |
| 20 to 24 Year Olds | 566 (59.6%) | 384 (40.4%) |
| 25 to 34 Year Olds | 239 (79.9%) | 60 (20.1%) |
| 35 Years and over | 496 (81.6%) | 112 (18.4%) |
| Total | 10,451 (87.8%) | 1,452 (12.2%) |
Educational Attainment by Field of Study in Carbon County
Business (1,857 | 19.7%), education (1,630 | 17.3%), science & technology (1,215 | 12.9%), arts & humanities (731 | 7.8%), and bio, nature & agricultural (633 | 6.7%) are the most common fields of study among 9,410 individuals in Carbon County who have obtained a bachelor's degree or higher.
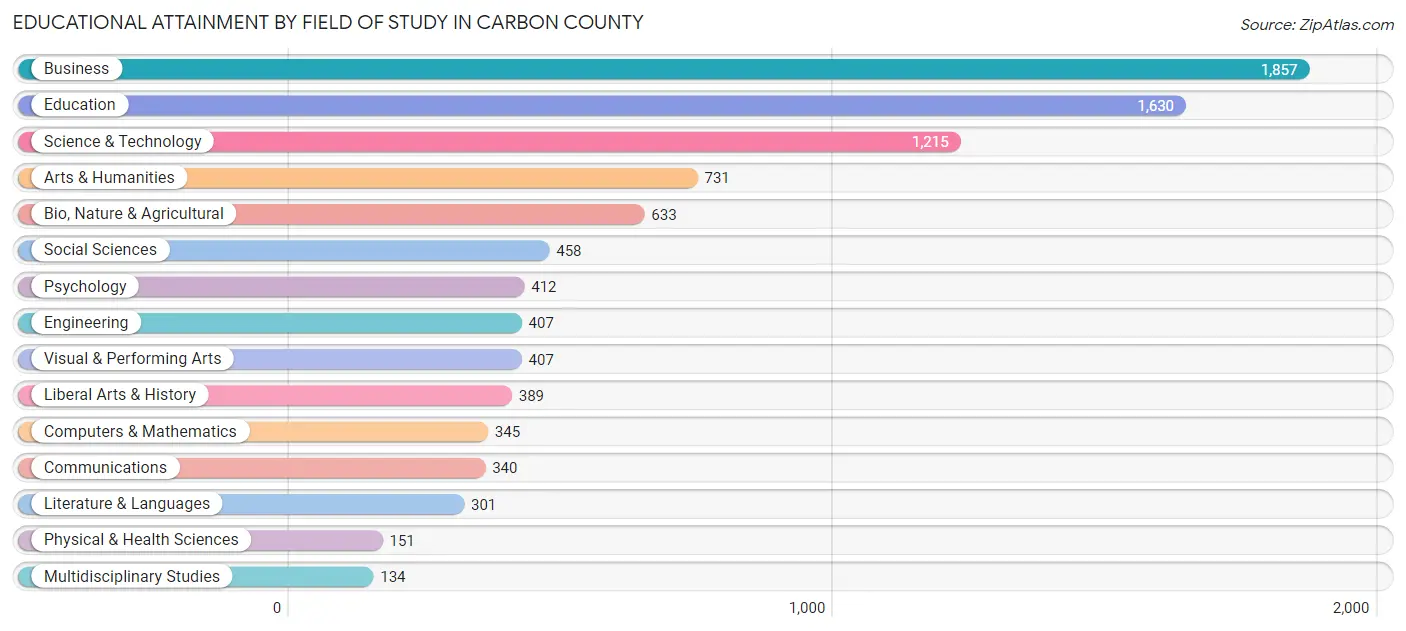
| Field of Study | # Graduates | % Graduates |
| Computers & Mathematics | 345 | 3.7% |
| Bio, Nature & Agricultural | 633 | 6.7% |
| Physical & Health Sciences | 151 | 1.6% |
| Psychology | 412 | 4.4% |
| Social Sciences | 458 | 4.9% |
| Engineering | 407 | 4.3% |
| Multidisciplinary Studies | 134 | 1.4% |
| Science & Technology | 1,215 | 12.9% |
| Business | 1,857 | 19.7% |
| Education | 1,630 | 17.3% |
| Literature & Languages | 301 | 3.2% |
| Liberal Arts & History | 389 | 4.1% |
| Visual & Performing Arts | 407 | 4.3% |
| Communications | 340 | 3.6% |
| Arts & Humanities | 731 | 7.8% |
| Total | 9,410 | 100.0% |
Transportation & Commute in Carbon County
Vehicle Availability by Sex in Carbon County
The most prevalent vehicle ownership categories in Carbon County are males with 2 vehicles (6,238, accounting for 39.6%) and females with 2 vehicles (5,161, making up 45.3%).
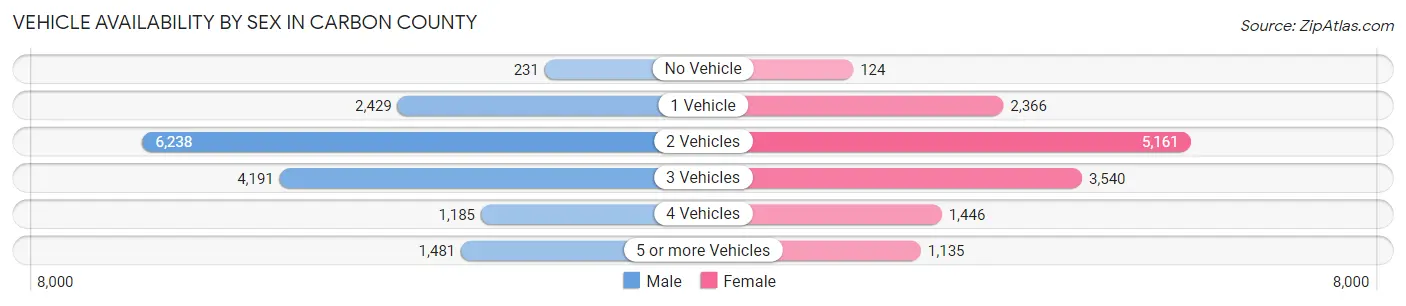
| Vehicles Available | Male | Female |
| No Vehicle | 231 (1.5%) | 124 (0.9%) |
| 1 Vehicle | 2,429 (15.4%) | 2,366 (17.2%) |
| 2 Vehicles | 6,238 (39.6%) | 5,161 (37.5%) |
| 3 Vehicles | 4,191 (26.6%) | 3,540 (25.7%) |
| 4 Vehicles | 1,185 (7.5%) | 1,446 (10.5%) |
| 5 or more Vehicles | 1,481 (9.4%) | 1,135 (8.2%) |
| Total | 15,755 (100.0%) | 13,772 (100.0%) |
Commute Time in Carbon County
The most frequently occuring commute durations in Carbon County are 45 to 59 minutes (4,957 commuters, 18.0%), 15 to 19 minutes (2,914 commuters, 10.6%), and 5 to 9 minutes (2,836 commuters, 10.3%).
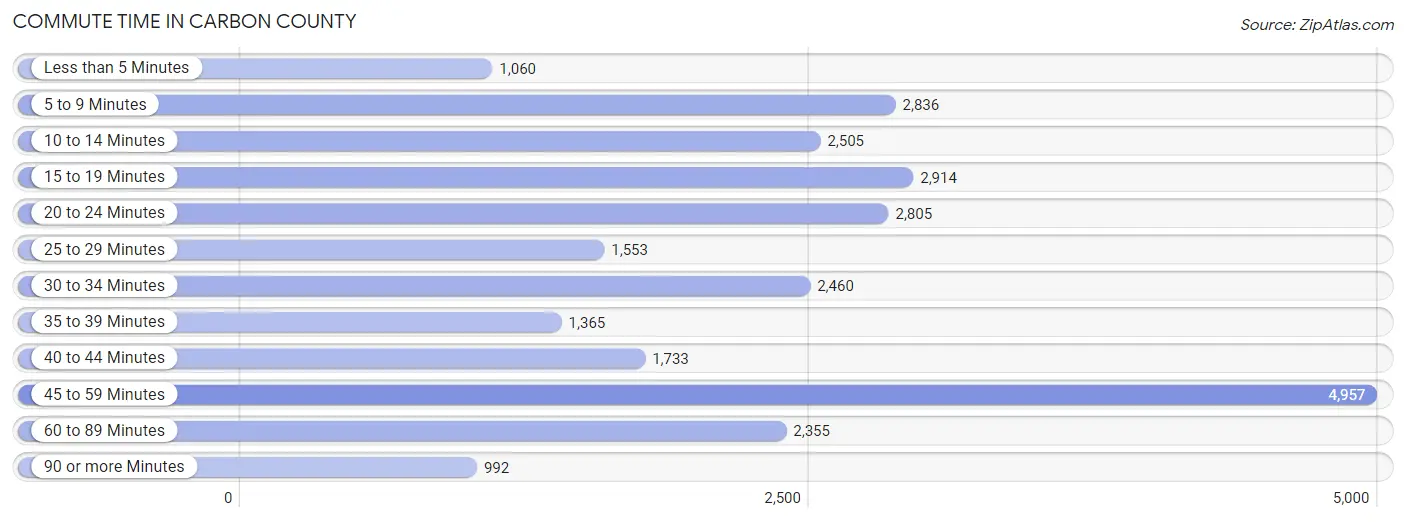
| Commute Time | # Commuters | % Commuters |
| Less than 5 Minutes | 1,060 | 3.8% |
| 5 to 9 Minutes | 2,836 | 10.3% |
| 10 to 14 Minutes | 2,505 | 9.1% |
| 15 to 19 Minutes | 2,914 | 10.6% |
| 20 to 24 Minutes | 2,805 | 10.2% |
| 25 to 29 Minutes | 1,553 | 5.6% |
| 30 to 34 Minutes | 2,460 | 8.9% |
| 35 to 39 Minutes | 1,365 | 5.0% |
| 40 to 44 Minutes | 1,733 | 6.3% |
| 45 to 59 Minutes | 4,957 | 18.0% |
| 60 to 89 Minutes | 2,355 | 8.6% |
| 90 or more Minutes | 992 | 3.6% |
Commute Time by Sex in Carbon County
The most common commute times in Carbon County are 45 to 59 minutes (3,183 commuters, 21.4%) for males and 20 to 24 minutes (1,776 commuters, 14.0%) for females.
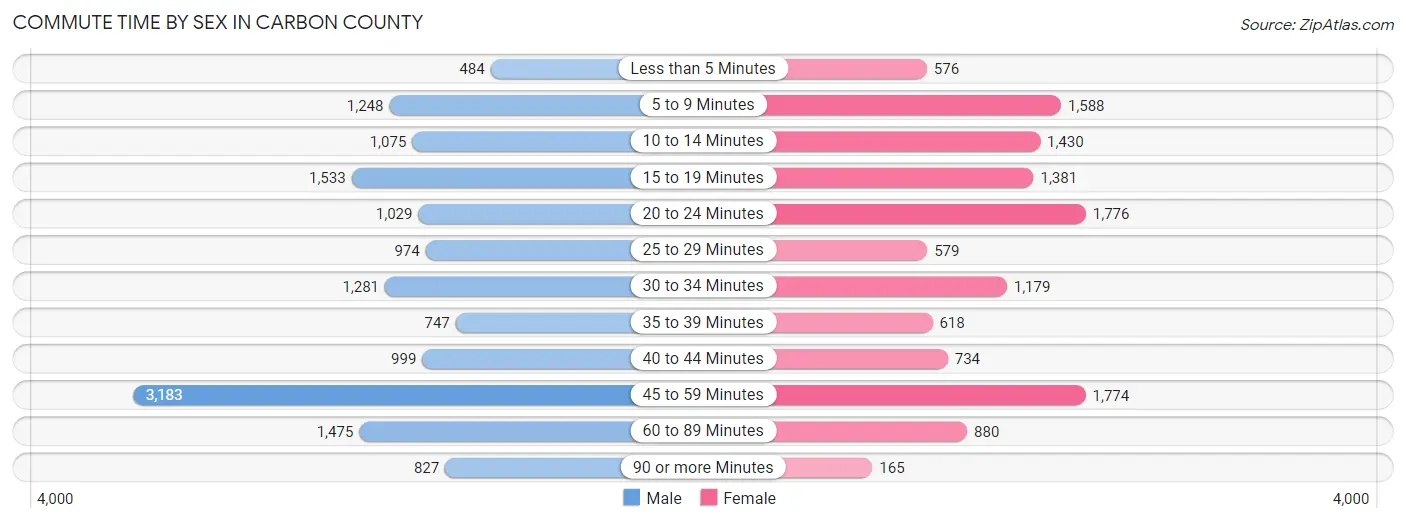
| Commute Time | Male | Female |
| Less than 5 Minutes | 484 (3.3%) | 576 (4.5%) |
| 5 to 9 Minutes | 1,248 (8.4%) | 1,588 (12.5%) |
| 10 to 14 Minutes | 1,075 (7.2%) | 1,430 (11.3%) |
| 15 to 19 Minutes | 1,533 (10.3%) | 1,381 (10.9%) |
| 20 to 24 Minutes | 1,029 (6.9%) | 1,776 (14.0%) |
| 25 to 29 Minutes | 974 (6.6%) | 579 (4.6%) |
| 30 to 34 Minutes | 1,281 (8.6%) | 1,179 (9.3%) |
| 35 to 39 Minutes | 747 (5.0%) | 618 (4.9%) |
| 40 to 44 Minutes | 999 (6.7%) | 734 (5.8%) |
| 45 to 59 Minutes | 3,183 (21.4%) | 1,774 (14.0%) |
| 60 to 89 Minutes | 1,475 (9.9%) | 880 (6.9%) |
| 90 or more Minutes | 827 (5.6%) | 165 (1.3%) |
Time of Departure to Work by Sex in Carbon County
The most frequent times of departure to work in Carbon County are 6:00 AM to 6:29 AM (1,865, 12.6%) for males and 7:00 AM to 7:29 AM (1,916, 15.1%) for females.
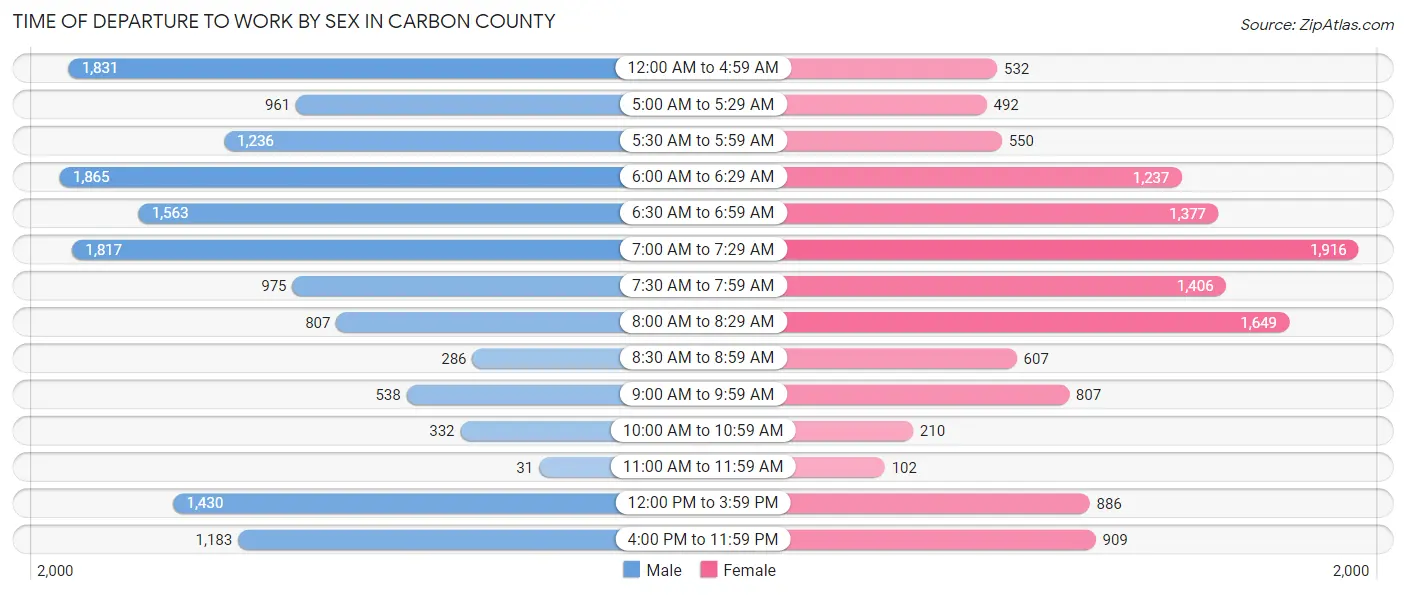
| Time of Departure | Male | Female |
| 12:00 AM to 4:59 AM | 1,831 (12.3%) | 532 (4.2%) |
| 5:00 AM to 5:29 AM | 961 (6.5%) | 492 (3.9%) |
| 5:30 AM to 5:59 AM | 1,236 (8.3%) | 550 (4.3%) |
| 6:00 AM to 6:29 AM | 1,865 (12.6%) | 1,237 (9.8%) |
| 6:30 AM to 6:59 AM | 1,563 (10.5%) | 1,377 (10.9%) |
| 7:00 AM to 7:29 AM | 1,817 (12.2%) | 1,916 (15.1%) |
| 7:30 AM to 7:59 AM | 975 (6.6%) | 1,406 (11.1%) |
| 8:00 AM to 8:29 AM | 807 (5.4%) | 1,649 (13.0%) |
| 8:30 AM to 8:59 AM | 286 (1.9%) | 607 (4.8%) |
| 9:00 AM to 9:59 AM | 538 (3.6%) | 807 (6.4%) |
| 10:00 AM to 10:59 AM | 332 (2.2%) | 210 (1.7%) |
| 11:00 AM to 11:59 AM | 31 (0.2%) | 102 (0.8%) |
| 12:00 PM to 3:59 PM | 1,430 (9.6%) | 886 (7.0%) |
| 4:00 PM to 11:59 PM | 1,183 (8.0%) | 909 (7.2%) |
| Total | 14,855 (100.0%) | 12,680 (100.0%) |
Housing Occupancy in Carbon County
Occupancy by Ownership in Carbon County
Of the total 26,662 dwellings in Carbon County, owner-occupied units account for 20,015 (75.1%), while renter-occupied units make up 6,647 (24.9%).
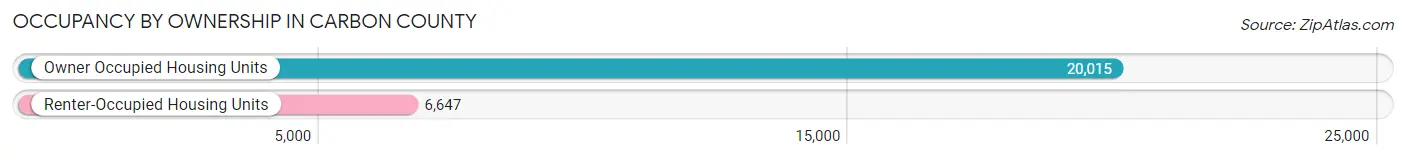
| Occupancy | # Housing Units | % Housing Units |
| Owner Occupied Housing Units | 20,015 | 75.1% |
| Renter-Occupied Housing Units | 6,647 | 24.9% |
| Total Occupied Housing Units | 26,662 | 100.0% |
Occupancy by Household Size in Carbon County
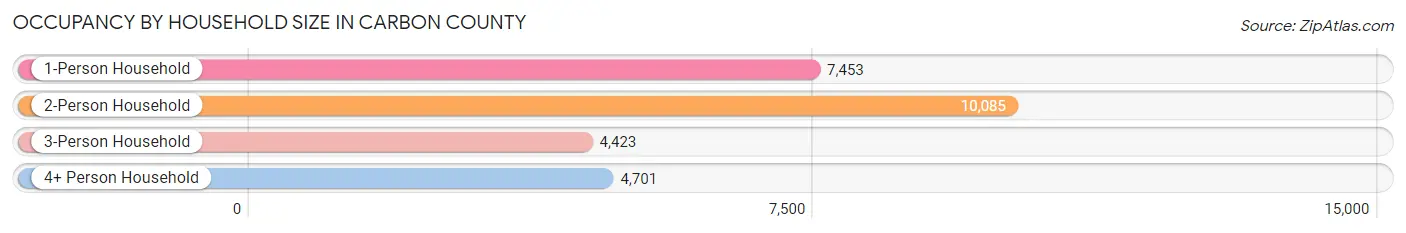
| Household Size | # Housing Units | % Housing Units |
| 1-Person Household | 7,453 | 28.0% |
| 2-Person Household | 10,085 | 37.8% |
| 3-Person Household | 4,423 | 16.6% |
| 4+ Person Household | 4,701 | 17.6% |
| Total Housing Units | 26,662 | 100.0% |
Occupancy by Ownership by Household Size in Carbon County
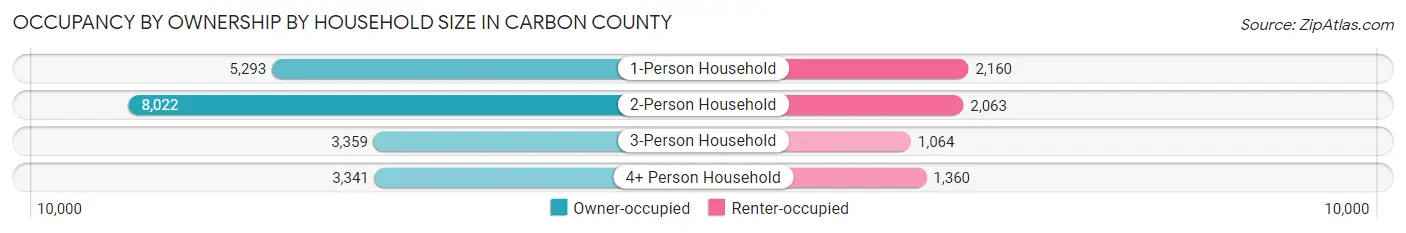
| Household Size | Owner-occupied | Renter-occupied |
| 1-Person Household | 5,293 (71.0%) | 2,160 (29.0%) |
| 2-Person Household | 8,022 (79.5%) | 2,063 (20.5%) |
| 3-Person Household | 3,359 (75.9%) | 1,064 (24.1%) |
| 4+ Person Household | 3,341 (71.1%) | 1,360 (28.9%) |
| Total Housing Units | 20,015 (75.1%) | 6,647 (24.9%) |
Occupancy by Educational Attainment in Carbon County
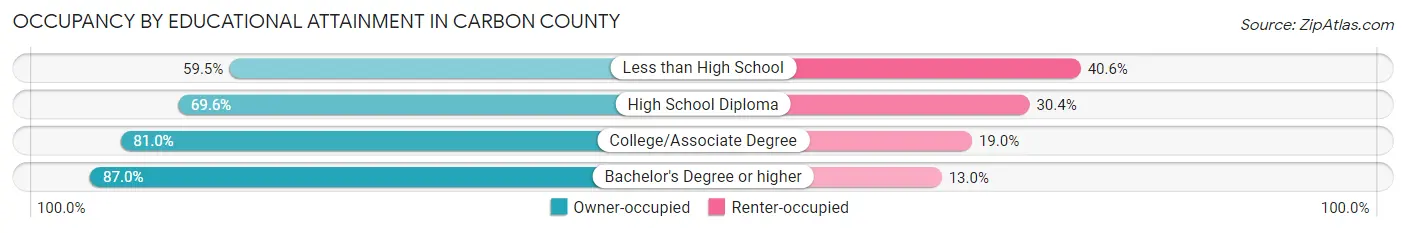
| Household Size | Owner-occupied | Renter-occupied |
| Less than High School | 1,733 (59.5%) | 1,182 (40.6%) |
| High School Diploma | 7,663 (69.6%) | 3,347 (30.4%) |
| College/Associate Degree | 6,247 (81.0%) | 1,465 (19.0%) |
| Bachelor's Degree or higher | 4,372 (87.0%) | 653 (13.0%) |
Occupancy by Age of Householder in Carbon County
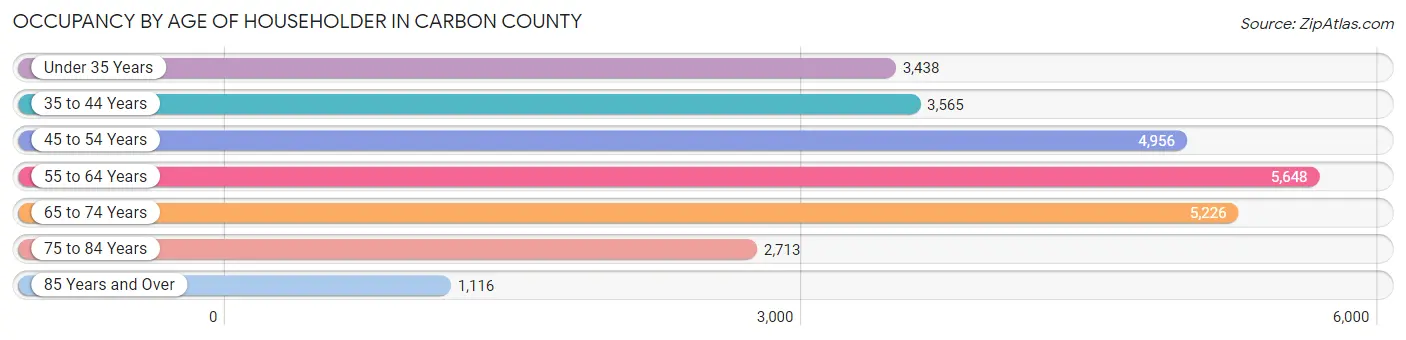
| Age Bracket | # Households | % Households |
| Under 35 Years | 3,438 | 12.9% |
| 35 to 44 Years | 3,565 | 13.4% |
| 45 to 54 Years | 4,956 | 18.6% |
| 55 to 64 Years | 5,648 | 21.2% |
| 65 to 74 Years | 5,226 | 19.6% |
| 75 to 84 Years | 2,713 | 10.2% |
| 85 Years and Over | 1,116 | 4.2% |
| Total | 26,662 | 100.0% |
Housing Finances in Carbon County
Median Income by Occupancy in Carbon County
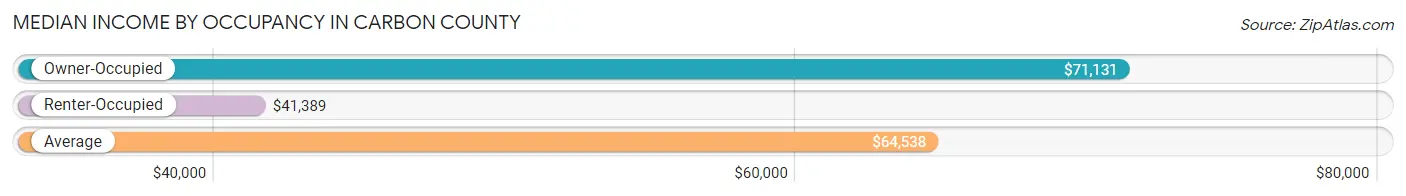
| Occupancy Type | # Households | Median Income |
| Owner-Occupied | 20,015 (75.1%) | $71,131 |
| Renter-Occupied | 6,647 (24.9%) | $41,389 |
| Average | 26,662 (100.0%) | $64,538 |
Occupancy by Householder Income Bracket in Carbon County
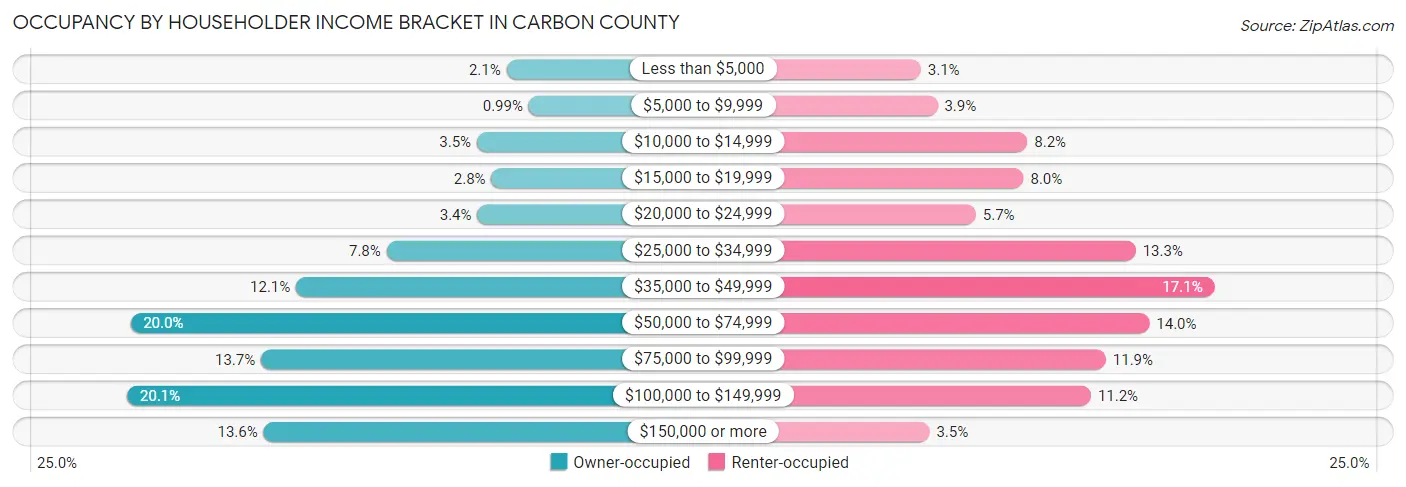
| Income Bracket | Owner-occupied | Renter-occupied |
| Less than $5,000 | 410 (2.1%) | 207 (3.1%) |
| $5,000 to $9,999 | 199 (1.0%) | 259 (3.9%) |
| $10,000 to $14,999 | 693 (3.5%) | 544 (8.2%) |
| $15,000 to $19,999 | 554 (2.8%) | 532 (8.0%) |
| $20,000 to $24,999 | 688 (3.4%) | 381 (5.7%) |
| $25,000 to $34,999 | 1,554 (7.8%) | 887 (13.3%) |
| $35,000 to $49,999 | 2,416 (12.1%) | 1,136 (17.1%) |
| $50,000 to $74,999 | 3,996 (20.0%) | 930 (14.0%) |
| $75,000 to $99,999 | 2,750 (13.7%) | 792 (11.9%) |
| $100,000 to $149,999 | 4,029 (20.1%) | 745 (11.2%) |
| $150,000 or more | 2,726 (13.6%) | 234 (3.5%) |
| Total | 20,015 (100.0%) | 6,647 (100.0%) |
Monthly Housing Cost Tiers in Carbon County
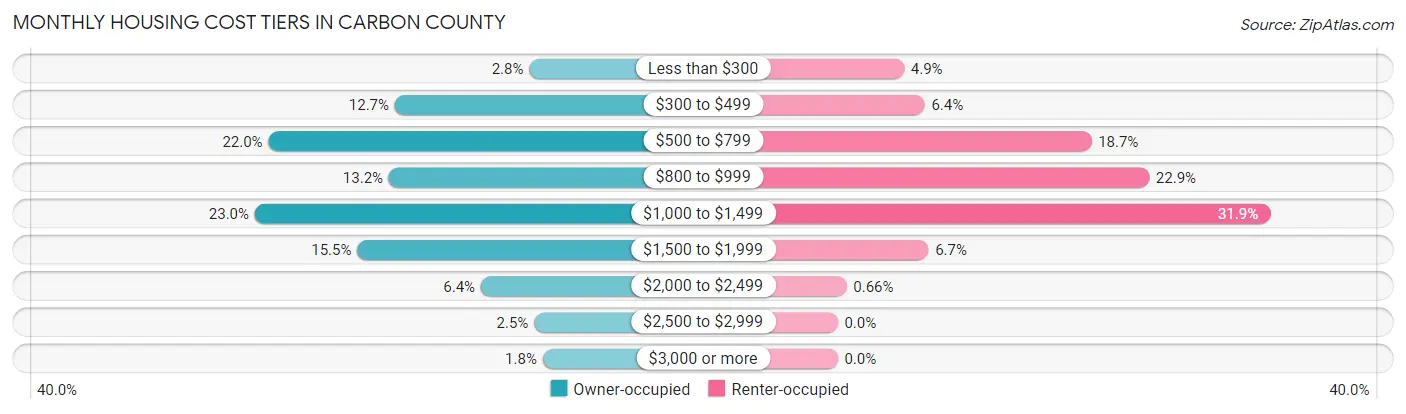
| Monthly Cost | Owner-occupied | Renter-occupied |
| Less than $300 | 566 (2.8%) | 325 (4.9%) |
| $300 to $499 | 2,548 (12.7%) | 426 (6.4%) |
| $500 to $799 | 4,411 (22.0%) | 1,242 (18.7%) |
| $800 to $999 | 2,635 (13.2%) | 1,525 (22.9%) |
| $1,000 to $1,499 | 4,611 (23.0%) | 2,118 (31.9%) |
| $1,500 to $1,999 | 3,103 (15.5%) | 445 (6.7%) |
| $2,000 to $2,499 | 1,278 (6.4%) | 44 (0.7%) |
| $2,500 to $2,999 | 494 (2.5%) | 0 (0.0%) |
| $3,000 or more | 369 (1.8%) | 0 (0.0%) |
| Total | 20,015 (100.0%) | 6,647 (100.0%) |
Physical Housing Characteristics in Carbon County
Housing Structures in Carbon County
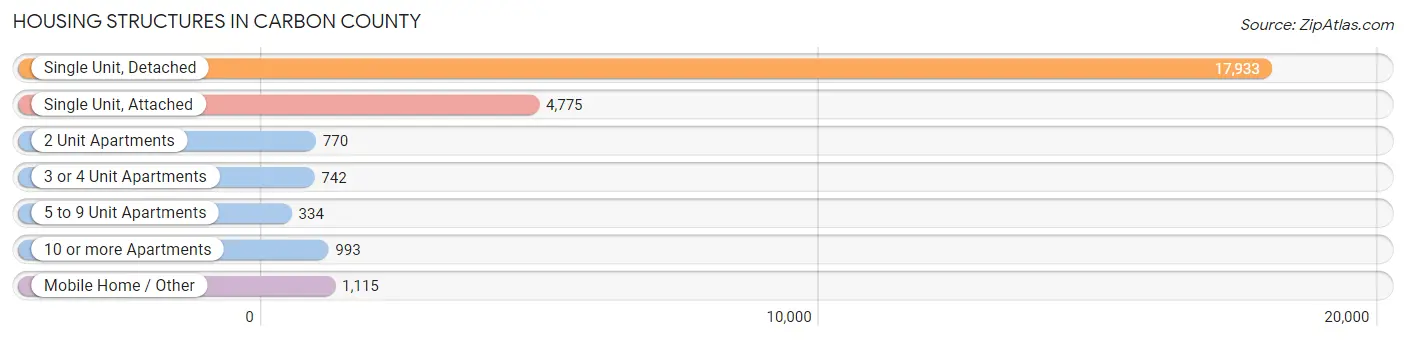
| Structure Type | # Housing Units | % Housing Units |
| Single Unit, Detached | 17,933 | 67.3% |
| Single Unit, Attached | 4,775 | 17.9% |
| 2 Unit Apartments | 770 | 2.9% |
| 3 or 4 Unit Apartments | 742 | 2.8% |
| 5 to 9 Unit Apartments | 334 | 1.3% |
| 10 or more Apartments | 993 | 3.7% |
| Mobile Home / Other | 1,115 | 4.2% |
| Total | 26,662 | 100.0% |
Housing Structures by Occupancy in Carbon County
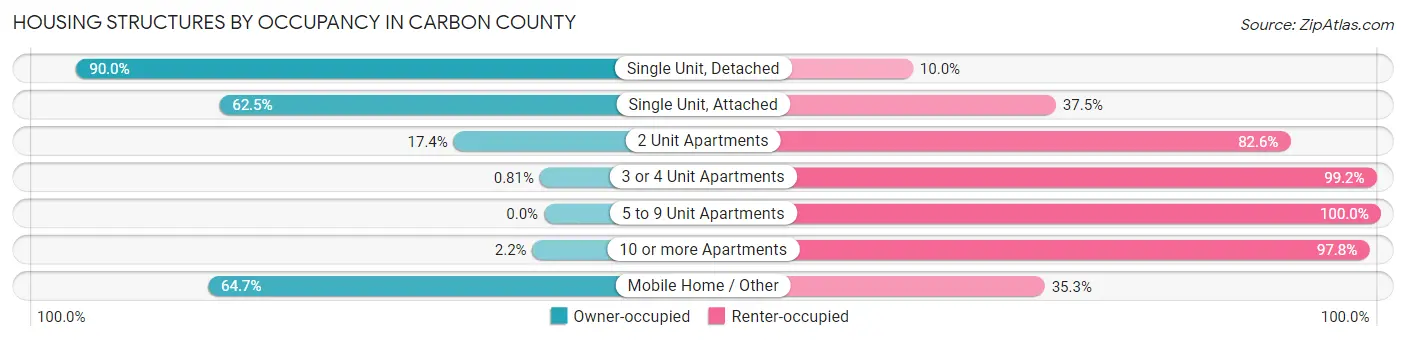
| Structure Type | Owner-occupied | Renter-occupied |
| Single Unit, Detached | 16,147 (90.0%) | 1,786 (10.0%) |
| Single Unit, Attached | 2,985 (62.5%) | 1,790 (37.5%) |
| 2 Unit Apartments | 134 (17.4%) | 636 (82.6%) |
| 3 or 4 Unit Apartments | 6 (0.8%) | 736 (99.2%) |
| 5 to 9 Unit Apartments | 0 (0.0%) | 334 (100.0%) |
| 10 or more Apartments | 22 (2.2%) | 971 (97.8%) |
| Mobile Home / Other | 721 (64.7%) | 394 (35.3%) |
| Total | 20,015 (75.1%) | 6,647 (24.9%) |
Housing Structures by Number of Rooms in Carbon County
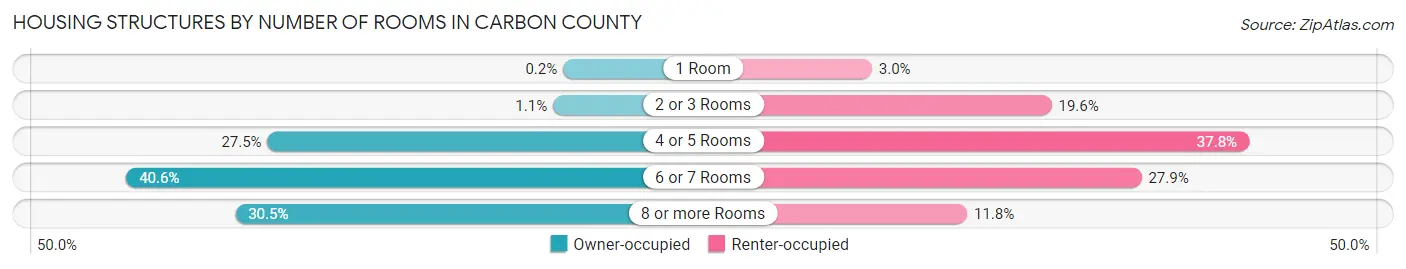
| Number of Rooms | Owner-occupied | Renter-occupied |
| 1 Room | 41 (0.2%) | 196 (2.9%) |
| 2 or 3 Rooms | 226 (1.1%) | 1,301 (19.6%) |
| 4 or 5 Rooms | 5,513 (27.5%) | 2,514 (37.8%) |
| 6 or 7 Rooms | 8,127 (40.6%) | 1,854 (27.9%) |
| 8 or more Rooms | 6,108 (30.5%) | 782 (11.8%) |
| Total | 20,015 (100.0%) | 6,647 (100.0%) |
Housing Structure by Heating Type in Carbon County
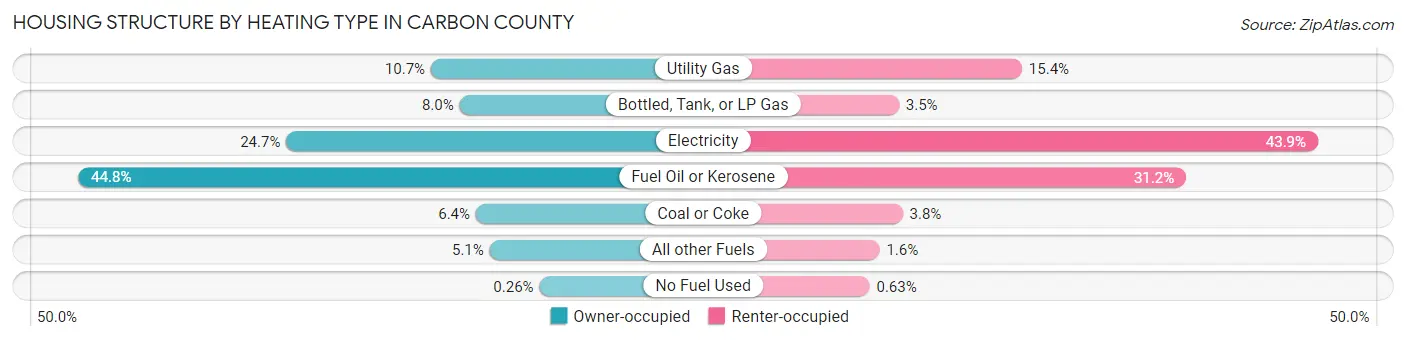
| Heating Type | Owner-occupied | Renter-occupied |
| Utility Gas | 2,149 (10.7%) | 1,020 (15.3%) |
| Bottled, Tank, or LP Gas | 1,598 (8.0%) | 230 (3.5%) |
| Electricity | 4,948 (24.7%) | 2,921 (43.9%) |
| Fuel Oil or Kerosene | 8,973 (44.8%) | 2,074 (31.2%) |
| Coal or Coke | 1,280 (6.4%) | 254 (3.8%) |
| All other Fuels | 1,014 (5.1%) | 106 (1.6%) |
| No Fuel Used | 53 (0.3%) | 42 (0.6%) |
| Total | 20,015 (100.0%) | 6,647 (100.0%) |
Household Vehicle Usage in Carbon County
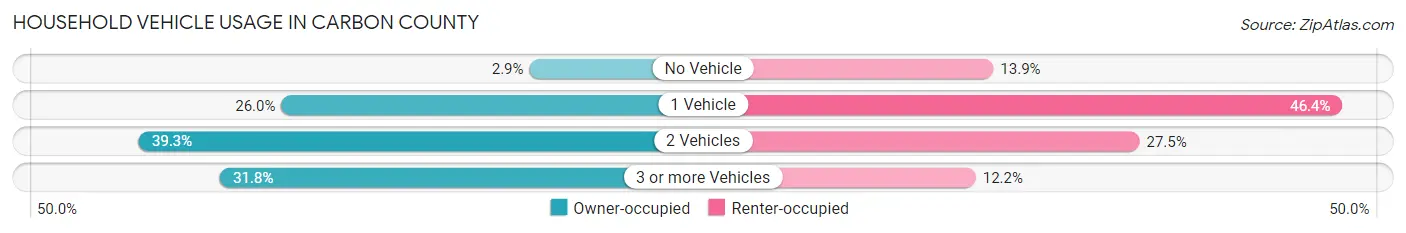
| Vehicles per Household | Owner-occupied | Renter-occupied |
| No Vehicle | 577 (2.9%) | 921 (13.9%) |
| 1 Vehicle | 5,212 (26.0%) | 3,086 (46.4%) |
| 2 Vehicles | 7,872 (39.3%) | 1,828 (27.5%) |
| 3 or more Vehicles | 6,354 (31.8%) | 812 (12.2%) |
| Total | 20,015 (100.0%) | 6,647 (100.0%) |
Real Estate & Mortgages in Carbon County
Real Estate and Mortgage Overview in Carbon County
| Characteristic | Without Mortgage | With Mortgage |
| Housing Units | 8,717 | 11,298 |
| Median Property Value | $173,100 | $183,900 |
| Median Household Income | $52,697 | $2,005 |
| Monthly Housing Costs | $588 | $362 |
| Real Estate Taxes | $2,753 | $139 |
Property Value by Mortgage Status in Carbon County
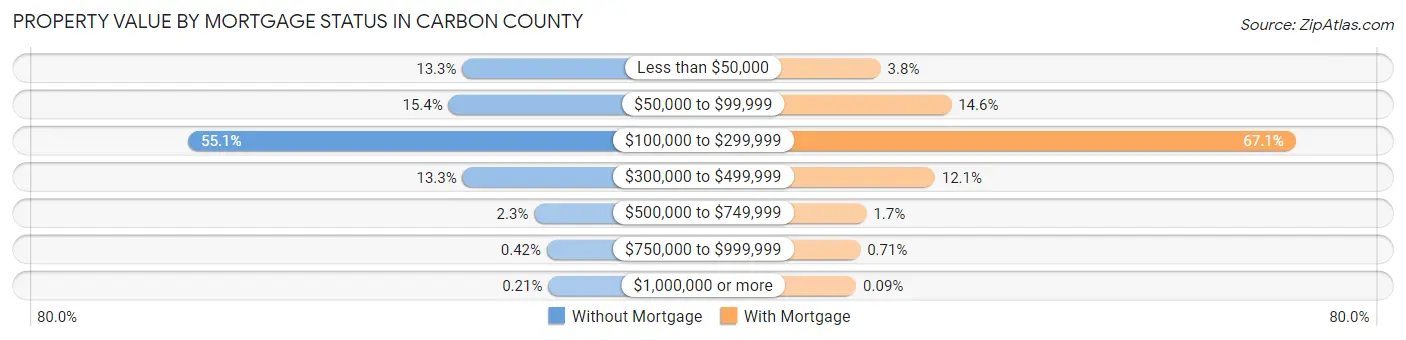
| Property Value | Without Mortgage | With Mortgage |
| Less than $50,000 | 1,159 (13.3%) | 433 (3.8%) |
| $50,000 to $99,999 | 1,342 (15.4%) | 1,647 (14.6%) |
| $100,000 to $299,999 | 4,801 (55.1%) | 7,575 (67.0%) |
| $300,000 to $499,999 | 1,156 (13.3%) | 1,365 (12.1%) |
| $500,000 to $749,999 | 204 (2.3%) | 188 (1.7%) |
| $750,000 to $999,999 | 37 (0.4%) | 80 (0.7%) |
| $1,000,000 or more | 18 (0.2%) | 10 (0.1%) |
| Total | 8,717 (100.0%) | 11,298 (100.0%) |
Household Income by Mortgage Status in Carbon County
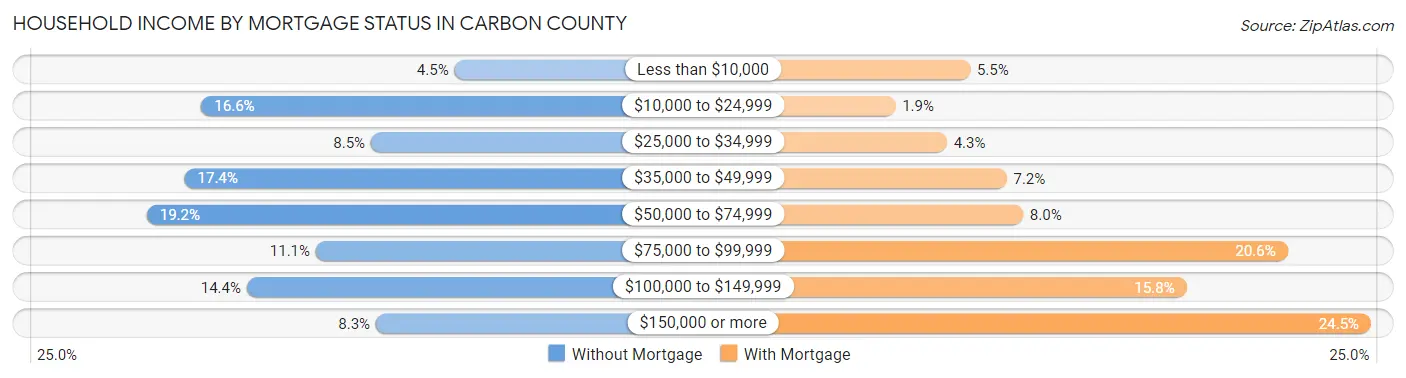
| Household Income | Without Mortgage | With Mortgage |
| Less than $10,000 | 395 (4.5%) | 616 (5.4%) |
| $10,000 to $24,999 | 1,445 (16.6%) | 214 (1.9%) |
| $25,000 to $34,999 | 742 (8.5%) | 490 (4.3%) |
| $35,000 to $49,999 | 1,515 (17.4%) | 812 (7.2%) |
| $50,000 to $74,999 | 1,672 (19.2%) | 901 (8.0%) |
| $75,000 to $99,999 | 970 (11.1%) | 2,324 (20.6%) |
| $100,000 to $149,999 | 1,257 (14.4%) | 1,780 (15.8%) |
| $150,000 or more | 721 (8.3%) | 2,772 (24.5%) |
| Total | 8,717 (100.0%) | 11,298 (100.0%) |
Property Value to Household Income Ratio in Carbon County
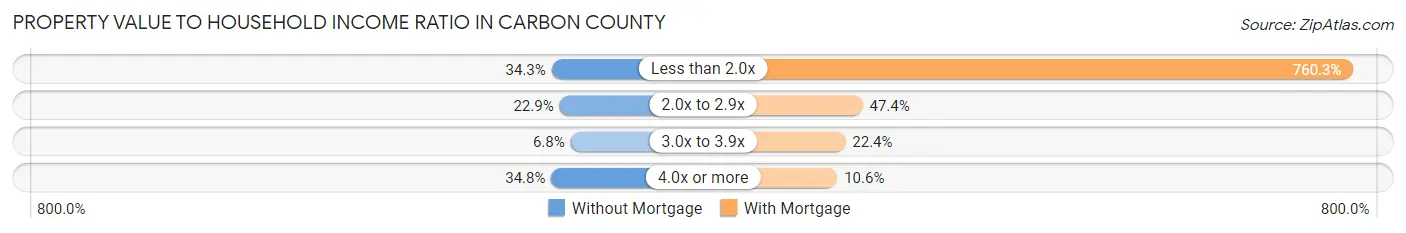
| Value-to-Income Ratio | Without Mortgage | With Mortgage |
| Less than 2.0x | 2,990 (34.3%) | 85,900 (760.3%) |
| 2.0x to 2.9x | 1,995 (22.9%) | 5,353 (47.4%) |
| 3.0x to 3.9x | 595 (6.8%) | 2,531 (22.4%) |
| 4.0x or more | 3,031 (34.8%) | 1,198 (10.6%) |
| Total | 8,717 (100.0%) | 11,298 (100.0%) |
Real Estate Taxes by Mortgage Status in Carbon County
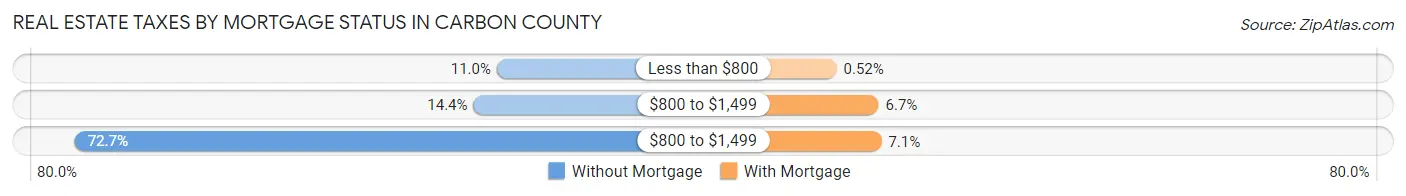
| Property Taxes | Without Mortgage | With Mortgage |
| Less than $800 | 960 (11.0%) | 59 (0.5%) |
| $800 to $1,499 | 1,258 (14.4%) | 751 (6.7%) |
| $800 to $1,499 | 6,335 (72.7%) | 800 (7.1%) |
| Total | 8,717 (100.0%) | 11,298 (100.0%) |
Health & Disability in Carbon County
Health Insurance Coverage by Age in Carbon County
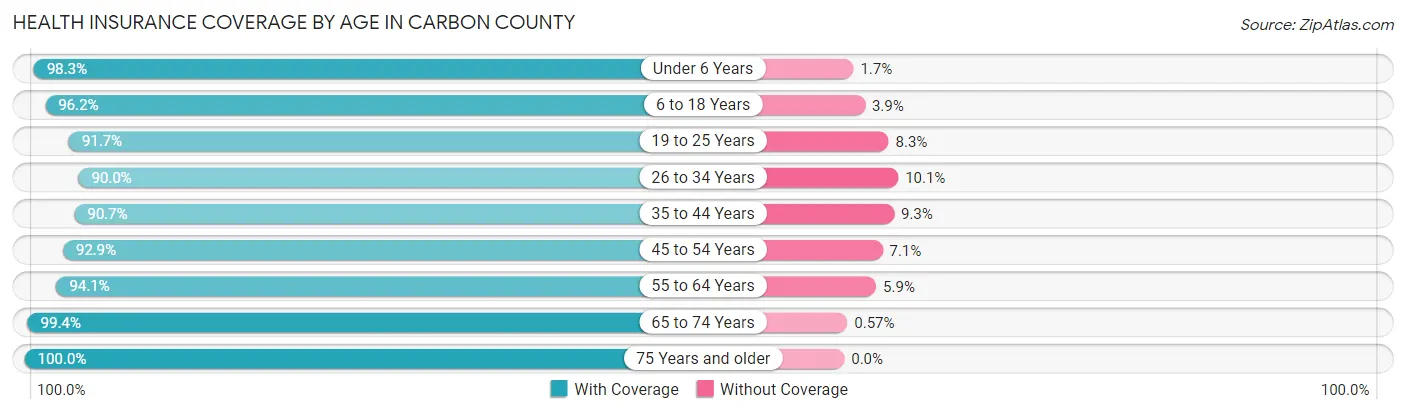
| Age Bracket | With Coverage | Without Coverage |
| Under 6 Years | 3,400 (98.3%) | 59 (1.7%) |
| 6 to 18 Years | 9,206 (96.2%) | 369 (3.8%) |
| 19 to 25 Years | 4,210 (91.7%) | 379 (8.3%) |
| 26 to 34 Years | 5,566 (89.9%) | 622 (10.1%) |
| 35 to 44 Years | 6,836 (90.7%) | 699 (9.3%) |
| 45 to 54 Years | 8,364 (92.9%) | 642 (7.1%) |
| 55 to 64 Years | 9,729 (94.1%) | 614 (5.9%) |
| 65 to 74 Years | 8,243 (99.4%) | 47 (0.6%) |
| 75 Years and older | 5,226 (100.0%) | 0 (0.0%) |
| Total | 60,780 (94.7%) | 3,431 (5.3%) |
Health Insurance Coverage by Citizenship Status in Carbon County
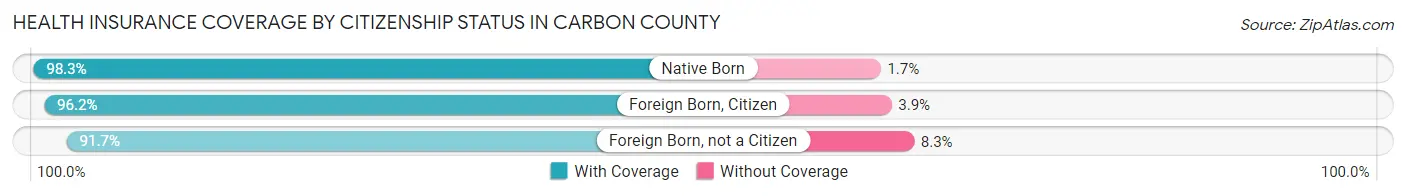
| Citizenship Status | With Coverage | Without Coverage |
| Native Born | 3,400 (98.3%) | 59 (1.7%) |
| Foreign Born, Citizen | 9,206 (96.2%) | 369 (3.8%) |
| Foreign Born, not a Citizen | 4,210 (91.7%) | 379 (8.3%) |
Health Insurance Coverage by Household Income in Carbon County
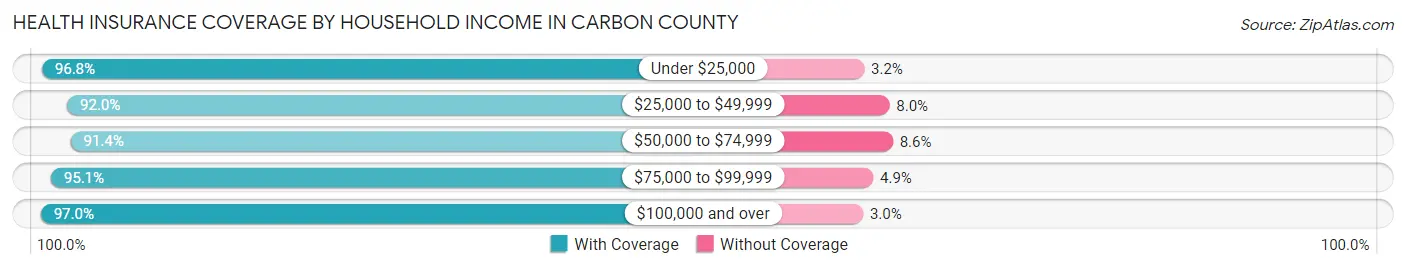
| Household Income | With Coverage | Without Coverage |
| Under $25,000 | 6,742 (96.8%) | 226 (3.2%) |
| $25,000 to $49,999 | 11,609 (92.0%) | 1,006 (8.0%) |
| $50,000 to $74,999 | 10,838 (91.4%) | 1,021 (8.6%) |
| $75,000 to $99,999 | 8,705 (95.1%) | 451 (4.9%) |
| $100,000 and over | 22,805 (97.0%) | 713 (3.0%) |
Public vs Private Health Insurance Coverage by Age in Carbon County
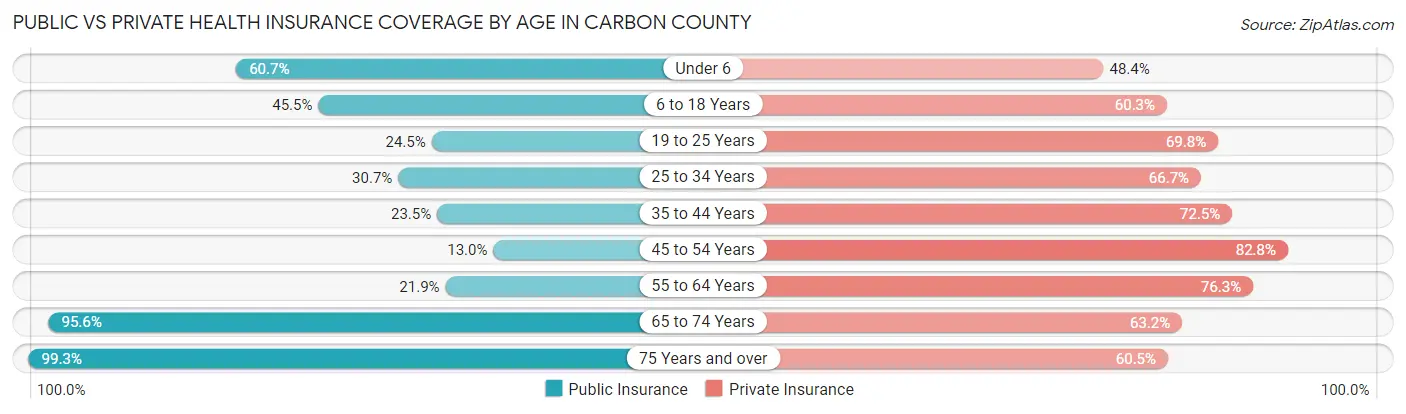
| Age Bracket | Public Insurance | Private Insurance |
| Under 6 | 2,100 (60.7%) | 1,674 (48.4%) |
| 6 to 18 Years | 4,355 (45.5%) | 5,777 (60.3%) |
| 19 to 25 Years | 1,123 (24.5%) | 3,204 (69.8%) |
| 25 to 34 Years | 1,897 (30.7%) | 4,124 (66.6%) |
| 35 to 44 Years | 1,767 (23.4%) | 5,459 (72.5%) |
| 45 to 54 Years | 1,172 (13.0%) | 7,454 (82.8%) |
| 55 to 64 Years | 2,264 (21.9%) | 7,894 (76.3%) |
| 65 to 74 Years | 7,921 (95.6%) | 5,235 (63.1%) |
| 75 Years and over | 5,187 (99.3%) | 3,163 (60.5%) |
| Total | 27,786 (43.3%) | 43,984 (68.5%) |
Disability Status by Sex by Age in Carbon County
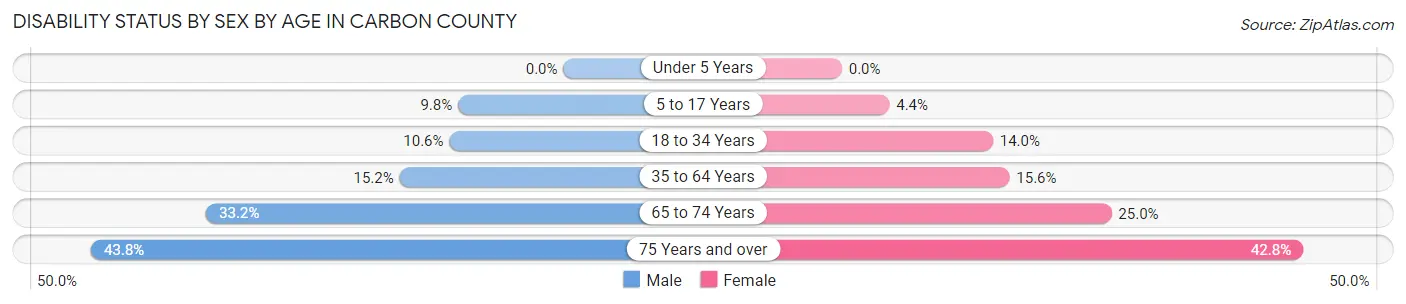
| Age Bracket | Male | Female |
| Under 5 Years | 0 (0.0%) | 0 (0.0%) |
| 5 to 17 Years | 462 (9.8%) | 204 (4.4%) |
| 18 to 34 Years | 630 (10.6%) | 775 (14.0%) |
| 35 to 64 Years | 2,074 (15.2%) | 2,059 (15.5%) |
| 65 to 74 Years | 1,394 (33.2%) | 1,022 (25.0%) |
| 75 Years and over | 978 (43.8%) | 1,282 (42.8%) |
Disability Class by Sex by Age in Carbon County
Disability Class: Hearing Difficulty
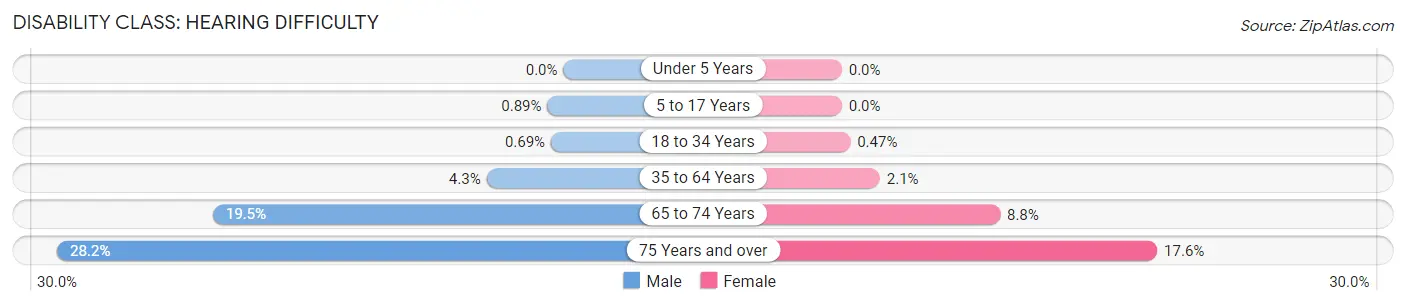
| Age Bracket | Male | Female |
| Under 5 Years | 0 (0.0%) | 0 (0.0%) |
| 5 to 17 Years | 42 (0.9%) | 0 (0.0%) |
| 18 to 34 Years | 41 (0.7%) | 26 (0.5%) |
| 35 to 64 Years | 584 (4.3%) | 281 (2.1%) |
| 65 to 74 Years | 821 (19.5%) | 360 (8.8%) |
| 75 Years and over | 629 (28.2%) | 526 (17.6%) |
Disability Class: Vision Difficulty
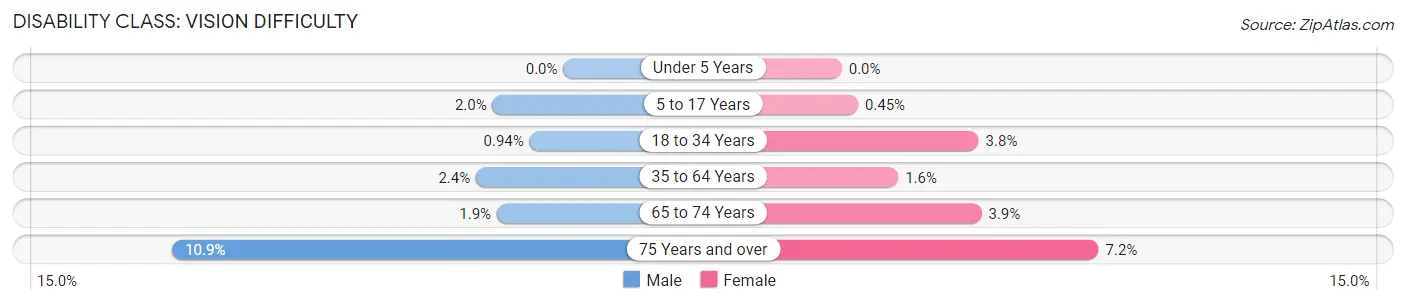
| Age Bracket | Male | Female |
| Under 5 Years | 0 (0.0%) | 0 (0.0%) |
| 5 to 17 Years | 93 (2.0%) | 21 (0.4%) |
| 18 to 34 Years | 56 (0.9%) | 211 (3.8%) |
| 35 to 64 Years | 332 (2.4%) | 208 (1.6%) |
| 65 to 74 Years | 78 (1.8%) | 159 (3.9%) |
| 75 Years and over | 243 (10.9%) | 214 (7.1%) |
Disability Class: Cognitive Difficulty
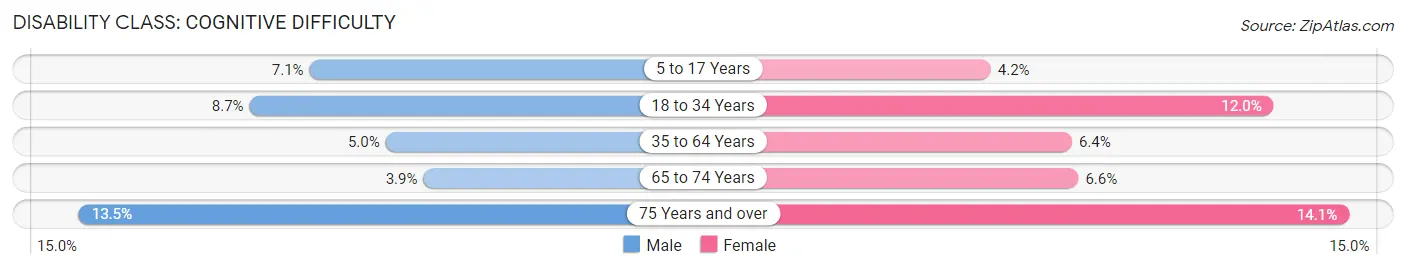
| Age Bracket | Male | Female |
| 5 to 17 Years | 334 (7.1%) | 192 (4.2%) |
| 18 to 34 Years | 520 (8.7%) | 665 (12.0%) |
| 35 to 64 Years | 675 (5.0%) | 849 (6.4%) |
| 65 to 74 Years | 164 (3.9%) | 269 (6.6%) |
| 75 Years and over | 301 (13.5%) | 423 (14.1%) |
Disability Class: Ambulatory Difficulty
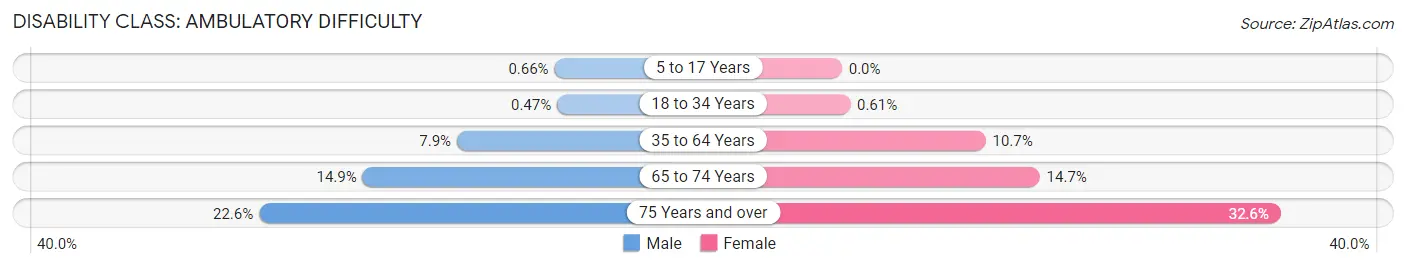
| Age Bracket | Male | Female |
| 5 to 17 Years | 31 (0.7%) | 0 (0.0%) |
| 18 to 34 Years | 28 (0.5%) | 34 (0.6%) |
| 35 to 64 Years | 1,078 (7.9%) | 1,413 (10.7%) |
| 65 to 74 Years | 627 (14.9%) | 600 (14.7%) |
| 75 Years and over | 504 (22.6%) | 976 (32.6%) |
Disability Class: Self-Care Difficulty
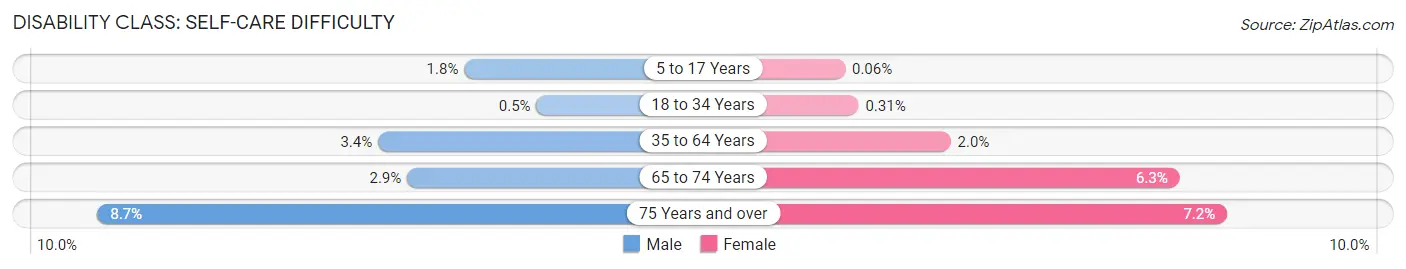
| Age Bracket | Male | Female |
| 5 to 17 Years | 87 (1.8%) | 3 (0.1%) |
| 18 to 34 Years | 30 (0.5%) | 17 (0.3%) |
| 35 to 64 Years | 470 (3.4%) | 268 (2.0%) |
| 65 to 74 Years | 122 (2.9%) | 256 (6.3%) |
| 75 Years and over | 193 (8.6%) | 214 (7.1%) |
Technology Access in Carbon County
Computing Device Access in Carbon County
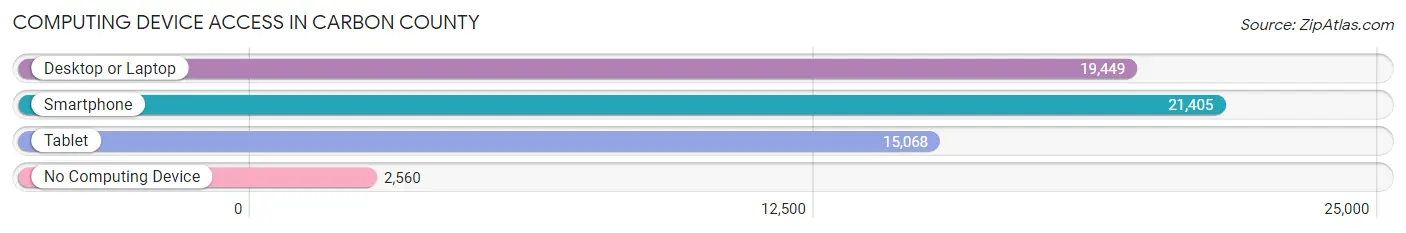
| Device Type | # Households | % Households |
| Desktop or Laptop | 19,449 | 73.0% |
| Smartphone | 21,405 | 80.3% |
| Tablet | 15,068 | 56.5% |
| No Computing Device | 2,560 | 9.6% |
| Total | 26,662 | 100.0% |
Internet Access in Carbon County
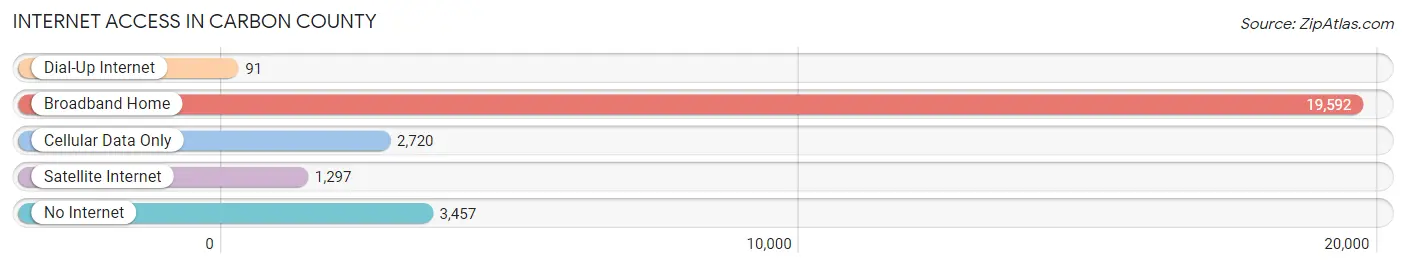
| Internet Type | # Households | % Households |
| Dial-Up Internet | 91 | 0.3% |
| Broadband Home | 19,592 | 73.5% |
| Cellular Data Only | 2,720 | 10.2% |
| Satellite Internet | 1,297 | 4.9% |
| No Internet | 3,457 | 13.0% |
| Total | 26,662 | 100.0% |
Carbon County Summary
Carbon County is a county located in the U.S. state of Pennsylvania. As of the 2010 census, the population was 65,249. The county seat is Jim Thorpe. Carbon County is included in the Allentown-Bethlehem-Easton, PA-NJ Metropolitan Statistical Area.
History
Carbon County was created on March 13, 1843, from parts of Northampton, Monroe, and Luzerne counties. It was named for the extensive deposits of coal in the region. The first courthouse was located in Easton, Pennsylvania, but it was moved to Mauch Chunk (now Jim Thorpe) in 1845.
Geography
Carbon County is located in eastern Pennsylvania, about 80 miles north of Philadelphia and 100 miles west of New York City. It is bordered by Monroe County to the north, Schuylkill County to the east, Lehigh County to the south, and Northampton County to the west. The county has a total area of 387 square miles, of which 383 square miles is land and 4.2 square miles is water.
The county is located in the Ridge and Valley region of the Appalachian Mountains. The Lehigh River flows through the county, and the Lehigh Gap is located in the northern part of the county. The county is home to several state parks, including Hickory Run State Park, Beltzville State Park, and Lehigh Gorge State Park.
Economy
The economy of Carbon County is largely based on tourism and manufacturing. The county is home to several ski resorts, including Blue Mountain Ski Area, Jack Frost Big Boulder, and Camelback Ski Area. The county is also home to several manufacturing companies, including Air Products and Chemicals, Inc., Crayola, and Kraft Foods.
The county also has a large agricultural sector, with dairy farming being the primary industry. The county is home to several wineries, including Franklin Hill Vineyards and Big Creek Vineyard.
Demographics
As of the 2010 census, there were 65,249 people, 25,844 households, and 17,836 families residing in the county. The population density was 169.3 people per square mile. There were 28,844 housing units at an average density of 75.1 per square mile. The racial makeup of the county was 97.2% White, 0.9% Black or African American, 0.2% Native American, 0.5% Asian, 0.1% Pacific Islander, 0.4% from other races, and 0.7% from two or more races. 1.7% of the population were Hispanic or Latino of any race.
There were 25,844 households, out of which 28.2% had children under the age of 18 living with them, 54.2% were married couples living together, 9.7% had a female householder with no husband present, and 31.3% were non-families. 26.2% of all households were made up of individuals, and 11.7% had someone living alone who was 65 years of age or older. The average household size was 2.48 and the average family size was 2.99.
In the county, the population was spread out, with 22.2% under the age of 18, 7.2% from 18 to 24, 27.2% from 25 to 44, 26.2% from 45 to 64, and 17.2% who were 65 years of age or older. The median age was 40 years. For every 100 females, there were 97.2 males. For every 100 females age 18 and over, there were 94.7 males.
The median income for a household in the county was $41,902, and the median income for a family was $50,976. Males had a median income of $37,788 versus $25,734 for females. The per capita income for the county was $20,948. About 6.2% of families and 9.2% of the population were below the poverty line, including 11.2% of those under age 18 and 8.2% of those age 65 or over.
Common Questions
What is Per Capita Income in Carbon County?
Per Capita income in Carbon County is $34,375.
What is the Median Family Income in Carbon County?
Median Family Income in Carbon County is $76,535.
What is the Median Household income in Carbon County?
Median Household Income in Carbon County is $64,538.
What is Income or Wage Gap in Carbon County?
Income or Wage Gap in Carbon County is 30.6%.
Women in Carbon County earn 69.4 cents for every dollar earned by a man.
What is Family Income Deficit in Carbon County?
Family Income Deficit in Carbon County is $11,062.
Families that are below poverty line in Carbon County earn $11,062 less on average than the poverty threshold level.
What is Inequality or Gini Index in Carbon County?
Inequality or Gini Index in Carbon County is 0.43.
What is the Total Population of Carbon County?
Total Population of Carbon County is 65,018.
What is the Total Male Population of Carbon County?
Total Male Population of Carbon County is 32,644.
What is the Total Female Population of Carbon County?
Total Female Population of Carbon County is 32,374.
What is the Ratio of Males per 100 Females in Carbon County?
There are 100.83 Males per 100 Females in Carbon County.
What is the Ratio of Females per 100 Males in Carbon County?
There are 99.17 Females per 100 Males in Carbon County.
What is the Median Population Age in Carbon County?
Median Population Age in Carbon County is 46.3 Years.
What is the Average Family Size in Carbon County
Average Family Size in Carbon County is 2.9 People.
What is the Average Household Size in Carbon County
Average Household Size in Carbon County is 2.4 People.
How Large is the Labor Force in Carbon County?
There are 33,068 People in the Labor Forcein in Carbon County.
What is the Percentage of People in the Labor Force in Carbon County?
61.0% of People are in the Labor Force in Carbon County.
What is the Unemployment Rate in Carbon County?
Unemployment Rate in Carbon County is 6.9%.