Berks County, PA Map & Demographics
Berks County Map
Berks County Overview
$37,776
PER CAPITA INCOME
$92,726
AVG FAMILY INCOME
$74,617
AVG HOUSEHOLD INCOME
33.7%
WAGE / INCOME GAP [ % ]
66.3¢/ $1
WAGE / INCOME GAP [ $ ]
$11,208
FAMILY INCOME DEFICIT
0.45
INEQUALITY / GINI INDEX
428,483
TOTAL POPULATION
212,820
MALE POPULATION
215,663
FEMALE POPULATION
98.68
MALES / 100 FEMALES
101.34
FEMALES / 100 MALES
39.9
MEDIAN AGE
3.1
AVG FAMILY SIZE
2.6
AVG HOUSEHOLD SIZE
223,782
LABOR FORCE [ PEOPLE ]
64.8%
PERCENT IN LABOR FORCE
5.4%
UNEMPLOYMENT RATE
Income in Berks County
Income Overview in Berks County
Per Capita Income in Berks County is $37,776, while median incomes of families and households are $92,726 and $74,617 respectively.
| Characteristic | Number | Measure |
| Per Capita Income | 428,483 | $37,776 |
| Median Family Income | 107,561 | $92,726 |
| Mean Family Income | 107,561 | $112,986 |
| Median Household Income | 161,174 | $74,617 |
| Mean Household Income | 161,174 | $97,622 |
| Income Deficit | 107,561 | $11,208 |
| Wage / Income Gap (%) | 428,483 | 33.70% |
| Wage / Income Gap ($) | 428,483 | 66.30¢ per $1 |
| Gini / Inequality Index | 428,483 | 0.45 |
Earnings by Sex in Berks County
Average Earnings in Berks County are $41,692, $50,196 for men and $33,282 for women, a difference of 33.7%.
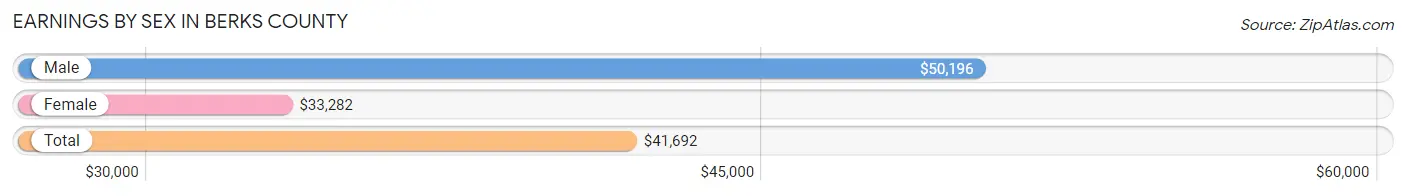
| Sex | Number | Average Earnings |
| Male | 123,963 (52.7%) | $50,196 |
| Female | 111,280 (47.3%) | $33,282 |
| Total | 235,243 (100.0%) | $41,692 |
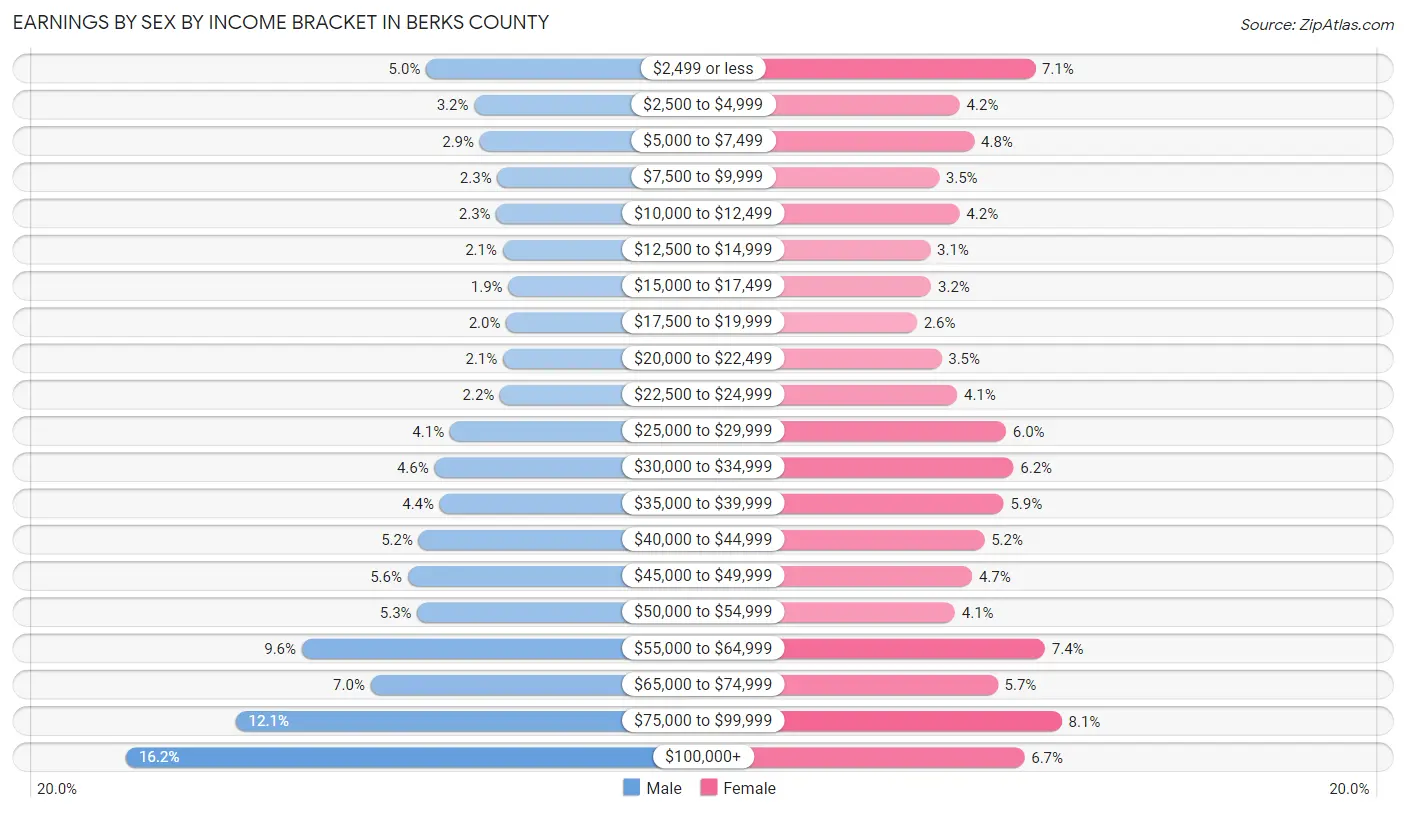
Earnings by Sex by Income Bracket in Berks County
The most common earnings brackets in Berks County are $100,000+ for men (20,083 | 16.2%) and $75,000 to $99,999 for women (8,953 | 8.1%).
| Income | Male | Female |
| $2,499 or less | 6,140 (5.0%) | 7,844 (7.0%) |
| $2,500 to $4,999 | 3,905 (3.2%) | 4,704 (4.2%) |
| $5,000 to $7,499 | 3,646 (2.9%) | 5,303 (4.8%) |
| $7,500 to $9,999 | 2,821 (2.3%) | 3,835 (3.5%) |
| $10,000 to $12,499 | 2,870 (2.3%) | 4,692 (4.2%) |
| $12,500 to $14,999 | 2,579 (2.1%) | 3,471 (3.1%) |
| $15,000 to $17,499 | 2,312 (1.9%) | 3,522 (3.2%) |
| $17,500 to $19,999 | 2,416 (1.9%) | 2,911 (2.6%) |
| $20,000 to $22,499 | 2,567 (2.1%) | 3,942 (3.5%) |
| $22,500 to $24,999 | 2,700 (2.2%) | 4,595 (4.1%) |
| $25,000 to $29,999 | 5,037 (4.1%) | 6,631 (6.0%) |
| $30,000 to $34,999 | 5,752 (4.6%) | 6,945 (6.2%) |
| $35,000 to $39,999 | 5,501 (4.4%) | 6,536 (5.9%) |
| $40,000 to $44,999 | 6,487 (5.2%) | 5,735 (5.1%) |
| $45,000 to $49,999 | 6,989 (5.6%) | 5,216 (4.7%) |
| $50,000 to $54,999 | 6,540 (5.3%) | 4,505 (4.1%) |
| $55,000 to $64,999 | 11,918 (9.6%) | 8,260 (7.4%) |
| $65,000 to $74,999 | 8,714 (7.0%) | 6,285 (5.7%) |
| $75,000 to $99,999 | 14,986 (12.1%) | 8,953 (8.1%) |
| $100,000+ | 20,083 (16.2%) | 7,395 (6.7%) |
| Total | 123,963 (100.0%) | 111,280 (100.0%) |
Earnings by Sex by Educational Attainment in Berks County
Average earnings in Berks County are $56,480 for men and $39,176 for women, a difference of 30.6%. Men with an educational attainment of graduate degree enjoy the highest average annual earnings of $93,281, while those with less than high school education earn the least with $42,735. Women with an educational attainment of graduate degree earn the most with the average annual earnings of $74,267, while those with less than high school education have the smallest earnings of $23,361.
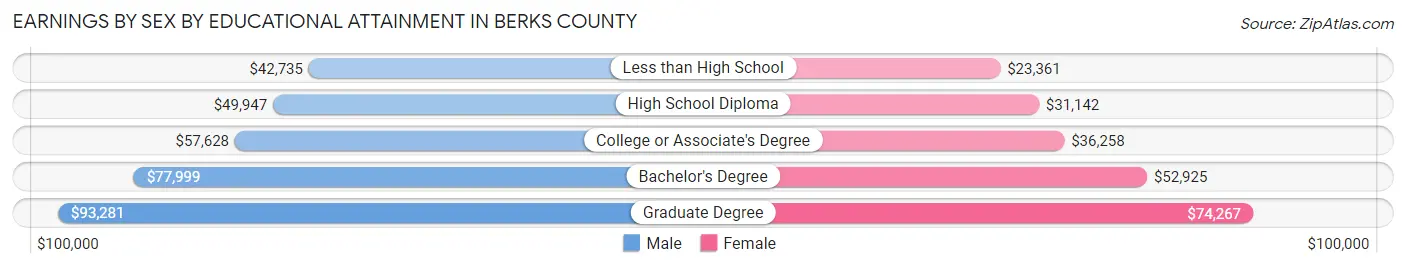
| Educational Attainment | Male Income | Female Income |
| Less than High School | $42,735 | $23,361 |
| High School Diploma | $49,947 | $31,142 |
| College or Associate's Degree | $57,628 | $36,258 |
| Bachelor's Degree | $77,999 | $52,925 |
| Graduate Degree | $93,281 | $74,267 |
| Total | $56,480 | $39,176 |
Family Income in Berks County
Family Income Brackets in Berks County
According to the Berks County family income data, there are 24,309 families falling into the $100,000 to $149,999 income range, which is the most common income bracket and makes up 22.6% of all families. Conversely, the $10,000 to $14,999 income bracket is the least frequent group with only 1,613 families (1.5%) belonging to this category.
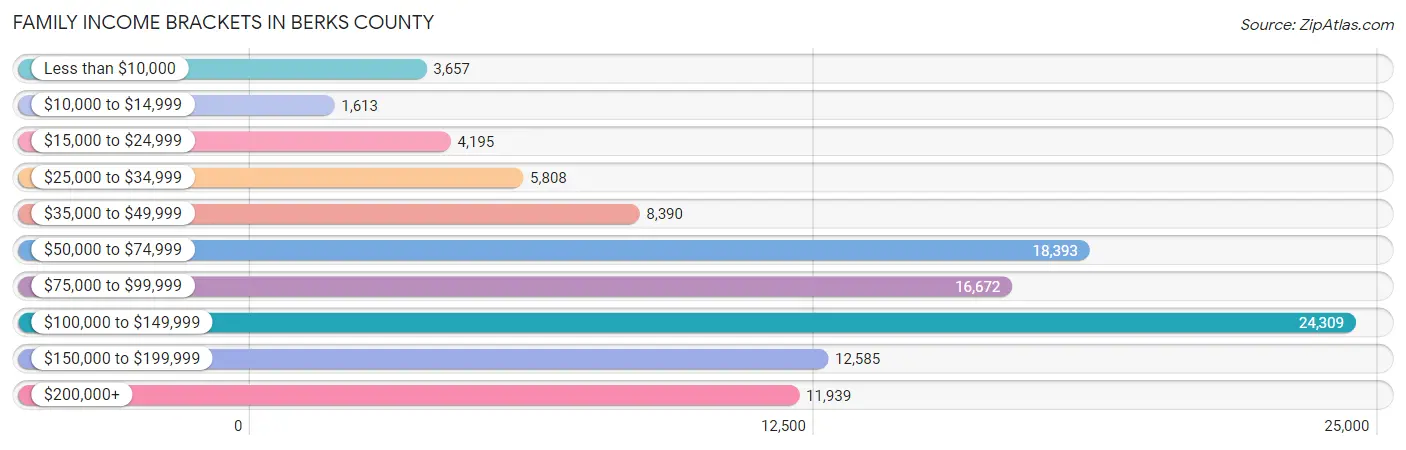
| Income Bracket | # Families | % Families |
| Less than $10,000 | 3,657 | 3.4% |
| $10,000 to $14,999 | 1,613 | 1.5% |
| $15,000 to $24,999 | 4,195 | 3.9% |
| $25,000 to $34,999 | 5,808 | 5.4% |
| $35,000 to $49,999 | 8,390 | 7.8% |
| $50,000 to $74,999 | 18,393 | 17.1% |
| $75,000 to $99,999 | 16,672 | 15.5% |
| $100,000 to $149,999 | 24,309 | 22.6% |
| $150,000 to $199,999 | 12,585 | 11.7% |
| $200,000+ | 11,939 | 11.1% |
Family Income by Famaliy Size in Berks County
4-person families (18,779 | 17.5%) account for the highest median family income in Berks County with $111,603 per family, while 2-person families (50,669 | 47.1%) have the highest median income of $40,229 per family member.
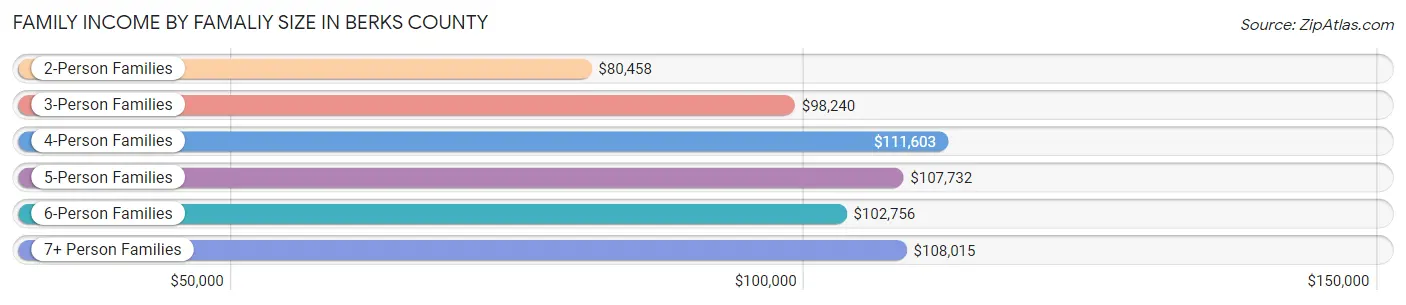
| Income Bracket | # Families | Median Income |
| 2-Person Families | 50,669 (47.1%) | $80,458 |
| 3-Person Families | 24,483 (22.8%) | $98,240 |
| 4-Person Families | 18,779 (17.5%) | $111,603 |
| 5-Person Families | 9,018 (8.4%) | $107,732 |
| 6-Person Families | 2,916 (2.7%) | $102,756 |
| 7+ Person Families | 1,696 (1.6%) | $108,015 |
| Total | 107,561 (100.0%) | $92,726 |
Family Income by Number of Earners in Berks County
The median family income in Berks County is $92,726, with families comprising 3+ earners (15,880) having the highest median family income of $146,167, while families with no earners (15,327) have the lowest median family income of $50,326, accounting for 14.8% and 14.2% of families, respectively.
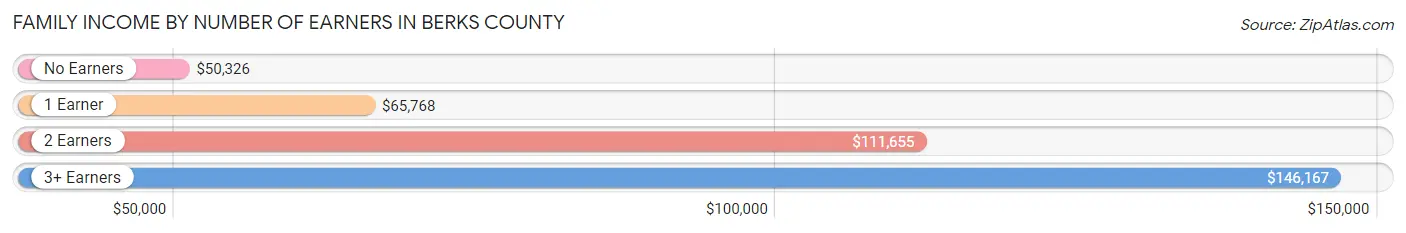
| Number of Earners | # Families | Median Income |
| No Earners | 15,327 (14.2%) | $50,326 |
| 1 Earner | 31,172 (29.0%) | $65,768 |
| 2 Earners | 45,182 (42.0%) | $111,655 |
| 3+ Earners | 15,880 (14.8%) | $146,167 |
| Total | 107,561 (100.0%) | $92,726 |
Household Income in Berks County
Household Income Brackets in Berks County
With 29,334 households falling in the category, the $100,000 to $149,999 income range is the most frequent in Berks County, accounting for 18.2% of all households. In contrast, only 5,641 households (3.5%) fall into the $10,000 to $14,999 income bracket, making it the least populous group.
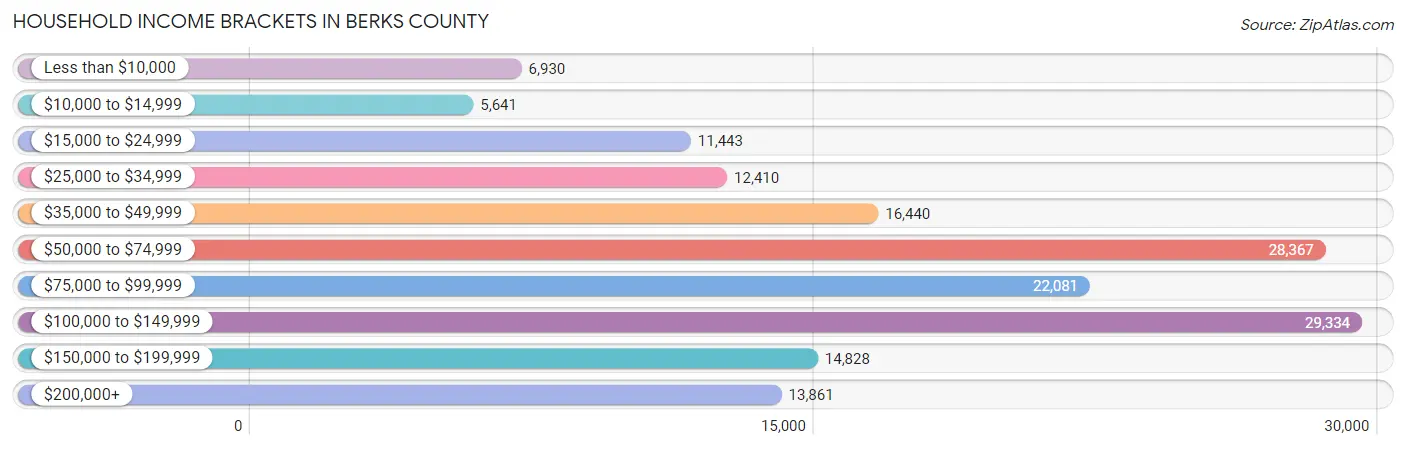
| Income Bracket | # Households | % Households |
| Less than $10,000 | 6,930 | 4.3% |
| $10,000 to $14,999 | 5,641 | 3.5% |
| $15,000 to $24,999 | 11,443 | 7.1% |
| $25,000 to $34,999 | 12,410 | 7.7% |
| $35,000 to $49,999 | 16,440 | 10.2% |
| $50,000 to $74,999 | 28,367 | 17.6% |
| $75,000 to $99,999 | 22,081 | 13.7% |
| $100,000 to $149,999 | 29,334 | 18.2% |
| $150,000 to $199,999 | 14,828 | 9.2% |
| $200,000+ | 13,861 | 8.6% |
Household Income by Householder Age in Berks County
The median household income in Berks County is $74,617, with the highest median household income of $94,145 found in the 45 to 64 years age bracket for the primary householder. A total of 63,684 households (39.5%) fall into this category. Meanwhile, the 15 to 24 years age bracket for the primary householder has the lowest median household income of $39,871, with 4,252 households (2.6%) in this group.
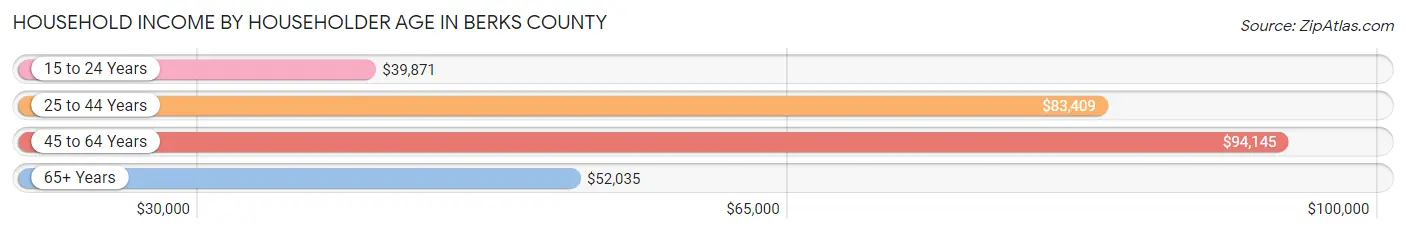
| Income Bracket | # Households | Median Income |
| 15 to 24 Years | 4,252 (2.6%) | $39,871 |
| 25 to 44 Years | 47,628 (29.5%) | $83,409 |
| 45 to 64 Years | 63,684 (39.5%) | $94,145 |
| 65+ Years | 45,610 (28.3%) | $52,035 |
| Total | 161,174 (100.0%) | $74,617 |
Poverty in Berks County
Income Below Poverty by Sex and Age in Berks County
With 11.0% poverty level for males and 12.6% for females among the residents of Berks County, under 5 year old males and under 5 year old females are the most vulnerable to poverty, with 2,570 males (21.6%) and 2,274 females (20.3%) in their respective age groups living below the poverty level.
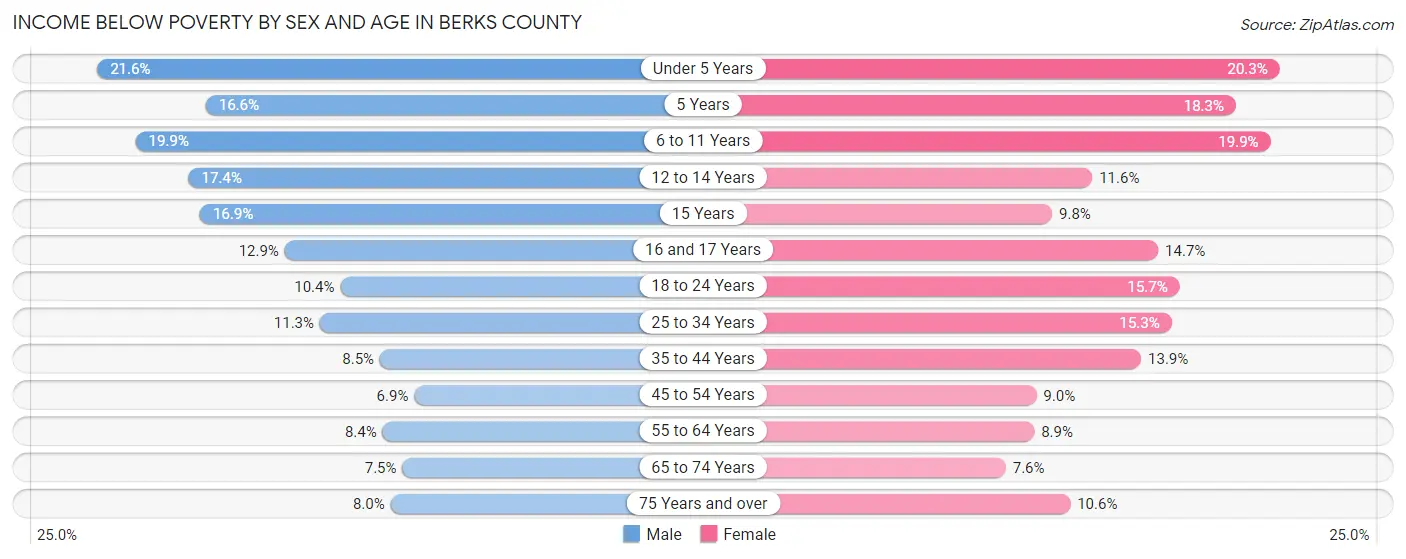
| Age Bracket | Male | Female |
| Under 5 Years | 2,570 (21.6%) | 2,274 (20.3%) |
| 5 Years | 443 (16.6%) | 511 (18.3%) |
| 6 to 11 Years | 3,113 (19.9%) | 2,818 (19.9%) |
| 12 to 14 Years | 1,495 (17.4%) | 964 (11.6%) |
| 15 Years | 540 (16.9%) | 260 (9.8%) |
| 16 and 17 Years | 702 (12.9%) | 840 (14.7%) |
| 18 to 24 Years | 1,849 (10.3%) | 2,629 (15.7%) |
| 25 to 34 Years | 3,033 (11.3%) | 3,939 (15.3%) |
| 35 to 44 Years | 2,143 (8.5%) | 3,502 (13.9%) |
| 45 to 54 Years | 1,865 (6.9%) | 2,439 (9.0%) |
| 55 to 64 Years | 2,453 (8.4%) | 2,612 (8.9%) |
| 65 to 74 Years | 1,535 (7.5%) | 1,680 (7.6%) |
| 75 Years and over | 997 (8.0%) | 1,909 (10.6%) |
| Total | 22,738 (11.0%) | 26,377 (12.6%) |
Income Above Poverty by Sex and Age in Berks County
According to the poverty statistics in Berks County, males aged 45 to 54 years and females aged 65 to 74 years are the age groups that are most secure financially, with 93.1% of males and 92.4% of females in these age groups living above the poverty line.
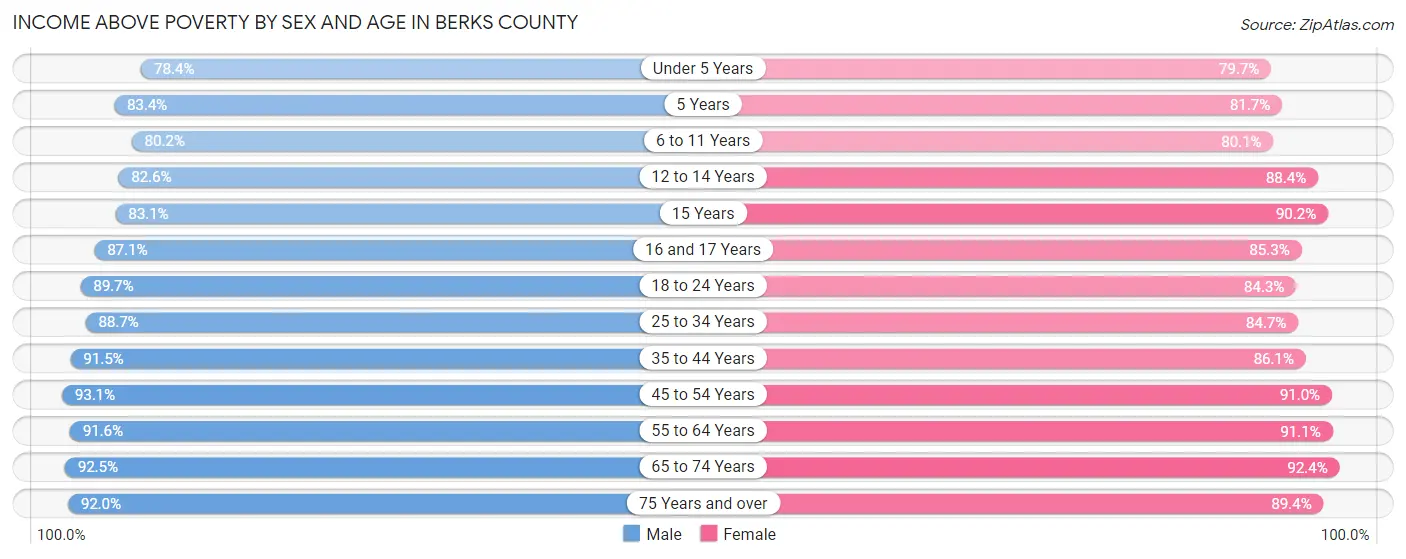
| Age Bracket | Male | Female |
| Under 5 Years | 9,313 (78.4%) | 8,925 (79.7%) |
| 5 Years | 2,228 (83.4%) | 2,284 (81.7%) |
| 6 to 11 Years | 12,568 (80.1%) | 11,353 (80.1%) |
| 12 to 14 Years | 7,104 (82.6%) | 7,330 (88.4%) |
| 15 Years | 2,663 (83.1%) | 2,404 (90.2%) |
| 16 and 17 Years | 4,727 (87.1%) | 4,884 (85.3%) |
| 18 to 24 Years | 16,019 (89.6%) | 14,152 (84.3%) |
| 25 to 34 Years | 23,807 (88.7%) | 21,807 (84.7%) |
| 35 to 44 Years | 23,037 (91.5%) | 21,713 (86.1%) |
| 45 to 54 Years | 25,084 (93.1%) | 24,582 (91.0%) |
| 55 to 64 Years | 26,800 (91.6%) | 26,646 (91.1%) |
| 65 to 74 Years | 19,019 (92.5%) | 20,392 (92.4%) |
| 75 Years and over | 11,441 (92.0%) | 16,103 (89.4%) |
| Total | 183,810 (89.0%) | 182,575 (87.4%) |
Income Below Poverty Among Married-Couple Families in Berks County
The poverty statistics for married-couple families in Berks County show that 3.6% or 2,833 of the total 78,179 families live below the poverty line. Families with 3 or 4 children have the highest poverty rate of 7.3%, comprising of 402 families. On the other hand, families with no children have the lowest poverty rate of 2.9%, which includes 1,433 families.
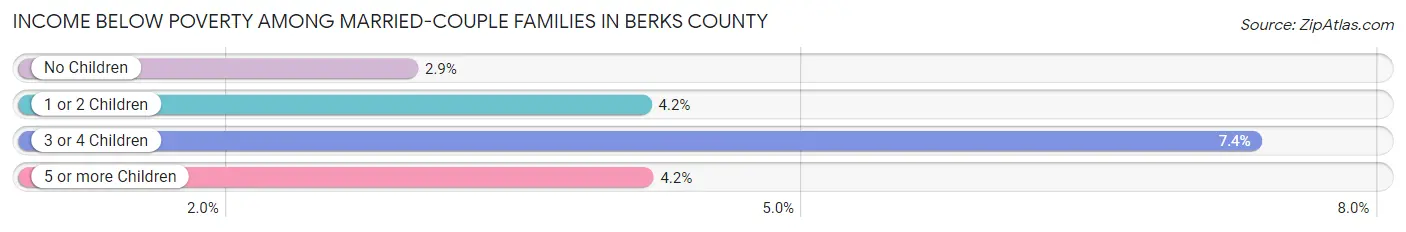
| Children | Above Poverty | Below Poverty |
| No Children | 47,291 (97.1%) | 1,433 (2.9%) |
| 1 or 2 Children | 22,439 (95.8%) | 974 (4.2%) |
| 3 or 4 Children | 5,065 (92.6%) | 402 (7.3%) |
| 5 or more Children | 551 (95.8%) | 24 (4.2%) |
| Total | 75,346 (96.4%) | 2,833 (3.6%) |
Income Below Poverty Among Single-Parent Households in Berks County
According to the poverty data in Berks County, 12.0% or 1,034 single-father households and 25.4% or 5,263 single-mother households are living below the poverty line. Among single-father households, those with 5 or more children have the highest poverty rate, with 26 households (72.2%) experiencing poverty. Likewise, among single-mother households, those with 5 or more children have the highest poverty rate, with 160 households (55.0%) falling below the poverty line.
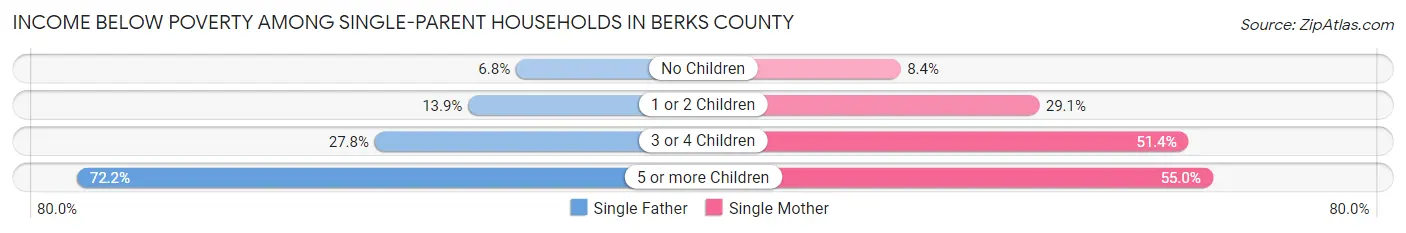
| Children | Single Father | Single Mother |
| No Children | 287 (6.8%) | 565 (8.4%) |
| 1 or 2 Children | 489 (13.9%) | 3,306 (29.1%) |
| 3 or 4 Children | 232 (27.8%) | 1,232 (51.4%) |
| 5 or more Children | 26 (72.2%) | 160 (55.0%) |
| Total | 1,034 (12.0%) | 5,263 (25.4%) |
Income Below Poverty Among Married-Couple vs Single-Parent Households in Berks County
The poverty data for Berks County shows that 2,833 of the married-couple family households (3.6%) and 6,297 of the single-parent households (21.4%) are living below the poverty level. Within the married-couple family households, those with 3 or 4 children have the highest poverty rate, with 402 households (7.3%) falling below the poverty line. Among the single-parent households, those with 5 or more children have the highest poverty rate, with 186 household (56.9%) living below poverty.
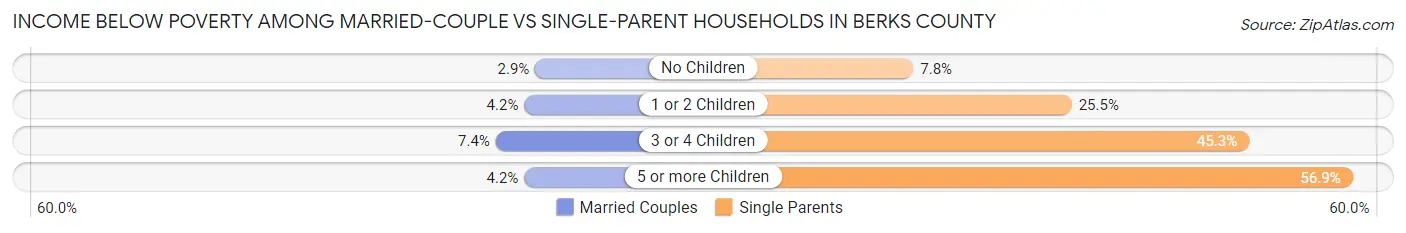
| Children | Married-Couple Families | Single-Parent Households |
| No Children | 1,433 (2.9%) | 852 (7.8%) |
| 1 or 2 Children | 974 (4.2%) | 3,795 (25.5%) |
| 3 or 4 Children | 402 (7.3%) | 1,464 (45.3%) |
| 5 or more Children | 24 (4.2%) | 186 (56.9%) |
| Total | 2,833 (3.6%) | 6,297 (21.4%) |
Race in Berks County
The most populous races in Berks County are White / Caucasian (322,910 | 75.4%), Hispanic or Latino (99,460 | 23.2%), and Two or more Races (38,567 | 9.0%).
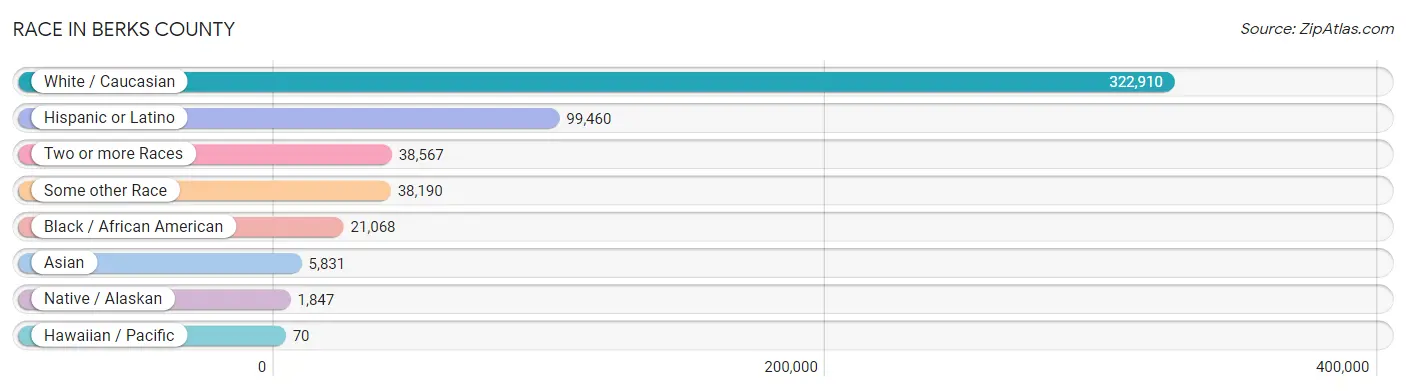
| Race | # Population | % Population |
| Asian | 5,831 | 1.4% |
| Black / African American | 21,068 | 4.9% |
| Hawaiian / Pacific | 70 | 0.0% |
| Hispanic or Latino | 99,460 | 23.2% |
| Native / Alaskan | 1,847 | 0.4% |
| White / Caucasian | 322,910 | 75.4% |
| Two or more Races | 38,567 | 9.0% |
| Some other Race | 38,190 | 8.9% |
| Total | 428,483 | 100.0% |
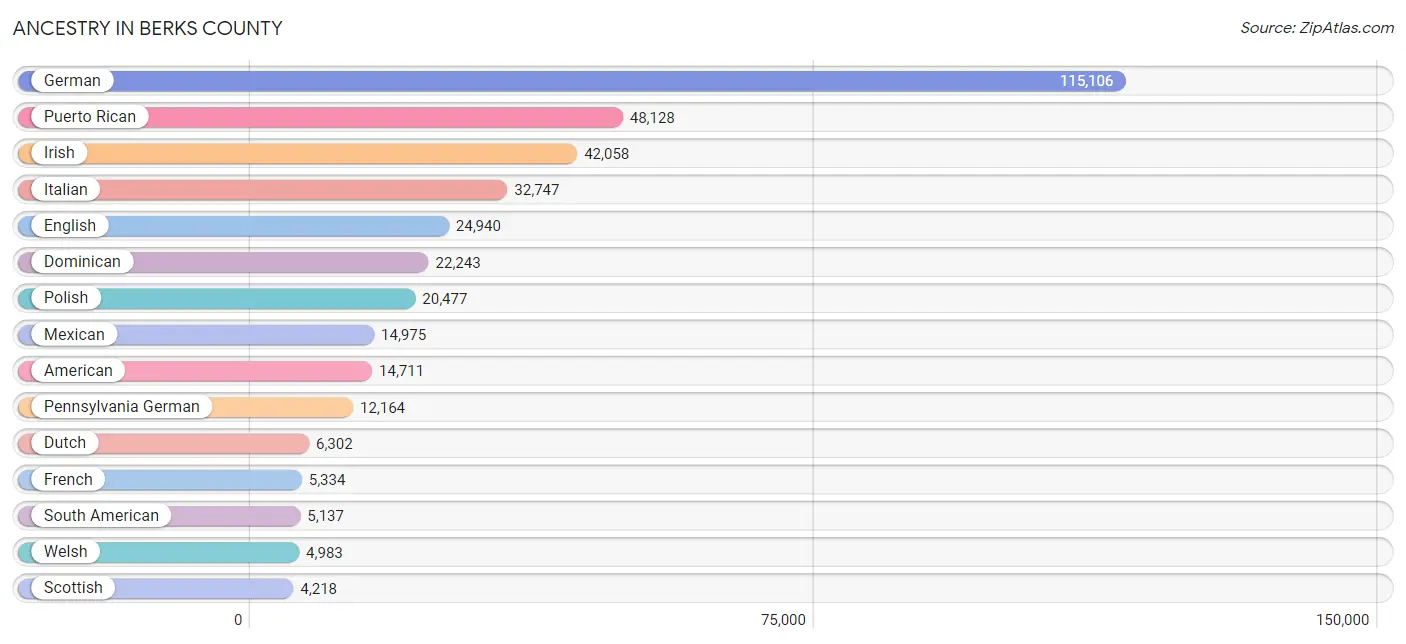
Ancestry in Berks County
The most populous ancestries reported in Berks County are German (115,106 | 26.9%), Puerto Rican (48,128 | 11.2%), Irish (42,058 | 9.8%), Italian (32,747 | 7.6%), and English (24,940 | 5.8%), together accounting for 61.4% of all Berks County residents.
| Ancestry | # Population | % Population |
| Afghan | 141 | 0.0% |
| African | 1,038 | 0.2% |
| Albanian | 15 | 0.0% |
| American | 14,711 | 3.4% |
| Apache | 56 | 0.0% |
| Arab | 823 | 0.2% |
| Argentinean | 151 | 0.0% |
| Armenian | 53 | 0.0% |
| Assyrian / Chaldean / Syriac | 11 | 0.0% |
| Australian | 35 | 0.0% |
| Austrian | 944 | 0.2% |
| Bahamian | 12 | 0.0% |
| Barbadian | 119 | 0.0% |
| Belgian | 219 | 0.1% |
| Bhutanese | 457 | 0.1% |
| Blackfeet | 149 | 0.0% |
| Bolivian | 72 | 0.0% |
| Brazilian | 304 | 0.1% |
| British | 1,263 | 0.3% |
| British West Indian | 24 | 0.0% |
| Bulgarian | 200 | 0.1% |
| Burmese | 964 | 0.2% |
| Canadian | 480 | 0.1% |
| Carpatho Rusyn | 12 | 0.0% |
| Celtic | 50 | 0.0% |
| Central American | 3,889 | 0.9% |
| Central American Indian | 1,638 | 0.4% |
| Cherokee | 238 | 0.1% |
| Chilean | 54 | 0.0% |
| Chinese | 24 | 0.0% |
| Chippewa | 4 | 0.0% |
| Choctaw | 63 | 0.0% |
| Colombian | 2,305 | 0.5% |
| Comanche | 46 | 0.0% |
| Costa Rican | 47 | 0.0% |
| Cree | 35 | 0.0% |
| Creek | 9 | 0.0% |
| Croatian | 128 | 0.0% |
| Cuban | 1,188 | 0.3% |
| Czech | 791 | 0.2% |
| Czechoslovakian | 255 | 0.1% |
| Danish | 473 | 0.1% |
| Delaware | 55 | 0.0% |
| Dominican | 22,243 | 5.2% |
| Dutch | 6,302 | 1.5% |
| Dutch West Indian | 17 | 0.0% |
| Eastern European | 1,109 | 0.3% |
| Ecuadorian | 855 | 0.2% |
| Egyptian | 154 | 0.0% |
| English | 24,940 | 5.8% |
| Ethiopian | 207 | 0.1% |
| European | 3,558 | 0.8% |
| Filipino | 15 | 0.0% |
| Finnish | 155 | 0.0% |
| French | 5,334 | 1.2% |
| French Canadian | 727 | 0.2% |
| German | 115,106 | 26.9% |
| German Russian | 46 | 0.0% |
| Ghanaian | 140 | 0.0% |
| Greek | 1,875 | 0.4% |
| Guamanian / Chamorro | 28 | 0.0% |
| Guatemalan | 1,152 | 0.3% |
| Guyanese | 231 | 0.1% |
| Haitian | 867 | 0.2% |
| Honduran | 705 | 0.2% |
| Hopi | 15 | 0.0% |
| Hungarian | 2,487 | 0.6% |
| Indian (Asian) | 1,117 | 0.3% |
| Indonesian | 12 | 0.0% |
| Iranian | 54 | 0.0% |
| Irish | 42,058 | 9.8% |
| Iroquois | 62 | 0.0% |
| Israeli | 16 | 0.0% |
| Italian | 32,747 | 7.6% |
| Jamaican | 1,000 | 0.2% |
| Japanese | 89 | 0.0% |
| Jordanian | 10 | 0.0% |
| Kenyan | 1 | 0.0% |
| Korean | 1,070 | 0.3% |
| Latvian | 90 | 0.0% |
| Lebanese | 375 | 0.1% |
| Liberian | 30 | 0.0% |
| Lithuanian | 1,587 | 0.4% |
| Lumbee | 11 | 0.0% |
| Macedonian | 11 | 0.0% |
| Malaysian | 106 | 0.0% |
| Mexican | 14,975 | 3.5% |
| Mexican American Indian | 876 | 0.2% |
| Moroccan | 46 | 0.0% |
| Native Hawaiian | 107 | 0.0% |
| Navajo | 5 | 0.0% |
| New Zealander | 16 | 0.0% |
| Nicaraguan | 316 | 0.1% |
| Nigerian | 492 | 0.1% |
| Northern European | 239 | 0.1% |
| Norwegian | 1,186 | 0.3% |
| Pakistani | 97 | 0.0% |
| Palestinian | 20 | 0.0% |
| Panamanian | 186 | 0.0% |
| Paraguayan | 12 | 0.0% |
| Pennsylvania German | 12,164 | 2.8% |
| Peruvian | 1,231 | 0.3% |
| Polish | 20,477 | 4.8% |
| Portuguese | 403 | 0.1% |
| Potawatomi | 27 | 0.0% |
| Puerto Rican | 48,128 | 11.2% |
| Romanian | 1,377 | 0.3% |
| Russian | 2,433 | 0.6% |
| Salvadoran | 1,478 | 0.3% |
| Scandinavian | 434 | 0.1% |
| Scotch-Irish | 2,104 | 0.5% |
| Scottish | 4,218 | 1.0% |
| Serbian | 63 | 0.0% |
| Sierra Leonean | 44 | 0.0% |
| Sioux | 42 | 0.0% |
| Slavic | 128 | 0.0% |
| Slovak | 2,420 | 0.6% |
| Slovene | 213 | 0.1% |
| Somali | 29 | 0.0% |
| South African | 40 | 0.0% |
| South American | 5,137 | 1.2% |
| South American Indian | 25 | 0.0% |
| Spaniard | 1,352 | 0.3% |
| Spanish | 353 | 0.1% |
| Sri Lankan | 1,257 | 0.3% |
| Subsaharan African | 2,057 | 0.5% |
| Swedish | 1,983 | 0.5% |
| Swiss | 3,197 | 0.7% |
| Syrian | 121 | 0.0% |
| Thai | 2,185 | 0.5% |
| Tlingit-Haida | 17 | 0.0% |
| Trinidadian and Tobagonian | 400 | 0.1% |
| Turkish | 192 | 0.0% |
| U.S. Virgin Islander | 47 | 0.0% |
| Ukrainian | 2,482 | 0.6% |
| Uruguayan | 7 | 0.0% |
| Ute | 3 | 0.0% |
| Venezuelan | 450 | 0.1% |
| Vietnamese | 22 | 0.0% |
| Welsh | 4,983 | 1.2% |
| West Indian | 111 | 0.0% |
| Yugoslavian | 286 | 0.1% | View All 142 Rows |
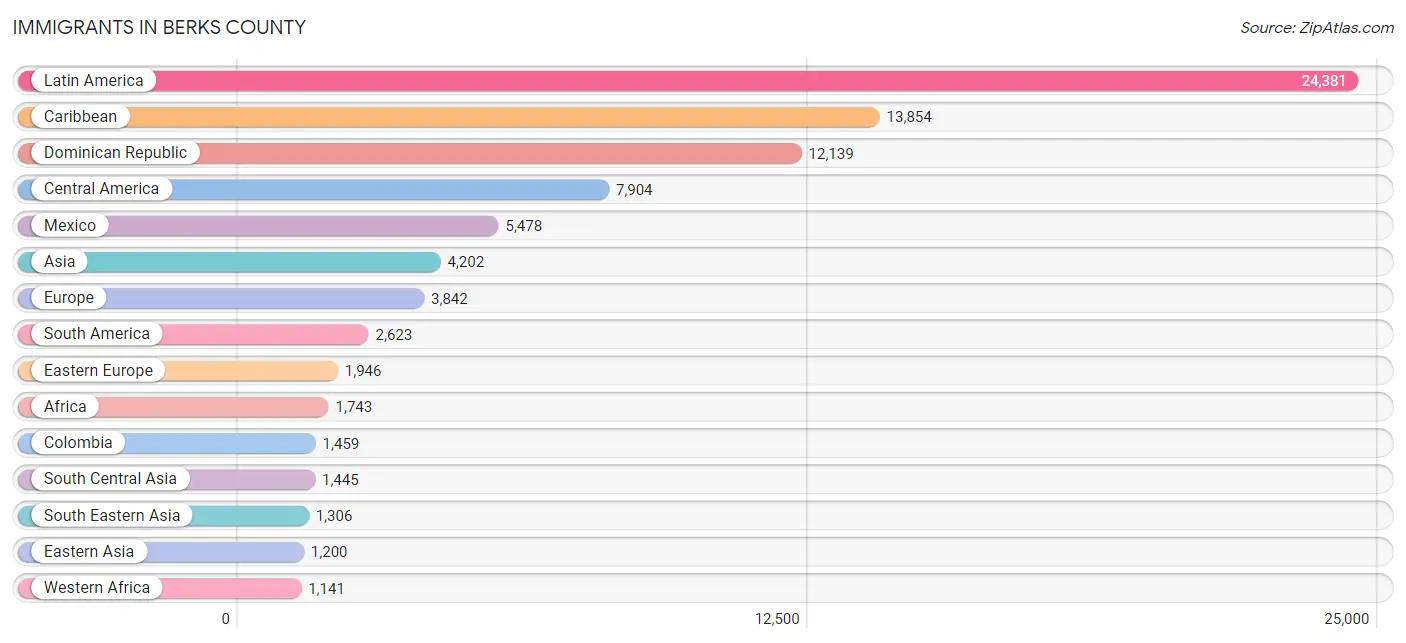
Immigrants in Berks County
The most numerous immigrant groups reported in Berks County came from Latin America (24,381 | 5.7%), Caribbean (13,854 | 3.2%), Dominican Republic (12,139 | 2.8%), Central America (7,904 | 1.8%), and Mexico (5,478 | 1.3%), together accounting for 14.9% of all Berks County residents.
| Immigration Origin | # Population | % Population |
| Afghanistan | 83 | 0.0% |
| Africa | 1,743 | 0.4% |
| Argentina | 148 | 0.0% |
| Asia | 4,202 | 1.0% |
| Australia | 10 | 0.0% |
| Austria | 13 | 0.0% |
| Bangladesh | 8 | 0.0% |
| Barbados | 71 | 0.0% |
| Belarus | 46 | 0.0% |
| Belgium | 44 | 0.0% |
| Bolivia | 16 | 0.0% |
| Bosnia and Herzegovina | 33 | 0.0% |
| Brazil | 102 | 0.0% |
| Bulgaria | 11 | 0.0% |
| Cambodia | 27 | 0.0% |
| Canada | 598 | 0.1% |
| Caribbean | 13,854 | 3.2% |
| Central America | 7,904 | 1.8% |
| Chile | 46 | 0.0% |
| China | 616 | 0.1% |
| Colombia | 1,459 | 0.3% |
| Costa Rica | 20 | 0.0% |
| Cuba | 145 | 0.0% |
| Denmark | 31 | 0.0% |
| Dominica | 366 | 0.1% |
| Dominican Republic | 12,139 | 2.8% |
| Eastern Africa | 246 | 0.1% |
| Eastern Asia | 1,200 | 0.3% |
| Eastern Europe | 1,946 | 0.4% |
| Ecuador | 414 | 0.1% |
| Egypt | 71 | 0.0% |
| El Salvador | 642 | 0.2% |
| England | 153 | 0.0% |
| Ethiopia | 144 | 0.0% |
| Europe | 3,842 | 0.9% |
| France | 113 | 0.0% |
| Germany | 605 | 0.1% |
| Ghana | 160 | 0.0% |
| Greece | 58 | 0.0% |
| Grenada | 88 | 0.0% |
| Guatemala | 998 | 0.2% |
| Guyana | 141 | 0.0% |
| Haiti | 452 | 0.1% |
| Honduras | 597 | 0.1% |
| Hong Kong | 9 | 0.0% |
| Hungary | 148 | 0.0% |
| India | 1,061 | 0.3% |
| Indonesia | 11 | 0.0% |
| Iran | 77 | 0.0% |
| Iraq | 14 | 0.0% |
| Ireland | 105 | 0.0% |
| Israel | 15 | 0.0% |
| Italy | 308 | 0.1% |
| Jamaica | 423 | 0.1% |
| Japan | 124 | 0.0% |
| Jordan | 10 | 0.0% |
| Kazakhstan | 8 | 0.0% |
| Kenya | 12 | 0.0% |
| Korea | 460 | 0.1% |
| Kuwait | 42 | 0.0% |
| Latin America | 24,381 | 5.7% |
| Lebanon | 120 | 0.0% |
| Lithuania | 15 | 0.0% |
| Mexico | 5,478 | 1.3% |
| Morocco | 35 | 0.0% |
| Nepal | 23 | 0.0% |
| Netherlands | 24 | 0.0% |
| Nicaragua | 127 | 0.0% |
| Nigeria | 310 | 0.1% |
| Northern Africa | 237 | 0.1% |
| Northern Europe | 604 | 0.1% |
| Norway | 11 | 0.0% |
| Oceania | 26 | 0.0% |
| Pakistan | 74 | 0.0% |
| Panama | 42 | 0.0% |
| Peru | 160 | 0.0% |
| Philippines | 450 | 0.1% |
| Poland | 406 | 0.1% |
| Portugal | 3 | 0.0% |
| Romania | 925 | 0.2% |
| Russia | 207 | 0.1% |
| Saudi Arabia | 4 | 0.0% |
| Scotland | 83 | 0.0% |
| Sierra Leone | 405 | 0.1% |
| Somalia | 13 | 0.0% |
| South Africa | 43 | 0.0% |
| South America | 2,623 | 0.6% |
| South Central Asia | 1,445 | 0.3% |
| South Eastern Asia | 1,306 | 0.3% |
| Southern Europe | 460 | 0.1% |
| Spain | 91 | 0.0% |
| Sri Lanka | 20 | 0.0% |
| Sweden | 15 | 0.0% |
| Switzerland | 33 | 0.0% |
| Syria | 15 | 0.0% |
| Taiwan | 12 | 0.0% |
| Thailand | 88 | 0.0% |
| Trinidad and Tobago | 161 | 0.0% |
| Turkey | 23 | 0.0% |
| Uganda | 40 | 0.0% |
| Ukraine | 117 | 0.0% |
| Venezuela | 137 | 0.0% |
| Vietnam | 717 | 0.2% |
| Western Africa | 1,141 | 0.3% |
| Western Asia | 251 | 0.1% |
| Western Europe | 832 | 0.2% | View All 106 Rows |
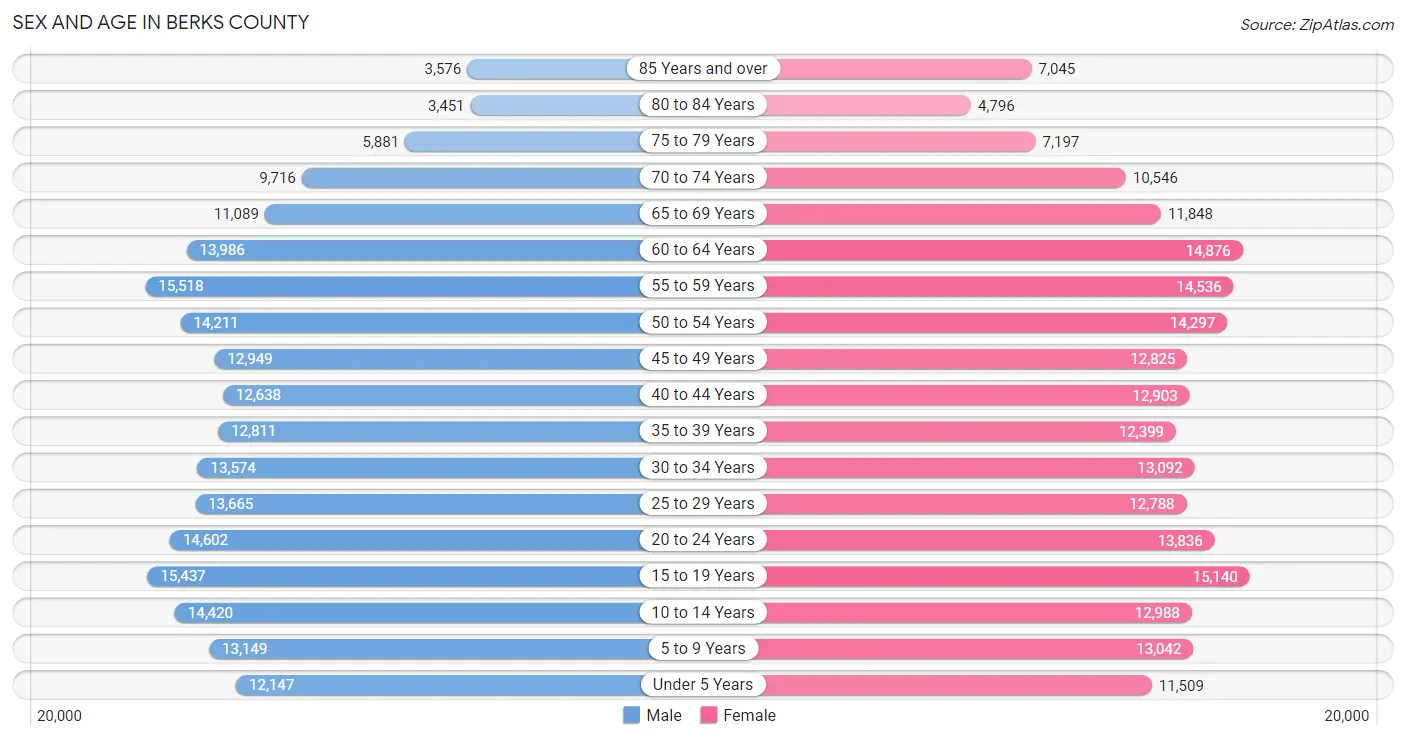
Sex and Age in Berks County
Sex and Age in Berks County
The most populous age groups in Berks County are 55 to 59 Years (15,518 | 7.3%) for men and 15 to 19 Years (15,140 | 7.0%) for women.
| Age Bracket | Male | Female |
| Under 5 Years | 12,147 (5.7%) | 11,509 (5.3%) |
| 5 to 9 Years | 13,149 (6.2%) | 13,042 (6.0%) |
| 10 to 14 Years | 14,420 (6.8%) | 12,988 (6.0%) |
| 15 to 19 Years | 15,437 (7.2%) | 15,140 (7.0%) |
| 20 to 24 Years | 14,602 (6.9%) | 13,836 (6.4%) |
| 25 to 29 Years | 13,665 (6.4%) | 12,788 (5.9%) |
| 30 to 34 Years | 13,574 (6.4%) | 13,092 (6.1%) |
| 35 to 39 Years | 12,811 (6.0%) | 12,399 (5.8%) |
| 40 to 44 Years | 12,638 (5.9%) | 12,903 (6.0%) |
| 45 to 49 Years | 12,949 (6.1%) | 12,825 (5.9%) |
| 50 to 54 Years | 14,211 (6.7%) | 14,297 (6.6%) |
| 55 to 59 Years | 15,518 (7.3%) | 14,536 (6.7%) |
| 60 to 64 Years | 13,986 (6.6%) | 14,876 (6.9%) |
| 65 to 69 Years | 11,089 (5.2%) | 11,848 (5.5%) |
| 70 to 74 Years | 9,716 (4.6%) | 10,546 (4.9%) |
| 75 to 79 Years | 5,881 (2.8%) | 7,197 (3.3%) |
| 80 to 84 Years | 3,451 (1.6%) | 4,796 (2.2%) |
| 85 Years and over | 3,576 (1.7%) | 7,045 (3.3%) |
| Total | 212,820 (100.0%) | 215,663 (100.0%) |
Families and Households in Berks County
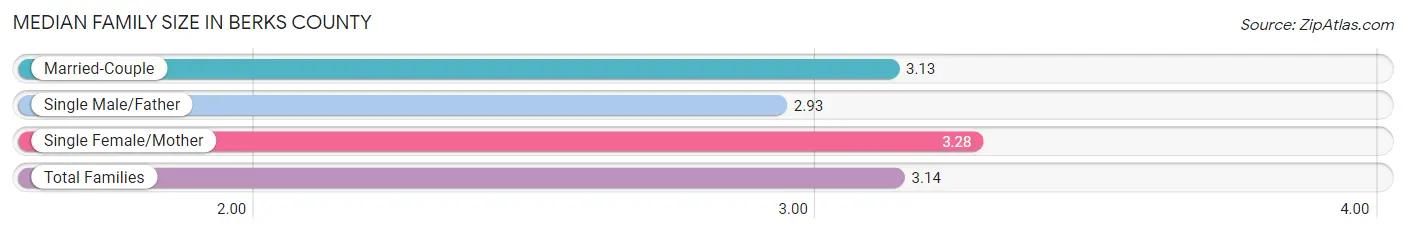
Median Family Size in Berks County
The median family size in Berks County is 3.14 persons per family, with single female/mother families (20,761 | 19.3%) accounting for the largest median family size of 3.28 persons per family. On the other hand, single male/father families (8,621 | 8.0%) represent the smallest median family size with 2.93 persons per family.
| Family Type | # Families | Family Size |
| Married-Couple | 78,179 (72.7%) | 3.13 |
| Single Male/Father | 8,621 (8.0%) | 2.93 |
| Single Female/Mother | 20,761 (19.3%) | 3.28 |
| Total Families | 107,561 (100.0%) | 3.14 |
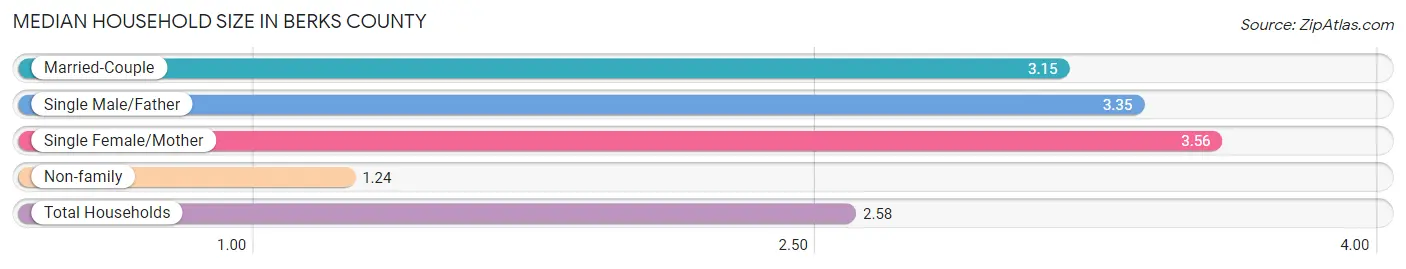
Median Household Size in Berks County
The median household size in Berks County is 2.58 persons per household, with single female/mother households (20,761 | 12.9%) accounting for the largest median household size of 3.56 persons per household. non-family households (53,613 | 33.3%) represent the smallest median household size with 1.24 persons per household.
| Household Type | # Households | Household Size |
| Married-Couple | 78,179 (48.5%) | 3.15 |
| Single Male/Father | 8,621 (5.3%) | 3.35 |
| Single Female/Mother | 20,761 (12.9%) | 3.56 |
| Non-family | 53,613 (33.3%) | 1.24 |
| Total Households | 161,174 (100.0%) | 2.58 |
Household Size by Marriage Status in Berks County
Out of a total of 161,174 households in Berks County, 107,561 (66.7%) are family households, while 53,613 (33.3%) are nonfamily households. The most numerous type of family households are 2-person households, comprising 46,711, and the most common type of nonfamily households are 1-person households, comprising 43,879.
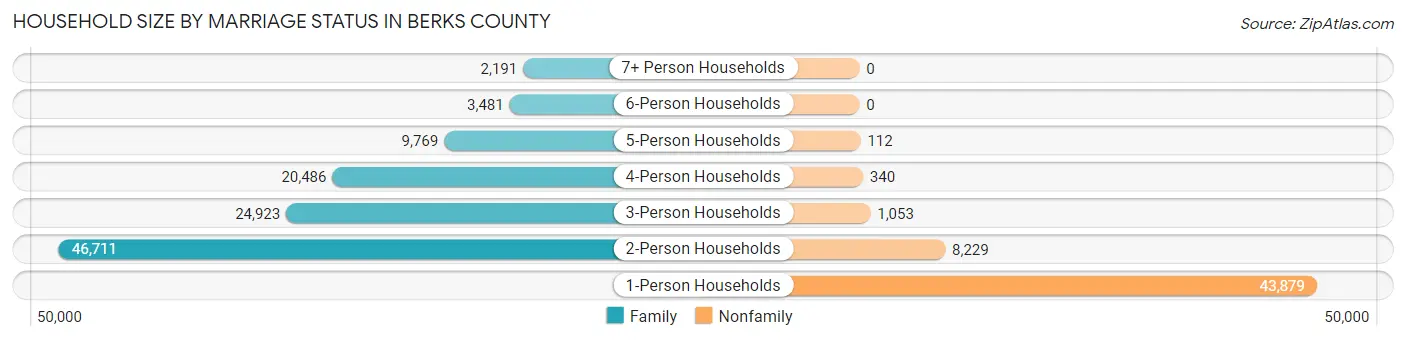
| Household Size | Family Households | Nonfamily Households |
| 1-Person Households | - | 43,879 (27.2%) |
| 2-Person Households | 46,711 (29.0%) | 8,229 (5.1%) |
| 3-Person Households | 24,923 (15.5%) | 1,053 (0.6%) |
| 4-Person Households | 20,486 (12.7%) | 340 (0.2%) |
| 5-Person Households | 9,769 (6.1%) | 112 (0.1%) |
| 6-Person Households | 3,481 (2.2%) | 0 (0.0%) |
| 7+ Person Households | 2,191 (1.4%) | 0 (0.0%) |
| Total | 107,561 (66.7%) | 53,613 (33.3%) |
Female Fertility in Berks County
Fertility by Age in Berks County
Average fertility rate in Berks County is 52.0 births per 1,000 women. Women in the age bracket of 20 to 34 years have the highest fertility rate with 93.0 births per 1,000 women. Women in the age bracket of 20 to 34 years acount for 74.4% of all women with births.
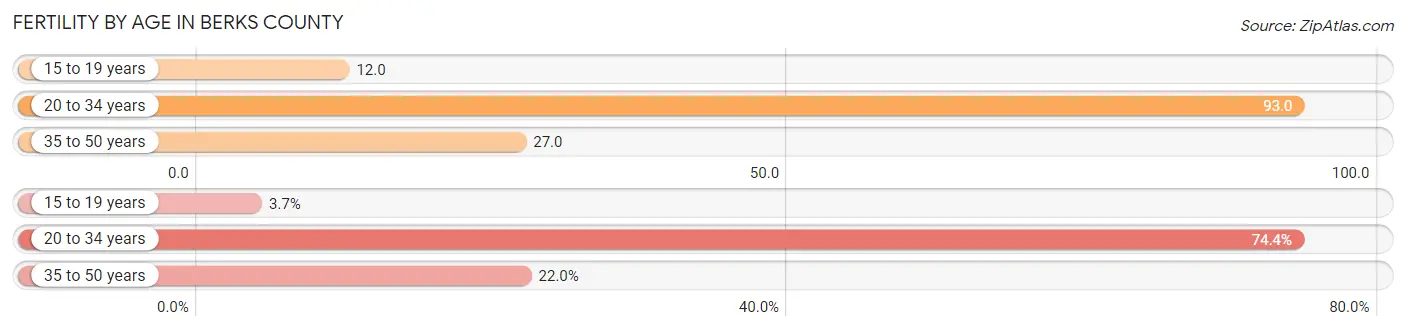
| Age Bracket | Women with Births | Births / 1,000 Women |
| 15 to 19 years | 182 (3.7%) | 12.0 |
| 20 to 34 years | 3,691 (74.4%) | 93.0 |
| 35 to 50 years | 1,090 (22.0%) | 27.0 |
| Total | 4,963 (100.0%) | 52.0 |
Fertility by Age by Marriage Status in Berks County
57.6% of women with births (4,963) in Berks County are married. The highest percentage of unmarried women with births falls into 15 to 19 years age bracket with 94.5% of them unmarried at the time of birth, while the lowest percentage of unmarried women with births belong to 35 to 50 years age bracket with 29.4% of them unmarried.
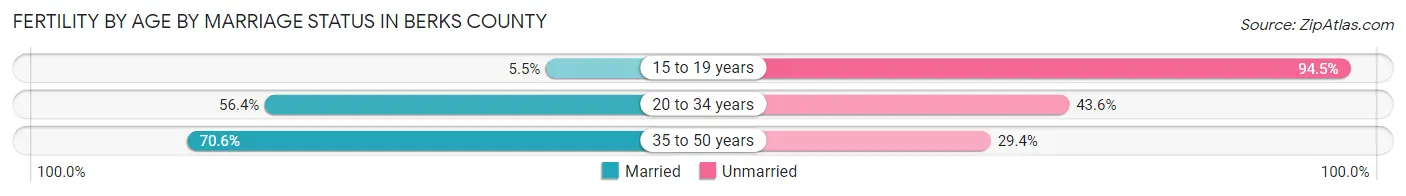
| Age Bracket | Married | Unmarried |
| 15 to 19 years | 10 (5.5%) | 172 (94.5%) |
| 20 to 34 years | 2,082 (56.4%) | 1,609 (43.6%) |
| 35 to 50 years | 770 (70.6%) | 320 (29.4%) |
| Total | 2,859 (57.6%) | 2,104 (42.4%) |
Fertility by Education in Berks County
Average fertility rate in Berks County is 52.0 births per 1,000 women. Women with the education attainment of graduate degree have the highest fertility rate of 70.0 births per 1,000 women, while women with the education attainment of bachelor's degree have the lowest fertility at 43.0 births per 1,000 women. Women with the education attainment of college or associate's degree represent 30.5% of all women with births.
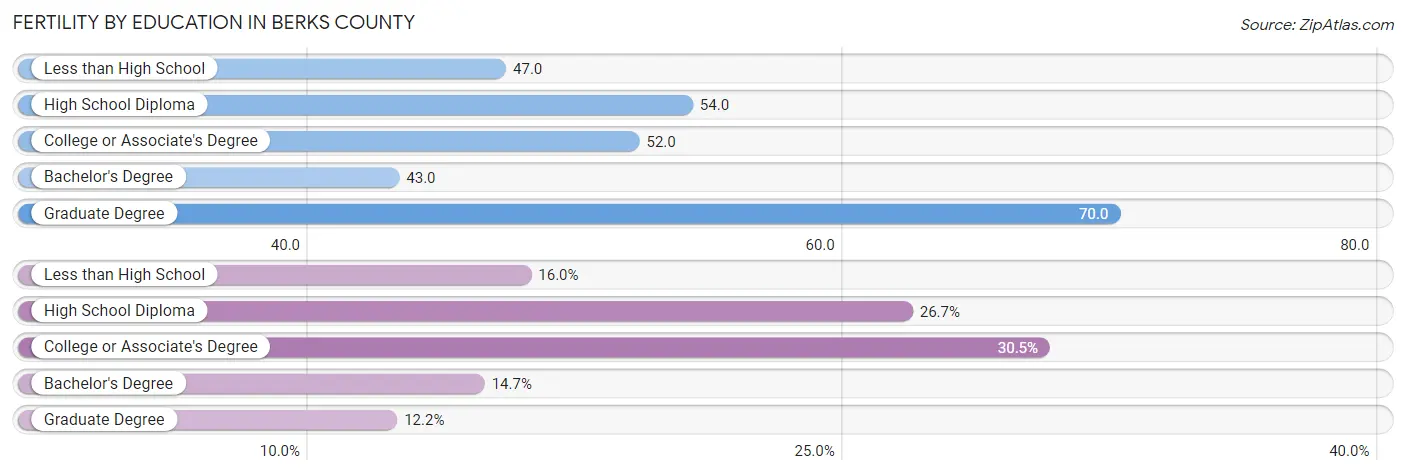
| Educational Attainment | Women with Births | Births / 1,000 Women |
| Less than High School | 792 (16.0%) | 47.0 |
| High School Diploma | 1,324 (26.7%) | 54.0 |
| College or Associate's Degree | 1,515 (30.5%) | 52.0 |
| Bachelor's Degree | 727 (14.6%) | 43.0 |
| Graduate Degree | 605 (12.2%) | 70.0 |
| Total | 4,963 (100.0%) | 52.0 |
Fertility by Education by Marriage Status in Berks County
42.4% of women with births in Berks County are unmarried. Women with the educational attainment of graduate degree are most likely to be married with 89.9% of them married at childbirth, while women with the educational attainment of less than high school are least likely to be married with 62.4% of them unmarried at childbirth.
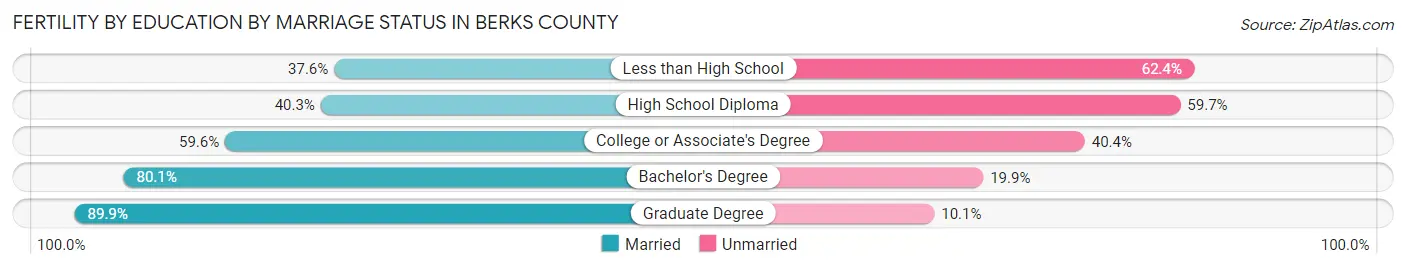
| Educational Attainment | Married | Unmarried |
| Less than High School | 298 (37.6%) | 494 (62.4%) |
| High School Diploma | 534 (40.3%) | 790 (59.7%) |
| College or Associate's Degree | 903 (59.6%) | 612 (40.4%) |
| Bachelor's Degree | 582 (80.1%) | 145 (19.9%) |
| Graduate Degree | 544 (89.9%) | 61 (10.1%) |
| Total | 2,859 (57.6%) | 2,104 (42.4%) |
Employment Characteristics in Berks County
Employment by Class of Employer in Berks County
Among the 206,685 employed individuals in Berks County, private company employees (151,195 | 73.2%), not-for-profit organizations (20,024 | 9.7%), and local government employees (11,812 | 5.7%) make up the most common classes of employment.
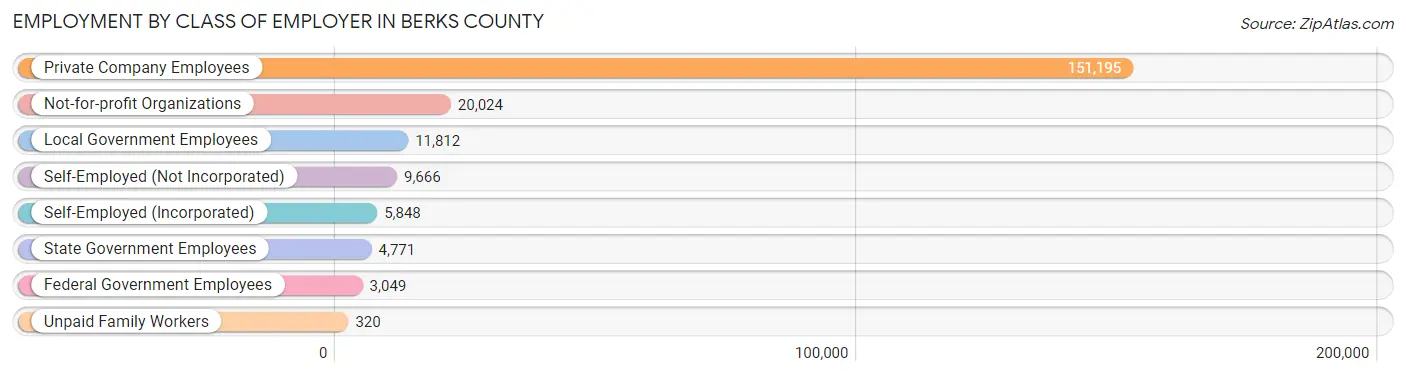
| Employer Class | # Employees | % Employees |
| Private Company Employees | 151,195 | 73.2% |
| Self-Employed (Incorporated) | 5,848 | 2.8% |
| Self-Employed (Not Incorporated) | 9,666 | 4.7% |
| Not-for-profit Organizations | 20,024 | 9.7% |
| Local Government Employees | 11,812 | 5.7% |
| State Government Employees | 4,771 | 2.3% |
| Federal Government Employees | 3,049 | 1.5% |
| Unpaid Family Workers | 320 | 0.2% |
| Total | 206,685 | 100.0% |
Employment Status by Age in Berks County
According to the labor force statistics for Berks County, out of the total population over 16 years of age (345,342), 64.8% or 223,782 individuals are in the labor force, with 5.4% or 12,084 of them unemployed. The age group with the highest labor force participation rate is 35 to 44 years, with 85.7% or 43,494 individuals in the labor force. Within the labor force, the 16 to 19 years age range has the highest percentage of unemployed individuals, with 12.0% or 1,410 of them being unemployed.
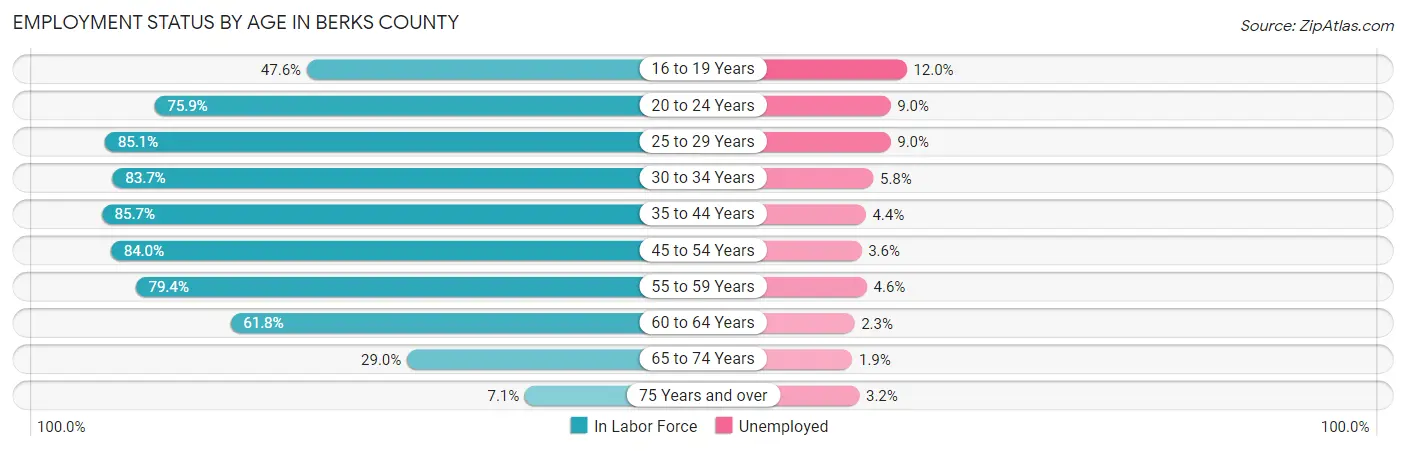
| Age Bracket | In Labor Force | Unemployed |
| 16 to 19 Years | 11,753 (47.6%) | 1,410 (12.0%) |
| 20 to 24 Years | 21,584 (75.9%) | 1,943 (9.0%) |
| 25 to 29 Years | 22,512 (85.1%) | 2,026 (9.0%) |
| 30 to 34 Years | 22,319 (83.7%) | 1,295 (5.8%) |
| 35 to 44 Years | 43,494 (85.7%) | 1,914 (4.4%) |
| 45 to 54 Years | 45,597 (84.0%) | 1,641 (3.6%) |
| 55 to 59 Years | 23,863 (79.4%) | 1,098 (4.6%) |
| 60 to 64 Years | 17,837 (61.8%) | 410 (2.3%) |
| 65 to 74 Years | 12,528 (29.0%) | 238 (1.9%) |
| 75 Years and over | 2,268 (7.1%) | 73 (3.2%) |
| Total | 223,782 (64.8%) | 12,084 (5.4%) |
Employment Status by Educational Attainment in Berks County
According to labor force statistics for Berks County, 80.9% of individuals (175,608) out of the total population between 25 and 64 years of age (217,068) are in the labor force, with 4.8% or 8,429 of them being unemployed. The group with the highest labor force participation rate are those with the educational attainment of bachelor's degree or higher, with 89.8% or 55,345 individuals in the labor force. Within the labor force, individuals with less than high school education have the highest percentage of unemployment, with 6.5% or 941 of them being unemployed.
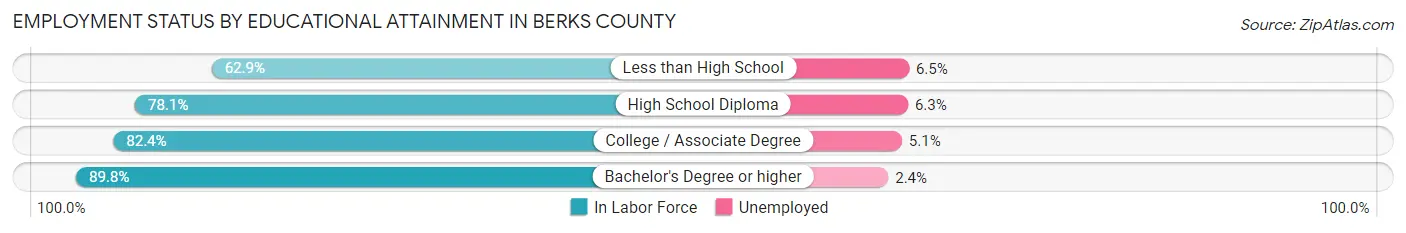
| Educational Attainment | In Labor Force | Unemployed |
| Less than High School | 14,476 (62.9%) | 1,496 (6.5%) |
| High School Diploma | 58,950 (78.1%) | 4,755 (6.3%) |
| College / Associate Degree | 46,920 (82.4%) | 2,904 (5.1%) |
| Bachelor's Degree or higher | 55,345 (89.8%) | 1,479 (2.4%) |
| Total | 175,608 (80.9%) | 10,419 (4.8%) |
Employment Occupations by Sex in Berks County
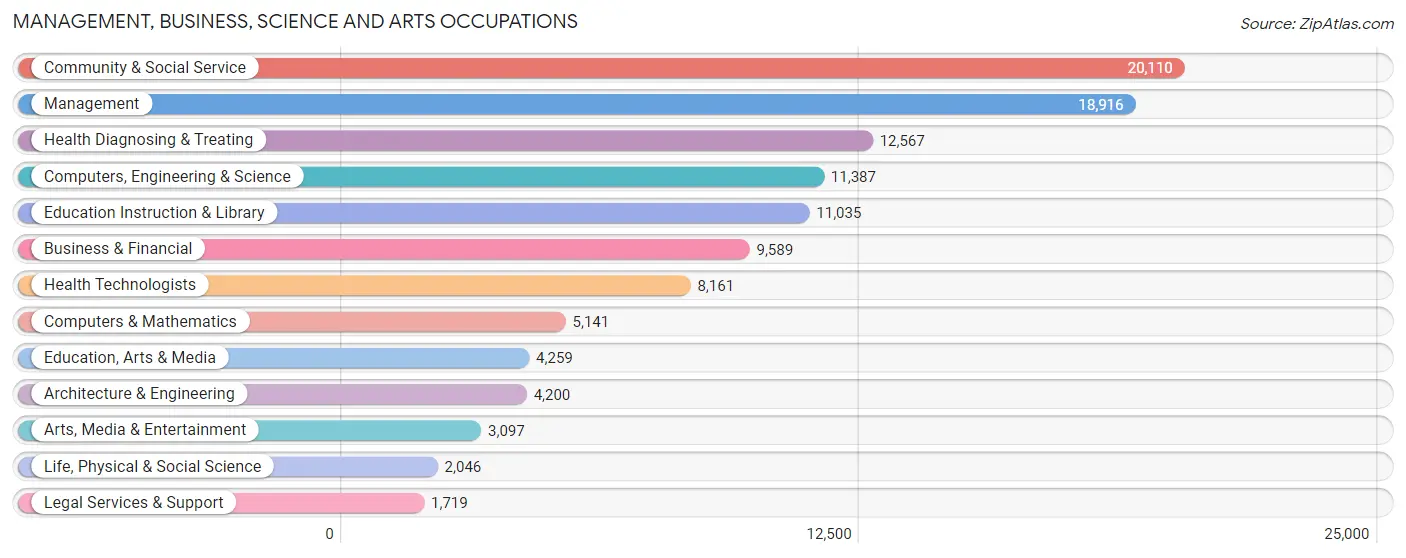
Management, Business, Science and Arts Occupations
The most common Management, Business, Science and Arts occupations in Berks County are Community & Social Service (20,110 | 9.5%), Management (18,916 | 8.9%), Health Diagnosing & Treating (12,567 | 5.9%), Computers, Engineering & Science (11,387 | 5.4%), and Education Instruction & Library (11,035 | 5.2%).
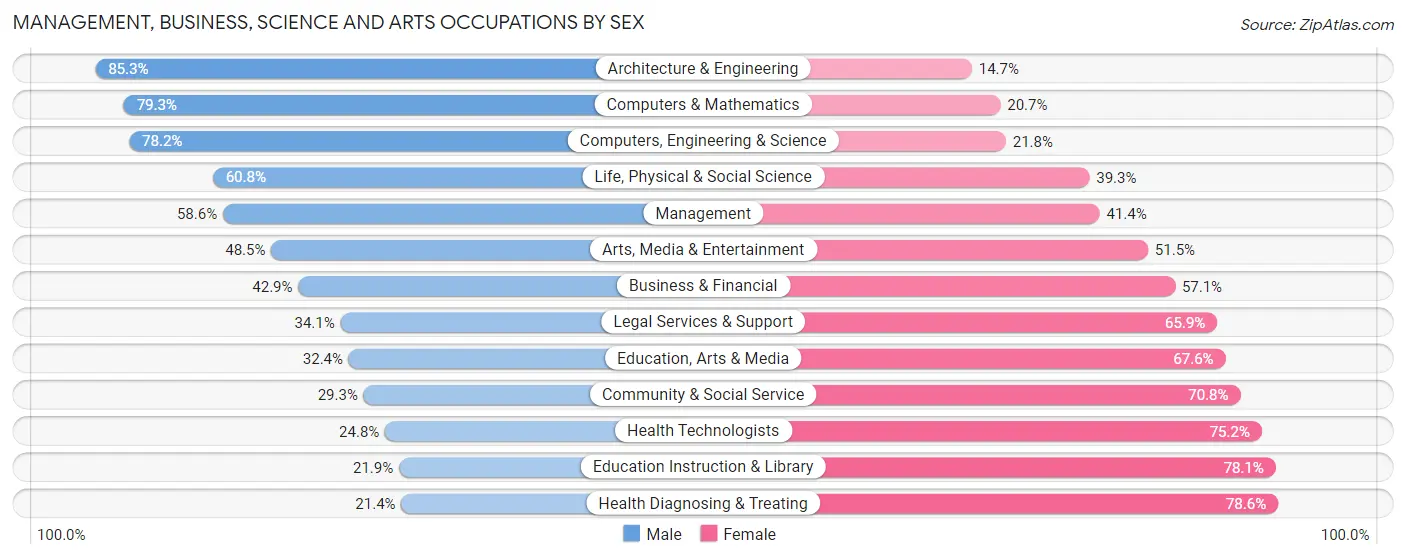
Management, Business, Science and Arts Occupations by Sex
Within the Management, Business, Science and Arts occupations in Berks County, the most male-oriented occupations are Architecture & Engineering (85.3%), Computers & Mathematics (79.3%), and Computers, Engineering & Science (78.2%), while the most female-oriented occupations are Health Diagnosing & Treating (78.6%), Education Instruction & Library (78.1%), and Health Technologists (75.2%).
| Occupation | Male | Female |
| Management | 11,088 (58.6%) | 7,828 (41.4%) |
| Business & Financial | 4,113 (42.9%) | 5,476 (57.1%) |
| Computers, Engineering & Science | 8,902 (78.2%) | 2,485 (21.8%) |
| Computers & Mathematics | 4,078 (79.3%) | 1,063 (20.7%) |
| Architecture & Engineering | 3,581 (85.3%) | 619 (14.7%) |
| Life, Physical & Social Science | 1,243 (60.8%) | 803 (39.3%) |
| Community & Social Service | 5,882 (29.2%) | 14,228 (70.8%) |
| Education, Arts & Media | 1,378 (32.4%) | 2,881 (67.6%) |
| Legal Services & Support | 586 (34.1%) | 1,133 (65.9%) |
| Education Instruction & Library | 2,415 (21.9%) | 8,620 (78.1%) |
| Arts, Media & Entertainment | 1,503 (48.5%) | 1,594 (51.5%) |
| Health Diagnosing & Treating | 2,689 (21.4%) | 9,878 (78.6%) |
| Health Technologists | 2,023 (24.8%) | 6,138 (75.2%) |
| Total (Category) | 32,674 (45.0%) | 39,895 (55.0%) |
| Total (Overall) | 112,629 (53.3%) | 98,793 (46.7%) |
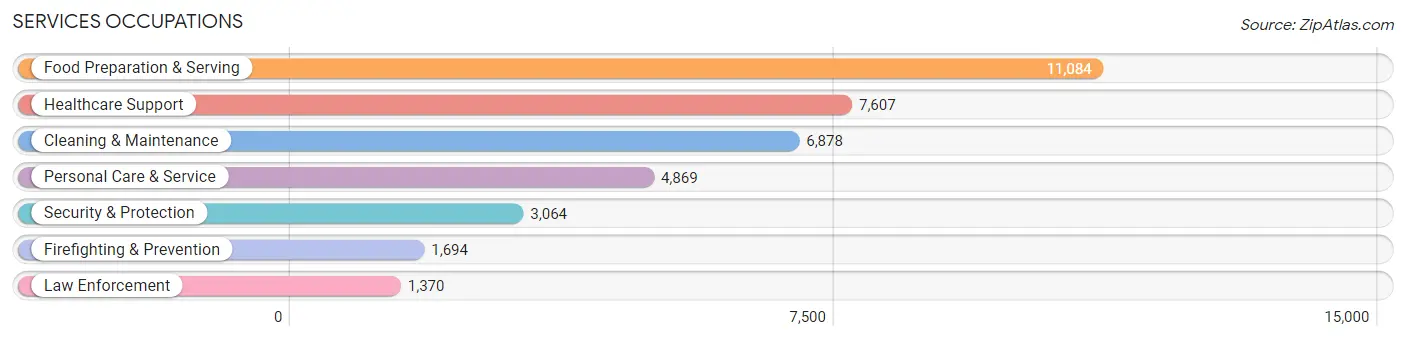
Services Occupations
The most common Services occupations in Berks County are Food Preparation & Serving (11,084 | 5.2%), Healthcare Support (7,607 | 3.6%), Cleaning & Maintenance (6,878 | 3.3%), Personal Care & Service (4,869 | 2.3%), and Security & Protection (3,064 | 1.5%).
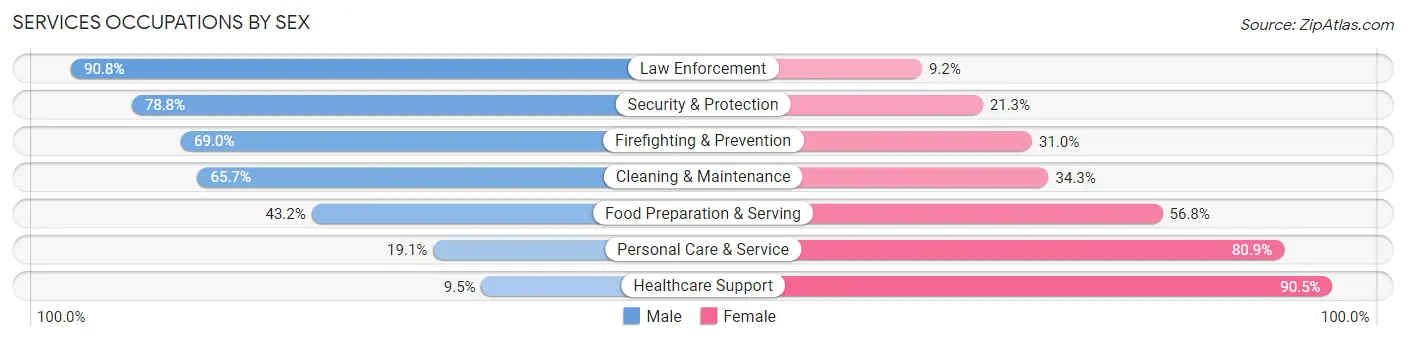
Services Occupations by Sex
Within the Services occupations in Berks County, the most male-oriented occupations are Law Enforcement (90.8%), Security & Protection (78.7%), and Firefighting & Prevention (69.0%), while the most female-oriented occupations are Healthcare Support (90.5%), Personal Care & Service (80.9%), and Food Preparation & Serving (56.8%).
| Occupation | Male | Female |
| Healthcare Support | 726 (9.5%) | 6,881 (90.5%) |
| Security & Protection | 2,413 (78.7%) | 651 (21.2%) |
| Firefighting & Prevention | 1,169 (69.0%) | 525 (31.0%) |
| Law Enforcement | 1,244 (90.8%) | 126 (9.2%) |
| Food Preparation & Serving | 4,785 (43.2%) | 6,299 (56.8%) |
| Cleaning & Maintenance | 4,521 (65.7%) | 2,357 (34.3%) |
| Personal Care & Service | 930 (19.1%) | 3,939 (80.9%) |
| Total (Category) | 13,375 (39.9%) | 20,127 (60.1%) |
| Total (Overall) | 112,629 (53.3%) | 98,793 (46.7%) |
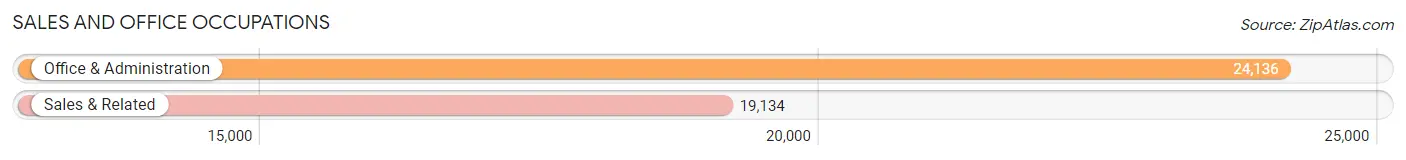
Sales and Office Occupations
The most common Sales and Office occupations in Berks County are Office & Administration (24,136 | 11.4%), and Sales & Related (19,134 | 9.0%).
Sales and Office Occupations by Sex
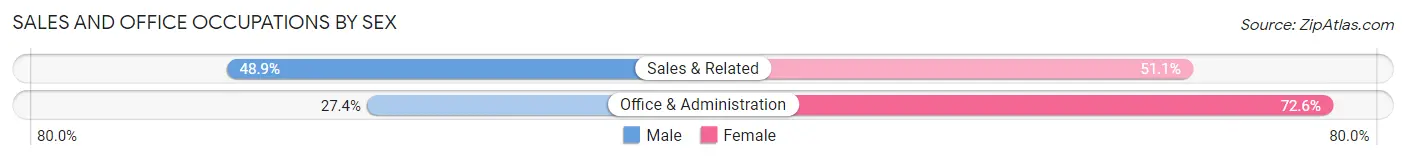
| Occupation | Male | Female |
| Sales & Related | 9,361 (48.9%) | 9,773 (51.1%) |
| Office & Administration | 6,603 (27.4%) | 17,533 (72.6%) |
| Total (Category) | 15,964 (36.9%) | 27,306 (63.1%) |
| Total (Overall) | 112,629 (53.3%) | 98,793 (46.7%) |
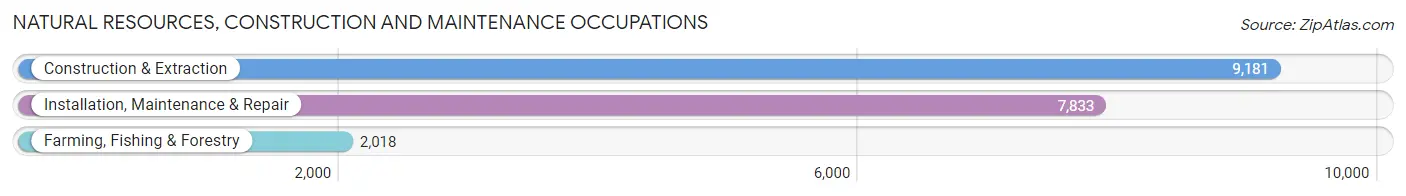
Natural Resources, Construction and Maintenance Occupations
The most common Natural Resources, Construction and Maintenance occupations in Berks County are Construction & Extraction (9,181 | 4.3%), Installation, Maintenance & Repair (7,833 | 3.7%), and Farming, Fishing & Forestry (2,018 | 0.9%).
Natural Resources, Construction and Maintenance Occupations by Sex
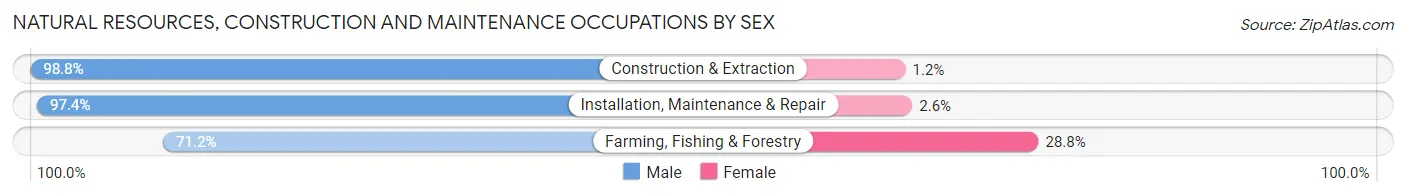
| Occupation | Male | Female |
| Farming, Fishing & Forestry | 1,436 (71.2%) | 582 (28.8%) |
| Construction & Extraction | 9,072 (98.8%) | 109 (1.2%) |
| Installation, Maintenance & Repair | 7,630 (97.4%) | 203 (2.6%) |
| Total (Category) | 18,138 (95.3%) | 894 (4.7%) |
| Total (Overall) | 112,629 (53.3%) | 98,793 (46.7%) |
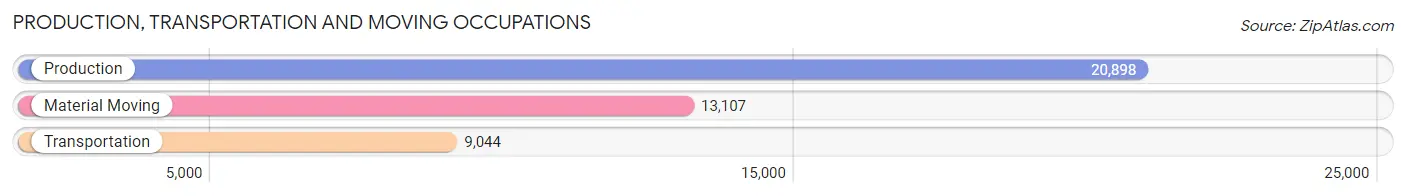
Production, Transportation and Moving Occupations
The most common Production, Transportation and Moving occupations in Berks County are Production (20,898 | 9.9%), Material Moving (13,107 | 6.2%), and Transportation (9,044 | 4.3%).
Production, Transportation and Moving Occupations by Sex
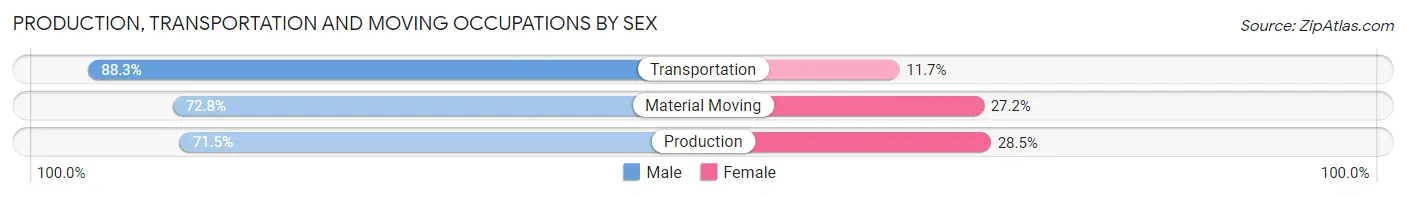
| Occupation | Male | Female |
| Production | 14,949 (71.5%) | 5,949 (28.5%) |
| Transportation | 7,985 (88.3%) | 1,059 (11.7%) |
| Material Moving | 9,544 (72.8%) | 3,563 (27.2%) |
| Total (Category) | 32,478 (75.4%) | 10,571 (24.6%) |
| Total (Overall) | 112,629 (53.3%) | 98,793 (46.7%) |
Employment Industries by Sex in Berks County
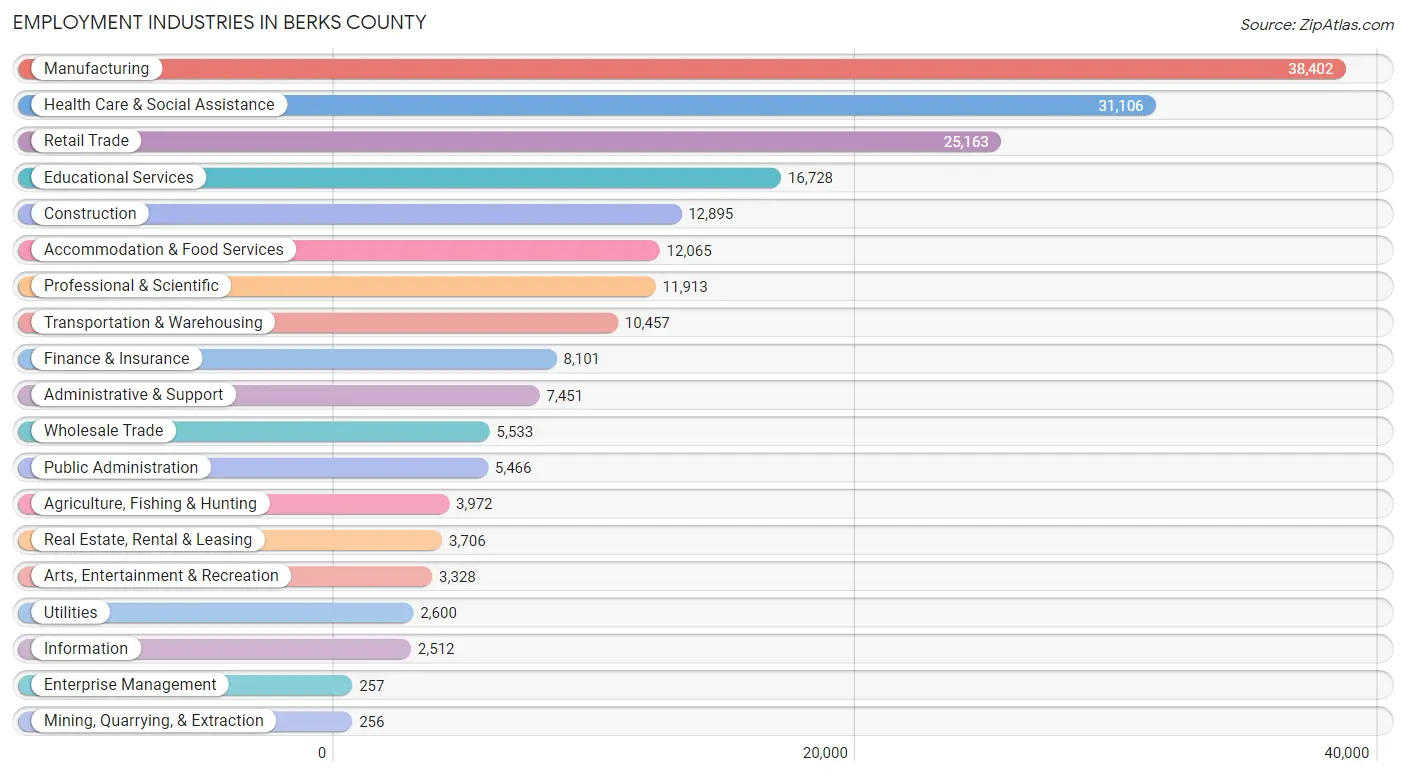
Employment Industries in Berks County
The major employment industries in Berks County include Manufacturing (38,402 | 18.2%), Health Care & Social Assistance (31,106 | 14.7%), Retail Trade (25,163 | 11.9%), Educational Services (16,728 | 7.9%), and Construction (12,895 | 6.1%).
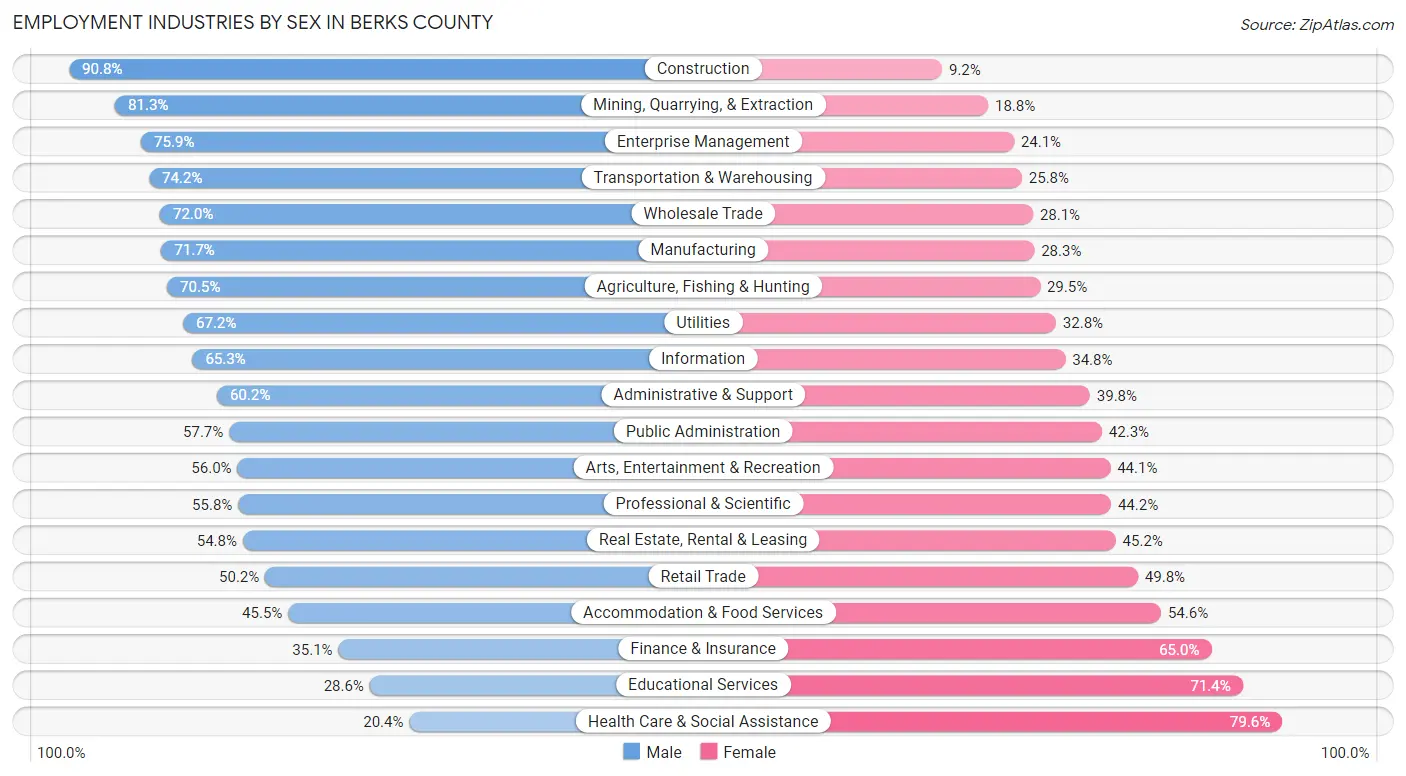
Employment Industries by Sex in Berks County
The Berks County industries that see more men than women are Construction (90.8%), Mining, Quarrying, & Extraction (81.2%), and Enterprise Management (75.9%), whereas the industries that tend to have a higher number of women are Health Care & Social Assistance (79.6%), Educational Services (71.4%), and Finance & Insurance (64.9%).
| Industry | Male | Female |
| Agriculture, Fishing & Hunting | 2,800 (70.5%) | 1,172 (29.5%) |
| Mining, Quarrying, & Extraction | 208 (81.2%) | 48 (18.8%) |
| Construction | 11,705 (90.8%) | 1,190 (9.2%) |
| Manufacturing | 27,525 (71.7%) | 10,877 (28.3%) |
| Wholesale Trade | 3,981 (72.0%) | 1,552 (28.1%) |
| Retail Trade | 12,636 (50.2%) | 12,527 (49.8%) |
| Transportation & Warehousing | 7,763 (74.2%) | 2,694 (25.8%) |
| Utilities | 1,747 (67.2%) | 853 (32.8%) |
| Information | 1,639 (65.2%) | 873 (34.7%) |
| Finance & Insurance | 2,839 (35.0%) | 5,262 (64.9%) |
| Real Estate, Rental & Leasing | 2,032 (54.8%) | 1,674 (45.2%) |
| Professional & Scientific | 6,647 (55.8%) | 5,266 (44.2%) |
| Enterprise Management | 195 (75.9%) | 62 (24.1%) |
| Administrative & Support | 4,483 (60.2%) | 2,968 (39.8%) |
| Educational Services | 4,780 (28.6%) | 11,948 (71.4%) |
| Health Care & Social Assistance | 6,340 (20.4%) | 24,766 (79.6%) |
| Arts, Entertainment & Recreation | 1,862 (55.9%) | 1,466 (44.1%) |
| Accommodation & Food Services | 5,484 (45.5%) | 6,581 (54.5%) |
| Public Administration | 3,152 (57.7%) | 2,314 (42.3%) |
| Total | 112,629 (53.3%) | 98,793 (46.7%) |
Education in Berks County
School Enrollment in Berks County
The most common levels of schooling among the 103,555 students in Berks County are high school (22,952 | 22.2%), college / undergraduate (22,544 | 21.8%), and middle school (22,328 | 21.6%).
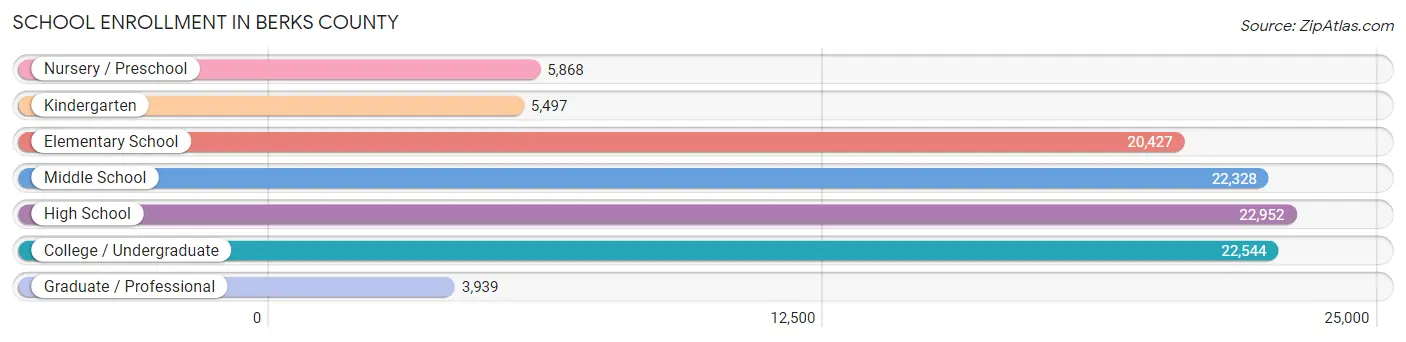
| School Level | # Students | % Students |
| Nursery / Preschool | 5,868 | 5.7% |
| Kindergarten | 5,497 | 5.3% |
| Elementary School | 20,427 | 19.7% |
| Middle School | 22,328 | 21.6% |
| High School | 22,952 | 22.2% |
| College / Undergraduate | 22,544 | 21.8% |
| Graduate / Professional | 3,939 | 3.8% |
| Total | 103,555 | 100.0% |
School Enrollment by Age by Funding Source in Berks County
Out of a total of 103,555 students who are enrolled in schools in Berks County, 19,675 (19.0%) attend a private institution, while the remaining 83,880 (81.0%) are enrolled in public schools. The age group of 3 to 4 year olds has the highest likelihood of being enrolled in private schools, with 1,927 (44.4% in the age bracket) enrolled. Conversely, the age group of 15 to 17 year olds has the lowest likelihood of being enrolled in a private school, with 14,718 (88.3% in the age bracket) attending a public institution.
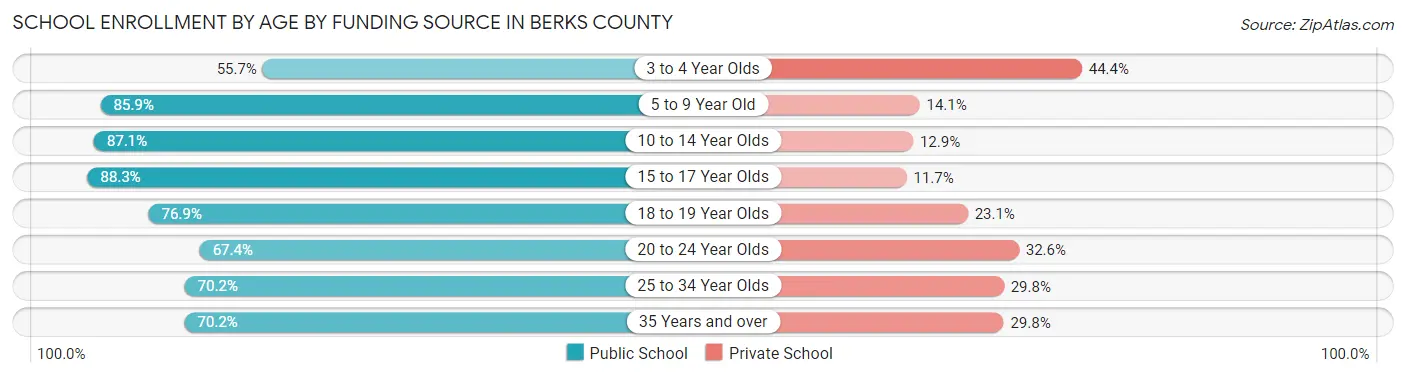
| Age Bracket | Public School | Private School |
| 3 to 4 Year Olds | 2,418 (55.6%) | 1,927 (44.4%) |
| 5 to 9 Year Old | 21,393 (85.9%) | 3,524 (14.1%) |
| 10 to 14 Year Olds | 23,343 (87.1%) | 3,460 (12.9%) |
| 15 to 17 Year Olds | 14,718 (88.3%) | 1,952 (11.7%) |
| 18 to 19 Year Olds | 7,838 (76.9%) | 2,355 (23.1%) |
| 20 to 24 Year Olds | 7,728 (67.4%) | 3,742 (32.6%) |
| 25 to 34 Year Olds | 3,035 (70.2%) | 1,289 (29.8%) |
| 35 Years and over | 3,394 (70.2%) | 1,439 (29.8%) |
| Total | 83,880 (81.0%) | 19,675 (19.0%) |
Educational Attainment by Field of Study in Berks County
Business (15,687 | 18.7%), education (14,452 | 17.2%), science & technology (8,634 | 10.3%), bio, nature & agricultural (5,982 | 7.1%), and arts & humanities (5,908 | 7.0%) are the most common fields of study among 83,891 individuals in Berks County who have obtained a bachelor's degree or higher.
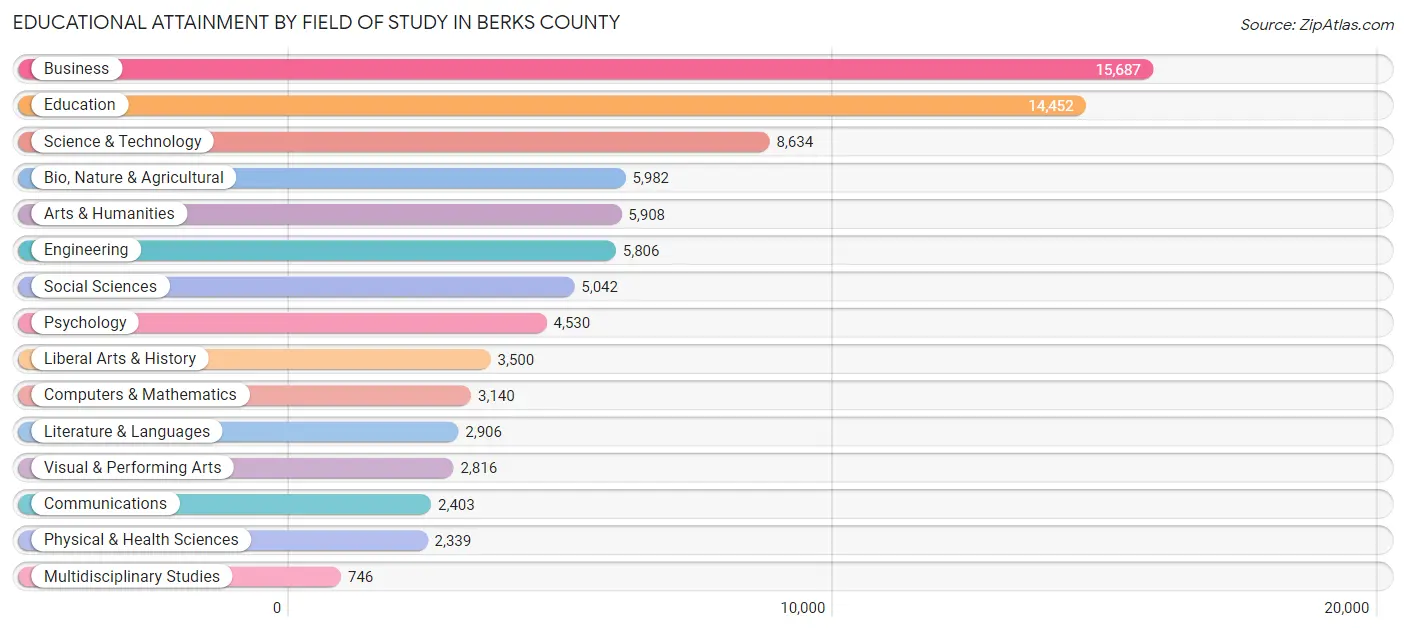
| Field of Study | # Graduates | % Graduates |
| Computers & Mathematics | 3,140 | 3.7% |
| Bio, Nature & Agricultural | 5,982 | 7.1% |
| Physical & Health Sciences | 2,339 | 2.8% |
| Psychology | 4,530 | 5.4% |
| Social Sciences | 5,042 | 6.0% |
| Engineering | 5,806 | 6.9% |
| Multidisciplinary Studies | 746 | 0.9% |
| Science & Technology | 8,634 | 10.3% |
| Business | 15,687 | 18.7% |
| Education | 14,452 | 17.2% |
| Literature & Languages | 2,906 | 3.5% |
| Liberal Arts & History | 3,500 | 4.2% |
| Visual & Performing Arts | 2,816 | 3.4% |
| Communications | 2,403 | 2.9% |
| Arts & Humanities | 5,908 | 7.0% |
| Total | 83,891 | 100.0% |
Transportation & Commute in Berks County
Vehicle Availability by Sex in Berks County
The most prevalent vehicle ownership categories in Berks County are males with 2 vehicles (43,233, accounting for 39.6%) and females with 2 vehicles (35,656, making up 45.8%).
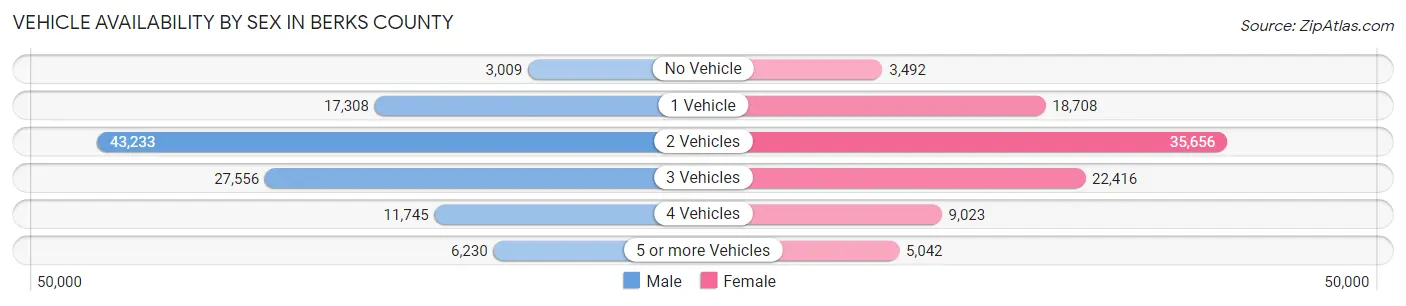
| Vehicles Available | Male | Female |
| No Vehicle | 3,009 (2.8%) | 3,492 (3.7%) |
| 1 Vehicle | 17,308 (15.9%) | 18,708 (19.8%) |
| 2 Vehicles | 43,233 (39.6%) | 35,656 (37.8%) |
| 3 Vehicles | 27,556 (25.3%) | 22,416 (23.8%) |
| 4 Vehicles | 11,745 (10.8%) | 9,023 (9.6%) |
| 5 or more Vehicles | 6,230 (5.7%) | 5,042 (5.3%) |
| Total | 109,081 (100.0%) | 94,337 (100.0%) |
Commute Time in Berks County
The most frequently occuring commute durations in Berks County are 15 to 19 minutes (32,635 commuters, 17.4%), 10 to 14 minutes (27,827 commuters, 14.8%), and 20 to 24 minutes (27,438 commuters, 14.6%).
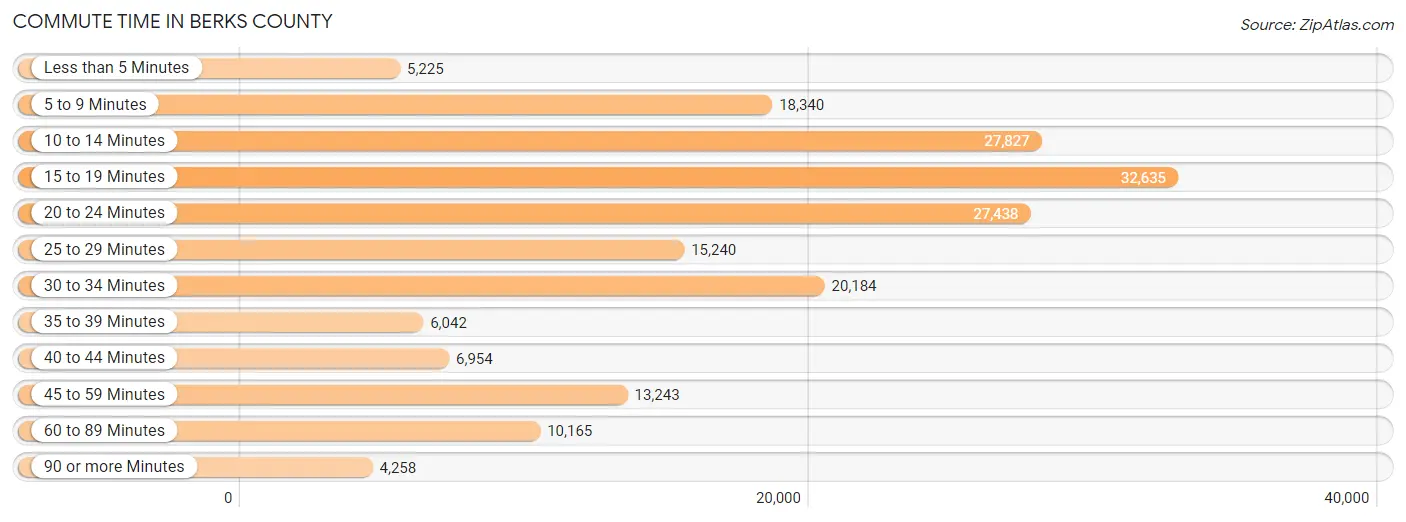
| Commute Time | # Commuters | % Commuters |
| Less than 5 Minutes | 5,225 | 2.8% |
| 5 to 9 Minutes | 18,340 | 9.8% |
| 10 to 14 Minutes | 27,827 | 14.8% |
| 15 to 19 Minutes | 32,635 | 17.4% |
| 20 to 24 Minutes | 27,438 | 14.6% |
| 25 to 29 Minutes | 15,240 | 8.1% |
| 30 to 34 Minutes | 20,184 | 10.8% |
| 35 to 39 Minutes | 6,042 | 3.2% |
| 40 to 44 Minutes | 6,954 | 3.7% |
| 45 to 59 Minutes | 13,243 | 7.1% |
| 60 to 89 Minutes | 10,165 | 5.4% |
| 90 or more Minutes | 4,258 | 2.3% |
Commute Time by Sex in Berks County
The most common commute times in Berks County are 15 to 19 minutes (16,595 commuters, 16.4%) for males and 15 to 19 minutes (16,040 commuters, 18.5%) for females.
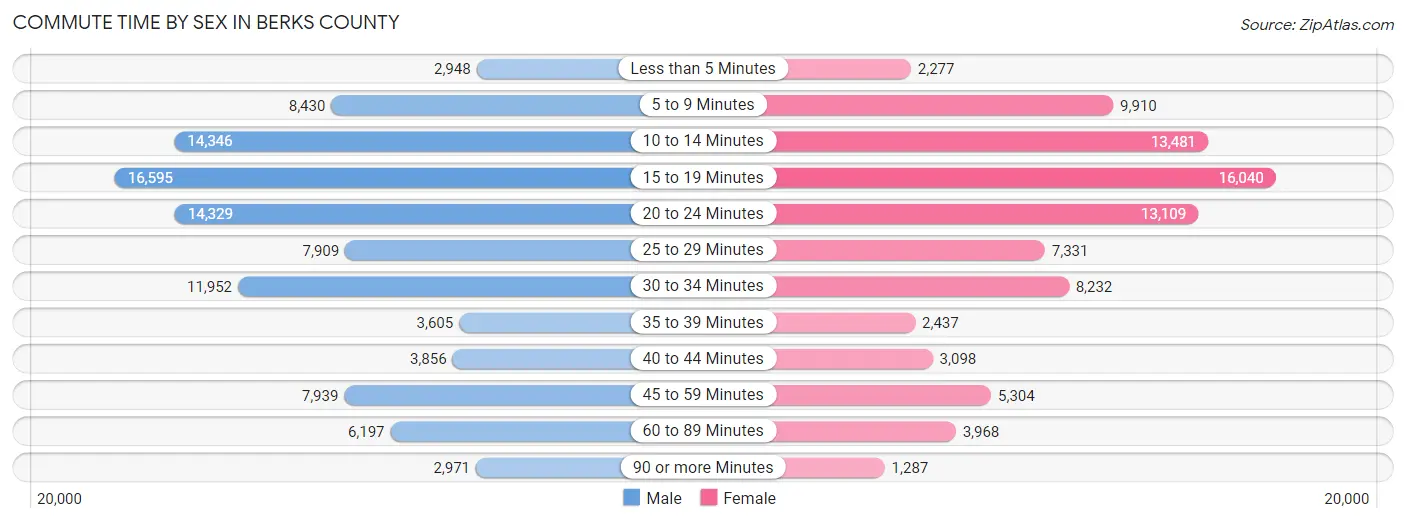
| Commute Time | Male | Female |
| Less than 5 Minutes | 2,948 (2.9%) | 2,277 (2.6%) |
| 5 to 9 Minutes | 8,430 (8.3%) | 9,910 (11.5%) |
| 10 to 14 Minutes | 14,346 (14.2%) | 13,481 (15.6%) |
| 15 to 19 Minutes | 16,595 (16.4%) | 16,040 (18.5%) |
| 20 to 24 Minutes | 14,329 (14.2%) | 13,109 (15.2%) |
| 25 to 29 Minutes | 7,909 (7.8%) | 7,331 (8.5%) |
| 30 to 34 Minutes | 11,952 (11.8%) | 8,232 (9.5%) |
| 35 to 39 Minutes | 3,605 (3.6%) | 2,437 (2.8%) |
| 40 to 44 Minutes | 3,856 (3.8%) | 3,098 (3.6%) |
| 45 to 59 Minutes | 7,939 (7.9%) | 5,304 (6.1%) |
| 60 to 89 Minutes | 6,197 (6.1%) | 3,968 (4.6%) |
| 90 or more Minutes | 2,971 (2.9%) | 1,287 (1.5%) |
Time of Departure to Work by Sex in Berks County
The most frequent times of departure to work in Berks County are 7:00 AM to 7:29 AM (11,674, 11.6%) for males and 7:00 AM to 7:29 AM (13,320, 15.4%) for females.
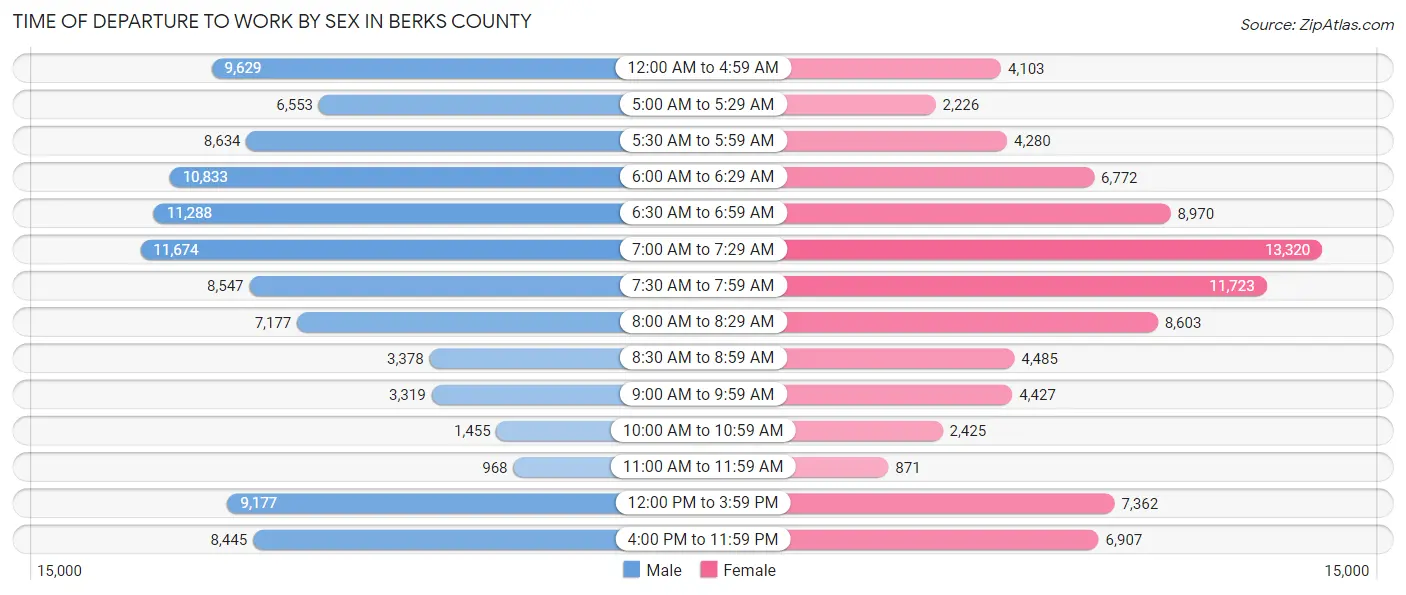
| Time of Departure | Male | Female |
| 12:00 AM to 4:59 AM | 9,629 (9.5%) | 4,103 (4.7%) |
| 5:00 AM to 5:29 AM | 6,553 (6.5%) | 2,226 (2.6%) |
| 5:30 AM to 5:59 AM | 8,634 (8.5%) | 4,280 (5.0%) |
| 6:00 AM to 6:29 AM | 10,833 (10.7%) | 6,772 (7.8%) |
| 6:30 AM to 6:59 AM | 11,288 (11.2%) | 8,970 (10.4%) |
| 7:00 AM to 7:29 AM | 11,674 (11.6%) | 13,320 (15.4%) |
| 7:30 AM to 7:59 AM | 8,547 (8.5%) | 11,723 (13.6%) |
| 8:00 AM to 8:29 AM | 7,177 (7.1%) | 8,603 (10.0%) |
| 8:30 AM to 8:59 AM | 3,378 (3.3%) | 4,485 (5.2%) |
| 9:00 AM to 9:59 AM | 3,319 (3.3%) | 4,427 (5.1%) |
| 10:00 AM to 10:59 AM | 1,455 (1.4%) | 2,425 (2.8%) |
| 11:00 AM to 11:59 AM | 968 (1.0%) | 871 (1.0%) |
| 12:00 PM to 3:59 PM | 9,177 (9.1%) | 7,362 (8.5%) |
| 4:00 PM to 11:59 PM | 8,445 (8.4%) | 6,907 (8.0%) |
| Total | 101,077 (100.0%) | 86,474 (100.0%) |
Housing Occupancy in Berks County
Occupancy by Ownership in Berks County
Of the total 161,174 dwellings in Berks County, owner-occupied units account for 114,165 (70.8%), while renter-occupied units make up 47,009 (29.2%).
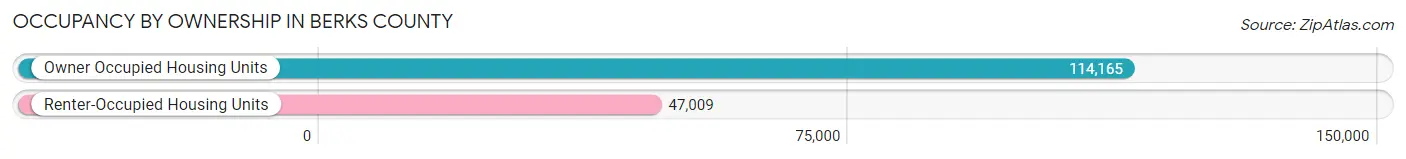
| Occupancy | # Housing Units | % Housing Units |
| Owner Occupied Housing Units | 114,165 | 70.8% |
| Renter-Occupied Housing Units | 47,009 | 29.2% |
| Total Occupied Housing Units | 161,174 | 100.0% |
Occupancy by Household Size in Berks County
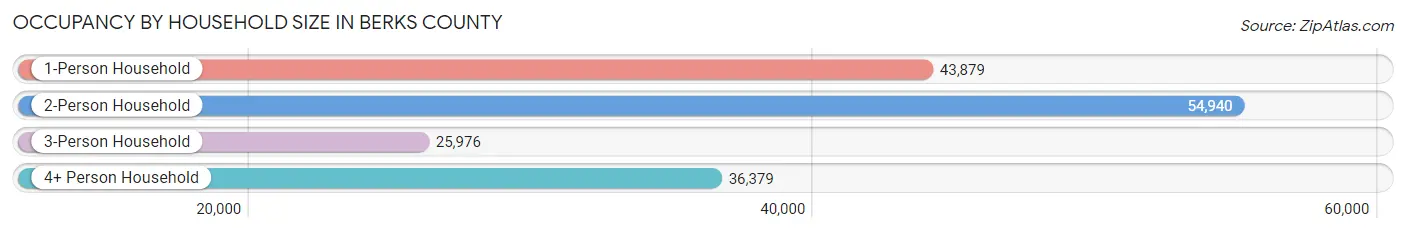
| Household Size | # Housing Units | % Housing Units |
| 1-Person Household | 43,879 | 27.2% |
| 2-Person Household | 54,940 | 34.1% |
| 3-Person Household | 25,976 | 16.1% |
| 4+ Person Household | 36,379 | 22.6% |
| Total Housing Units | 161,174 | 100.0% |
Occupancy by Ownership by Household Size in Berks County
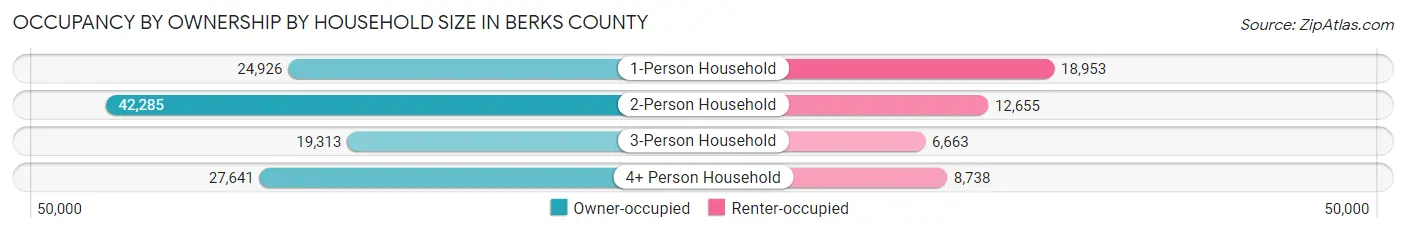
| Household Size | Owner-occupied | Renter-occupied |
| 1-Person Household | 24,926 (56.8%) | 18,953 (43.2%) |
| 2-Person Household | 42,285 (77.0%) | 12,655 (23.0%) |
| 3-Person Household | 19,313 (74.4%) | 6,663 (25.7%) |
| 4+ Person Household | 27,641 (76.0%) | 8,738 (24.0%) |
| Total Housing Units | 114,165 (70.8%) | 47,009 (29.2%) |
Occupancy by Educational Attainment in Berks County
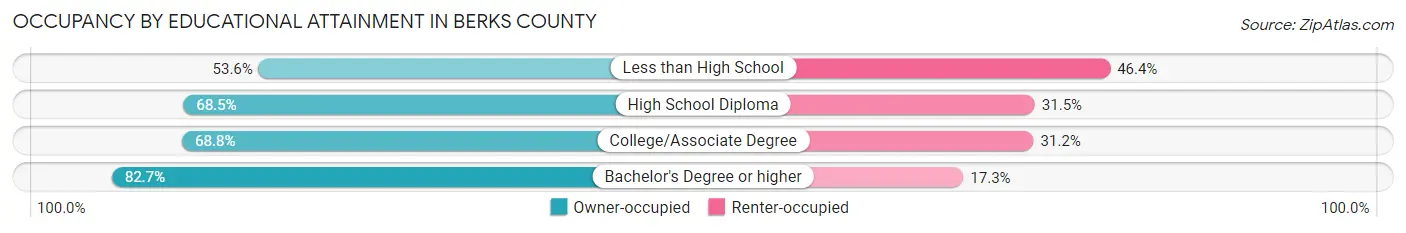
| Household Size | Owner-occupied | Renter-occupied |
| Less than High School | 9,758 (53.6%) | 8,448 (46.4%) |
| High School Diploma | 38,315 (68.5%) | 17,593 (31.5%) |
| College/Associate Degree | 29,165 (68.8%) | 13,241 (31.2%) |
| Bachelor's Degree or higher | 36,927 (82.7%) | 7,727 (17.3%) |
Occupancy by Age of Householder in Berks County
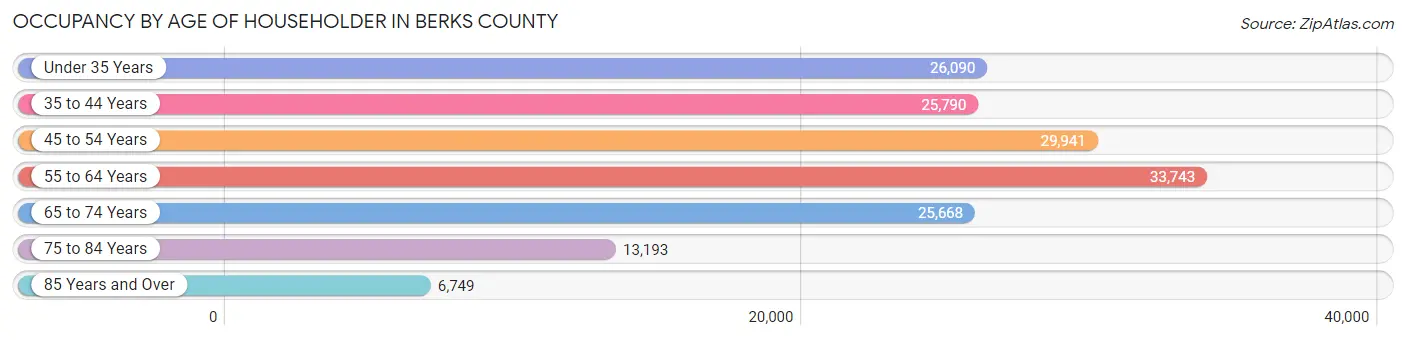
| Age Bracket | # Households | % Households |
| Under 35 Years | 26,090 | 16.2% |
| 35 to 44 Years | 25,790 | 16.0% |
| 45 to 54 Years | 29,941 | 18.6% |
| 55 to 64 Years | 33,743 | 20.9% |
| 65 to 74 Years | 25,668 | 15.9% |
| 75 to 84 Years | 13,193 | 8.2% |
| 85 Years and Over | 6,749 | 4.2% |
| Total | 161,174 | 100.0% |
Housing Finances in Berks County
Median Income by Occupancy in Berks County
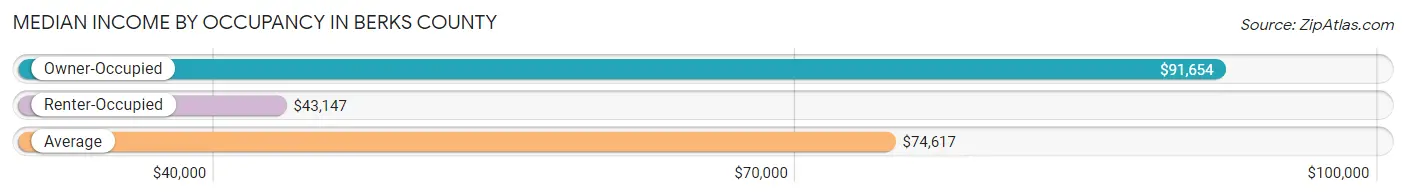
| Occupancy Type | # Households | Median Income |
| Owner-Occupied | 114,165 (70.8%) | $91,654 |
| Renter-Occupied | 47,009 (29.2%) | $43,147 |
| Average | 161,174 (100.0%) | $74,617 |
Occupancy by Householder Income Bracket in Berks County
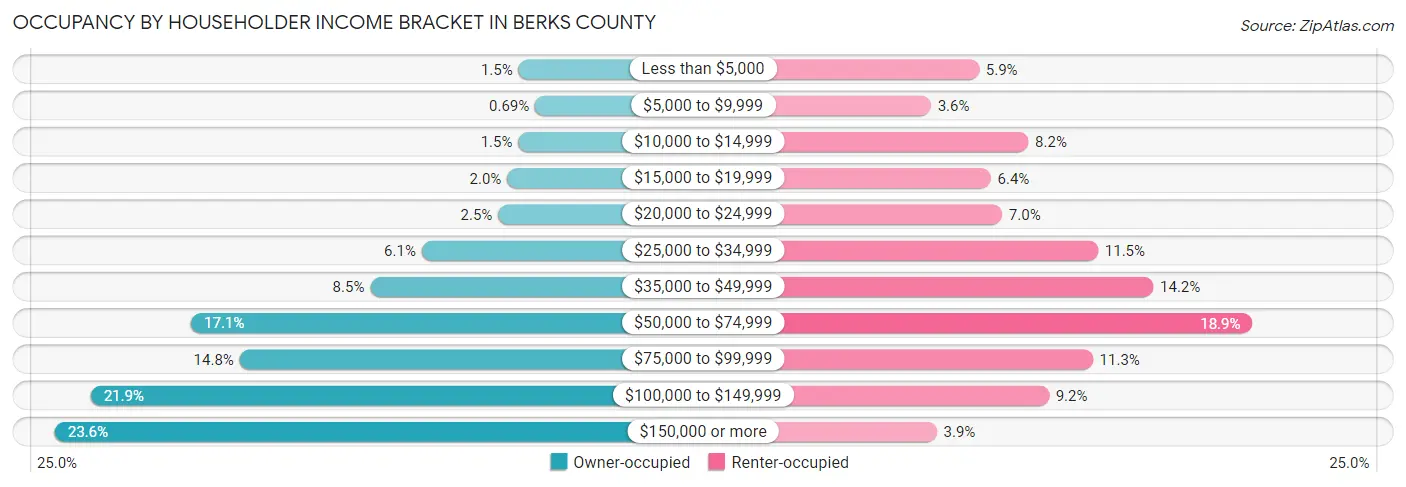
| Income Bracket | Owner-occupied | Renter-occupied |
| Less than $5,000 | 1,684 (1.5%) | 2,758 (5.9%) |
| $5,000 to $9,999 | 789 (0.7%) | 1,682 (3.6%) |
| $10,000 to $14,999 | 1,703 (1.5%) | 3,863 (8.2%) |
| $15,000 to $19,999 | 2,311 (2.0%) | 3,021 (6.4%) |
| $20,000 to $24,999 | 2,796 (2.5%) | 3,275 (7.0%) |
| $25,000 to $34,999 | 6,958 (6.1%) | 5,424 (11.5%) |
| $35,000 to $49,999 | 9,745 (8.5%) | 6,659 (14.2%) |
| $50,000 to $74,999 | 19,488 (17.1%) | 8,880 (18.9%) |
| $75,000 to $99,999 | 16,851 (14.8%) | 5,309 (11.3%) |
| $100,000 to $149,999 | 24,940 (21.8%) | 4,325 (9.2%) |
| $150,000 or more | 26,900 (23.6%) | 1,813 (3.9%) |
| Total | 114,165 (100.0%) | 47,009 (100.0%) |
Monthly Housing Cost Tiers in Berks County
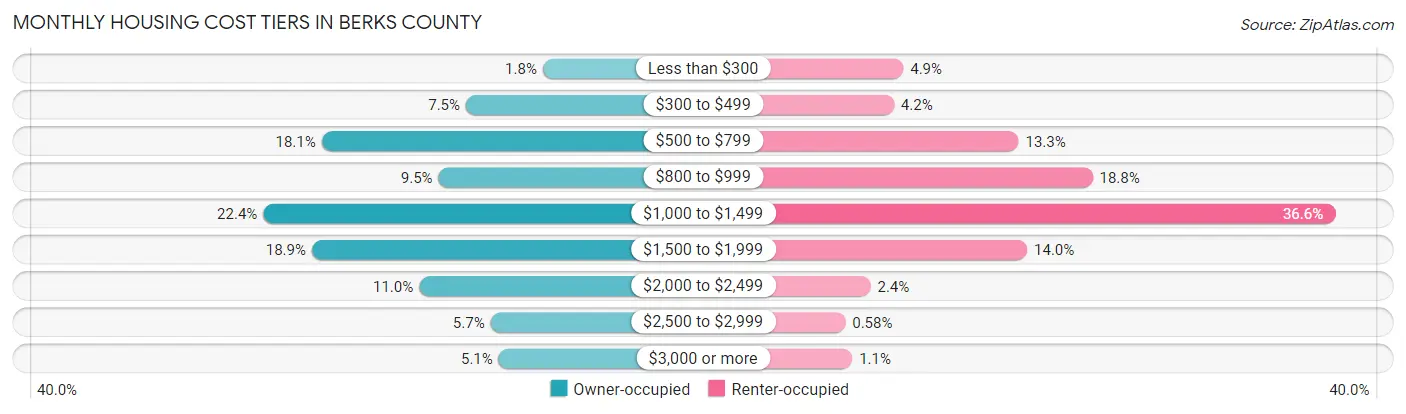
| Monthly Cost | Owner-occupied | Renter-occupied |
| Less than $300 | 2,103 (1.8%) | 2,279 (4.9%) |
| $300 to $499 | 8,559 (7.5%) | 1,954 (4.2%) |
| $500 to $799 | 20,697 (18.1%) | 6,272 (13.3%) |
| $800 to $999 | 10,870 (9.5%) | 8,834 (18.8%) |
| $1,000 to $1,499 | 25,610 (22.4%) | 17,223 (36.6%) |
| $1,500 to $1,999 | 21,522 (18.9%) | 6,568 (14.0%) |
| $2,000 to $2,499 | 12,497 (11.0%) | 1,147 (2.4%) |
| $2,500 to $2,999 | 6,501 (5.7%) | 274 (0.6%) |
| $3,000 or more | 5,806 (5.1%) | 511 (1.1%) |
| Total | 114,165 (100.0%) | 47,009 (100.0%) |
Physical Housing Characteristics in Berks County
Housing Structures in Berks County
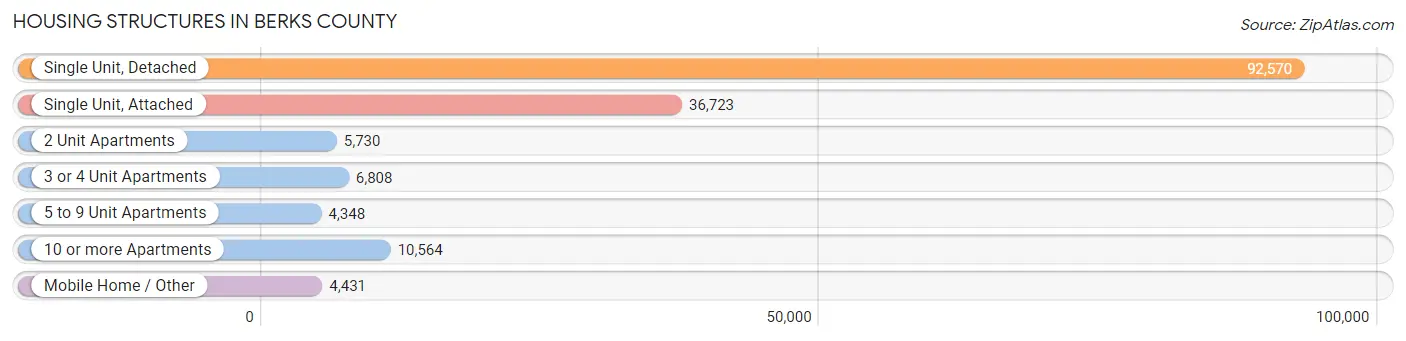
| Structure Type | # Housing Units | % Housing Units |
| Single Unit, Detached | 92,570 | 57.4% |
| Single Unit, Attached | 36,723 | 22.8% |
| 2 Unit Apartments | 5,730 | 3.6% |
| 3 or 4 Unit Apartments | 6,808 | 4.2% |
| 5 to 9 Unit Apartments | 4,348 | 2.7% |
| 10 or more Apartments | 10,564 | 6.6% |
| Mobile Home / Other | 4,431 | 2.8% |
| Total | 161,174 | 100.0% |
Housing Structures by Occupancy in Berks County
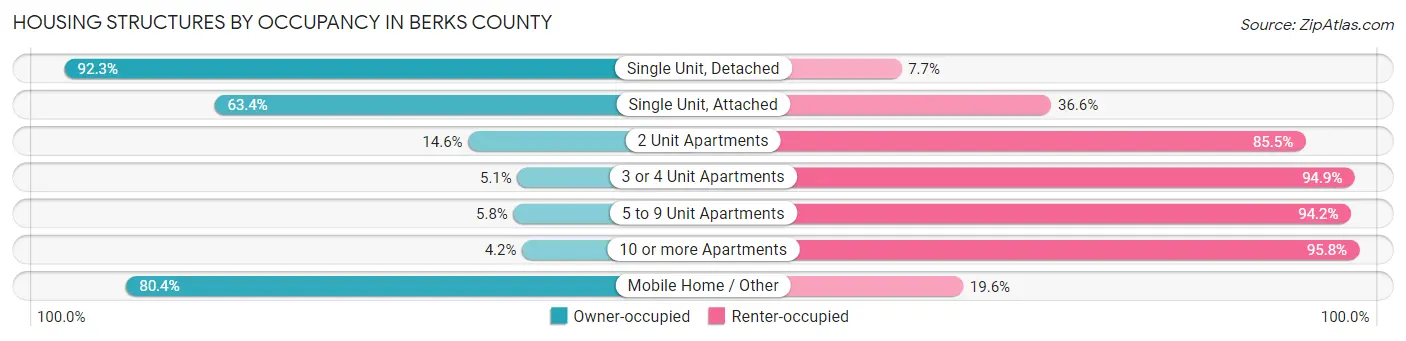
| Structure Type | Owner-occupied | Renter-occupied |
| Single Unit, Detached | 85,431 (92.3%) | 7,139 (7.7%) |
| Single Unit, Attached | 23,297 (63.4%) | 13,426 (36.6%) |
| 2 Unit Apartments | 834 (14.5%) | 4,896 (85.5%) |
| 3 or 4 Unit Apartments | 345 (5.1%) | 6,463 (94.9%) |
| 5 to 9 Unit Apartments | 254 (5.8%) | 4,094 (94.2%) |
| 10 or more Apartments | 441 (4.2%) | 10,123 (95.8%) |
| Mobile Home / Other | 3,563 (80.4%) | 868 (19.6%) |
| Total | 114,165 (70.8%) | 47,009 (29.2%) |
Housing Structures by Number of Rooms in Berks County
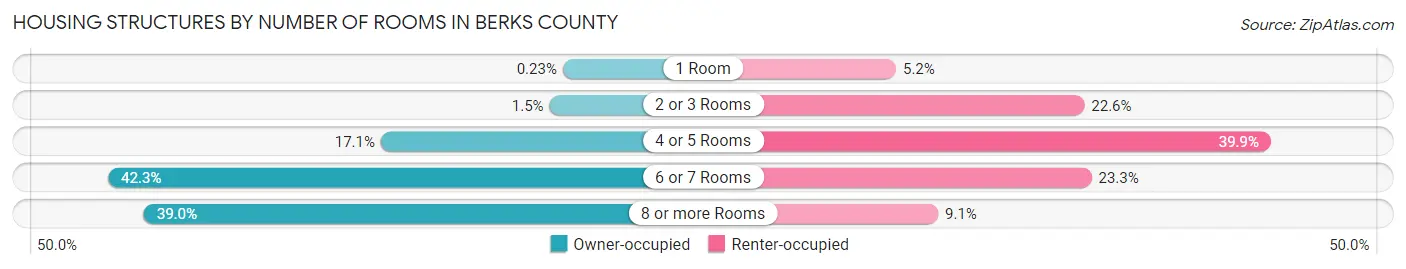
| Number of Rooms | Owner-occupied | Renter-occupied |
| 1 Room | 259 (0.2%) | 2,439 (5.2%) |
| 2 or 3 Rooms | 1,665 (1.5%) | 10,628 (22.6%) |
| 4 or 5 Rooms | 19,472 (17.1%) | 18,733 (39.9%) |
| 6 or 7 Rooms | 48,274 (42.3%) | 10,940 (23.3%) |
| 8 or more Rooms | 44,495 (39.0%) | 4,269 (9.1%) |
| Total | 114,165 (100.0%) | 47,009 (100.0%) |
Housing Structure by Heating Type in Berks County
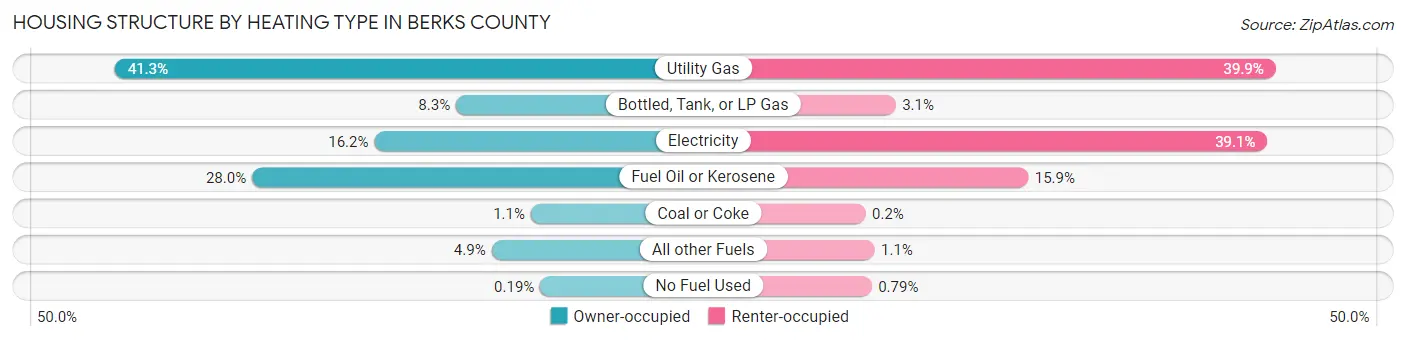
| Heating Type | Owner-occupied | Renter-occupied |
| Utility Gas | 47,128 (41.3%) | 18,738 (39.9%) |
| Bottled, Tank, or LP Gas | 9,500 (8.3%) | 1,462 (3.1%) |
| Electricity | 18,507 (16.2%) | 18,355 (39.1%) |
| Fuel Oil or Kerosene | 31,996 (28.0%) | 7,484 (15.9%) |
| Coal or Coke | 1,240 (1.1%) | 93 (0.2%) |
| All other Fuels | 5,577 (4.9%) | 505 (1.1%) |
| No Fuel Used | 217 (0.2%) | 372 (0.8%) |
| Total | 114,165 (100.0%) | 47,009 (100.0%) |
Household Vehicle Usage in Berks County
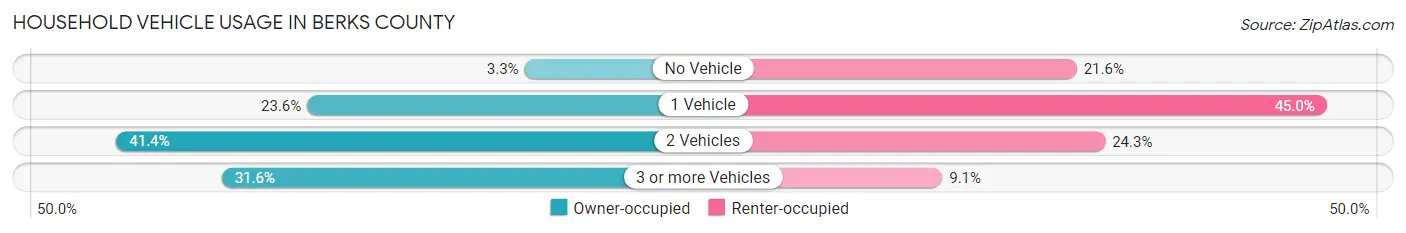
| Vehicles per Household | Owner-occupied | Renter-occupied |
| No Vehicle | 3,810 (3.3%) | 10,175 (21.6%) |
| 1 Vehicle | 26,982 (23.6%) | 21,140 (45.0%) |
| 2 Vehicles | 47,297 (41.4%) | 11,421 (24.3%) |
| 3 or more Vehicles | 36,076 (31.6%) | 4,273 (9.1%) |
| Total | 114,165 (100.0%) | 47,009 (100.0%) |
Real Estate & Mortgages in Berks County
Real Estate and Mortgage Overview in Berks County
| Characteristic | Without Mortgage | With Mortgage |
| Housing Units | 43,199 | 70,966 |
| Median Property Value | $210,300 | $233,600 |
| Median Household Income | $68,201 | $20,032 |
| Monthly Housing Costs | $686 | $5,641 |
| Real Estate Taxes | $3,804 | $1,174 |
Property Value by Mortgage Status in Berks County
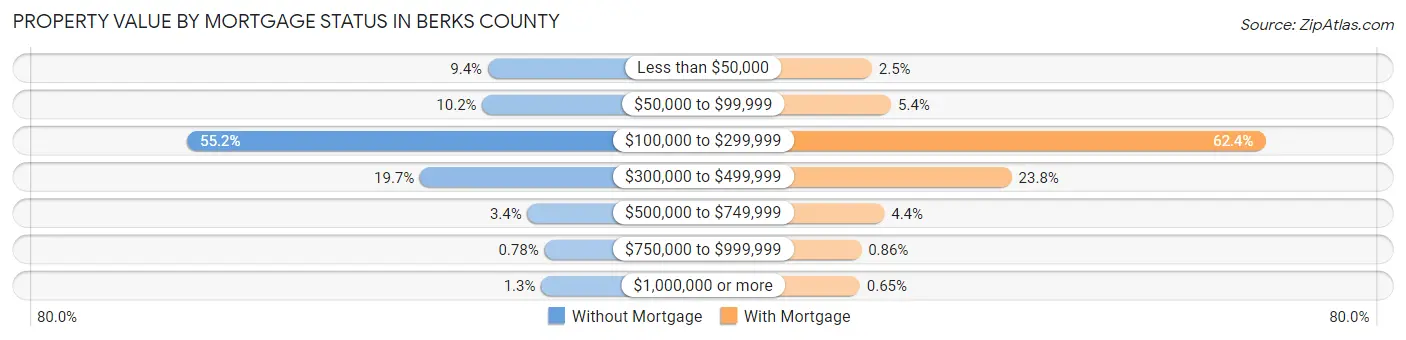
| Property Value | Without Mortgage | With Mortgage |
| Less than $50,000 | 4,059 (9.4%) | 1,757 (2.5%) |
| $50,000 to $99,999 | 4,423 (10.2%) | 3,848 (5.4%) |
| $100,000 to $299,999 | 23,859 (55.2%) | 44,303 (62.4%) |
| $300,000 to $499,999 | 8,525 (19.7%) | 16,884 (23.8%) |
| $500,000 to $749,999 | 1,450 (3.4%) | 3,107 (4.4%) |
| $750,000 to $999,999 | 336 (0.8%) | 609 (0.9%) |
| $1,000,000 or more | 547 (1.3%) | 458 (0.6%) |
| Total | 43,199 (100.0%) | 70,966 (100.0%) |
Household Income by Mortgage Status in Berks County
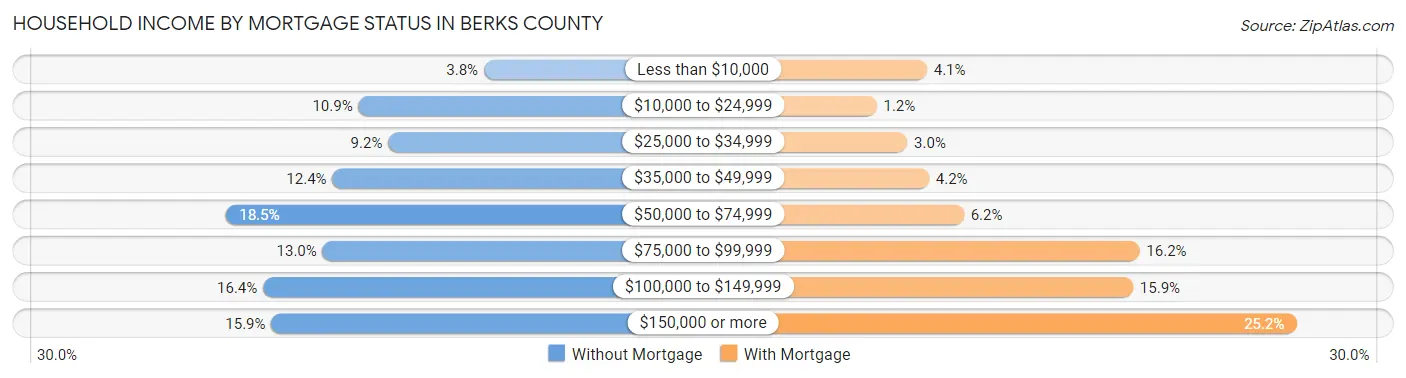
| Household Income | Without Mortgage | With Mortgage |
| Less than $10,000 | 1,619 (3.7%) | 2,887 (4.1%) |
| $10,000 to $24,999 | 4,719 (10.9%) | 854 (1.2%) |
| $25,000 to $34,999 | 3,981 (9.2%) | 2,091 (2.9%) |
| $35,000 to $49,999 | 5,360 (12.4%) | 2,977 (4.2%) |
| $50,000 to $74,999 | 7,978 (18.5%) | 4,385 (6.2%) |
| $75,000 to $99,999 | 5,601 (13.0%) | 11,510 (16.2%) |
| $100,000 to $149,999 | 7,073 (16.4%) | 11,250 (15.9%) |
| $150,000 or more | 6,868 (15.9%) | 17,867 (25.2%) |
| Total | 43,199 (100.0%) | 70,966 (100.0%) |
Property Value to Household Income Ratio in Berks County
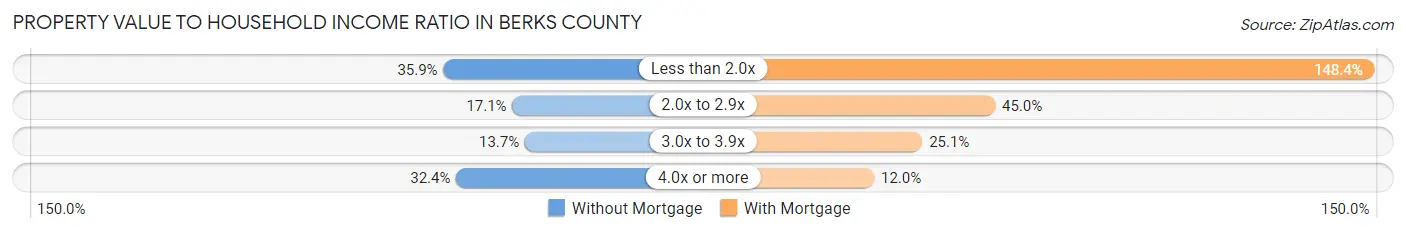
| Value-to-Income Ratio | Without Mortgage | With Mortgage |
| Less than 2.0x | 15,509 (35.9%) | 105,303 (148.4%) |
| 2.0x to 2.9x | 7,386 (17.1%) | 31,933 (45.0%) |
| 3.0x to 3.9x | 5,904 (13.7%) | 17,843 (25.1%) |
| 4.0x or more | 13,993 (32.4%) | 8,538 (12.0%) |
| Total | 43,199 (100.0%) | 70,966 (100.0%) |
Real Estate Taxes by Mortgage Status in Berks County
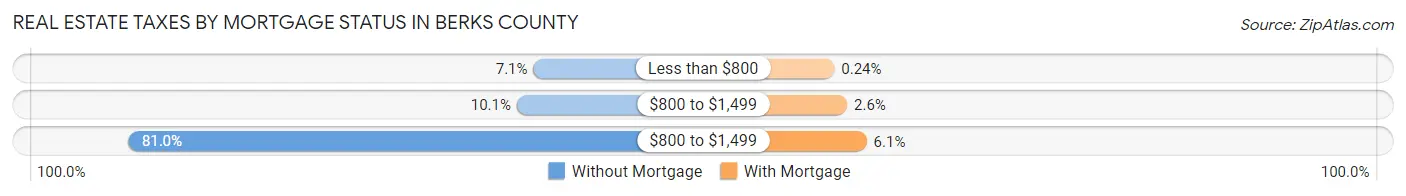
| Property Taxes | Without Mortgage | With Mortgage |
| Less than $800 | 3,060 (7.1%) | 172 (0.2%) |
| $800 to $1,499 | 4,362 (10.1%) | 1,825 (2.6%) |
| $800 to $1,499 | 34,971 (80.9%) | 4,359 (6.1%) |
| Total | 43,199 (100.0%) | 70,966 (100.0%) |
Health & Disability in Berks County
Health Insurance Coverage by Age in Berks County
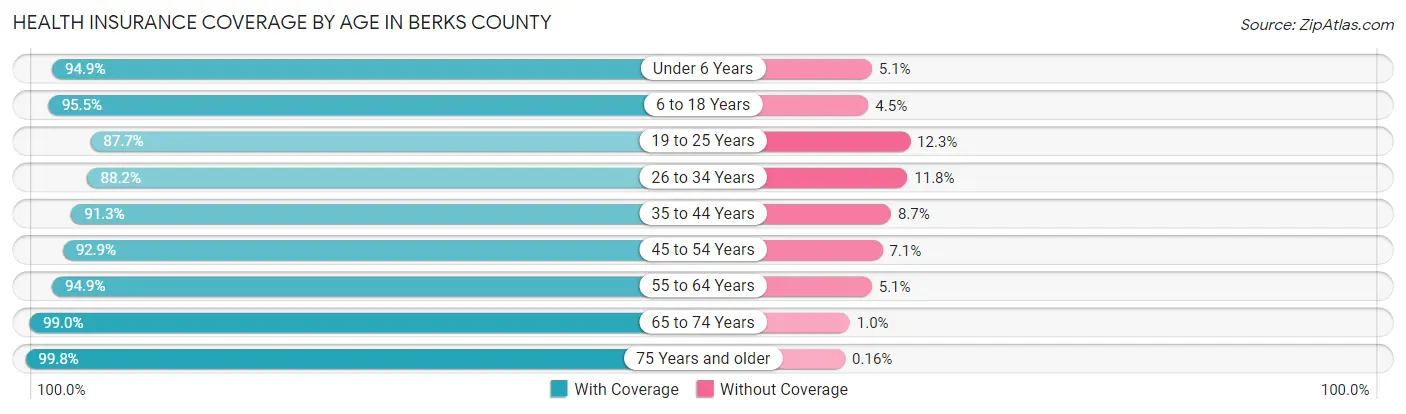
| Age Bracket | With Coverage | Without Coverage |
| Under 6 Years | 27,684 (94.9%) | 1,501 (5.1%) |
| 6 to 18 Years | 68,672 (95.5%) | 3,238 (4.5%) |
| 19 to 25 Years | 35,298 (87.7%) | 4,942 (12.3%) |
| 26 to 34 Years | 41,511 (88.2%) | 5,534 (11.8%) |
| 35 to 44 Years | 45,955 (91.3%) | 4,387 (8.7%) |
| 45 to 54 Years | 50,080 (92.9%) | 3,836 (7.1%) |
| 55 to 64 Years | 55,513 (94.9%) | 2,999 (5.1%) |
| 65 to 74 Years | 42,185 (99.0%) | 441 (1.0%) |
| 75 Years and older | 30,402 (99.8%) | 48 (0.2%) |
| Total | 397,300 (93.6%) | 26,926 (6.4%) |
Health Insurance Coverage by Citizenship Status in Berks County
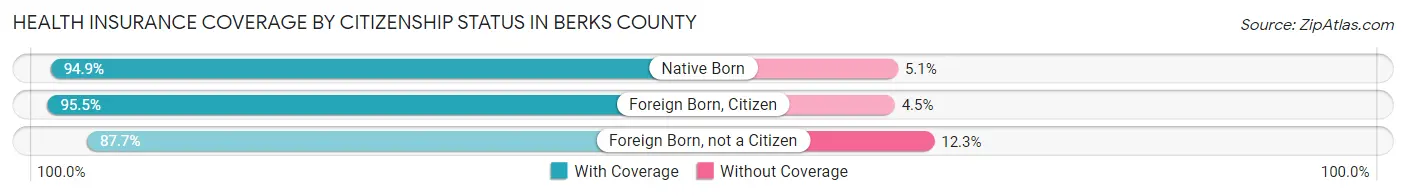
| Citizenship Status | With Coverage | Without Coverage |
| Native Born | 27,684 (94.9%) | 1,501 (5.1%) |
| Foreign Born, Citizen | 68,672 (95.5%) | 3,238 (4.5%) |
| Foreign Born, not a Citizen | 35,298 (87.7%) | 4,942 (12.3%) |
Health Insurance Coverage by Household Income in Berks County
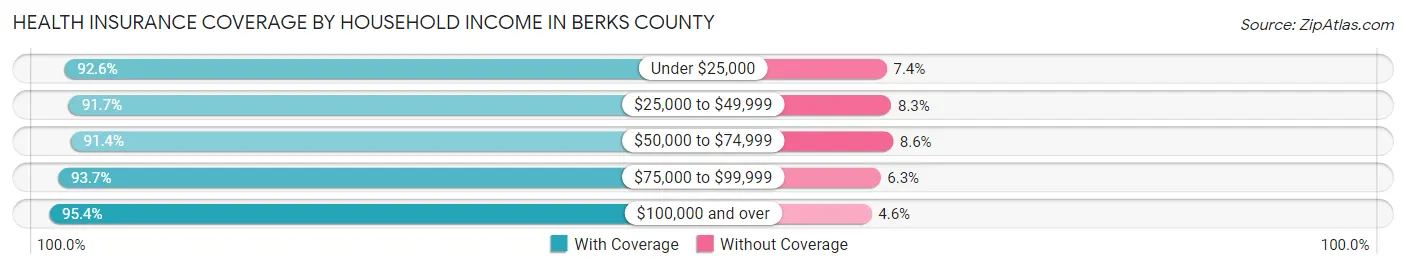
| Household Income | With Coverage | Without Coverage |
| Under $25,000 | 39,287 (92.6%) | 3,159 (7.4%) |
| $25,000 to $49,999 | 53,414 (91.7%) | 4,829 (8.3%) |
| $50,000 to $74,999 | 62,227 (91.4%) | 5,878 (8.6%) |
| $75,000 to $99,999 | 56,761 (93.7%) | 3,811 (6.3%) |
| $100,000 and over | 176,916 (95.4%) | 8,521 (4.6%) |
Public vs Private Health Insurance Coverage by Age in Berks County
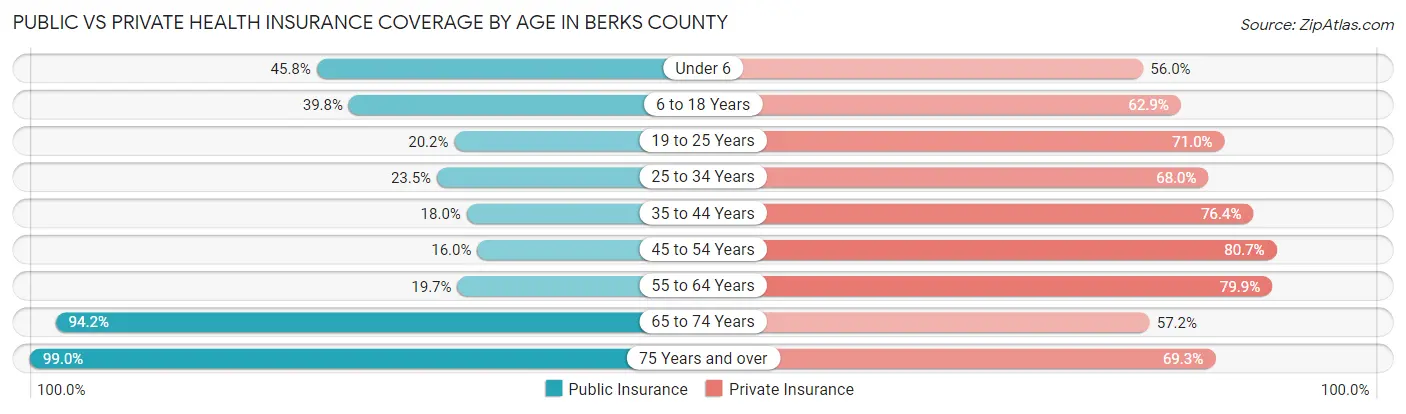
| Age Bracket | Public Insurance | Private Insurance |
| Under 6 | 13,368 (45.8%) | 16,337 (56.0%) |
| 6 to 18 Years | 28,643 (39.8%) | 45,222 (62.9%) |
| 19 to 25 Years | 8,143 (20.2%) | 28,574 (71.0%) |
| 25 to 34 Years | 11,035 (23.5%) | 32,007 (68.0%) |
| 35 to 44 Years | 9,034 (17.9%) | 38,441 (76.4%) |
| 45 to 54 Years | 8,608 (16.0%) | 43,486 (80.7%) |
| 55 to 64 Years | 11,508 (19.7%) | 46,725 (79.9%) |
| 65 to 74 Years | 40,168 (94.2%) | 24,371 (57.2%) |
| 75 Years and over | 30,150 (99.0%) | 21,089 (69.3%) |
| Total | 160,657 (37.9%) | 296,252 (69.8%) |
Disability Status by Sex by Age in Berks County
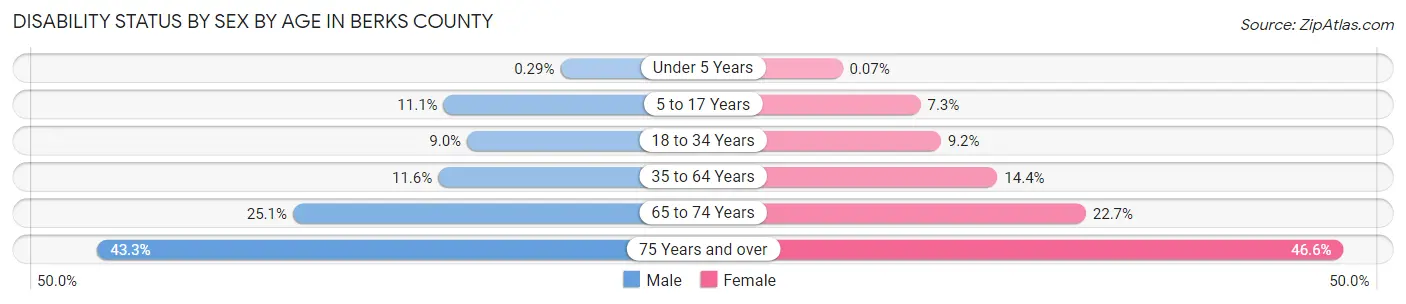
| Age Bracket | Male | Female |
| Under 5 Years | 35 (0.3%) | 8 (0.1%) |
| 5 to 17 Years | 4,041 (11.1%) | 2,517 (7.3%) |
| 18 to 34 Years | 4,267 (8.9%) | 4,260 (9.2%) |
| 35 to 64 Years | 9,456 (11.6%) | 11,760 (14.4%) |
| 65 to 74 Years | 5,162 (25.1%) | 5,000 (22.7%) |
| 75 Years and over | 5,380 (43.2%) | 8,385 (46.6%) |
Disability Class by Sex by Age in Berks County
Disability Class: Hearing Difficulty
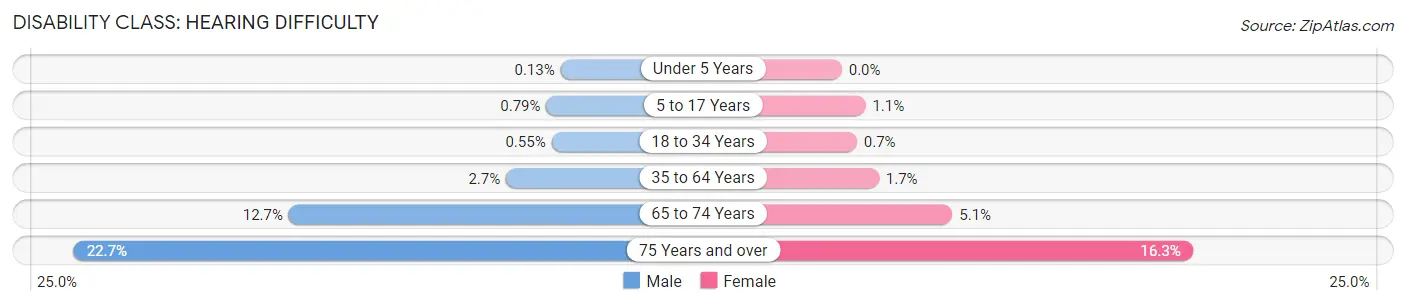
| Age Bracket | Male | Female |
| Under 5 Years | 16 (0.1%) | 0 (0.0%) |
| 5 to 17 Years | 288 (0.8%) | 379 (1.1%) |
| 18 to 34 Years | 263 (0.5%) | 323 (0.7%) |
| 35 to 64 Years | 2,163 (2.7%) | 1,405 (1.7%) |
| 65 to 74 Years | 2,618 (12.7%) | 1,132 (5.1%) |
| 75 Years and over | 2,826 (22.7%) | 2,932 (16.3%) |
Disability Class: Vision Difficulty
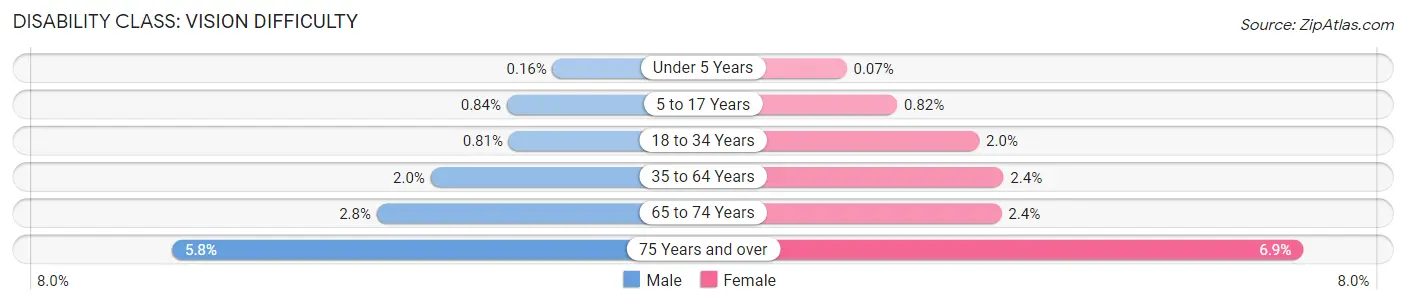
| Age Bracket | Male | Female |
| Under 5 Years | 19 (0.2%) | 8 (0.1%) |
| 5 to 17 Years | 306 (0.8%) | 281 (0.8%) |
| 18 to 34 Years | 386 (0.8%) | 943 (2.0%) |
| 35 to 64 Years | 1,604 (2.0%) | 1,955 (2.4%) |
| 65 to 74 Years | 569 (2.8%) | 524 (2.4%) |
| 75 Years and over | 723 (5.8%) | 1,234 (6.9%) |
Disability Class: Cognitive Difficulty
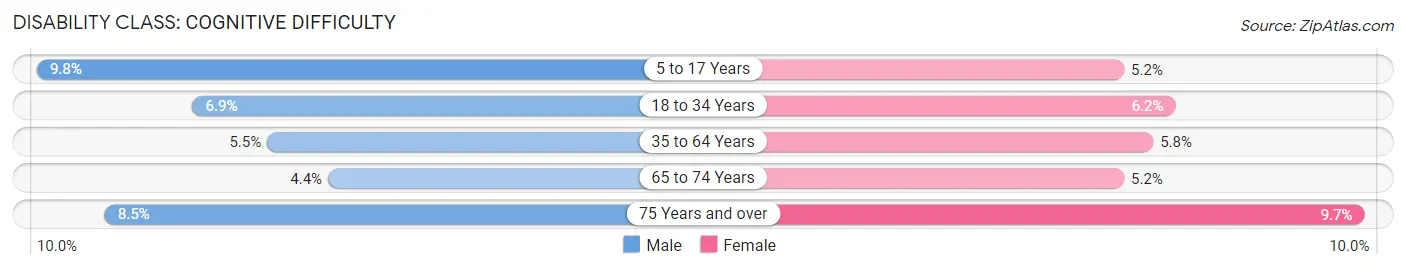
| Age Bracket | Male | Female |
| 5 to 17 Years | 3,548 (9.8%) | 1,803 (5.2%) |
| 18 to 34 Years | 3,279 (6.9%) | 2,870 (6.2%) |
| 35 to 64 Years | 4,471 (5.5%) | 4,712 (5.8%) |
| 65 to 74 Years | 899 (4.4%) | 1,157 (5.2%) |
| 75 Years and over | 1,058 (8.5%) | 1,748 (9.7%) |
Disability Class: Ambulatory Difficulty
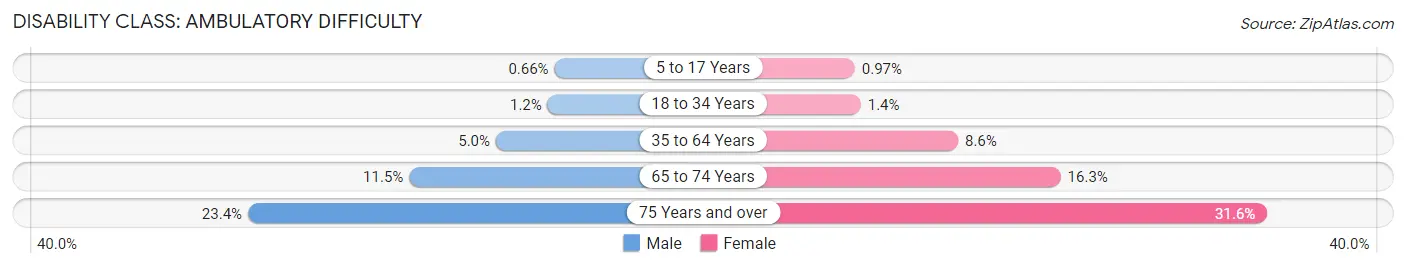
| Age Bracket | Male | Female |
| 5 to 17 Years | 241 (0.7%) | 335 (1.0%) |
| 18 to 34 Years | 558 (1.2%) | 651 (1.4%) |
| 35 to 64 Years | 4,075 (5.0%) | 7,031 (8.6%) |
| 65 to 74 Years | 2,354 (11.5%) | 3,587 (16.3%) |
| 75 Years and over | 2,913 (23.4%) | 5,688 (31.6%) |
Disability Class: Self-Care Difficulty
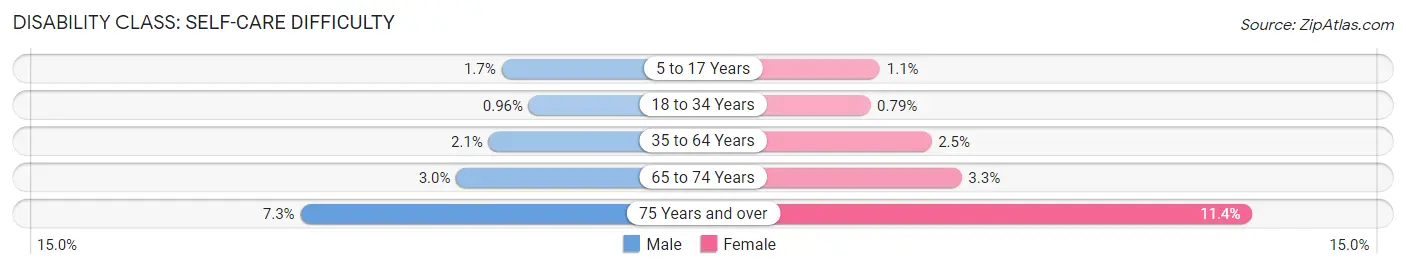
| Age Bracket | Male | Female |
| 5 to 17 Years | 625 (1.7%) | 365 (1.1%) |
| 18 to 34 Years | 460 (1.0%) | 366 (0.8%) |
| 35 to 64 Years | 1,688 (2.1%) | 2,028 (2.5%) |
| 65 to 74 Years | 612 (3.0%) | 736 (3.3%) |
| 75 Years and over | 910 (7.3%) | 2,059 (11.4%) |
Technology Access in Berks County
Computing Device Access in Berks County
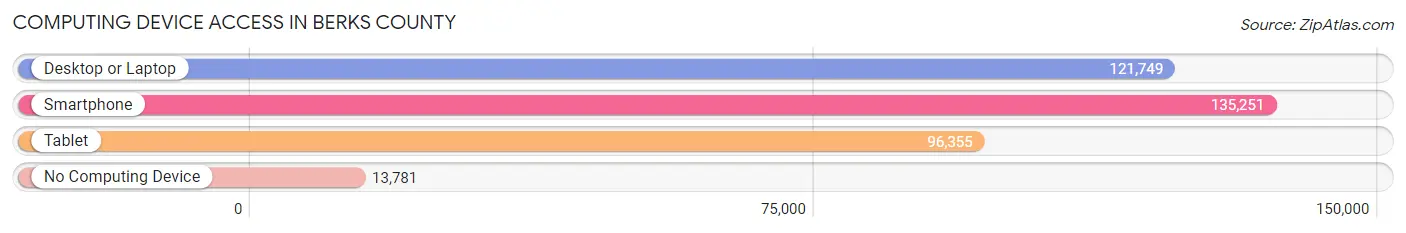
| Device Type | # Households | % Households |
| Desktop or Laptop | 121,749 | 75.5% |
| Smartphone | 135,251 | 83.9% |
| Tablet | 96,355 | 59.8% |
| No Computing Device | 13,781 | 8.6% |
| Total | 161,174 | 100.0% |
Internet Access in Berks County
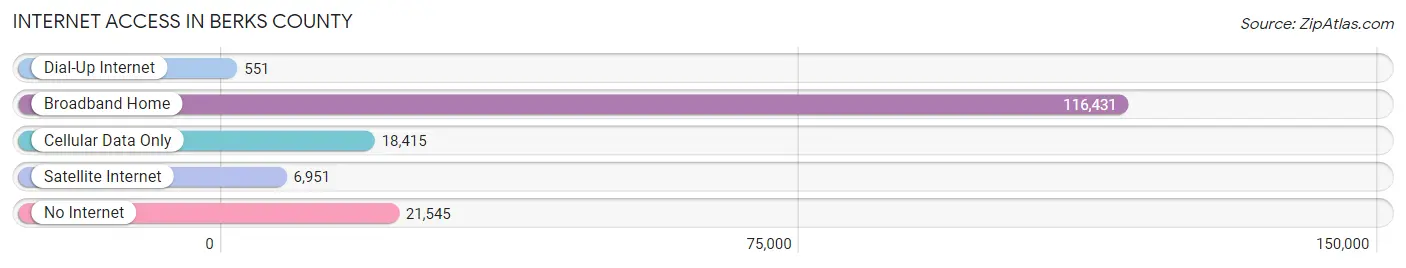
| Internet Type | # Households | % Households |
| Dial-Up Internet | 551 | 0.3% |
| Broadband Home | 116,431 | 72.2% |
| Cellular Data Only | 18,415 | 11.4% |
| Satellite Internet | 6,951 | 4.3% |
| No Internet | 21,545 | 13.4% |
| Total | 161,174 | 100.0% |
Berks County Summary
Berks County, Pennsylvania is located in the southeastern part of the state and is part of the Philadelphia metropolitan area. It is bordered by Montgomery County to the north, Lehigh County to the northeast, Bucks County to the east, Chester County to the south, and Lancaster County to the west. The county seat is Reading, and the county has a population of approximately 415,271 as of 2019.
Geography
Berks County is located in the southeastern part of Pennsylvania and is part of the Philadelphia metropolitan area. It is bordered by Montgomery County to the north, Lehigh County to the northeast, Bucks County to the east, Chester County to the south, and Lancaster County to the west. The county has a total area of 866 square miles, of which 860 square miles is land and 6.2 square miles is water. The county is divided into three distinct geographic regions: the Reading Prong, the Schuylkill River Valley, and the Piedmont Plateau.
The Reading Prong is a narrow strip of land that runs through the center of the county and is characterized by rolling hills and valleys. The Schuylkill River Valley is located in the eastern part of the county and is home to the city of Reading. The Piedmont Plateau is located in the western part of the county and is characterized by flat, rolling hills.
History
Berks County was established in 1752 and was named after the English county of Berkshire. The county was originally part of Philadelphia County and was part of the original land grant given to William Penn in 1681. The county was divided into three townships: Reading, Exeter, and Oley.
The county was an important center of the iron industry in the 19th century, and the county seat of Reading was an important railroad hub. The county was also home to several large farms, and the county was known for its production of dairy products.
In the 20th century, the county experienced a period of rapid growth and development. The population of the county increased from approximately 200,000 in 1950 to over 400,000 in 2019. The county also experienced an influx of immigrants from Latin America and Asia, and the county is now home to a diverse population.
Economy
Berks County has a diverse economy that is driven by manufacturing, healthcare, education, and tourism. The county is home to several large manufacturing companies, including Carpenter Technology Corporation, Reading Truck Body, and W.L. Gore & Associates. The county is also home to several healthcare providers, including Reading Hospital, St. Joseph Medical Center, and Tower Health.
The county is also home to several educational institutions, including Albright College, Kutztown University, and Penn State Berks. The county is also home to several tourist attractions, including the Reading Public Museum, the Reading Phillies baseball team, and the Reading Fightin Phils minor league baseball team.
Demographics
As of 2019, the population of Berks County was estimated to be 415,271. The population is composed of a diverse mix of ethnicities, including White (77.2%), Hispanic or Latino (14.2%), Black or African American (4.7%), Asian (2.7%), and other (1.2%). The median household income in the county is $60,945, and the median age is 40.3 years.
Berks County is home to a large number of immigrants, with approximately 11.3% of the population being foreign-born. The largest immigrant groups in the county are from Mexico (4.2%), India (2.2%), and China (1.7%).
Conclusion
Berks County, Pennsylvania is a diverse and vibrant county located in the southeastern part of the state. The county has a rich history and a diverse economy that is driven by manufacturing, healthcare, education, and tourism. The county is home to a diverse population, with a mix of ethnicities and a large number of immigrants. The county is an important part of the Philadelphia metropolitan area and is an important contributor to the state’s economy.
Common Questions
What is Per Capita Income in Berks County?
Per Capita income in Berks County is $37,776.
What is the Median Family Income in Berks County?
Median Family Income in Berks County is $92,726.
What is the Median Household income in Berks County?
Median Household Income in Berks County is $74,617.
What is Income or Wage Gap in Berks County?
Income or Wage Gap in Berks County is 33.7%.
Women in Berks County earn 66.3 cents for every dollar earned by a man.
What is Family Income Deficit in Berks County?
Family Income Deficit in Berks County is $11,208.
Families that are below poverty line in Berks County earn $11,208 less on average than the poverty threshold level.
What is Inequality or Gini Index in Berks County?
Inequality or Gini Index in Berks County is 0.45.
What is the Total Population of Berks County?
Total Population of Berks County is 428,483.
What is the Total Male Population of Berks County?
Total Male Population of Berks County is 212,820.
What is the Total Female Population of Berks County?
Total Female Population of Berks County is 215,663.
What is the Ratio of Males per 100 Females in Berks County?
There are 98.68 Males per 100 Females in Berks County.
What is the Ratio of Females per 100 Males in Berks County?
There are 101.34 Females per 100 Males in Berks County.
What is the Median Population Age in Berks County?
Median Population Age in Berks County is 39.9 Years.
What is the Average Family Size in Berks County
Average Family Size in Berks County is 3.1 People.
What is the Average Household Size in Berks County
Average Household Size in Berks County is 2.6 People.
How Large is the Labor Force in Berks County?
There are 223,782 People in the Labor Forcein in Berks County.
What is the Percentage of People in the Labor Force in Berks County?
64.8% of People are in the Labor Force in Berks County.
What is the Unemployment Rate in Berks County?
Unemployment Rate in Berks County is 5.4%.