Beaver County, PA Map & Demographics
Beaver County Map
Beaver County Overview
$37,649
PER CAPITA INCOME
$86,197
AVG FAMILY INCOME
$67,194
AVG HOUSEHOLD INCOME
31.0%
WAGE / INCOME GAP [ % ]
69.0¢/ $1
WAGE / INCOME GAP [ $ ]
$12,172
FAMILY INCOME DEFICIT
0.44
INEQUALITY / GINI INDEX
167,629
TOTAL POPULATION
82,169
MALE POPULATION
85,460
FEMALE POPULATION
96.15
MALES / 100 FEMALES
104.01
FEMALES / 100 MALES
44.9
MEDIAN AGE
2.9
AVG FAMILY SIZE
2.3
AVG HOUSEHOLD SIZE
85,208
LABOR FORCE [ PEOPLE ]
61.2%
PERCENT IN LABOR FORCE
5.6%
UNEMPLOYMENT RATE
Income in Beaver County
Income Overview in Beaver County
Per Capita Income in Beaver County is $37,649, while median incomes of families and households are $86,197 and $67,194 respectively.
| Characteristic | Number | Measure |
| Per Capita Income | 167,629 | $37,649 |
| Median Family Income | 45,103 | $86,197 |
| Mean Family Income | 45,103 | $104,997 |
| Median Household Income | 71,999 | $67,194 |
| Mean Household Income | 71,999 | $85,850 |
| Income Deficit | 45,103 | $12,172 |
| Wage / Income Gap (%) | 167,629 | 30.99% |
| Wage / Income Gap ($) | 167,629 | 69.01¢ per $1 |
| Gini / Inequality Index | 167,629 | 0.44 |
Earnings by Sex in Beaver County
Average Earnings in Beaver County are $41,950, $50,738 for men and $35,016 for women, a difference of 31.0%.
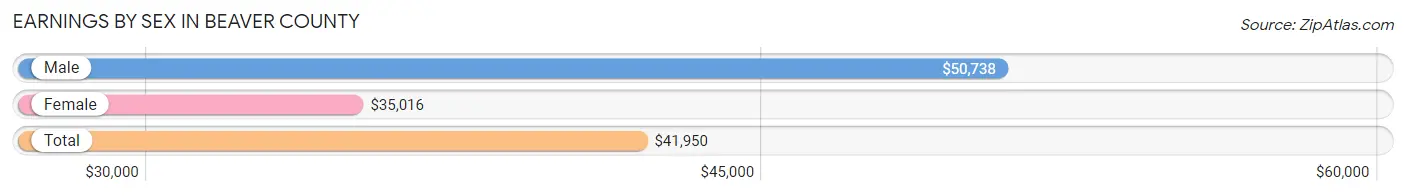
| Sex | Number | Average Earnings |
| Male | 46,633 (52.5%) | $50,738 |
| Female | 42,144 (47.5%) | $35,016 |
| Total | 88,777 (100.0%) | $41,950 |
Earnings by Sex by Income Bracket in Beaver County
The most common earnings brackets in Beaver County are $100,000+ for men (7,124 | 15.3%) and $75,000 to $99,999 for women (3,523 | 8.4%).
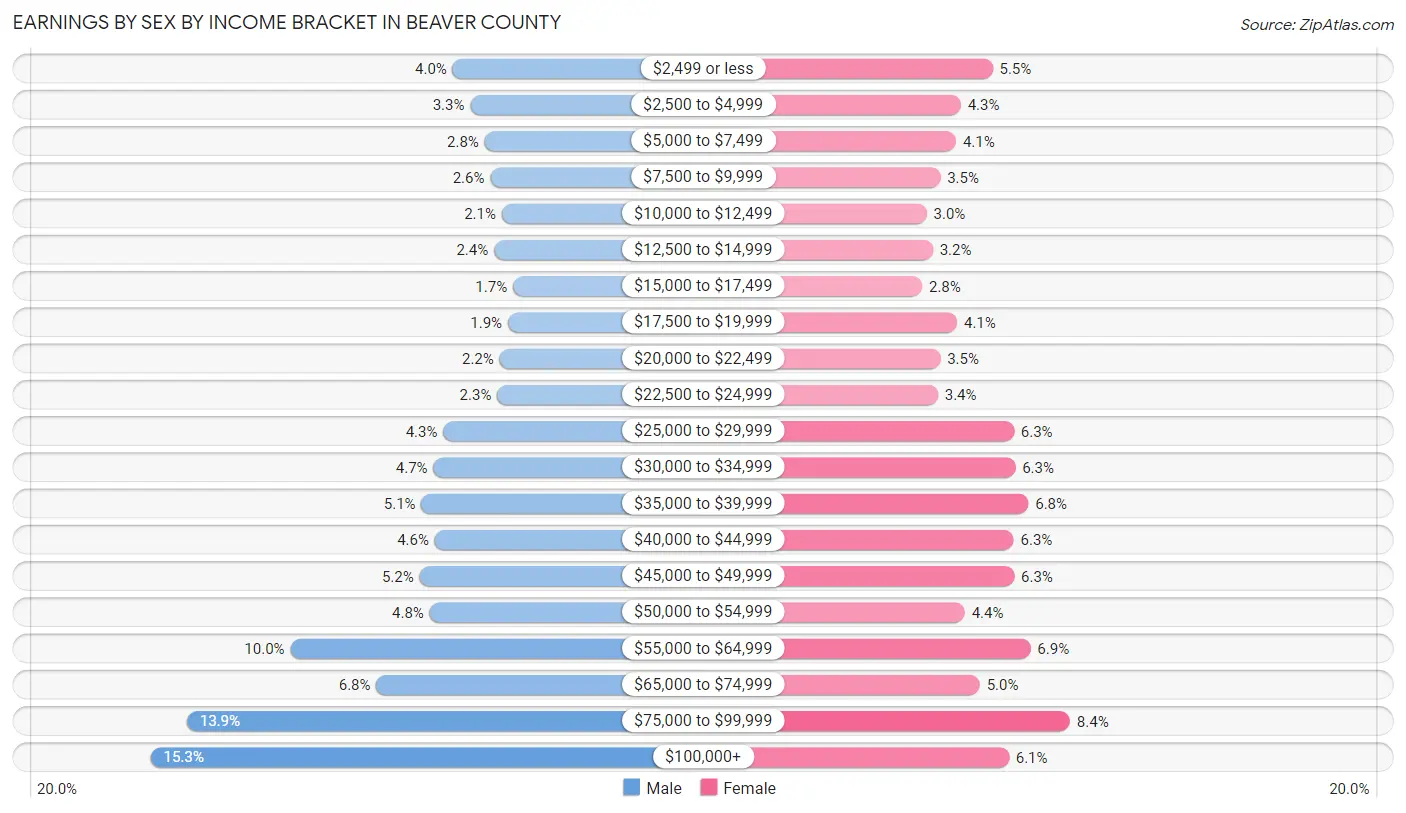
| Income | Male | Female |
| $2,499 or less | 1,848 (4.0%) | 2,302 (5.5%) |
| $2,500 to $4,999 | 1,539 (3.3%) | 1,800 (4.3%) |
| $5,000 to $7,499 | 1,288 (2.8%) | 1,725 (4.1%) |
| $7,500 to $9,999 | 1,188 (2.5%) | 1,475 (3.5%) |
| $10,000 to $12,499 | 989 (2.1%) | 1,262 (3.0%) |
| $12,500 to $14,999 | 1,122 (2.4%) | 1,357 (3.2%) |
| $15,000 to $17,499 | 792 (1.7%) | 1,190 (2.8%) |
| $17,500 to $19,999 | 881 (1.9%) | 1,742 (4.1%) |
| $20,000 to $22,499 | 1,028 (2.2%) | 1,474 (3.5%) |
| $22,500 to $24,999 | 1,067 (2.3%) | 1,436 (3.4%) |
| $25,000 to $29,999 | 2,009 (4.3%) | 2,637 (6.3%) |
| $30,000 to $34,999 | 2,181 (4.7%) | 2,661 (6.3%) |
| $35,000 to $39,999 | 2,390 (5.1%) | 2,866 (6.8%) |
| $40,000 to $44,999 | 2,158 (4.6%) | 2,633 (6.2%) |
| $45,000 to $49,999 | 2,427 (5.2%) | 2,642 (6.3%) |
| $50,000 to $54,999 | 2,249 (4.8%) | 1,864 (4.4%) |
| $55,000 to $64,999 | 4,681 (10.0%) | 2,899 (6.9%) |
| $65,000 to $74,999 | 3,179 (6.8%) | 2,097 (5.0%) |
| $75,000 to $99,999 | 6,493 (13.9%) | 3,523 (8.4%) |
| $100,000+ | 7,124 (15.3%) | 2,559 (6.1%) |
| Total | 46,633 (100.0%) | 42,144 (100.0%) |
Earnings by Sex by Educational Attainment in Beaver County
Average earnings in Beaver County are $56,075 for men and $38,967 for women, a difference of 30.5%. Men with an educational attainment of graduate degree enjoy the highest average annual earnings of $84,876, while those with less than high school education earn the least with $37,675. Women with an educational attainment of graduate degree earn the most with the average annual earnings of $73,550, while those with less than high school education have the smallest earnings of $21,250.
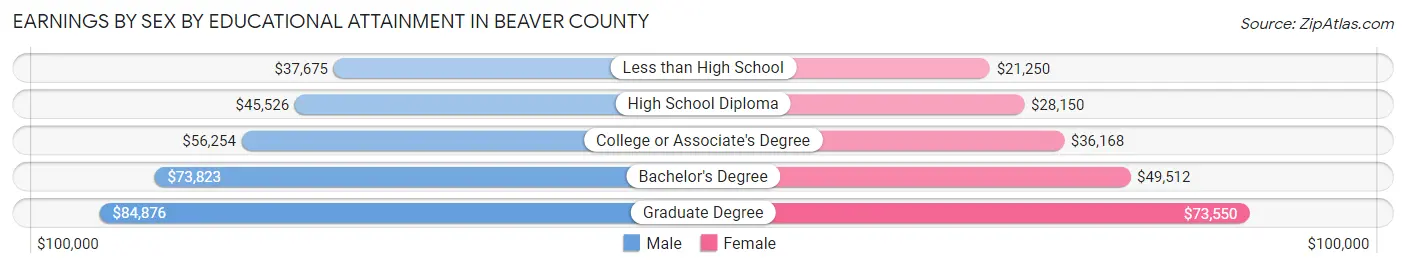
| Educational Attainment | Male Income | Female Income |
| Less than High School | $37,675 | $21,250 |
| High School Diploma | $45,526 | $28,150 |
| College or Associate's Degree | $56,254 | $36,168 |
| Bachelor's Degree | $73,823 | $49,512 |
| Graduate Degree | $84,876 | $73,550 |
| Total | $56,075 | $38,967 |
Family Income in Beaver County
Family Income Brackets in Beaver County
According to the Beaver County family income data, there are 10,148 families falling into the $100,000 to $149,999 income range, which is the most common income bracket and makes up 22.5% of all families. Conversely, the $10,000 to $14,999 income bracket is the least frequent group with only 451 families (1.0%) belonging to this category.
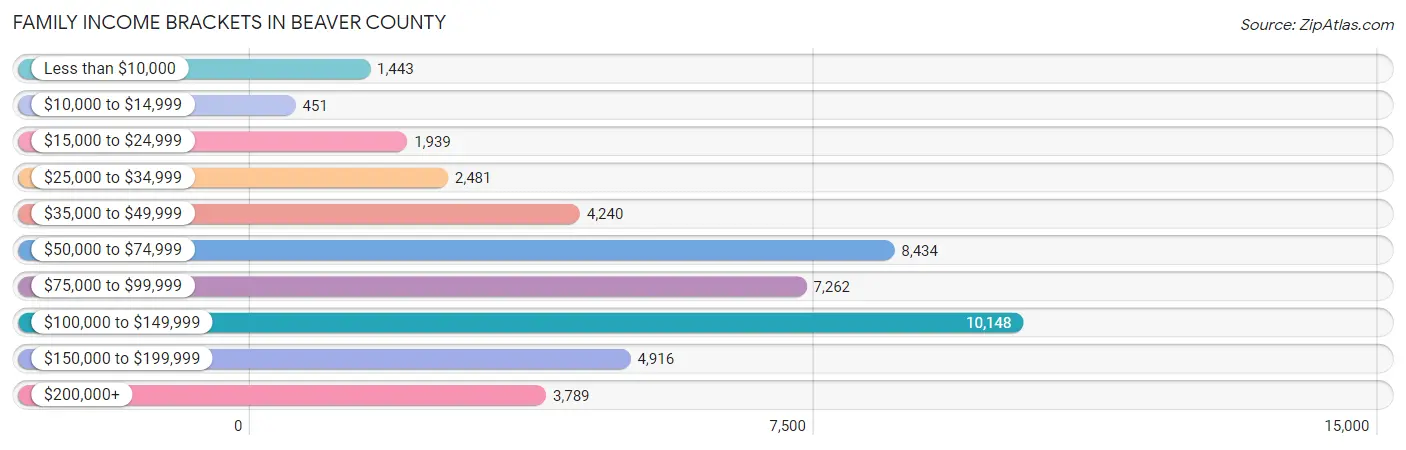
| Income Bracket | # Families | % Families |
| Less than $10,000 | 1,443 | 3.2% |
| $10,000 to $14,999 | 451 | 1.0% |
| $15,000 to $24,999 | 1,939 | 4.3% |
| $25,000 to $34,999 | 2,481 | 5.5% |
| $35,000 to $49,999 | 4,240 | 9.4% |
| $50,000 to $74,999 | 8,434 | 18.7% |
| $75,000 to $99,999 | 7,262 | 16.1% |
| $100,000 to $149,999 | 10,148 | 22.5% |
| $150,000 to $199,999 | 4,916 | 10.9% |
| $200,000+ | 3,789 | 8.4% |
Family Income by Famaliy Size in Beaver County
6-person families (775 | 1.7%) account for the highest median family income in Beaver County with $132,969 per family, while 2-person families (24,145 | 53.5%) have the highest median income of $36,970 per family member.
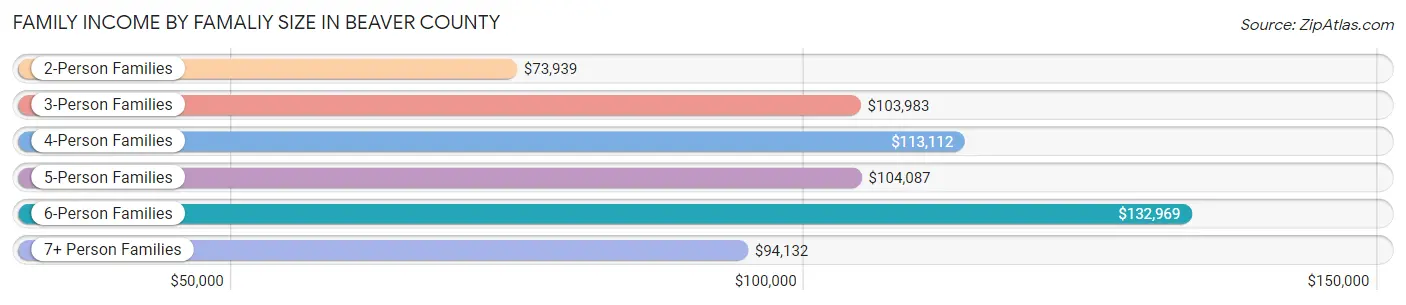
| Income Bracket | # Families | Median Income |
| 2-Person Families | 24,145 (53.5%) | $73,939 |
| 3-Person Families | 9,744 (21.6%) | $103,983 |
| 4-Person Families | 7,251 (16.1%) | $113,112 |
| 5-Person Families | 2,889 (6.4%) | $104,087 |
| 6-Person Families | 775 (1.7%) | $132,969 |
| 7+ Person Families | 299 (0.7%) | $94,132 |
| Total | 45,103 (100.0%) | $86,197 |
Family Income by Number of Earners in Beaver County
The median family income in Beaver County is $86,197, with families comprising 3+ earners (4,935) having the highest median family income of $142,743, while families with no earners (8,397) have the lowest median family income of $48,982, accounting for 10.9% and 18.6% of families, respectively.
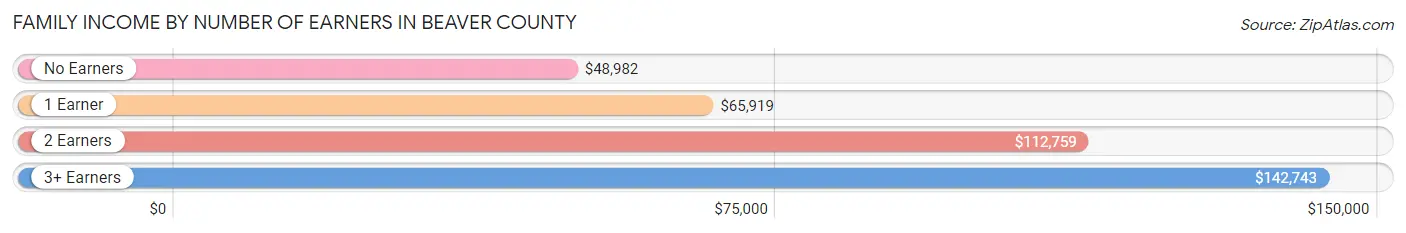
| Number of Earners | # Families | Median Income |
| No Earners | 8,397 (18.6%) | $48,982 |
| 1 Earner | 14,028 (31.1%) | $65,919 |
| 2 Earners | 17,743 (39.3%) | $112,759 |
| 3+ Earners | 4,935 (10.9%) | $142,743 |
| Total | 45,103 (100.0%) | $86,197 |
Household Income in Beaver County
Household Income Brackets in Beaver County
With 12,816 households falling in the category, the $50,000 to $74,999 income range is the most frequent in Beaver County, accounting for 17.8% of all households. In contrast, only 2,736 households (3.8%) fall into the $10,000 to $14,999 income bracket, making it the least populous group.
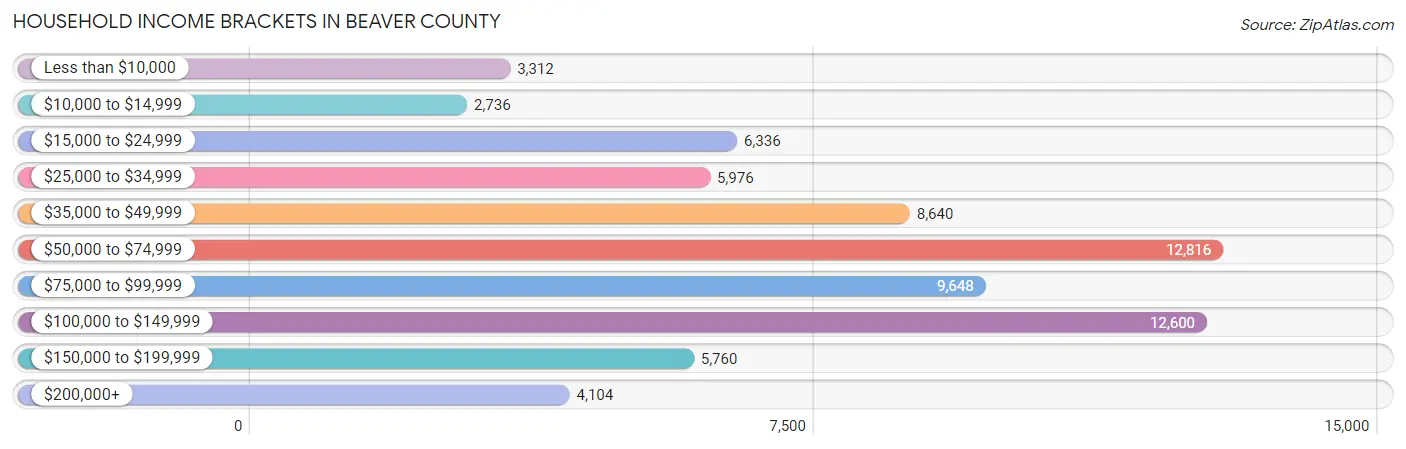
| Income Bracket | # Households | % Households |
| Less than $10,000 | 3,312 | 4.6% |
| $10,000 to $14,999 | 2,736 | 3.8% |
| $15,000 to $24,999 | 6,336 | 8.8% |
| $25,000 to $34,999 | 5,976 | 8.3% |
| $35,000 to $49,999 | 8,640 | 12.0% |
| $50,000 to $74,999 | 12,816 | 17.8% |
| $75,000 to $99,999 | 9,648 | 13.4% |
| $100,000 to $149,999 | 12,600 | 17.5% |
| $150,000 to $199,999 | 5,760 | 8.0% |
| $200,000+ | 4,104 | 5.7% |
Household Income by Householder Age in Beaver County
The median household income in Beaver County is $67,194, with the highest median household income of $83,651 found in the 45 to 64 years age bracket for the primary householder. A total of 27,310 households (37.9%) fall into this category. Meanwhile, the 15 to 24 years age bracket for the primary householder has the lowest median household income of $34,490, with 1,972 households (2.7%) in this group.
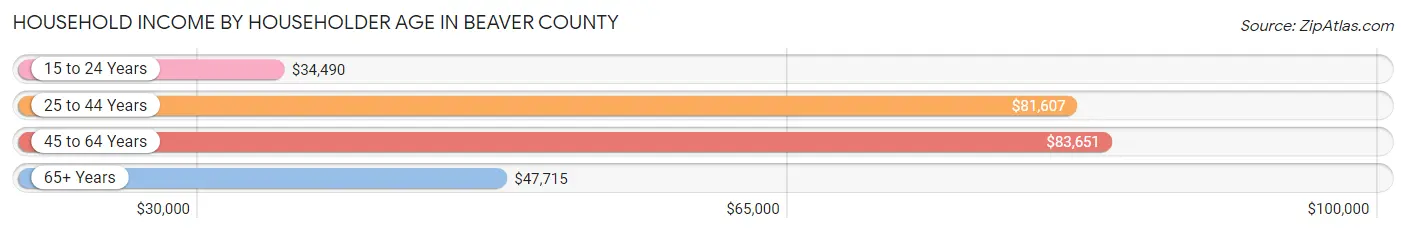
| Income Bracket | # Households | Median Income |
| 15 to 24 Years | 1,972 (2.7%) | $34,490 |
| 25 to 44 Years | 18,782 (26.1%) | $81,607 |
| 45 to 64 Years | 27,310 (37.9%) | $83,651 |
| 65+ Years | 23,935 (33.2%) | $47,715 |
| Total | 71,999 (100.0%) | $67,194 |
Poverty in Beaver County
Income Below Poverty by Sex and Age in Beaver County
With 9.2% poverty level for males and 11.7% for females among the residents of Beaver County, 5 year old males and under 5 year old females are the most vulnerable to poverty, with 218 males (28.3%) and 858 females (22.1%) in their respective age groups living below the poverty level.
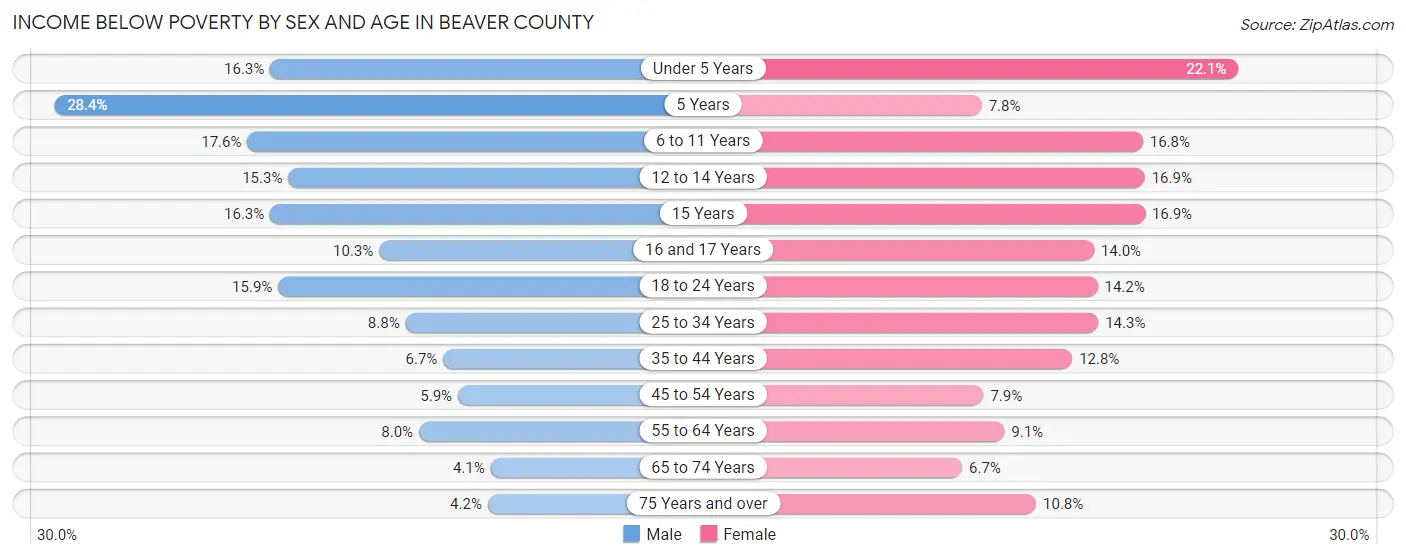
| Age Bracket | Male | Female |
| Under 5 Years | 681 (16.3%) | 858 (22.1%) |
| 5 Years | 218 (28.3%) | 88 (7.8%) |
| 6 to 11 Years | 1,043 (17.6%) | 862 (16.8%) |
| 12 to 14 Years | 376 (15.3%) | 431 (16.9%) |
| 15 Years | 146 (16.3%) | 161 (16.9%) |
| 16 and 17 Years | 212 (10.3%) | 271 (14.0%) |
| 18 to 24 Years | 917 (15.9%) | 748 (14.2%) |
| 25 to 34 Years | 869 (8.8%) | 1,369 (14.3%) |
| 35 to 44 Years | 677 (6.7%) | 1,247 (12.8%) |
| 45 to 54 Years | 587 (5.9%) | 809 (7.9%) |
| 55 to 64 Years | 1,031 (8.0%) | 1,216 (9.0%) |
| 65 to 74 Years | 406 (4.1%) | 742 (6.7%) |
| 75 Years and over | 247 (4.2%) | 989 (10.8%) |
| Total | 7,410 (9.2%) | 9,791 (11.7%) |
Income Above Poverty by Sex and Age in Beaver County
According to the poverty statistics in Beaver County, males aged 65 to 74 years and females aged 65 to 74 years are the age groups that are most secure financially, with 96.0% of males and 93.3% of females in these age groups living above the poverty line.
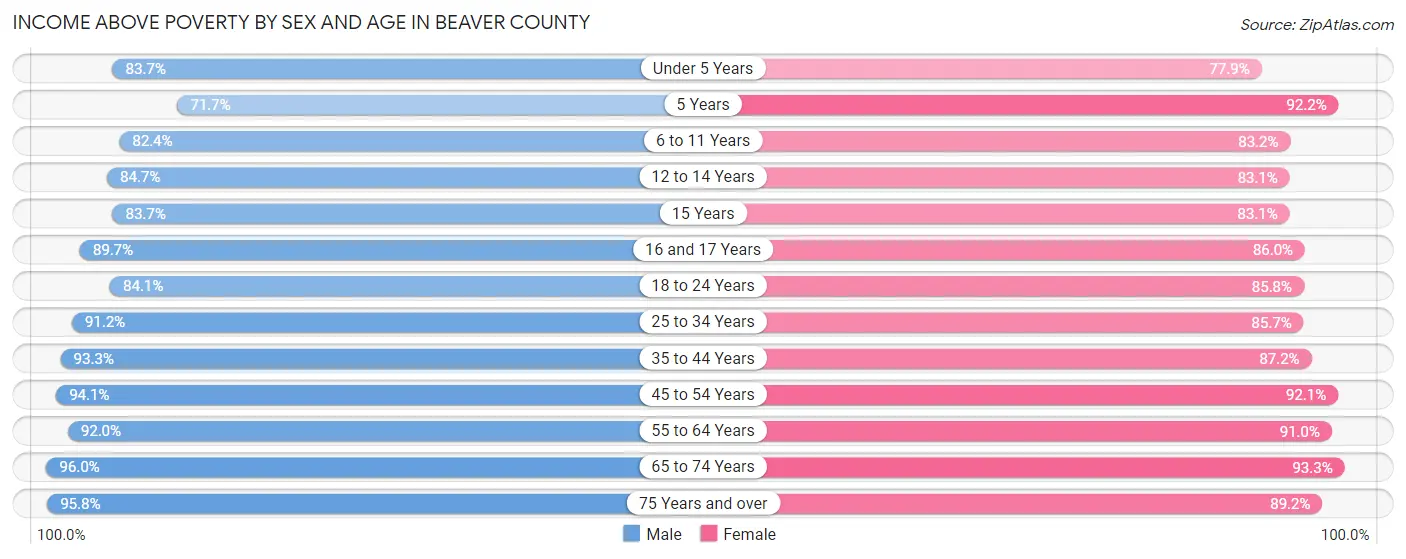
| Age Bracket | Male | Female |
| Under 5 Years | 3,488 (83.7%) | 3,028 (77.9%) |
| 5 Years | 551 (71.7%) | 1,042 (92.2%) |
| 6 to 11 Years | 4,884 (82.4%) | 4,280 (83.2%) |
| 12 to 14 Years | 2,078 (84.7%) | 2,124 (83.1%) |
| 15 Years | 748 (83.7%) | 793 (83.1%) |
| 16 and 17 Years | 1,854 (89.7%) | 1,659 (86.0%) |
| 18 to 24 Years | 4,859 (84.1%) | 4,504 (85.8%) |
| 25 to 34 Years | 9,018 (91.2%) | 8,221 (85.7%) |
| 35 to 44 Years | 9,437 (93.3%) | 8,469 (87.2%) |
| 45 to 54 Years | 9,418 (94.1%) | 9,446 (92.1%) |
| 55 to 64 Years | 11,798 (92.0%) | 12,226 (90.9%) |
| 65 to 74 Years | 9,620 (96.0%) | 10,338 (93.3%) |
| 75 Years and over | 5,617 (95.8%) | 8,155 (89.2%) |
| Total | 73,370 (90.8%) | 74,285 (88.3%) |
Income Below Poverty Among Married-Couple Families in Beaver County
The poverty statistics for married-couple families in Beaver County show that 2.7% or 933 of the total 34,028 families live below the poverty line. Families with 3 or 4 children have the highest poverty rate of 8.8%, comprising of 168 families. On the other hand, families with no children have the lowest poverty rate of 2.1%, which includes 482 families.
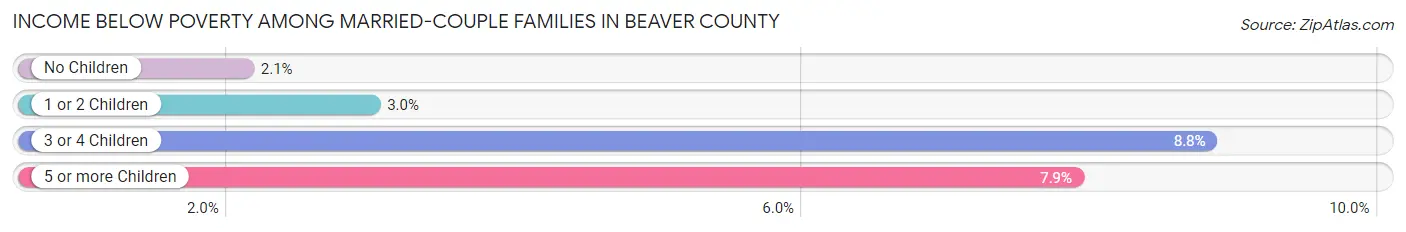
| Children | Above Poverty | Below Poverty |
| No Children | 22,360 (97.9%) | 482 (2.1%) |
| 1 or 2 Children | 8,893 (97.0%) | 274 (3.0%) |
| 3 or 4 Children | 1,737 (91.2%) | 168 (8.8%) |
| 5 or more Children | 105 (92.1%) | 9 (7.9%) |
| Total | 33,095 (97.3%) | 933 (2.7%) |
Income Below Poverty Among Single-Parent Households in Beaver County
According to the poverty data in Beaver County, 12.4% or 369 single-father households and 22.3% or 1,805 single-mother households are living below the poverty line. Among single-father households, those with 3 or 4 children have the highest poverty rate, with 88 households (53.3%) experiencing poverty. Likewise, among single-mother households, those with 5 or more children have the highest poverty rate, with 73 households (100.0%) falling below the poverty line.
| Children | Single Father | Single Mother |
| No Children | 19 (1.3%) | 136 (4.2%) |
| 1 or 2 Children | 262 (19.3%) | 1,161 (29.4%) |
| 3 or 4 Children | 88 (53.3%) | 435 (53.2%) |
| 5 or more Children | 0 (0.0%) | 73 (100.0%) |
| Total | 369 (12.4%) | 1,805 (22.3%) |
Income Below Poverty Among Married-Couple vs Single-Parent Households in Beaver County
The poverty data for Beaver County shows that 933 of the married-couple family households (2.7%) and 2,174 of the single-parent households (19.6%) are living below the poverty level. Within the married-couple family households, those with 3 or 4 children have the highest poverty rate, with 168 households (8.8%) falling below the poverty line. Among the single-parent households, those with 5 or more children have the highest poverty rate, with 73 household (100.0%) living below poverty.
| Children | Married-Couple Families | Single-Parent Households |
| No Children | 482 (2.1%) | 155 (3.3%) |
| 1 or 2 Children | 274 (3.0%) | 1,423 (26.8%) |
| 3 or 4 Children | 168 (8.8%) | 523 (53.2%) |
| 5 or more Children | 9 (7.9%) | 73 (100.0%) |
| Total | 933 (2.7%) | 2,174 (19.6%) |
Race in Beaver County
The most populous races in Beaver County are White / Caucasian (148,540 | 88.6%), Black / African American (10,127 | 6.0%), and Two or more Races (6,834 | 4.1%).
| Race | # Population | % Population |
| Asian | 839 | 0.5% |
| Black / African American | 10,127 | 6.0% |
| Hawaiian / Pacific | 6 | 0.0% |
| Hispanic or Latino | 3,227 | 1.9% |
| Native / Alaskan | 127 | 0.1% |
| White / Caucasian | 148,540 | 88.6% |
| Two or more Races | 6,834 | 4.1% |
| Some other Race | 1,156 | 0.7% |
| Total | 167,629 | 100.0% |
Ancestry in Beaver County
The most populous ancestries reported in Beaver County are German (44,938 | 26.8%), Italian (27,671 | 16.5%), Irish (27,656 | 16.5%), English (16,204 | 9.7%), and Polish (11,168 | 6.7%), together accounting for 76.2% of all Beaver County residents.
| Ancestry | # Population | % Population |
| African | 269 | 0.2% |
| Albanian | 94 | 0.1% |
| American | 6,116 | 3.6% |
| Apache | 27 | 0.0% |
| Arab | 1,044 | 0.6% |
| Argentinean | 15 | 0.0% |
| Armenian | 116 | 0.1% |
| Australian | 81 | 0.1% |
| Austrian | 555 | 0.3% |
| Bahamian | 4 | 0.0% |
| Belgian | 268 | 0.2% |
| Bhutanese | 195 | 0.1% |
| Blackfeet | 65 | 0.0% |
| Brazilian | 21 | 0.0% |
| British | 535 | 0.3% |
| British West Indian | 33 | 0.0% |
| Burmese | 246 | 0.2% |
| Canadian | 60 | 0.0% |
| Carpatho Rusyn | 127 | 0.1% |
| Celtic | 26 | 0.0% |
| Central American | 336 | 0.2% |
| Central American Indian | 34 | 0.0% |
| Cherokee | 268 | 0.2% |
| Cheyenne | 3 | 0.0% |
| Chilean | 127 | 0.1% |
| Choctaw | 3 | 0.0% |
| Colombian | 21 | 0.0% |
| Comanche | 20 | 0.0% |
| Croatian | 4,033 | 2.4% |
| Crow | 4 | 0.0% |
| Cuban | 32 | 0.0% |
| Cypriot | 12 | 0.0% |
| Czech | 1,044 | 0.6% |
| Czechoslovakian | 473 | 0.3% |
| Danish | 214 | 0.1% |
| Delaware | 2 | 0.0% |
| Dominican | 149 | 0.1% |
| Dutch | 1,767 | 1.1% |
| Dutch West Indian | 8 | 0.0% |
| Eastern European | 560 | 0.3% |
| Ecuadorian | 53 | 0.0% |
| Egyptian | 33 | 0.0% |
| English | 16,204 | 9.7% |
| European | 1,473 | 0.9% |
| Filipino | 32 | 0.0% |
| Finnish | 86 | 0.1% |
| French | 2,340 | 1.4% |
| French American Indian | 7 | 0.0% |
| French Canadian | 279 | 0.2% |
| German | 44,938 | 26.8% |
| Greek | 1,390 | 0.8% |
| Guamanian / Chamorro | 13 | 0.0% |
| Guatemalan | 81 | 0.1% |
| Honduran | 85 | 0.1% |
| Hungarian | 2,048 | 1.2% |
| Icelander | 33 | 0.0% |
| Indian (Asian) | 507 | 0.3% |
| Irish | 27,656 | 16.5% |
| Iroquois | 24 | 0.0% |
| Italian | 27,671 | 16.5% |
| Jamaican | 48 | 0.0% |
| Kenyan | 14 | 0.0% |
| Korean | 307 | 0.2% |
| Laotian | 20 | 0.0% |
| Lebanese | 795 | 0.5% |
| Liberian | 16 | 0.0% |
| Lithuanian | 536 | 0.3% |
| Macedonian | 2 | 0.0% |
| Mexican | 1,028 | 0.6% |
| Mexican American Indian | 2 | 0.0% |
| Native Hawaiian | 114 | 0.1% |
| Navajo | 1 | 0.0% |
| Nigerian | 226 | 0.1% |
| Northern European | 150 | 0.1% |
| Norwegian | 400 | 0.2% |
| Pakistani | 16 | 0.0% |
| Panamanian | 28 | 0.0% |
| Pennsylvania German | 194 | 0.1% |
| Peruvian | 9 | 0.0% |
| Polish | 11,168 | 6.7% |
| Portuguese | 240 | 0.1% |
| Puerto Rican | 1,050 | 0.6% |
| Romanian | 238 | 0.1% |
| Russian | 1,427 | 0.9% |
| Salvadoran | 142 | 0.1% |
| Samoan | 20 | 0.0% |
| Scandinavian | 159 | 0.1% |
| Scotch-Irish | 3,473 | 2.1% |
| Scottish | 3,183 | 1.9% |
| Serbian | 2,536 | 1.5% |
| Sioux | 51 | 0.0% |
| Slavic | 275 | 0.2% |
| Slovak | 3,510 | 2.1% |
| Slovene | 296 | 0.2% |
| South African | 5 | 0.0% |
| South American | 256 | 0.2% |
| Spaniard | 98 | 0.1% |
| Spanish | 143 | 0.1% |
| Spanish American Indian | 5 | 0.0% |
| Sri Lankan | 54 | 0.0% |
| Subsaharan African | 576 | 0.3% |
| Swedish | 991 | 0.6% |
| Swiss | 254 | 0.2% |
| Syrian | 112 | 0.1% |
| Thai | 200 | 0.1% |
| Turkish | 62 | 0.0% |
| Ukrainian | 2,261 | 1.3% |
| Venezuelan | 31 | 0.0% |
| Vietnamese | 8 | 0.0% |
| Welsh | 2,070 | 1.2% |
| West Indian | 27 | 0.0% |
| Yugoslavian | 187 | 0.1% | View All 112 Rows |
Immigrants in Beaver County
The most numerous immigrant groups reported in Beaver County came from Europe (1,630 | 1.0%), Asia (733 | 0.4%), Latin America (730 | 0.4%), Southern Europe (604 | 0.4%), and Italy (453 | 0.3%), together accounting for 2.5% of all Beaver County residents.
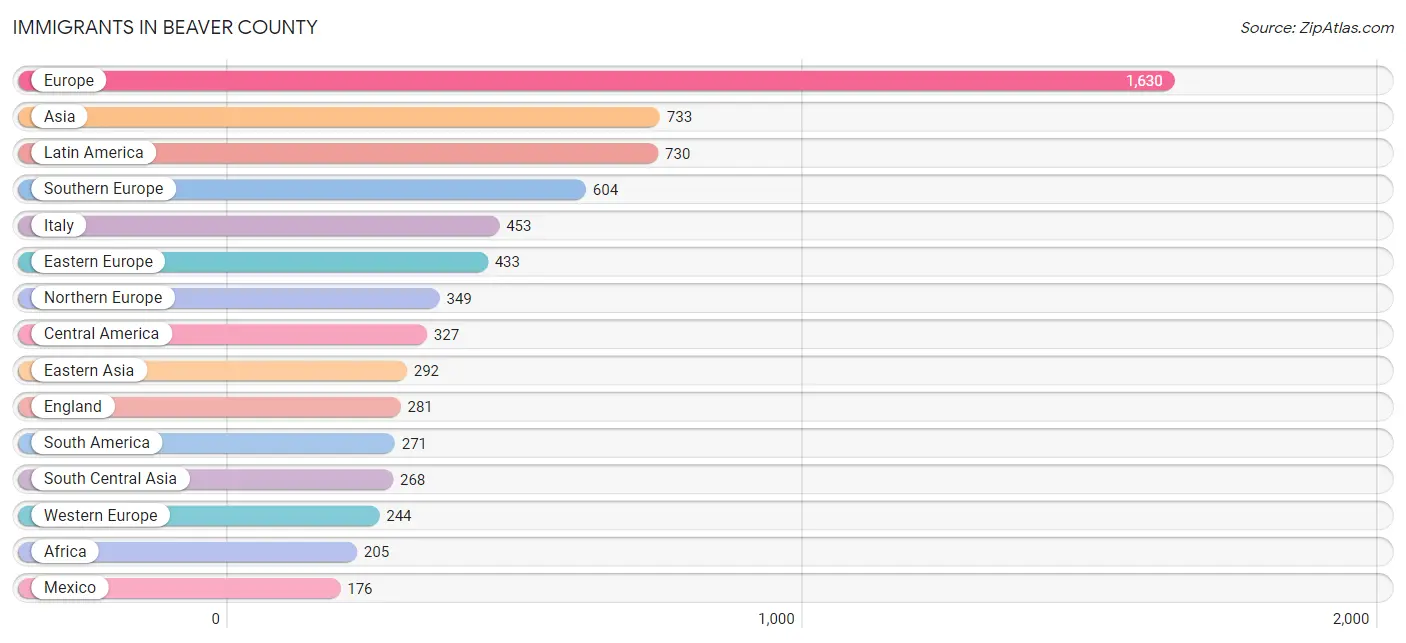
| Immigration Origin | # Population | % Population |
| Africa | 205 | 0.1% |
| Argentina | 15 | 0.0% |
| Asia | 733 | 0.4% |
| Australia | 78 | 0.1% |
| Austria | 10 | 0.0% |
| Belarus | 24 | 0.0% |
| Bosnia and Herzegovina | 8 | 0.0% |
| Brazil | 22 | 0.0% |
| Canada | 153 | 0.1% |
| Caribbean | 132 | 0.1% |
| Central America | 327 | 0.2% |
| Chile | 125 | 0.1% |
| China | 172 | 0.1% |
| Colombia | 76 | 0.1% |
| Croatia | 17 | 0.0% |
| Cuba | 2 | 0.0% |
| Czechoslovakia | 5 | 0.0% |
| Dominican Republic | 28 | 0.0% |
| Eastern Africa | 30 | 0.0% |
| Eastern Asia | 292 | 0.2% |
| Eastern Europe | 433 | 0.3% |
| Ecuador | 7 | 0.0% |
| Egypt | 44 | 0.0% |
| El Salvador | 96 | 0.1% |
| England | 281 | 0.2% |
| Europe | 1,630 | 1.0% |
| France | 37 | 0.0% |
| Germany | 167 | 0.1% |
| Greece | 151 | 0.1% |
| Guatemala | 55 | 0.0% |
| India | 153 | 0.1% |
| Indonesia | 4 | 0.0% |
| Israel | 13 | 0.0% |
| Italy | 453 | 0.3% |
| Jamaica | 36 | 0.0% |
| Japan | 66 | 0.0% |
| Kenya | 14 | 0.0% |
| Korea | 54 | 0.0% |
| Latin America | 730 | 0.4% |
| Liberia | 16 | 0.0% |
| Mexico | 176 | 0.1% |
| Middle Africa | 10 | 0.0% |
| Morocco | 5 | 0.0% |
| Netherlands | 30 | 0.0% |
| Nigeria | 28 | 0.0% |
| Northern Africa | 58 | 0.0% |
| Northern Europe | 349 | 0.2% |
| Oceania | 78 | 0.1% |
| Pakistan | 74 | 0.0% |
| Philippines | 30 | 0.0% |
| Poland | 31 | 0.0% |
| Romania | 47 | 0.0% |
| Russia | 159 | 0.1% |
| Scotland | 14 | 0.0% |
| South Africa | 27 | 0.0% |
| South America | 271 | 0.2% |
| South Central Asia | 268 | 0.2% |
| South Eastern Asia | 140 | 0.1% |
| Southern Europe | 604 | 0.4% |
| Sri Lanka | 18 | 0.0% |
| Taiwan | 17 | 0.0% |
| Thailand | 16 | 0.0% |
| Uganda | 16 | 0.0% |
| Ukraine | 116 | 0.1% |
| Venezuela | 26 | 0.0% |
| Vietnam | 90 | 0.1% |
| Western Africa | 80 | 0.1% |
| Western Asia | 21 | 0.0% |
| Western Europe | 244 | 0.2% |
| Zaire | 10 | 0.0% | View All 70 Rows |
Sex and Age in Beaver County
Sex and Age in Beaver County
The most populous age groups in Beaver County are 60 to 64 Years (6,744 | 8.2%) for men and 60 to 64 Years (7,210 | 8.4%) for women.
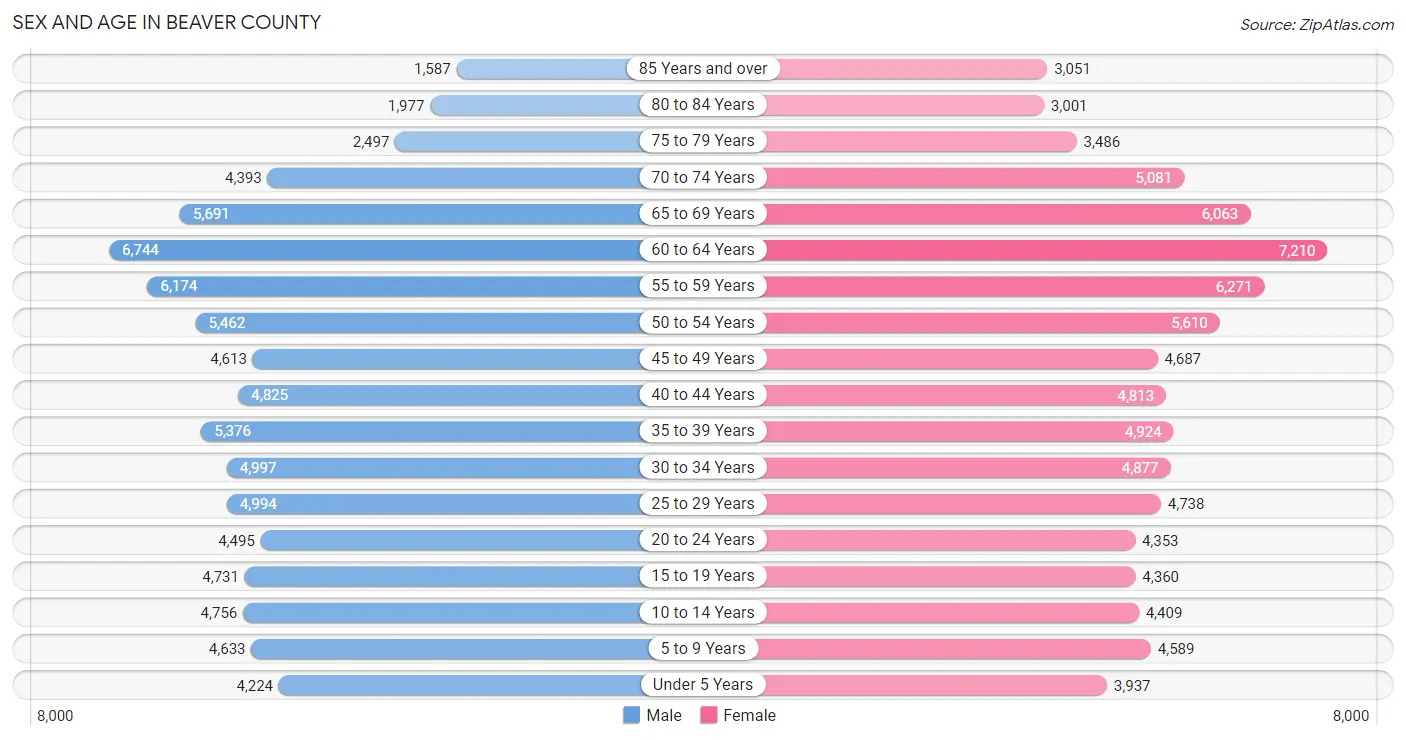
| Age Bracket | Male | Female |
| Under 5 Years | 4,224 (5.1%) | 3,937 (4.6%) |
| 5 to 9 Years | 4,633 (5.6%) | 4,589 (5.4%) |
| 10 to 14 Years | 4,756 (5.8%) | 4,409 (5.2%) |
| 15 to 19 Years | 4,731 (5.8%) | 4,360 (5.1%) |
| 20 to 24 Years | 4,495 (5.5%) | 4,353 (5.1%) |
| 25 to 29 Years | 4,994 (6.1%) | 4,738 (5.5%) |
| 30 to 34 Years | 4,997 (6.1%) | 4,877 (5.7%) |
| 35 to 39 Years | 5,376 (6.5%) | 4,924 (5.8%) |
| 40 to 44 Years | 4,825 (5.9%) | 4,813 (5.6%) |
| 45 to 49 Years | 4,613 (5.6%) | 4,687 (5.5%) |
| 50 to 54 Years | 5,462 (6.7%) | 5,610 (6.6%) |
| 55 to 59 Years | 6,174 (7.5%) | 6,271 (7.3%) |
| 60 to 64 Years | 6,744 (8.2%) | 7,210 (8.4%) |
| 65 to 69 Years | 5,691 (6.9%) | 6,063 (7.1%) |
| 70 to 74 Years | 4,393 (5.3%) | 5,081 (5.9%) |
| 75 to 79 Years | 2,497 (3.0%) | 3,486 (4.1%) |
| 80 to 84 Years | 1,977 (2.4%) | 3,001 (3.5%) |
| 85 Years and over | 1,587 (1.9%) | 3,051 (3.6%) |
| Total | 82,169 (100.0%) | 85,460 (100.0%) |
Families and Households in Beaver County
Median Family Size in Beaver County
The median family size in Beaver County is 2.88 persons per family, with married-couple families (34,028 | 75.4%) accounting for the largest median family size of 2.93 persons per family. On the other hand, single male/father families (2,975 | 6.6%) represent the smallest median family size with 2.69 persons per family.
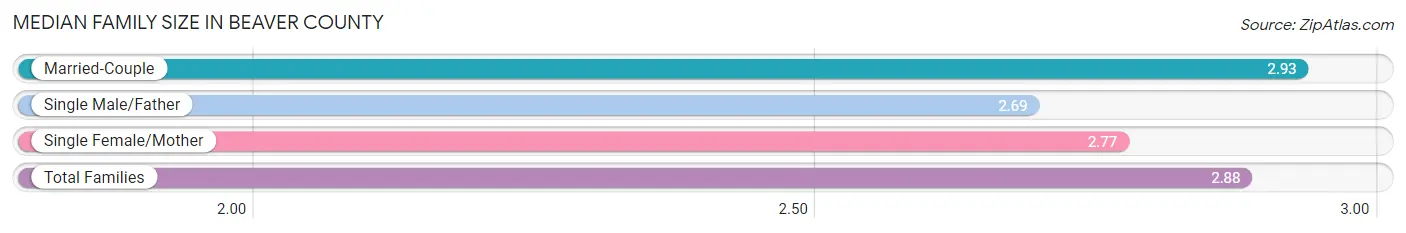
| Family Type | # Families | Family Size |
| Married-Couple | 34,028 (75.4%) | 2.93 |
| Single Male/Father | 2,975 (6.6%) | 2.69 |
| Single Female/Mother | 8,100 (18.0%) | 2.77 |
| Total Families | 45,103 (100.0%) | 2.88 |
Median Household Size in Beaver County
The median household size in Beaver County is 2.29 persons per household, with single male/father households (2,975 | 4.1%) accounting for the largest median household size of 3.06 persons per household. non-family households (26,896 | 37.4%) represent the smallest median household size with 1.16 persons per household.
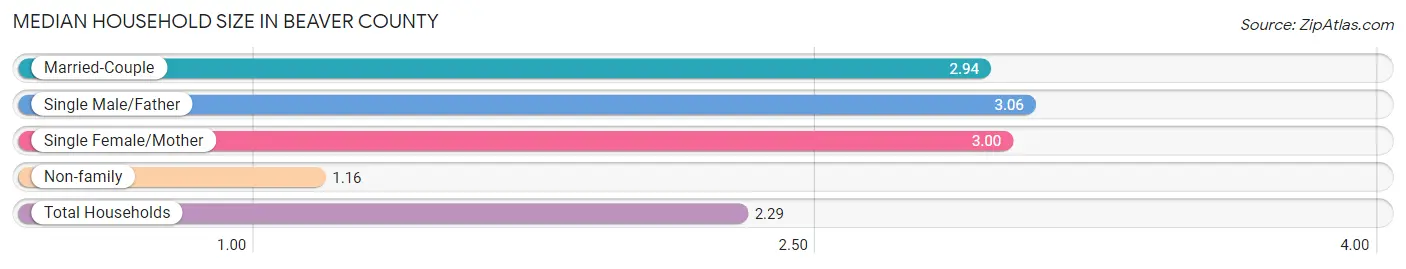
| Household Type | # Households | Household Size |
| Married-Couple | 34,028 (47.3%) | 2.94 |
| Single Male/Father | 2,975 (4.1%) | 3.06 |
| Single Female/Mother | 8,100 (11.3%) | 3.00 |
| Non-family | 26,896 (37.4%) | 1.16 |
| Total Households | 71,999 (100.0%) | 2.29 |
Household Size by Marriage Status in Beaver County
Out of a total of 71,999 households in Beaver County, 45,103 (62.6%) are family households, while 26,896 (37.4%) are nonfamily households. The most numerous type of family households are 2-person households, comprising 22,566, and the most common type of nonfamily households are 1-person households, comprising 23,244.
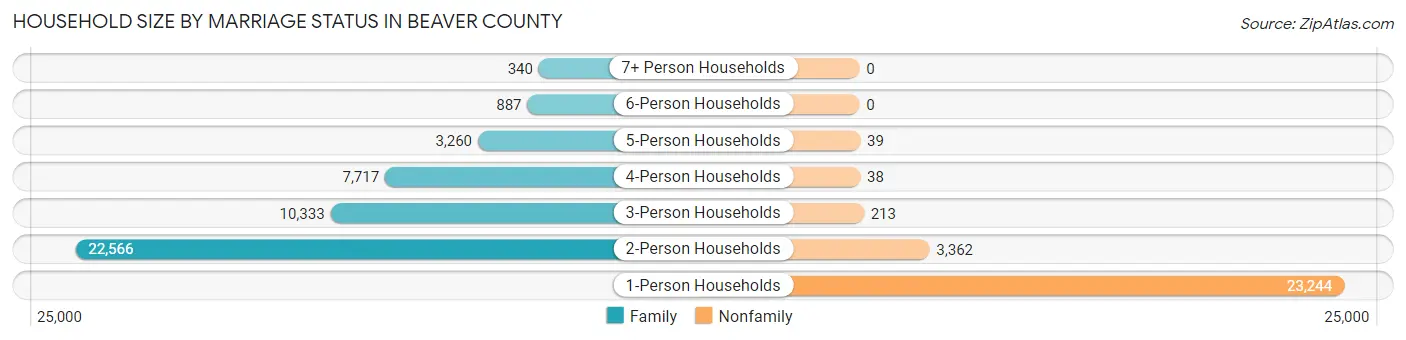
| Household Size | Family Households | Nonfamily Households |
| 1-Person Households | - | 23,244 (32.3%) |
| 2-Person Households | 22,566 (31.3%) | 3,362 (4.7%) |
| 3-Person Households | 10,333 (14.3%) | 213 (0.3%) |
| 4-Person Households | 7,717 (10.7%) | 38 (0.1%) |
| 5-Person Households | 3,260 (4.5%) | 39 (0.1%) |
| 6-Person Households | 887 (1.2%) | 0 (0.0%) |
| 7+ Person Households | 340 (0.5%) | 0 (0.0%) |
| Total | 45,103 (62.6%) | 26,896 (37.4%) |
Female Fertility in Beaver County
Fertility by Age in Beaver County
Average fertility rate in Beaver County is 49.0 births per 1,000 women. Women in the age bracket of 20 to 34 years have the highest fertility rate with 93.0 births per 1,000 women. Women in the age bracket of 20 to 34 years acount for 79.1% of all women with births.
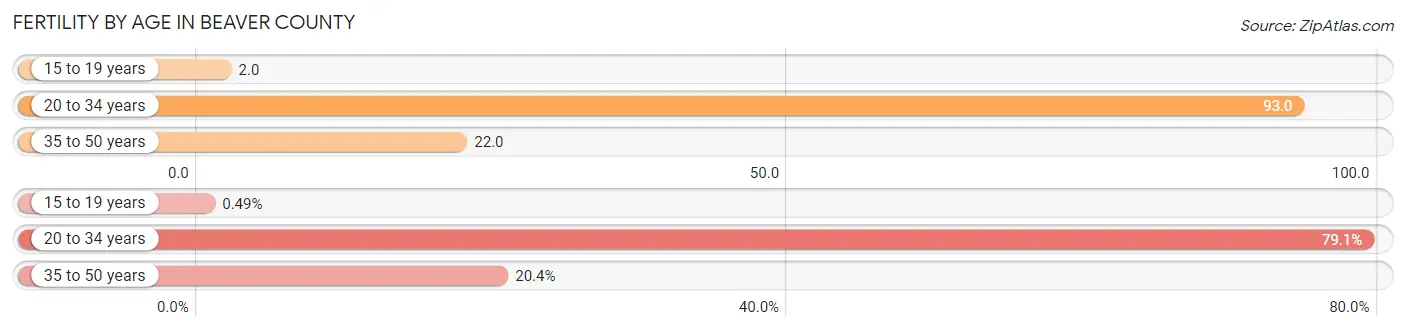
| Age Bracket | Women with Births | Births / 1,000 Women |
| 15 to 19 years | 8 (0.5%) | 2.0 |
| 20 to 34 years | 1,297 (79.1%) | 93.0 |
| 35 to 50 years | 334 (20.4%) | 22.0 |
| Total | 1,639 (100.0%) | 49.0 |
Fertility by Age by Marriage Status in Beaver County
66.7% of women with births (1,639) in Beaver County are married. The highest percentage of unmarried women with births falls into 15 to 19 years age bracket with 100.0% of them unmarried at the time of birth, while the lowest percentage of unmarried women with births belong to 35 to 50 years age bracket with 10.5% of them unmarried.
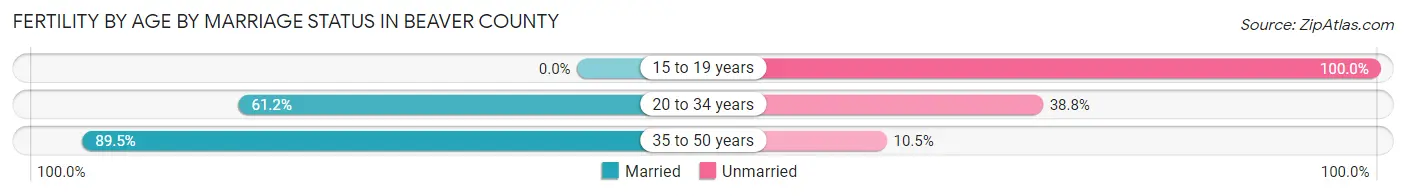
| Age Bracket | Married | Unmarried |
| 15 to 19 years | 0 (0.0%) | 8 (100.0%) |
| 20 to 34 years | 794 (61.2%) | 503 (38.8%) |
| 35 to 50 years | 299 (89.5%) | 35 (10.5%) |
| Total | 1,093 (66.7%) | 546 (33.3%) |
Fertility by Education in Beaver County
Average fertility rate in Beaver County is 49.0 births per 1,000 women. Women with the education attainment of graduate degree have the highest fertility rate of 60.0 births per 1,000 women, while women with the education attainment of less than high school have the lowest fertility at 13.0 births per 1,000 women. Women with the education attainment of college or associate's degree represent 41.7% of all women with births.
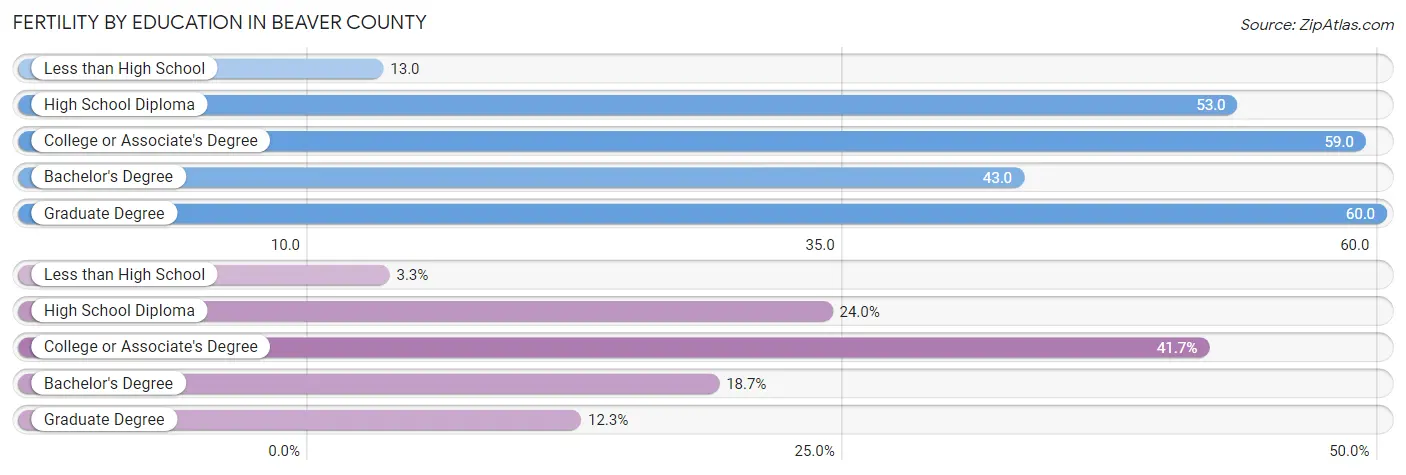
| Educational Attainment | Women with Births | Births / 1,000 Women |
| Less than High School | 54 (3.3%) | 13.0 |
| High School Diploma | 394 (24.0%) | 53.0 |
| College or Associate's Degree | 683 (41.7%) | 59.0 |
| Bachelor's Degree | 307 (18.7%) | 43.0 |
| Graduate Degree | 201 (12.3%) | 60.0 |
| Total | 1,639 (100.0%) | 49.0 |
Fertility by Education by Marriage Status in Beaver County
33.3% of women with births in Beaver County are unmarried. Women with the educational attainment of bachelor's degree are most likely to be married with 98.1% of them married at childbirth, while women with the educational attainment of less than high school are least likely to be married with 100.0% of them unmarried at childbirth.
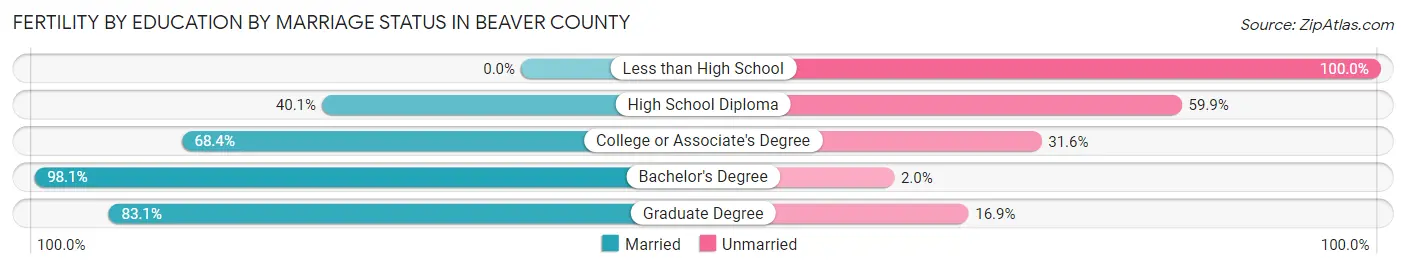
| Educational Attainment | Married | Unmarried |
| Less than High School | 0 (0.0%) | 54 (100.0%) |
| High School Diploma | 158 (40.1%) | 236 (59.9%) |
| College or Associate's Degree | 467 (68.4%) | 216 (31.6%) |
| Bachelor's Degree | 301 (98.1%) | 6 (1.9%) |
| Graduate Degree | 167 (83.1%) | 34 (16.9%) |
| Total | 1,093 (66.7%) | 546 (33.3%) |
Employment Characteristics in Beaver County
Employment by Class of Employer in Beaver County
Among the 78,748 employed individuals in Beaver County, private company employees (56,016 | 71.1%), not-for-profit organizations (8,869 | 11.3%), and local government employees (5,250 | 6.7%) make up the most common classes of employment.
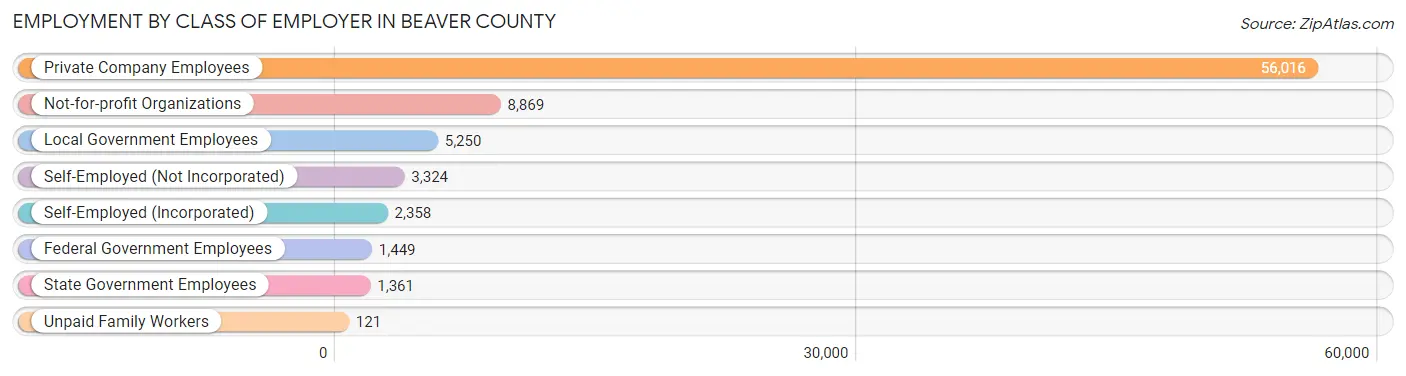
| Employer Class | # Employees | % Employees |
| Private Company Employees | 56,016 | 71.1% |
| Self-Employed (Incorporated) | 2,358 | 3.0% |
| Self-Employed (Not Incorporated) | 3,324 | 4.2% |
| Not-for-profit Organizations | 8,869 | 11.3% |
| Local Government Employees | 5,250 | 6.7% |
| State Government Employees | 1,361 | 1.7% |
| Federal Government Employees | 1,449 | 1.8% |
| Unpaid Family Workers | 121 | 0.2% |
| Total | 78,748 | 100.0% |
Employment Status by Age in Beaver County
According to the labor force statistics for Beaver County, out of the total population over 16 years of age (139,229), 61.2% or 85,208 individuals are in the labor force, with 5.6% or 4,772 of them unemployed. The age group with the highest labor force participation rate is 30 to 34 years, with 87.3% or 8,620 individuals in the labor force. Within the labor force, the 16 to 19 years age range has the highest percentage of unemployed individuals, with 17.2% or 529 of them being unemployed.
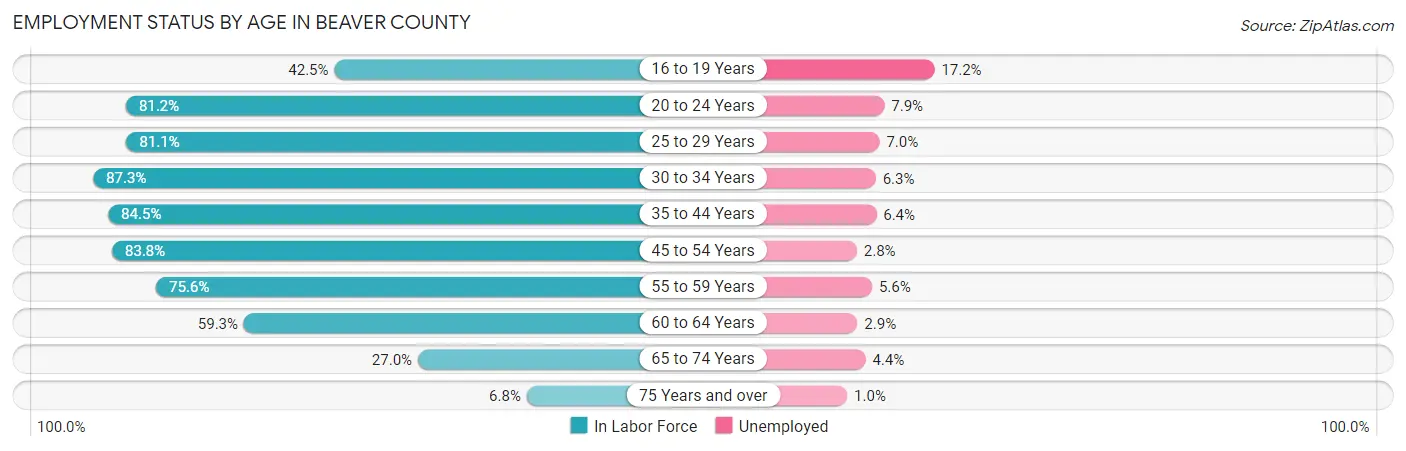
| Age Bracket | In Labor Force | Unemployed |
| 16 to 19 Years | 3,077 (42.5%) | 529 (17.2%) |
| 20 to 24 Years | 7,185 (81.2%) | 568 (7.9%) |
| 25 to 29 Years | 7,893 (81.1%) | 553 (7.0%) |
| 30 to 34 Years | 8,620 (87.3%) | 543 (6.3%) |
| 35 to 44 Years | 16,848 (84.5%) | 1,078 (6.4%) |
| 45 to 54 Years | 17,072 (83.8%) | 478 (2.8%) |
| 55 to 59 Years | 9,408 (75.6%) | 527 (5.6%) |
| 60 to 64 Years | 8,275 (59.3%) | 240 (2.9%) |
| 65 to 74 Years | 5,732 (27.0%) | 252 (4.4%) |
| 75 Years and over | 1,061 (6.8%) | 11 (1.0%) |
| Total | 85,208 (61.2%) | 4,772 (5.6%) |
Employment Status by Educational Attainment in Beaver County
According to labor force statistics for Beaver County, 78.9% of individuals (68,103) out of the total population between 25 and 64 years of age (86,315) are in the labor force, with 5.0% or 3,405 of them being unemployed. The group with the highest labor force participation rate are those with the educational attainment of bachelor's degree or higher, with 87.2% or 22,299 individuals in the labor force. Within the labor force, individuals with less than high school education have the highest percentage of unemployment, with 9.2% or 205 of them being unemployed.
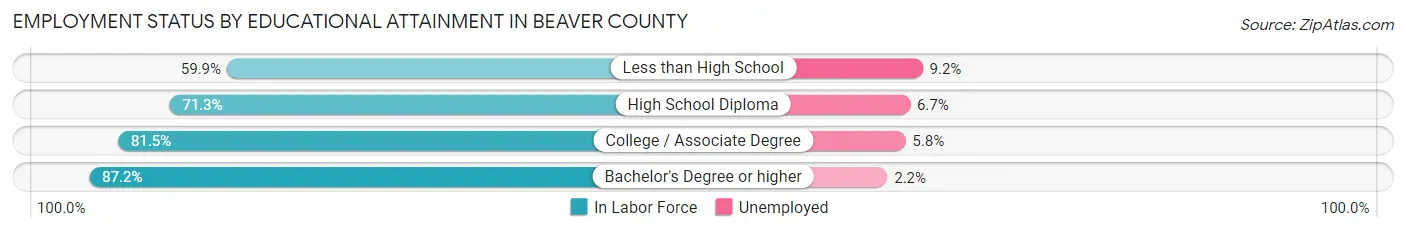
| Educational Attainment | In Labor Force | Unemployed |
| Less than High School | 2,228 (59.9%) | 342 (9.2%) |
| High School Diploma | 20,062 (71.3%) | 1,885 (6.7%) |
| College / Associate Degree | 23,543 (81.5%) | 1,675 (5.8%) |
| Bachelor's Degree or higher | 22,299 (87.2%) | 563 (2.2%) |
| Total | 68,103 (78.9%) | 4,316 (5.0%) |
Employment Occupations by Sex in Beaver County
Management, Business, Science and Arts Occupations
The most common Management, Business, Science and Arts occupations in Beaver County are Management (7,952 | 9.9%), Community & Social Service (7,395 | 9.2%), Health Diagnosing & Treating (5,525 | 6.9%), Computers, Engineering & Science (4,548 | 5.7%), and Business & Financial (4,153 | 5.2%).
Management, Business, Science and Arts Occupations by Sex
Within the Management, Business, Science and Arts occupations in Beaver County, the most male-oriented occupations are Architecture & Engineering (92.8%), Computers, Engineering & Science (83.6%), and Computers & Mathematics (78.4%), while the most female-oriented occupations are Health Technologists (84.6%), Health Diagnosing & Treating (83.8%), and Education Instruction & Library (73.4%).
| Occupation | Male | Female |
| Management | 4,566 (57.4%) | 3,386 (42.6%) |
| Business & Financial | 1,771 (42.6%) | 2,382 (57.4%) |
| Computers, Engineering & Science | 3,802 (83.6%) | 746 (16.4%) |
| Computers & Mathematics | 1,462 (78.4%) | 402 (21.6%) |
| Architecture & Engineering | 1,948 (92.8%) | 152 (7.2%) |
| Life, Physical & Social Science | 392 (67.1%) | 192 (32.9%) |
| Community & Social Service | 2,289 (30.9%) | 5,106 (69.1%) |
| Education, Arts & Media | 693 (39.0%) | 1,086 (61.1%) |
| Legal Services & Support | 207 (27.9%) | 535 (72.1%) |
| Education Instruction & Library | 1,071 (26.6%) | 2,949 (73.4%) |
| Arts, Media & Entertainment | 318 (37.2%) | 536 (62.8%) |
| Health Diagnosing & Treating | 897 (16.2%) | 4,628 (83.8%) |
| Health Technologists | 526 (15.4%) | 2,887 (84.6%) |
| Total (Category) | 13,325 (45.1%) | 16,248 (54.9%) |
| Total (Overall) | 42,061 (52.4%) | 38,241 (47.6%) |
Services Occupations
The most common Services occupations in Beaver County are Food Preparation & Serving (4,329 | 5.4%), Healthcare Support (3,091 | 3.8%), Cleaning & Maintenance (2,546 | 3.2%), Personal Care & Service (2,115 | 2.6%), and Security & Protection (1,687 | 2.1%).
Services Occupations by Sex
Within the Services occupations in Beaver County, the most male-oriented occupations are Law Enforcement (94.5%), Security & Protection (73.1%), and Cleaning & Maintenance (68.9%), while the most female-oriented occupations are Healthcare Support (87.2%), Personal Care & Service (72.6%), and Food Preparation & Serving (60.8%).
| Occupation | Male | Female |
| Healthcare Support | 397 (12.8%) | 2,694 (87.2%) |
| Security & Protection | 1,233 (73.1%) | 454 (26.9%) |
| Firefighting & Prevention | 464 (53.1%) | 409 (46.9%) |
| Law Enforcement | 769 (94.5%) | 45 (5.5%) |
| Food Preparation & Serving | 1,699 (39.3%) | 2,630 (60.8%) |
| Cleaning & Maintenance | 1,755 (68.9%) | 791 (31.1%) |
| Personal Care & Service | 579 (27.4%) | 1,536 (72.6%) |
| Total (Category) | 5,663 (41.1%) | 8,105 (58.9%) |
| Total (Overall) | 42,061 (52.4%) | 38,241 (47.6%) |
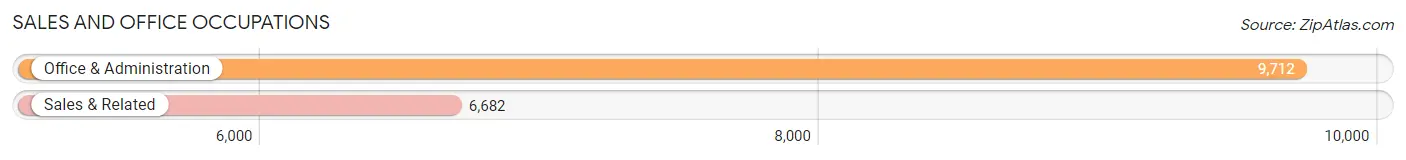
Sales and Office Occupations
The most common Sales and Office occupations in Beaver County are Office & Administration (9,712 | 12.1%), and Sales & Related (6,682 | 8.3%).
Sales and Office Occupations by Sex
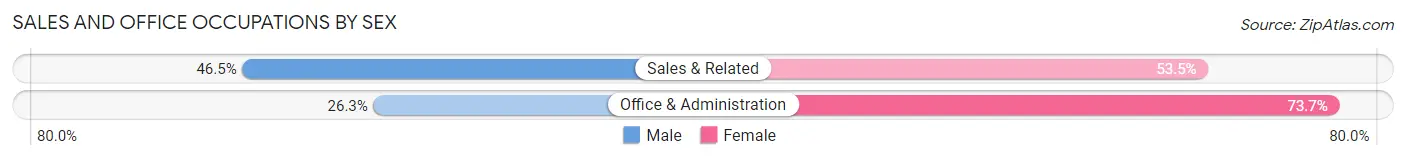
| Occupation | Male | Female |
| Sales & Related | 3,106 (46.5%) | 3,576 (53.5%) |
| Office & Administration | 2,555 (26.3%) | 7,157 (73.7%) |
| Total (Category) | 5,661 (34.5%) | 10,733 (65.5%) |
| Total (Overall) | 42,061 (52.4%) | 38,241 (47.6%) |
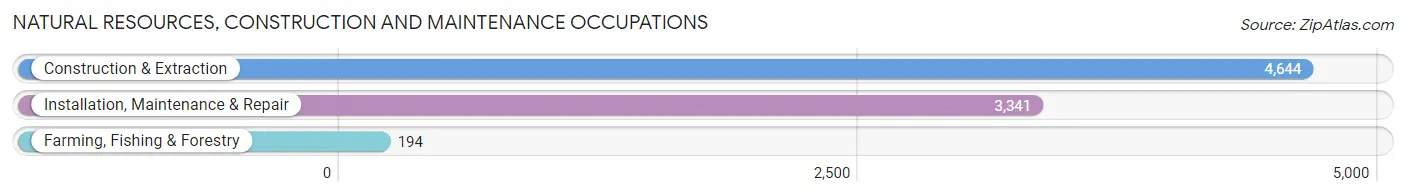
Natural Resources, Construction and Maintenance Occupations
The most common Natural Resources, Construction and Maintenance occupations in Beaver County are Construction & Extraction (4,644 | 5.8%), Installation, Maintenance & Repair (3,341 | 4.2%), and Farming, Fishing & Forestry (194 | 0.2%).
Natural Resources, Construction and Maintenance Occupations by Sex
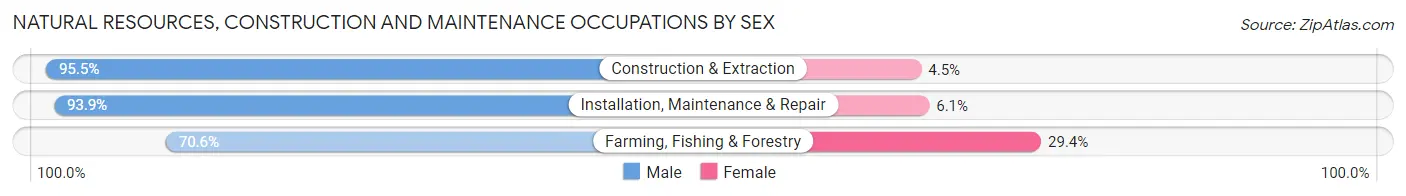
| Occupation | Male | Female |
| Farming, Fishing & Forestry | 137 (70.6%) | 57 (29.4%) |
| Construction & Extraction | 4,437 (95.5%) | 207 (4.5%) |
| Installation, Maintenance & Repair | 3,137 (93.9%) | 204 (6.1%) |
| Total (Category) | 7,711 (94.3%) | 468 (5.7%) |
| Total (Overall) | 42,061 (52.4%) | 38,241 (47.6%) |
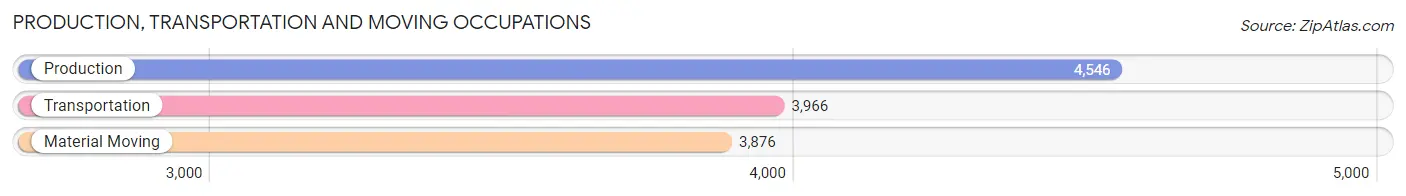
Production, Transportation and Moving Occupations
The most common Production, Transportation and Moving occupations in Beaver County are Production (4,546 | 5.7%), Transportation (3,966 | 4.9%), and Material Moving (3,876 | 4.8%).
Production, Transportation and Moving Occupations by Sex
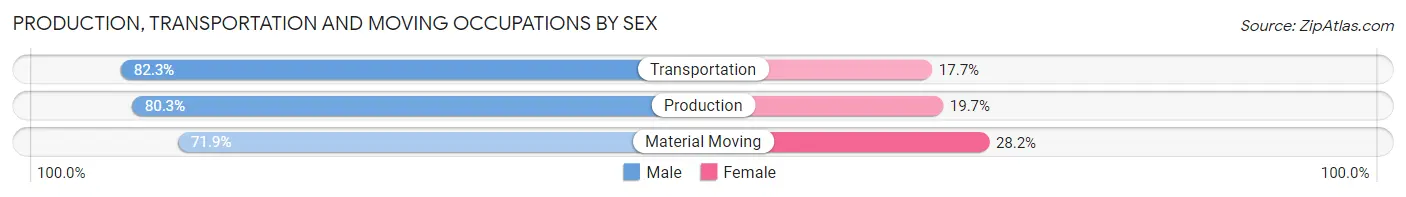
| Occupation | Male | Female |
| Production | 3,651 (80.3%) | 895 (19.7%) |
| Transportation | 3,265 (82.3%) | 701 (17.7%) |
| Material Moving | 2,785 (71.9%) | 1,091 (28.1%) |
| Total (Category) | 9,701 (78.3%) | 2,687 (21.7%) |
| Total (Overall) | 42,061 (52.4%) | 38,241 (47.6%) |
Employment Industries by Sex in Beaver County
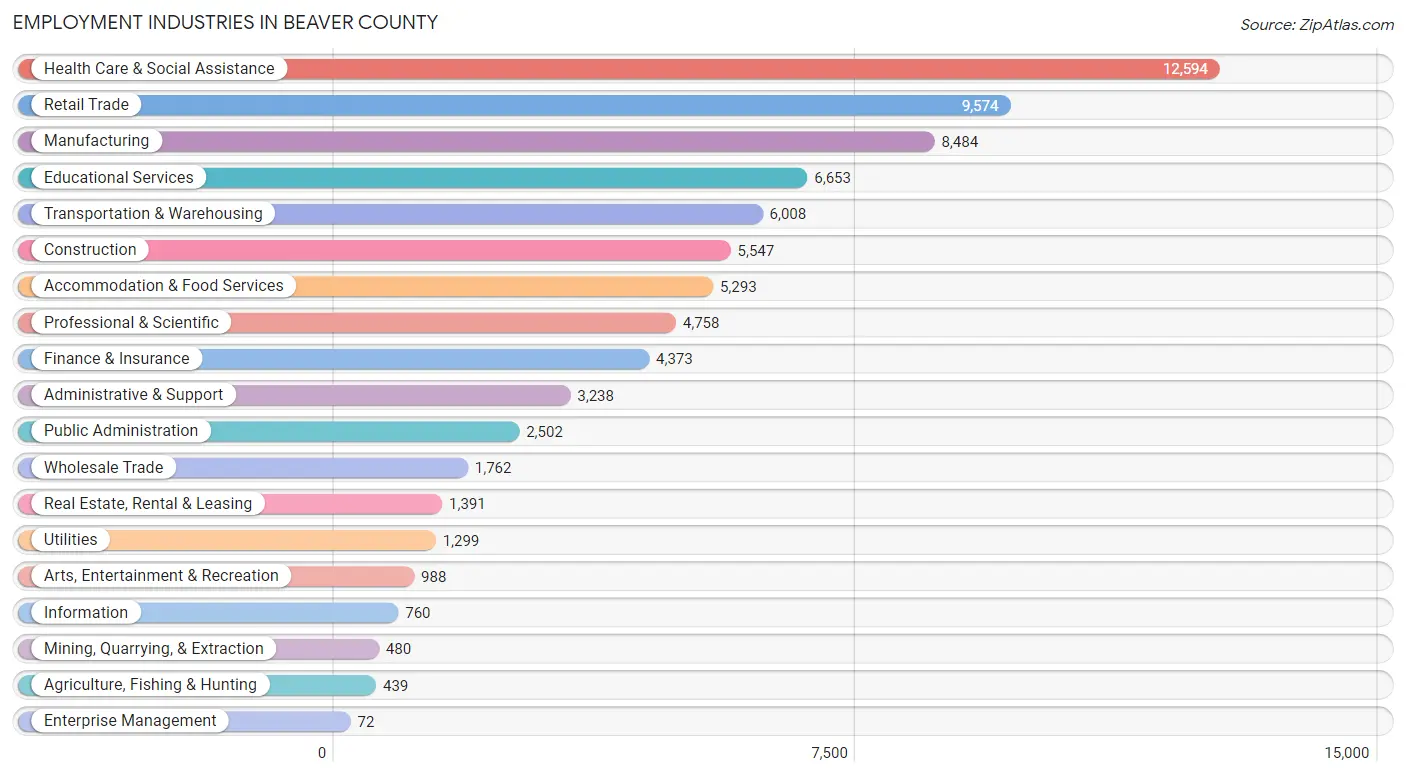
Employment Industries in Beaver County
The major employment industries in Beaver County include Health Care & Social Assistance (12,594 | 15.7%), Retail Trade (9,574 | 11.9%), Manufacturing (8,484 | 10.6%), Educational Services (6,653 | 8.3%), and Transportation & Warehousing (6,008 | 7.5%).
Employment Industries by Sex in Beaver County
The Beaver County industries that see more men than women are Construction (90.5%), Utilities (86.6%), and Mining, Quarrying, & Extraction (80.8%), whereas the industries that tend to have a higher number of women are Health Care & Social Assistance (80.6%), Educational Services (67.8%), and Finance & Insurance (57.2%).
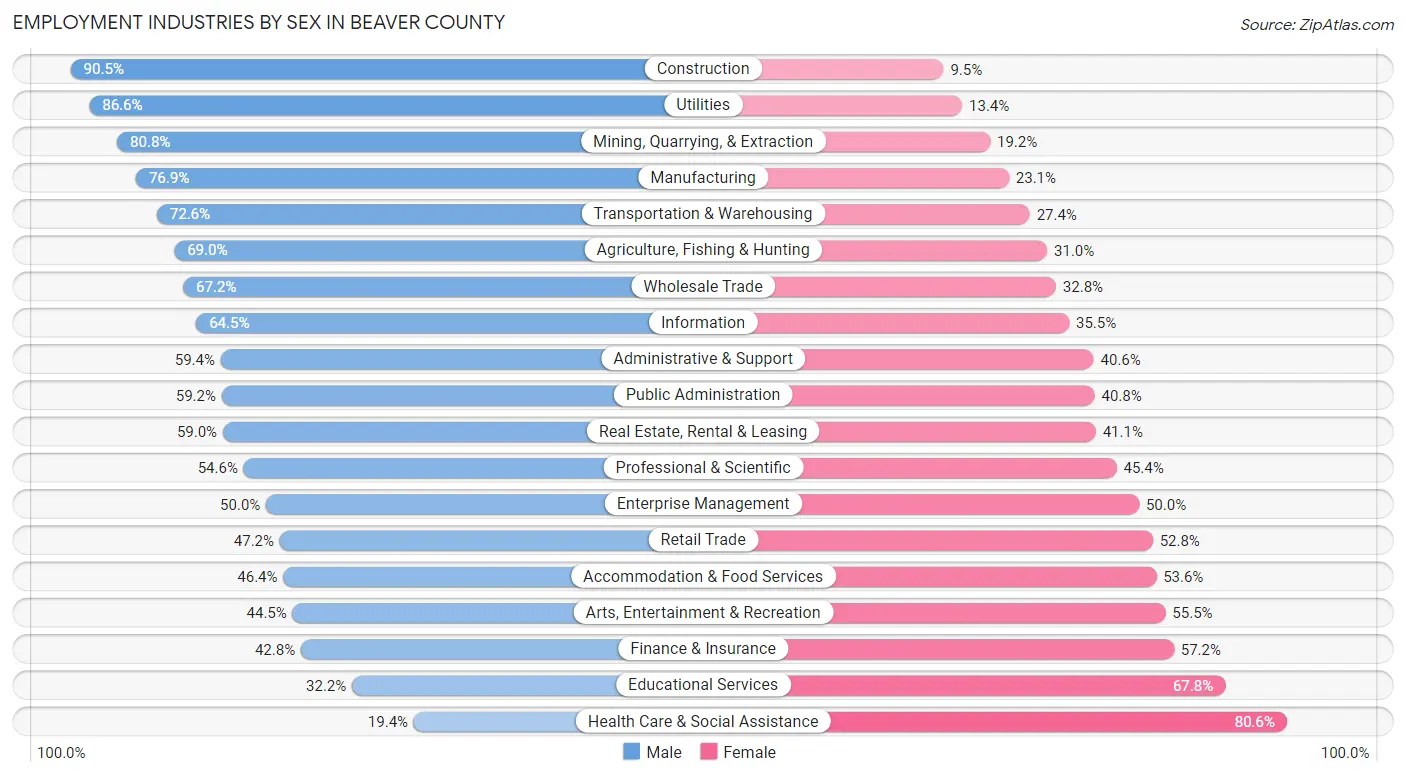
| Industry | Male | Female |
| Agriculture, Fishing & Hunting | 303 (69.0%) | 136 (31.0%) |
| Mining, Quarrying, & Extraction | 388 (80.8%) | 92 (19.2%) |
| Construction | 5,018 (90.5%) | 529 (9.5%) |
| Manufacturing | 6,528 (76.9%) | 1,956 (23.1%) |
| Wholesale Trade | 1,184 (67.2%) | 578 (32.8%) |
| Retail Trade | 4,515 (47.2%) | 5,059 (52.8%) |
| Transportation & Warehousing | 4,363 (72.6%) | 1,645 (27.4%) |
| Utilities | 1,125 (86.6%) | 174 (13.4%) |
| Information | 490 (64.5%) | 270 (35.5%) |
| Finance & Insurance | 1,871 (42.8%) | 2,502 (57.2%) |
| Real Estate, Rental & Leasing | 820 (59.0%) | 571 (41.0%) |
| Professional & Scientific | 2,600 (54.6%) | 2,158 (45.4%) |
| Enterprise Management | 36 (50.0%) | 36 (50.0%) |
| Administrative & Support | 1,923 (59.4%) | 1,315 (40.6%) |
| Educational Services | 2,143 (32.2%) | 4,510 (67.8%) |
| Health Care & Social Assistance | 2,446 (19.4%) | 10,148 (80.6%) |
| Arts, Entertainment & Recreation | 440 (44.5%) | 548 (55.5%) |
| Accommodation & Food Services | 2,458 (46.4%) | 2,835 (53.6%) |
| Public Administration | 1,481 (59.2%) | 1,021 (40.8%) |
| Total | 42,061 (52.4%) | 38,241 (47.6%) |
Education in Beaver County
School Enrollment in Beaver County
The most common levels of schooling among the 32,571 students in Beaver County are high school (7,738 | 23.8%), elementary school (7,448 | 22.9%), and middle school (7,004 | 21.5%).
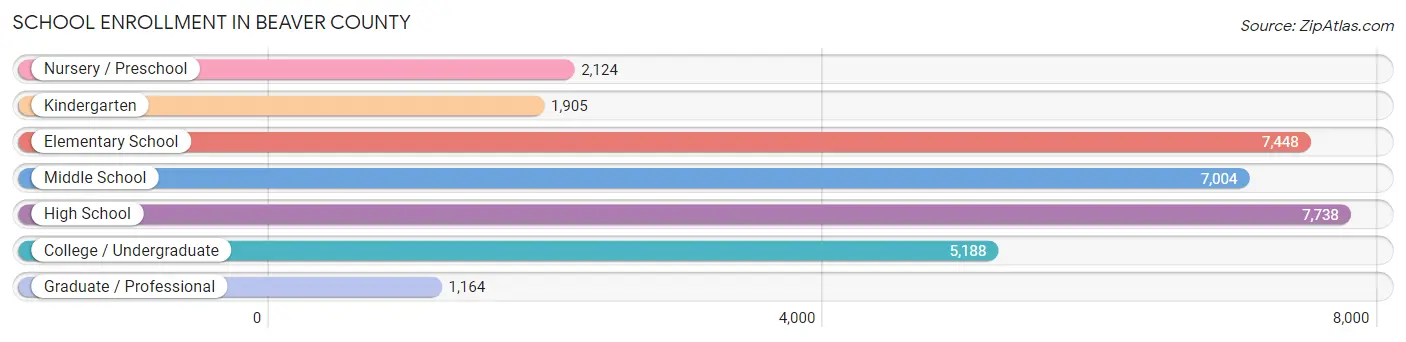
| School Level | # Students | % Students |
| Nursery / Preschool | 2,124 | 6.5% |
| Kindergarten | 1,905 | 5.9% |
| Elementary School | 7,448 | 22.9% |
| Middle School | 7,004 | 21.5% |
| High School | 7,738 | 23.8% |
| College / Undergraduate | 5,188 | 15.9% |
| Graduate / Professional | 1,164 | 3.6% |
| Total | 32,571 | 100.0% |
School Enrollment by Age by Funding Source in Beaver County
Out of a total of 32,571 students who are enrolled in schools in Beaver County, 5,146 (15.8%) attend a private institution, while the remaining 27,425 (84.2%) are enrolled in public schools. The age group of 3 to 4 year olds has the highest likelihood of being enrolled in private schools, with 572 (42.5% in the age bracket) enrolled. Conversely, the age group of 15 to 17 year olds has the lowest likelihood of being enrolled in a private school, with 5,235 (92.0% in the age bracket) attending a public institution.
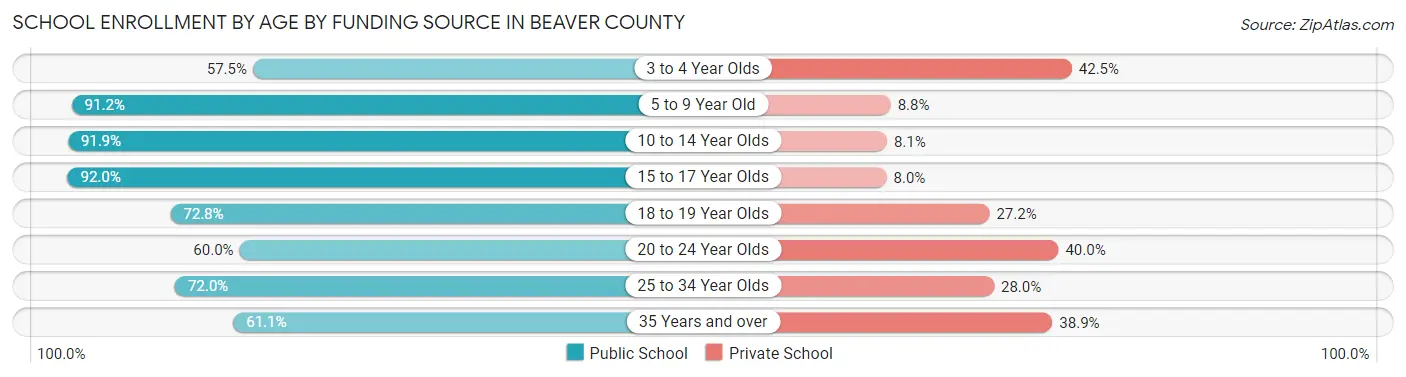
| Age Bracket | Public School | Private School |
| 3 to 4 Year Olds | 774 (57.5%) | 572 (42.5%) |
| 5 to 9 Year Old | 8,019 (91.2%) | 771 (8.8%) |
| 10 to 14 Year Olds | 8,330 (91.9%) | 730 (8.1%) |
| 15 to 17 Year Olds | 5,235 (92.0%) | 455 (8.0%) |
| 18 to 19 Year Olds | 1,751 (72.8%) | 653 (27.2%) |
| 20 to 24 Year Olds | 1,687 (60.0%) | 1,125 (40.0%) |
| 25 to 34 Year Olds | 848 (72.0%) | 330 (28.0%) |
| 35 Years and over | 789 (61.1%) | 502 (38.9%) |
| Total | 27,425 (84.2%) | 5,146 (15.8%) |
Educational Attainment by Field of Study in Beaver County
Business (7,255 | 20.5%), education (6,512 | 18.4%), science & technology (4,091 | 11.6%), engineering (2,808 | 7.9%), and arts & humanities (1,944 | 5.5%) are the most common fields of study among 35,404 individuals in Beaver County who have obtained a bachelor's degree or higher.
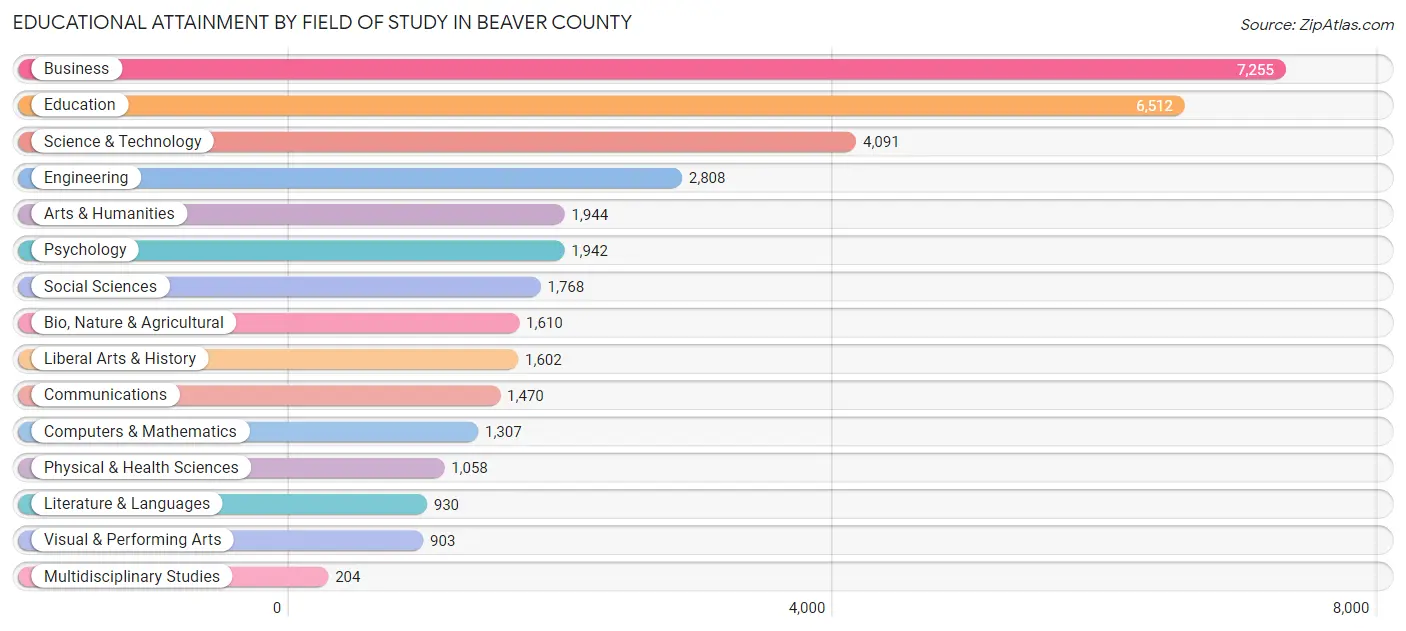
| Field of Study | # Graduates | % Graduates |
| Computers & Mathematics | 1,307 | 3.7% |
| Bio, Nature & Agricultural | 1,610 | 4.5% |
| Physical & Health Sciences | 1,058 | 3.0% |
| Psychology | 1,942 | 5.5% |
| Social Sciences | 1,768 | 5.0% |
| Engineering | 2,808 | 7.9% |
| Multidisciplinary Studies | 204 | 0.6% |
| Science & Technology | 4,091 | 11.6% |
| Business | 7,255 | 20.5% |
| Education | 6,512 | 18.4% |
| Literature & Languages | 930 | 2.6% |
| Liberal Arts & History | 1,602 | 4.5% |
| Visual & Performing Arts | 903 | 2.5% |
| Communications | 1,470 | 4.2% |
| Arts & Humanities | 1,944 | 5.5% |
| Total | 35,404 | 100.0% |
Transportation & Commute in Beaver County
Vehicle Availability by Sex in Beaver County
The most prevalent vehicle ownership categories in Beaver County are males with 2 vehicles (17,585, accounting for 42.6%) and females with 2 vehicles (15,327, making up 47.7%).
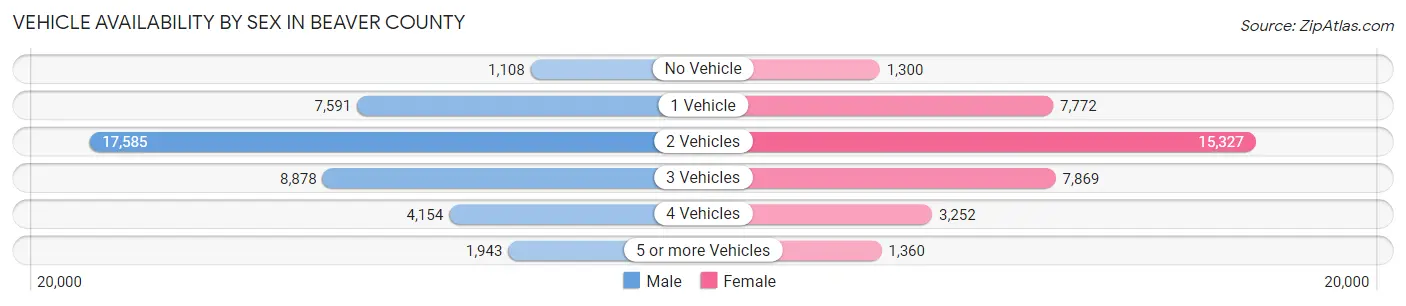
| Vehicles Available | Male | Female |
| No Vehicle | 1,108 (2.7%) | 1,300 (3.5%) |
| 1 Vehicle | 7,591 (18.4%) | 7,772 (21.1%) |
| 2 Vehicles | 17,585 (42.6%) | 15,327 (41.6%) |
| 3 Vehicles | 8,878 (21.5%) | 7,869 (21.3%) |
| 4 Vehicles | 4,154 (10.1%) | 3,252 (8.8%) |
| 5 or more Vehicles | 1,943 (4.7%) | 1,360 (3.7%) |
| Total | 41,259 (100.0%) | 36,880 (100.0%) |
Commute Time in Beaver County
The most frequently occuring commute durations in Beaver County are 15 to 19 minutes (10,396 commuters, 14.6%), 20 to 24 minutes (10,261 commuters, 14.4%), and 30 to 34 minutes (8,696 commuters, 12.2%).
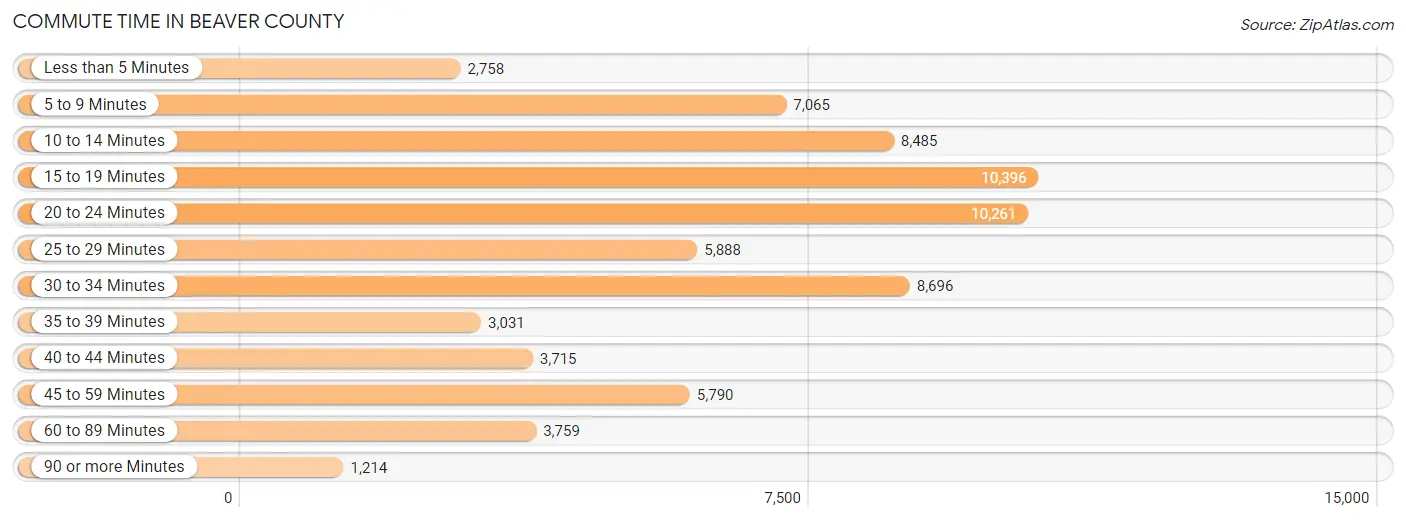
| Commute Time | # Commuters | % Commuters |
| Less than 5 Minutes | 2,758 | 3.9% |
| 5 to 9 Minutes | 7,065 | 9.9% |
| 10 to 14 Minutes | 8,485 | 11.9% |
| 15 to 19 Minutes | 10,396 | 14.6% |
| 20 to 24 Minutes | 10,261 | 14.4% |
| 25 to 29 Minutes | 5,888 | 8.3% |
| 30 to 34 Minutes | 8,696 | 12.2% |
| 35 to 39 Minutes | 3,031 | 4.3% |
| 40 to 44 Minutes | 3,715 | 5.2% |
| 45 to 59 Minutes | 5,790 | 8.2% |
| 60 to 89 Minutes | 3,759 | 5.3% |
| 90 or more Minutes | 1,214 | 1.7% |
Commute Time by Sex in Beaver County
The most common commute times in Beaver County are 20 to 24 minutes (5,432 commuters, 14.3%) for males and 15 to 19 minutes (5,041 commuters, 15.2%) for females.
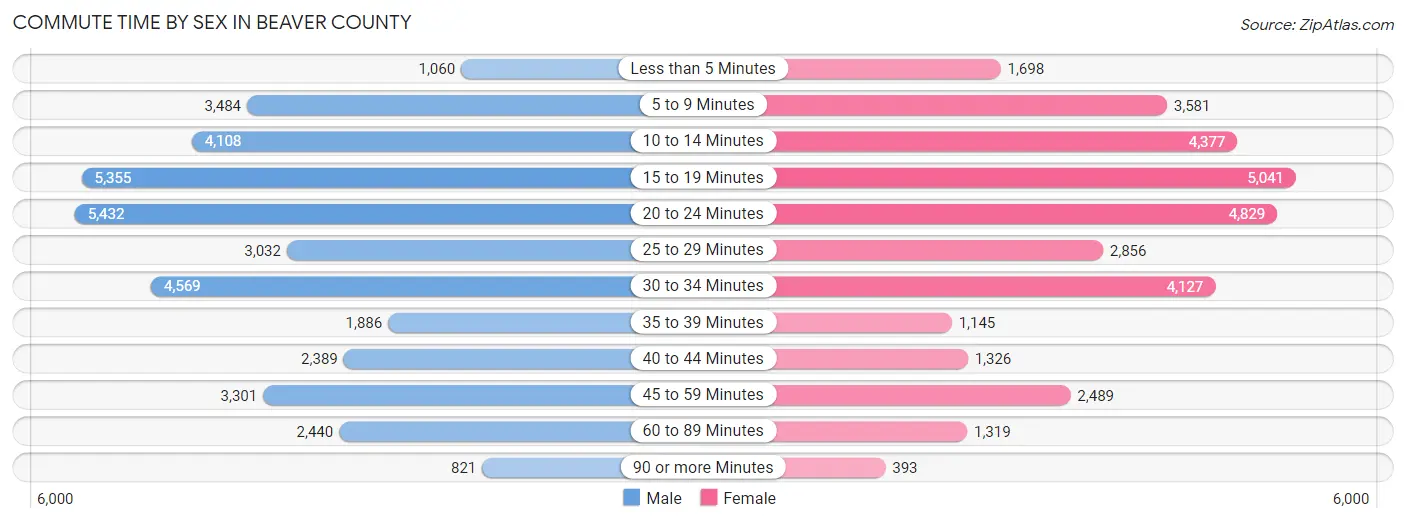
| Commute Time | Male | Female |
| Less than 5 Minutes | 1,060 (2.8%) | 1,698 (5.1%) |
| 5 to 9 Minutes | 3,484 (9.2%) | 3,581 (10.8%) |
| 10 to 14 Minutes | 4,108 (10.8%) | 4,377 (13.2%) |
| 15 to 19 Minutes | 5,355 (14.1%) | 5,041 (15.2%) |
| 20 to 24 Minutes | 5,432 (14.3%) | 4,829 (14.5%) |
| 25 to 29 Minutes | 3,032 (8.0%) | 2,856 (8.6%) |
| 30 to 34 Minutes | 4,569 (12.1%) | 4,127 (12.4%) |
| 35 to 39 Minutes | 1,886 (5.0%) | 1,145 (3.5%) |
| 40 to 44 Minutes | 2,389 (6.3%) | 1,326 (4.0%) |
| 45 to 59 Minutes | 3,301 (8.7%) | 2,489 (7.5%) |
| 60 to 89 Minutes | 2,440 (6.4%) | 1,319 (4.0%) |
| 90 or more Minutes | 821 (2.2%) | 393 (1.2%) |
Time of Departure to Work by Sex in Beaver County
The most frequent times of departure to work in Beaver County are 7:00 AM to 7:29 AM (5,168, 13.6%) for males and 7:00 AM to 7:29 AM (4,946, 14.9%) for females.
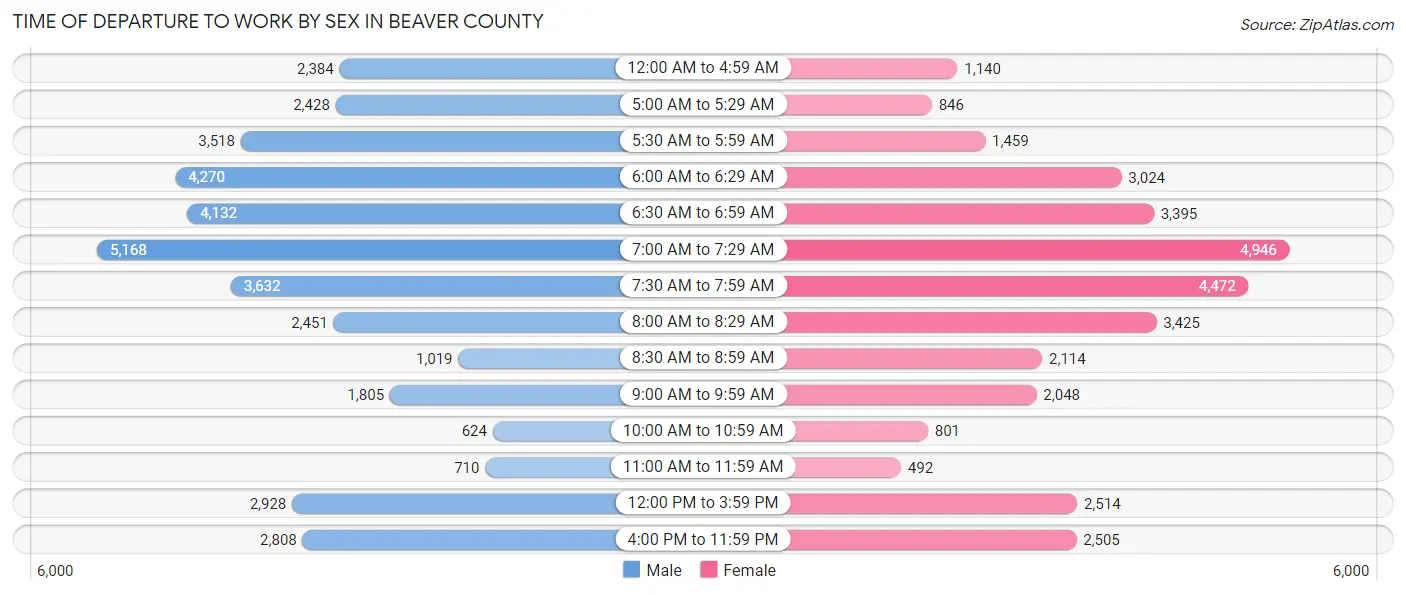
| Time of Departure | Male | Female |
| 12:00 AM to 4:59 AM | 2,384 (6.3%) | 1,140 (3.4%) |
| 5:00 AM to 5:29 AM | 2,428 (6.4%) | 846 (2.5%) |
| 5:30 AM to 5:59 AM | 3,518 (9.3%) | 1,459 (4.4%) |
| 6:00 AM to 6:29 AM | 4,270 (11.3%) | 3,024 (9.1%) |
| 6:30 AM to 6:59 AM | 4,132 (10.9%) | 3,395 (10.2%) |
| 7:00 AM to 7:29 AM | 5,168 (13.6%) | 4,946 (14.9%) |
| 7:30 AM to 7:59 AM | 3,632 (9.6%) | 4,472 (13.5%) |
| 8:00 AM to 8:29 AM | 2,451 (6.5%) | 3,425 (10.3%) |
| 8:30 AM to 8:59 AM | 1,019 (2.7%) | 2,114 (6.4%) |
| 9:00 AM to 9:59 AM | 1,805 (4.8%) | 2,048 (6.2%) |
| 10:00 AM to 10:59 AM | 624 (1.7%) | 801 (2.4%) |
| 11:00 AM to 11:59 AM | 710 (1.9%) | 492 (1.5%) |
| 12:00 PM to 3:59 PM | 2,928 (7.7%) | 2,514 (7.6%) |
| 4:00 PM to 11:59 PM | 2,808 (7.4%) | 2,505 (7.5%) |
| Total | 37,877 (100.0%) | 33,181 (100.0%) |
Housing Occupancy in Beaver County
Occupancy by Ownership in Beaver County
Of the total 71,999 dwellings in Beaver County, owner-occupied units account for 52,993 (73.6%), while renter-occupied units make up 19,006 (26.4%).
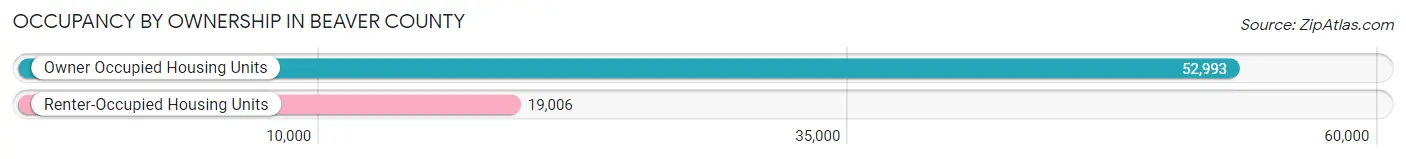
| Occupancy | # Housing Units | % Housing Units |
| Owner Occupied Housing Units | 52,993 | 73.6% |
| Renter-Occupied Housing Units | 19,006 | 26.4% |
| Total Occupied Housing Units | 71,999 | 100.0% |
Occupancy by Household Size in Beaver County
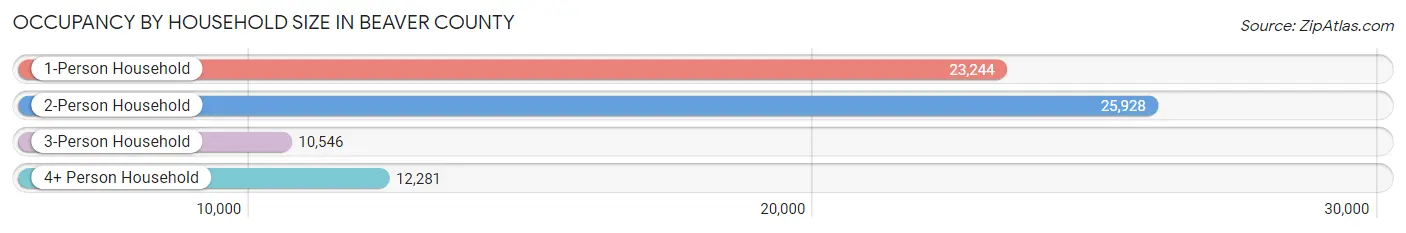
| Household Size | # Housing Units | % Housing Units |
| 1-Person Household | 23,244 | 32.3% |
| 2-Person Household | 25,928 | 36.0% |
| 3-Person Household | 10,546 | 14.6% |
| 4+ Person Household | 12,281 | 17.1% |
| Total Housing Units | 71,999 | 100.0% |
Occupancy by Ownership by Household Size in Beaver County
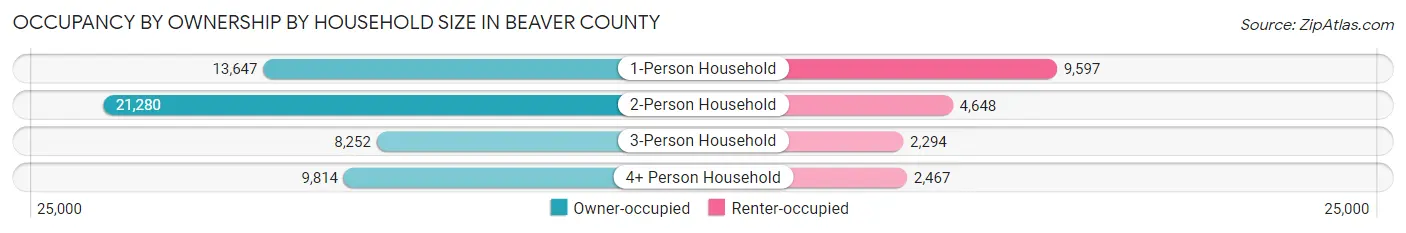
| Household Size | Owner-occupied | Renter-occupied |
| 1-Person Household | 13,647 (58.7%) | 9,597 (41.3%) |
| 2-Person Household | 21,280 (82.1%) | 4,648 (17.9%) |
| 3-Person Household | 8,252 (78.2%) | 2,294 (21.7%) |
| 4+ Person Household | 9,814 (79.9%) | 2,467 (20.1%) |
| Total Housing Units | 52,993 (73.6%) | 19,006 (26.4%) |
Occupancy by Educational Attainment in Beaver County
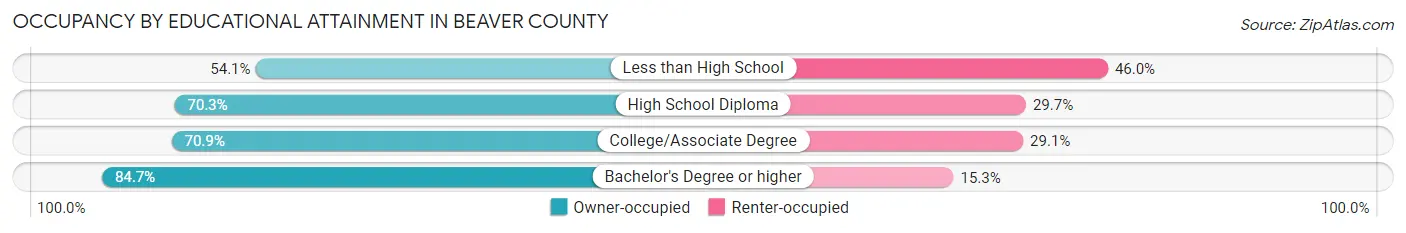
| Household Size | Owner-occupied | Renter-occupied |
| Less than High School | 2,127 (54.0%) | 1,808 (46.0%) |
| High School Diploma | 16,879 (70.3%) | 7,131 (29.7%) |
| College/Associate Degree | 16,990 (70.9%) | 6,988 (29.1%) |
| Bachelor's Degree or higher | 16,997 (84.7%) | 3,079 (15.3%) |
Occupancy by Age of Householder in Beaver County
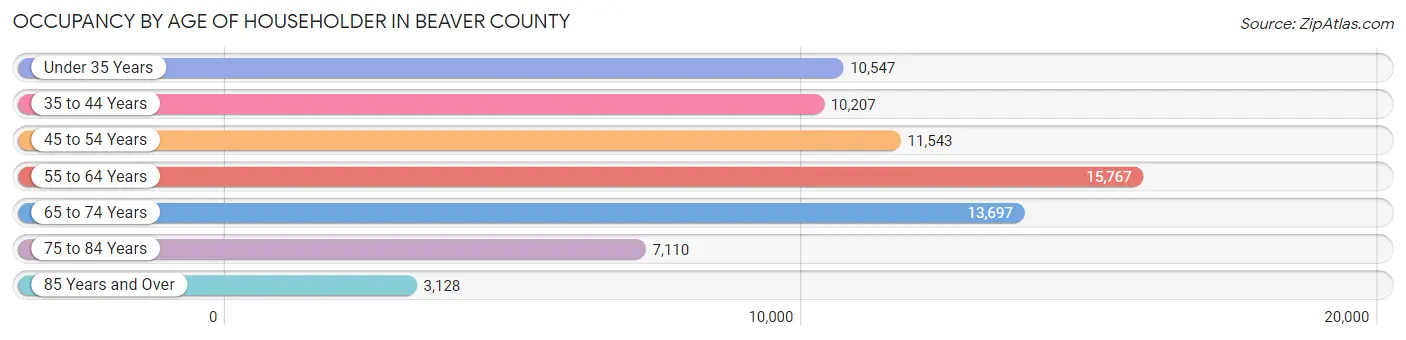
| Age Bracket | # Households | % Households |
| Under 35 Years | 10,547 | 14.6% |
| 35 to 44 Years | 10,207 | 14.2% |
| 45 to 54 Years | 11,543 | 16.0% |
| 55 to 64 Years | 15,767 | 21.9% |
| 65 to 74 Years | 13,697 | 19.0% |
| 75 to 84 Years | 7,110 | 9.9% |
| 85 Years and Over | 3,128 | 4.3% |
| Total | 71,999 | 100.0% |
Housing Finances in Beaver County
Median Income by Occupancy in Beaver County
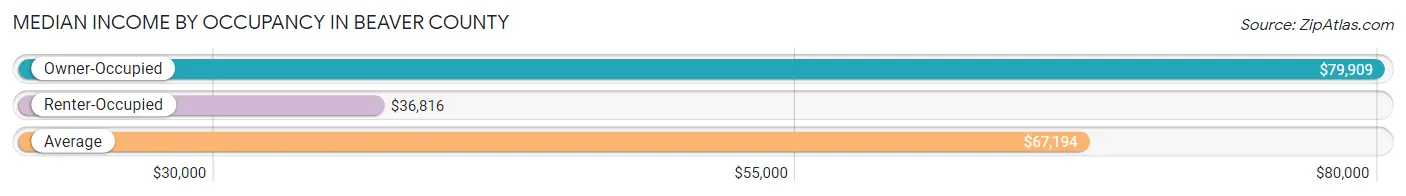
| Occupancy Type | # Households | Median Income |
| Owner-Occupied | 52,993 (73.6%) | $79,909 |
| Renter-Occupied | 19,006 (26.4%) | $36,816 |
| Average | 71,999 (100.0%) | $67,194 |
Occupancy by Householder Income Bracket in Beaver County
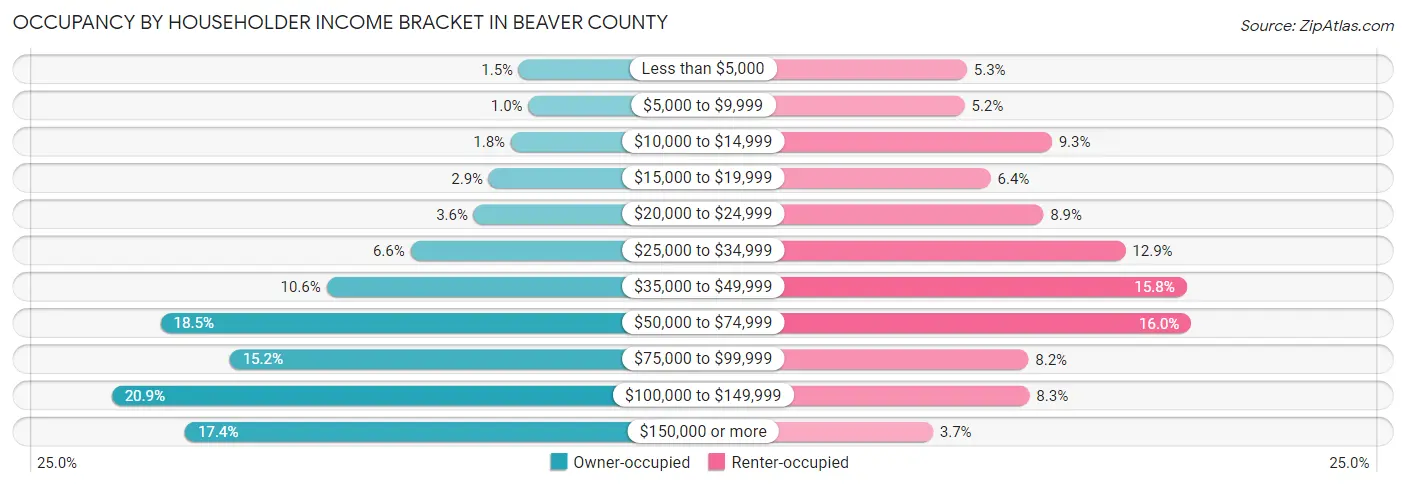
| Income Bracket | Owner-occupied | Renter-occupied |
| Less than $5,000 | 775 (1.5%) | 1,008 (5.3%) |
| $5,000 to $9,999 | 536 (1.0%) | 986 (5.2%) |
| $10,000 to $14,999 | 973 (1.8%) | 1,775 (9.3%) |
| $15,000 to $19,999 | 1,533 (2.9%) | 1,222 (6.4%) |
| $20,000 to $24,999 | 1,912 (3.6%) | 1,700 (8.9%) |
| $25,000 to $34,999 | 3,507 (6.6%) | 2,443 (12.9%) |
| $35,000 to $49,999 | 5,629 (10.6%) | 2,996 (15.8%) |
| $50,000 to $74,999 | 9,812 (18.5%) | 3,038 (16.0%) |
| $75,000 to $99,999 | 8,069 (15.2%) | 1,565 (8.2%) |
| $100,000 to $149,999 | 11,050 (20.8%) | 1,573 (8.3%) |
| $150,000 or more | 9,197 (17.4%) | 700 (3.7%) |
| Total | 52,993 (100.0%) | 19,006 (100.0%) |
Monthly Housing Cost Tiers in Beaver County
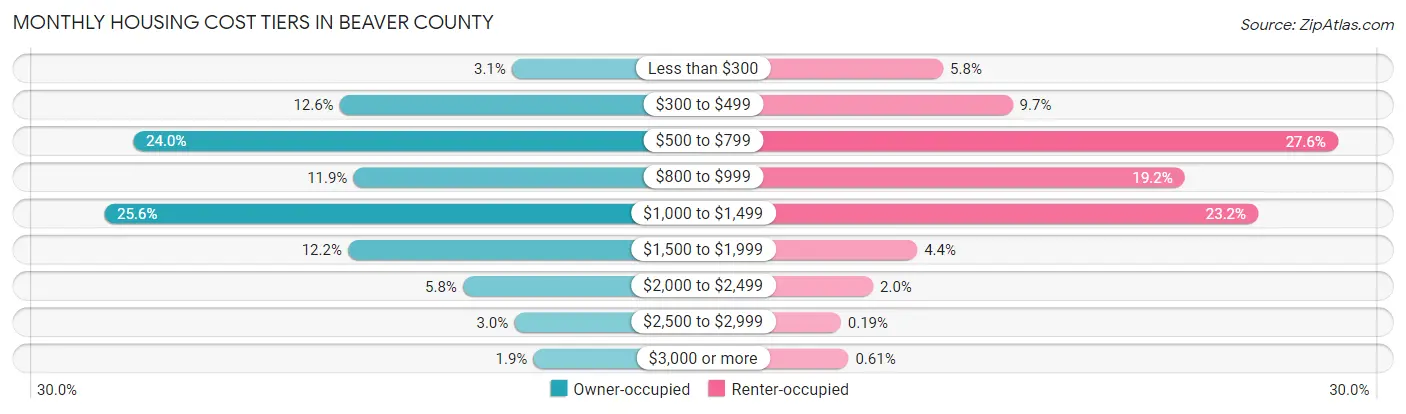
| Monthly Cost | Owner-occupied | Renter-occupied |
| Less than $300 | 1,645 (3.1%) | 1,110 (5.8%) |
| $300 to $499 | 6,681 (12.6%) | 1,839 (9.7%) |
| $500 to $799 | 12,725 (24.0%) | 5,251 (27.6%) |
| $800 to $999 | 6,279 (11.8%) | 3,643 (19.2%) |
| $1,000 to $1,499 | 13,571 (25.6%) | 4,414 (23.2%) |
| $1,500 to $1,999 | 6,436 (12.1%) | 839 (4.4%) |
| $2,000 to $2,499 | 3,075 (5.8%) | 374 (2.0%) |
| $2,500 to $2,999 | 1,567 (3.0%) | 36 (0.2%) |
| $3,000 or more | 1,014 (1.9%) | 115 (0.6%) |
| Total | 52,993 (100.0%) | 19,006 (100.0%) |
Physical Housing Characteristics in Beaver County
Housing Structures in Beaver County
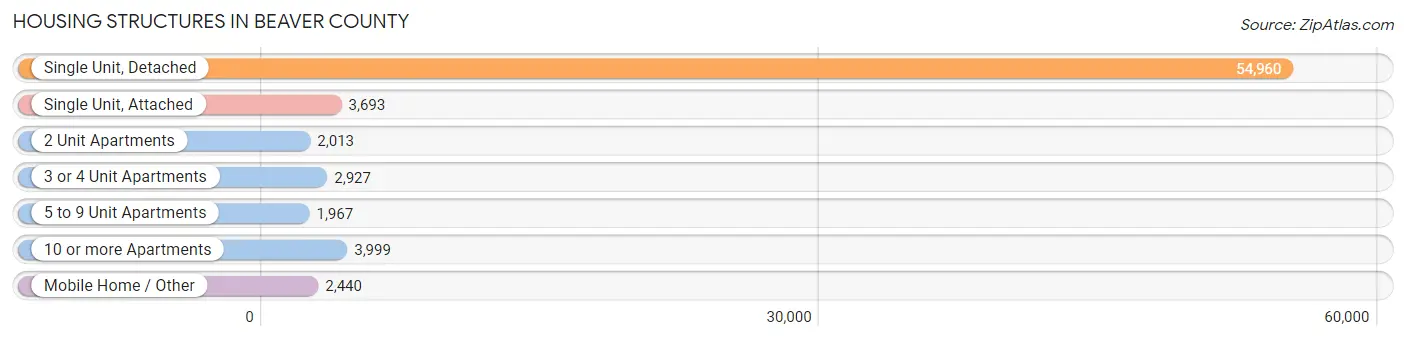
| Structure Type | # Housing Units | % Housing Units |
| Single Unit, Detached | 54,960 | 76.3% |
| Single Unit, Attached | 3,693 | 5.1% |
| 2 Unit Apartments | 2,013 | 2.8% |
| 3 or 4 Unit Apartments | 2,927 | 4.1% |
| 5 to 9 Unit Apartments | 1,967 | 2.7% |
| 10 or more Apartments | 3,999 | 5.6% |
| Mobile Home / Other | 2,440 | 3.4% |
| Total | 71,999 | 100.0% |
Housing Structures by Occupancy in Beaver County
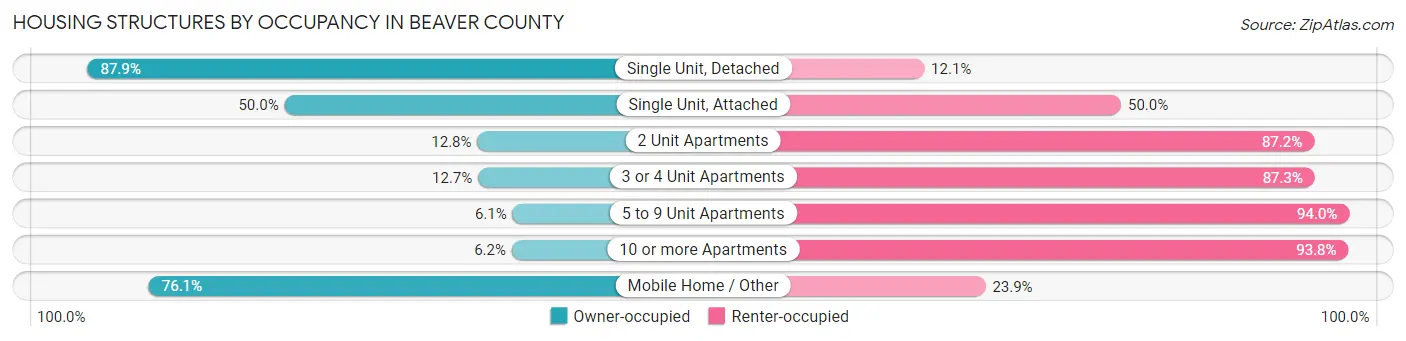
| Structure Type | Owner-occupied | Renter-occupied |
| Single Unit, Detached | 48,296 (87.9%) | 6,664 (12.1%) |
| Single Unit, Attached | 1,845 (50.0%) | 1,848 (50.0%) |
| 2 Unit Apartments | 258 (12.8%) | 1,755 (87.2%) |
| 3 or 4 Unit Apartments | 371 (12.7%) | 2,556 (87.3%) |
| 5 to 9 Unit Apartments | 119 (6.0%) | 1,848 (94.0%) |
| 10 or more Apartments | 248 (6.2%) | 3,751 (93.8%) |
| Mobile Home / Other | 1,856 (76.1%) | 584 (23.9%) |
| Total | 52,993 (73.6%) | 19,006 (26.4%) |
Housing Structures by Number of Rooms in Beaver County
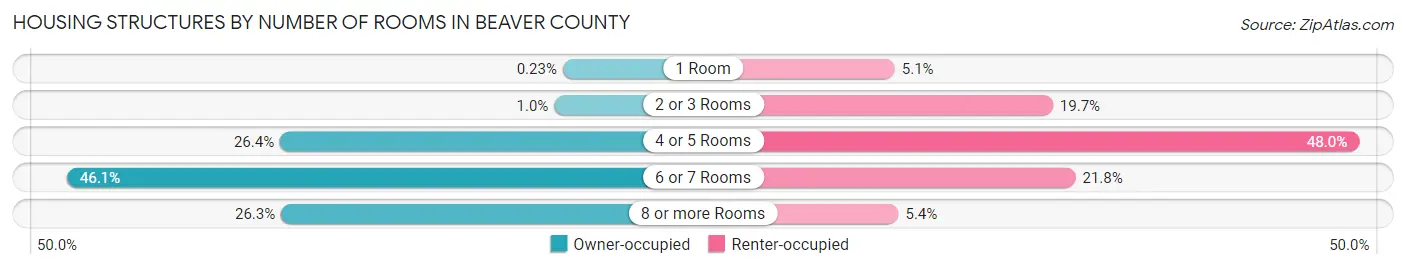
| Number of Rooms | Owner-occupied | Renter-occupied |
| 1 Room | 122 (0.2%) | 965 (5.1%) |
| 2 or 3 Rooms | 543 (1.0%) | 3,745 (19.7%) |
| 4 or 5 Rooms | 13,978 (26.4%) | 9,124 (48.0%) |
| 6 or 7 Rooms | 24,425 (46.1%) | 4,141 (21.8%) |
| 8 or more Rooms | 13,925 (26.3%) | 1,031 (5.4%) |
| Total | 52,993 (100.0%) | 19,006 (100.0%) |
Housing Structure by Heating Type in Beaver County
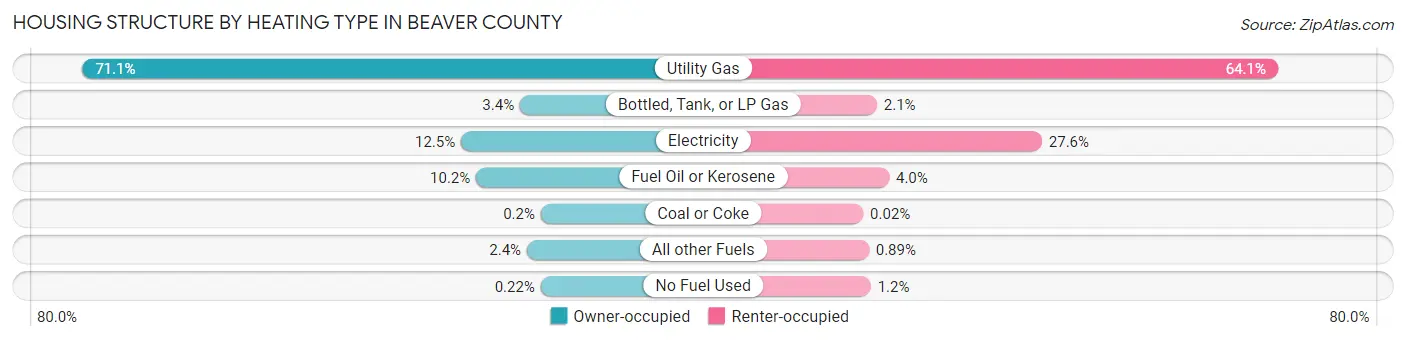
| Heating Type | Owner-occupied | Renter-occupied |
| Utility Gas | 37,675 (71.1%) | 12,184 (64.1%) |
| Bottled, Tank, or LP Gas | 1,811 (3.4%) | 406 (2.1%) |
| Electricity | 6,639 (12.5%) | 5,253 (27.6%) |
| Fuel Oil or Kerosene | 5,403 (10.2%) | 764 (4.0%) |
| Coal or Coke | 105 (0.2%) | 3 (0.0%) |
| All other Fuels | 1,243 (2.4%) | 169 (0.9%) |
| No Fuel Used | 117 (0.2%) | 227 (1.2%) |
| Total | 52,993 (100.0%) | 19,006 (100.0%) |
Household Vehicle Usage in Beaver County
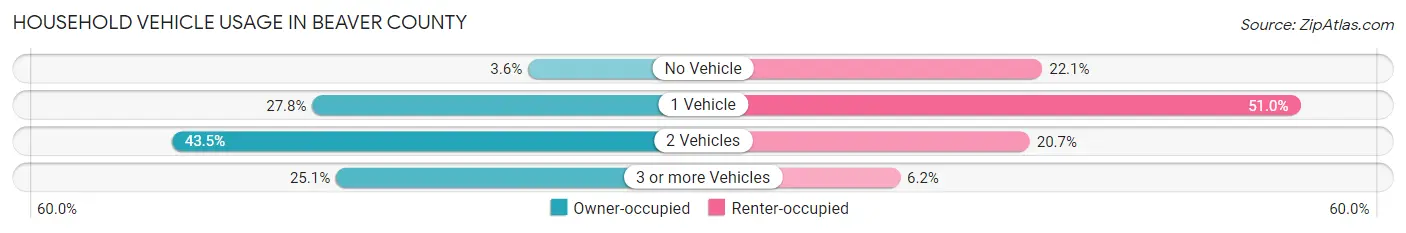
| Vehicles per Household | Owner-occupied | Renter-occupied |
| No Vehicle | 1,911 (3.6%) | 4,202 (22.1%) |
| 1 Vehicle | 14,716 (27.8%) | 9,693 (51.0%) |
| 2 Vehicles | 23,056 (43.5%) | 3,936 (20.7%) |
| 3 or more Vehicles | 13,310 (25.1%) | 1,175 (6.2%) |
| Total | 52,993 (100.0%) | 19,006 (100.0%) |
Real Estate & Mortgages in Beaver County
Real Estate and Mortgage Overview in Beaver County
| Characteristic | Without Mortgage | With Mortgage |
| Housing Units | 23,580 | 29,413 |
| Median Property Value | $161,100 | $179,000 |
| Median Household Income | $61,130 | $6,399 |
| Monthly Housing Costs | $588 | $1,003 |
| Real Estate Taxes | $2,393 | $609 |
Property Value by Mortgage Status in Beaver County
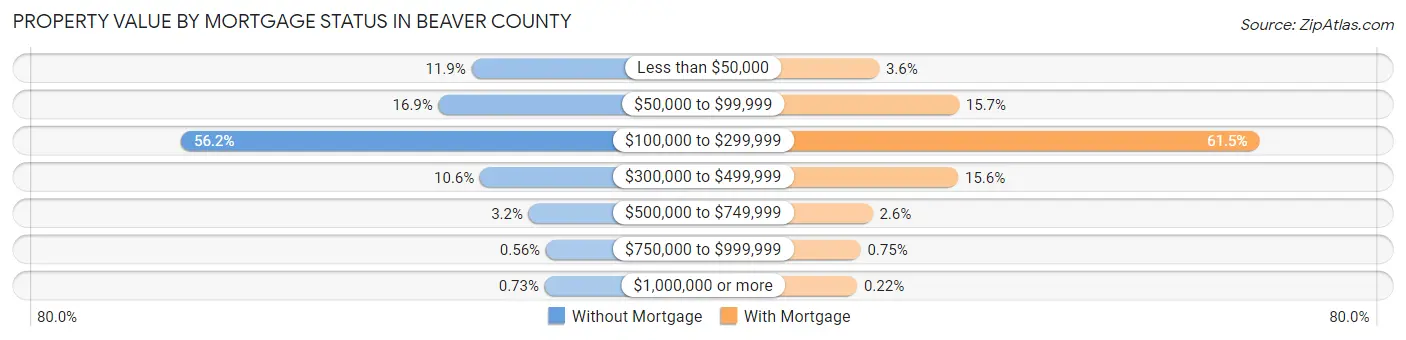
| Property Value | Without Mortgage | With Mortgage |
| Less than $50,000 | 2,803 (11.9%) | 1,049 (3.6%) |
| $50,000 to $99,999 | 3,987 (16.9%) | 4,630 (15.7%) |
| $100,000 to $299,999 | 13,240 (56.1%) | 18,094 (61.5%) |
| $300,000 to $499,999 | 2,498 (10.6%) | 4,595 (15.6%) |
| $500,000 to $749,999 | 748 (3.2%) | 758 (2.6%) |
| $750,000 to $999,999 | 133 (0.6%) | 222 (0.7%) |
| $1,000,000 or more | 171 (0.7%) | 65 (0.2%) |
| Total | 23,580 (100.0%) | 29,413 (100.0%) |
Household Income by Mortgage Status in Beaver County
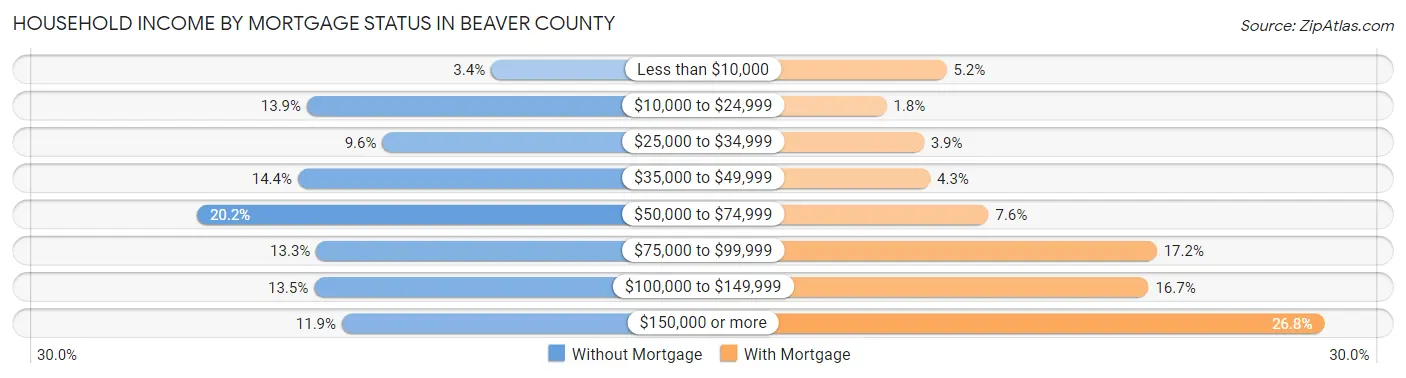
| Household Income | Without Mortgage | With Mortgage |
| Less than $10,000 | 791 (3.4%) | 1,529 (5.2%) |
| $10,000 to $24,999 | 3,271 (13.9%) | 520 (1.8%) |
| $25,000 to $34,999 | 2,255 (9.6%) | 1,147 (3.9%) |
| $35,000 to $49,999 | 3,394 (14.4%) | 1,252 (4.3%) |
| $50,000 to $74,999 | 4,751 (20.2%) | 2,235 (7.6%) |
| $75,000 to $99,999 | 3,146 (13.3%) | 5,061 (17.2%) |
| $100,000 to $149,999 | 3,174 (13.5%) | 4,923 (16.7%) |
| $150,000 or more | 2,798 (11.9%) | 7,876 (26.8%) |
| Total | 23,580 (100.0%) | 29,413 (100.0%) |
Property Value to Household Income Ratio in Beaver County
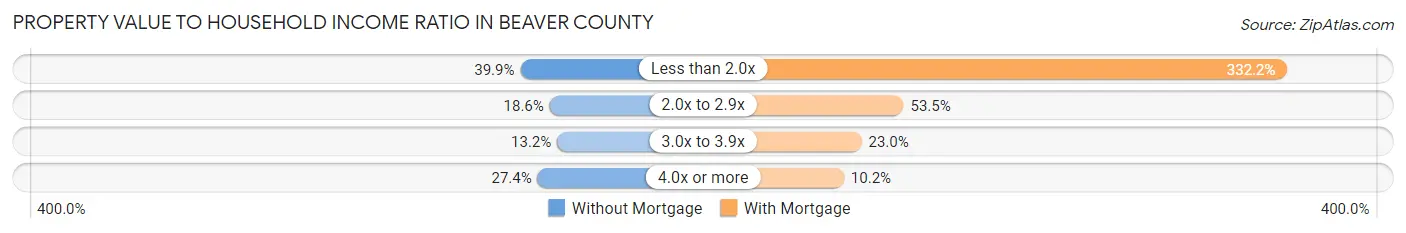
| Value-to-Income Ratio | Without Mortgage | With Mortgage |
| Less than 2.0x | 9,401 (39.9%) | 97,715 (332.2%) |
| 2.0x to 2.9x | 4,383 (18.6%) | 15,737 (53.5%) |
| 3.0x to 3.9x | 3,104 (13.2%) | 6,752 (23.0%) |
| 4.0x or more | 6,459 (27.4%) | 2,990 (10.2%) |
| Total | 23,580 (100.0%) | 29,413 (100.0%) |
Real Estate Taxes by Mortgage Status in Beaver County
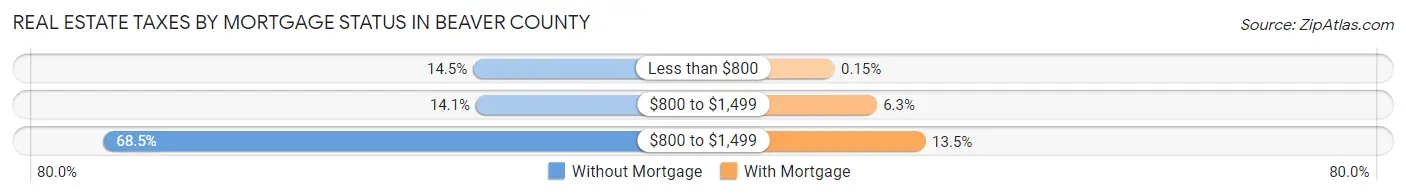
| Property Taxes | Without Mortgage | With Mortgage |
| Less than $800 | 3,413 (14.5%) | 44 (0.2%) |
| $800 to $1,499 | 3,314 (14.1%) | 1,855 (6.3%) |
| $800 to $1,499 | 16,147 (68.5%) | 3,959 (13.5%) |
| Total | 23,580 (100.0%) | 29,413 (100.0%) |
Health & Disability in Beaver County
Health Insurance Coverage by Age in Beaver County
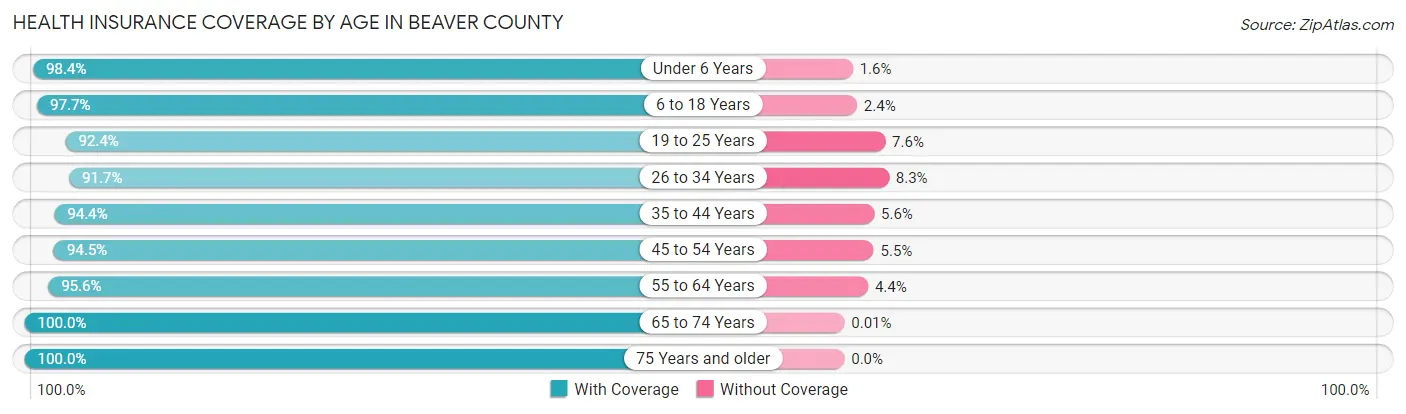
| Age Bracket | With Coverage | Without Coverage |
| Under 6 Years | 9,942 (98.4%) | 159 (1.6%) |
| 6 to 18 Years | 23,445 (97.7%) | 564 (2.4%) |
| 19 to 25 Years | 11,359 (92.4%) | 937 (7.6%) |
| 26 to 34 Years | 15,950 (91.7%) | 1,446 (8.3%) |
| 35 to 44 Years | 18,711 (94.4%) | 1,102 (5.6%) |
| 45 to 54 Years | 19,123 (94.5%) | 1,106 (5.5%) |
| 55 to 64 Years | 25,113 (95.6%) | 1,158 (4.4%) |
| 65 to 74 Years | 21,104 (100.0%) | 2 (0.0%) |
| 75 Years and older | 15,008 (100.0%) | 0 (0.0%) |
| Total | 159,755 (96.1%) | 6,474 (3.9%) |
Health Insurance Coverage by Citizenship Status in Beaver County
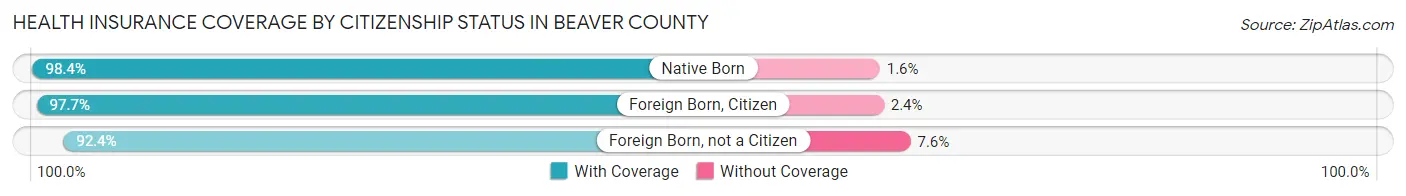
| Citizenship Status | With Coverage | Without Coverage |
| Native Born | 9,942 (98.4%) | 159 (1.6%) |
| Foreign Born, Citizen | 23,445 (97.7%) | 564 (2.4%) |
| Foreign Born, not a Citizen | 11,359 (92.4%) | 937 (7.6%) |
Health Insurance Coverage by Household Income in Beaver County
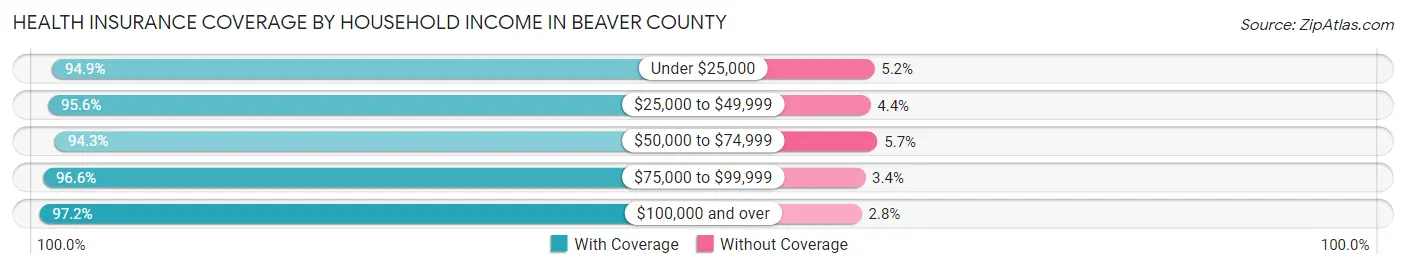
| Household Income | With Coverage | Without Coverage |
| Under $25,000 | 18,114 (94.9%) | 983 (5.1%) |
| $25,000 to $49,999 | 24,753 (95.6%) | 1,141 (4.4%) |
| $50,000 to $74,999 | 26,113 (94.3%) | 1,586 (5.7%) |
| $75,000 to $99,999 | 23,610 (96.6%) | 840 (3.4%) |
| $100,000 and over | 65,639 (97.2%) | 1,871 (2.8%) |
Public vs Private Health Insurance Coverage by Age in Beaver County
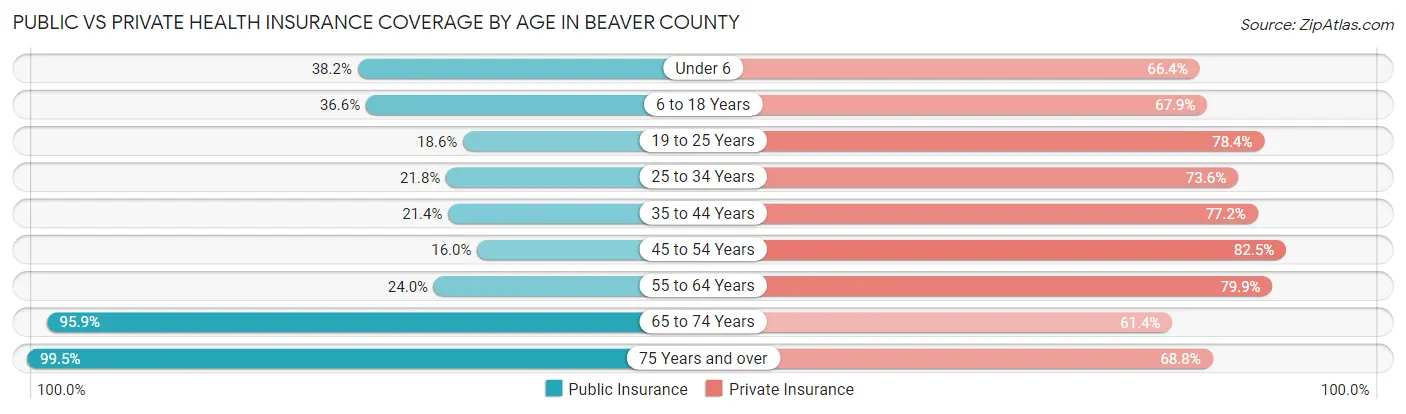
| Age Bracket | Public Insurance | Private Insurance |
| Under 6 | 3,856 (38.2%) | 6,708 (66.4%) |
| 6 to 18 Years | 8,795 (36.6%) | 16,289 (67.8%) |
| 19 to 25 Years | 2,287 (18.6%) | 9,642 (78.4%) |
| 25 to 34 Years | 3,784 (21.7%) | 12,797 (73.6%) |
| 35 to 44 Years | 4,233 (21.4%) | 15,293 (77.2%) |
| 45 to 54 Years | 3,231 (16.0%) | 16,683 (82.5%) |
| 55 to 64 Years | 6,313 (24.0%) | 20,998 (79.9%) |
| 65 to 74 Years | 20,240 (95.9%) | 12,951 (61.4%) |
| 75 Years and over | 14,936 (99.5%) | 10,325 (68.8%) |
| Total | 67,675 (40.7%) | 121,686 (73.2%) |
Disability Status by Sex by Age in Beaver County
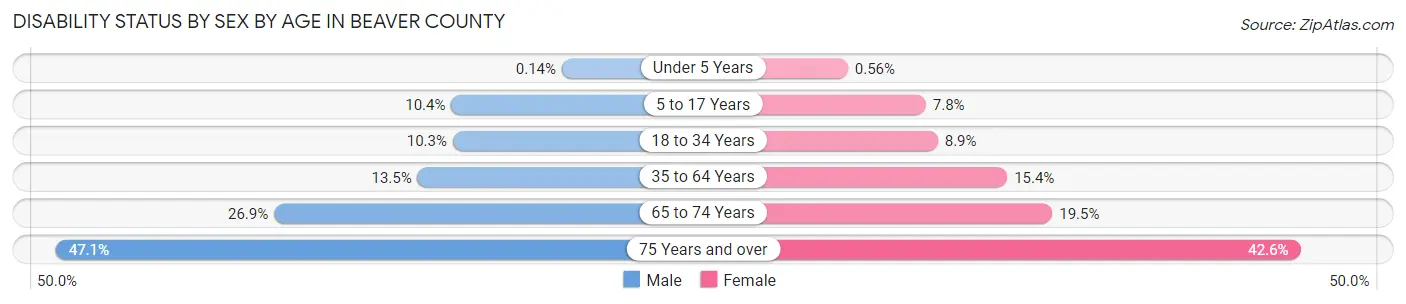
| Age Bracket | Male | Female |
| Under 5 Years | 6 (0.1%) | 22 (0.6%) |
| 5 to 17 Years | 1,283 (10.4%) | 926 (7.8%) |
| 18 to 34 Years | 1,644 (10.3%) | 1,372 (8.9%) |
| 35 to 64 Years | 4,453 (13.5%) | 5,128 (15.3%) |
| 65 to 74 Years | 2,692 (26.9%) | 2,165 (19.5%) |
| 75 Years and over | 2,762 (47.1%) | 3,892 (42.6%) |
Disability Class by Sex by Age in Beaver County
Disability Class: Hearing Difficulty
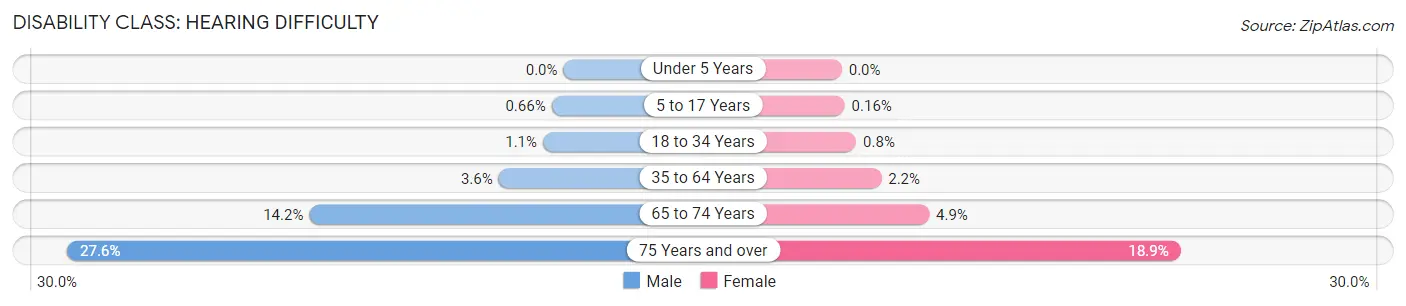
| Age Bracket | Male | Female |
| Under 5 Years | 0 (0.0%) | 0 (0.0%) |
| 5 to 17 Years | 81 (0.7%) | 19 (0.2%) |
| 18 to 34 Years | 182 (1.1%) | 123 (0.8%) |
| 35 to 64 Years | 1,188 (3.6%) | 735 (2.2%) |
| 65 to 74 Years | 1,419 (14.1%) | 538 (4.9%) |
| 75 Years and over | 1,620 (27.6%) | 1,725 (18.9%) |
Disability Class: Vision Difficulty
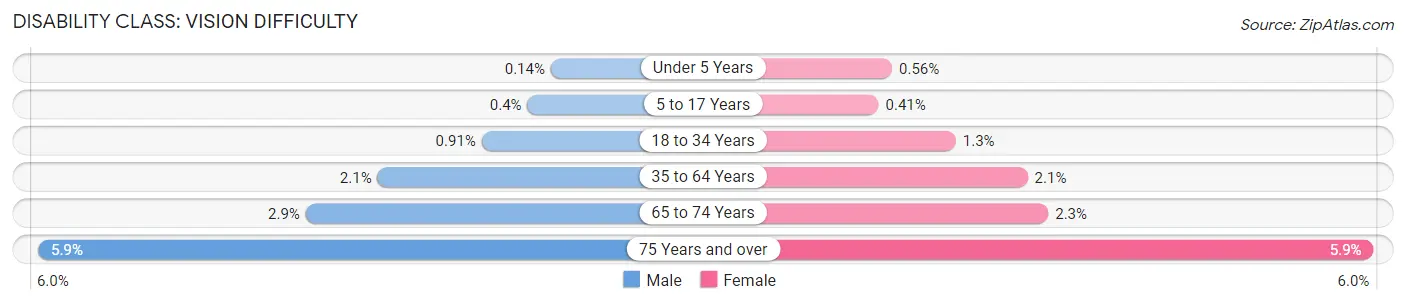
| Age Bracket | Male | Female |
| Under 5 Years | 6 (0.1%) | 22 (0.6%) |
| 5 to 17 Years | 49 (0.4%) | 49 (0.4%) |
| 18 to 34 Years | 146 (0.9%) | 196 (1.3%) |
| 35 to 64 Years | 680 (2.1%) | 691 (2.1%) |
| 65 to 74 Years | 288 (2.9%) | 255 (2.3%) |
| 75 Years and over | 343 (5.9%) | 541 (5.9%) |
Disability Class: Cognitive Difficulty
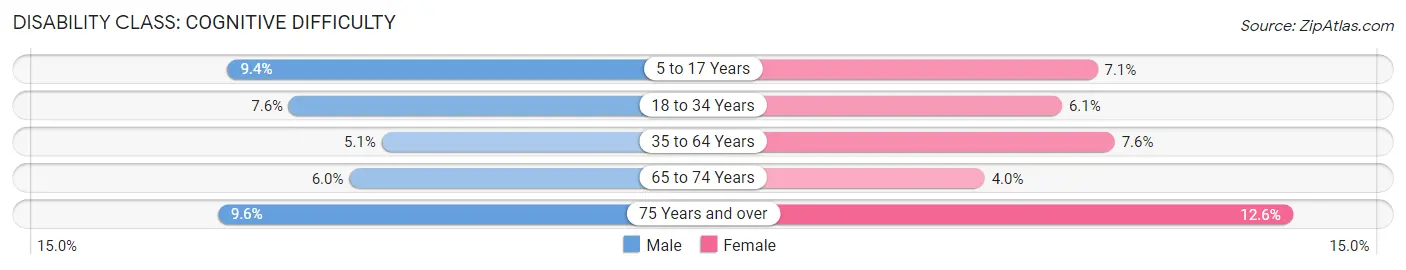
| Age Bracket | Male | Female |
| 5 to 17 Years | 1,154 (9.3%) | 846 (7.1%) |
| 18 to 34 Years | 1,224 (7.6%) | 943 (6.1%) |
| 35 to 64 Years | 1,665 (5.1%) | 2,541 (7.6%) |
| 65 to 74 Years | 598 (6.0%) | 441 (4.0%) |
| 75 Years and over | 564 (9.6%) | 1,148 (12.6%) |
Disability Class: Ambulatory Difficulty
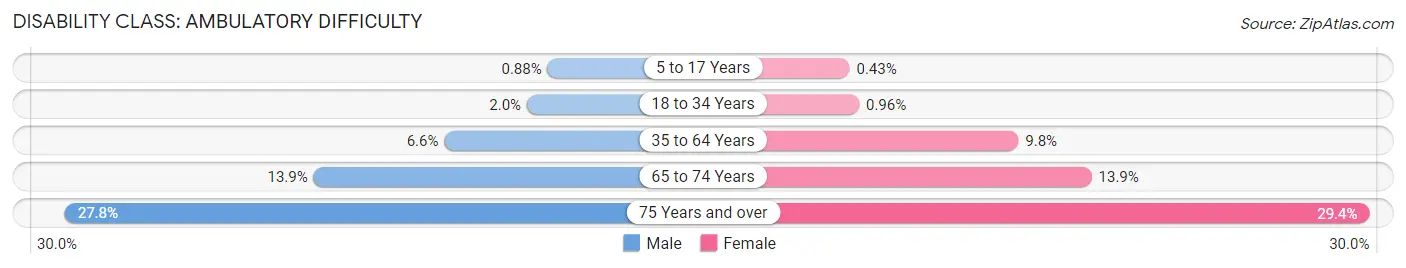
| Age Bracket | Male | Female |
| 5 to 17 Years | 109 (0.9%) | 51 (0.4%) |
| 18 to 34 Years | 325 (2.0%) | 148 (1.0%) |
| 35 to 64 Years | 2,182 (6.6%) | 3,283 (9.8%) |
| 65 to 74 Years | 1,395 (13.9%) | 1,541 (13.9%) |
| 75 Years and over | 1,628 (27.8%) | 2,686 (29.4%) |
Disability Class: Self-Care Difficulty
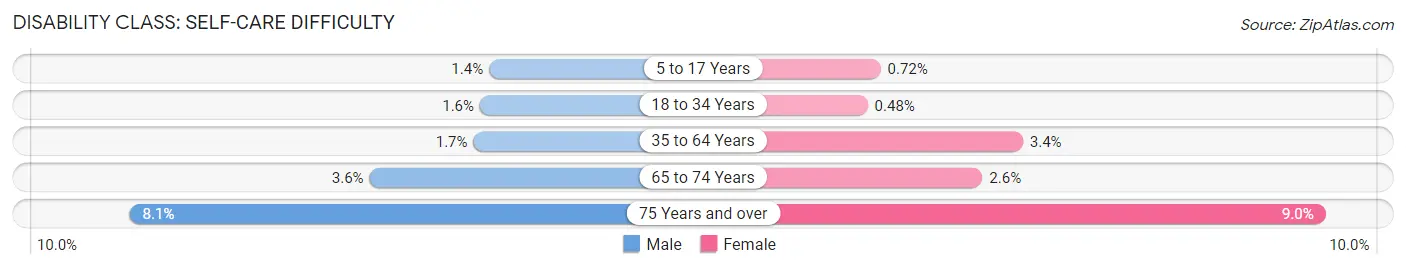
| Age Bracket | Male | Female |
| 5 to 17 Years | 170 (1.4%) | 86 (0.7%) |
| 18 to 34 Years | 249 (1.5%) | 74 (0.5%) |
| 35 to 64 Years | 549 (1.7%) | 1,123 (3.4%) |
| 65 to 74 Years | 361 (3.6%) | 289 (2.6%) |
| 75 Years and over | 472 (8.1%) | 821 (9.0%) |
Technology Access in Beaver County
Computing Device Access in Beaver County
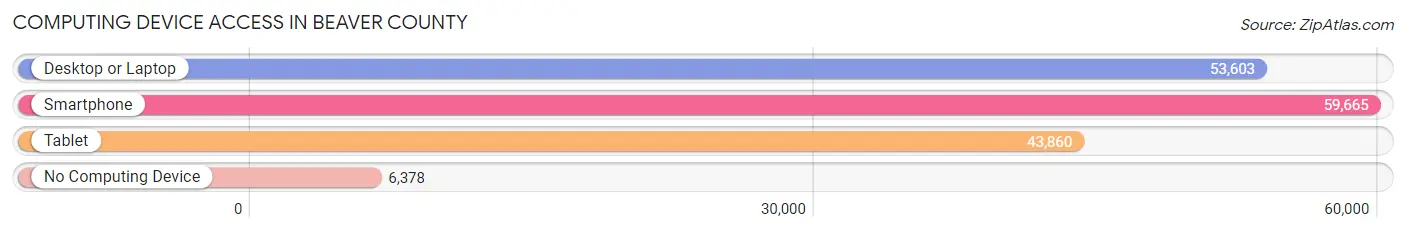
| Device Type | # Households | % Households |
| Desktop or Laptop | 53,603 | 74.5% |
| Smartphone | 59,665 | 82.9% |
| Tablet | 43,860 | 60.9% |
| No Computing Device | 6,378 | 8.9% |
| Total | 71,999 | 100.0% |
Internet Access in Beaver County
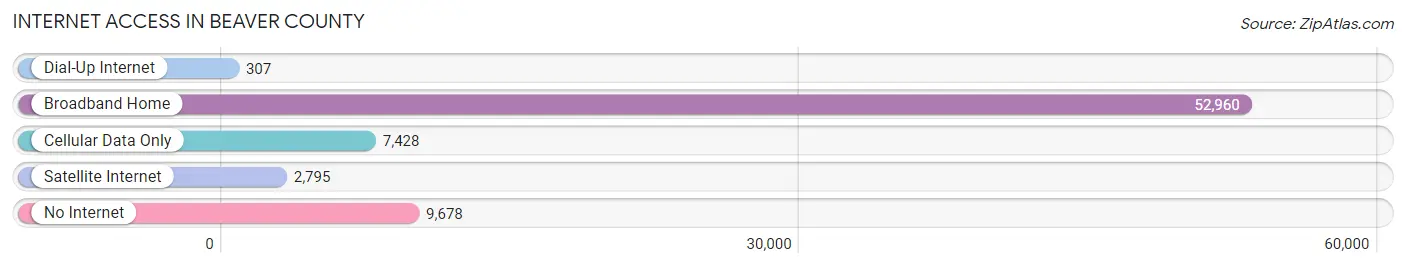
| Internet Type | # Households | % Households |
| Dial-Up Internet | 307 | 0.4% |
| Broadband Home | 52,960 | 73.6% |
| Cellular Data Only | 7,428 | 10.3% |
| Satellite Internet | 2,795 | 3.9% |
| No Internet | 9,678 | 13.4% |
| Total | 71,999 | 100.0% |
Beaver County Summary
Beaver County is a county located in the U.S. state of Pennsylvania. It is located in the southwestern corner of the state, along the Ohio River. As of the 2010 census, the population was 170,539. The county seat is Beaver.
History
Beaver County was formed on March 12, 1800, from parts of Allegheny and Washington Counties. It was named after the Beaver River, which runs through the county. The county was originally part of the Northwest Territory, and was later part of the Ohio Country.
The county was home to many Native American tribes, including the Iroquois, Shawnee, and Delaware. The first European settlers arrived in the area in the late 1700s.
Geography
Beaver County is located in the southwestern corner of Pennsylvania, along the Ohio River. It is bordered by Lawrence County to the north, Allegheny County to the east, Washington County to the south, and Ohio to the west.
The county has a total area of 444 square miles, of which 437 square miles is land and 7 square miles is water. The highest point in the county is the summit of Big Knob, at 1,845 feet.
Economy
Beaver County has a diverse economy, with a mix of manufacturing, retail, and service industries. The county is home to several large employers, including the Shell Oil Refinery, the Beaver Valley Mall, and the Beaver County Airport.
The county is also home to several colleges and universities, including Geneva College, Penn State Beaver, and the Community College of Beaver County.
Demographics
As of the 2010 census, there were 170,539 people, 68,945 households, and 45,844 families living in the county. The population density was 389.3 people per square mile. There were 75,817 housing units at an average density of 173.2 per square mile.
The racial makeup of the county was 94.2% White, 3.2% Black or African American, 0.2% Native American, 0.7% Asian, 0.1% Pacific Islander, 0.5% from other races, and 1.2% from two or more races. 1.7% of the population were Hispanic or Latino of any race.
The median income for a household in the county was $45,844, and the median income for a family was $54,817. The per capita income for the county was $22,945. About 8.2% of families and 11.2% of the population were below the poverty line, including 15.2% of those under age 18 and 6.7% of those age 65 or over.
Common Questions
What is Per Capita Income in Beaver County?
Per Capita income in Beaver County is $37,649.
What is the Median Family Income in Beaver County?
Median Family Income in Beaver County is $86,197.
What is the Median Household income in Beaver County?
Median Household Income in Beaver County is $67,194.
What is Income or Wage Gap in Beaver County?
Income or Wage Gap in Beaver County is 31.0%.
Women in Beaver County earn 69.0 cents for every dollar earned by a man.
What is Family Income Deficit in Beaver County?
Family Income Deficit in Beaver County is $12,172.
Families that are below poverty line in Beaver County earn $12,172 less on average than the poverty threshold level.
What is Inequality or Gini Index in Beaver County?
Inequality or Gini Index in Beaver County is 0.44.
What is the Total Population of Beaver County?
Total Population of Beaver County is 167,629.
What is the Total Male Population of Beaver County?
Total Male Population of Beaver County is 82,169.
What is the Total Female Population of Beaver County?
Total Female Population of Beaver County is 85,460.
What is the Ratio of Males per 100 Females in Beaver County?
There are 96.15 Males per 100 Females in Beaver County.
What is the Ratio of Females per 100 Males in Beaver County?
There are 104.01 Females per 100 Males in Beaver County.
What is the Median Population Age in Beaver County?
Median Population Age in Beaver County is 44.9 Years.
What is the Average Family Size in Beaver County
Average Family Size in Beaver County is 2.9 People.
What is the Average Household Size in Beaver County
Average Household Size in Beaver County is 2.3 People.
How Large is the Labor Force in Beaver County?
There are 85,208 People in the Labor Forcein in Beaver County.
What is the Percentage of People in the Labor Force in Beaver County?
61.2% of People are in the Labor Force in Beaver County.
What is the Unemployment Rate in Beaver County?
Unemployment Rate in Beaver County is 5.6%.