Allegheny County, PA Map & Demographics
Allegheny County Map
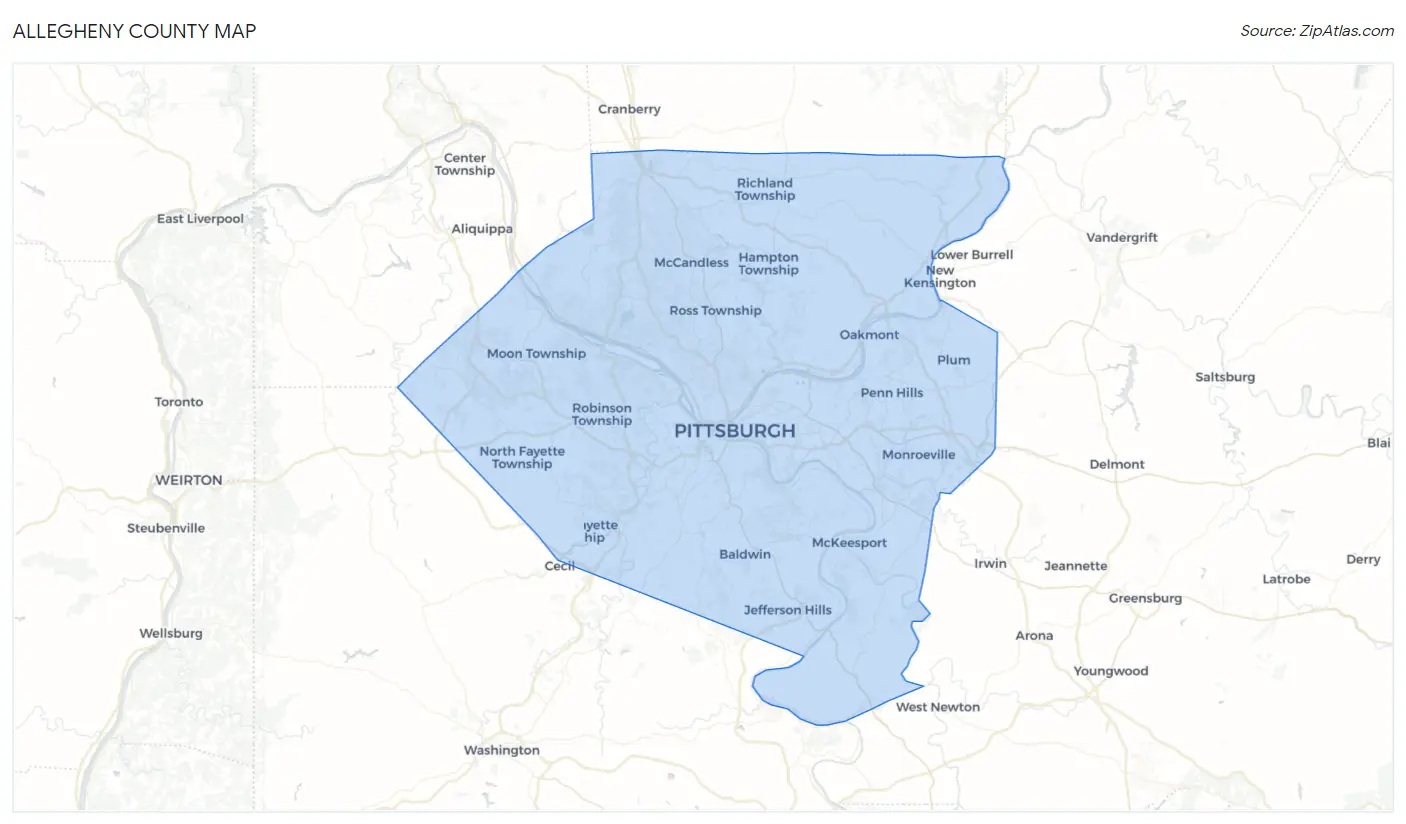
Allegheny County Overview
$45,939
PER CAPITA INCOME
$102,710
AVG FAMILY INCOME
$72,537
AVG HOUSEHOLD INCOME
28.0%
WAGE / INCOME GAP [ % ]
72.0¢/ $1
WAGE / INCOME GAP [ $ ]
$11,417
FAMILY INCOME DEFICIT
0.48
INEQUALITY / GINI INDEX
1,245,310
TOTAL POPULATION
607,557
MALE POPULATION
637,753
FEMALE POPULATION
95.27
MALES / 100 FEMALES
104.97
FEMALES / 100 MALES
40.6
MEDIAN AGE
3.0
AVG FAMILY SIZE
2.2
AVG HOUSEHOLD SIZE
674,236
LABOR FORCE [ PEOPLE ]
64.8%
PERCENT IN LABOR FORCE
4.9%
UNEMPLOYMENT RATE
Income in Allegheny County
Income Overview in Allegheny County
Per Capita Income in Allegheny County is $45,939, while median incomes of families and households are $102,710 and $72,537 respectively.
| Characteristic | Number | Measure |
| Per Capita Income | 1,245,310 | $45,939 |
| Median Family Income | 302,324 | $102,710 |
| Mean Family Income | 302,324 | $132,517 |
| Median Household Income | 545,637 | $72,537 |
| Mean Household Income | 545,637 | $102,371 |
| Income Deficit | 302,324 | $11,417 |
| Wage / Income Gap (%) | 1,245,310 | 27.96% |
| Wage / Income Gap ($) | 1,245,310 | 72.04¢ per $1 |
| Gini / Inequality Index | 1,245,310 | 0.48 |
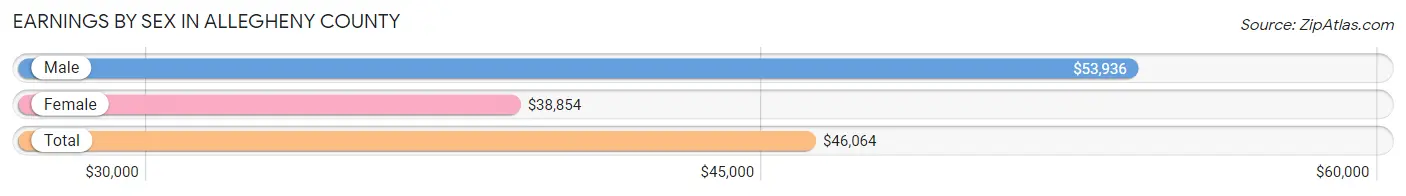
Earnings by Sex in Allegheny County
Average Earnings in Allegheny County are $46,064, $53,936 for men and $38,854 for women, a difference of 28.0%.
| Sex | Number | Average Earnings |
| Male | 365,627 (51.6%) | $53,936 |
| Female | 342,261 (48.3%) | $38,854 |
| Total | 707,888 (100.0%) | $46,064 |
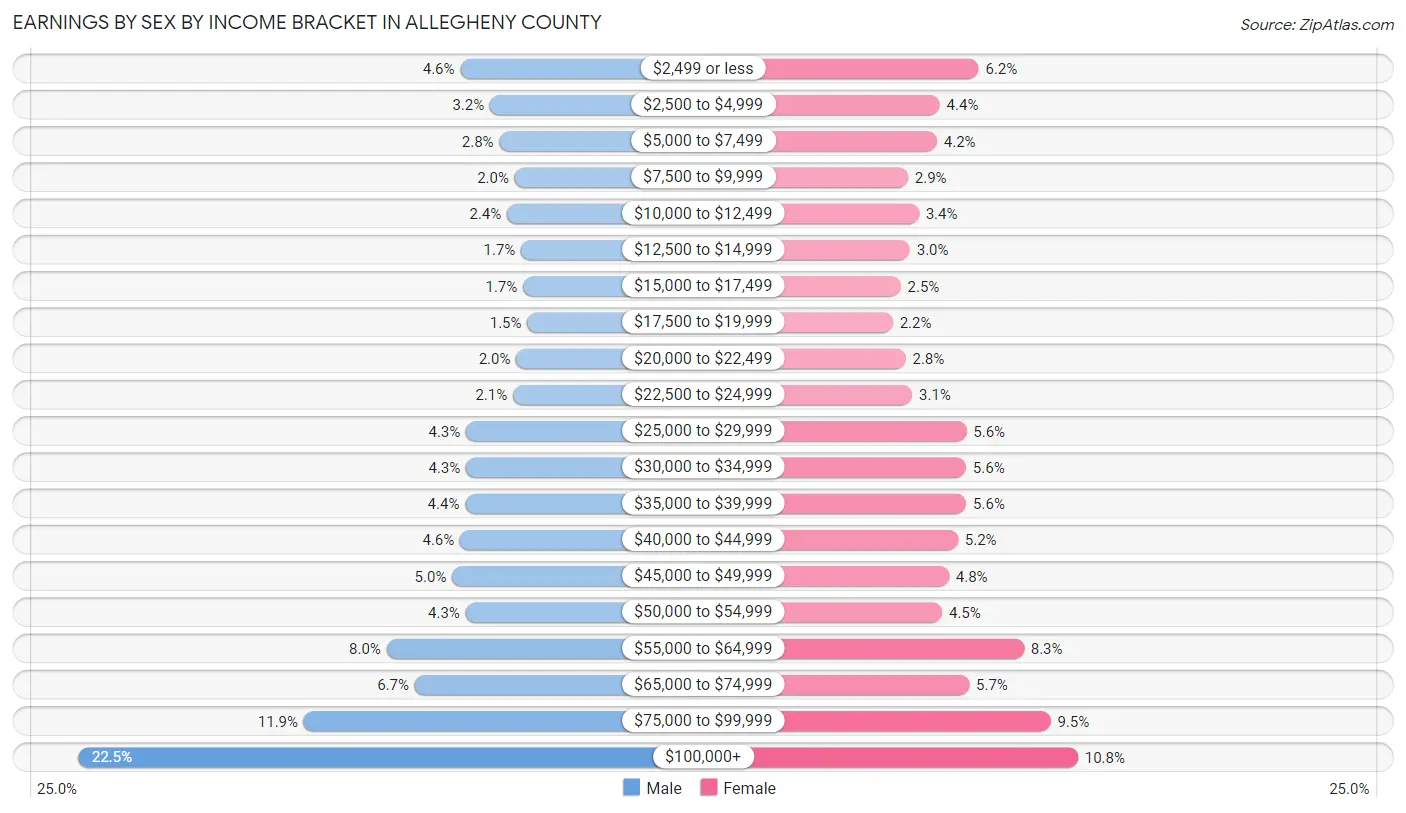
Earnings by Sex by Income Bracket in Allegheny County
The most common earnings brackets in Allegheny County are $100,000+ for men (82,120 | 22.5%) and $100,000+ for women (37,029 | 10.8%).
| Income | Male | Female |
| $2,499 or less | 16,798 (4.6%) | 21,104 (6.2%) |
| $2,500 to $4,999 | 11,694 (3.2%) | 14,895 (4.3%) |
| $5,000 to $7,499 | 10,101 (2.8%) | 14,444 (4.2%) |
| $7,500 to $9,999 | 7,472 (2.0%) | 9,793 (2.9%) |
| $10,000 to $12,499 | 8,779 (2.4%) | 11,536 (3.4%) |
| $12,500 to $14,999 | 6,367 (1.7%) | 10,095 (2.9%) |
| $15,000 to $17,499 | 6,035 (1.7%) | 8,625 (2.5%) |
| $17,500 to $19,999 | 5,300 (1.5%) | 7,357 (2.1%) |
| $20,000 to $22,499 | 7,200 (2.0%) | 9,402 (2.8%) |
| $22,500 to $24,999 | 7,767 (2.1%) | 10,481 (3.1%) |
| $25,000 to $29,999 | 15,804 (4.3%) | 19,161 (5.6%) |
| $30,000 to $34,999 | 15,805 (4.3%) | 19,115 (5.6%) |
| $35,000 to $39,999 | 15,950 (4.4%) | 19,138 (5.6%) |
| $40,000 to $44,999 | 16,824 (4.6%) | 17,797 (5.2%) |
| $45,000 to $49,999 | 18,177 (5.0%) | 16,377 (4.8%) |
| $50,000 to $54,999 | 15,854 (4.3%) | 15,254 (4.5%) |
| $55,000 to $64,999 | 29,410 (8.0%) | 28,377 (8.3%) |
| $65,000 to $74,999 | 24,583 (6.7%) | 19,619 (5.7%) |
| $75,000 to $99,999 | 43,587 (11.9%) | 32,662 (9.5%) |
| $100,000+ | 82,120 (22.5%) | 37,029 (10.8%) |
| Total | 365,627 (100.0%) | 342,261 (100.0%) |
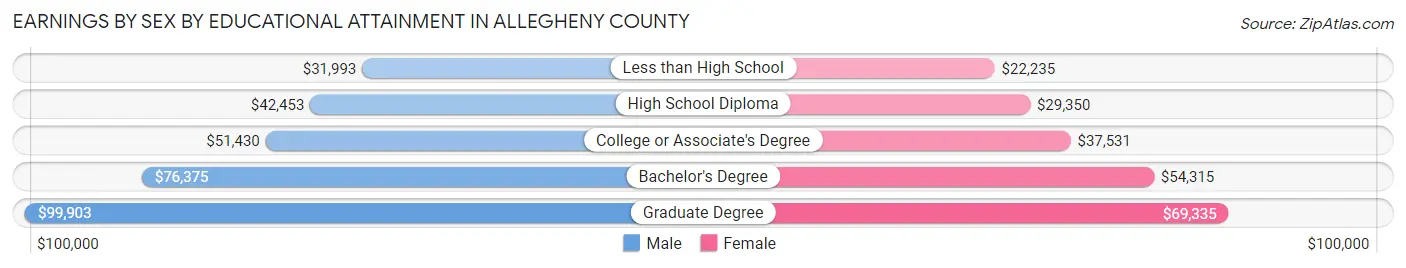
Earnings by Sex by Educational Attainment in Allegheny County
Average earnings in Allegheny County are $60,610 for men and $45,168 for women, a difference of 25.5%. Men with an educational attainment of graduate degree enjoy the highest average annual earnings of $99,903, while those with less than high school education earn the least with $31,993. Women with an educational attainment of graduate degree earn the most with the average annual earnings of $69,335, while those with less than high school education have the smallest earnings of $22,235.
| Educational Attainment | Male Income | Female Income |
| Less than High School | $31,993 | $22,235 |
| High School Diploma | $42,453 | $29,350 |
| College or Associate's Degree | $51,430 | $37,531 |
| Bachelor's Degree | $76,375 | $54,315 |
| Graduate Degree | $99,903 | $69,335 |
| Total | $60,610 | $45,168 |
Family Income in Allegheny County
Family Income Brackets in Allegheny County
According to the Allegheny County family income data, there are 65,907 families falling into the $100,000 to $149,999 income range, which is the most common income bracket and makes up 21.8% of all families. Conversely, the $10,000 to $14,999 income bracket is the least frequent group with only 5,140 families (1.7%) belonging to this category.
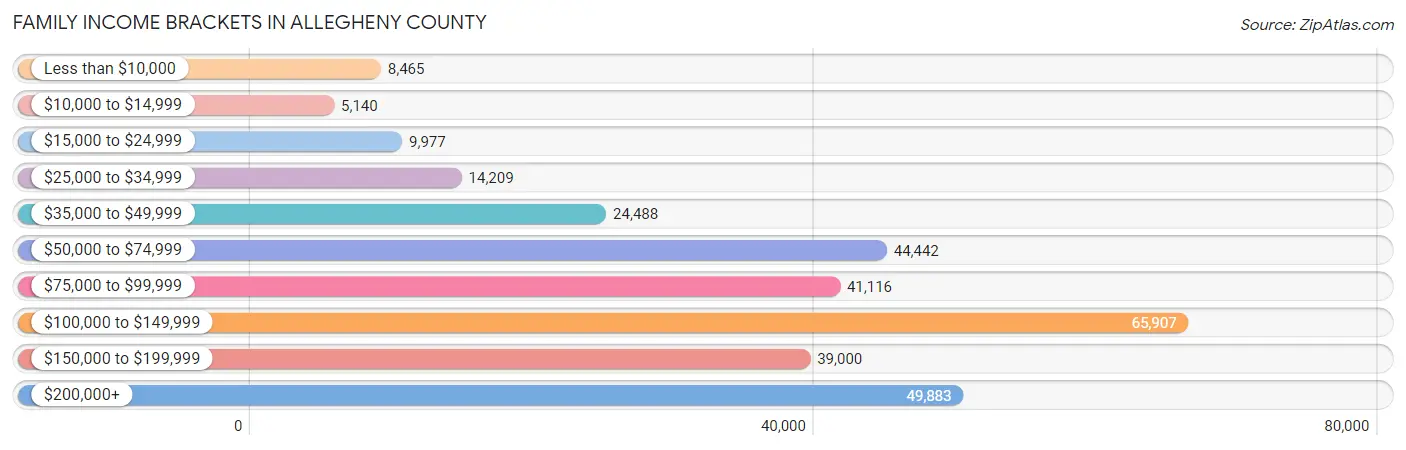
| Income Bracket | # Families | % Families |
| Less than $10,000 | 8,465 | 2.8% |
| $10,000 to $14,999 | 5,140 | 1.7% |
| $15,000 to $24,999 | 9,977 | 3.3% |
| $25,000 to $34,999 | 14,209 | 4.7% |
| $35,000 to $49,999 | 24,488 | 8.1% |
| $50,000 to $74,999 | 44,442 | 14.7% |
| $75,000 to $99,999 | 41,116 | 13.6% |
| $100,000 to $149,999 | 65,907 | 21.8% |
| $150,000 to $199,999 | 39,000 | 12.9% |
| $200,000+ | 49,883 | 16.5% |
Family Income by Famaliy Size in Allegheny County
4-person families (51,175 | 16.9%) account for the highest median family income in Allegheny County with $134,973 per family, while 2-person families (158,512 | 52.4%) have the highest median income of $42,806 per family member.
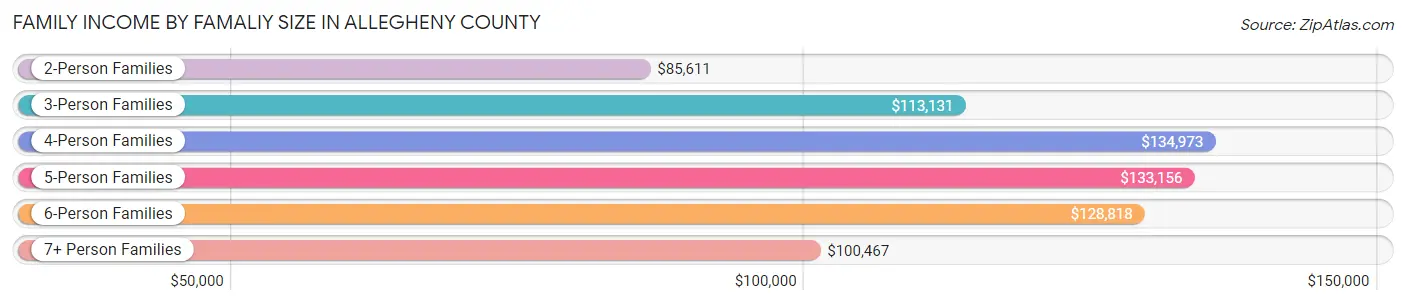
| Income Bracket | # Families | Median Income |
| 2-Person Families | 158,512 (52.4%) | $85,611 |
| 3-Person Families | 66,945 (22.1%) | $113,131 |
| 4-Person Families | 51,175 (16.9%) | $134,973 |
| 5-Person Families | 18,580 (6.1%) | $133,156 |
| 6-Person Families | 4,878 (1.6%) | $128,818 |
| 7+ Person Families | 2,234 (0.7%) | $100,467 |
| Total | 302,324 (100.0%) | $102,710 |
Family Income by Number of Earners in Allegheny County
The median family income in Allegheny County is $102,710, with families comprising 3+ earners (31,578) having the highest median family income of $157,363, while families with no earners (44,976) have the lowest median family income of $51,956, accounting for 10.4% and 14.9% of families, respectively.
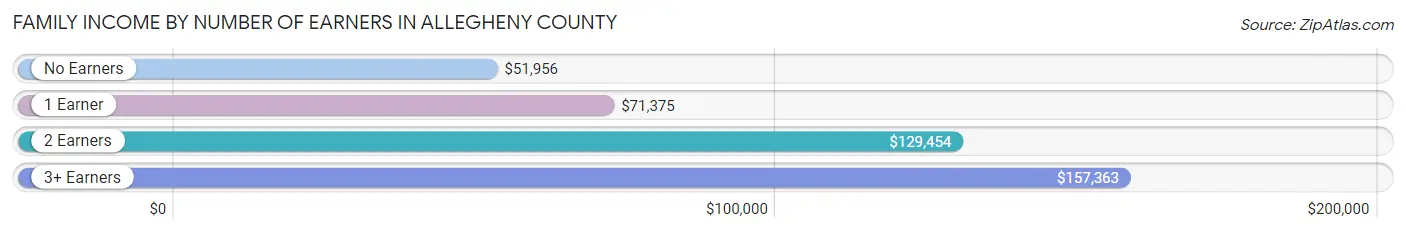
| Number of Earners | # Families | Median Income |
| No Earners | 44,976 (14.9%) | $51,956 |
| 1 Earner | 91,324 (30.2%) | $71,375 |
| 2 Earners | 134,446 (44.5%) | $129,454 |
| 3+ Earners | 31,578 (10.4%) | $157,363 |
| Total | 302,324 (100.0%) | $102,710 |
Household Income in Allegheny County
Household Income Brackets in Allegheny County
With 91,121 households falling in the category, the $100,000 to $149,999 income range is the most frequent in Allegheny County, accounting for 16.7% of all households. In contrast, only 22,371 households (4.1%) fall into the $10,000 to $14,999 income bracket, making it the least populous group.
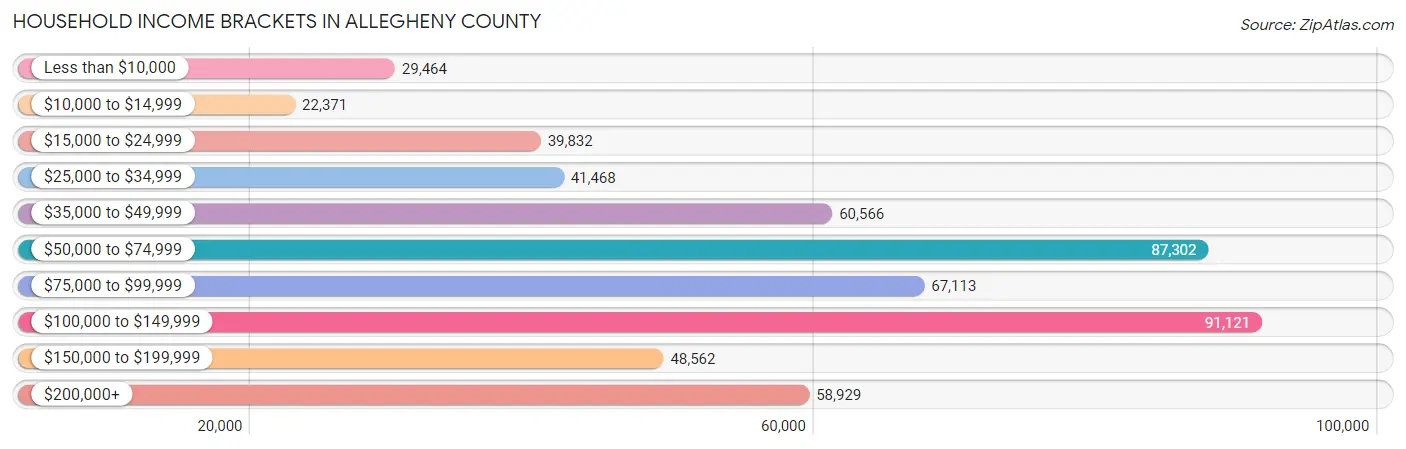
| Income Bracket | # Households | % Households |
| Less than $10,000 | 29,464 | 5.4% |
| $10,000 to $14,999 | 22,371 | 4.1% |
| $15,000 to $24,999 | 39,832 | 7.3% |
| $25,000 to $34,999 | 41,468 | 7.6% |
| $35,000 to $49,999 | 60,566 | 11.1% |
| $50,000 to $74,999 | 87,302 | 16.0% |
| $75,000 to $99,999 | 67,113 | 12.3% |
| $100,000 to $149,999 | 91,121 | 16.7% |
| $150,000 to $199,999 | 48,562 | 8.9% |
| $200,000+ | 58,929 | 10.8% |
Household Income by Householder Age in Allegheny County
The median household income in Allegheny County is $72,537, with the highest median household income of $89,751 found in the 45 to 64 years age bracket for the primary householder. A total of 187,085 households (34.3%) fall into this category. Meanwhile, the 15 to 24 years age bracket for the primary householder has the lowest median household income of $33,842, with 19,858 households (3.6%) in this group.
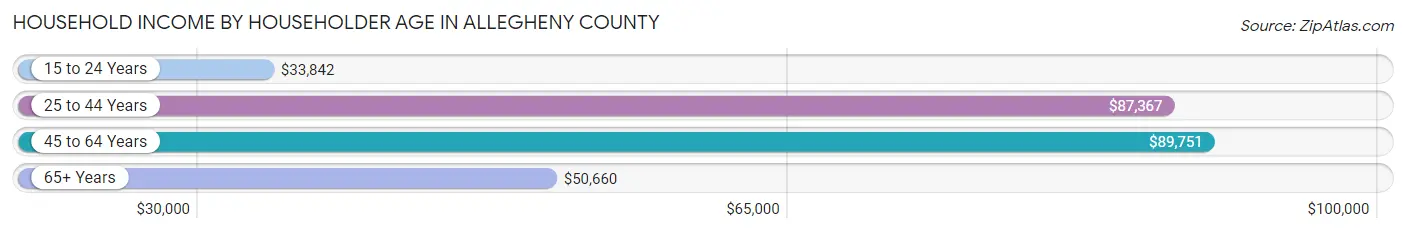
| Income Bracket | # Households | Median Income |
| 15 to 24 Years | 19,858 (3.6%) | $33,842 |
| 25 to 44 Years | 178,696 (32.8%) | $87,367 |
| 45 to 64 Years | 187,085 (34.3%) | $89,751 |
| 65+ Years | 159,998 (29.3%) | $50,660 |
| Total | 545,637 (100.0%) | $72,537 |
Poverty in Allegheny County
Income Below Poverty by Sex and Age in Allegheny County
With 9.9% poverty level for males and 12.2% for females among the residents of Allegheny County, 18 to 24 year old males and 18 to 24 year old females are the most vulnerable to poverty, with 9,087 males (19.5%) and 11,667 females (26.1%) in their respective age groups living below the poverty level.
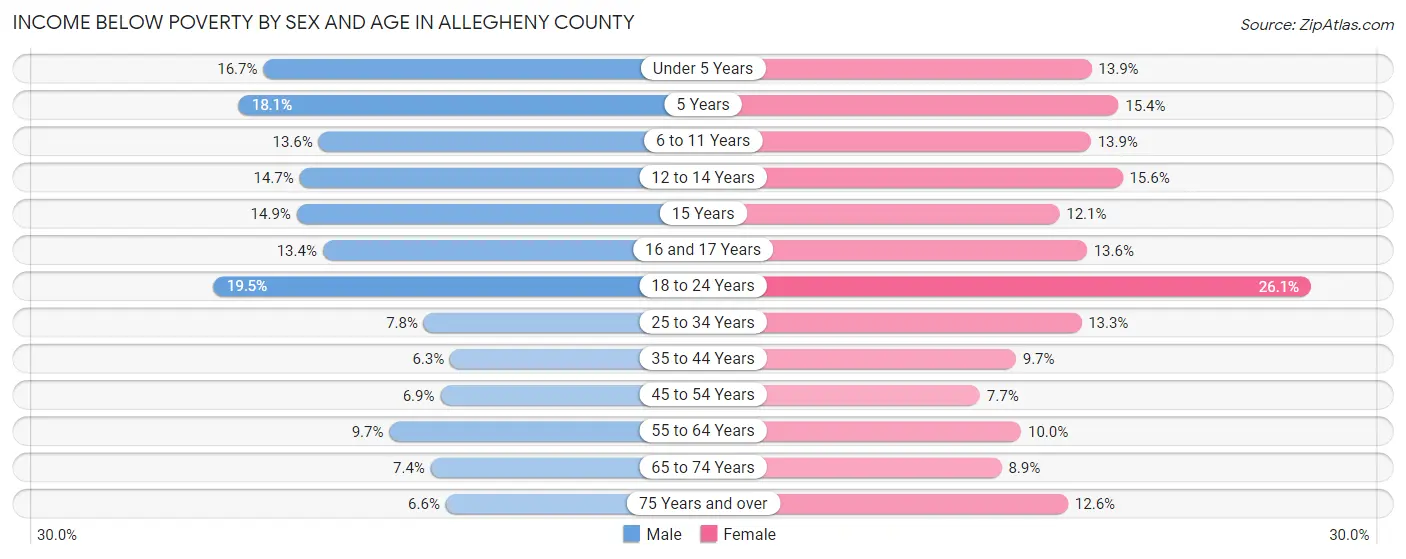
| Age Bracket | Male | Female |
| Under 5 Years | 5,283 (16.7%) | 4,234 (13.9%) |
| 5 Years | 1,098 (18.1%) | 991 (15.4%) |
| 6 to 11 Years | 5,333 (13.6%) | 5,030 (13.9%) |
| 12 to 14 Years | 2,909 (14.7%) | 2,993 (15.6%) |
| 15 Years | 1,035 (14.8%) | 747 (12.1%) |
| 16 and 17 Years | 1,761 (13.4%) | 1,792 (13.6%) |
| 18 to 24 Years | 9,087 (19.5%) | 11,667 (26.1%) |
| 25 to 34 Years | 7,322 (7.8%) | 12,236 (13.3%) |
| 35 to 44 Years | 5,003 (6.3%) | 7,403 (9.7%) |
| 45 to 54 Years | 4,859 (6.9%) | 5,541 (7.7%) |
| 55 to 64 Years | 8,022 (9.7%) | 8,922 (10.0%) |
| 65 to 74 Years | 4,704 (7.4%) | 6,532 (8.9%) |
| 75 Years and over | 2,463 (6.6%) | 7,620 (12.6%) |
| Total | 58,879 (9.9%) | 75,708 (12.2%) |
Income Above Poverty by Sex and Age in Allegheny County
According to the poverty statistics in Allegheny County, males aged 35 to 44 years and females aged 45 to 54 years are the age groups that are most secure financially, with 93.7% of males and 92.3% of females in these age groups living above the poverty line.
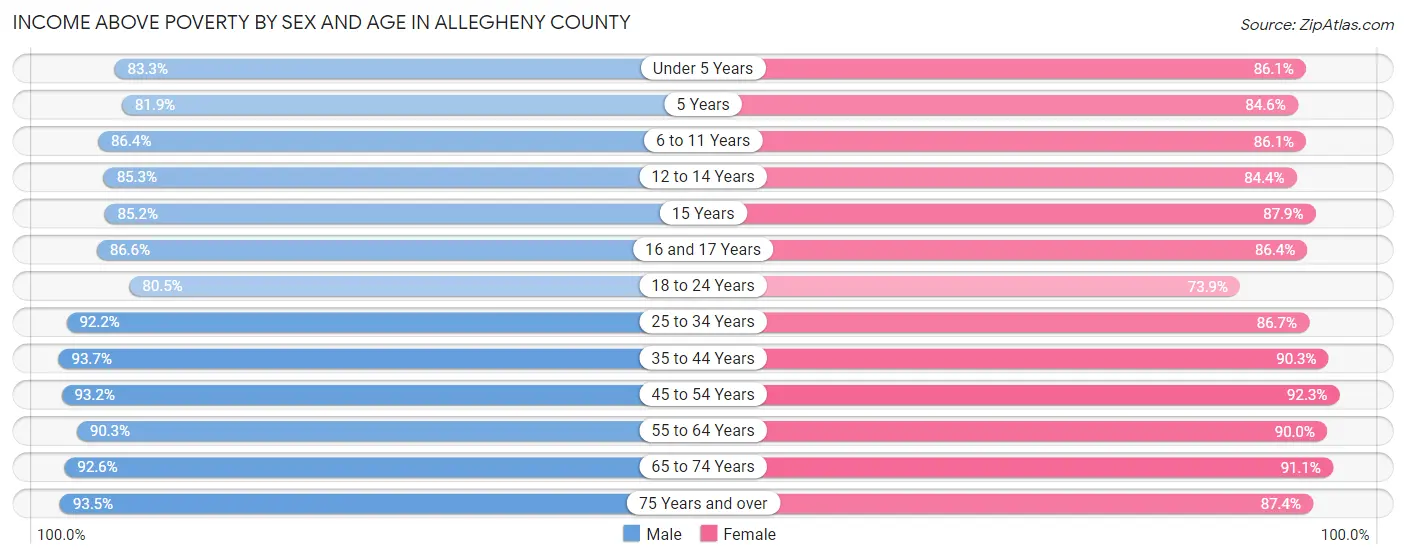
| Age Bracket | Male | Female |
| Under 5 Years | 26,340 (83.3%) | 26,219 (86.1%) |
| 5 Years | 4,977 (81.9%) | 5,444 (84.6%) |
| 6 to 11 Years | 33,807 (86.4%) | 31,266 (86.1%) |
| 12 to 14 Years | 16,897 (85.3%) | 16,160 (84.4%) |
| 15 Years | 5,935 (85.2%) | 5,420 (87.9%) |
| 16 and 17 Years | 11,379 (86.6%) | 11,342 (86.4%) |
| 18 to 24 Years | 37,616 (80.5%) | 32,998 (73.9%) |
| 25 to 34 Years | 86,971 (92.2%) | 79,548 (86.7%) |
| 35 to 44 Years | 74,333 (93.7%) | 69,017 (90.3%) |
| 45 to 54 Years | 66,069 (93.1%) | 66,509 (92.3%) |
| 55 to 64 Years | 74,726 (90.3%) | 80,518 (90.0%) |
| 65 to 74 Years | 58,985 (92.6%) | 66,927 (91.1%) |
| 75 Years and over | 35,140 (93.4%) | 52,893 (87.4%) |
| Total | 533,175 (90.1%) | 544,261 (87.8%) |
Income Below Poverty Among Married-Couple Families in Allegheny County
The poverty statistics for married-couple families in Allegheny County show that 2.6% or 5,909 of the total 225,854 families live below the poverty line. Families with 5 or more children have the highest poverty rate of 17.9%, comprising of 135 families. On the other hand, families with no children have the lowest poverty rate of 2.4%, which includes 3,441 families.
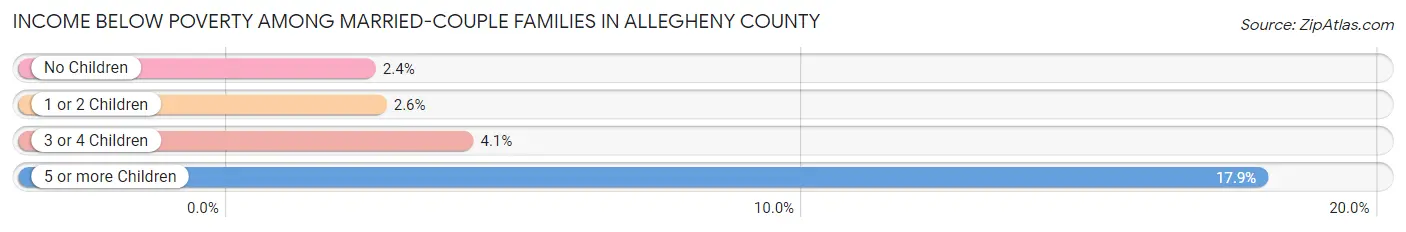
| Children | Above Poverty | Below Poverty |
| No Children | 139,680 (97.6%) | 3,441 (2.4%) |
| 1 or 2 Children | 66,541 (97.4%) | 1,772 (2.6%) |
| 3 or 4 Children | 13,106 (95.9%) | 561 (4.1%) |
| 5 or more Children | 618 (82.1%) | 135 (17.9%) |
| Total | 219,945 (97.4%) | 5,909 (2.6%) |
Income Below Poverty Among Single-Parent Households in Allegheny County
According to the poverty data in Allegheny County, 9.8% or 1,991 single-father households and 22.6% or 12,657 single-mother households are living below the poverty line. Among single-father households, those with 3 or 4 children have the highest poverty rate, with 363 households (30.1%) experiencing poverty. Likewise, among single-mother households, those with 5 or more children have the highest poverty rate, with 561 households (89.6%) falling below the poverty line.
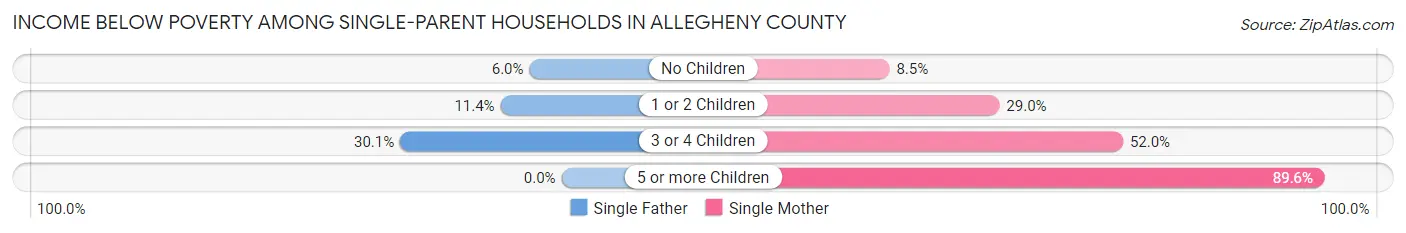
| Children | Single Father | Single Mother |
| No Children | 597 (6.0%) | 2,090 (8.5%) |
| 1 or 2 Children | 1,031 (11.4%) | 7,726 (29.0%) |
| 3 or 4 Children | 363 (30.1%) | 2,280 (52.0%) |
| 5 or more Children | 0 (0.0%) | 561 (89.6%) |
| Total | 1,991 (9.8%) | 12,657 (22.6%) |
Income Below Poverty Among Married-Couple vs Single-Parent Households in Allegheny County
The poverty data for Allegheny County shows that 5,909 of the married-couple family households (2.6%) and 14,648 of the single-parent households (19.2%) are living below the poverty level. Within the married-couple family households, those with 5 or more children have the highest poverty rate, with 135 households (17.9%) falling below the poverty line. Among the single-parent households, those with 5 or more children have the highest poverty rate, with 561 household (78.8%) living below poverty.
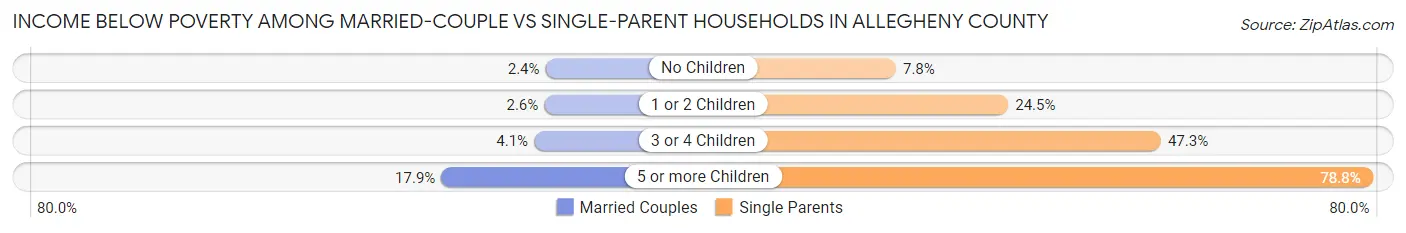
| Children | Married-Couple Families | Single-Parent Households |
| No Children | 3,441 (2.4%) | 2,687 (7.8%) |
| 1 or 2 Children | 1,772 (2.6%) | 8,757 (24.5%) |
| 3 or 4 Children | 561 (4.1%) | 2,643 (47.3%) |
| 5 or more Children | 135 (17.9%) | 561 (78.8%) |
| Total | 5,909 (2.6%) | 14,648 (19.2%) |
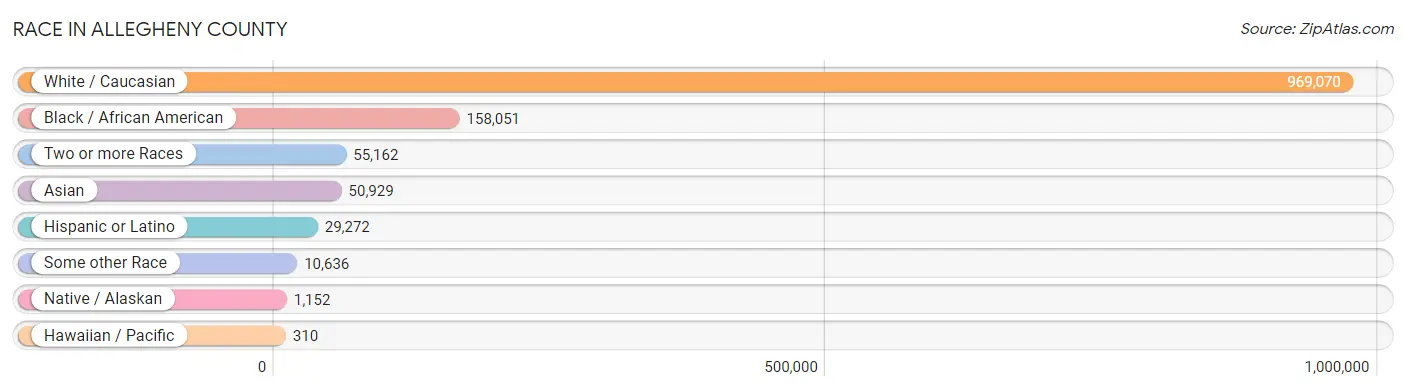
Race in Allegheny County
The most populous races in Allegheny County are White / Caucasian (969,070 | 77.8%), Black / African American (158,051 | 12.7%), and Two or more Races (55,162 | 4.4%).
| Race | # Population | % Population |
| Asian | 50,929 | 4.1% |
| Black / African American | 158,051 | 12.7% |
| Hawaiian / Pacific | 310 | 0.0% |
| Hispanic or Latino | 29,272 | 2.4% |
| Native / Alaskan | 1,152 | 0.1% |
| White / Caucasian | 969,070 | 77.8% |
| Two or more Races | 55,162 | 4.4% |
| Some other Race | 10,636 | 0.9% |
| Total | 1,245,310 | 100.0% |
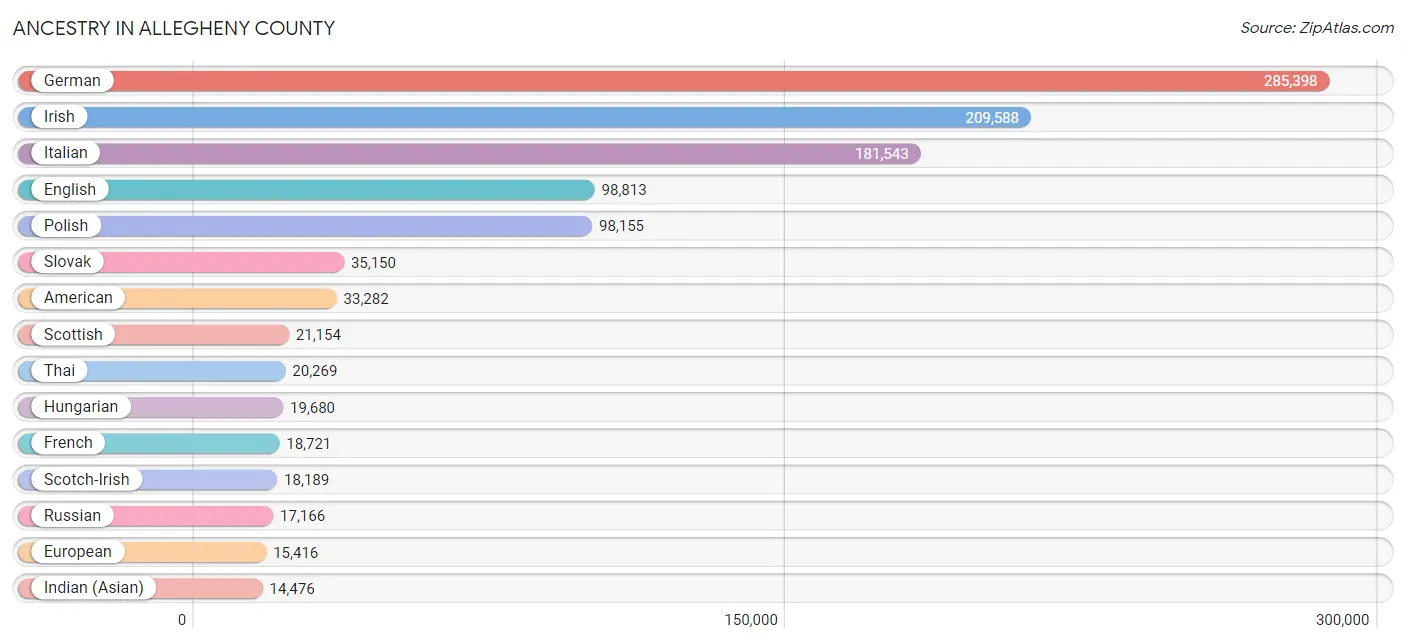
Ancestry in Allegheny County
The most populous ancestries reported in Allegheny County are German (285,398 | 22.9%), Irish (209,588 | 16.8%), Italian (181,543 | 14.6%), English (98,813 | 7.9%), and Polish (98,155 | 7.9%), together accounting for 70.1% of all Allegheny County residents.
| Ancestry | # Population | % Population |
| Afghan | 292 | 0.0% |
| African | 8,555 | 0.7% |
| Alaska Native | 22 | 0.0% |
| Albanian | 271 | 0.0% |
| Aleut | 4 | 0.0% |
| Alsatian | 41 | 0.0% |
| American | 33,282 | 2.7% |
| Apache | 146 | 0.0% |
| Arab | 10,105 | 0.8% |
| Argentinean | 663 | 0.1% |
| Armenian | 535 | 0.0% |
| Assyrian / Chaldean / Syriac | 5 | 0.0% |
| Australian | 541 | 0.0% |
| Austrian | 4,570 | 0.4% |
| Bahamian | 201 | 0.0% |
| Bangladeshi | 9 | 0.0% |
| Barbadian | 156 | 0.0% |
| Basque | 27 | 0.0% |
| Belgian | 1,245 | 0.1% |
| Belizean | 16 | 0.0% |
| Bermudan | 30 | 0.0% |
| Bhutanese | 2,515 | 0.2% |
| Blackfeet | 1,289 | 0.1% |
| Bolivian | 236 | 0.0% |
| Brazilian | 676 | 0.1% |
| British | 5,058 | 0.4% |
| British West Indian | 59 | 0.0% |
| Bulgarian | 625 | 0.1% |
| Burmese | 4,838 | 0.4% |
| Cajun | 50 | 0.0% |
| Cambodian | 82 | 0.0% |
| Canadian | 1,349 | 0.1% |
| Cape Verdean | 108 | 0.0% |
| Carpatho Rusyn | 589 | 0.1% |
| Celtic | 61 | 0.0% |
| Central American | 2,641 | 0.2% |
| Central American Indian | 315 | 0.0% |
| Cherokee | 2,175 | 0.2% |
| Cheyenne | 15 | 0.0% |
| Chickasaw | 38 | 0.0% |
| Chilean | 400 | 0.0% |
| Chippewa | 80 | 0.0% |
| Choctaw | 58 | 0.0% |
| Colombian | 1,589 | 0.1% |
| Comanche | 61 | 0.0% |
| Costa Rican | 192 | 0.0% |
| Creek | 116 | 0.0% |
| Croatian | 14,217 | 1.1% |
| Crow | 4 | 0.0% |
| Cuban | 913 | 0.1% |
| Cypriot | 37 | 0.0% |
| Czech | 6,877 | 0.5% |
| Czechoslovakian | 3,117 | 0.3% |
| Danish | 1,849 | 0.2% |
| Delaware | 111 | 0.0% |
| Dominican | 1,276 | 0.1% |
| Dutch | 7,937 | 0.6% |
| Dutch West Indian | 14 | 0.0% |
| Eastern European | 8,701 | 0.7% |
| Ecuadorian | 325 | 0.0% |
| Egyptian | 649 | 0.1% |
| English | 98,813 | 7.9% |
| Estonian | 16 | 0.0% |
| Ethiopian | 293 | 0.0% |
| European | 15,416 | 1.2% |
| Filipino | 623 | 0.1% |
| Finnish | 722 | 0.1% |
| French | 18,721 | 1.5% |
| French American Indian | 43 | 0.0% |
| French Canadian | 2,612 | 0.2% |
| German | 285,398 | 22.9% |
| German Russian | 65 | 0.0% |
| Ghanaian | 499 | 0.0% |
| Greek | 7,229 | 0.6% |
| Guamanian / Chamorro | 68 | 0.0% |
| Guatemalan | 1,079 | 0.1% |
| Guyanese | 169 | 0.0% |
| Haitian | 1,023 | 0.1% |
| Hmong | 6 | 0.0% |
| Honduran | 430 | 0.0% |
| Hopi | 14 | 0.0% |
| Houma | 8 | 0.0% |
| Hungarian | 19,680 | 1.6% |
| Icelander | 121 | 0.0% |
| Indian (Asian) | 14,476 | 1.2% |
| Indonesian | 396 | 0.0% |
| Iranian | 867 | 0.1% |
| Iraqi | 604 | 0.1% |
| Irish | 209,588 | 16.8% |
| Iroquois | 264 | 0.0% |
| Israeli | 702 | 0.1% |
| Italian | 181,543 | 14.6% |
| Jamaican | 2,240 | 0.2% |
| Japanese | 98 | 0.0% |
| Jordanian | 435 | 0.0% |
| Kenyan | 511 | 0.0% |
| Kiowa | 2 | 0.0% |
| Korean | 3,798 | 0.3% |
| Laotian | 350 | 0.0% |
| Latvian | 212 | 0.0% |
| Lebanese | 3,067 | 0.3% |
| Liberian | 146 | 0.0% |
| Lithuanian | 6,744 | 0.5% |
| Lumbee | 25 | 0.0% |
| Luxembourger | 137 | 0.0% |
| Macedonian | 222 | 0.0% |
| Malaysian | 160 | 0.0% |
| Maltese | 58 | 0.0% |
| Mexican | 9,419 | 0.8% |
| Mexican American Indian | 146 | 0.0% |
| Mongolian | 217 | 0.0% |
| Moroccan | 624 | 0.1% |
| Native Hawaiian | 324 | 0.0% |
| Navajo | 92 | 0.0% |
| New Zealander | 24 | 0.0% |
| Nicaraguan | 108 | 0.0% |
| Nigerian | 1,799 | 0.1% |
| Northern European | 1,135 | 0.1% |
| Norwegian | 3,780 | 0.3% |
| Okinawan | 15 | 0.0% |
| Ottawa | 4 | 0.0% |
| Pakistani | 714 | 0.1% |
| Palestinian | 150 | 0.0% |
| Panamanian | 400 | 0.0% |
| Paraguayan | 237 | 0.0% |
| Pennsylvania German | 931 | 0.1% |
| Peruvian | 616 | 0.1% |
| Polish | 98,155 | 7.9% |
| Portuguese | 1,125 | 0.1% |
| Potawatomi | 3 | 0.0% |
| Puerto Rican | 6,308 | 0.5% |
| Puget Sound Salish | 8 | 0.0% |
| Romanian | 2,144 | 0.2% |
| Russian | 17,166 | 1.4% |
| Salvadoran | 411 | 0.0% |
| Samoan | 154 | 0.0% |
| Scandinavian | 1,390 | 0.1% |
| Scotch-Irish | 18,189 | 1.5% |
| Scottish | 21,154 | 1.7% |
| Seminole | 234 | 0.0% |
| Senegalese | 45 | 0.0% |
| Serbian | 5,053 | 0.4% |
| Shoshone | 31 | 0.0% |
| Sierra Leonean | 19 | 0.0% |
| Sioux | 231 | 0.0% |
| Slavic | 2,660 | 0.2% |
| Slovak | 35,150 | 2.8% |
| Slovene | 3,991 | 0.3% |
| Somali | 245 | 0.0% |
| South African | 212 | 0.0% |
| South American | 4,843 | 0.4% |
| South American Indian | 86 | 0.0% |
| Soviet Union | 44 | 0.0% |
| Spaniard | 1,063 | 0.1% |
| Spanish | 1,428 | 0.1% |
| Sri Lankan | 2,780 | 0.2% |
| Subsaharan African | 13,481 | 1.1% |
| Sudanese | 321 | 0.0% |
| Swedish | 8,904 | 0.7% |
| Swiss | 3,574 | 0.3% |
| Syrian | 2,208 | 0.2% |
| Taiwanese | 5 | 0.0% |
| Thai | 20,269 | 1.6% |
| Tlingit-Haida | 18 | 0.0% |
| Tongan | 12 | 0.0% |
| Trinidadian and Tobagonian | 192 | 0.0% |
| Turkish | 1,207 | 0.1% |
| U.S. Virgin Islander | 78 | 0.0% |
| Ugandan | 70 | 0.0% |
| Ukrainian | 11,214 | 0.9% |
| Uruguayan | 42 | 0.0% |
| Ute | 23 | 0.0% |
| Venezuelan | 735 | 0.1% |
| Vietnamese | 473 | 0.0% |
| Welsh | 13,228 | 1.1% |
| West Indian | 329 | 0.0% |
| Yakama | 4 | 0.0% |
| Yaqui | 44 | 0.0% |
| Yugoslavian | 1,435 | 0.1% |
| Zimbabwean | 19 | 0.0% | View All 180 Rows |
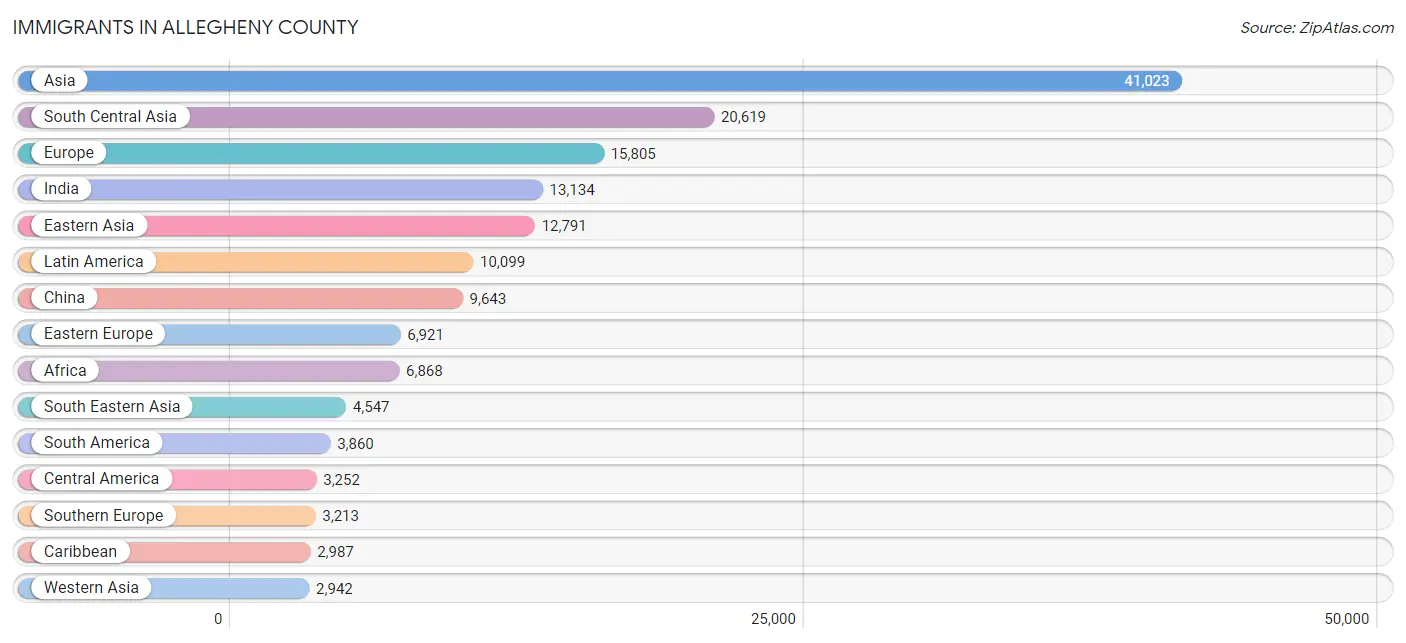
Immigrants in Allegheny County
The most numerous immigrant groups reported in Allegheny County came from Asia (41,023 | 3.3%), South Central Asia (20,619 | 1.7%), Europe (15,805 | 1.3%), India (13,134 | 1.1%), and Eastern Asia (12,791 | 1.0%), together accounting for 8.3% of all Allegheny County residents.
| Immigration Origin | # Population | % Population |
| Afghanistan | 256 | 0.0% |
| Africa | 6,868 | 0.5% |
| Albania | 47 | 0.0% |
| Argentina | 335 | 0.0% |
| Asia | 41,023 | 3.3% |
| Australia | 647 | 0.1% |
| Austria | 77 | 0.0% |
| Bahamas | 170 | 0.0% |
| Bangladesh | 397 | 0.0% |
| Belarus | 262 | 0.0% |
| Belgium | 152 | 0.0% |
| Belize | 16 | 0.0% |
| Bolivia | 229 | 0.0% |
| Bosnia and Herzegovina | 540 | 0.0% |
| Brazil | 1,092 | 0.1% |
| Bulgaria | 382 | 0.0% |
| Cambodia | 77 | 0.0% |
| Cameroon | 242 | 0.0% |
| Canada | 2,601 | 0.2% |
| Caribbean | 2,987 | 0.2% |
| Central America | 3,252 | 0.3% |
| Chile | 125 | 0.0% |
| China | 9,643 | 0.8% |
| Colombia | 636 | 0.1% |
| Congo | 116 | 0.0% |
| Costa Rica | 109 | 0.0% |
| Croatia | 99 | 0.0% |
| Cuba | 211 | 0.0% |
| Czechoslovakia | 421 | 0.0% |
| Denmark | 24 | 0.0% |
| Dominica | 30 | 0.0% |
| Dominican Republic | 669 | 0.1% |
| Eastern Africa | 1,859 | 0.2% |
| Eastern Asia | 12,791 | 1.0% |
| Eastern Europe | 6,921 | 0.6% |
| Ecuador | 156 | 0.0% |
| Egypt | 349 | 0.0% |
| El Salvador | 243 | 0.0% |
| England | 890 | 0.1% |
| Eritrea | 103 | 0.0% |
| Ethiopia | 242 | 0.0% |
| Europe | 15,805 | 1.3% |
| France | 391 | 0.0% |
| Germany | 2,001 | 0.2% |
| Ghana | 347 | 0.0% |
| Greece | 311 | 0.0% |
| Guatemala | 566 | 0.1% |
| Guyana | 115 | 0.0% |
| Haiti | 361 | 0.0% |
| Honduras | 175 | 0.0% |
| Hong Kong | 324 | 0.0% |
| Hungary | 287 | 0.0% |
| India | 13,134 | 1.1% |
| Indonesia | 269 | 0.0% |
| Iran | 548 | 0.0% |
| Iraq | 431 | 0.0% |
| Ireland | 378 | 0.0% |
| Israel | 384 | 0.0% |
| Italy | 2,513 | 0.2% |
| Jamaica | 1,220 | 0.1% |
| Japan | 918 | 0.1% |
| Jordan | 385 | 0.0% |
| Kazakhstan | 133 | 0.0% |
| Kenya | 721 | 0.1% |
| Korea | 2,202 | 0.2% |
| Kuwait | 93 | 0.0% |
| Latin America | 10,099 | 0.8% |
| Latvia | 45 | 0.0% |
| Lebanon | 181 | 0.0% |
| Liberia | 139 | 0.0% |
| Lithuania | 207 | 0.0% |
| Malaysia | 208 | 0.0% |
| Mexico | 1,948 | 0.2% |
| Middle Africa | 624 | 0.1% |
| Moldova | 43 | 0.0% |
| Morocco | 430 | 0.0% |
| Nepal | 1,791 | 0.1% |
| Netherlands | 168 | 0.0% |
| Nicaragua | 14 | 0.0% |
| Nigeria | 1,177 | 0.1% |
| North Macedonia | 8 | 0.0% |
| Northern Africa | 1,774 | 0.1% |
| Northern Europe | 2,783 | 0.2% |
| Norway | 36 | 0.0% |
| Oceania | 702 | 0.1% |
| Pakistan | 757 | 0.1% |
| Panama | 181 | 0.0% |
| Peru | 359 | 0.0% |
| Philippines | 1,637 | 0.1% |
| Poland | 645 | 0.1% |
| Portugal | 95 | 0.0% |
| Romania | 514 | 0.0% |
| Russia | 1,788 | 0.1% |
| Saudi Arabia | 381 | 0.0% |
| Scotland | 53 | 0.0% |
| Senegal | 36 | 0.0% |
| Serbia | 194 | 0.0% |
| Sierra Leone | 13 | 0.0% |
| Singapore | 76 | 0.0% |
| Somalia | 265 | 0.0% |
| South Africa | 262 | 0.0% |
| South America | 3,860 | 0.3% |
| South Central Asia | 20,619 | 1.7% |
| South Eastern Asia | 4,547 | 0.4% |
| Southern Europe | 3,213 | 0.3% |
| Spain | 288 | 0.0% |
| Sri Lanka | 42 | 0.0% |
| Sudan | 296 | 0.0% |
| Sweden | 215 | 0.0% |
| Switzerland | 89 | 0.0% |
| Syria | 368 | 0.0% |
| Taiwan | 1,125 | 0.1% |
| Thailand | 460 | 0.0% |
| Trinidad and Tobago | 188 | 0.0% |
| Turkey | 486 | 0.0% |
| Uganda | 41 | 0.0% |
| Ukraine | 973 | 0.1% |
| Uruguay | 17 | 0.0% |
| Uzbekistan | 618 | 0.1% |
| Venezuela | 622 | 0.1% |
| Vietnam | 1,492 | 0.1% |
| Western Africa | 2,267 | 0.2% |
| Western Asia | 2,942 | 0.2% |
| Western Europe | 2,888 | 0.2% |
| Zaire | 239 | 0.0% |
| Zimbabwe | 19 | 0.0% | View All 126 Rows |
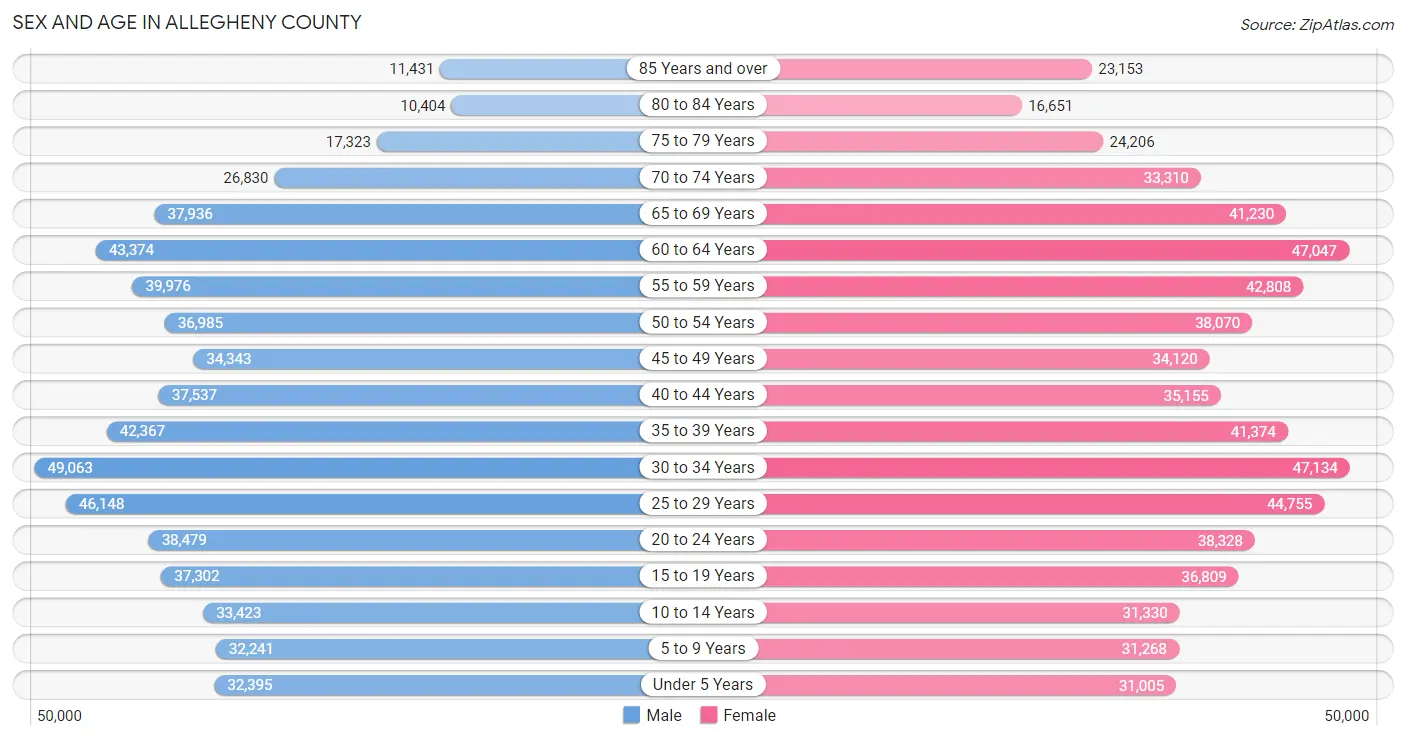
Sex and Age in Allegheny County
Sex and Age in Allegheny County
The most populous age groups in Allegheny County are 30 to 34 Years (49,063 | 8.1%) for men and 30 to 34 Years (47,134 | 7.4%) for women.
| Age Bracket | Male | Female |
| Under 5 Years | 32,395 (5.3%) | 31,005 (4.9%) |
| 5 to 9 Years | 32,241 (5.3%) | 31,268 (4.9%) |
| 10 to 14 Years | 33,423 (5.5%) | 31,330 (4.9%) |
| 15 to 19 Years | 37,302 (6.1%) | 36,809 (5.8%) |
| 20 to 24 Years | 38,479 (6.3%) | 38,328 (6.0%) |
| 25 to 29 Years | 46,148 (7.6%) | 44,755 (7.0%) |
| 30 to 34 Years | 49,063 (8.1%) | 47,134 (7.4%) |
| 35 to 39 Years | 42,367 (7.0%) | 41,374 (6.5%) |
| 40 to 44 Years | 37,537 (6.2%) | 35,155 (5.5%) |
| 45 to 49 Years | 34,343 (5.7%) | 34,120 (5.3%) |
| 50 to 54 Years | 36,985 (6.1%) | 38,070 (6.0%) |
| 55 to 59 Years | 39,976 (6.6%) | 42,808 (6.7%) |
| 60 to 64 Years | 43,374 (7.1%) | 47,047 (7.4%) |
| 65 to 69 Years | 37,936 (6.2%) | 41,230 (6.5%) |
| 70 to 74 Years | 26,830 (4.4%) | 33,310 (5.2%) |
| 75 to 79 Years | 17,323 (2.9%) | 24,206 (3.8%) |
| 80 to 84 Years | 10,404 (1.7%) | 16,651 (2.6%) |
| 85 Years and over | 11,431 (1.9%) | 23,153 (3.6%) |
| Total | 607,557 (100.0%) | 637,753 (100.0%) |
Families and Households in Allegheny County
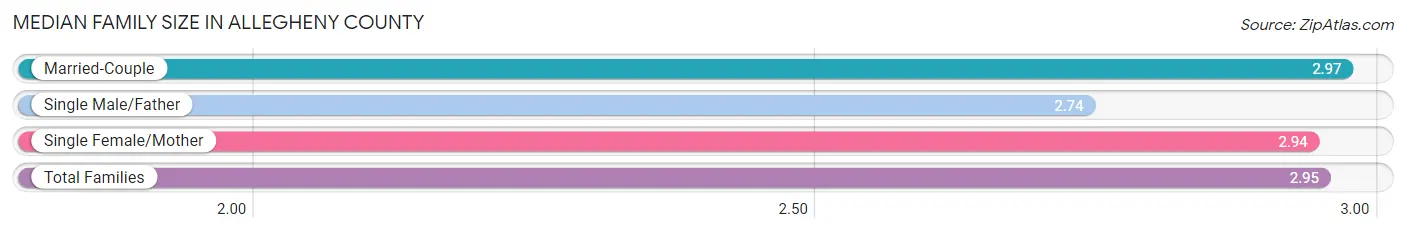
Median Family Size in Allegheny County
The median family size in Allegheny County is 2.95 persons per family, with married-couple families (225,854 | 74.7%) accounting for the largest median family size of 2.97 persons per family. On the other hand, single male/father families (20,343 | 6.7%) represent the smallest median family size with 2.74 persons per family.
| Family Type | # Families | Family Size |
| Married-Couple | 225,854 (74.7%) | 2.97 |
| Single Male/Father | 20,343 (6.7%) | 2.74 |
| Single Female/Mother | 56,127 (18.6%) | 2.94 |
| Total Families | 302,324 (100.0%) | 2.95 |
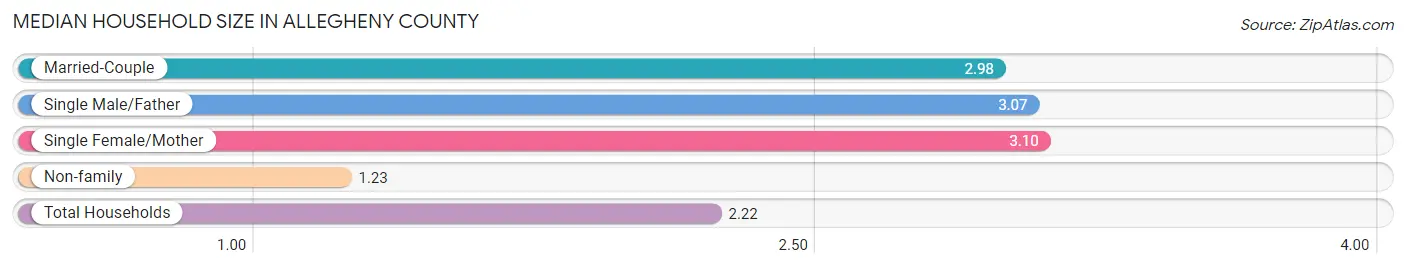
Median Household Size in Allegheny County
The median household size in Allegheny County is 2.22 persons per household, with single female/mother households (56,127 | 10.3%) accounting for the largest median household size of 3.1 persons per household. non-family households (243,313 | 44.6%) represent the smallest median household size with 1.23 persons per household.
| Household Type | # Households | Household Size |
| Married-Couple | 225,854 (41.4%) | 2.98 |
| Single Male/Father | 20,343 (3.7%) | 3.07 |
| Single Female/Mother | 56,127 (10.3%) | 3.10 |
| Non-family | 243,313 (44.6%) | 1.23 |
| Total Households | 545,637 (100.0%) | 2.22 |
Household Size by Marriage Status in Allegheny County
Out of a total of 545,637 households in Allegheny County, 302,324 (55.4%) are family households, while 243,313 (44.6%) are nonfamily households. The most numerous type of family households are 2-person households, comprising 150,585, and the most common type of nonfamily households are 1-person households, comprising 200,673.
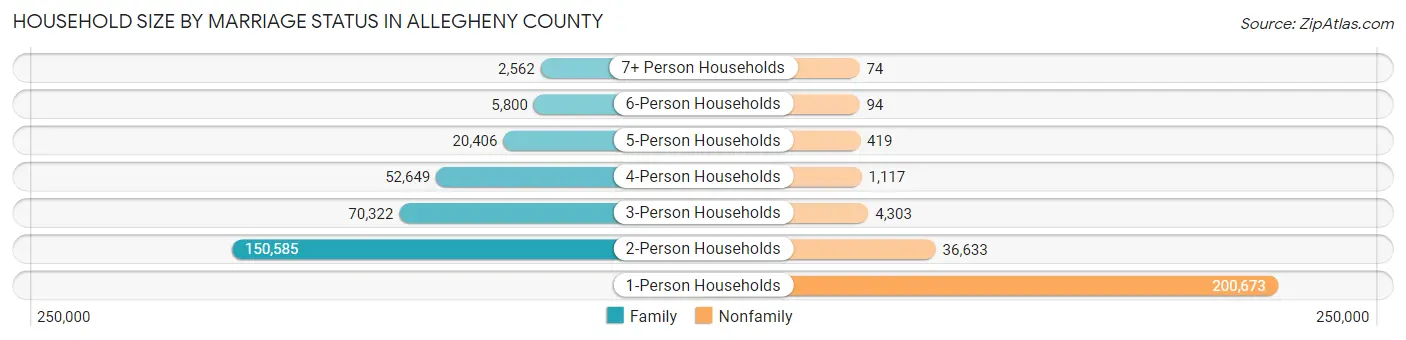
| Household Size | Family Households | Nonfamily Households |
| 1-Person Households | - | 200,673 (36.8%) |
| 2-Person Households | 150,585 (27.6%) | 36,633 (6.7%) |
| 3-Person Households | 70,322 (12.9%) | 4,303 (0.8%) |
| 4-Person Households | 52,649 (9.7%) | 1,117 (0.2%) |
| 5-Person Households | 20,406 (3.7%) | 419 (0.1%) |
| 6-Person Households | 5,800 (1.1%) | 94 (0.0%) |
| 7+ Person Households | 2,562 (0.5%) | 74 (0.0%) |
| Total | 302,324 (55.4%) | 243,313 (44.6%) |
Female Fertility in Allegheny County
Fertility by Age in Allegheny County
Average fertility rate in Allegheny County is 48.0 births per 1,000 women. Women in the age bracket of 20 to 34 years have the highest fertility rate with 77.0 births per 1,000 women. Women in the age bracket of 20 to 34 years acount for 72.8% of all women with births.
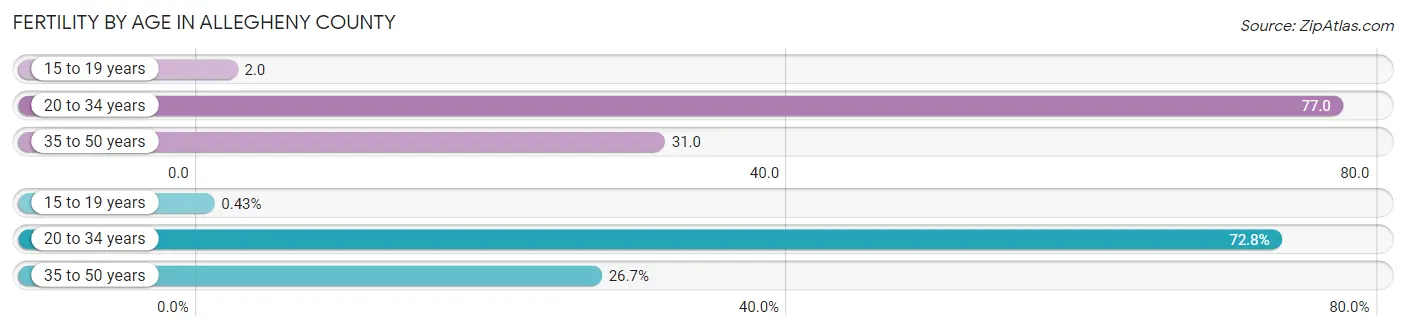
| Age Bracket | Women with Births | Births / 1,000 Women |
| 15 to 19 years | 59 (0.4%) | 2.0 |
| 20 to 34 years | 9,971 (72.8%) | 77.0 |
| 35 to 50 years | 3,658 (26.7%) | 31.0 |
| Total | 13,688 (100.0%) | 48.0 |
Fertility by Age by Marriage Status in Allegheny County
70.6% of women with births (13,688) in Allegheny County are married. The highest percentage of unmarried women with births falls into 15 to 19 years age bracket with 100.0% of them unmarried at the time of birth, while the lowest percentage of unmarried women with births belong to 35 to 50 years age bracket with 19.8% of them unmarried.
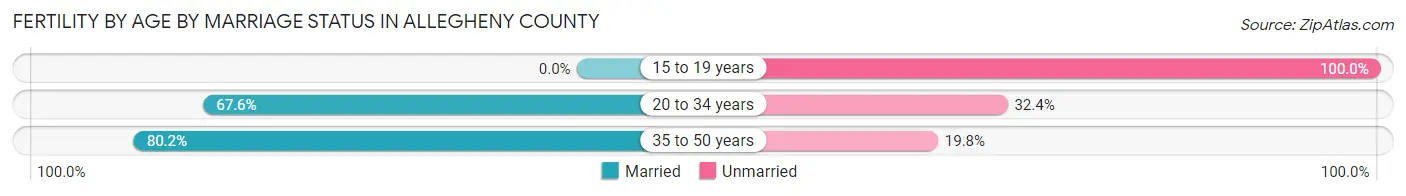
| Age Bracket | Married | Unmarried |
| 15 to 19 years | 0 (0.0%) | 59 (100.0%) |
| 20 to 34 years | 6,740 (67.6%) | 3,231 (32.4%) |
| 35 to 50 years | 2,934 (80.2%) | 724 (19.8%) |
| Total | 9,664 (70.6%) | 4,024 (29.4%) |
Fertility by Education in Allegheny County
Average fertility rate in Allegheny County is 48.0 births per 1,000 women. Women with the education attainment of graduate degree have the highest fertility rate of 69.0 births per 1,000 women, while women with the education attainment of less than high school have the lowest fertility at 19.0 births per 1,000 women. Women with the education attainment of bachelor's degree represent 29.2% of all women with births.
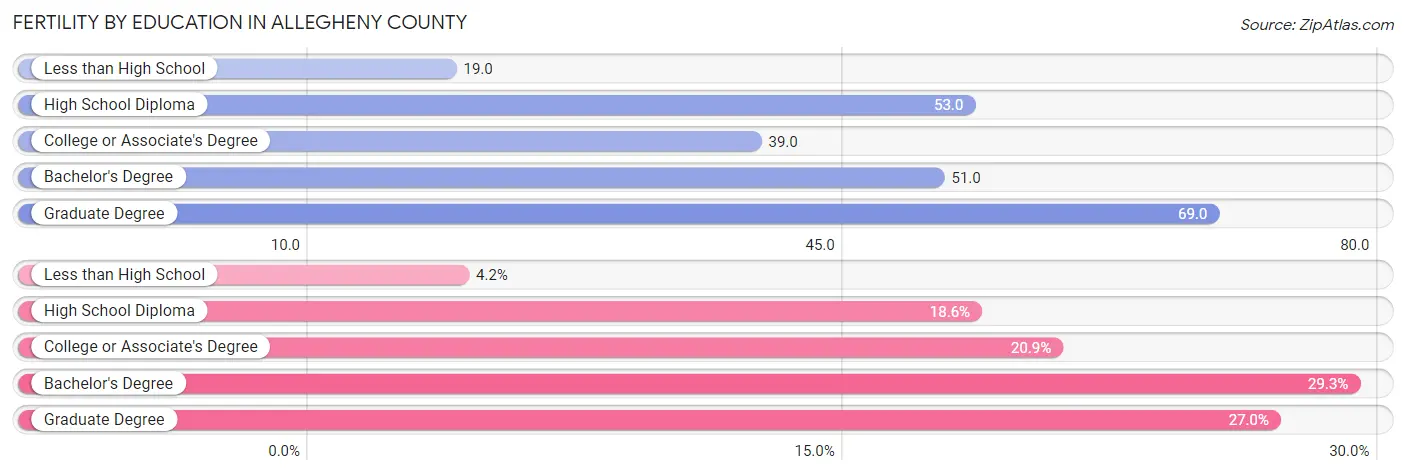
| Educational Attainment | Women with Births | Births / 1,000 Women |
| Less than High School | 576 (4.2%) | 19.0 |
| High School Diploma | 2,549 (18.6%) | 53.0 |
| College or Associate's Degree | 2,861 (20.9%) | 39.0 |
| Bachelor's Degree | 4,004 (29.2%) | 51.0 |
| Graduate Degree | 3,698 (27.0%) | 69.0 |
| Total | 13,688 (100.0%) | 48.0 |
Fertility by Education by Marriage Status in Allegheny County
29.4% of women with births in Allegheny County are unmarried. Women with the educational attainment of graduate degree are most likely to be married with 95.1% of them married at childbirth, while women with the educational attainment of high school diploma are least likely to be married with 71.0% of them unmarried at childbirth.
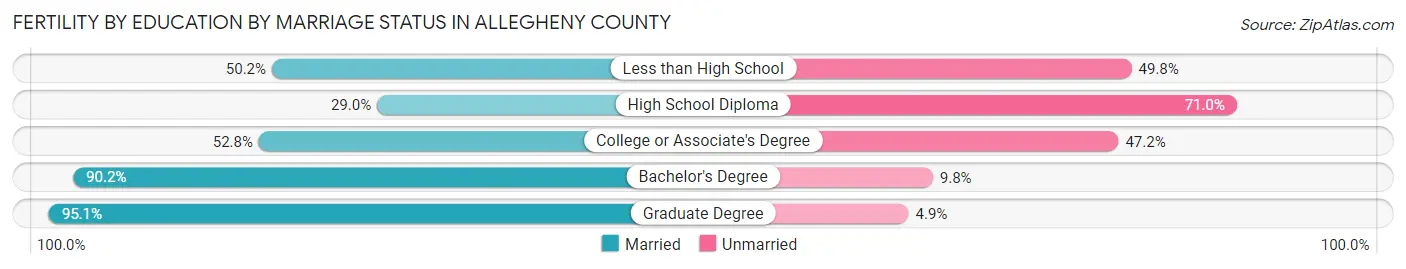
| Educational Attainment | Married | Unmarried |
| Less than High School | 289 (50.2%) | 287 (49.8%) |
| High School Diploma | 739 (29.0%) | 1,810 (71.0%) |
| College or Associate's Degree | 1,511 (52.8%) | 1,350 (47.2%) |
| Bachelor's Degree | 3,612 (90.2%) | 392 (9.8%) |
| Graduate Degree | 3,517 (95.1%) | 181 (4.9%) |
| Total | 9,664 (70.6%) | 4,024 (29.4%) |
Employment Characteristics in Allegheny County
Employment by Class of Employer in Allegheny County
Among the 627,652 employed individuals in Allegheny County, private company employees (416,229 | 66.3%), not-for-profit organizations (104,917 | 16.7%), and local government employees (34,258 | 5.5%) make up the most common classes of employment.
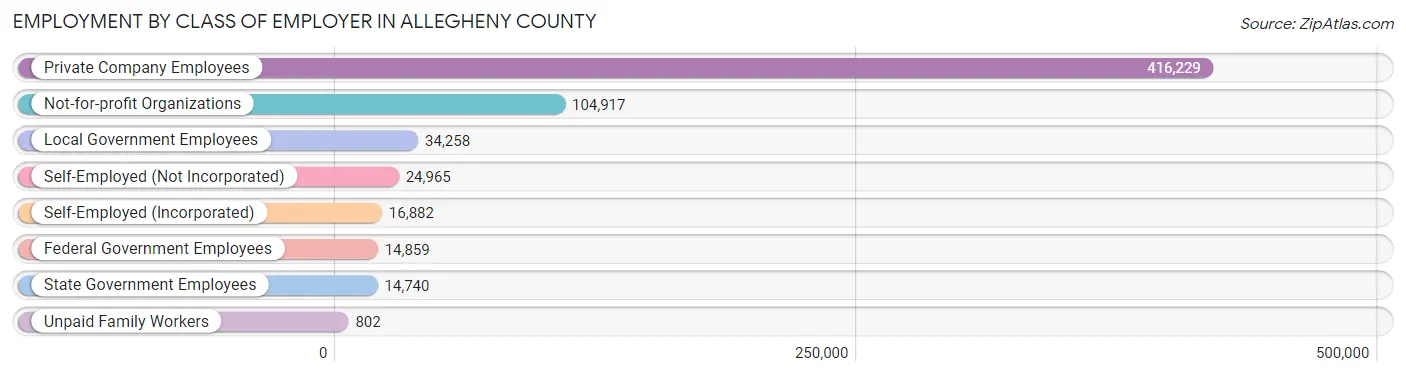
| Employer Class | # Employees | % Employees |
| Private Company Employees | 416,229 | 66.3% |
| Self-Employed (Incorporated) | 16,882 | 2.7% |
| Self-Employed (Not Incorporated) | 24,965 | 4.0% |
| Not-for-profit Organizations | 104,917 | 16.7% |
| Local Government Employees | 34,258 | 5.5% |
| State Government Employees | 14,740 | 2.4% |
| Federal Government Employees | 14,859 | 2.4% |
| Unpaid Family Workers | 802 | 0.1% |
| Total | 627,652 | 100.0% |
Employment Status by Age in Allegheny County
According to the labor force statistics for Allegheny County, out of the total population over 16 years of age (1,040,488), 64.8% or 674,236 individuals are in the labor force, with 4.9% or 33,038 of them unemployed. The age group with the highest labor force participation rate is 30 to 34 years, with 88.4% or 85,038 individuals in the labor force. Within the labor force, the 16 to 19 years age range has the highest percentage of unemployed individuals, with 12.3% or 3,156 of them being unemployed.
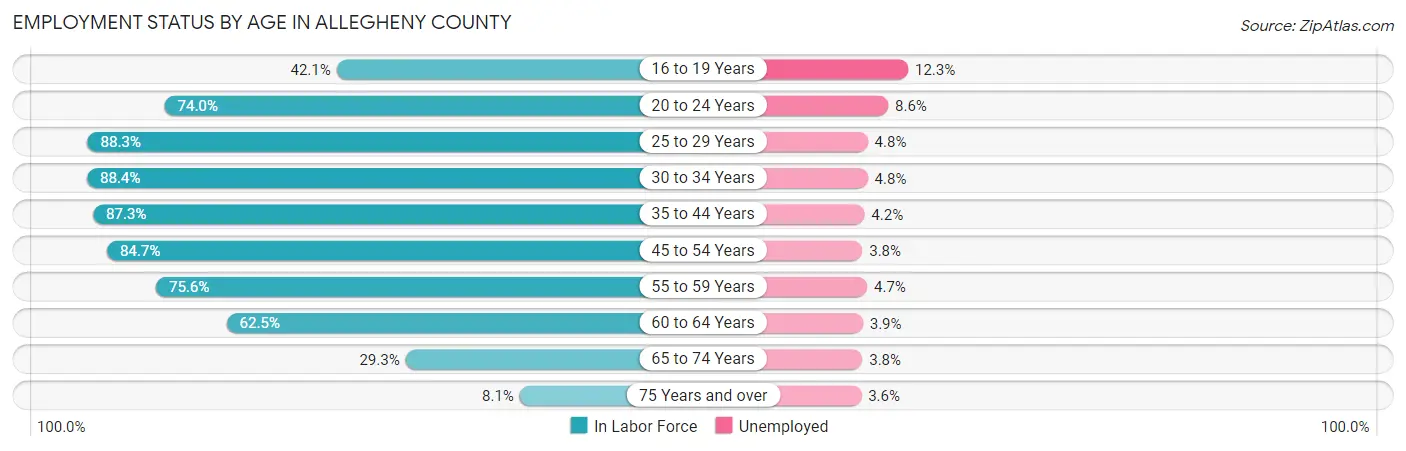
| Age Bracket | In Labor Force | Unemployed |
| 16 to 19 Years | 25,660 (42.1%) | 3,156 (12.3%) |
| 20 to 24 Years | 56,837 (74.0%) | 4,888 (8.6%) |
| 25 to 29 Years | 80,267 (88.3%) | 3,853 (4.8%) |
| 30 to 34 Years | 85,038 (88.4%) | 4,082 (4.8%) |
| 35 to 44 Years | 136,566 (87.3%) | 5,736 (4.2%) |
| 45 to 54 Years | 121,560 (84.7%) | 4,619 (3.8%) |
| 55 to 59 Years | 62,585 (75.6%) | 2,941 (4.7%) |
| 60 to 64 Years | 56,513 (62.5%) | 2,204 (3.9%) |
| 65 to 74 Years | 40,817 (29.3%) | 1,551 (3.8%) |
| 75 Years and over | 8,357 (8.1%) | 301 (3.6%) |
| Total | 674,236 (64.8%) | 33,038 (4.9%) |
Employment Status by Educational Attainment in Allegheny County
According to labor force statistics for Allegheny County, 82.2% of individuals (542,730) out of the total population between 25 and 64 years of age (660,256) are in the labor force, with 4.3% or 23,337 of them being unemployed. The group with the highest labor force participation rate are those with the educational attainment of bachelor's degree or higher, with 89.2% or 285,109 individuals in the labor force. Within the labor force, individuals with less than high school education have the highest percentage of unemployment, with 10.0% or 1,428 of them being unemployed.
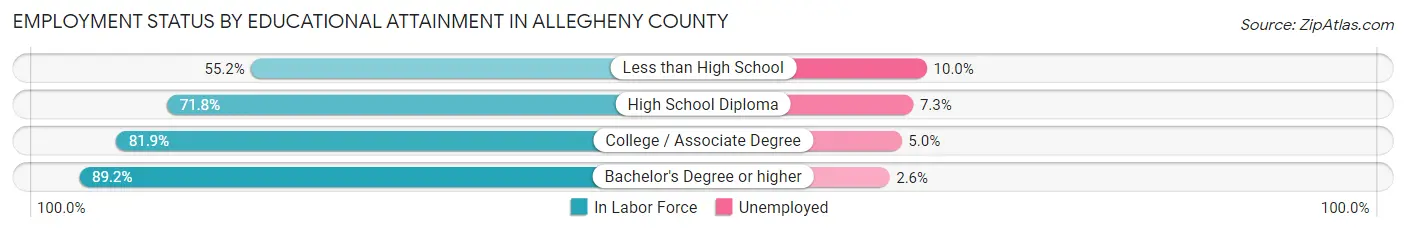
| Educational Attainment | In Labor Force | Unemployed |
| Less than High School | 14,283 (55.2%) | 2,588 (10.0%) |
| High School Diploma | 101,915 (71.8%) | 10,362 (7.3%) |
| College / Associate Degree | 141,531 (81.9%) | 8,640 (5.0%) |
| Bachelor's Degree or higher | 285,109 (89.2%) | 8,310 (2.6%) |
| Total | 542,730 (82.2%) | 28,391 (4.3%) |
Employment Occupations by Sex in Allegheny County
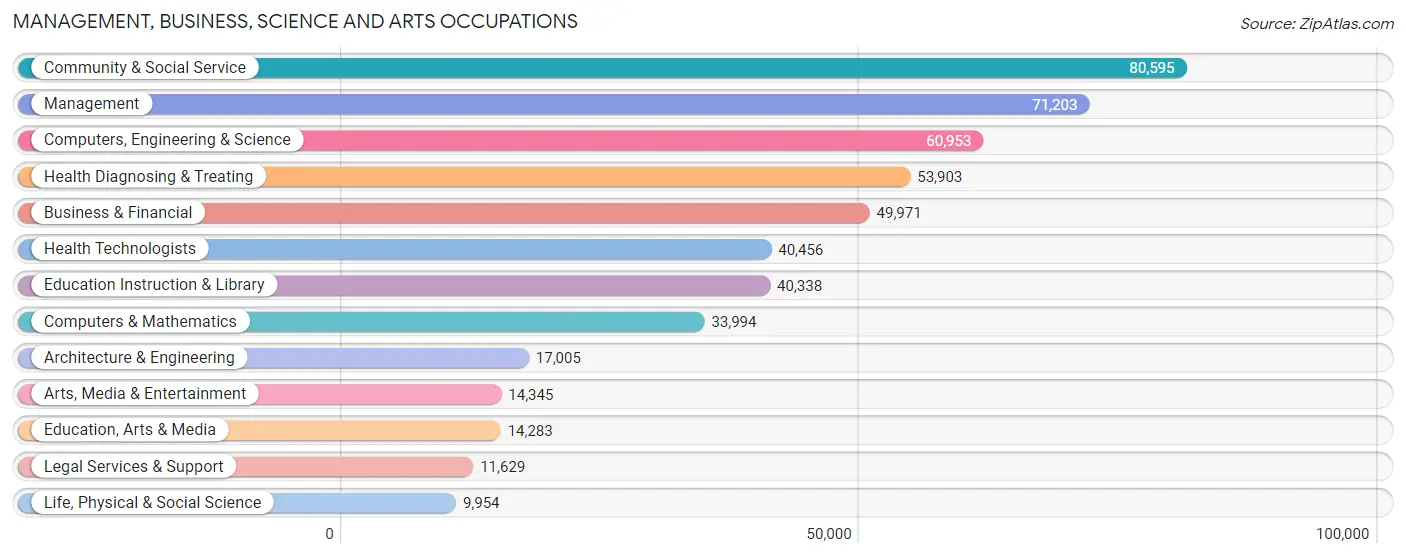
Management, Business, Science and Arts Occupations
The most common Management, Business, Science and Arts occupations in Allegheny County are Community & Social Service (80,595 | 12.6%), Management (71,203 | 11.1%), Computers, Engineering & Science (60,953 | 9.5%), Health Diagnosing & Treating (53,903 | 8.4%), and Business & Financial (49,971 | 7.8%).
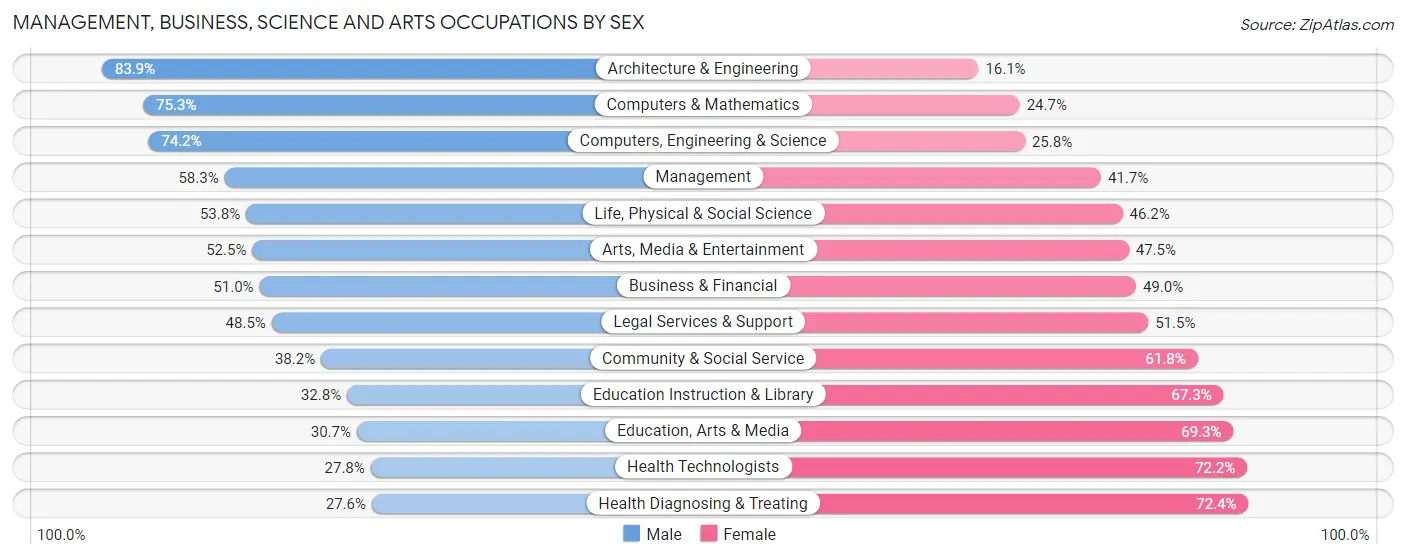
Management, Business, Science and Arts Occupations by Sex
Within the Management, Business, Science and Arts occupations in Allegheny County, the most male-oriented occupations are Architecture & Engineering (83.9%), Computers & Mathematics (75.3%), and Computers, Engineering & Science (74.2%), while the most female-oriented occupations are Health Diagnosing & Treating (72.4%), Health Technologists (72.2%), and Education, Arts & Media (69.3%).
| Occupation | Male | Female |
| Management | 41,509 (58.3%) | 29,694 (41.7%) |
| Business & Financial | 25,493 (51.0%) | 24,478 (49.0%) |
| Computers, Engineering & Science | 45,207 (74.2%) | 15,746 (25.8%) |
| Computers & Mathematics | 25,586 (75.3%) | 8,408 (24.7%) |
| Architecture & Engineering | 14,264 (83.9%) | 2,741 (16.1%) |
| Life, Physical & Social Science | 5,357 (53.8%) | 4,597 (46.2%) |
| Community & Social Service | 30,766 (38.2%) | 49,829 (61.8%) |
| Education, Arts & Media | 4,386 (30.7%) | 9,897 (69.3%) |
| Legal Services & Support | 5,635 (48.5%) | 5,994 (51.5%) |
| Education Instruction & Library | 13,212 (32.8%) | 27,126 (67.2%) |
| Arts, Media & Entertainment | 7,533 (52.5%) | 6,812 (47.5%) |
| Health Diagnosing & Treating | 14,862 (27.6%) | 39,041 (72.4%) |
| Health Technologists | 11,254 (27.8%) | 29,202 (72.2%) |
| Total (Category) | 157,837 (49.8%) | 158,788 (50.1%) |
| Total (Overall) | 331,095 (51.7%) | 308,944 (48.3%) |
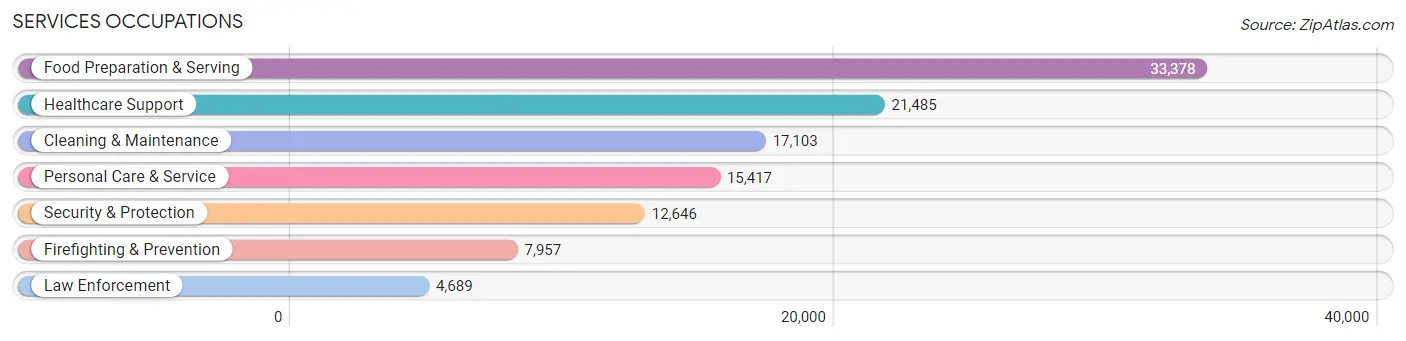
Services Occupations
The most common Services occupations in Allegheny County are Food Preparation & Serving (33,378 | 5.2%), Healthcare Support (21,485 | 3.4%), Cleaning & Maintenance (17,103 | 2.7%), Personal Care & Service (15,417 | 2.4%), and Security & Protection (12,646 | 2.0%).
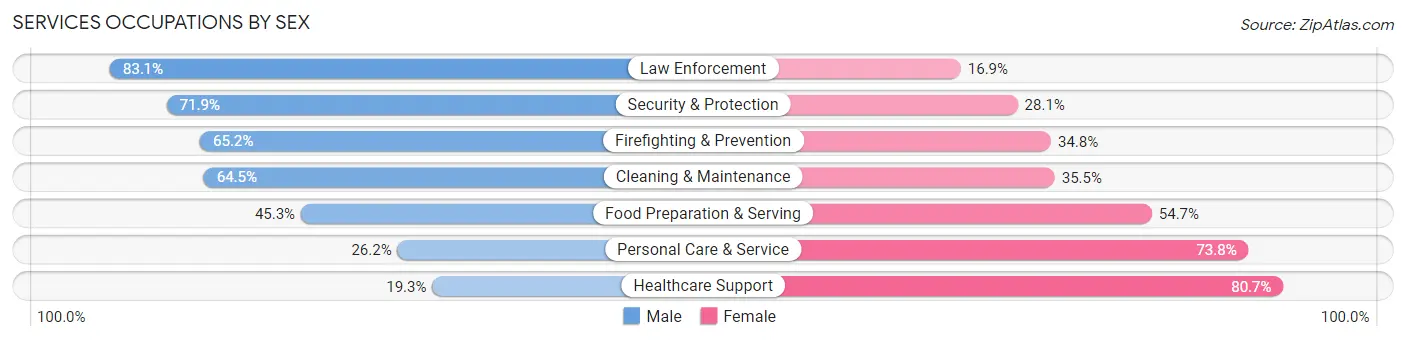
Services Occupations by Sex
Within the Services occupations in Allegheny County, the most male-oriented occupations are Law Enforcement (83.1%), Security & Protection (71.9%), and Firefighting & Prevention (65.2%), while the most female-oriented occupations are Healthcare Support (80.7%), Personal Care & Service (73.8%), and Food Preparation & Serving (54.7%).
| Occupation | Male | Female |
| Healthcare Support | 4,141 (19.3%) | 17,344 (80.7%) |
| Security & Protection | 9,088 (71.9%) | 3,558 (28.1%) |
| Firefighting & Prevention | 5,191 (65.2%) | 2,766 (34.8%) |
| Law Enforcement | 3,897 (83.1%) | 792 (16.9%) |
| Food Preparation & Serving | 15,115 (45.3%) | 18,263 (54.7%) |
| Cleaning & Maintenance | 11,034 (64.5%) | 6,069 (35.5%) |
| Personal Care & Service | 4,033 (26.2%) | 11,384 (73.8%) |
| Total (Category) | 43,411 (43.4%) | 56,618 (56.6%) |
| Total (Overall) | 331,095 (51.7%) | 308,944 (48.3%) |
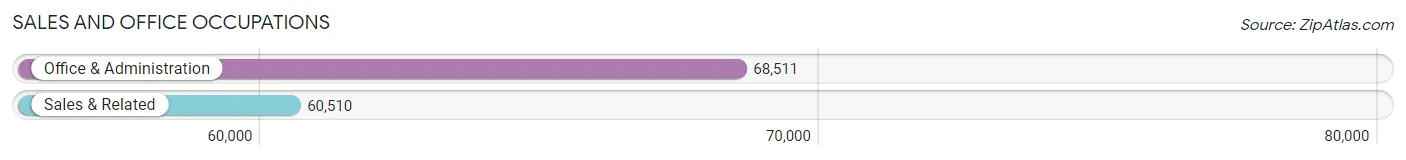
Sales and Office Occupations
The most common Sales and Office occupations in Allegheny County are Office & Administration (68,511 | 10.7%), and Sales & Related (60,510 | 9.5%).
Sales and Office Occupations by Sex
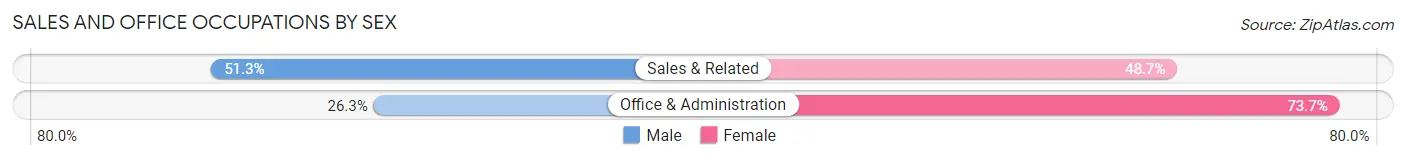
| Occupation | Male | Female |
| Sales & Related | 31,029 (51.3%) | 29,481 (48.7%) |
| Office & Administration | 18,035 (26.3%) | 50,476 (73.7%) |
| Total (Category) | 49,064 (38.0%) | 79,957 (62.0%) |
| Total (Overall) | 331,095 (51.7%) | 308,944 (48.3%) |
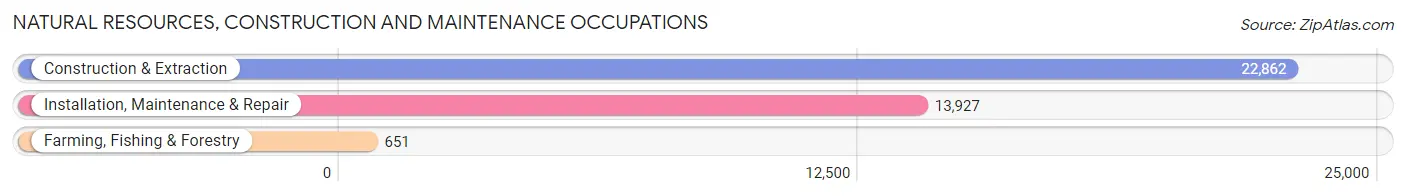
Natural Resources, Construction and Maintenance Occupations
The most common Natural Resources, Construction and Maintenance occupations in Allegheny County are Construction & Extraction (22,862 | 3.6%), Installation, Maintenance & Repair (13,927 | 2.2%), and Farming, Fishing & Forestry (651 | 0.1%).
Natural Resources, Construction and Maintenance Occupations by Sex
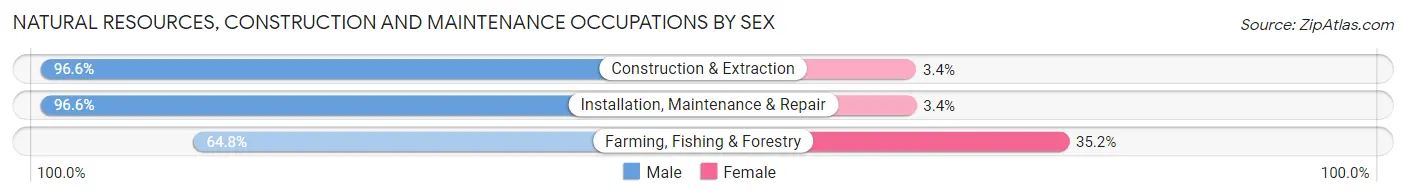
| Occupation | Male | Female |
| Farming, Fishing & Forestry | 422 (64.8%) | 229 (35.2%) |
| Construction & Extraction | 22,090 (96.6%) | 772 (3.4%) |
| Installation, Maintenance & Repair | 13,451 (96.6%) | 476 (3.4%) |
| Total (Category) | 35,963 (96.1%) | 1,477 (3.9%) |
| Total (Overall) | 331,095 (51.7%) | 308,944 (48.3%) |
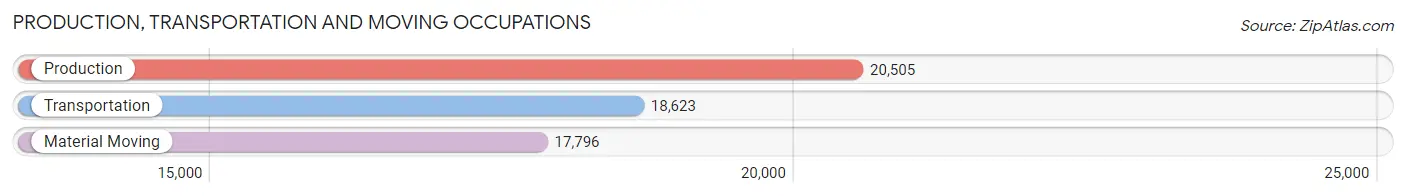
Production, Transportation and Moving Occupations
The most common Production, Transportation and Moving occupations in Allegheny County are Production (20,505 | 3.2%), Transportation (18,623 | 2.9%), and Material Moving (17,796 | 2.8%).
Production, Transportation and Moving Occupations by Sex
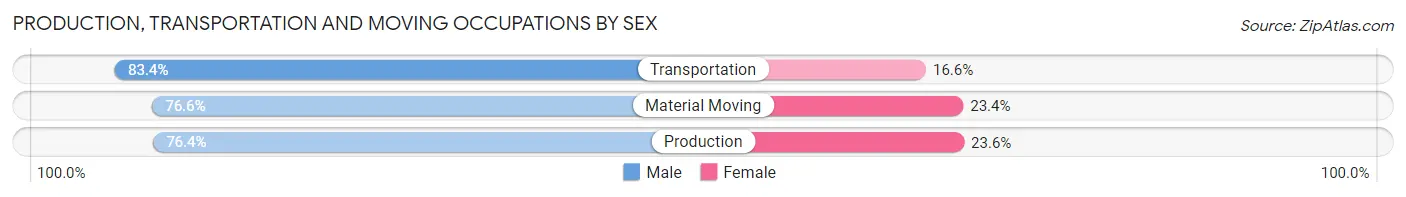
| Occupation | Male | Female |
| Production | 15,666 (76.4%) | 4,839 (23.6%) |
| Transportation | 15,530 (83.4%) | 3,093 (16.6%) |
| Material Moving | 13,624 (76.6%) | 4,172 (23.4%) |
| Total (Category) | 44,820 (78.7%) | 12,104 (21.3%) |
| Total (Overall) | 331,095 (51.7%) | 308,944 (48.3%) |
Employment Industries by Sex in Allegheny County
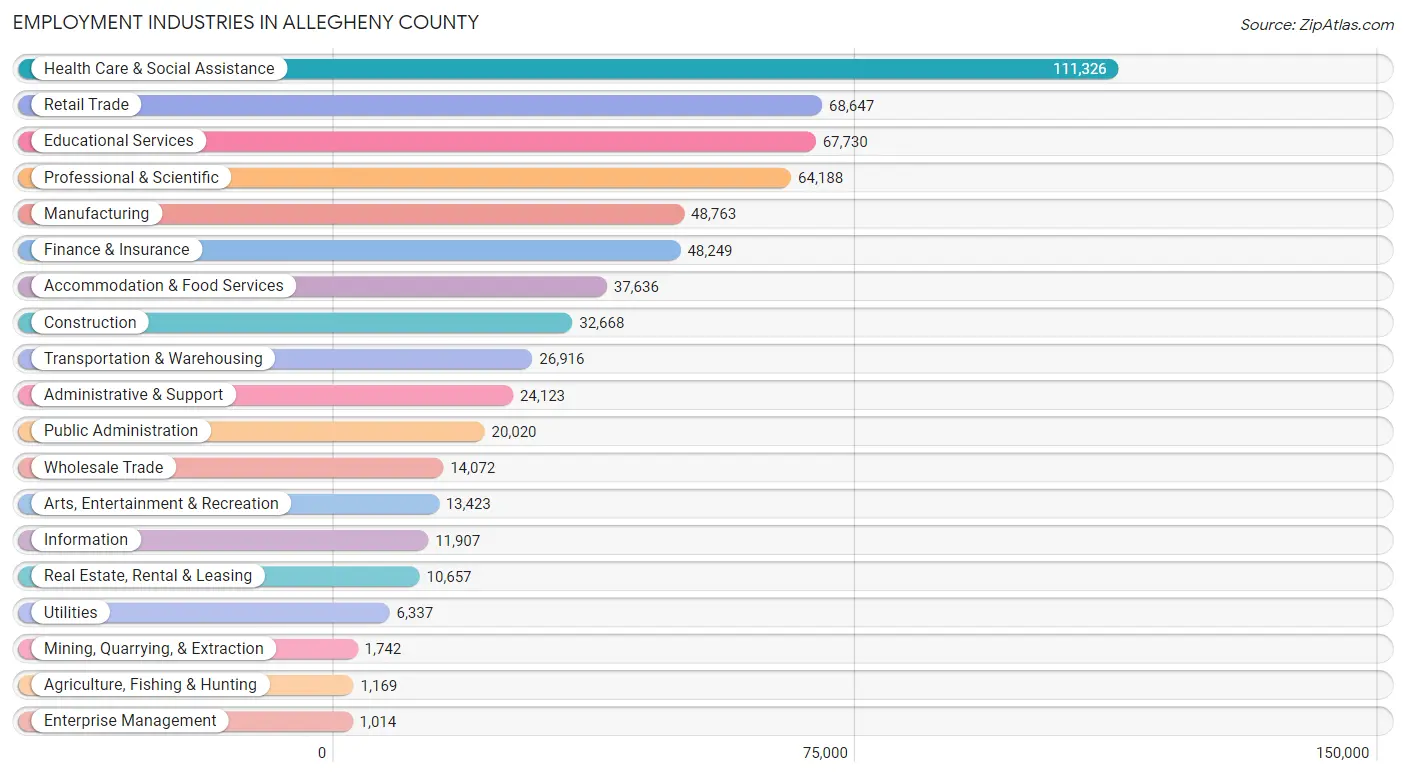
Employment Industries in Allegheny County
The major employment industries in Allegheny County include Health Care & Social Assistance (111,326 | 17.4%), Retail Trade (68,647 | 10.7%), Educational Services (67,730 | 10.6%), Professional & Scientific (64,188 | 10.0%), and Manufacturing (48,763 | 7.6%).
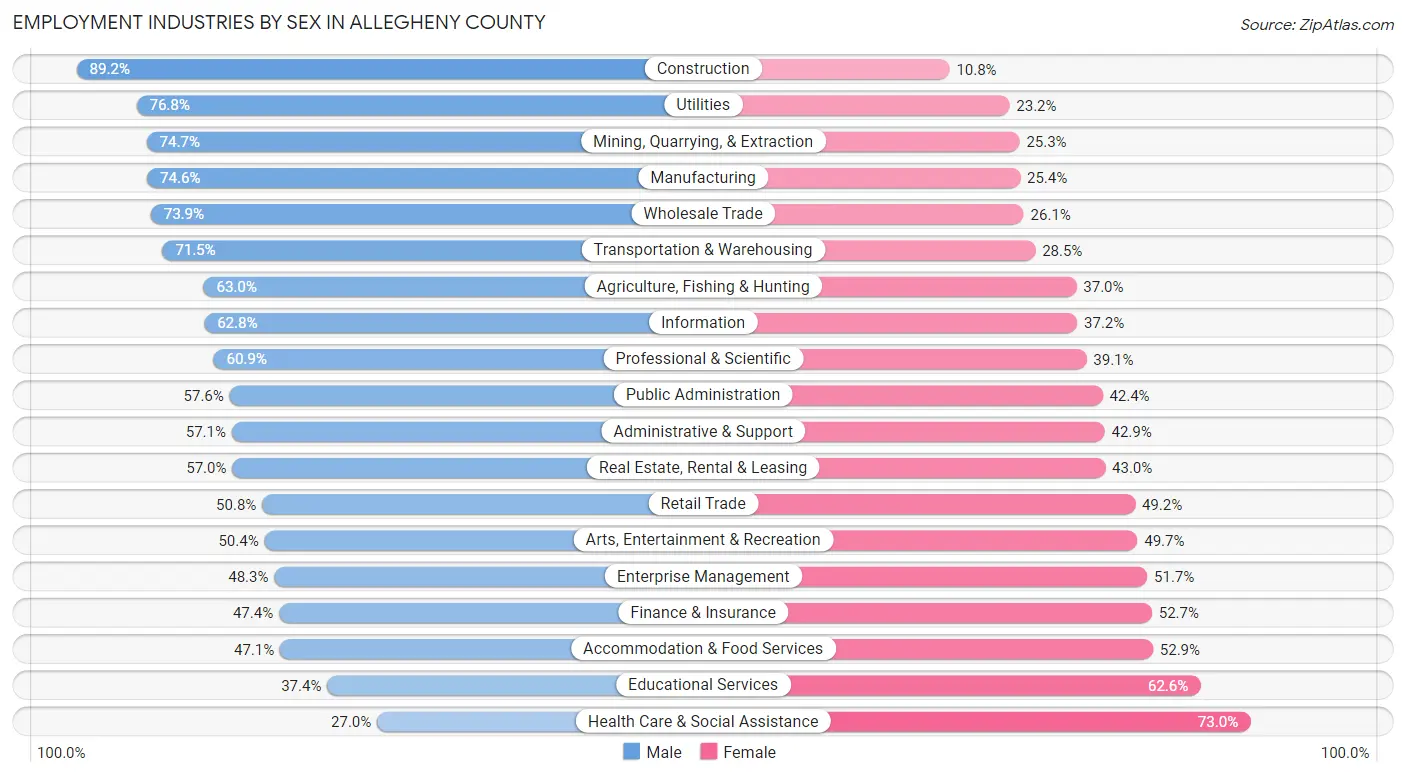
Employment Industries by Sex in Allegheny County
The Allegheny County industries that see more men than women are Construction (89.2%), Utilities (76.8%), and Mining, Quarrying, & Extraction (74.7%), whereas the industries that tend to have a higher number of women are Health Care & Social Assistance (73.0%), Educational Services (62.6%), and Accommodation & Food Services (52.9%).
| Industry | Male | Female |
| Agriculture, Fishing & Hunting | 736 (63.0%) | 433 (37.0%) |
| Mining, Quarrying, & Extraction | 1,302 (74.7%) | 440 (25.3%) |
| Construction | 29,149 (89.2%) | 3,519 (10.8%) |
| Manufacturing | 36,387 (74.6%) | 12,376 (25.4%) |
| Wholesale Trade | 10,395 (73.9%) | 3,677 (26.1%) |
| Retail Trade | 34,894 (50.8%) | 33,753 (49.2%) |
| Transportation & Warehousing | 19,240 (71.5%) | 7,676 (28.5%) |
| Utilities | 4,869 (76.8%) | 1,468 (23.2%) |
| Information | 7,479 (62.8%) | 4,428 (37.2%) |
| Finance & Insurance | 22,847 (47.3%) | 25,402 (52.6%) |
| Real Estate, Rental & Leasing | 6,076 (57.0%) | 4,581 (43.0%) |
| Professional & Scientific | 39,085 (60.9%) | 25,103 (39.1%) |
| Enterprise Management | 490 (48.3%) | 524 (51.7%) |
| Administrative & Support | 13,778 (57.1%) | 10,345 (42.9%) |
| Educational Services | 25,304 (37.4%) | 42,426 (62.6%) |
| Health Care & Social Assistance | 30,093 (27.0%) | 81,233 (73.0%) |
| Arts, Entertainment & Recreation | 6,758 (50.3%) | 6,665 (49.6%) |
| Accommodation & Food Services | 17,736 (47.1%) | 19,900 (52.9%) |
| Public Administration | 11,524 (57.6%) | 8,496 (42.4%) |
| Total | 331,095 (51.7%) | 308,944 (48.3%) |
Education in Allegheny County
School Enrollment in Allegheny County
The most common levels of schooling among the 272,541 students in Allegheny County are college / undergraduate (64,710 | 23.7%), high school (52,664 | 19.3%), and middle school (50,578 | 18.6%).
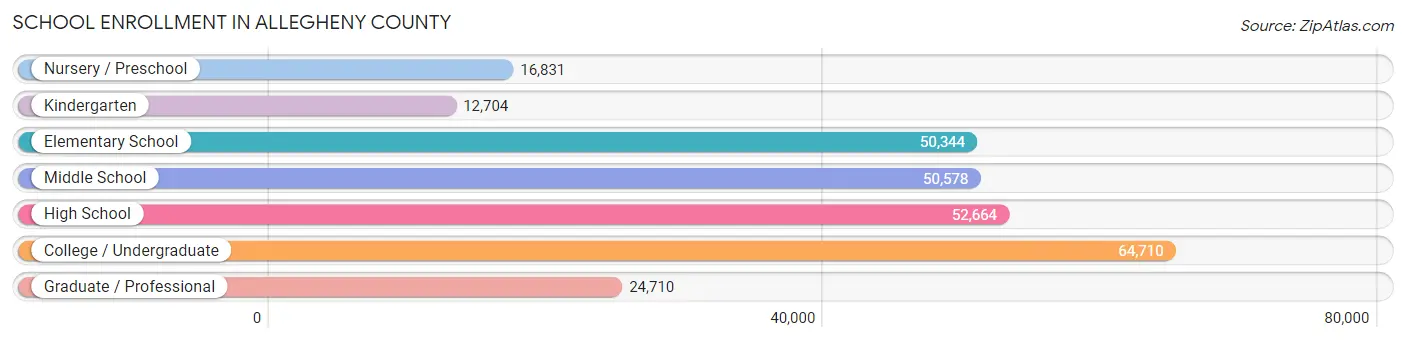
| School Level | # Students | % Students |
| Nursery / Preschool | 16,831 | 6.2% |
| Kindergarten | 12,704 | 4.7% |
| Elementary School | 50,344 | 18.5% |
| Middle School | 50,578 | 18.6% |
| High School | 52,664 | 19.3% |
| College / Undergraduate | 64,710 | 23.7% |
| Graduate / Professional | 24,710 | 9.1% |
| Total | 272,541 | 100.0% |
School Enrollment by Age by Funding Source in Allegheny County
Out of a total of 272,541 students who are enrolled in schools in Allegheny County, 66,500 (24.4%) attend a private institution, while the remaining 206,041 (75.6%) are enrolled in public schools. The age group of 3 to 4 year olds has the highest likelihood of being enrolled in private schools, with 6,372 (51.3% in the age bracket) enrolled. Conversely, the age group of 10 to 14 year olds has the lowest likelihood of being enrolled in a private school, with 55,651 (87.8% in the age bracket) attending a public institution.
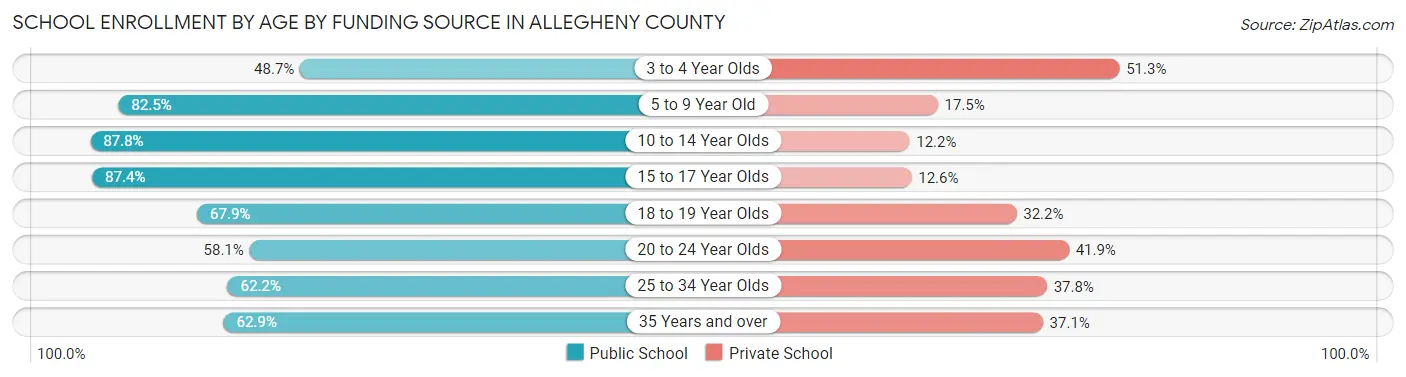
| Age Bracket | Public School | Private School |
| 3 to 4 Year Olds | 6,043 (48.7%) | 6,372 (51.3%) |
| 5 to 9 Year Old | 49,235 (82.5%) | 10,432 (17.5%) |
| 10 to 14 Year Olds | 55,651 (87.8%) | 7,750 (12.2%) |
| 15 to 17 Year Olds | 33,604 (87.4%) | 4,841 (12.6%) |
| 18 to 19 Year Olds | 19,790 (67.8%) | 9,379 (32.2%) |
| 20 to 24 Year Olds | 21,489 (58.1%) | 15,502 (41.9%) |
| 25 to 34 Year Olds | 12,606 (62.2%) | 7,668 (37.8%) |
| 35 Years and over | 7,665 (62.9%) | 4,514 (37.1%) |
| Total | 206,041 (75.6%) | 66,500 (24.4%) |
Educational Attainment by Field of Study in Allegheny County
Business (83,550 | 19.3%), science & technology (42,220 | 9.8%), education (41,762 | 9.7%), engineering (34,533 | 8.0%), and social sciences (33,667 | 7.8%) are the most common fields of study among 432,981 individuals in Allegheny County who have obtained a bachelor's degree or higher.
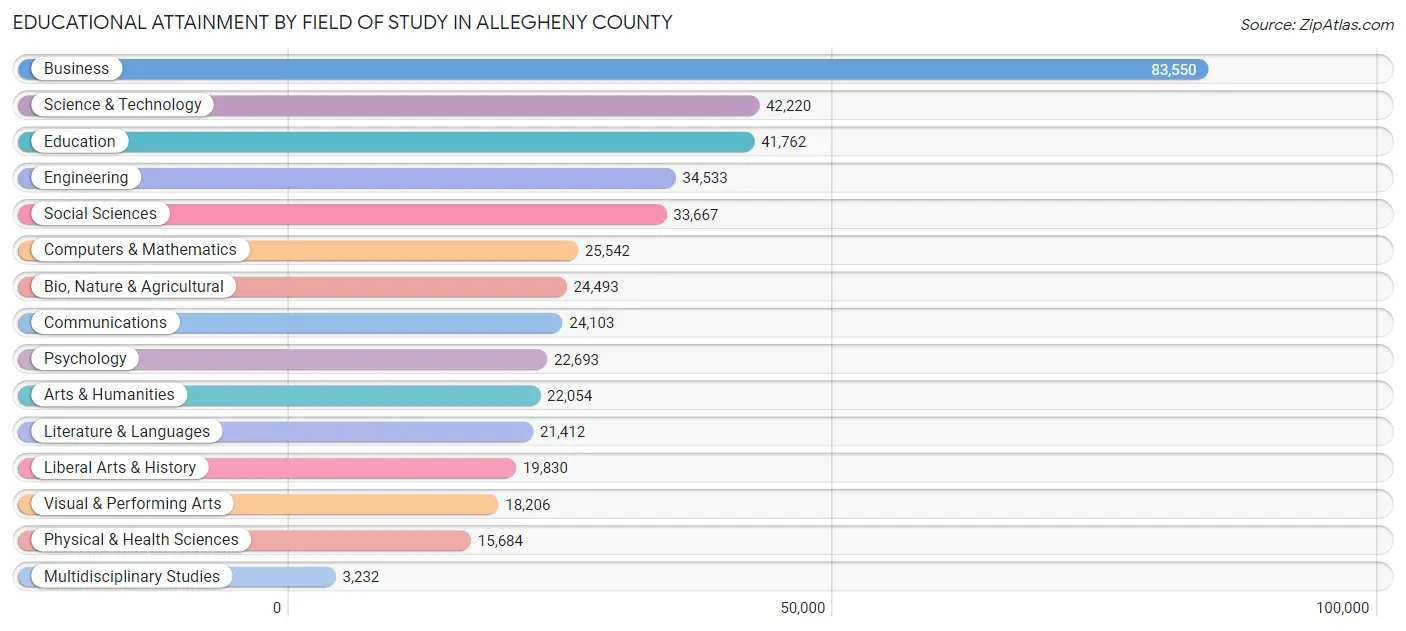
| Field of Study | # Graduates | % Graduates |
| Computers & Mathematics | 25,542 | 5.9% |
| Bio, Nature & Agricultural | 24,493 | 5.7% |
| Physical & Health Sciences | 15,684 | 3.6% |
| Psychology | 22,693 | 5.2% |
| Social Sciences | 33,667 | 7.8% |
| Engineering | 34,533 | 8.0% |
| Multidisciplinary Studies | 3,232 | 0.7% |
| Science & Technology | 42,220 | 9.8% |
| Business | 83,550 | 19.3% |
| Education | 41,762 | 9.7% |
| Literature & Languages | 21,412 | 5.0% |
| Liberal Arts & History | 19,830 | 4.6% |
| Visual & Performing Arts | 18,206 | 4.2% |
| Communications | 24,103 | 5.6% |
| Arts & Humanities | 22,054 | 5.1% |
| Total | 432,981 | 100.0% |
Transportation & Commute in Allegheny County
Vehicle Availability by Sex in Allegheny County
The most prevalent vehicle ownership categories in Allegheny County are males with 2 vehicles (146,433, accounting for 45.3%) and females with 2 vehicles (126,867, making up 49.3%).
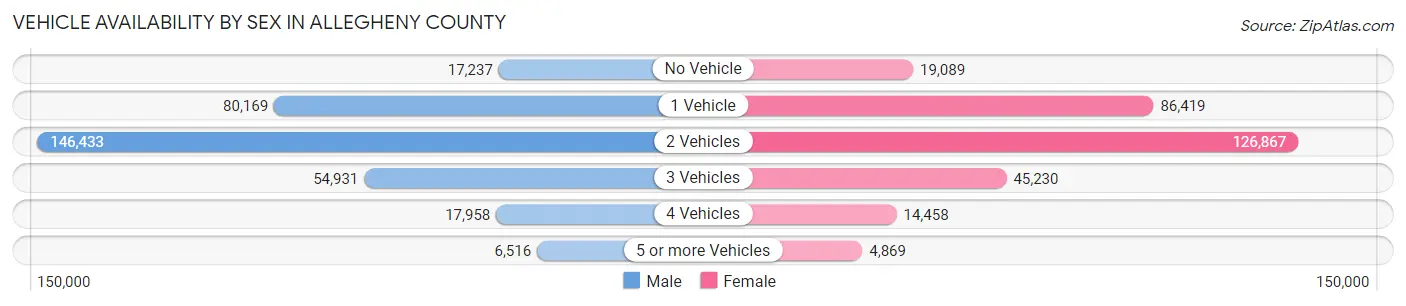
| Vehicles Available | Male | Female |
| No Vehicle | 17,237 (5.3%) | 19,089 (6.4%) |
| 1 Vehicle | 80,169 (24.8%) | 86,419 (29.1%) |
| 2 Vehicles | 146,433 (45.3%) | 126,867 (42.7%) |
| 3 Vehicles | 54,931 (17.0%) | 45,230 (15.2%) |
| 4 Vehicles | 17,958 (5.6%) | 14,458 (4.9%) |
| 5 or more Vehicles | 6,516 (2.0%) | 4,869 (1.6%) |
| Total | 323,244 (100.0%) | 296,932 (100.0%) |
Commute Time in Allegheny County
The most frequently occuring commute durations in Allegheny County are 30 to 34 minutes (83,763 commuters, 15.9%), 20 to 24 minutes (82,124 commuters, 15.5%), and 15 to 19 minutes (80,241 commuters, 15.2%).
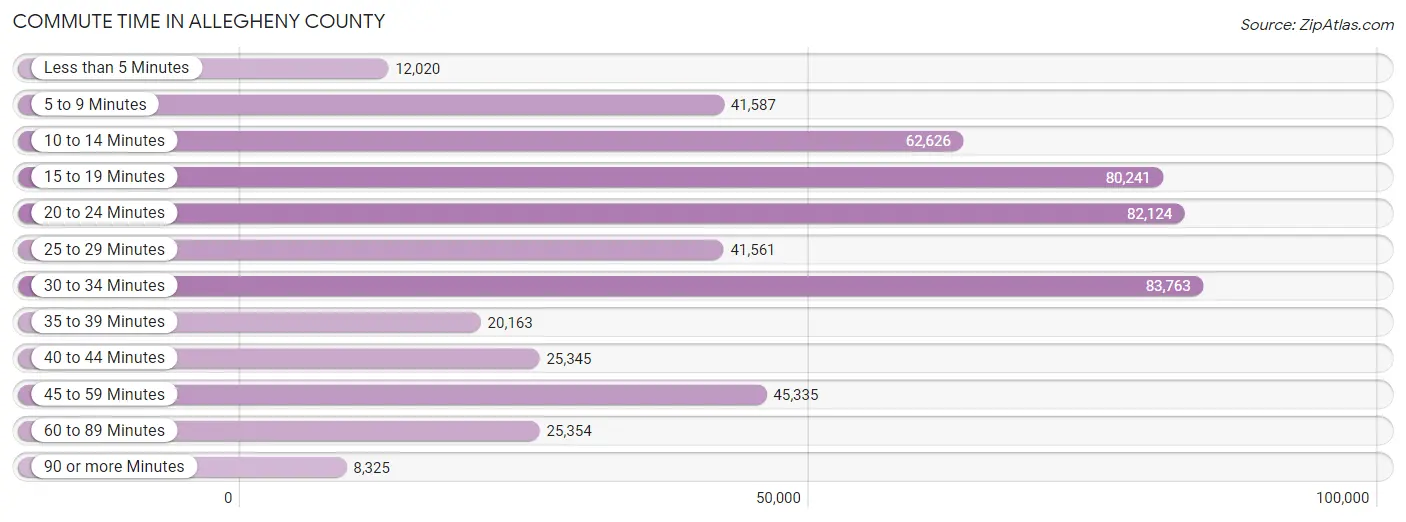
| Commute Time | # Commuters | % Commuters |
| Less than 5 Minutes | 12,020 | 2.3% |
| 5 to 9 Minutes | 41,587 | 7.9% |
| 10 to 14 Minutes | 62,626 | 11.8% |
| 15 to 19 Minutes | 80,241 | 15.2% |
| 20 to 24 Minutes | 82,124 | 15.5% |
| 25 to 29 Minutes | 41,561 | 7.9% |
| 30 to 34 Minutes | 83,763 | 15.9% |
| 35 to 39 Minutes | 20,163 | 3.8% |
| 40 to 44 Minutes | 25,345 | 4.8% |
| 45 to 59 Minutes | 45,335 | 8.6% |
| 60 to 89 Minutes | 25,354 | 4.8% |
| 90 or more Minutes | 8,325 | 1.6% |
Commute Time by Sex in Allegheny County
The most common commute times in Allegheny County are 30 to 34 minutes (45,858 commuters, 16.5%) for males and 15 to 19 minutes (40,557 commuters, 16.2%) for females.
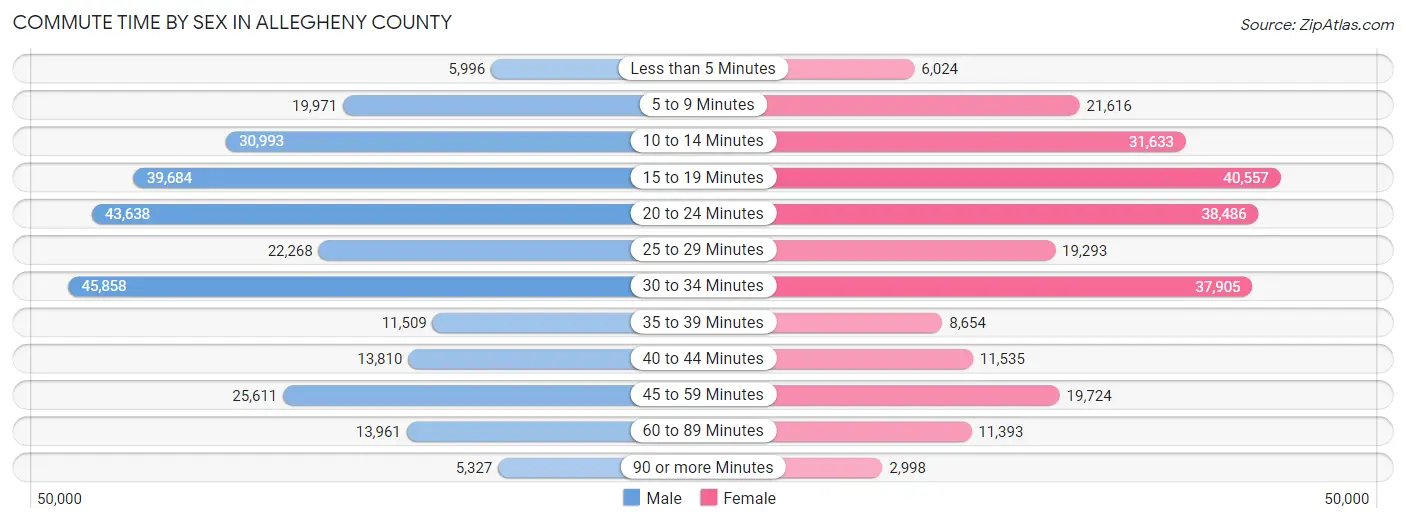
| Commute Time | Male | Female |
| Less than 5 Minutes | 5,996 (2.1%) | 6,024 (2.4%) |
| 5 to 9 Minutes | 19,971 (7.2%) | 21,616 (8.6%) |
| 10 to 14 Minutes | 30,993 (11.1%) | 31,633 (12.7%) |
| 15 to 19 Minutes | 39,684 (14.2%) | 40,557 (16.2%) |
| 20 to 24 Minutes | 43,638 (15.7%) | 38,486 (15.4%) |
| 25 to 29 Minutes | 22,268 (8.0%) | 19,293 (7.7%) |
| 30 to 34 Minutes | 45,858 (16.5%) | 37,905 (15.2%) |
| 35 to 39 Minutes | 11,509 (4.1%) | 8,654 (3.5%) |
| 40 to 44 Minutes | 13,810 (5.0%) | 11,535 (4.6%) |
| 45 to 59 Minutes | 25,611 (9.2%) | 19,724 (7.9%) |
| 60 to 89 Minutes | 13,961 (5.0%) | 11,393 (4.6%) |
| 90 or more Minutes | 5,327 (1.9%) | 2,998 (1.2%) |
Time of Departure to Work by Sex in Allegheny County
The most frequent times of departure to work in Allegheny County are 7:00 AM to 7:29 AM (36,852, 13.2%) for males and 7:00 AM to 7:29 AM (36,458, 14.6%) for females.
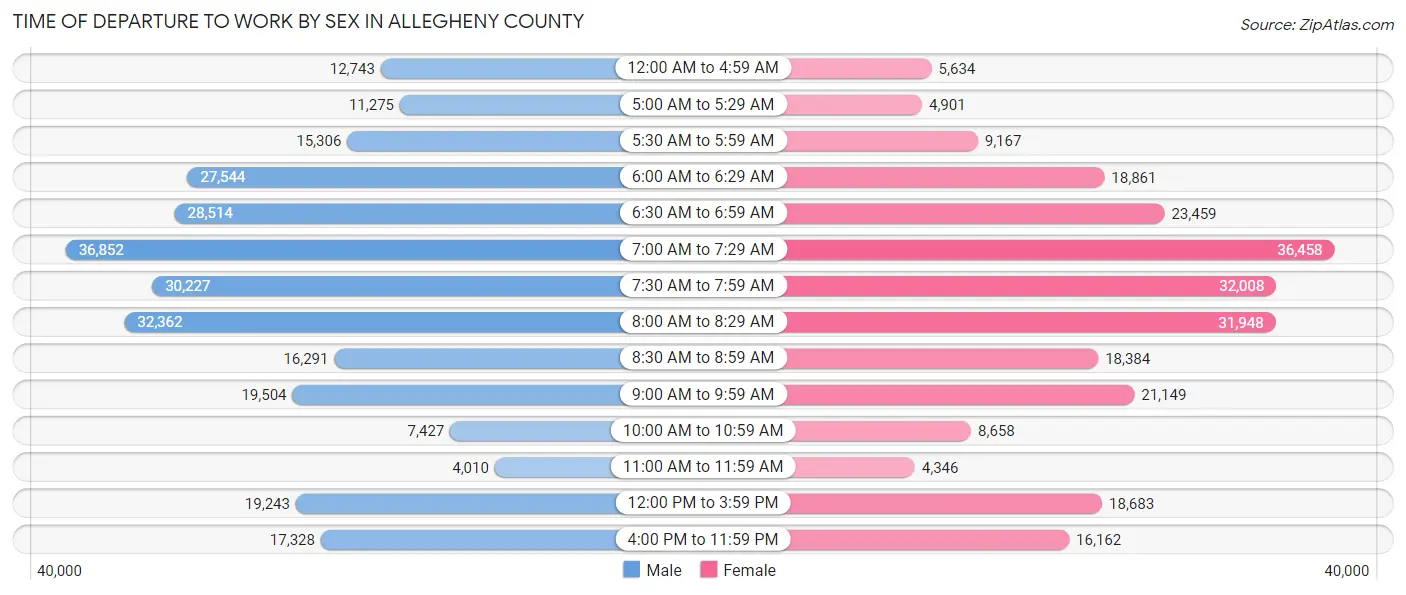
| Time of Departure | Male | Female |
| 12:00 AM to 4:59 AM | 12,743 (4.6%) | 5,634 (2.3%) |
| 5:00 AM to 5:29 AM | 11,275 (4.1%) | 4,901 (2.0%) |
| 5:30 AM to 5:59 AM | 15,306 (5.5%) | 9,167 (3.7%) |
| 6:00 AM to 6:29 AM | 27,544 (9.9%) | 18,861 (7.5%) |
| 6:30 AM to 6:59 AM | 28,514 (10.2%) | 23,459 (9.4%) |
| 7:00 AM to 7:29 AM | 36,852 (13.2%) | 36,458 (14.6%) |
| 7:30 AM to 7:59 AM | 30,227 (10.8%) | 32,008 (12.8%) |
| 8:00 AM to 8:29 AM | 32,362 (11.6%) | 31,948 (12.8%) |
| 8:30 AM to 8:59 AM | 16,291 (5.9%) | 18,384 (7.4%) |
| 9:00 AM to 9:59 AM | 19,504 (7.0%) | 21,149 (8.5%) |
| 10:00 AM to 10:59 AM | 7,427 (2.7%) | 8,658 (3.5%) |
| 11:00 AM to 11:59 AM | 4,010 (1.4%) | 4,346 (1.7%) |
| 12:00 PM to 3:59 PM | 19,243 (6.9%) | 18,683 (7.5%) |
| 4:00 PM to 11:59 PM | 17,328 (6.2%) | 16,162 (6.5%) |
| Total | 278,626 (100.0%) | 249,818 (100.0%) |
Housing Occupancy in Allegheny County
Occupancy by Ownership in Allegheny County
Of the total 545,637 dwellings in Allegheny County, owner-occupied units account for 354,956 (65.0%), while renter-occupied units make up 190,681 (34.9%).
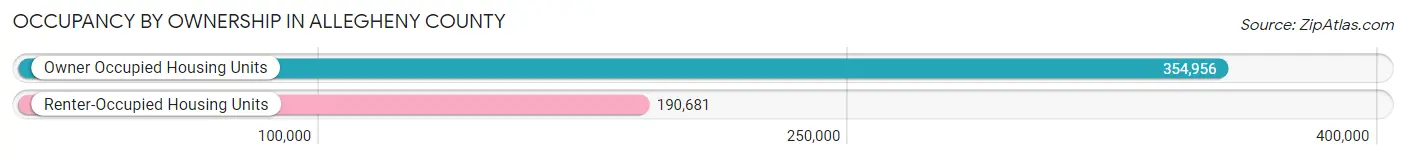
| Occupancy | # Housing Units | % Housing Units |
| Owner Occupied Housing Units | 354,956 | 65.0% |
| Renter-Occupied Housing Units | 190,681 | 34.9% |
| Total Occupied Housing Units | 545,637 | 100.0% |
Occupancy by Household Size in Allegheny County
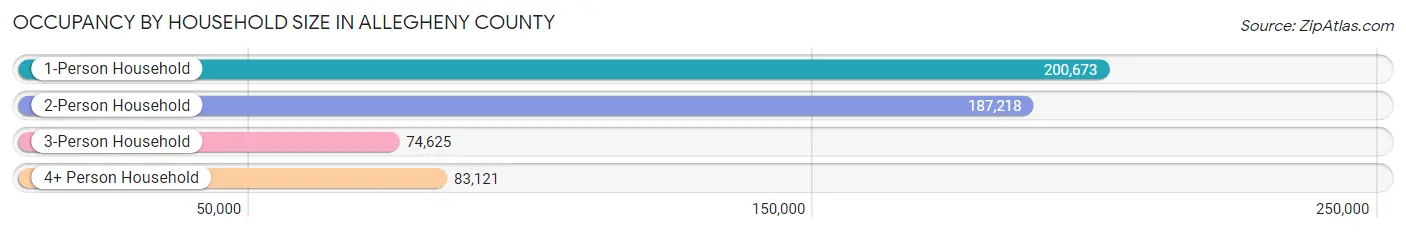
| Household Size | # Housing Units | % Housing Units |
| 1-Person Household | 200,673 | 36.8% |
| 2-Person Household | 187,218 | 34.3% |
| 3-Person Household | 74,625 | 13.7% |
| 4+ Person Household | 83,121 | 15.2% |
| Total Housing Units | 545,637 | 100.0% |
Occupancy by Ownership by Household Size in Allegheny County
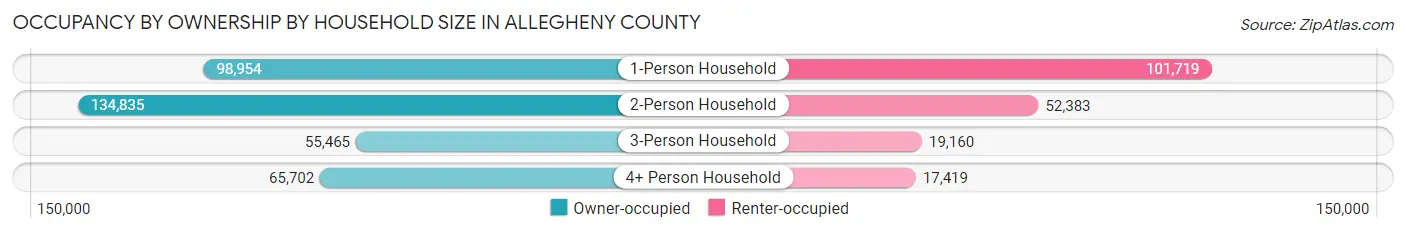
| Household Size | Owner-occupied | Renter-occupied |
| 1-Person Household | 98,954 (49.3%) | 101,719 (50.7%) |
| 2-Person Household | 134,835 (72.0%) | 52,383 (28.0%) |
| 3-Person Household | 55,465 (74.3%) | 19,160 (25.7%) |
| 4+ Person Household | 65,702 (79.0%) | 17,419 (21.0%) |
| Total Housing Units | 354,956 (65.0%) | 190,681 (34.9%) |
Occupancy by Educational Attainment in Allegheny County
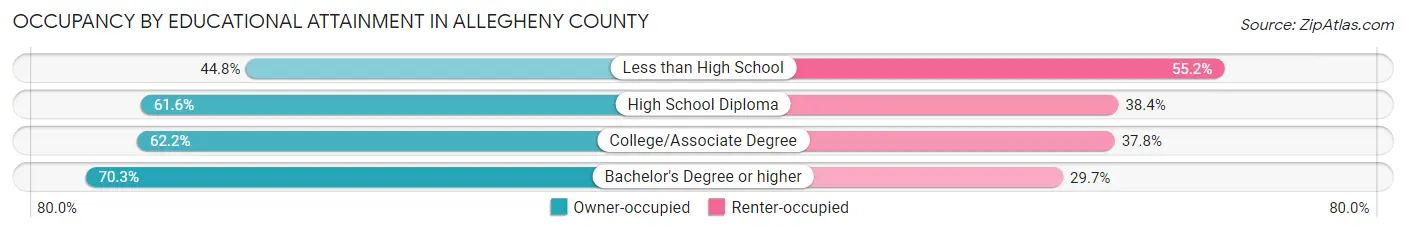
| Household Size | Owner-occupied | Renter-occupied |
| Less than High School | 9,831 (44.8%) | 12,093 (55.2%) |
| High School Diploma | 78,339 (61.6%) | 48,903 (38.4%) |
| College/Associate Degree | 91,877 (62.2%) | 55,920 (37.8%) |
| Bachelor's Degree or higher | 174,909 (70.3%) | 73,765 (29.7%) |
Occupancy by Age of Householder in Allegheny County
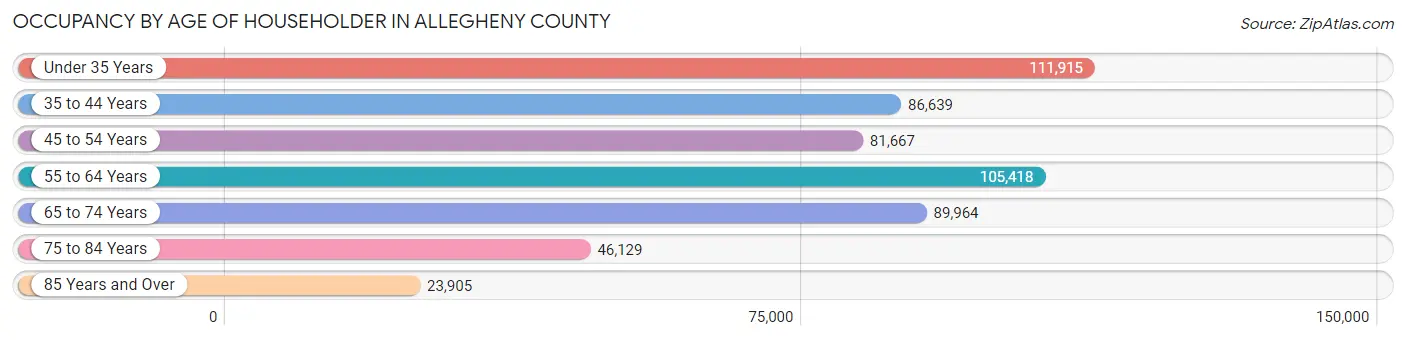
| Age Bracket | # Households | % Households |
| Under 35 Years | 111,915 | 20.5% |
| 35 to 44 Years | 86,639 | 15.9% |
| 45 to 54 Years | 81,667 | 15.0% |
| 55 to 64 Years | 105,418 | 19.3% |
| 65 to 74 Years | 89,964 | 16.5% |
| 75 to 84 Years | 46,129 | 8.5% |
| 85 Years and Over | 23,905 | 4.4% |
| Total | 545,637 | 100.0% |
Housing Finances in Allegheny County
Median Income by Occupancy in Allegheny County
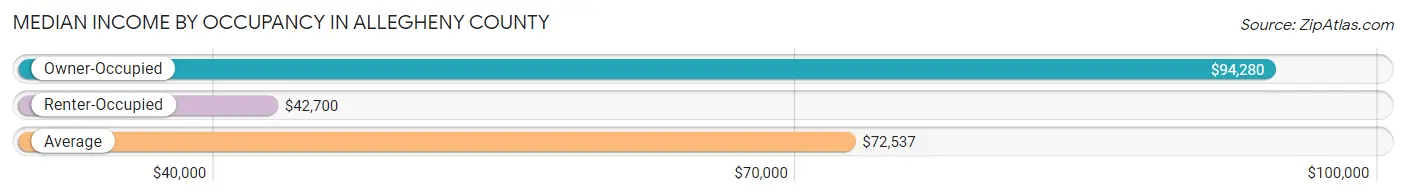
| Occupancy Type | # Households | Median Income |
| Owner-Occupied | 354,956 (65.0%) | $94,280 |
| Renter-Occupied | 190,681 (34.9%) | $42,700 |
| Average | 545,637 (100.0%) | $72,537 |
Occupancy by Householder Income Bracket in Allegheny County
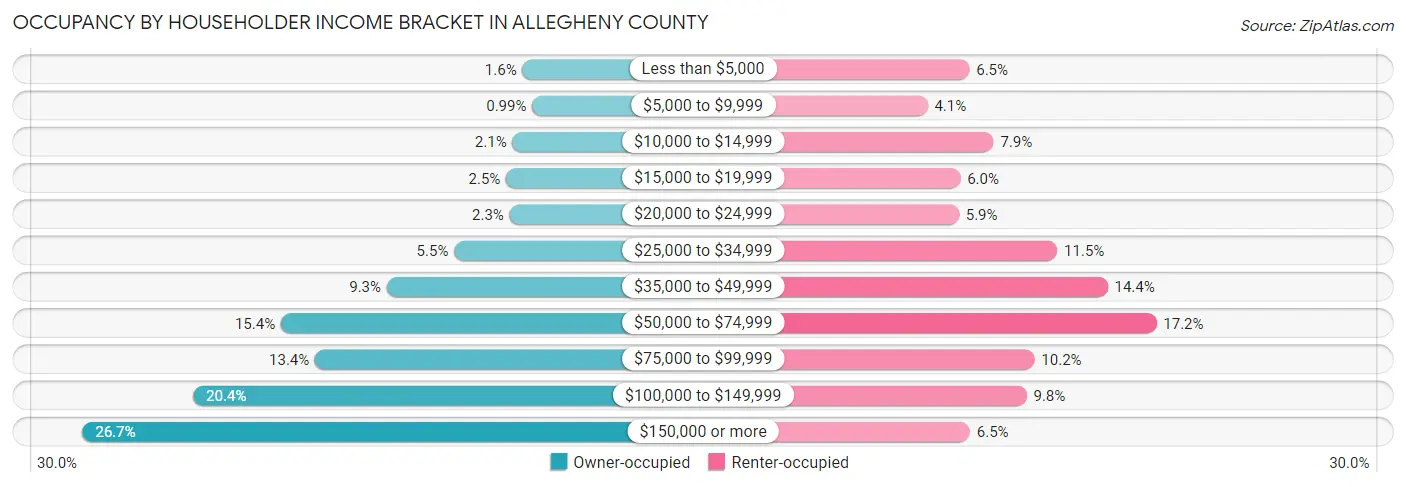
| Income Bracket | Owner-occupied | Renter-occupied |
| Less than $5,000 | 5,492 (1.5%) | 12,390 (6.5%) |
| $5,000 to $9,999 | 3,503 (1.0%) | 7,840 (4.1%) |
| $10,000 to $14,999 | 7,537 (2.1%) | 15,026 (7.9%) |
| $15,000 to $19,999 | 8,805 (2.5%) | 11,410 (6.0%) |
| $20,000 to $24,999 | 8,110 (2.3%) | 11,252 (5.9%) |
| $25,000 to $34,999 | 19,355 (5.4%) | 21,966 (11.5%) |
| $35,000 to $49,999 | 33,016 (9.3%) | 27,463 (14.4%) |
| $50,000 to $74,999 | 54,487 (15.3%) | 32,773 (17.2%) |
| $75,000 to $99,999 | 47,578 (13.4%) | 19,495 (10.2%) |
| $100,000 to $149,999 | 72,302 (20.4%) | 18,622 (9.8%) |
| $150,000 or more | 94,771 (26.7%) | 12,444 (6.5%) |
| Total | 354,956 (100.0%) | 190,681 (100.0%) |
Monthly Housing Cost Tiers in Allegheny County
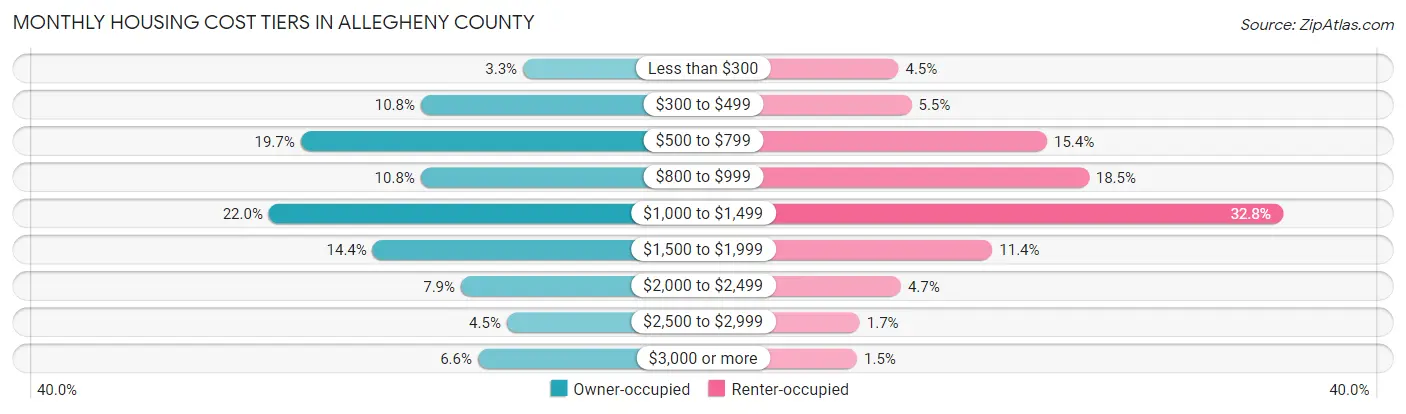
| Monthly Cost | Owner-occupied | Renter-occupied |
| Less than $300 | 11,725 (3.3%) | 8,582 (4.5%) |
| $300 to $499 | 38,415 (10.8%) | 10,403 (5.5%) |
| $500 to $799 | 69,866 (19.7%) | 29,447 (15.4%) |
| $800 to $999 | 38,439 (10.8%) | 35,287 (18.5%) |
| $1,000 to $1,499 | 78,144 (22.0%) | 62,515 (32.8%) |
| $1,500 to $1,999 | 50,996 (14.4%) | 21,750 (11.4%) |
| $2,000 to $2,499 | 27,943 (7.9%) | 8,931 (4.7%) |
| $2,500 to $2,999 | 15,936 (4.5%) | 3,153 (1.7%) |
| $3,000 or more | 23,492 (6.6%) | 2,769 (1.5%) |
| Total | 354,956 (100.0%) | 190,681 (100.0%) |
Physical Housing Characteristics in Allegheny County
Housing Structures in Allegheny County
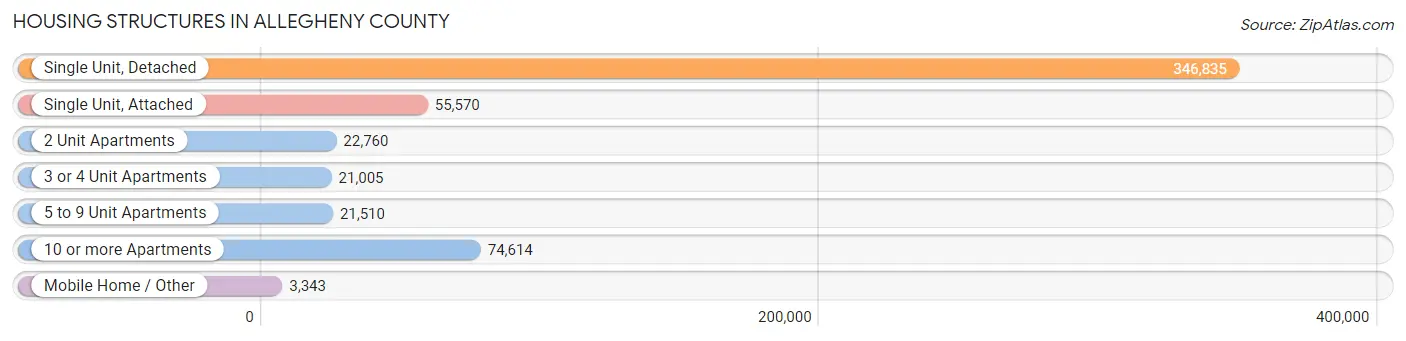
| Structure Type | # Housing Units | % Housing Units |
| Single Unit, Detached | 346,835 | 63.6% |
| Single Unit, Attached | 55,570 | 10.2% |
| 2 Unit Apartments | 22,760 | 4.2% |
| 3 or 4 Unit Apartments | 21,005 | 3.8% |
| 5 to 9 Unit Apartments | 21,510 | 3.9% |
| 10 or more Apartments | 74,614 | 13.7% |
| Mobile Home / Other | 3,343 | 0.6% |
| Total | 545,637 | 100.0% |
Housing Structures by Occupancy in Allegheny County
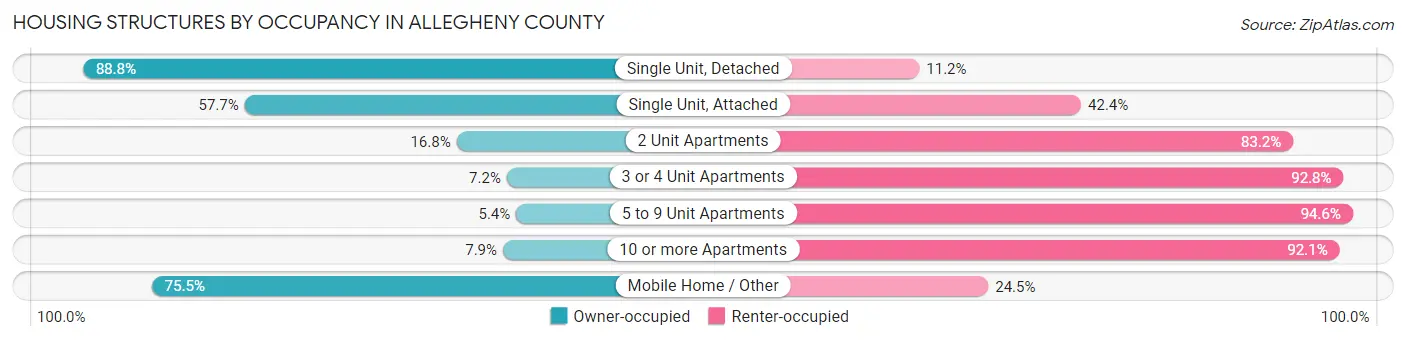
| Structure Type | Owner-occupied | Renter-occupied |
| Single Unit, Detached | 308,002 (88.8%) | 38,833 (11.2%) |
| Single Unit, Attached | 32,034 (57.7%) | 23,536 (42.3%) |
| 2 Unit Apartments | 3,832 (16.8%) | 18,928 (83.2%) |
| 3 or 4 Unit Apartments | 1,506 (7.2%) | 19,499 (92.8%) |
| 5 to 9 Unit Apartments | 1,154 (5.4%) | 20,356 (94.6%) |
| 10 or more Apartments | 5,903 (7.9%) | 68,711 (92.1%) |
| Mobile Home / Other | 2,525 (75.5%) | 818 (24.5%) |
| Total | 354,956 (65.0%) | 190,681 (34.9%) |
Housing Structures by Number of Rooms in Allegheny County
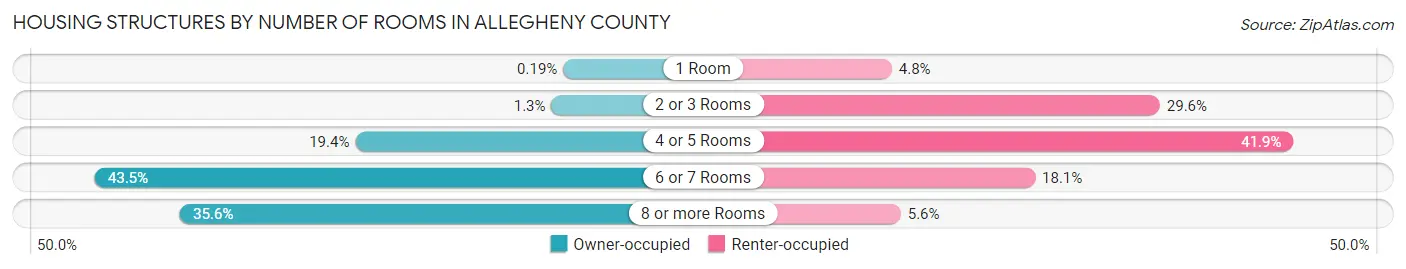
| Number of Rooms | Owner-occupied | Renter-occupied |
| 1 Room | 664 (0.2%) | 9,156 (4.8%) |
| 2 or 3 Rooms | 4,547 (1.3%) | 56,417 (29.6%) |
| 4 or 5 Rooms | 68,918 (19.4%) | 79,961 (41.9%) |
| 6 or 7 Rooms | 154,397 (43.5%) | 34,411 (18.0%) |
| 8 or more Rooms | 126,430 (35.6%) | 10,736 (5.6%) |
| Total | 354,956 (100.0%) | 190,681 (100.0%) |
Housing Structure by Heating Type in Allegheny County
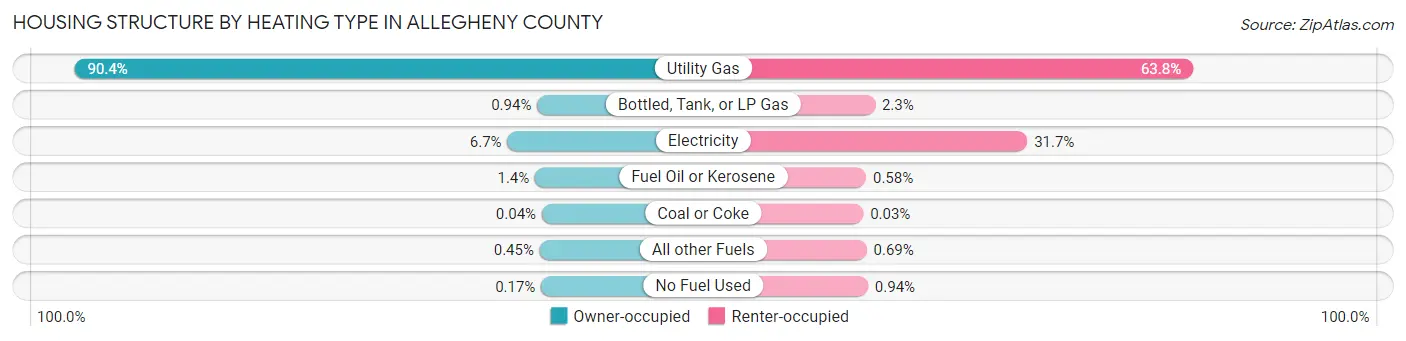
| Heating Type | Owner-occupied | Renter-occupied |
| Utility Gas | 320,728 (90.4%) | 121,553 (63.7%) |
| Bottled, Tank, or LP Gas | 3,339 (0.9%) | 4,385 (2.3%) |
| Electricity | 23,775 (6.7%) | 60,489 (31.7%) |
| Fuel Oil or Kerosene | 4,786 (1.3%) | 1,103 (0.6%) |
| Coal or Coke | 127 (0.0%) | 49 (0.0%) |
| All other Fuels | 1,595 (0.4%) | 1,315 (0.7%) |
| No Fuel Used | 606 (0.2%) | 1,787 (0.9%) |
| Total | 354,956 (100.0%) | 190,681 (100.0%) |
Household Vehicle Usage in Allegheny County
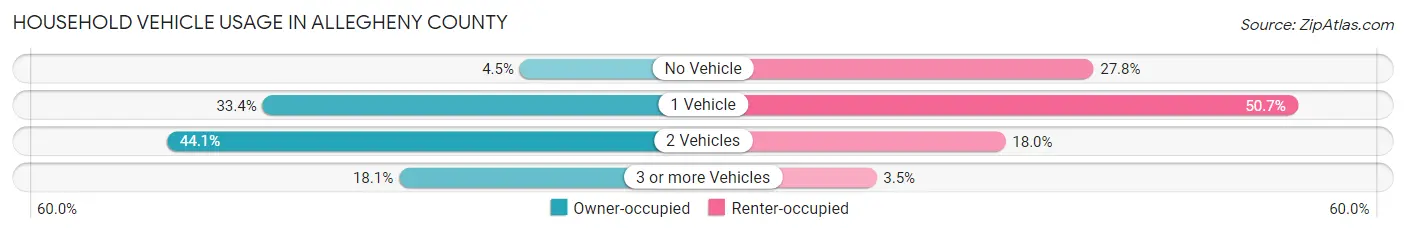
| Vehicles per Household | Owner-occupied | Renter-occupied |
| No Vehicle | 16,096 (4.5%) | 53,041 (27.8%) |
| 1 Vehicle | 118,371 (33.4%) | 96,661 (50.7%) |
| 2 Vehicles | 156,377 (44.1%) | 34,265 (18.0%) |
| 3 or more Vehicles | 64,112 (18.1%) | 6,714 (3.5%) |
| Total | 354,956 (100.0%) | 190,681 (100.0%) |
Real Estate & Mortgages in Allegheny County
Real Estate and Mortgage Overview in Allegheny County
| Characteristic | Without Mortgage | With Mortgage |
| Housing Units | 147,432 | 207,524 |
| Median Property Value | $172,600 | $218,000 |
| Median Household Income | $68,213 | $69,265 |
| Monthly Housing Costs | $618 | $22,796 |
| Real Estate Taxes | $2,939 | $2,983 |
Property Value by Mortgage Status in Allegheny County
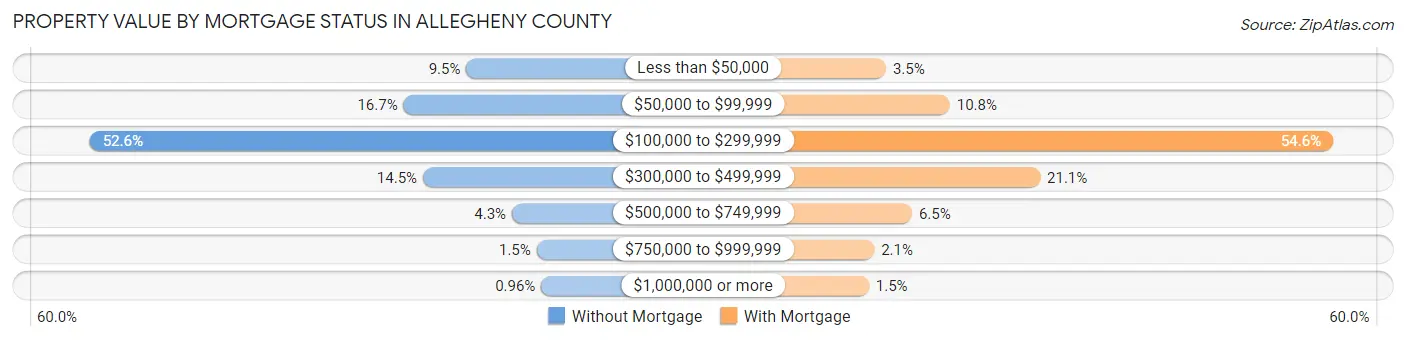
| Property Value | Without Mortgage | With Mortgage |
| Less than $50,000 | 14,037 (9.5%) | 7,228 (3.5%) |
| $50,000 to $99,999 | 24,623 (16.7%) | 22,354 (10.8%) |
| $100,000 to $299,999 | 77,474 (52.5%) | 113,227 (54.6%) |
| $300,000 to $499,999 | 21,352 (14.5%) | 43,757 (21.1%) |
| $500,000 to $749,999 | 6,352 (4.3%) | 13,380 (6.5%) |
| $750,000 to $999,999 | 2,183 (1.5%) | 4,429 (2.1%) |
| $1,000,000 or more | 1,411 (1.0%) | 3,149 (1.5%) |
| Total | 147,432 (100.0%) | 207,524 (100.0%) |
Household Income by Mortgage Status in Allegheny County
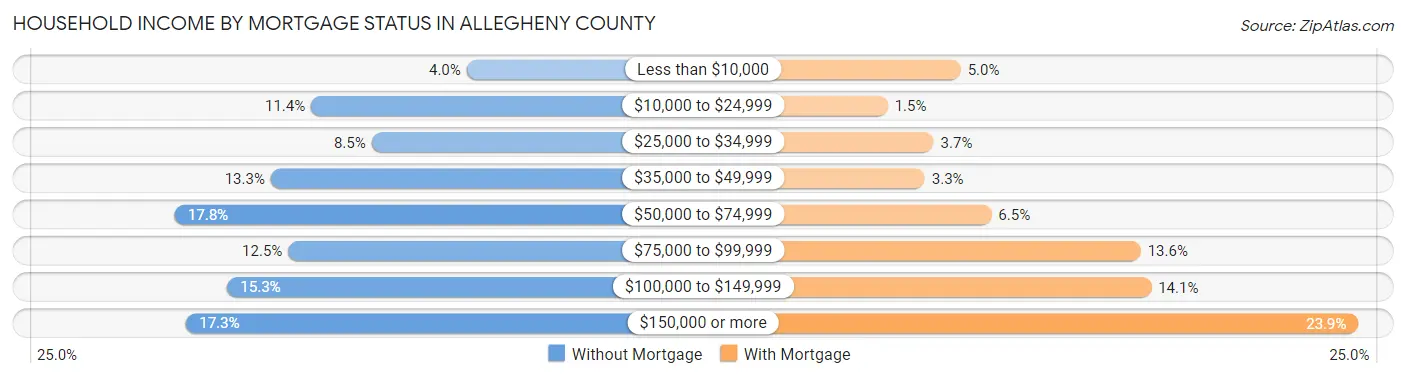
| Household Income | Without Mortgage | With Mortgage |
| Less than $10,000 | 5,817 (4.0%) | 10,401 (5.0%) |
| $10,000 to $24,999 | 16,741 (11.4%) | 3,178 (1.5%) |
| $25,000 to $34,999 | 12,508 (8.5%) | 7,711 (3.7%) |
| $35,000 to $49,999 | 19,583 (13.3%) | 6,847 (3.3%) |
| $50,000 to $74,999 | 26,301 (17.8%) | 13,433 (6.5%) |
| $75,000 to $99,999 | 18,357 (12.4%) | 28,186 (13.6%) |
| $100,000 to $149,999 | 22,619 (15.3%) | 29,221 (14.1%) |
| $150,000 or more | 25,506 (17.3%) | 49,683 (23.9%) |
| Total | 147,432 (100.0%) | 207,524 (100.0%) |
Property Value to Household Income Ratio in Allegheny County
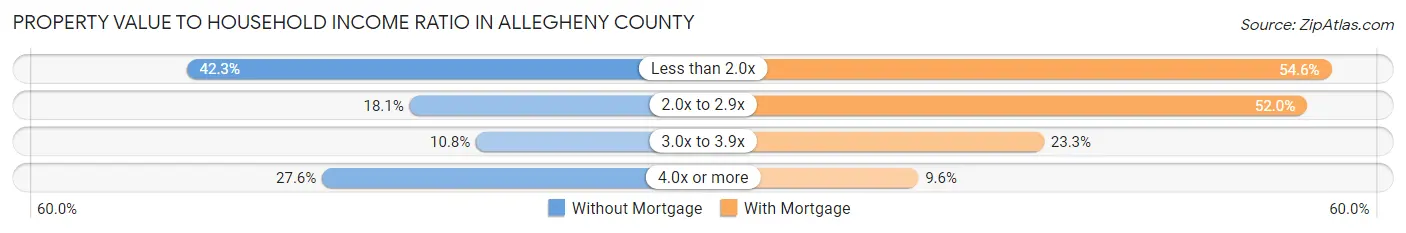
| Value-to-Income Ratio | Without Mortgage | With Mortgage |
| Less than 2.0x | 62,418 (42.3%) | 113,399 (54.6%) |
| 2.0x to 2.9x | 26,605 (18.0%) | 107,892 (52.0%) |
| 3.0x to 3.9x | 15,921 (10.8%) | 48,374 (23.3%) |
| 4.0x or more | 40,667 (27.6%) | 19,960 (9.6%) |
| Total | 147,432 (100.0%) | 207,524 (100.0%) |
Real Estate Taxes by Mortgage Status in Allegheny County
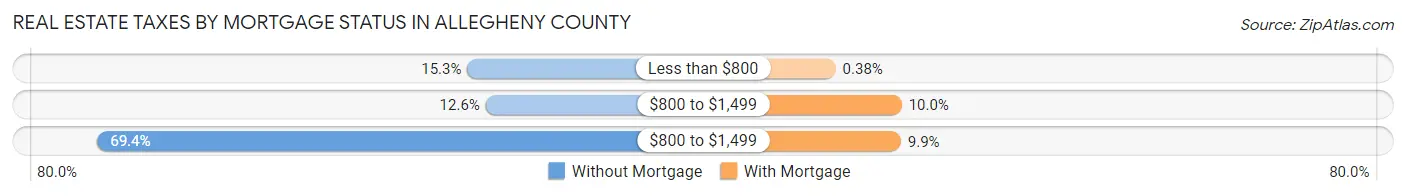
| Property Taxes | Without Mortgage | With Mortgage |
| Less than $800 | 22,569 (15.3%) | 790 (0.4%) |
| $800 to $1,499 | 18,616 (12.6%) | 20,820 (10.0%) |
| $800 to $1,499 | 102,272 (69.4%) | 20,562 (9.9%) |
| Total | 147,432 (100.0%) | 207,524 (100.0%) |
Health & Disability in Allegheny County
Health Insurance Coverage by Age in Allegheny County
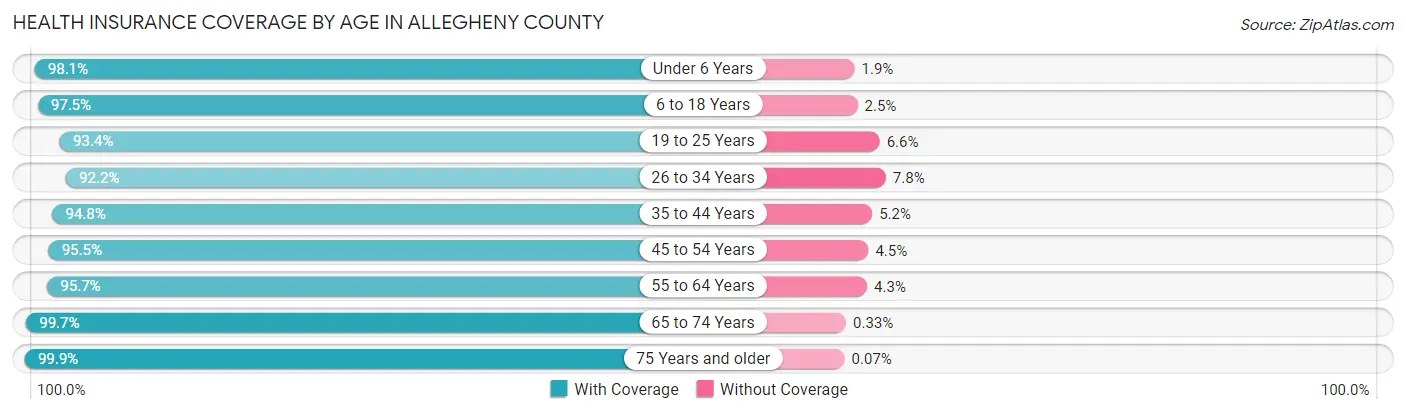
| Age Bracket | With Coverage | Without Coverage |
| Under 6 Years | 74,535 (98.1%) | 1,456 (1.9%) |
| 6 to 18 Years | 168,196 (97.5%) | 4,279 (2.5%) |
| 19 to 25 Years | 103,436 (93.4%) | 7,305 (6.6%) |
| 26 to 34 Years | 155,287 (92.2%) | 13,059 (7.8%) |
| 35 to 44 Years | 147,266 (94.8%) | 8,104 (5.2%) |
| 45 to 54 Years | 136,494 (95.5%) | 6,441 (4.5%) |
| 55 to 64 Years | 164,815 (95.7%) | 7,339 (4.3%) |
| 65 to 74 Years | 136,699 (99.7%) | 449 (0.3%) |
| 75 Years and older | 98,052 (99.9%) | 64 (0.1%) |
| Total | 1,184,780 (96.1%) | 48,496 (3.9%) |
Health Insurance Coverage by Citizenship Status in Allegheny County
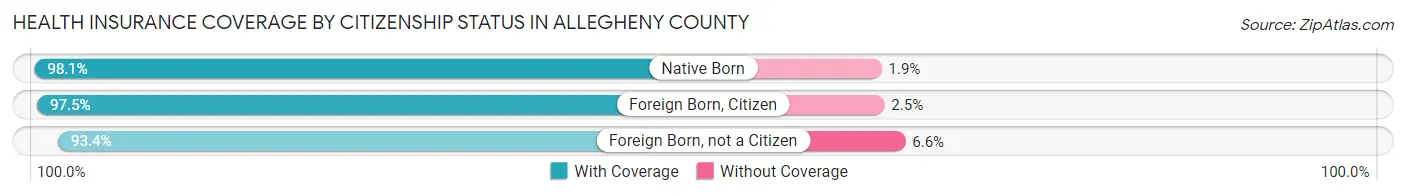
| Citizenship Status | With Coverage | Without Coverage |
| Native Born | 74,535 (98.1%) | 1,456 (1.9%) |
| Foreign Born, Citizen | 168,196 (97.5%) | 4,279 (2.5%) |
| Foreign Born, not a Citizen | 103,436 (93.4%) | 7,305 (6.6%) |
Health Insurance Coverage by Household Income in Allegheny County
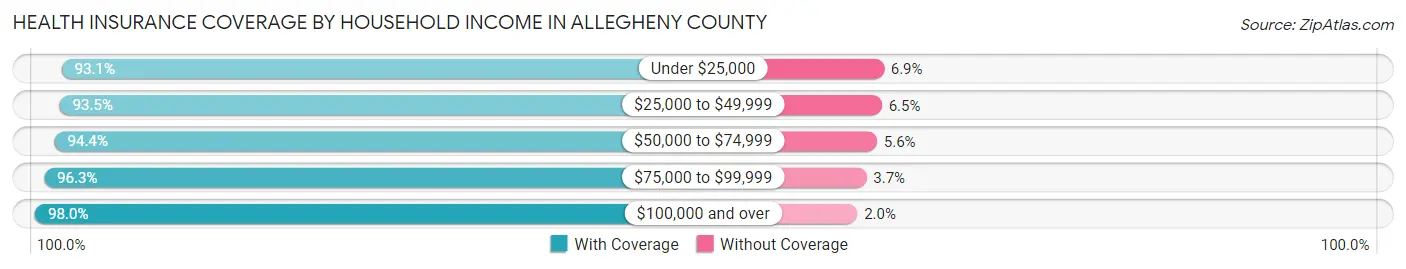
| Household Income | With Coverage | Without Coverage |
| Under $25,000 | 130,474 (93.1%) | 9,712 (6.9%) |
| $25,000 to $49,999 | 164,757 (93.5%) | 11,532 (6.5%) |
| $50,000 to $74,999 | 164,911 (94.4%) | 9,843 (5.6%) |
| $75,000 to $99,999 | 149,787 (96.3%) | 5,683 (3.7%) |
| $100,000 and over | 551,524 (98.0%) | 11,047 (2.0%) |
Public vs Private Health Insurance Coverage by Age in Allegheny County
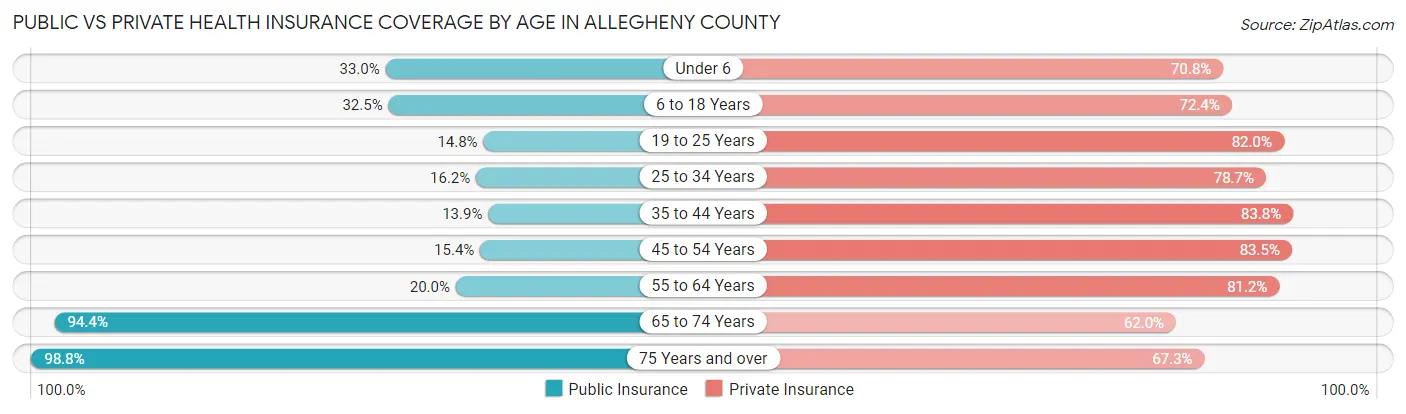
| Age Bracket | Public Insurance | Private Insurance |
| Under 6 | 25,078 (33.0%) | 53,787 (70.8%) |
| 6 to 18 Years | 55,992 (32.5%) | 124,795 (72.4%) |
| 19 to 25 Years | 16,418 (14.8%) | 90,834 (82.0%) |
| 25 to 34 Years | 27,260 (16.2%) | 132,484 (78.7%) |
| 35 to 44 Years | 21,651 (13.9%) | 130,121 (83.8%) |
| 45 to 54 Years | 22,072 (15.4%) | 119,365 (83.5%) |
| 55 to 64 Years | 34,371 (20.0%) | 139,751 (81.2%) |
| 65 to 74 Years | 129,508 (94.4%) | 85,064 (62.0%) |
| 75 Years and over | 96,894 (98.8%) | 66,040 (67.3%) |
| Total | 429,244 (34.8%) | 942,241 (76.4%) |
Disability Status by Sex by Age in Allegheny County
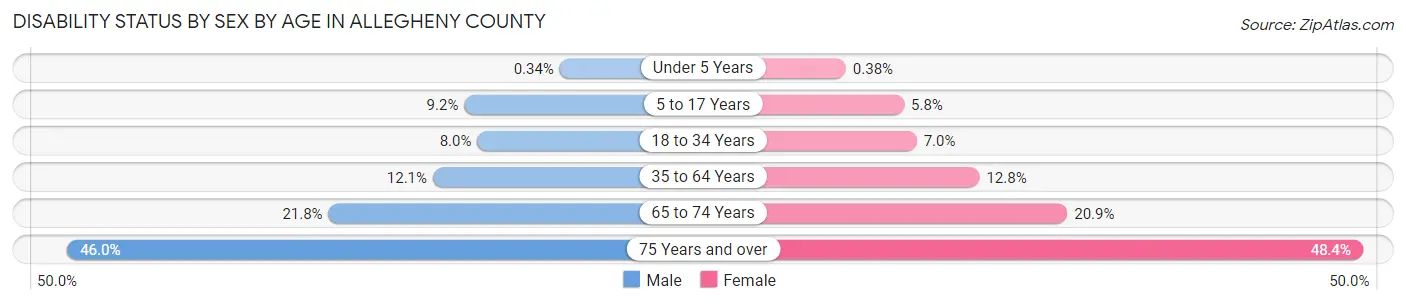
| Age Bracket | Male | Female |
| Under 5 Years | 110 (0.3%) | 117 (0.4%) |
| 5 to 17 Years | 7,892 (9.2%) | 4,740 (5.8%) |
| 18 to 34 Years | 11,897 (8.0%) | 10,253 (7.0%) |
| 35 to 64 Years | 28,164 (12.1%) | 30,405 (12.8%) |
| 65 to 74 Years | 13,886 (21.8%) | 15,378 (20.9%) |
| 75 Years and over | 17,313 (46.0%) | 29,256 (48.3%) |
Disability Class by Sex by Age in Allegheny County
Disability Class: Hearing Difficulty
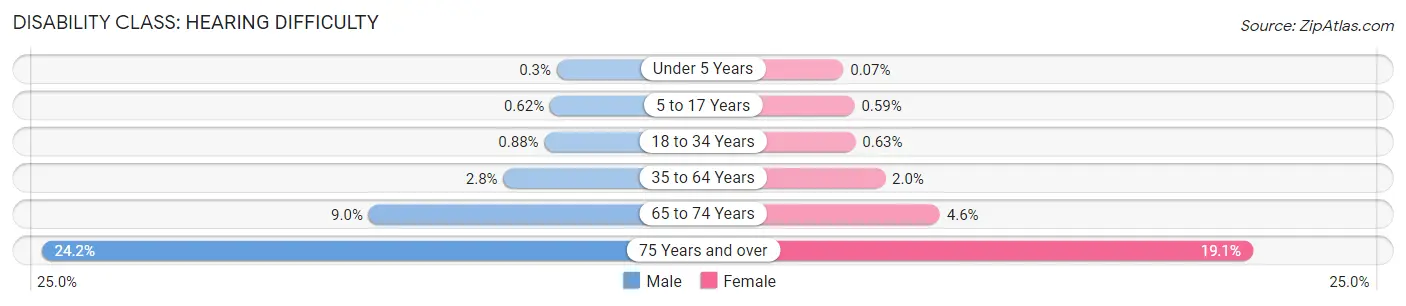
| Age Bracket | Male | Female |
| Under 5 Years | 96 (0.3%) | 21 (0.1%) |
| 5 to 17 Years | 532 (0.6%) | 484 (0.6%) |
| 18 to 34 Years | 1,305 (0.9%) | 936 (0.6%) |
| 35 to 64 Years | 6,457 (2.8%) | 4,770 (2.0%) |
| 65 to 74 Years | 5,749 (9.0%) | 3,340 (4.5%) |
| 75 Years and over | 9,103 (24.2%) | 11,541 (19.1%) |
Disability Class: Vision Difficulty
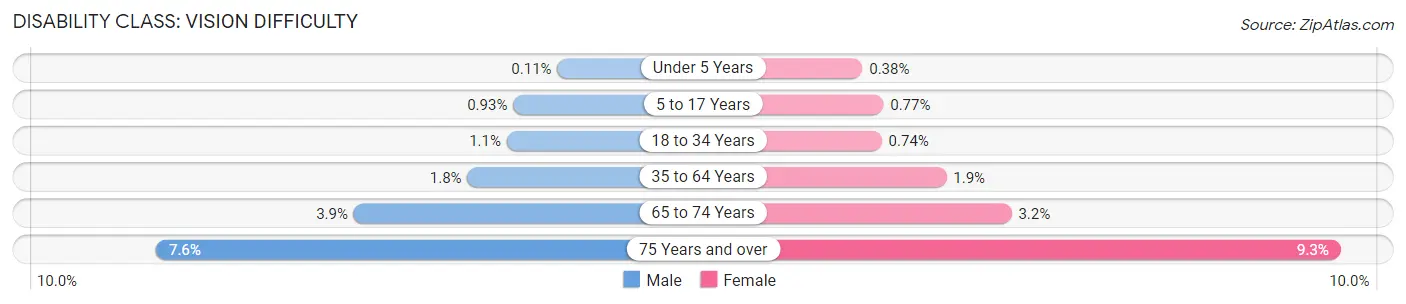
| Age Bracket | Male | Female |
| Under 5 Years | 36 (0.1%) | 117 (0.4%) |
| 5 to 17 Years | 801 (0.9%) | 628 (0.8%) |
| 18 to 34 Years | 1,562 (1.1%) | 1,095 (0.7%) |
| 35 to 64 Years | 4,148 (1.8%) | 4,624 (1.9%) |
| 65 to 74 Years | 2,475 (3.9%) | 2,311 (3.2%) |
| 75 Years and over | 2,842 (7.6%) | 5,603 (9.3%) |
Disability Class: Cognitive Difficulty
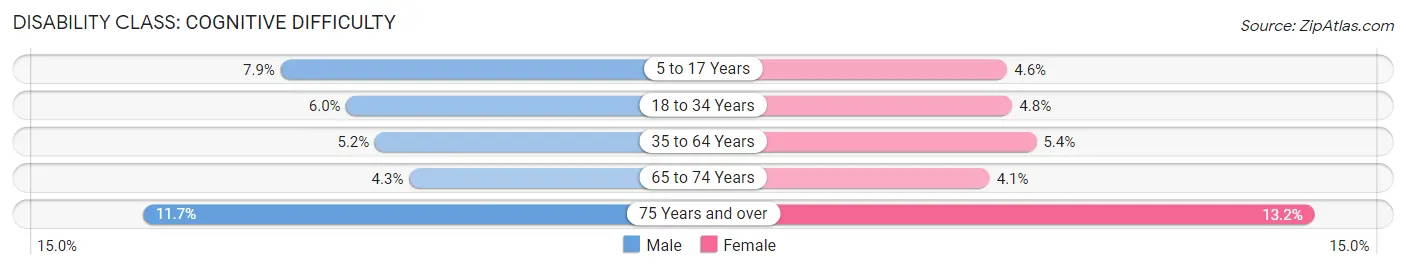
| Age Bracket | Male | Female |
| 5 to 17 Years | 6,751 (7.9%) | 3,782 (4.6%) |
| 18 to 34 Years | 8,999 (6.0%) | 7,002 (4.8%) |
| 35 to 64 Years | 12,182 (5.2%) | 12,906 (5.4%) |
| 65 to 74 Years | 2,730 (4.3%) | 3,028 (4.1%) |
| 75 Years and over | 4,404 (11.7%) | 7,962 (13.2%) |
Disability Class: Ambulatory Difficulty
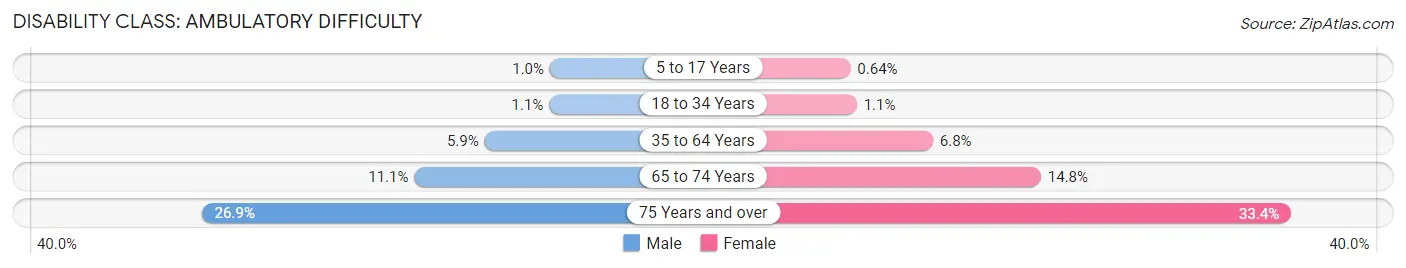
| Age Bracket | Male | Female |
| 5 to 17 Years | 854 (1.0%) | 523 (0.6%) |
| 18 to 34 Years | 1,560 (1.1%) | 1,640 (1.1%) |
| 35 to 64 Years | 13,595 (5.9%) | 16,092 (6.8%) |
| 65 to 74 Years | 7,048 (11.1%) | 10,855 (14.8%) |
| 75 Years and over | 10,099 (26.9%) | 20,186 (33.4%) |
Disability Class: Self-Care Difficulty
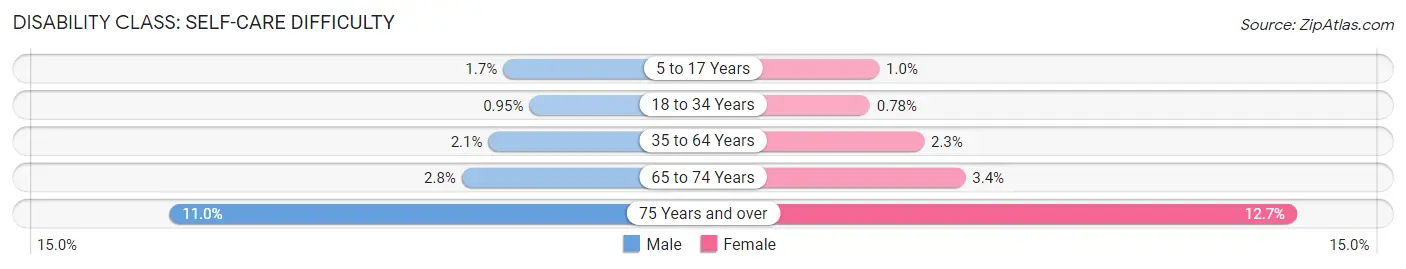
| Age Bracket | Male | Female |
| 5 to 17 Years | 1,438 (1.7%) | 853 (1.0%) |
| 18 to 34 Years | 1,416 (0.9%) | 1,151 (0.8%) |
| 35 to 64 Years | 4,865 (2.1%) | 5,438 (2.3%) |
| 65 to 74 Years | 1,803 (2.8%) | 2,525 (3.4%) |
| 75 Years and over | 4,125 (11.0%) | 7,664 (12.7%) |
Technology Access in Allegheny County
Computing Device Access in Allegheny County
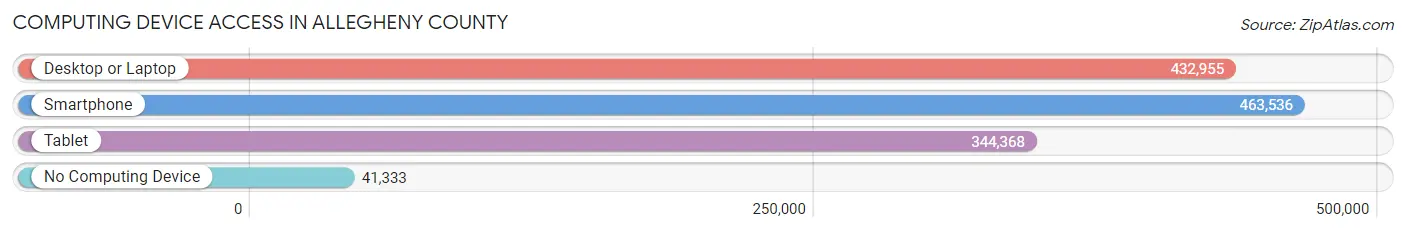
| Device Type | # Households | % Households |
| Desktop or Laptop | 432,955 | 79.3% |
| Smartphone | 463,536 | 85.0% |
| Tablet | 344,368 | 63.1% |
| No Computing Device | 41,333 | 7.6% |
| Total | 545,637 | 100.0% |
Internet Access in Allegheny County
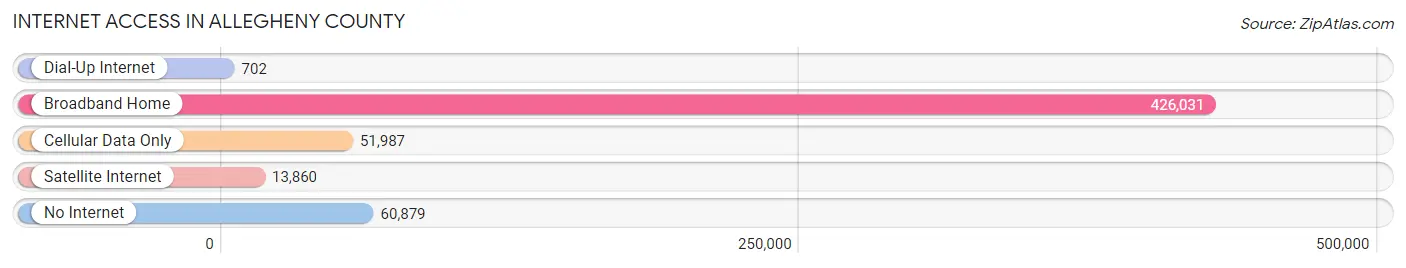
| Internet Type | # Households | % Households |
| Dial-Up Internet | 702 | 0.1% |
| Broadband Home | 426,031 | 78.1% |
| Cellular Data Only | 51,987 | 9.5% |
| Satellite Internet | 13,860 | 2.5% |
| No Internet | 60,879 | 11.2% |
| Total | 545,637 | 100.0% |
Allegheny County Summary
Allegheny County, Pennsylvania is located in the southwestern corner of the state and is part of the Pittsburgh metropolitan area. It is the second-most populous county in Pennsylvania, with a population of 1,225,365 as of the 2010 census. The county seat is Pittsburgh, the state’s second-largest city. Allegheny County is bordered by Westmoreland County to the east, Washington County to the south, and Beaver County to the northwest.
History
Allegheny County was formed in 1788 from parts of Washington and Westmoreland counties. It was named after the Allegheny River, which runs through the county. The county was originally part of the Virginia Colony, and was later part of the Northwest Territory. In 1791, Allegheny County became part of the newly formed Commonwealth of Pennsylvania.
The county was home to many Native American tribes, including the Shawnee, Delaware, and Iroquois. The first European settlers arrived in the area in the late 1700s. The county was an important center of the Underground Railroad, and many escaped slaves found refuge in the county.
In the 19th century, Allegheny County was an important center of industry, with steel mills, coal mines, and other industries. The county was also home to many immigrants, including Germans, Irish, and Italians.
Geography
Allegheny County covers an area of 745 square miles, making it the second-largest county in Pennsylvania. The county is located in the Allegheny Plateau region of the Appalachian Mountains. The Allegheny River runs through the county, and the Monongahela River forms part of its western border.
The county is home to several state parks, including Point State Park, which is located at the confluence of the Allegheny and Monongahela rivers. The county also contains several large parks, including North Park, South Park, and Frick Park.
Economy
Allegheny County’s economy is largely based on manufacturing, healthcare, and education. The county is home to several large companies, including U.S. Steel, PPG Industries, and Alcoa. The county is also home to several universities, including the University of Pittsburgh, Carnegie Mellon University, and Duquesne University.
The county’s largest employers are UPMC, the University of Pittsburgh Medical Center, and the Allegheny County government. The county’s unemployment rate was 5.2% in 2019.
Demographics
As of the 2010 census, the population of Allegheny County was 1,225,365. The population is largely white (78.2%), with African Americans making up 15.6% of the population. Other racial groups include Asians (3.3%), Hispanics (2.2%), and Native Americans (0.3%).
The median household income in the county was $50,819 in 2019. The median home value was $142,400 in 2019. The county’s poverty rate was 13.2% in 2019.
Allegheny County is home to a diverse population, with many different cultures and backgrounds. The county is home to a large number of immigrants, including those from India, China, and Mexico. The county is also home to a large number of refugees, including those from Syria, Iraq, and Afghanistan.
Common Questions
What is Per Capita Income in Allegheny County?
Per Capita income in Allegheny County is $45,939.
What is the Median Family Income in Allegheny County?
Median Family Income in Allegheny County is $102,710.
What is the Median Household income in Allegheny County?
Median Household Income in Allegheny County is $72,537.
What is Income or Wage Gap in Allegheny County?
Income or Wage Gap in Allegheny County is 28.0%.
Women in Allegheny County earn 72.0 cents for every dollar earned by a man.
What is Family Income Deficit in Allegheny County?
Family Income Deficit in Allegheny County is $11,417.
Families that are below poverty line in Allegheny County earn $11,417 less on average than the poverty threshold level.
What is Inequality or Gini Index in Allegheny County?
Inequality or Gini Index in Allegheny County is 0.48.
What is the Total Population of Allegheny County?
Total Population of Allegheny County is 1,245,310.
What is the Total Male Population of Allegheny County?
Total Male Population of Allegheny County is 607,557.
What is the Total Female Population of Allegheny County?
Total Female Population of Allegheny County is 637,753.
What is the Ratio of Males per 100 Females in Allegheny County?
There are 95.27 Males per 100 Females in Allegheny County.
What is the Ratio of Females per 100 Males in Allegheny County?
There are 104.97 Females per 100 Males in Allegheny County.
What is the Median Population Age in Allegheny County?
Median Population Age in Allegheny County is 40.6 Years.
What is the Average Family Size in Allegheny County
Average Family Size in Allegheny County is 3.0 People.
What is the Average Household Size in Allegheny County
Average Household Size in Allegheny County is 2.2 People.
How Large is the Labor Force in Allegheny County?
There are 674,236 People in the Labor Forcein in Allegheny County.
What is the Percentage of People in the Labor Force in Allegheny County?
64.8% of People are in the Labor Force in Allegheny County.
What is the Unemployment Rate in Allegheny County?
Unemployment Rate in Allegheny County is 4.9%.