Mortons Gap, KY Map & Demographics
Mortons Gap Map
Mortons Gap Overview
$20,953
PER CAPITA INCOME
$52,083
AVG FAMILY INCOME
$39,205
AVG HOUSEHOLD INCOME
43.0%
WAGE / INCOME GAP [ % ]
57.0¢/ $1
WAGE / INCOME GAP [ $ ]
0.43
INEQUALITY / GINI INDEX
841
TOTAL POPULATION
393
MALE POPULATION
448
FEMALE POPULATION
87.72
MALES / 100 FEMALES
113.99
FEMALES / 100 MALES
46.6
MEDIAN AGE
2.8
AVG FAMILY SIZE
2.3
AVG HOUSEHOLD SIZE
277
LABOR FORCE [ PEOPLE ]
39.6%
PERCENT IN LABOR FORCE
1.1%
UNEMPLOYMENT RATE
Mortons Gap Zip Codes
Mortons Gap Area Codes
Income in Mortons Gap
Income Overview in Mortons Gap
Per Capita Income in Mortons Gap is $20,953, while median incomes of families and households are $52,083 and $39,205 respectively.
| Characteristic | Number | Measure |
| Per Capita Income | 841 | $20,953 |
| Median Family Income | 240 | $52,083 |
| Mean Family Income | 240 | $55,506 |
| Median Household Income | 361 | $39,205 |
| Mean Household Income | 361 | $49,064 |
| Income Deficit | 240 | $0 |
| Wage / Income Gap (%) | 841 | 43.02% |
| Wage / Income Gap ($) | 841 | 56.98¢ per $1 |
| Gini / Inequality Index | 841 | 0.43 |
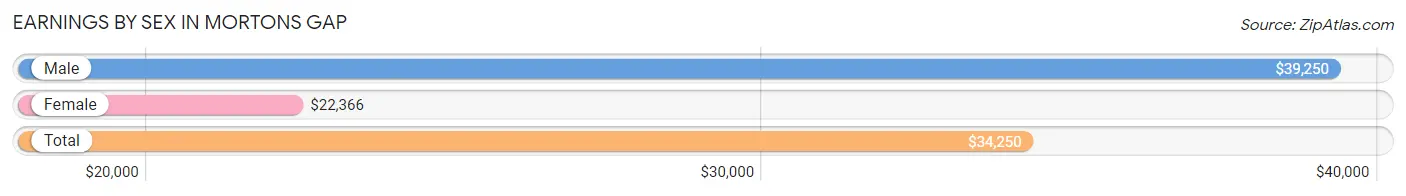
Earnings by Sex in Mortons Gap
Average Earnings in Mortons Gap are $34,250, $39,250 for men and $22,366 for women, a difference of 43.0%.
| Sex | Number | Average Earnings |
| Male | 182 (60.9%) | $39,250 |
| Female | 117 (39.1%) | $22,366 |
| Total | 299 (100.0%) | $34,250 |
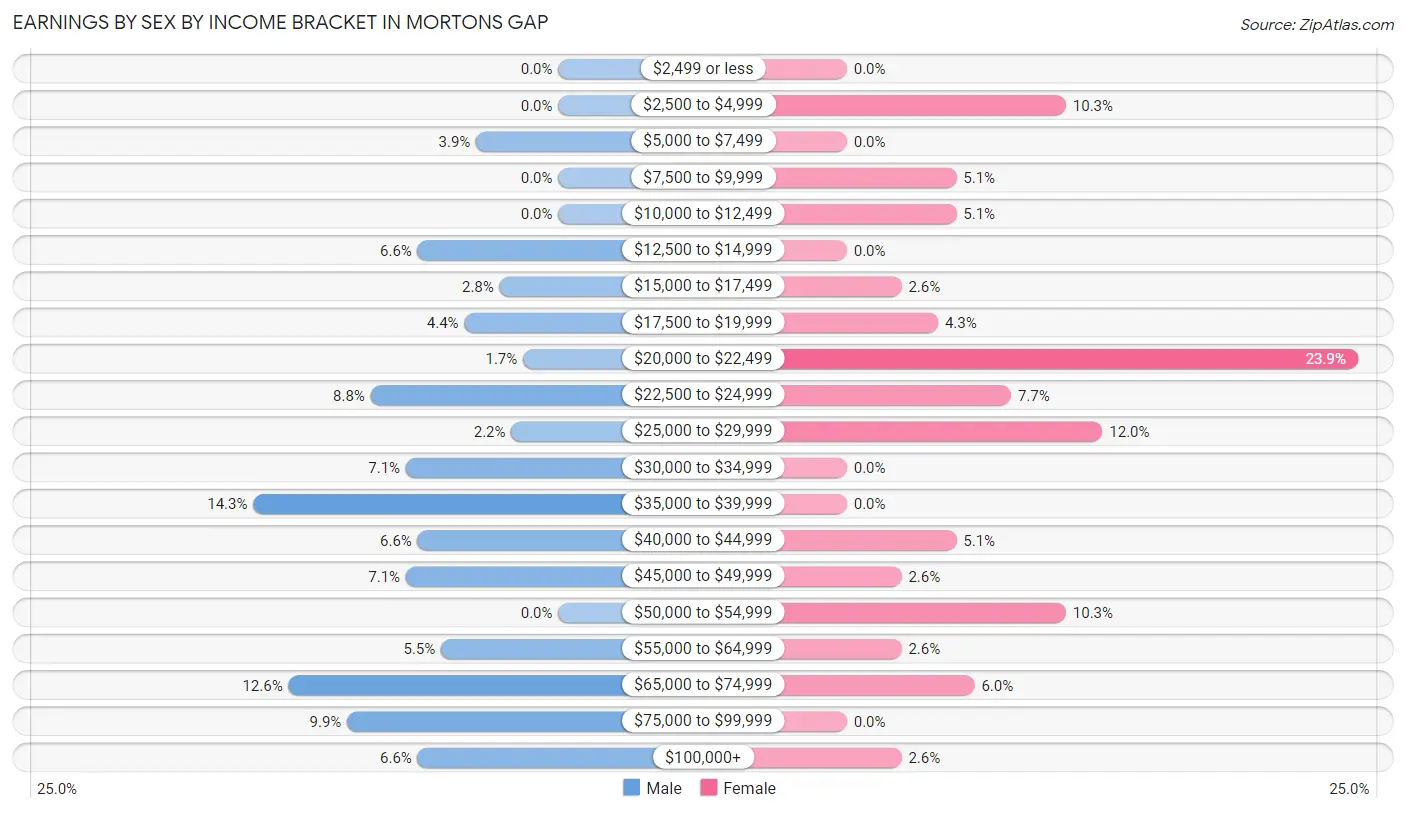
Earnings by Sex by Income Bracket in Mortons Gap
The most common earnings brackets in Mortons Gap are $35,000 to $39,999 for men (26 | 14.3%) and $20,000 to $22,499 for women (28 | 23.9%).
| Income | Male | Female |
| $2,499 or less | 0 (0.0%) | 0 (0.0%) |
| $2,500 to $4,999 | 0 (0.0%) | 12 (10.3%) |
| $5,000 to $7,499 | 7 (3.8%) | 0 (0.0%) |
| $7,500 to $9,999 | 0 (0.0%) | 6 (5.1%) |
| $10,000 to $12,499 | 0 (0.0%) | 6 (5.1%) |
| $12,500 to $14,999 | 12 (6.6%) | 0 (0.0%) |
| $15,000 to $17,499 | 5 (2.8%) | 3 (2.6%) |
| $17,500 to $19,999 | 8 (4.4%) | 5 (4.3%) |
| $20,000 to $22,499 | 3 (1.7%) | 28 (23.9%) |
| $22,500 to $24,999 | 16 (8.8%) | 9 (7.7%) |
| $25,000 to $29,999 | 4 (2.2%) | 14 (12.0%) |
| $30,000 to $34,999 | 13 (7.1%) | 0 (0.0%) |
| $35,000 to $39,999 | 26 (14.3%) | 0 (0.0%) |
| $40,000 to $44,999 | 12 (6.6%) | 6 (5.1%) |
| $45,000 to $49,999 | 13 (7.1%) | 3 (2.6%) |
| $50,000 to $54,999 | 0 (0.0%) | 12 (10.3%) |
| $55,000 to $64,999 | 10 (5.5%) | 3 (2.6%) |
| $65,000 to $74,999 | 23 (12.6%) | 7 (6.0%) |
| $75,000 to $99,999 | 18 (9.9%) | 0 (0.0%) |
| $100,000+ | 12 (6.6%) | 3 (2.6%) |
| Total | 182 (100.0%) | 117 (100.0%) |
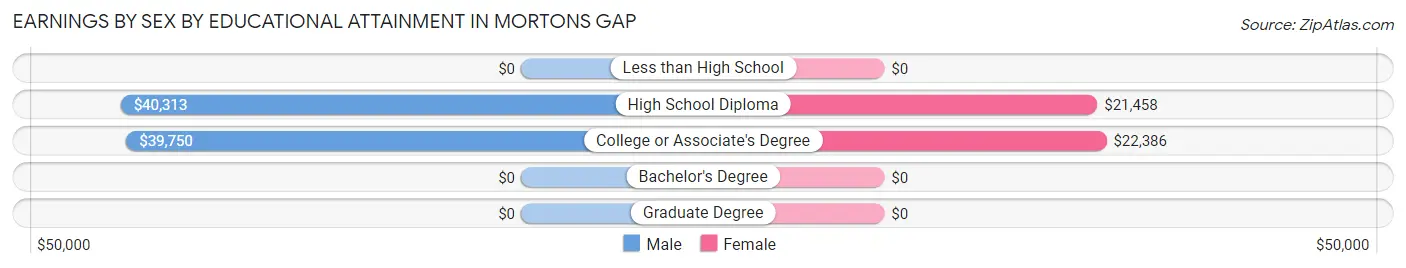
Earnings by Sex by Educational Attainment in Mortons Gap
Average earnings in Mortons Gap are $40,417 for men and $23,750 for women, a difference of 41.2%. Men with an educational attainment of high school diploma enjoy the highest average annual earnings of $40,313, while those with college or associate's degree education earn the least with $39,750. Women with an educational attainment of college or associate's degree earn the most with the average annual earnings of $22,386, while those with high school diploma education have the smallest earnings of $21,458.
| Educational Attainment | Male Income | Female Income |
| Less than High School | - | - |
| High School Diploma | $40,313 | $21,458 |
| College or Associate's Degree | $39,750 | $22,386 |
| Bachelor's Degree | - | - |
| Graduate Degree | - | - |
| Total | $40,417 | $23,750 |
Family Income in Mortons Gap
Family Income Brackets in Mortons Gap
According to the Mortons Gap family income data, there are 59 families falling into the $75,000 to $99,999 income range, which is the most common income bracket and makes up 24.6% of all families.
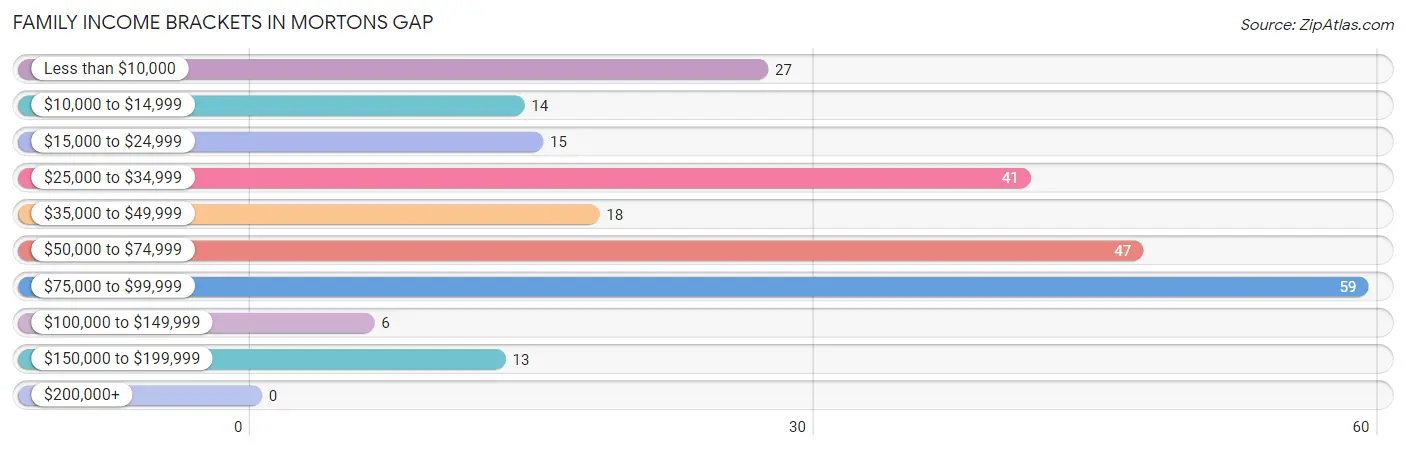
| Income Bracket | # Families | % Families |
| Less than $10,000 | 27 | 11.3% |
| $10,000 to $14,999 | 14 | 5.8% |
| $15,000 to $24,999 | 15 | 6.3% |
| $25,000 to $34,999 | 41 | 17.1% |
| $35,000 to $49,999 | 18 | 7.5% |
| $50,000 to $74,999 | 47 | 19.6% |
| $75,000 to $99,999 | 59 | 24.6% |
| $100,000 to $149,999 | 6 | 2.5% |
| $150,000 to $199,999 | 13 | 5.4% |
| $200,000+ | 0 | 0.0% |
Family Income by Famaliy Size in Mortons Gap
2-person families (127 | 52.9%) account for the highest median family income in Mortons Gap with $60,625 per family, while 2-person families (127 | 52.9%) have the highest median income of $30,312 per family member.
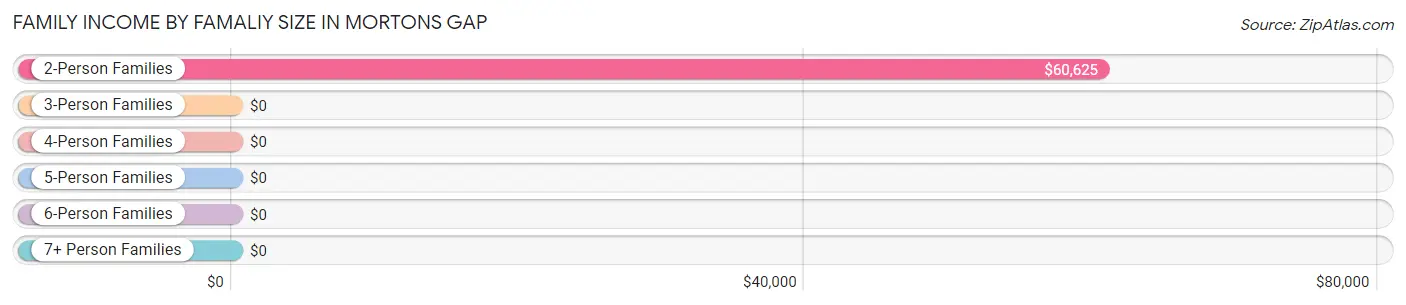
| Income Bracket | # Families | Median Income |
| 2-Person Families | 127 (52.9%) | $60,625 |
| 3-Person Families | 72 (30.0%) | $0 |
| 4-Person Families | 23 (9.6%) | $0 |
| 5-Person Families | 15 (6.2%) | $0 |
| 6-Person Families | 0 (0.0%) | $0 |
| 7+ Person Families | 3 (1.3%) | $0 |
| Total | 240 (100.0%) | $52,083 |
Family Income by Number of Earners in Mortons Gap
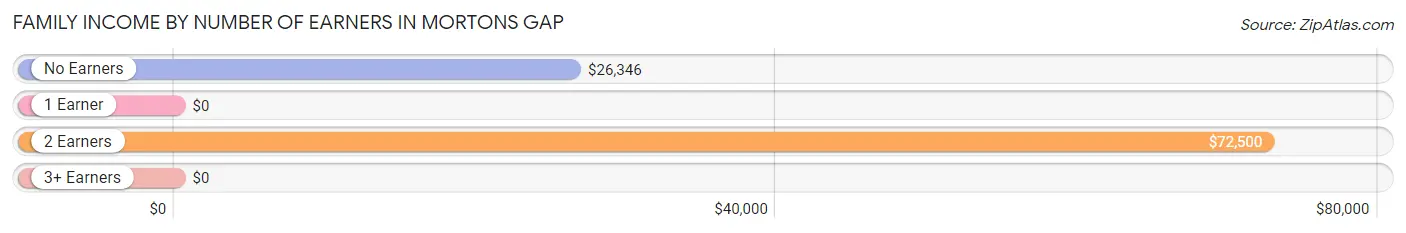
| Number of Earners | # Families | Median Income |
| No Earners | 86 (35.8%) | $26,346 |
| 1 Earner | 103 (42.9%) | $0 |
| 2 Earners | 48 (20.0%) | $72,500 |
| 3+ Earners | 3 (1.3%) | $0 |
| Total | 240 (100.0%) | $52,083 |
Household Income in Mortons Gap
Household Income Brackets in Mortons Gap
With 64 households falling in the category, the $75,000 to $99,999 income range is the most frequent in Mortons Gap, accounting for 17.7% of all households.
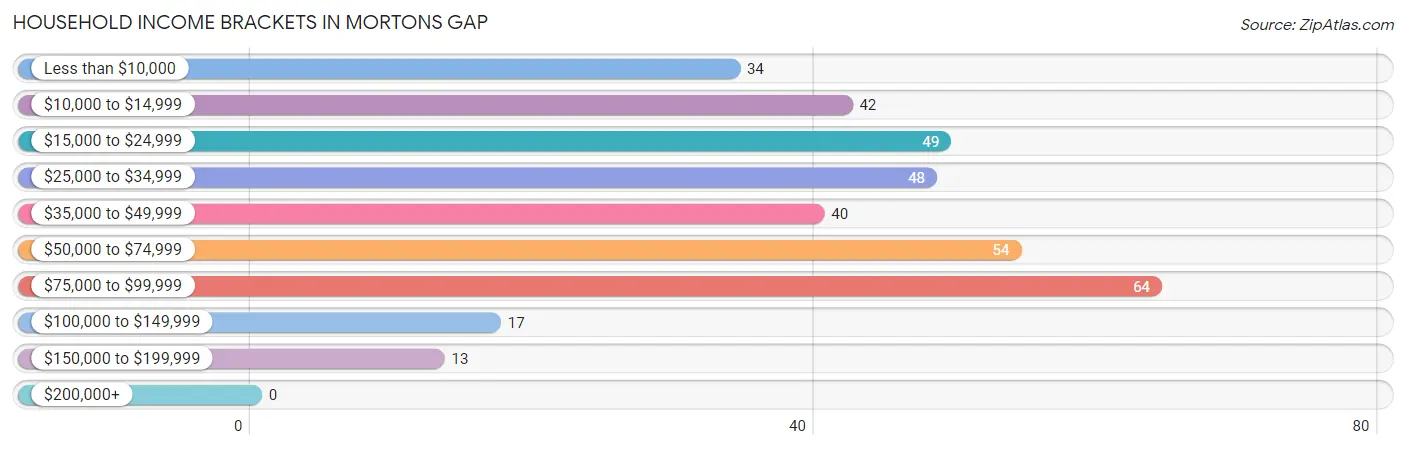
| Income Bracket | # Households | % Households |
| Less than $10,000 | 34 | 9.4% |
| $10,000 to $14,999 | 42 | 11.6% |
| $15,000 to $24,999 | 49 | 13.6% |
| $25,000 to $34,999 | 48 | 13.3% |
| $35,000 to $49,999 | 40 | 11.1% |
| $50,000 to $74,999 | 54 | 15.0% |
| $75,000 to $99,999 | 64 | 17.7% |
| $100,000 to $149,999 | 17 | 4.7% |
| $150,000 to $199,999 | 13 | 3.6% |
| $200,000+ | 0 | 0.0% |
Household Income by Householder Age in Mortons Gap
The median household income in Mortons Gap is $39,205, with the highest median household income of $55,000 found in the 25 to 44 years age bracket for the primary householder. A total of 102 households (28.2%) fall into this category. Meanwhile, the 15 to 24 years age bracket for the primary householder has the lowest median household income of $0, with 12 households (3.3%) in this group.
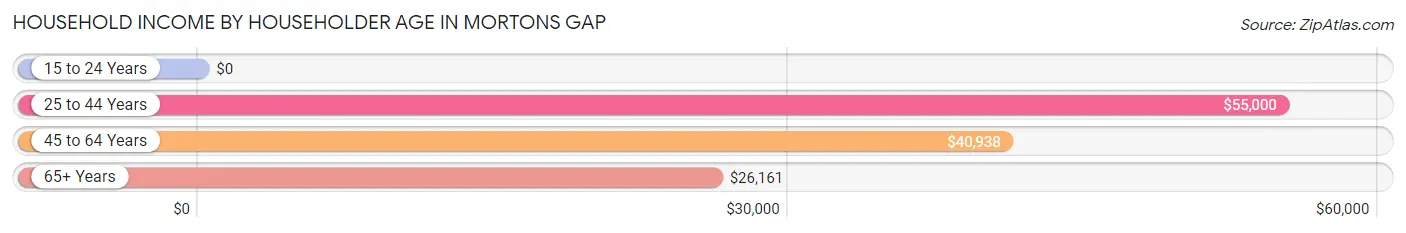
| Income Bracket | # Households | Median Income |
| 15 to 24 Years | 12 (3.3%) | $0 |
| 25 to 44 Years | 102 (28.2%) | $55,000 |
| 45 to 64 Years | 127 (35.2%) | $40,938 |
| 65+ Years | 120 (33.2%) | $26,161 |
| Total | 361 (100.0%) | $39,205 |
Poverty in Mortons Gap
Income Below Poverty by Sex and Age in Mortons Gap
With 17.6% poverty level for males and 31.7% for females among the residents of Mortons Gap, under 5 year old males and 18 to 24 year old females are the most vulnerable to poverty, with 28 males (73.7%) and 17 females (80.9%) in their respective age groups living below the poverty level.
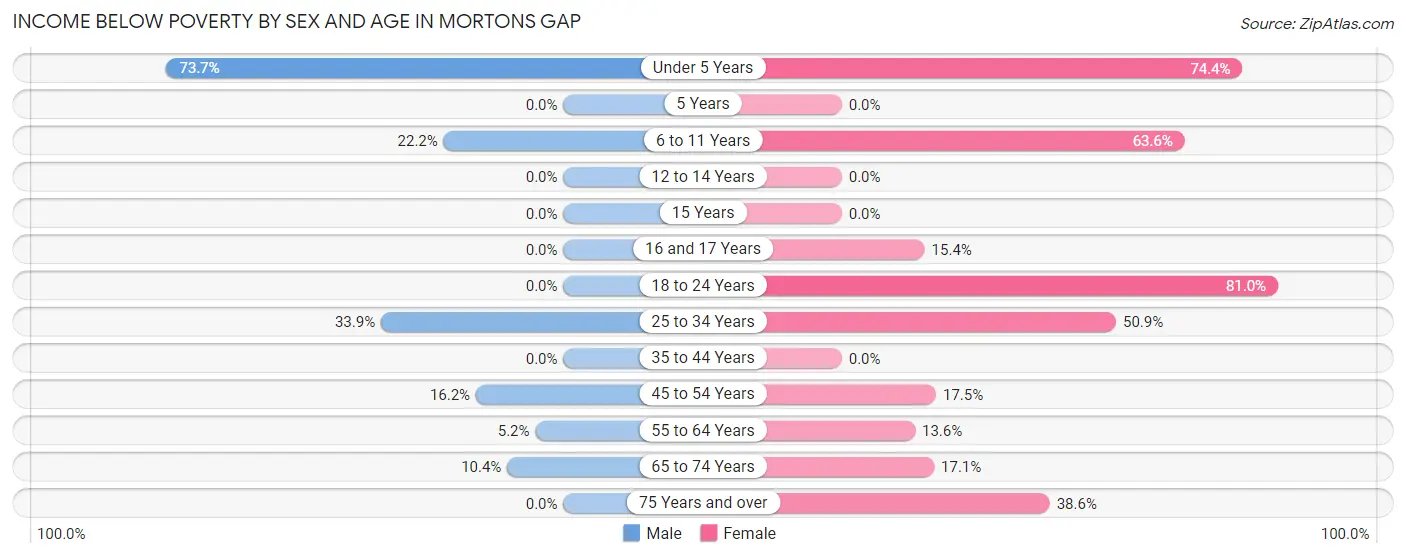
| Age Bracket | Male | Female |
| Under 5 Years | 28 (73.7%) | 29 (74.4%) |
| 5 Years | 0 (0.0%) | 0 (0.0%) |
| 6 to 11 Years | 4 (22.2%) | 14 (63.6%) |
| 12 to 14 Years | 0 (0.0%) | 0 (0.0%) |
| 15 Years | 0 (0.0%) | 0 (0.0%) |
| 16 and 17 Years | 0 (0.0%) | 2 (15.4%) |
| 18 to 24 Years | 0 (0.0%) | 17 (80.9%) |
| 25 to 34 Years | 22 (33.9%) | 28 (50.9%) |
| 35 to 44 Years | 0 (0.0%) | 0 (0.0%) |
| 45 to 54 Years | 6 (16.2%) | 7 (17.5%) |
| 55 to 64 Years | 4 (5.2%) | 17 (13.6%) |
| 65 to 74 Years | 5 (10.4%) | 6 (17.1%) |
| 75 Years and over | 0 (0.0%) | 22 (38.6%) |
| Total | 69 (17.6%) | 142 (31.7%) |
Income Above Poverty by Sex and Age in Mortons Gap
According to the poverty statistics in Mortons Gap, males aged 5 years and females aged 5 years are the age groups that are most secure financially, with 100.0% of males and 100.0% of females in these age groups living above the poverty line.
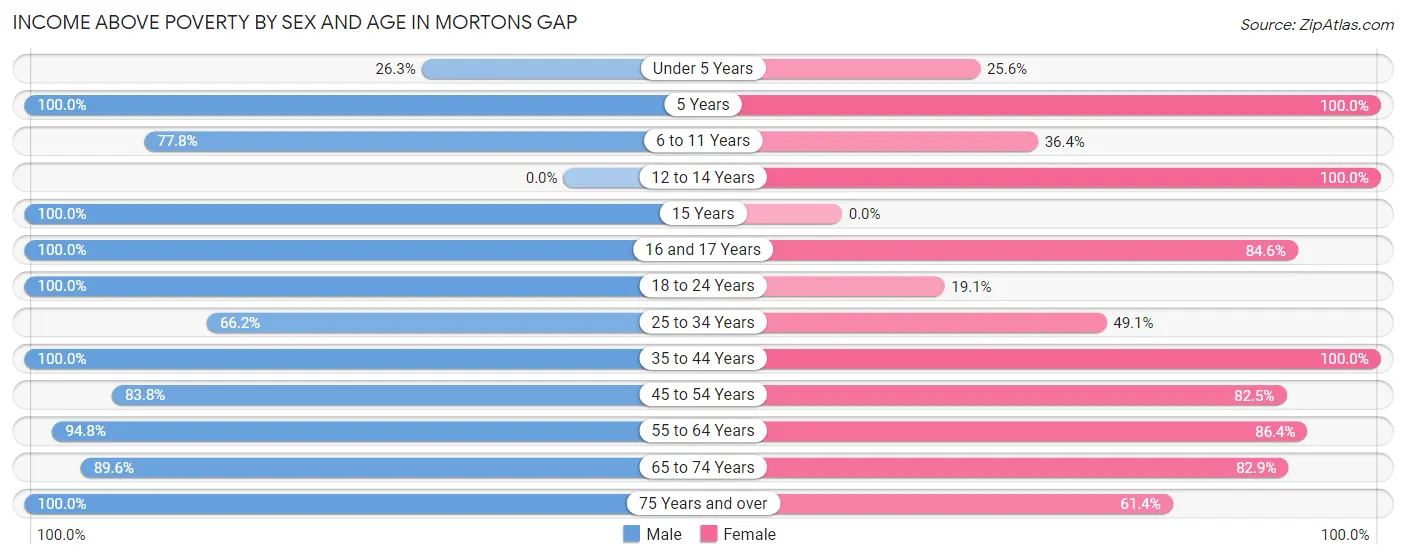
| Age Bracket | Male | Female |
| Under 5 Years | 10 (26.3%) | 10 (25.6%) |
| 5 Years | 7 (100.0%) | 4 (100.0%) |
| 6 to 11 Years | 14 (77.8%) | 8 (36.4%) |
| 12 to 14 Years | 0 (0.0%) | 9 (100.0%) |
| 15 Years | 5 (100.0%) | 0 (0.0%) |
| 16 and 17 Years | 6 (100.0%) | 11 (84.6%) |
| 18 to 24 Years | 20 (100.0%) | 4 (19.1%) |
| 25 to 34 Years | 43 (66.1%) | 27 (49.1%) |
| 35 to 44 Years | 55 (100.0%) | 28 (100.0%) |
| 45 to 54 Years | 31 (83.8%) | 33 (82.5%) |
| 55 to 64 Years | 73 (94.8%) | 108 (86.4%) |
| 65 to 74 Years | 43 (89.6%) | 29 (82.9%) |
| 75 Years and over | 17 (100.0%) | 35 (61.4%) |
| Total | 324 (82.4%) | 306 (68.3%) |
Income Below Poverty Among Married-Couple Families in Mortons Gap
The poverty statistics for married-couple families in Mortons Gap show that 12.1% or 20 of the total 165 families live below the poverty line. Families with 3 or 4 children have the highest poverty rate of 83.3%, comprising of 15 families. On the other hand, families with 1 or 2 children have the lowest poverty rate of 0.0%, which includes 0 families.
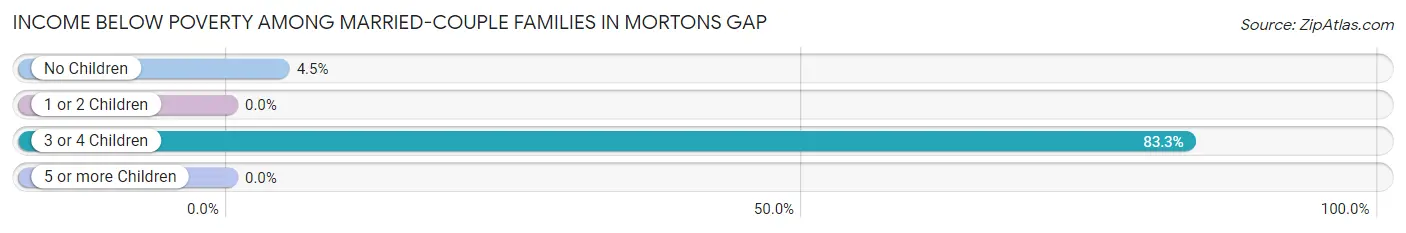
| Children | Above Poverty | Below Poverty |
| No Children | 106 (95.5%) | 5 (4.5%) |
| 1 or 2 Children | 36 (100.0%) | 0 (0.0%) |
| 3 or 4 Children | 3 (16.7%) | 15 (83.3%) |
| 5 or more Children | 0 (0.0%) | 0 (0.0%) |
| Total | 145 (87.9%) | 20 (12.1%) |
Income Below Poverty Among Single-Parent Households in Mortons Gap
According to the poverty data in Mortons Gap, 15.9% or 7 single-father households and 45.2% or 14 single-mother households are living below the poverty line. Among single-father households, those with 3 or 4 children have the highest poverty rate, with 7 households (100.0%) experiencing poverty. Likewise, among single-mother households, those with 1 or 2 children have the highest poverty rate, with 14 households (82.4%) falling below the poverty line.
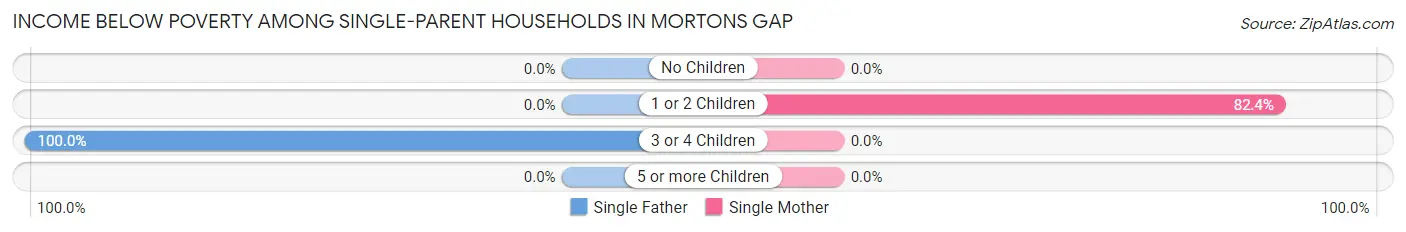
| Children | Single Father | Single Mother |
| No Children | 0 (0.0%) | 0 (0.0%) |
| 1 or 2 Children | 0 (0.0%) | 14 (82.4%) |
| 3 or 4 Children | 7 (100.0%) | 0 (0.0%) |
| 5 or more Children | 0 (0.0%) | 0 (0.0%) |
| Total | 7 (15.9%) | 14 (45.2%) |
Income Below Poverty Among Married-Couple vs Single-Parent Households in Mortons Gap
The poverty data for Mortons Gap shows that 20 of the married-couple family households (12.1%) and 21 of the single-parent households (28.0%) are living below the poverty level. Within the married-couple family households, those with 3 or 4 children have the highest poverty rate, with 15 households (83.3%) falling below the poverty line. Among the single-parent households, those with 3 or 4 children have the highest poverty rate, with 7 household (100.0%) living below poverty.
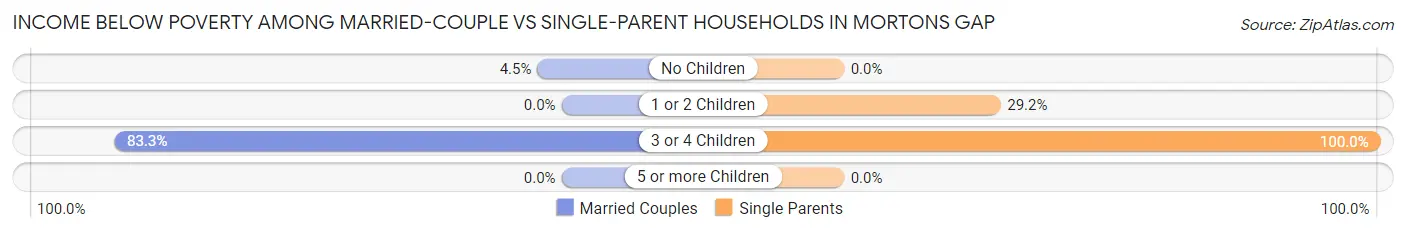
| Children | Married-Couple Families | Single-Parent Households |
| No Children | 5 (4.5%) | 0 (0.0%) |
| 1 or 2 Children | 0 (0.0%) | 14 (29.2%) |
| 3 or 4 Children | 15 (83.3%) | 7 (100.0%) |
| 5 or more Children | 0 (0.0%) | 0 (0.0%) |
| Total | 20 (12.1%) | 21 (28.0%) |
Race in Mortons Gap
The most populous races in Mortons Gap are White / Caucasian (793 | 94.3%), Black / African American (30 | 3.6%), and Two or more Races (18 | 2.1%).
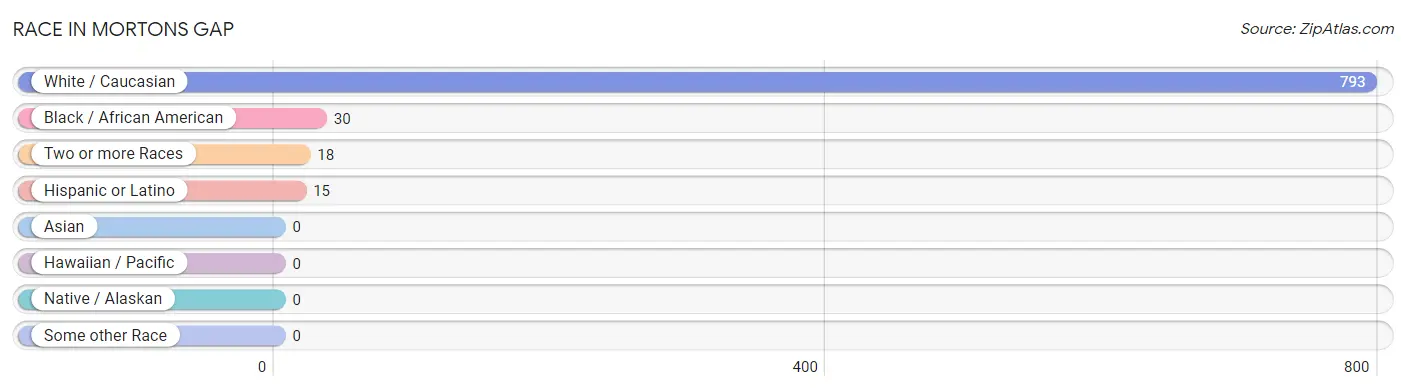
| Race | # Population | % Population |
| Asian | 0 | 0.0% |
| Black / African American | 30 | 3.6% |
| Hawaiian / Pacific | 0 | 0.0% |
| Hispanic or Latino | 15 | 1.8% |
| Native / Alaskan | 0 | 0.0% |
| White / Caucasian | 793 | 94.3% |
| Two or more Races | 18 | 2.1% |
| Some other Race | 0 | 0.0% |
| Total | 841 | 100.0% |
Ancestry in Mortons Gap
The most populous ancestries reported in Mortons Gap are Irish (119 | 14.1%), English (78 | 9.3%), German (62 | 7.4%), American (47 | 5.6%), and Scottish (42 | 5.0%), together accounting for 41.4% of all Mortons Gap residents.
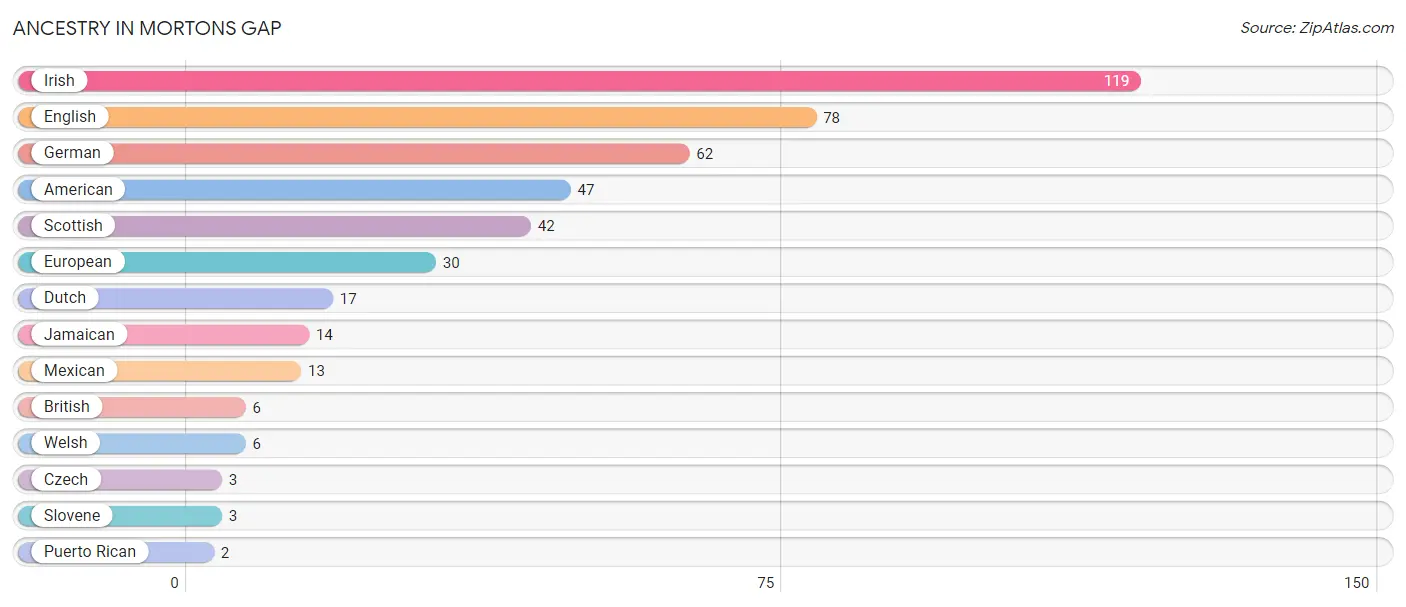
| Ancestry | # Population | % Population |
| American | 47 | 5.6% |
| British | 6 | 0.7% |
| Czech | 3 | 0.4% |
| Dutch | 17 | 2.0% |
| English | 78 | 9.3% |
| European | 30 | 3.6% |
| German | 62 | 7.4% |
| Irish | 119 | 14.1% |
| Jamaican | 14 | 1.7% |
| Mexican | 13 | 1.5% |
| Puerto Rican | 2 | 0.2% |
| Scottish | 42 | 5.0% |
| Slovene | 3 | 0.4% |
| Welsh | 6 | 0.7% | View All 14 Rows |
Immigrants in Mortons Gap

| Immigration Origin | # Population | % Population | View All 0 Rows |
Sex and Age in Mortons Gap
Sex and Age in Mortons Gap
The most populous age groups in Mortons Gap are 55 to 59 Years (58 | 14.8%) for men and 55 to 59 Years (99 | 22.1%) for women.
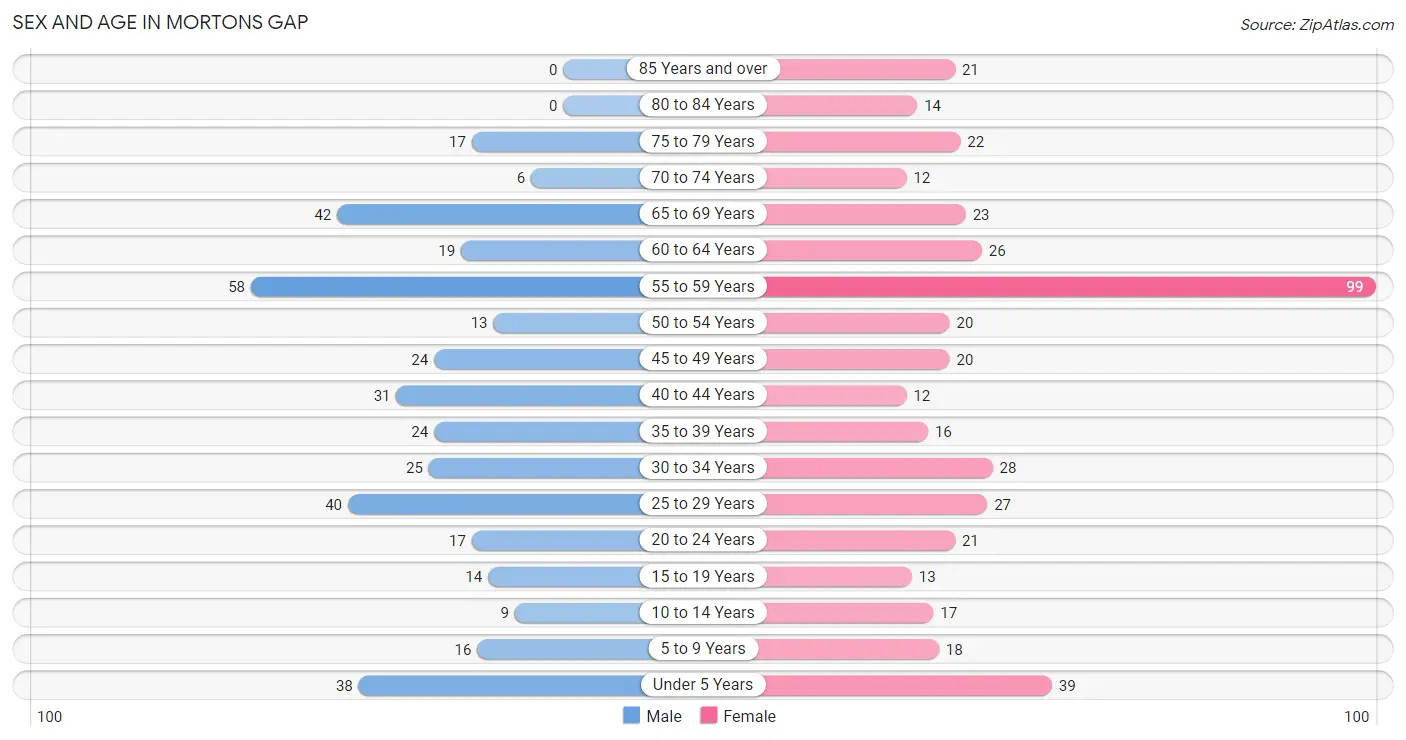
| Age Bracket | Male | Female |
| Under 5 Years | 38 (9.7%) | 39 (8.7%) |
| 5 to 9 Years | 16 (4.1%) | 18 (4.0%) |
| 10 to 14 Years | 9 (2.3%) | 17 (3.8%) |
| 15 to 19 Years | 14 (3.6%) | 13 (2.9%) |
| 20 to 24 Years | 17 (4.3%) | 21 (4.7%) |
| 25 to 29 Years | 40 (10.2%) | 27 (6.0%) |
| 30 to 34 Years | 25 (6.4%) | 28 (6.2%) |
| 35 to 39 Years | 24 (6.1%) | 16 (3.6%) |
| 40 to 44 Years | 31 (7.9%) | 12 (2.7%) |
| 45 to 49 Years | 24 (6.1%) | 20 (4.5%) |
| 50 to 54 Years | 13 (3.3%) | 20 (4.5%) |
| 55 to 59 Years | 58 (14.8%) | 99 (22.1%) |
| 60 to 64 Years | 19 (4.8%) | 26 (5.8%) |
| 65 to 69 Years | 42 (10.7%) | 23 (5.1%) |
| 70 to 74 Years | 6 (1.5%) | 12 (2.7%) |
| 75 to 79 Years | 17 (4.3%) | 22 (4.9%) |
| 80 to 84 Years | 0 (0.0%) | 14 (3.1%) |
| 85 Years and over | 0 (0.0%) | 21 (4.7%) |
| Total | 393 (100.0%) | 448 (100.0%) |
Families and Households in Mortons Gap
Median Family Size in Mortons Gap
The median family size in Mortons Gap is 2.78 persons per family, with married-couple families (165 | 68.8%) accounting for the largest median family size of 2.85 persons per family. On the other hand, single male/father families (44 | 18.3%) represent the smallest median family size with 2.43 persons per family.
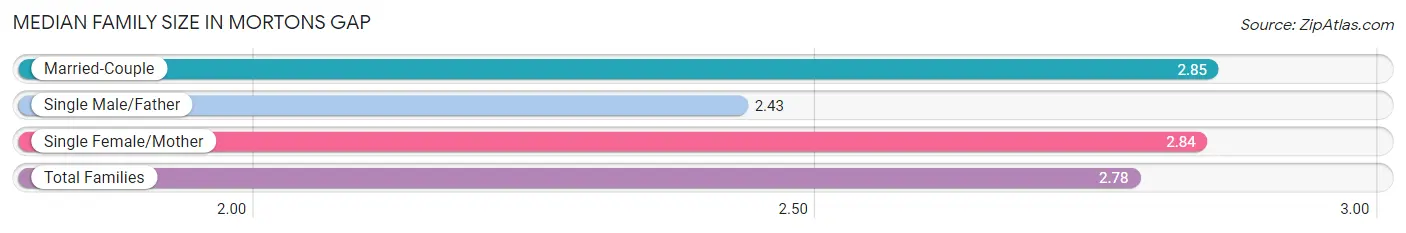
| Family Type | # Families | Family Size |
| Married-Couple | 165 (68.8%) | 2.85 |
| Single Male/Father | 44 (18.3%) | 2.43 |
| Single Female/Mother | 31 (12.9%) | 2.84 |
| Total Families | 240 (100.0%) | 2.78 |
Median Household Size in Mortons Gap
The median household size in Mortons Gap is 2.33 persons per household, with single female/mother households (31 | 8.6%) accounting for the largest median household size of 3.16 persons per household. non-family households (121 | 33.5%) represent the smallest median household size with 1.21 persons per household.
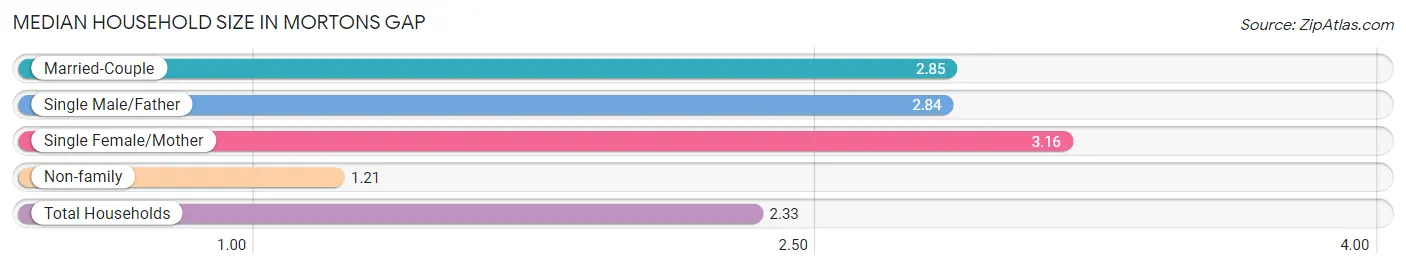
| Household Type | # Households | Household Size |
| Married-Couple | 165 (45.7%) | 2.85 |
| Single Male/Father | 44 (12.2%) | 2.84 |
| Single Female/Mother | 31 (8.6%) | 3.16 |
| Non-family | 121 (33.5%) | 1.21 |
| Total Households | 361 (100.0%) | 2.33 |
Household Size by Marriage Status in Mortons Gap
Out of a total of 361 households in Mortons Gap, 240 (66.5%) are family households, while 121 (33.5%) are nonfamily households. The most numerous type of family households are 2-person households, comprising 119, and the most common type of nonfamily households are 1-person households, comprising 97.
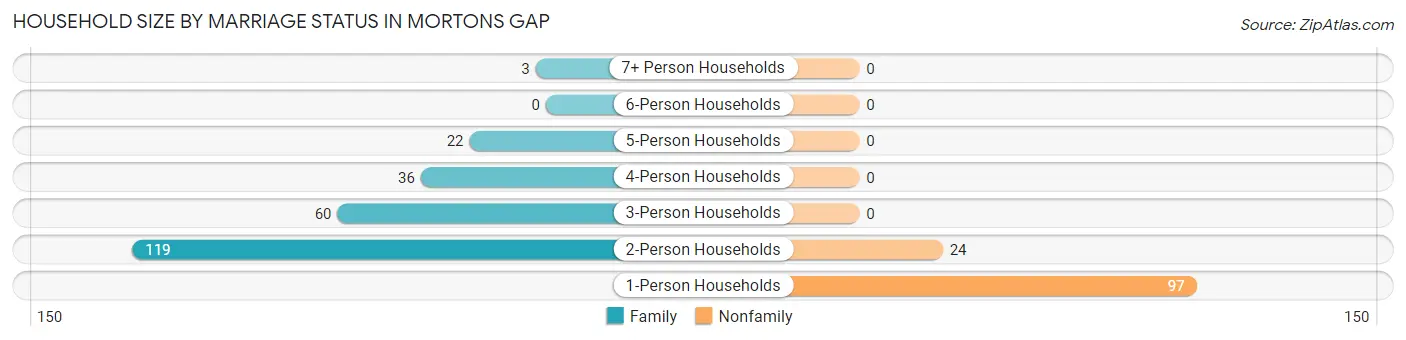
| Household Size | Family Households | Nonfamily Households |
| 1-Person Households | - | 97 (26.9%) |
| 2-Person Households | 119 (33.0%) | 24 (6.7%) |
| 3-Person Households | 60 (16.6%) | 0 (0.0%) |
| 4-Person Households | 36 (10.0%) | 0 (0.0%) |
| 5-Person Households | 22 (6.1%) | 0 (0.0%) |
| 6-Person Households | 0 (0.0%) | 0 (0.0%) |
| 7+ Person Households | 3 (0.8%) | 0 (0.0%) |
| Total | 240 (66.5%) | 121 (33.5%) |
Female Fertility in Mortons Gap
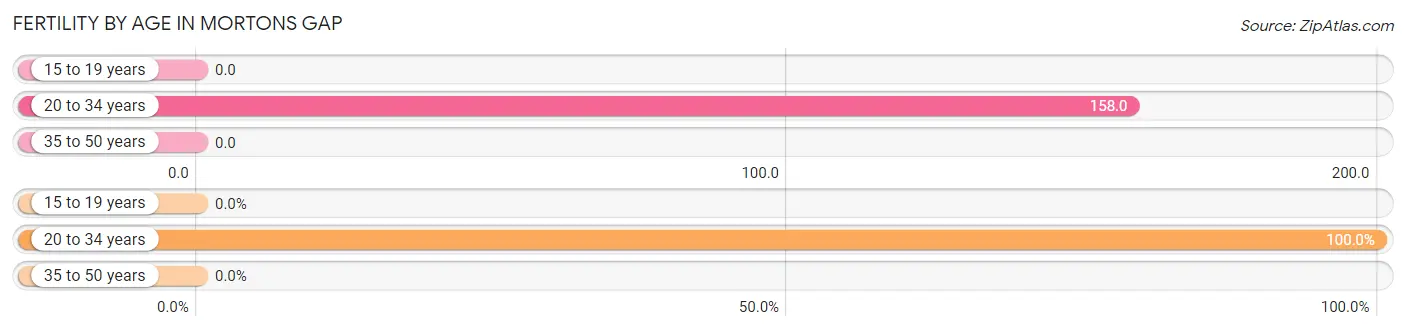
Fertility by Age in Mortons Gap
Average fertility rate in Mortons Gap is 88.0 births per 1,000 women. Women in the age bracket of 20 to 34 years have the highest fertility rate with 158.0 births per 1,000 women. Women in the age bracket of 20 to 34 years acount for 100.0% of all women with births.
| Age Bracket | Women with Births | Births / 1,000 Women |
| 15 to 19 years | 0 (0.0%) | 0.0 |
| 20 to 34 years | 12 (100.0%) | 158.0 |
| 35 to 50 years | 0 (0.0%) | 0.0 |
| Total | 12 (100.0%) | 88.0 |
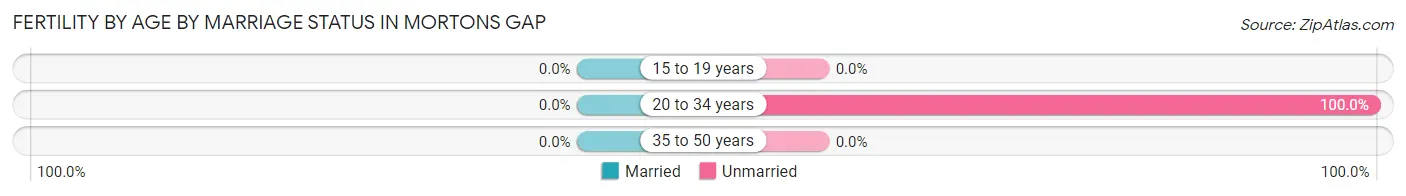
Fertility by Age by Marriage Status in Mortons Gap
| Age Bracket | Married | Unmarried |
| 15 to 19 years | 0 (0.0%) | 0 (0.0%) |
| 20 to 34 years | 0 (0.0%) | 12 (100.0%) |
| 35 to 50 years | 0 (0.0%) | 0 (0.0%) |
| Total | 0 (0.0%) | 12 (100.0%) |
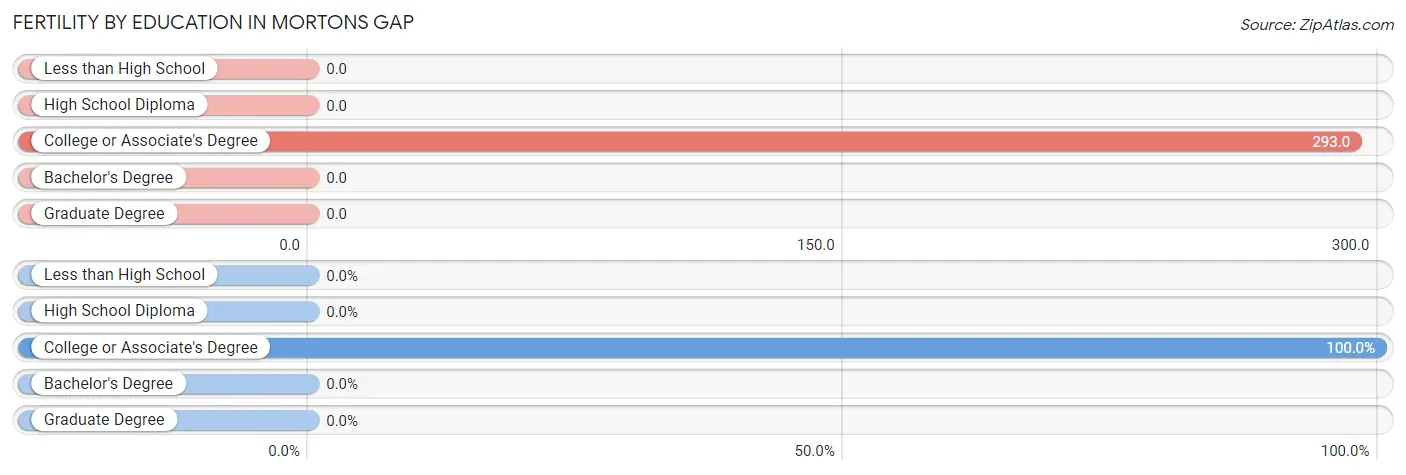
Fertility by Education in Mortons Gap
| Educational Attainment | Women with Births | Births / 1,000 Women |
| Less than High School | 0 (0.0%) | 0.0 |
| High School Diploma | 0 (0.0%) | 0.0 |
| College or Associate's Degree | 12 (100.0%) | 293.0 |
| Bachelor's Degree | 0 (0.0%) | 0.0 |
| Graduate Degree | 0 (0.0%) | 0.0 |
| Total | 12 (100.0%) | 88.0 |
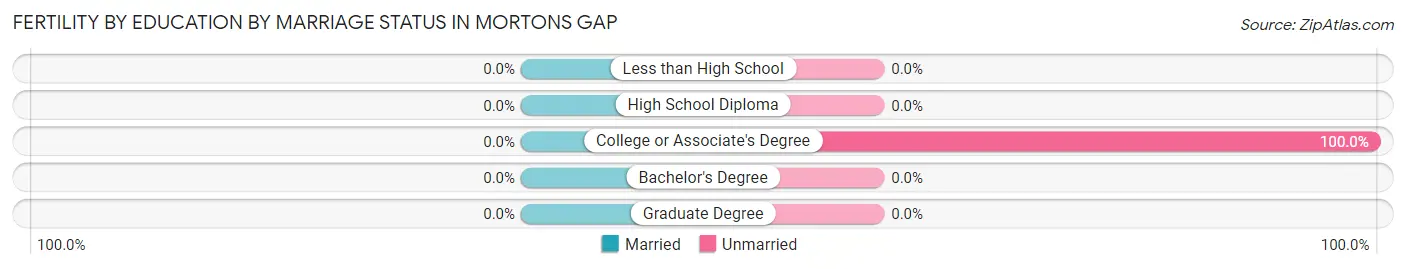
Fertility by Education by Marriage Status in Mortons Gap
| Educational Attainment | Married | Unmarried |
| Less than High School | 0 (0.0%) | 0 (0.0%) |
| High School Diploma | 0 (0.0%) | 0 (0.0%) |
| College or Associate's Degree | 0 (0.0%) | 12 (100.0%) |
| Bachelor's Degree | 0 (0.0%) | 0 (0.0%) |
| Graduate Degree | 0 (0.0%) | 0 (0.0%) |
| Total | 0 (0.0%) | 12 (100.0%) |
Employment Characteristics in Mortons Gap
Employment by Class of Employer in Mortons Gap
Among the 274 employed individuals in Mortons Gap, private company employees (222 | 81.0%), not-for-profit organizations (27 | 9.9%), and local government employees (11 | 4.0%) make up the most common classes of employment.
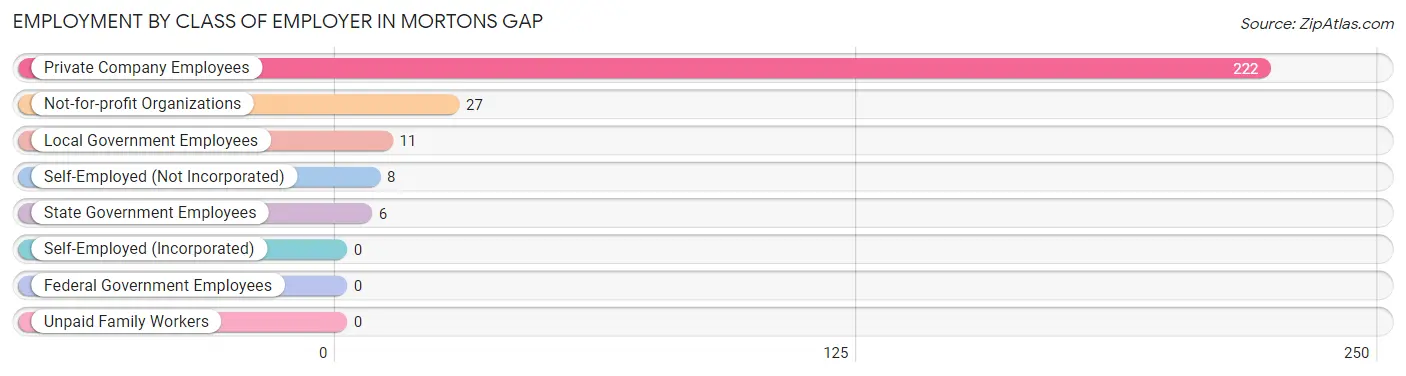
| Employer Class | # Employees | % Employees |
| Private Company Employees | 222 | 81.0% |
| Self-Employed (Incorporated) | 0 | 0.0% |
| Self-Employed (Not Incorporated) | 8 | 2.9% |
| Not-for-profit Organizations | 27 | 9.9% |
| Local Government Employees | 11 | 4.0% |
| State Government Employees | 6 | 2.2% |
| Federal Government Employees | 0 | 0.0% |
| Unpaid Family Workers | 0 | 0.0% |
| Total | 274 | 100.0% |
Employment Status by Age in Mortons Gap
According to the labor force statistics for Mortons Gap, out of the total population over 16 years of age (699), 39.6% or 277 individuals are in the labor force, with 1.1% or 3 of them unemployed. The age group with the highest labor force participation rate is 30 to 34 years, with 75.5% or 40 individuals in the labor force. Within the labor force, the 16 to 19 years age range has the highest percentage of unemployed individuals, with 50.0% or 3 of them being unemployed.
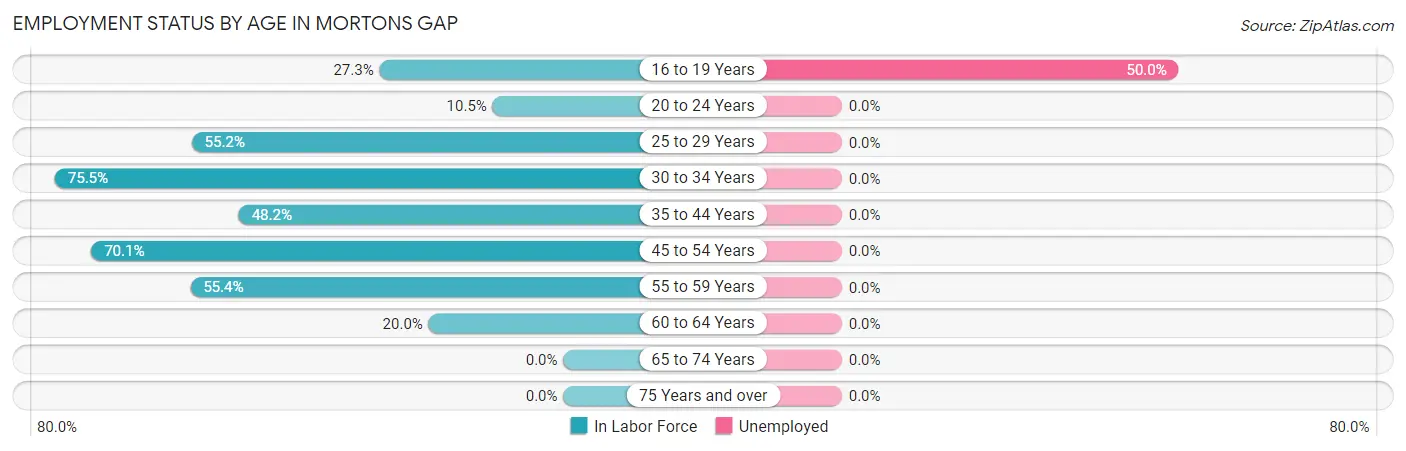
| Age Bracket | In Labor Force | Unemployed |
| 16 to 19 Years | 6 (27.3%) | 3 (50.0%) |
| 20 to 24 Years | 4 (10.5%) | 0 (0.0%) |
| 25 to 29 Years | 37 (55.2%) | 0 (0.0%) |
| 30 to 34 Years | 40 (75.5%) | 0 (0.0%) |
| 35 to 44 Years | 40 (48.2%) | 0 (0.0%) |
| 45 to 54 Years | 54 (70.1%) | 0 (0.0%) |
| 55 to 59 Years | 87 (55.4%) | 0 (0.0%) |
| 60 to 64 Years | 9 (20.0%) | 0 (0.0%) |
| 65 to 74 Years | 0 (0.0%) | 0 (0.0%) |
| 75 Years and over | 0 (0.0%) | 0 (0.0%) |
| Total | 277 (39.6%) | 3 (1.1%) |
Employment Status by Educational Attainment in Mortons Gap
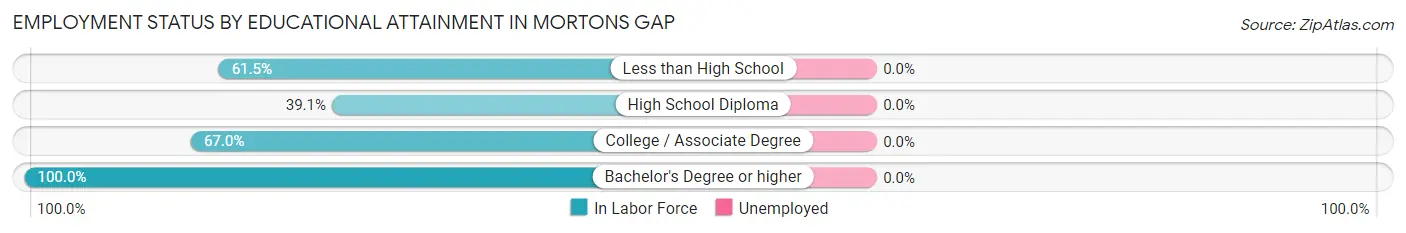
| Educational Attainment | In Labor Force | Unemployed |
| Less than High School | 24 (61.5%) | 0 (0.0%) |
| High School Diploma | 88 (39.1%) | 0 (0.0%) |
| College / Associate Degree | 128 (67.0%) | 0 (0.0%) |
| Bachelor's Degree or higher | 27 (100.0%) | 0 (0.0%) |
| Total | 267 (55.4%) | 0 (0.0%) |
Employment Occupations by Sex in Mortons Gap
Management, Business, Science and Arts Occupations
The most common Management, Business, Science and Arts occupations in Mortons Gap are Health Diagnosing & Treating (39 | 14.2%), Health Technologists (31 | 11.3%), Community & Social Service (19 | 6.9%), Education, Arts & Media (13 | 4.7%), and Management (7 | 2.5%).
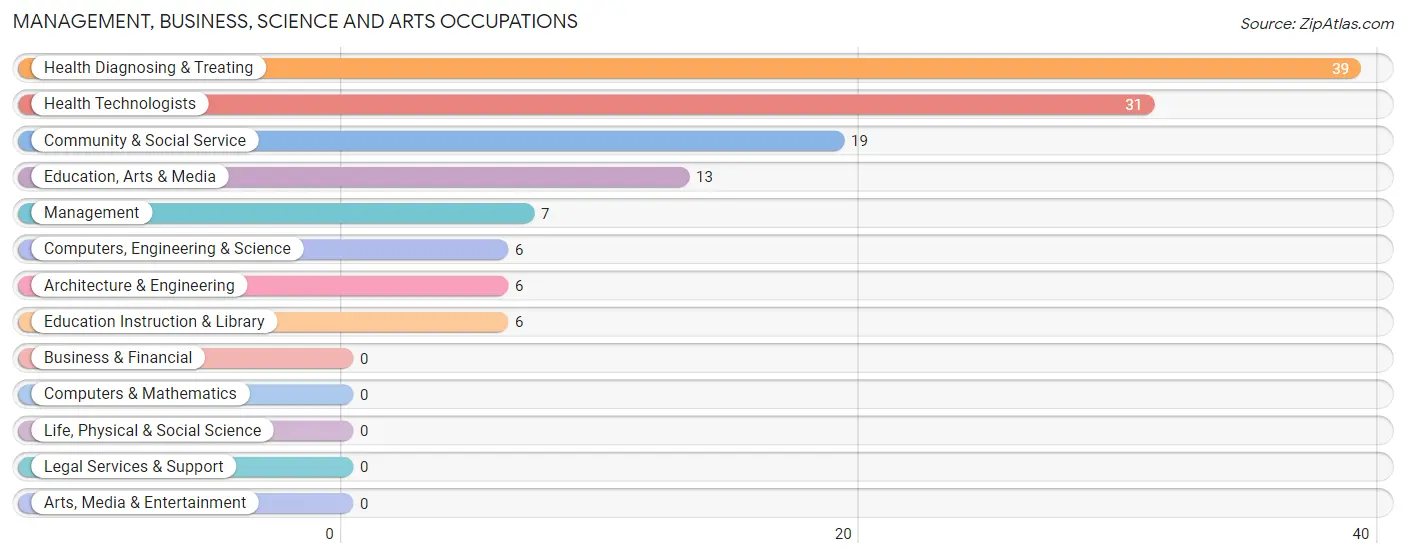
Management, Business, Science and Arts Occupations by Sex
Within the Management, Business, Science and Arts occupations in Mortons Gap, the most male-oriented occupations are Computers, Engineering & Science (100.0%), Architecture & Engineering (100.0%), and Education, Arts & Media (100.0%), while the most female-oriented occupations are Management (100.0%), Health Diagnosing & Treating (100.0%), and Health Technologists (100.0%).
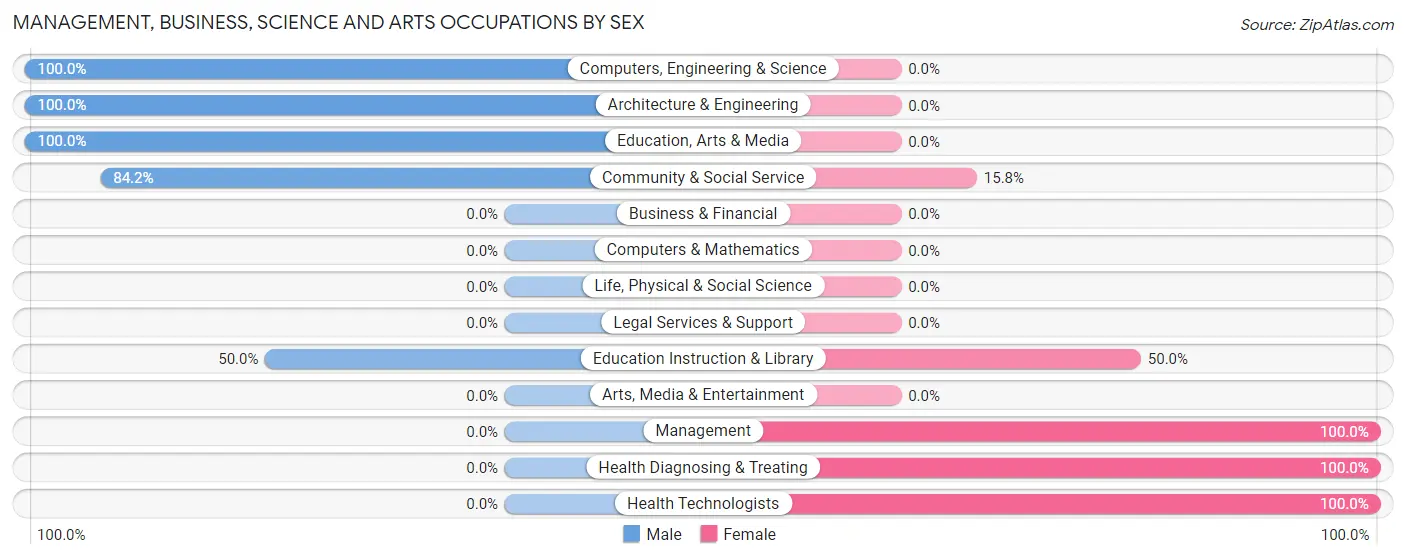
| Occupation | Male | Female |
| Management | 0 (0.0%) | 7 (100.0%) |
| Business & Financial | 0 (0.0%) | 0 (0.0%) |
| Computers, Engineering & Science | 6 (100.0%) | 0 (0.0%) |
| Computers & Mathematics | 0 (0.0%) | 0 (0.0%) |
| Architecture & Engineering | 6 (100.0%) | 0 (0.0%) |
| Life, Physical & Social Science | 0 (0.0%) | 0 (0.0%) |
| Community & Social Service | 16 (84.2%) | 3 (15.8%) |
| Education, Arts & Media | 13 (100.0%) | 0 (0.0%) |
| Legal Services & Support | 0 (0.0%) | 0 (0.0%) |
| Education Instruction & Library | 3 (50.0%) | 3 (50.0%) |
| Arts, Media & Entertainment | 0 (0.0%) | 0 (0.0%) |
| Health Diagnosing & Treating | 0 (0.0%) | 39 (100.0%) |
| Health Technologists | 0 (0.0%) | 31 (100.0%) |
| Total (Category) | 22 (31.0%) | 49 (69.0%) |
| Total (Overall) | 172 (62.8%) | 102 (37.2%) |
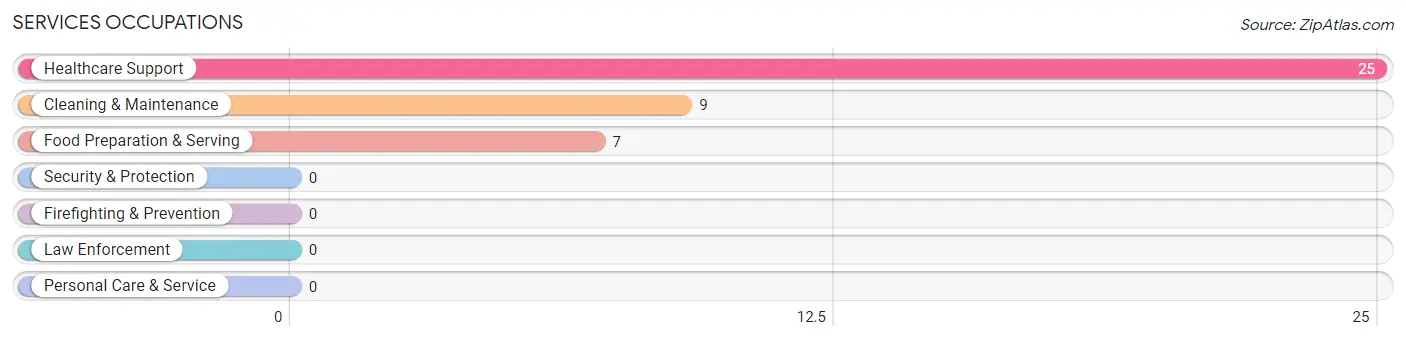
Services Occupations
The most common Services occupations in Mortons Gap are Healthcare Support (25 | 9.1%), Cleaning & Maintenance (9 | 3.3%), and Food Preparation & Serving (7 | 2.5%).
Services Occupations by Sex
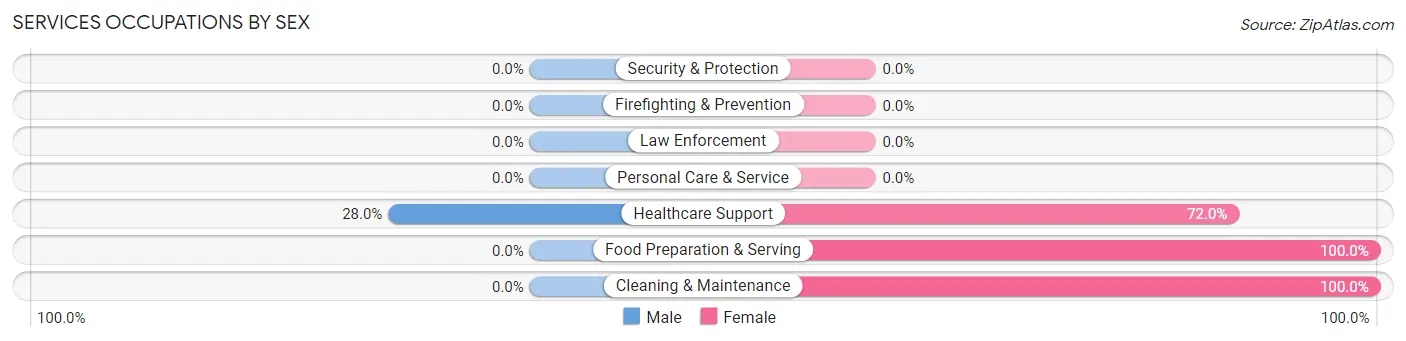
| Occupation | Male | Female |
| Healthcare Support | 7 (28.0%) | 18 (72.0%) |
| Security & Protection | 0 (0.0%) | 0 (0.0%) |
| Firefighting & Prevention | 0 (0.0%) | 0 (0.0%) |
| Law Enforcement | 0 (0.0%) | 0 (0.0%) |
| Food Preparation & Serving | 0 (0.0%) | 7 (100.0%) |
| Cleaning & Maintenance | 0 (0.0%) | 9 (100.0%) |
| Personal Care & Service | 0 (0.0%) | 0 (0.0%) |
| Total (Category) | 7 (17.1%) | 34 (82.9%) |
| Total (Overall) | 172 (62.8%) | 102 (37.2%) |
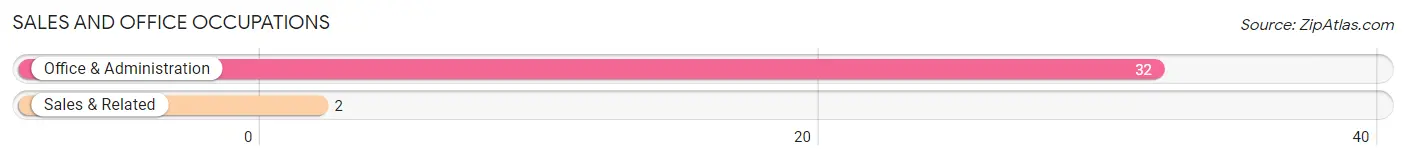
Sales and Office Occupations
The most common Sales and Office occupations in Mortons Gap are Office & Administration (32 | 11.7%), and Sales & Related (2 | 0.7%).
Sales and Office Occupations by Sex
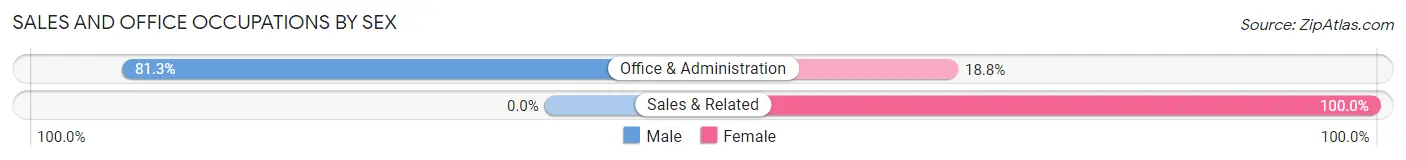
| Occupation | Male | Female |
| Sales & Related | 0 (0.0%) | 2 (100.0%) |
| Office & Administration | 26 (81.2%) | 6 (18.8%) |
| Total (Category) | 26 (76.5%) | 8 (23.5%) |
| Total (Overall) | 172 (62.8%) | 102 (37.2%) |
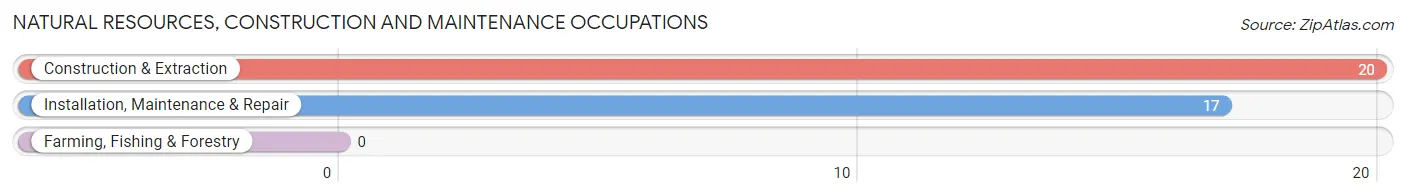
Natural Resources, Construction and Maintenance Occupations
The most common Natural Resources, Construction and Maintenance occupations in Mortons Gap are Construction & Extraction (20 | 7.3%), and Installation, Maintenance & Repair (17 | 6.2%).
Natural Resources, Construction and Maintenance Occupations by Sex
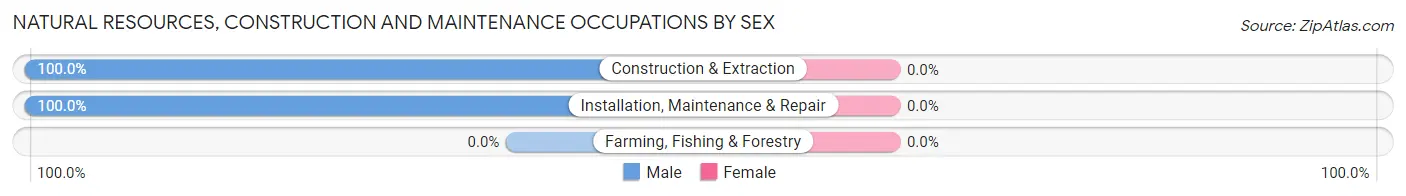
| Occupation | Male | Female |
| Farming, Fishing & Forestry | 0 (0.0%) | 0 (0.0%) |
| Construction & Extraction | 20 (100.0%) | 0 (0.0%) |
| Installation, Maintenance & Repair | 17 (100.0%) | 0 (0.0%) |
| Total (Category) | 37 (100.0%) | 0 (0.0%) |
| Total (Overall) | 172 (62.8%) | 102 (37.2%) |
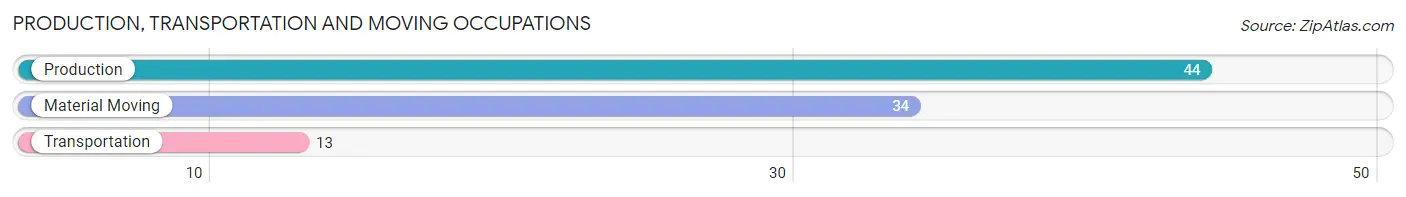
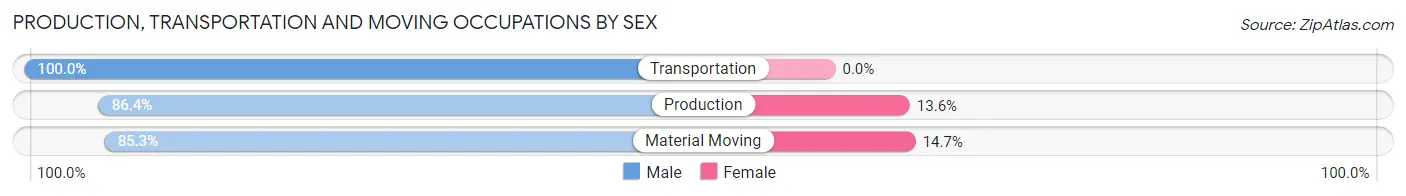
Production, Transportation and Moving Occupations
The most common Production, Transportation and Moving occupations in Mortons Gap are Production (44 | 16.1%), Material Moving (34 | 12.4%), and Transportation (13 | 4.7%).
Production, Transportation and Moving Occupations by Sex
| Occupation | Male | Female |
| Production | 38 (86.4%) | 6 (13.6%) |
| Transportation | 13 (100.0%) | 0 (0.0%) |
| Material Moving | 29 (85.3%) | 5 (14.7%) |
| Total (Category) | 80 (87.9%) | 11 (12.1%) |
| Total (Overall) | 172 (62.8%) | 102 (37.2%) |
Employment Industries by Sex in Mortons Gap
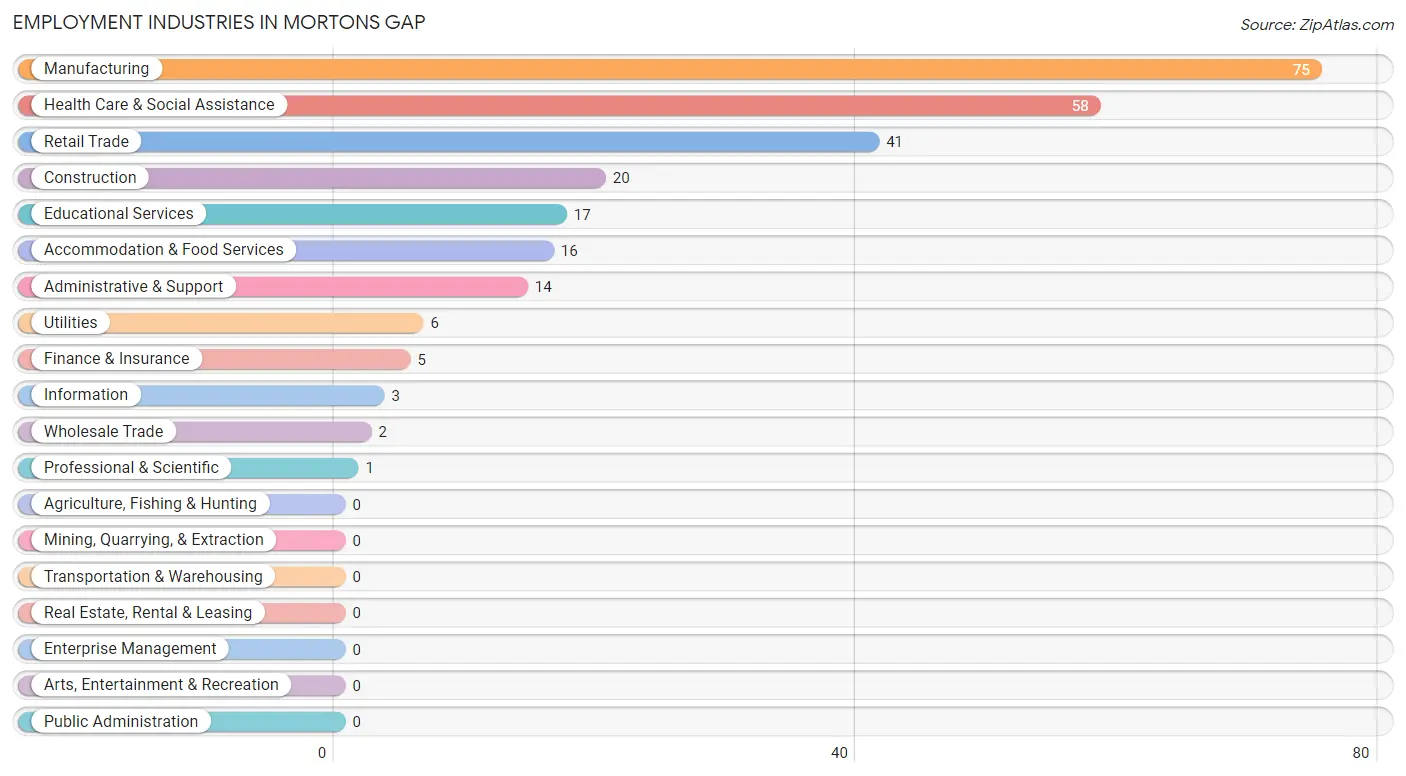
Employment Industries in Mortons Gap
The major employment industries in Mortons Gap include Manufacturing (75 | 27.4%), Health Care & Social Assistance (58 | 21.2%), Retail Trade (41 | 15.0%), Construction (20 | 7.3%), and Educational Services (17 | 6.2%).
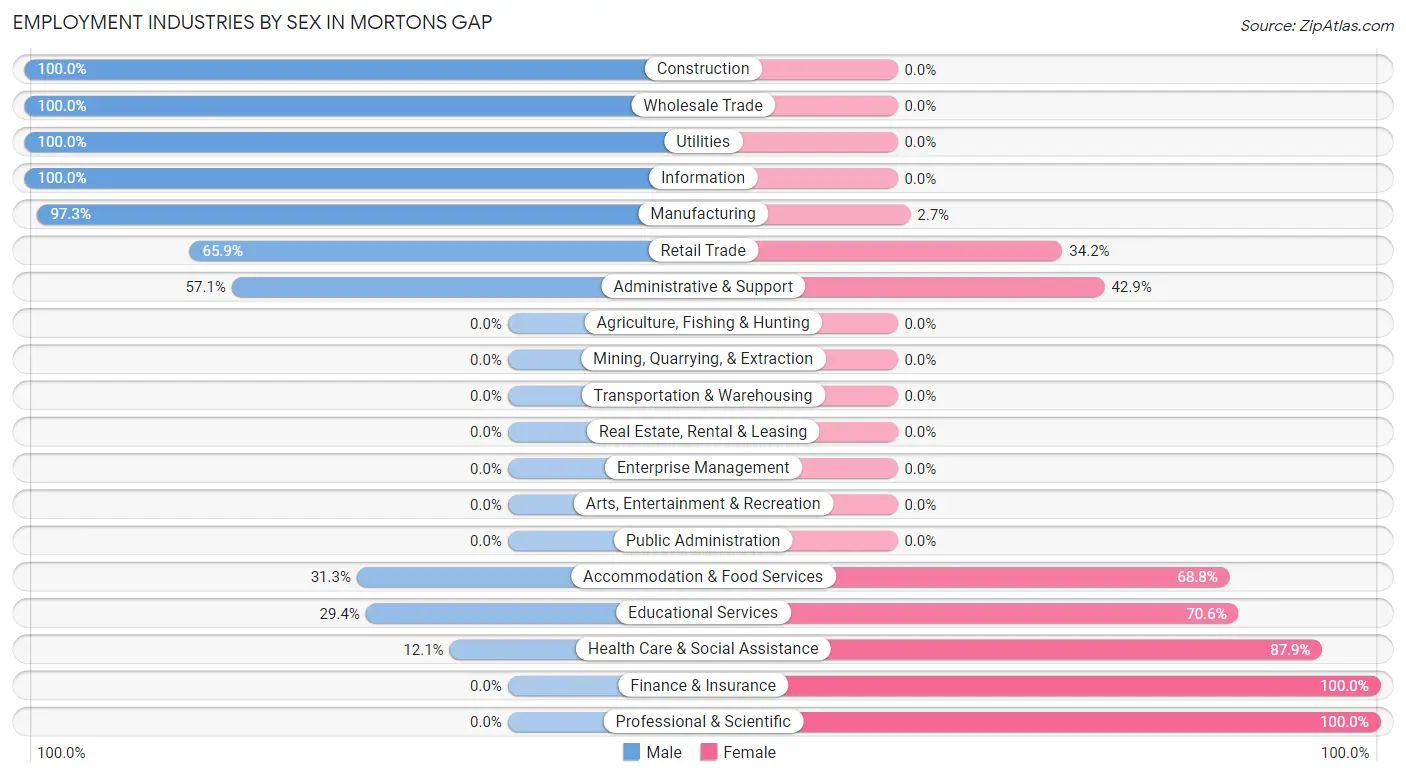
Employment Industries by Sex in Mortons Gap
The Mortons Gap industries that see more men than women are Construction (100.0%), Wholesale Trade (100.0%), and Utilities (100.0%), whereas the industries that tend to have a higher number of women are Finance & Insurance (100.0%), Professional & Scientific (100.0%), and Health Care & Social Assistance (87.9%).
| Industry | Male | Female |
| Agriculture, Fishing & Hunting | 0 (0.0%) | 0 (0.0%) |
| Mining, Quarrying, & Extraction | 0 (0.0%) | 0 (0.0%) |
| Construction | 20 (100.0%) | 0 (0.0%) |
| Manufacturing | 73 (97.3%) | 2 (2.7%) |
| Wholesale Trade | 2 (100.0%) | 0 (0.0%) |
| Retail Trade | 27 (65.8%) | 14 (34.2%) |
| Transportation & Warehousing | 0 (0.0%) | 0 (0.0%) |
| Utilities | 6 (100.0%) | 0 (0.0%) |
| Information | 3 (100.0%) | 0 (0.0%) |
| Finance & Insurance | 0 (0.0%) | 5 (100.0%) |
| Real Estate, Rental & Leasing | 0 (0.0%) | 0 (0.0%) |
| Professional & Scientific | 0 (0.0%) | 1 (100.0%) |
| Enterprise Management | 0 (0.0%) | 0 (0.0%) |
| Administrative & Support | 8 (57.1%) | 6 (42.9%) |
| Educational Services | 5 (29.4%) | 12 (70.6%) |
| Health Care & Social Assistance | 7 (12.1%) | 51 (87.9%) |
| Arts, Entertainment & Recreation | 0 (0.0%) | 0 (0.0%) |
| Accommodation & Food Services | 5 (31.2%) | 11 (68.8%) |
| Public Administration | 0 (0.0%) | 0 (0.0%) |
| Total | 172 (62.8%) | 102 (37.2%) |
Education in Mortons Gap
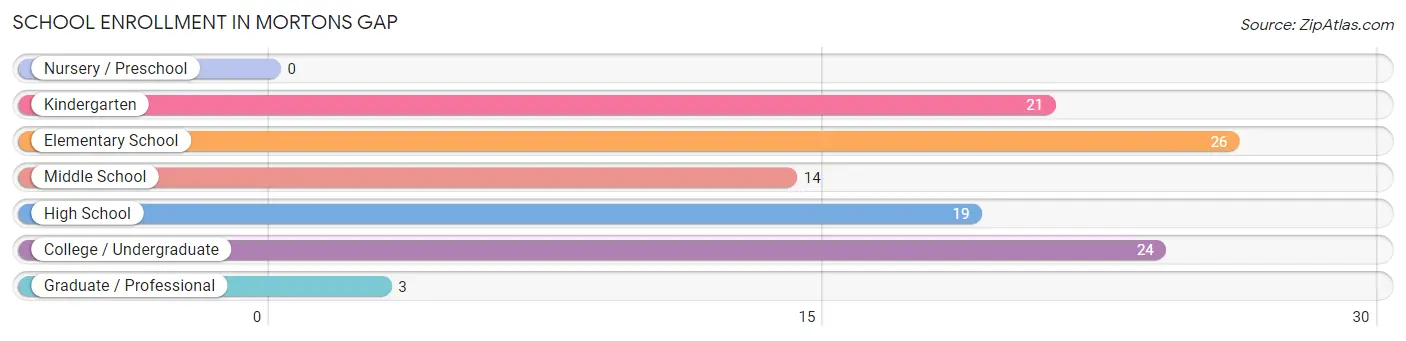
School Enrollment in Mortons Gap
The most common levels of schooling among the 107 students in Mortons Gap are elementary school (26 | 24.3%), college / undergraduate (24 | 22.4%), and kindergarten (21 | 19.6%).
| School Level | # Students | % Students |
| Nursery / Preschool | 0 | 0.0% |
| Kindergarten | 21 | 19.6% |
| Elementary School | 26 | 24.3% |
| Middle School | 14 | 13.1% |
| High School | 19 | 17.8% |
| College / Undergraduate | 24 | 22.4% |
| Graduate / Professional | 3 | 2.8% |
| Total | 107 | 100.0% |
School Enrollment by Age by Funding Source in Mortons Gap
Out of a total of 107 students who are enrolled in schools in Mortons Gap, 10 (9.3%) attend a private institution, while the remaining 97 (90.7%) are enrolled in public schools. The age group of 35 years and over has the highest likelihood of being enrolled in private schools, with 6 (100.0% in the age bracket) enrolled. Conversely, the age group of 10 to 14 year olds has the lowest likelihood of being enrolled in a private school, with 26 (100.0% in the age bracket) attending a public institution.
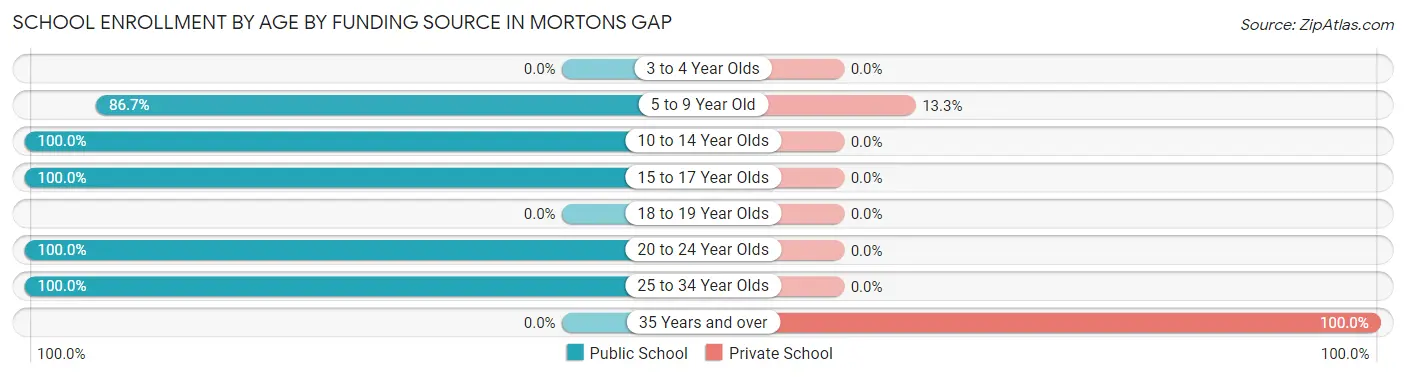
| Age Bracket | Public School | Private School |
| 3 to 4 Year Olds | 0 (0.0%) | 0 (0.0%) |
| 5 to 9 Year Old | 26 (86.7%) | 4 (13.3%) |
| 10 to 14 Year Olds | 26 (100.0%) | 0 (0.0%) |
| 15 to 17 Year Olds | 24 (100.0%) | 0 (0.0%) |
| 18 to 19 Year Olds | 0 (0.0%) | 0 (0.0%) |
| 20 to 24 Year Olds | 12 (100.0%) | 0 (0.0%) |
| 25 to 34 Year Olds | 9 (100.0%) | 0 (0.0%) |
| 35 Years and over | 0 (0.0%) | 6 (100.0%) |
| Total | 97 (90.7%) | 10 (9.3%) |
Educational Attainment by Field of Study in Mortons Gap
Business (16 | 39.0%), science & technology (8 | 19.5%), liberal arts & history (8 | 19.5%), psychology (3 | 7.3%), and education (3 | 7.3%) are the most common fields of study among 41 individuals in Mortons Gap who have obtained a bachelor's degree or higher.
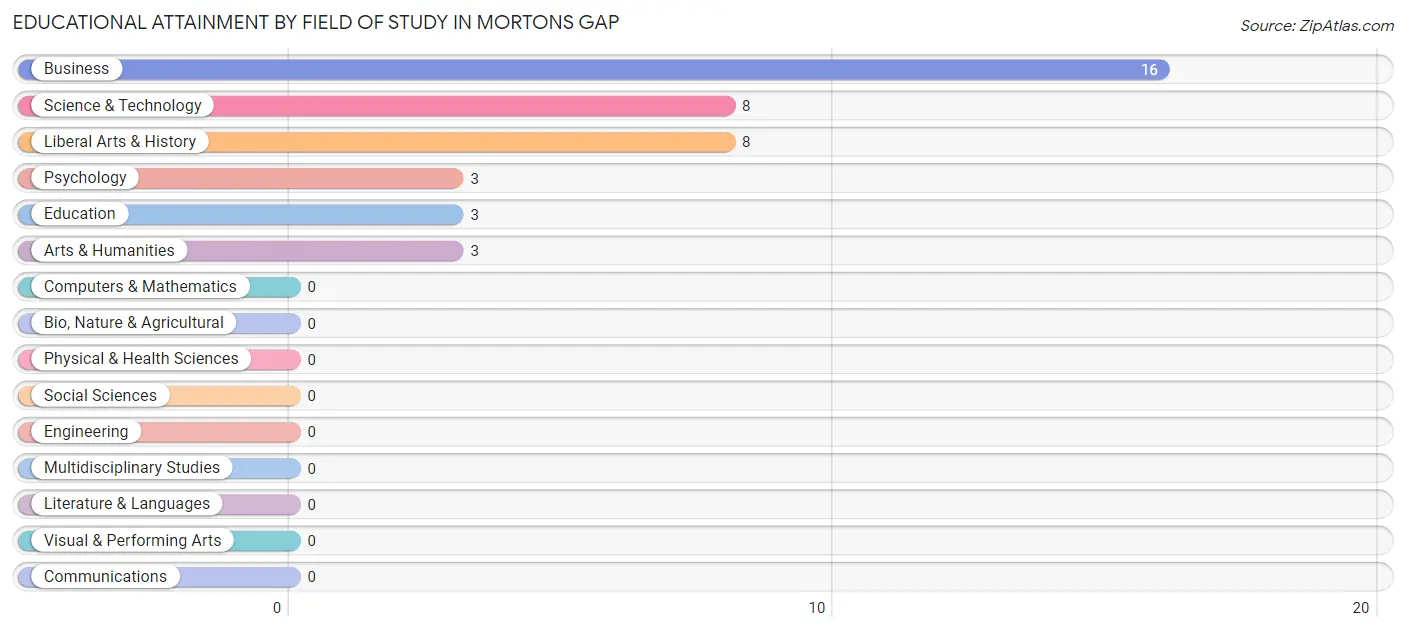
| Field of Study | # Graduates | % Graduates |
| Computers & Mathematics | 0 | 0.0% |
| Bio, Nature & Agricultural | 0 | 0.0% |
| Physical & Health Sciences | 0 | 0.0% |
| Psychology | 3 | 7.3% |
| Social Sciences | 0 | 0.0% |
| Engineering | 0 | 0.0% |
| Multidisciplinary Studies | 0 | 0.0% |
| Science & Technology | 8 | 19.5% |
| Business | 16 | 39.0% |
| Education | 3 | 7.3% |
| Literature & Languages | 0 | 0.0% |
| Liberal Arts & History | 8 | 19.5% |
| Visual & Performing Arts | 0 | 0.0% |
| Communications | 0 | 0.0% |
| Arts & Humanities | 3 | 7.3% |
| Total | 41 | 100.0% |
Transportation & Commute in Mortons Gap
Vehicle Availability by Sex in Mortons Gap
The most prevalent vehicle ownership categories in Mortons Gap are males with 2 vehicles (55, accounting for 32.0%) and females with 2 vehicles (35, making up 53.9%).
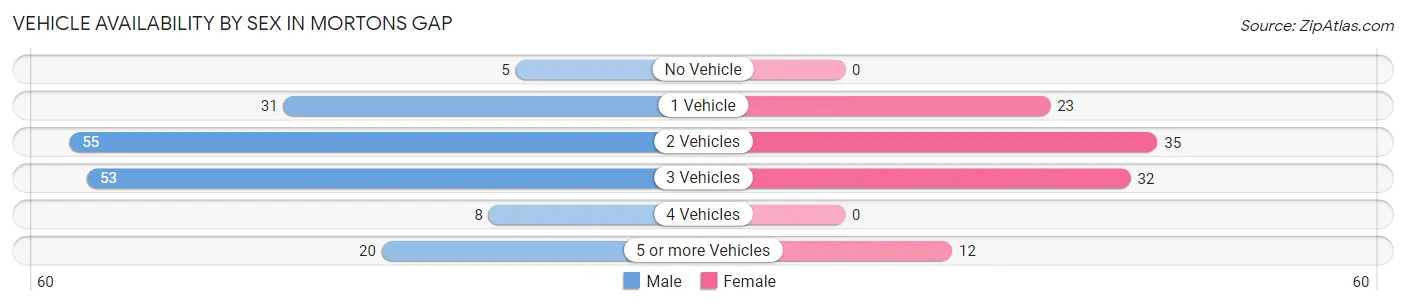
| Vehicles Available | Male | Female |
| No Vehicle | 5 (2.9%) | 0 (0.0%) |
| 1 Vehicle | 31 (18.0%) | 23 (22.6%) |
| 2 Vehicles | 55 (32.0%) | 35 (34.3%) |
| 3 Vehicles | 53 (30.8%) | 32 (31.4%) |
| 4 Vehicles | 8 (4.6%) | 0 (0.0%) |
| 5 or more Vehicles | 20 (11.6%) | 12 (11.8%) |
| Total | 172 (100.0%) | 102 (100.0%) |
Commute Time in Mortons Gap
The most frequently occuring commute durations in Mortons Gap are 15 to 19 minutes (104 commuters, 38.0%), 20 to 24 minutes (39 commuters, 14.2%), and 10 to 14 minutes (37 commuters, 13.5%).
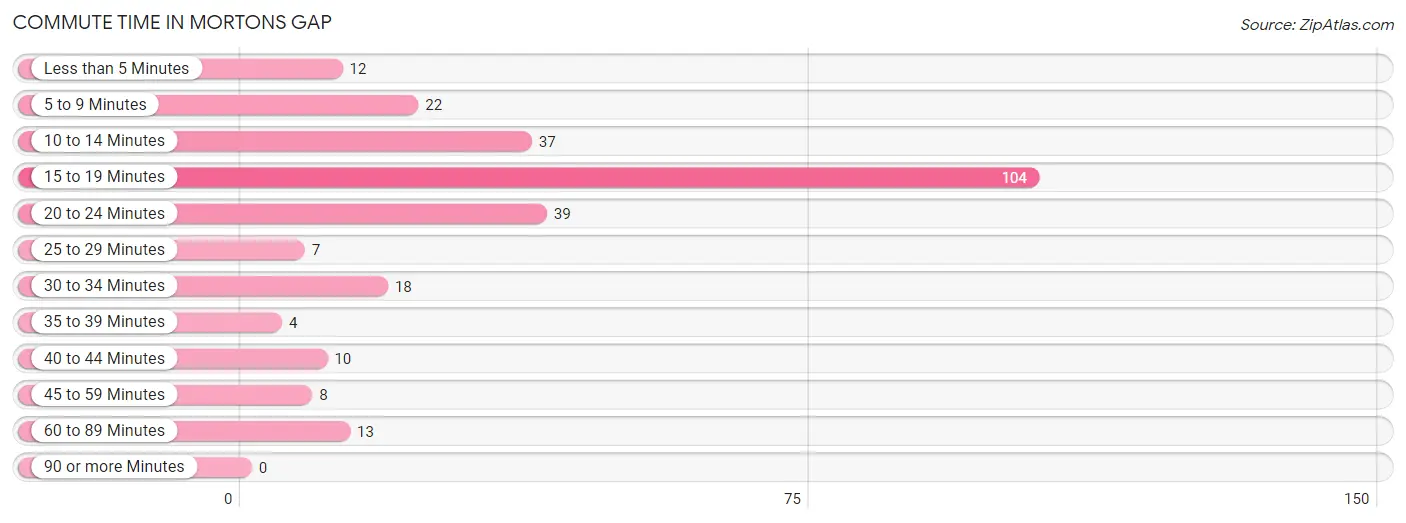
| Commute Time | # Commuters | % Commuters |
| Less than 5 Minutes | 12 | 4.4% |
| 5 to 9 Minutes | 22 | 8.0% |
| 10 to 14 Minutes | 37 | 13.5% |
| 15 to 19 Minutes | 104 | 38.0% |
| 20 to 24 Minutes | 39 | 14.2% |
| 25 to 29 Minutes | 7 | 2.5% |
| 30 to 34 Minutes | 18 | 6.6% |
| 35 to 39 Minutes | 4 | 1.5% |
| 40 to 44 Minutes | 10 | 3.6% |
| 45 to 59 Minutes | 8 | 2.9% |
| 60 to 89 Minutes | 13 | 4.7% |
| 90 or more Minutes | 0 | 0.0% |
Commute Time by Sex in Mortons Gap
The most common commute times in Mortons Gap are 15 to 19 minutes (38 commuters, 22.1%) for males and 15 to 19 minutes (66 commuters, 64.7%) for females.
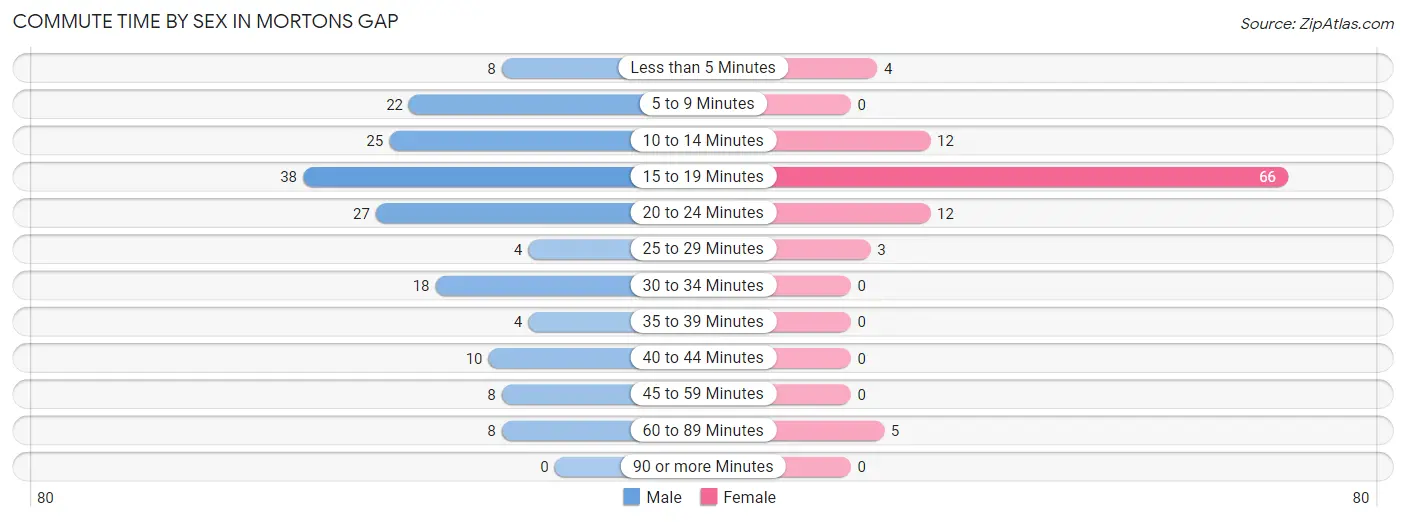
| Commute Time | Male | Female |
| Less than 5 Minutes | 8 (4.6%) | 4 (3.9%) |
| 5 to 9 Minutes | 22 (12.8%) | 0 (0.0%) |
| 10 to 14 Minutes | 25 (14.5%) | 12 (11.8%) |
| 15 to 19 Minutes | 38 (22.1%) | 66 (64.7%) |
| 20 to 24 Minutes | 27 (15.7%) | 12 (11.8%) |
| 25 to 29 Minutes | 4 (2.3%) | 3 (2.9%) |
| 30 to 34 Minutes | 18 (10.5%) | 0 (0.0%) |
| 35 to 39 Minutes | 4 (2.3%) | 0 (0.0%) |
| 40 to 44 Minutes | 10 (5.8%) | 0 (0.0%) |
| 45 to 59 Minutes | 8 (4.6%) | 0 (0.0%) |
| 60 to 89 Minutes | 8 (4.6%) | 5 (4.9%) |
| 90 or more Minutes | 0 (0.0%) | 0 (0.0%) |
Time of Departure to Work by Sex in Mortons Gap
The most frequent times of departure to work in Mortons Gap are 6:30 AM to 6:59 AM (53, 30.8%) for males and 12:00 PM to 3:59 PM (32, 31.4%) for females.
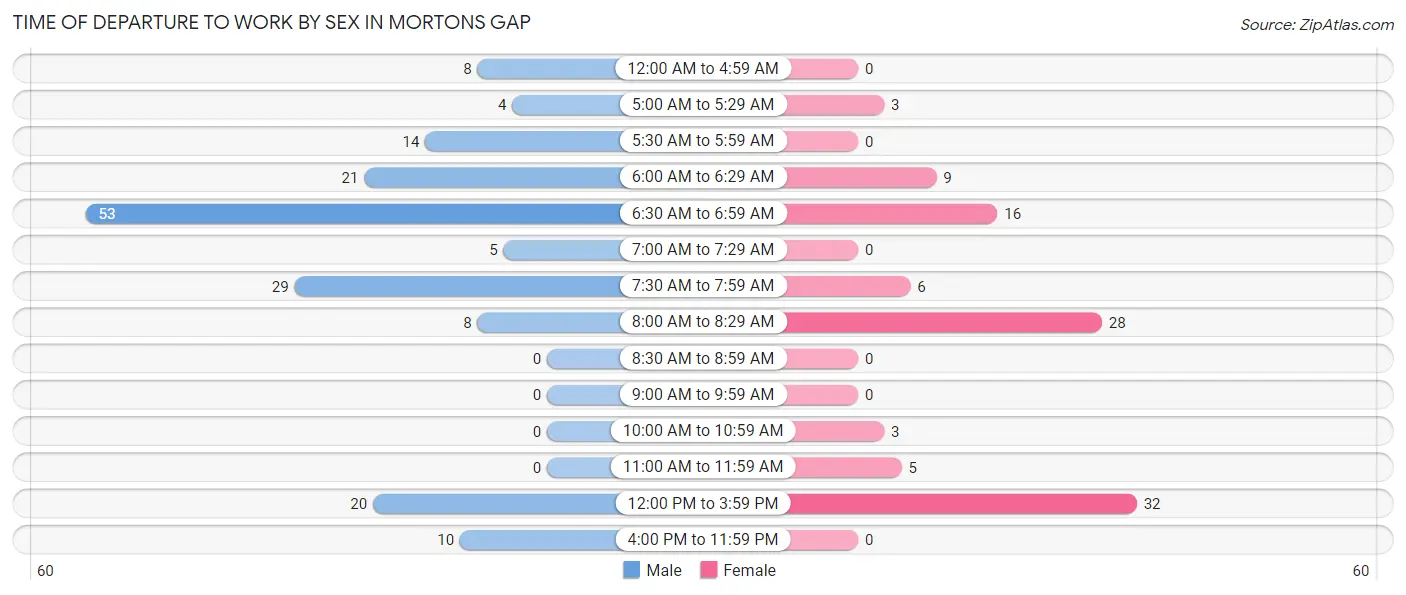
| Time of Departure | Male | Female |
| 12:00 AM to 4:59 AM | 8 (4.6%) | 0 (0.0%) |
| 5:00 AM to 5:29 AM | 4 (2.3%) | 3 (2.9%) |
| 5:30 AM to 5:59 AM | 14 (8.1%) | 0 (0.0%) |
| 6:00 AM to 6:29 AM | 21 (12.2%) | 9 (8.8%) |
| 6:30 AM to 6:59 AM | 53 (30.8%) | 16 (15.7%) |
| 7:00 AM to 7:29 AM | 5 (2.9%) | 0 (0.0%) |
| 7:30 AM to 7:59 AM | 29 (16.9%) | 6 (5.9%) |
| 8:00 AM to 8:29 AM | 8 (4.6%) | 28 (27.5%) |
| 8:30 AM to 8:59 AM | 0 (0.0%) | 0 (0.0%) |
| 9:00 AM to 9:59 AM | 0 (0.0%) | 0 (0.0%) |
| 10:00 AM to 10:59 AM | 0 (0.0%) | 3 (2.9%) |
| 11:00 AM to 11:59 AM | 0 (0.0%) | 5 (4.9%) |
| 12:00 PM to 3:59 PM | 20 (11.6%) | 32 (31.4%) |
| 4:00 PM to 11:59 PM | 10 (5.8%) | 0 (0.0%) |
| Total | 172 (100.0%) | 102 (100.0%) |
Housing Occupancy in Mortons Gap
Occupancy by Ownership in Mortons Gap
Of the total 361 dwellings in Mortons Gap, owner-occupied units account for 302 (83.7%), while renter-occupied units make up 59 (16.3%).
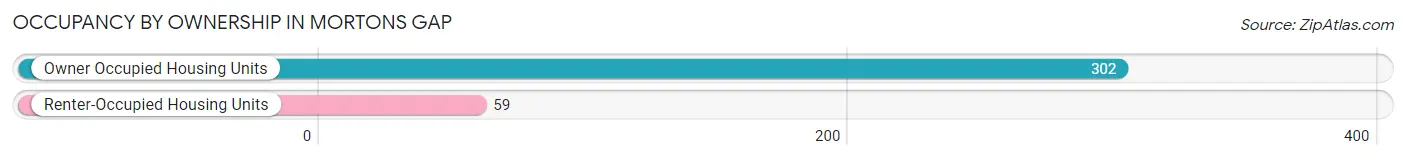
| Occupancy | # Housing Units | % Housing Units |
| Owner Occupied Housing Units | 302 | 83.7% |
| Renter-Occupied Housing Units | 59 | 16.3% |
| Total Occupied Housing Units | 361 | 100.0% |
Occupancy by Household Size in Mortons Gap
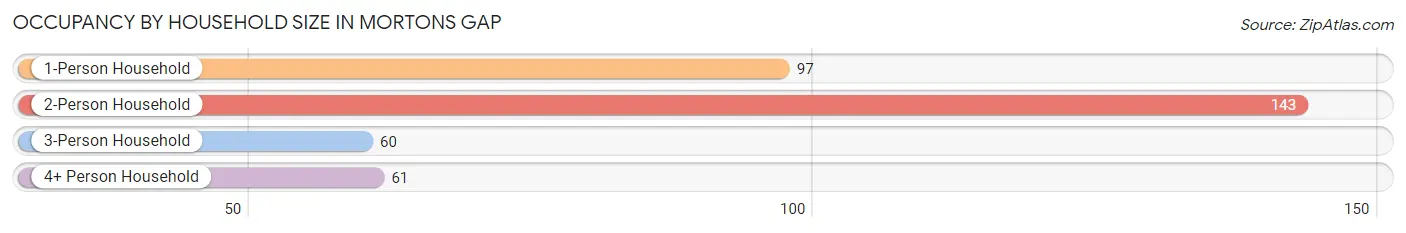
| Household Size | # Housing Units | % Housing Units |
| 1-Person Household | 97 | 26.9% |
| 2-Person Household | 143 | 39.6% |
| 3-Person Household | 60 | 16.6% |
| 4+ Person Household | 61 | 16.9% |
| Total Housing Units | 361 | 100.0% |
Occupancy by Ownership by Household Size in Mortons Gap
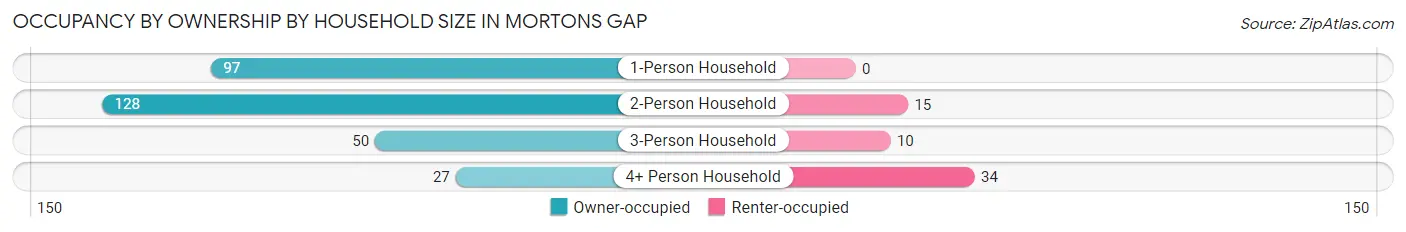
| Household Size | Owner-occupied | Renter-occupied |
| 1-Person Household | 97 (100.0%) | 0 (0.0%) |
| 2-Person Household | 128 (89.5%) | 15 (10.5%) |
| 3-Person Household | 50 (83.3%) | 10 (16.7%) |
| 4+ Person Household | 27 (44.3%) | 34 (55.7%) |
| Total Housing Units | 302 (83.7%) | 59 (16.3%) |
Occupancy by Educational Attainment in Mortons Gap
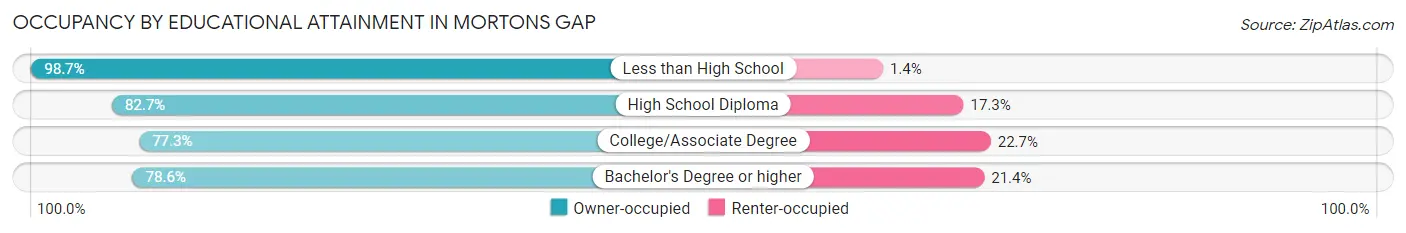
| Household Size | Owner-occupied | Renter-occupied |
| Less than High School | 73 (98.7%) | 1 (1.3%) |
| High School Diploma | 105 (82.7%) | 22 (17.3%) |
| College/Associate Degree | 102 (77.3%) | 30 (22.7%) |
| Bachelor's Degree or higher | 22 (78.6%) | 6 (21.4%) |
Occupancy by Age of Householder in Mortons Gap
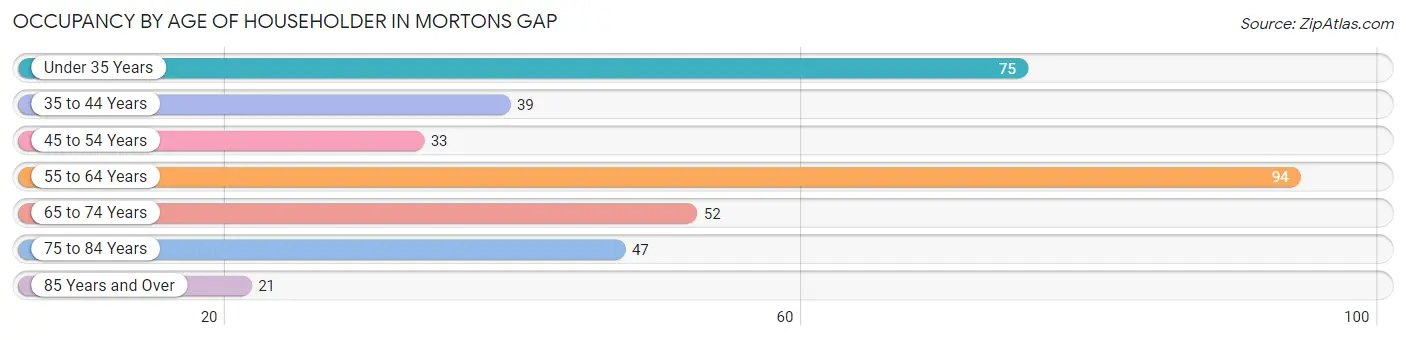
| Age Bracket | # Households | % Households |
| Under 35 Years | 75 | 20.8% |
| 35 to 44 Years | 39 | 10.8% |
| 45 to 54 Years | 33 | 9.1% |
| 55 to 64 Years | 94 | 26.0% |
| 65 to 74 Years | 52 | 14.4% |
| 75 to 84 Years | 47 | 13.0% |
| 85 Years and Over | 21 | 5.8% |
| Total | 361 | 100.0% |
Housing Finances in Mortons Gap
Median Income by Occupancy in Mortons Gap
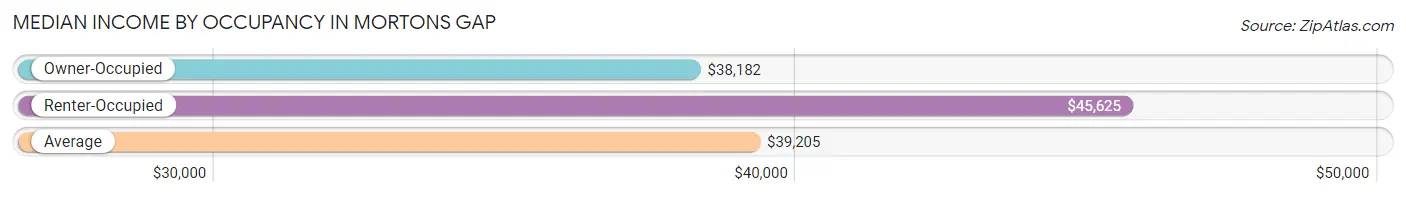
| Occupancy Type | # Households | Median Income |
| Owner-Occupied | 302 (83.7%) | $38,182 |
| Renter-Occupied | 59 (16.3%) | $45,625 |
| Average | 361 (100.0%) | $39,205 |
Occupancy by Householder Income Bracket in Mortons Gap
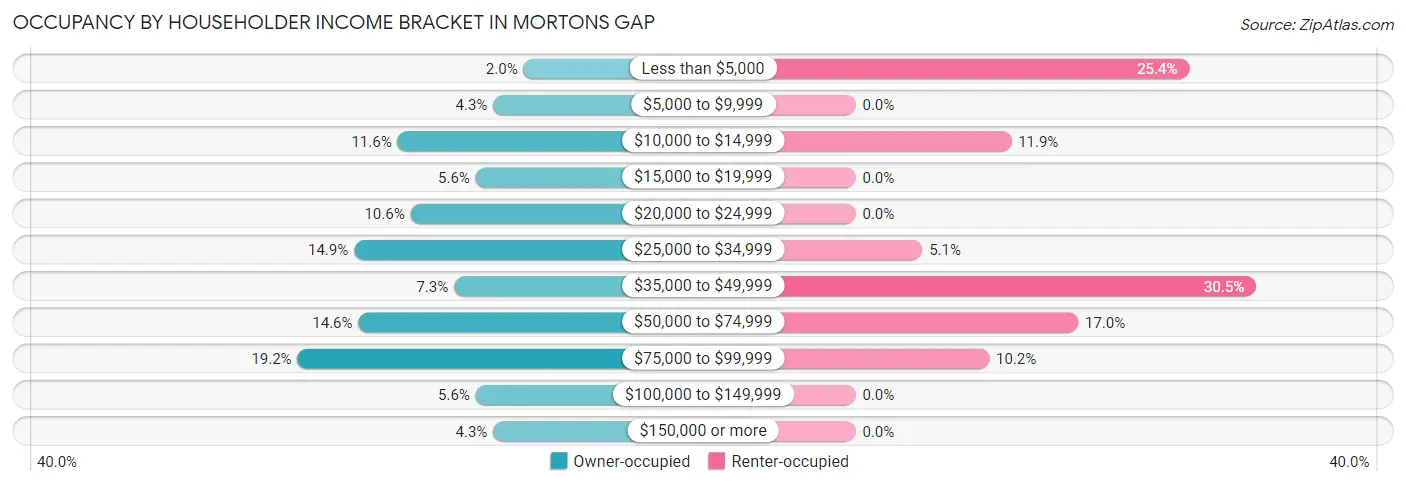
| Income Bracket | Owner-occupied | Renter-occupied |
| Less than $5,000 | 6 (2.0%) | 15 (25.4%) |
| $5,000 to $9,999 | 13 (4.3%) | 0 (0.0%) |
| $10,000 to $14,999 | 35 (11.6%) | 7 (11.9%) |
| $15,000 to $19,999 | 17 (5.6%) | 0 (0.0%) |
| $20,000 to $24,999 | 32 (10.6%) | 0 (0.0%) |
| $25,000 to $34,999 | 45 (14.9%) | 3 (5.1%) |
| $35,000 to $49,999 | 22 (7.3%) | 18 (30.5%) |
| $50,000 to $74,999 | 44 (14.6%) | 10 (17.0%) |
| $75,000 to $99,999 | 58 (19.2%) | 6 (10.2%) |
| $100,000 to $149,999 | 17 (5.6%) | 0 (0.0%) |
| $150,000 or more | 13 (4.3%) | 0 (0.0%) |
| Total | 302 (100.0%) | 59 (100.0%) |
Monthly Housing Cost Tiers in Mortons Gap
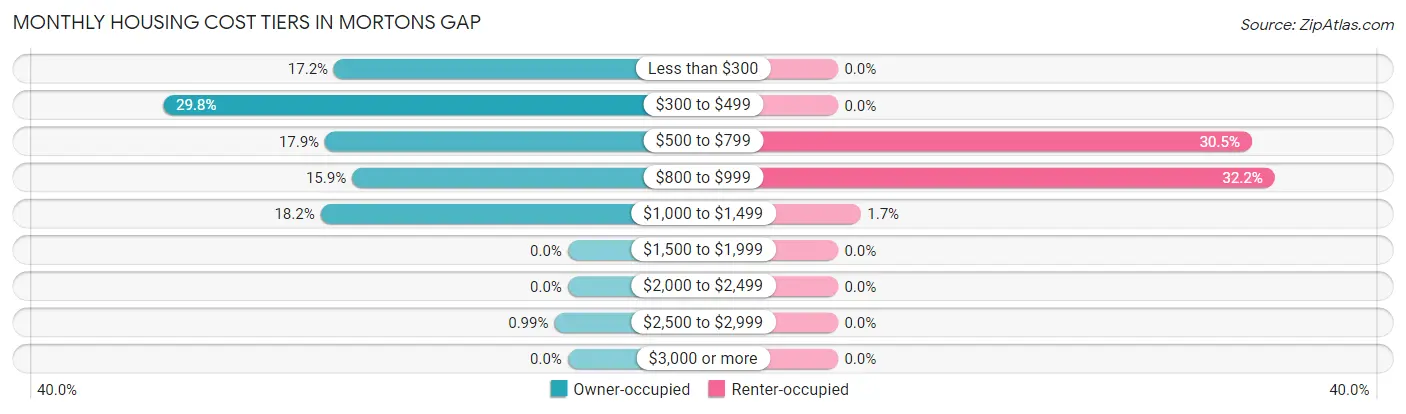
| Monthly Cost | Owner-occupied | Renter-occupied |
| Less than $300 | 52 (17.2%) | 0 (0.0%) |
| $300 to $499 | 90 (29.8%) | 0 (0.0%) |
| $500 to $799 | 54 (17.9%) | 18 (30.5%) |
| $800 to $999 | 48 (15.9%) | 19 (32.2%) |
| $1,000 to $1,499 | 55 (18.2%) | 1 (1.7%) |
| $1,500 to $1,999 | 0 (0.0%) | 0 (0.0%) |
| $2,000 to $2,499 | 0 (0.0%) | 0 (0.0%) |
| $2,500 to $2,999 | 3 (1.0%) | 0 (0.0%) |
| $3,000 or more | 0 (0.0%) | 0 (0.0%) |
| Total | 302 (100.0%) | 59 (100.0%) |
Physical Housing Characteristics in Mortons Gap
Housing Structures in Mortons Gap
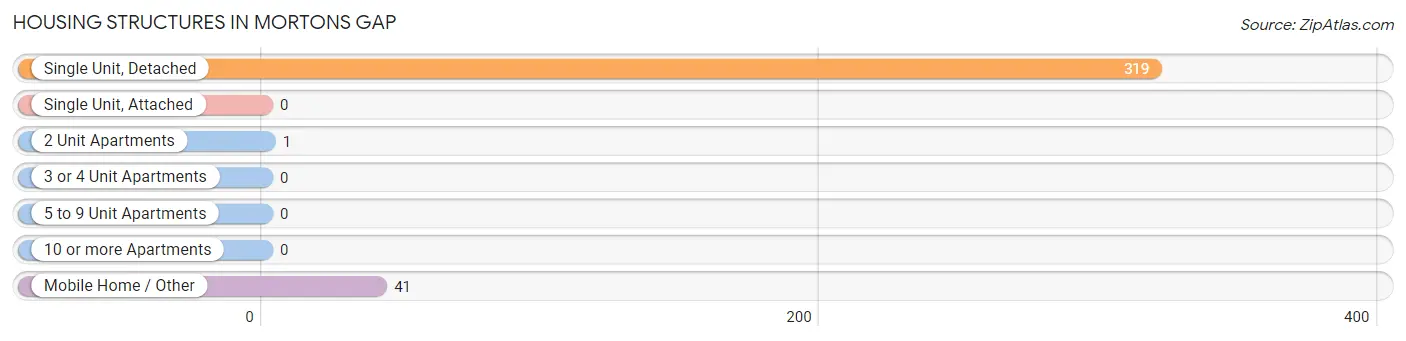
| Structure Type | # Housing Units | % Housing Units |
| Single Unit, Detached | 319 | 88.4% |
| Single Unit, Attached | 0 | 0.0% |
| 2 Unit Apartments | 1 | 0.3% |
| 3 or 4 Unit Apartments | 0 | 0.0% |
| 5 to 9 Unit Apartments | 0 | 0.0% |
| 10 or more Apartments | 0 | 0.0% |
| Mobile Home / Other | 41 | 11.4% |
| Total | 361 | 100.0% |
Housing Structures by Occupancy in Mortons Gap
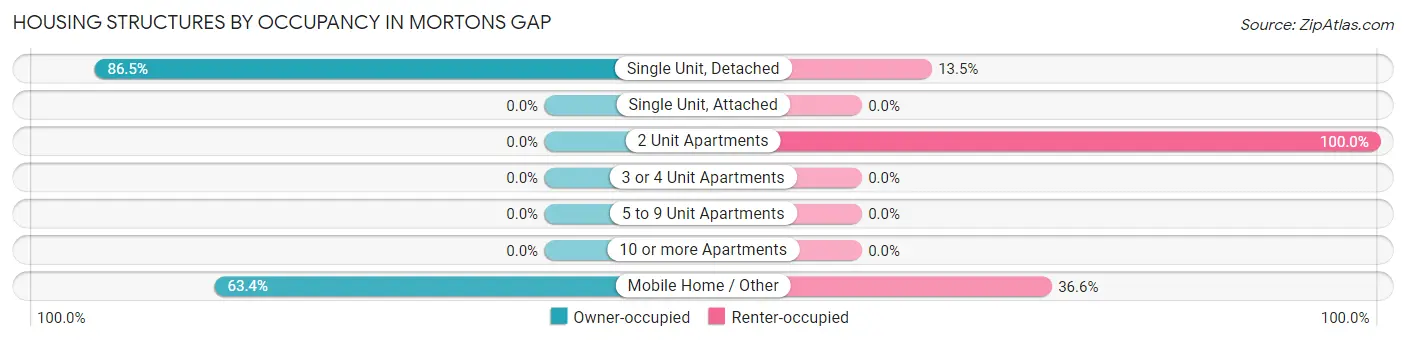
| Structure Type | Owner-occupied | Renter-occupied |
| Single Unit, Detached | 276 (86.5%) | 43 (13.5%) |
| Single Unit, Attached | 0 (0.0%) | 0 (0.0%) |
| 2 Unit Apartments | 0 (0.0%) | 1 (100.0%) |
| 3 or 4 Unit Apartments | 0 (0.0%) | 0 (0.0%) |
| 5 to 9 Unit Apartments | 0 (0.0%) | 0 (0.0%) |
| 10 or more Apartments | 0 (0.0%) | 0 (0.0%) |
| Mobile Home / Other | 26 (63.4%) | 15 (36.6%) |
| Total | 302 (83.7%) | 59 (16.3%) |
Housing Structures by Number of Rooms in Mortons Gap
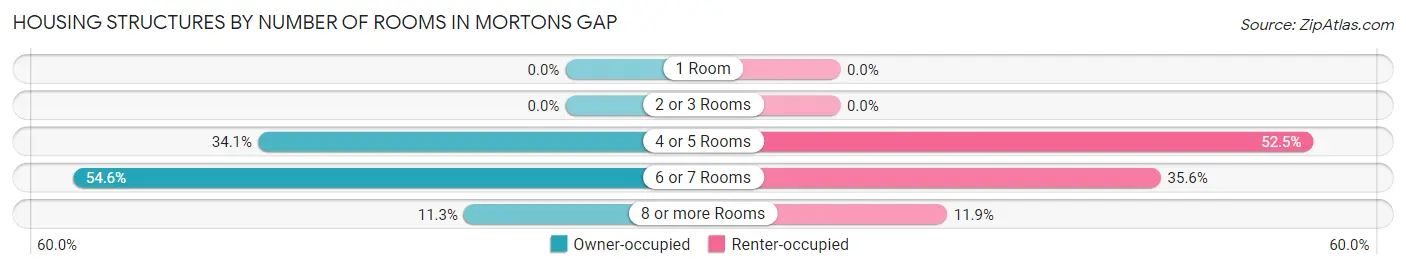
| Number of Rooms | Owner-occupied | Renter-occupied |
| 1 Room | 0 (0.0%) | 0 (0.0%) |
| 2 or 3 Rooms | 0 (0.0%) | 0 (0.0%) |
| 4 or 5 Rooms | 103 (34.1%) | 31 (52.5%) |
| 6 or 7 Rooms | 165 (54.6%) | 21 (35.6%) |
| 8 or more Rooms | 34 (11.3%) | 7 (11.9%) |
| Total | 302 (100.0%) | 59 (100.0%) |
Housing Structure by Heating Type in Mortons Gap
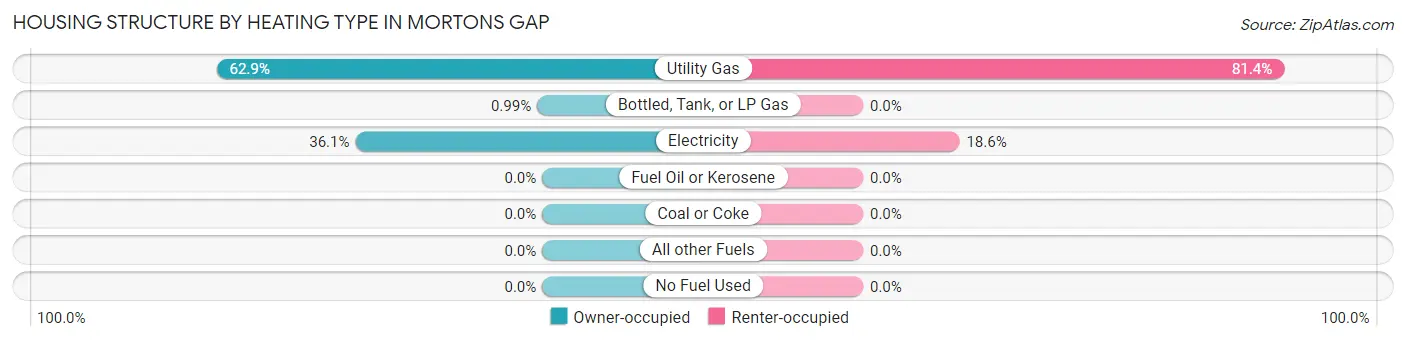
| Heating Type | Owner-occupied | Renter-occupied |
| Utility Gas | 190 (62.9%) | 48 (81.4%) |
| Bottled, Tank, or LP Gas | 3 (1.0%) | 0 (0.0%) |
| Electricity | 109 (36.1%) | 11 (18.6%) |
| Fuel Oil or Kerosene | 0 (0.0%) | 0 (0.0%) |
| Coal or Coke | 0 (0.0%) | 0 (0.0%) |
| All other Fuels | 0 (0.0%) | 0 (0.0%) |
| No Fuel Used | 0 (0.0%) | 0 (0.0%) |
| Total | 302 (100.0%) | 59 (100.0%) |
Household Vehicle Usage in Mortons Gap
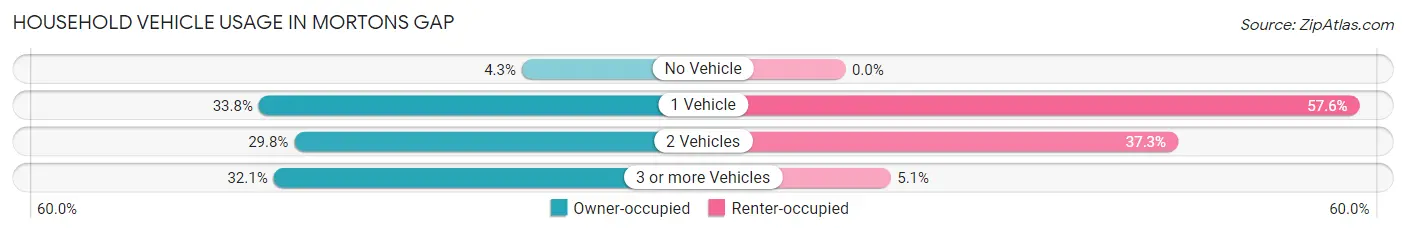
| Vehicles per Household | Owner-occupied | Renter-occupied |
| No Vehicle | 13 (4.3%) | 0 (0.0%) |
| 1 Vehicle | 102 (33.8%) | 34 (57.6%) |
| 2 Vehicles | 90 (29.8%) | 22 (37.3%) |
| 3 or more Vehicles | 97 (32.1%) | 3 (5.1%) |
| Total | 302 (100.0%) | 59 (100.0%) |
Real Estate & Mortgages in Mortons Gap
Real Estate and Mortgage Overview in Mortons Gap
| Characteristic | Without Mortgage | With Mortgage |
| Housing Units | 182 | 120 |
| Median Property Value | $68,400 | $114,500 |
| Median Household Income | $31,563 | $10 |
| Monthly Housing Costs | $422 | $0 |
| Real Estate Taxes | $468 | $2 |
Property Value by Mortgage Status in Mortons Gap
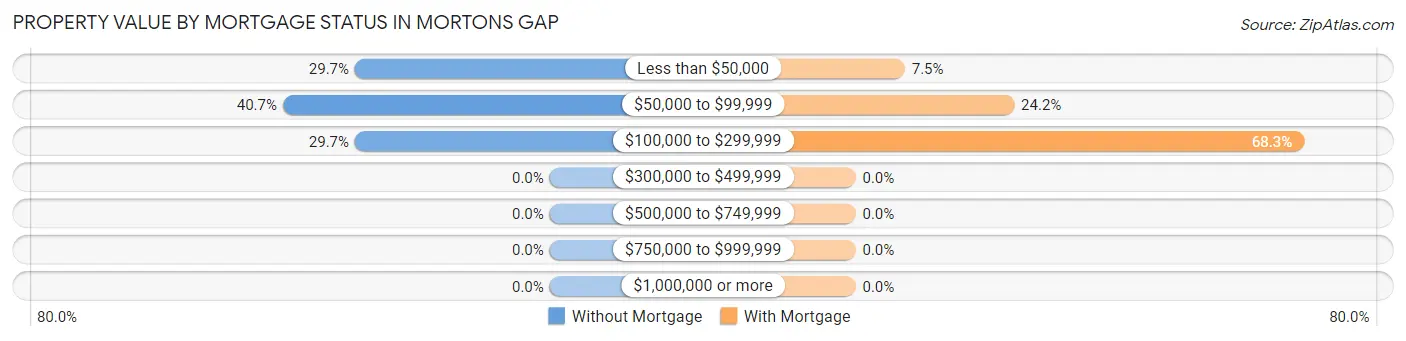
| Property Value | Without Mortgage | With Mortgage |
| Less than $50,000 | 54 (29.7%) | 9 (7.5%) |
| $50,000 to $99,999 | 74 (40.7%) | 29 (24.2%) |
| $100,000 to $299,999 | 54 (29.7%) | 82 (68.3%) |
| $300,000 to $499,999 | 0 (0.0%) | 0 (0.0%) |
| $500,000 to $749,999 | 0 (0.0%) | 0 (0.0%) |
| $750,000 to $999,999 | 0 (0.0%) | 0 (0.0%) |
| $1,000,000 or more | 0 (0.0%) | 0 (0.0%) |
| Total | 182 (100.0%) | 120 (100.0%) |
Household Income by Mortgage Status in Mortons Gap
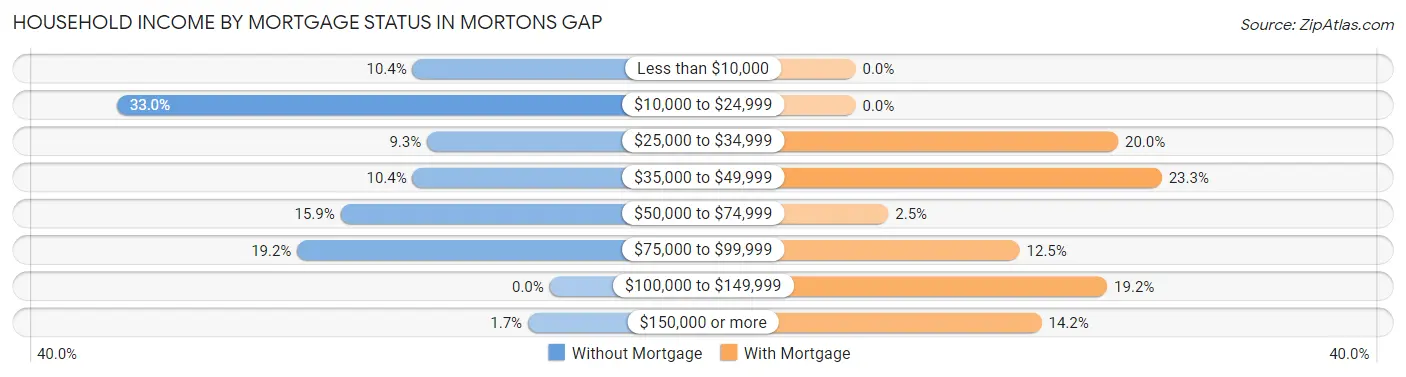
| Household Income | Without Mortgage | With Mortgage |
| Less than $10,000 | 19 (10.4%) | 0 (0.0%) |
| $10,000 to $24,999 | 60 (33.0%) | 0 (0.0%) |
| $25,000 to $34,999 | 17 (9.3%) | 24 (20.0%) |
| $35,000 to $49,999 | 19 (10.4%) | 28 (23.3%) |
| $50,000 to $74,999 | 29 (15.9%) | 3 (2.5%) |
| $75,000 to $99,999 | 35 (19.2%) | 15 (12.5%) |
| $100,000 to $149,999 | 0 (0.0%) | 23 (19.2%) |
| $150,000 or more | 3 (1.7%) | 17 (14.2%) |
| Total | 182 (100.0%) | 120 (100.0%) |
Property Value to Household Income Ratio in Mortons Gap
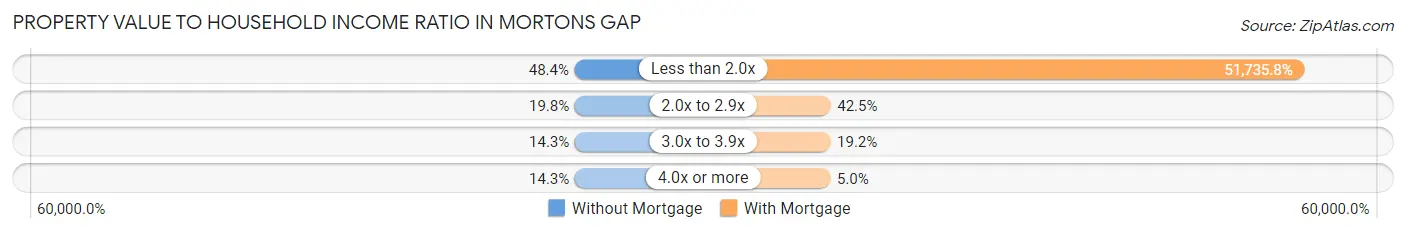
| Value-to-Income Ratio | Without Mortgage | With Mortgage |
| Less than 2.0x | 88 (48.3%) | 62,083 (51,735.8%) |
| 2.0x to 2.9x | 36 (19.8%) | 51 (42.5%) |
| 3.0x to 3.9x | 26 (14.3%) | 23 (19.2%) |
| 4.0x or more | 26 (14.3%) | 6 (5.0%) |
| Total | 182 (100.0%) | 120 (100.0%) |
Real Estate Taxes by Mortgage Status in Mortons Gap
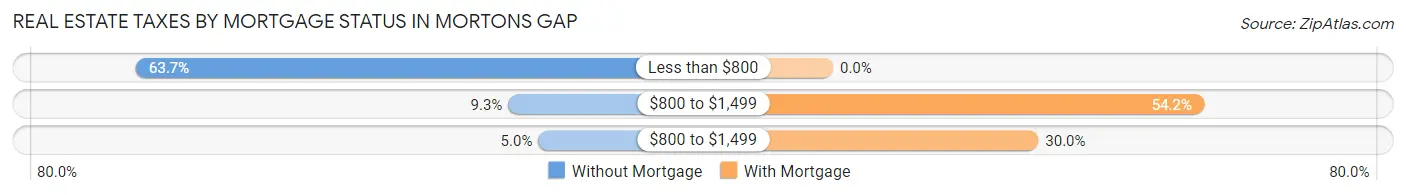
| Property Taxes | Without Mortgage | With Mortgage |
| Less than $800 | 116 (63.7%) | 0 (0.0%) |
| $800 to $1,499 | 17 (9.3%) | 65 (54.2%) |
| $800 to $1,499 | 9 (5.0%) | 36 (30.0%) |
| Total | 182 (100.0%) | 120 (100.0%) |
Health & Disability in Mortons Gap
Health Insurance Coverage by Age in Mortons Gap
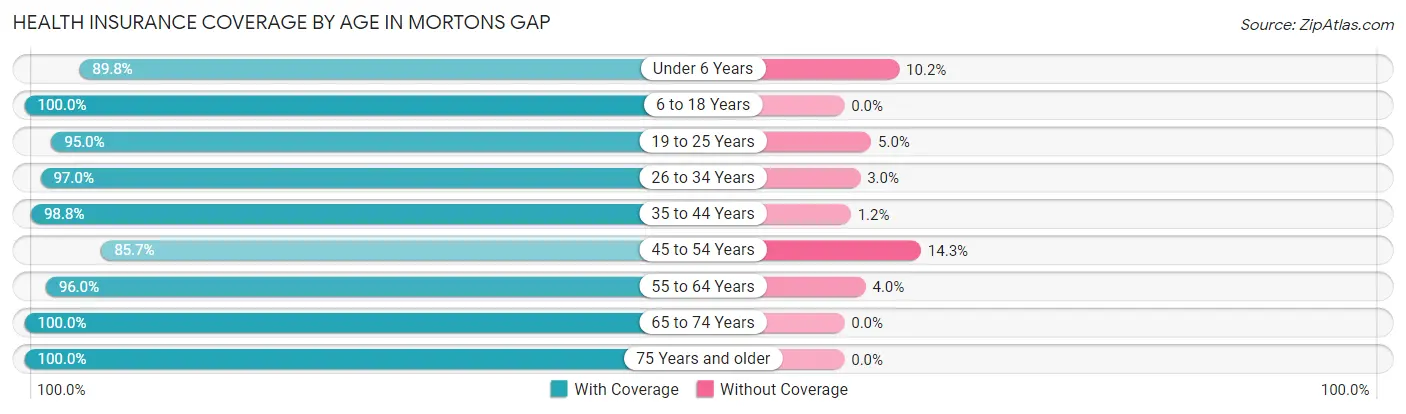
| Age Bracket | With Coverage | Without Coverage |
| Under 6 Years | 79 (89.8%) | 9 (10.2%) |
| 6 to 18 Years | 73 (100.0%) | 0 (0.0%) |
| 19 to 25 Years | 57 (95.0%) | 3 (5.0%) |
| 26 to 34 Years | 98 (97.0%) | 3 (3.0%) |
| 35 to 44 Years | 82 (98.8%) | 1 (1.2%) |
| 45 to 54 Years | 66 (85.7%) | 11 (14.3%) |
| 55 to 64 Years | 194 (96.0%) | 8 (4.0%) |
| 65 to 74 Years | 83 (100.0%) | 0 (0.0%) |
| 75 Years and older | 74 (100.0%) | 0 (0.0%) |
| Total | 806 (95.8%) | 35 (4.2%) |
Health Insurance Coverage by Citizenship Status in Mortons Gap
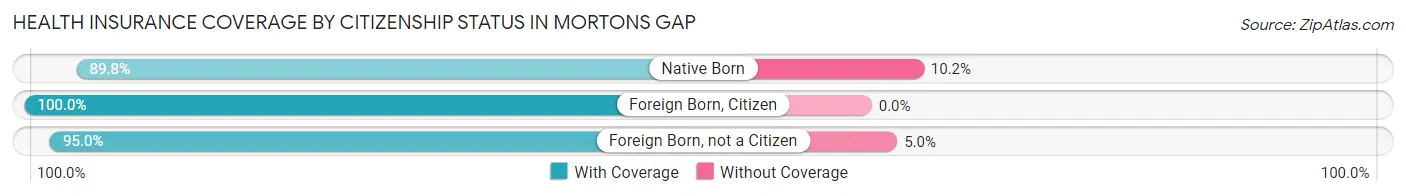
| Citizenship Status | With Coverage | Without Coverage |
| Native Born | 79 (89.8%) | 9 (10.2%) |
| Foreign Born, Citizen | 73 (100.0%) | 0 (0.0%) |
| Foreign Born, not a Citizen | 57 (95.0%) | 3 (5.0%) |
Health Insurance Coverage by Household Income in Mortons Gap
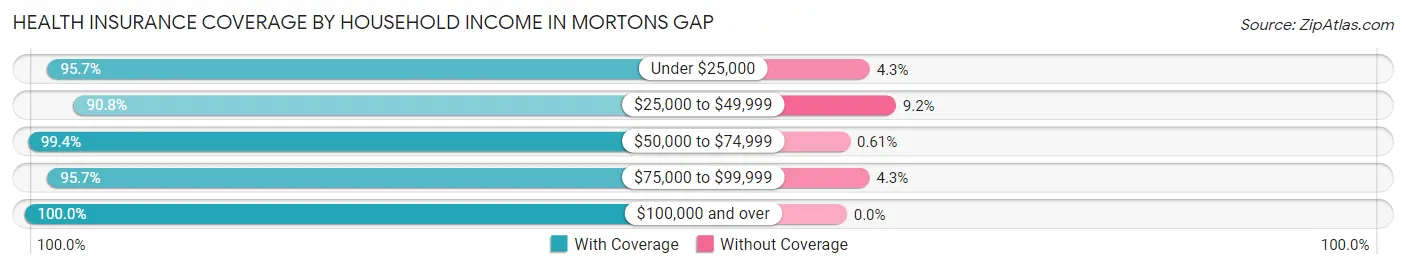
| Household Income | With Coverage | Without Coverage |
| Under $25,000 | 244 (95.7%) | 11 (4.3%) |
| $25,000 to $49,999 | 168 (90.8%) | 17 (9.2%) |
| $50,000 to $74,999 | 163 (99.4%) | 1 (0.6%) |
| $75,000 to $99,999 | 135 (95.7%) | 6 (4.3%) |
| $100,000 and over | 96 (100.0%) | 0 (0.0%) |
Public vs Private Health Insurance Coverage by Age in Mortons Gap
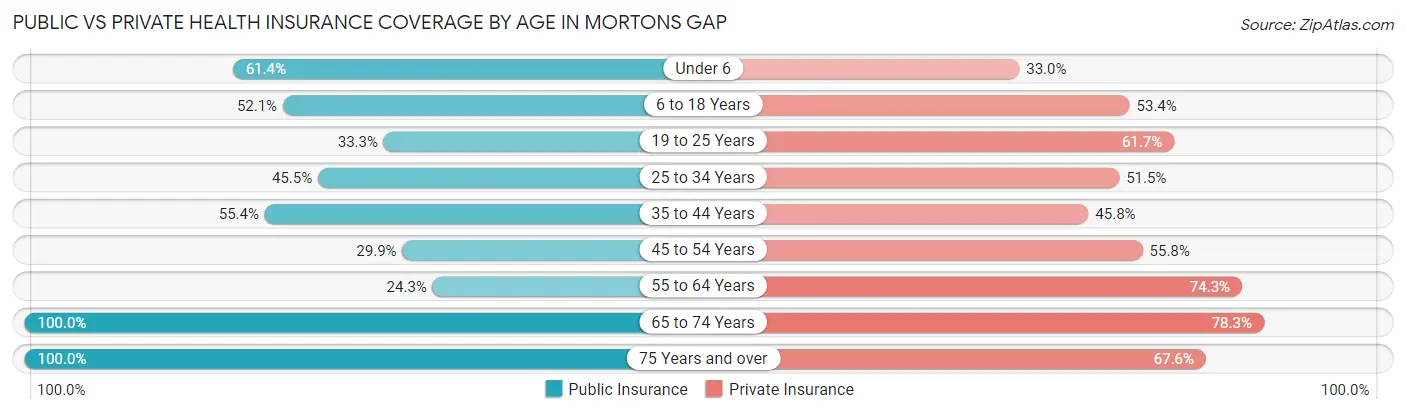
| Age Bracket | Public Insurance | Private Insurance |
| Under 6 | 54 (61.4%) | 29 (33.0%) |
| 6 to 18 Years | 38 (52.0%) | 39 (53.4%) |
| 19 to 25 Years | 20 (33.3%) | 37 (61.7%) |
| 25 to 34 Years | 46 (45.5%) | 52 (51.5%) |
| 35 to 44 Years | 46 (55.4%) | 38 (45.8%) |
| 45 to 54 Years | 23 (29.9%) | 43 (55.8%) |
| 55 to 64 Years | 49 (24.3%) | 150 (74.3%) |
| 65 to 74 Years | 83 (100.0%) | 65 (78.3%) |
| 75 Years and over | 74 (100.0%) | 50 (67.6%) |
| Total | 433 (51.5%) | 503 (59.8%) |
Disability Status by Sex by Age in Mortons Gap
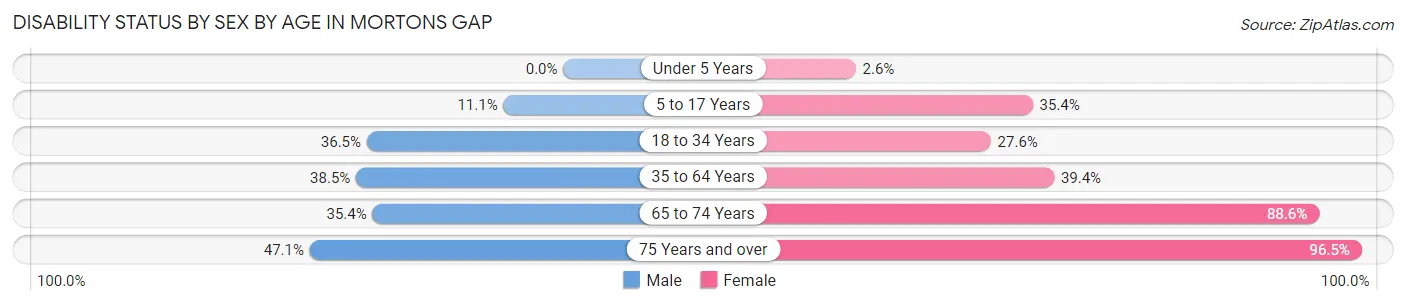
| Age Bracket | Male | Female |
| Under 5 Years | 0 (0.0%) | 1 (2.6%) |
| 5 to 17 Years | 4 (11.1%) | 17 (35.4%) |
| 18 to 34 Years | 31 (36.5%) | 21 (27.6%) |
| 35 to 64 Years | 65 (38.5%) | 76 (39.4%) |
| 65 to 74 Years | 17 (35.4%) | 31 (88.6%) |
| 75 Years and over | 8 (47.1%) | 55 (96.5%) |
Disability Class by Sex by Age in Mortons Gap
Disability Class: Hearing Difficulty
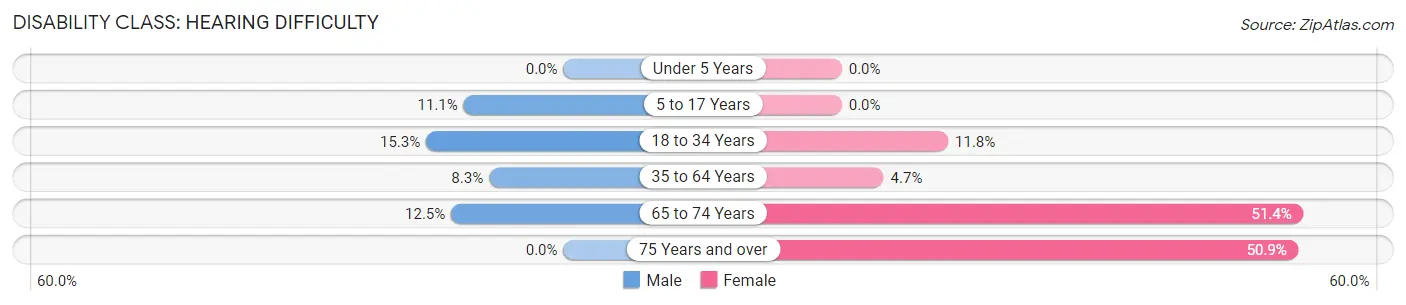
| Age Bracket | Male | Female |
| Under 5 Years | 0 (0.0%) | 0 (0.0%) |
| 5 to 17 Years | 4 (11.1%) | 0 (0.0%) |
| 18 to 34 Years | 13 (15.3%) | 9 (11.8%) |
| 35 to 64 Years | 14 (8.3%) | 9 (4.7%) |
| 65 to 74 Years | 6 (12.5%) | 18 (51.4%) |
| 75 Years and over | 0 (0.0%) | 29 (50.9%) |
Disability Class: Vision Difficulty
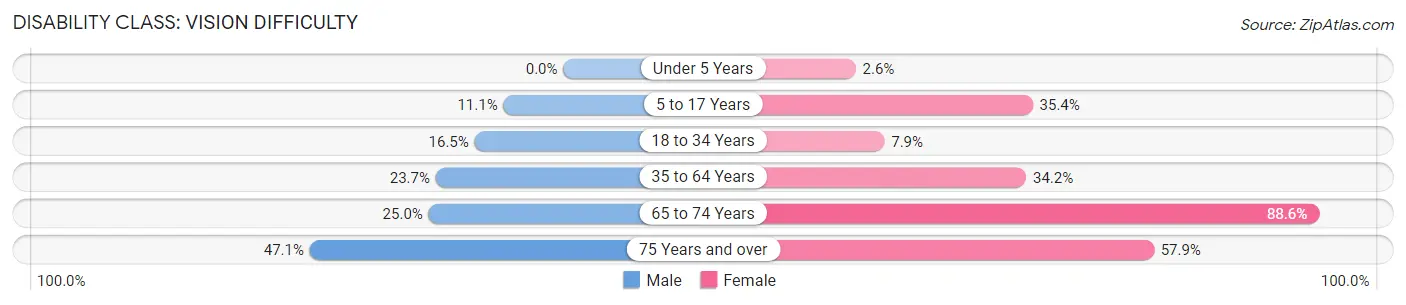
| Age Bracket | Male | Female |
| Under 5 Years | 0 (0.0%) | 1 (2.6%) |
| 5 to 17 Years | 4 (11.1%) | 17 (35.4%) |
| 18 to 34 Years | 14 (16.5%) | 6 (7.9%) |
| 35 to 64 Years | 40 (23.7%) | 66 (34.2%) |
| 65 to 74 Years | 12 (25.0%) | 31 (88.6%) |
| 75 Years and over | 8 (47.1%) | 33 (57.9%) |
Disability Class: Cognitive Difficulty
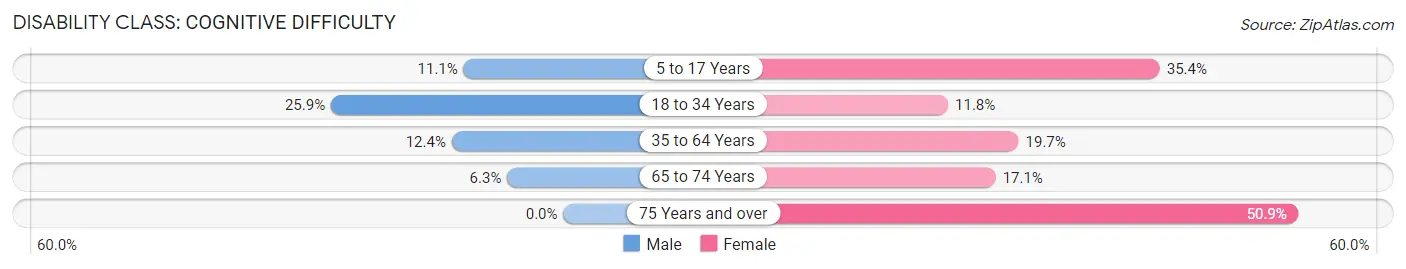
| Age Bracket | Male | Female |
| 5 to 17 Years | 4 (11.1%) | 17 (35.4%) |
| 18 to 34 Years | 22 (25.9%) | 9 (11.8%) |
| 35 to 64 Years | 21 (12.4%) | 38 (19.7%) |
| 65 to 74 Years | 3 (6.2%) | 6 (17.1%) |
| 75 Years and over | 0 (0.0%) | 29 (50.9%) |
Disability Class: Ambulatory Difficulty
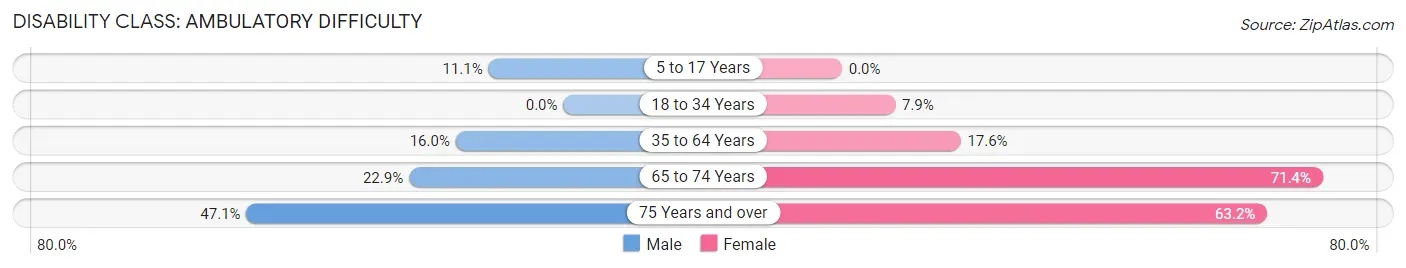
| Age Bracket | Male | Female |
| 5 to 17 Years | 4 (11.1%) | 0 (0.0%) |
| 18 to 34 Years | 0 (0.0%) | 6 (7.9%) |
| 35 to 64 Years | 27 (16.0%) | 34 (17.6%) |
| 65 to 74 Years | 11 (22.9%) | 25 (71.4%) |
| 75 Years and over | 8 (47.1%) | 36 (63.2%) |
Disability Class: Self-Care Difficulty
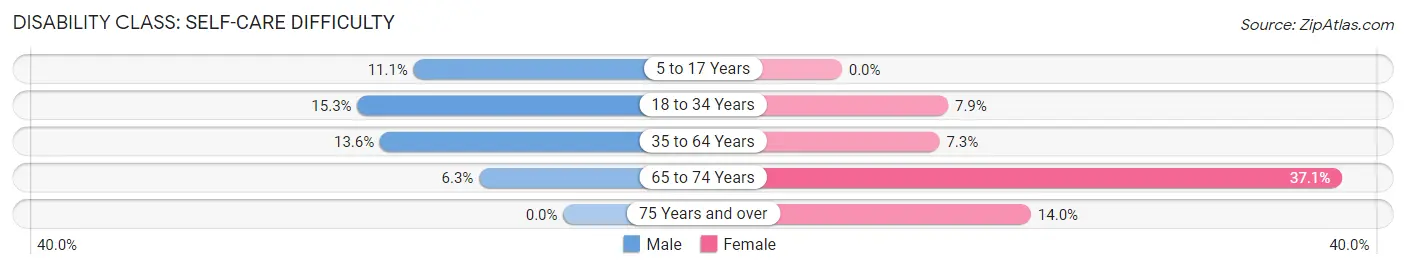
| Age Bracket | Male | Female |
| 5 to 17 Years | 4 (11.1%) | 0 (0.0%) |
| 18 to 34 Years | 13 (15.3%) | 6 (7.9%) |
| 35 to 64 Years | 23 (13.6%) | 14 (7.2%) |
| 65 to 74 Years | 3 (6.2%) | 13 (37.1%) |
| 75 Years and over | 0 (0.0%) | 8 (14.0%) |
Technology Access in Mortons Gap
Computing Device Access in Mortons Gap
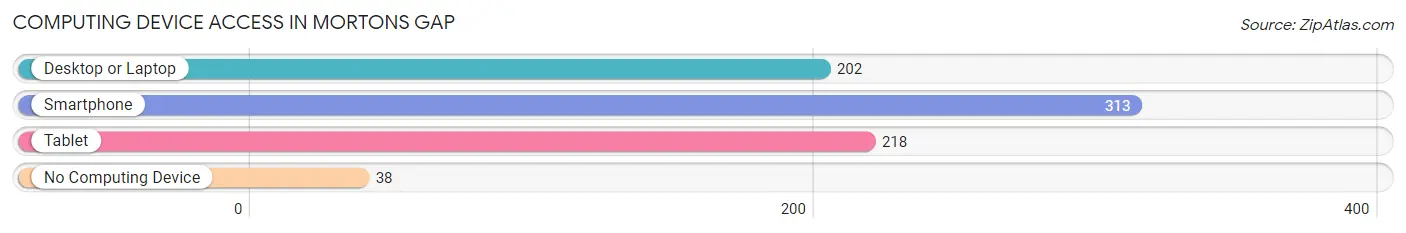
| Device Type | # Households | % Households |
| Desktop or Laptop | 202 | 56.0% |
| Smartphone | 313 | 86.7% |
| Tablet | 218 | 60.4% |
| No Computing Device | 38 | 10.5% |
| Total | 361 | 100.0% |
Internet Access in Mortons Gap
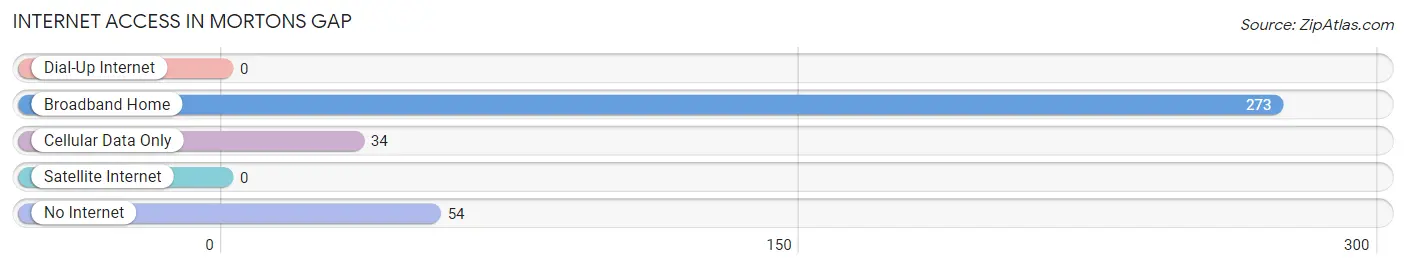
| Internet Type | # Households | % Households |
| Dial-Up Internet | 0 | 0.0% |
| Broadband Home | 273 | 75.6% |
| Cellular Data Only | 34 | 9.4% |
| Satellite Internet | 0 | 0.0% |
| No Internet | 54 | 15.0% |
| Total | 361 | 100.0% |
Mortons Gap Summary
Mortons Gap is a small city located in Hopkins County, Kentucky. It is situated in the western part of the state, about halfway between Madisonville and Madisonville. The city has a population of 1,845 people, according to the 2010 census.
History
Mortons Gap was founded in 1883 by William Morton, a former Confederate soldier. He named the town after his father, who had been killed in the Civil War. The town was originally known as Morton's Gap, but the name was changed to Mortons Gap in 1887.
The town was a small farming community until the early 1900s, when coal mining began to take off in the area. The coal industry brought jobs and economic growth to the area, and the population of Mortons Gap began to grow.
In the 1950s, the town was incorporated as a city. The city has since grown to its current population of 1,845 people.
Geography
Mortons Gap is located in western Kentucky, about halfway between Madisonville and Madisonville. The city is situated in the Pennyrile region of the state, which is known for its rolling hills and lush forests.
The city is located at the intersection of US Highway 41 and Kentucky Route 109. The nearest major cities are Madisonville, which is about 25 miles to the north, and Owensboro, which is about 40 miles to the south.
The climate in Mortons Gap is humid subtropical, with hot summers and mild winters. The average annual temperature is around 62 degrees Fahrenheit.
Economy
Mortons Gap's economy is largely based on agriculture and coal mining. The city is home to several large farms, which produce a variety of crops, including corn, soybeans, and wheat.
The coal industry is also an important part of the local economy. The city is home to several coal mines, which provide jobs for many of the city's residents.
Demographics
As of the 2010 census, the population of Mortons Gap was 1,845 people. The racial makeup of the city was 95.3% White, 2.2% African American, 0.3% Native American, 0.2% Asian, 0.1% Pacific Islander, 0.7% from other races, and 1.3% from two or more races.
The median household income in Mortons Gap was $31,250, and the median family income was $37,500. The per capita income was $17,845. About 17.2% of the population was below the poverty line.
Conclusion
Mortons Gap is a small city located in western Kentucky. It was founded in 1883 and has since grown to its current population of 1,845 people. The city's economy is largely based on agriculture and coal mining, and the median household income is $31,250. Mortons Gap is a diverse city, with a population that is 95.3% White, 2.2% African American, 0.3% Native American, 0.2% Asian, and 0.1% Pacific Islander.
Common Questions
What is Per Capita Income in Mortons Gap?
Per Capita income in Mortons Gap is $20,953.
What is the Median Family Income in Mortons Gap?
Median Family Income in Mortons Gap is $52,083.
What is the Median Household income in Mortons Gap?
Median Household Income in Mortons Gap is $39,205.
What is Income or Wage Gap in Mortons Gap?
Income or Wage Gap in Mortons Gap is 43.0%.
Women in Mortons Gap earn 57.0 cents for every dollar earned by a man.
What is Inequality or Gini Index in Mortons Gap?
Inequality or Gini Index in Mortons Gap is 0.43.
What is the Total Population of Mortons Gap?
Total Population of Mortons Gap is 841.
What is the Total Male Population of Mortons Gap?
Total Male Population of Mortons Gap is 393.
What is the Total Female Population of Mortons Gap?
Total Female Population of Mortons Gap is 448.
What is the Ratio of Males per 100 Females in Mortons Gap?
There are 87.72 Males per 100 Females in Mortons Gap.
What is the Ratio of Females per 100 Males in Mortons Gap?
There are 113.99 Females per 100 Males in Mortons Gap.
What is the Median Population Age in Mortons Gap?
Median Population Age in Mortons Gap is 46.6 Years.
What is the Average Family Size in Mortons Gap
Average Family Size in Mortons Gap is 2.8 People.
What is the Average Household Size in Mortons Gap
Average Household Size in Mortons Gap is 2.3 People.
How Large is the Labor Force in Mortons Gap?
There are 277 People in the Labor Forcein in Mortons Gap.
What is the Percentage of People in the Labor Force in Mortons Gap?
39.6% of People are in the Labor Force in Mortons Gap.
What is the Unemployment Rate in Mortons Gap?
Unemployment Rate in Mortons Gap is 1.1%.