Lynch, KY Map & Demographics
Lynch Map
Lynch Overview
$18,894
PER CAPITA INCOME
$36,094
AVG FAMILY INCOME
$29,954
AVG HOUSEHOLD INCOME
0.38
INEQUALITY / GINI INDEX
684
TOTAL POPULATION
299
MALE POPULATION
385
FEMALE POPULATION
77.66
MALES / 100 FEMALES
128.76
FEMALES / 100 MALES
59.1
MEDIAN AGE
2.8
AVG FAMILY SIZE
2.4
AVG HOUSEHOLD SIZE
231
LABOR FORCE [ PEOPLE ]
37.5%
PERCENT IN LABOR FORCE
6.1%
UNEMPLOYMENT RATE
Lynch Zip Codes
Lynch Area Codes
Income in Lynch
Income Overview in Lynch
Per Capita Income in Lynch is $18,894, while median incomes of families and households are $36,094 and $29,954 respectively.
| Characteristic | Number | Measure |
| Per Capita Income | 684 | $18,894 |
| Median Family Income | 215 | $36,094 |
| Mean Family Income | 215 | $44,832 |
| Median Household Income | 289 | $29,954 |
| Mean Household Income | 289 | $40,502 |
| Income Deficit | 215 | $0 |
| Wage / Income Gap (%) | 684 | 0.00% |
| Wage / Income Gap ($) | 684 | 100.00¢ per $1 |
| Gini / Inequality Index | 684 | 0.38 |
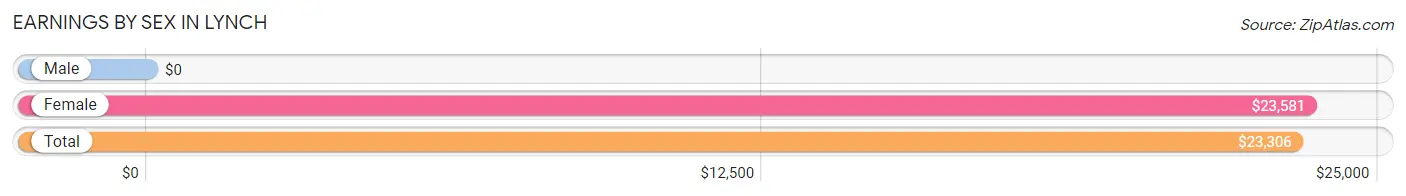
Earnings by Sex in Lynch
| Sex | Number | Average Earnings |
| Male | 86 (36.7%) | $0 |
| Female | 148 (63.2%) | $23,581 |
| Total | 234 (100.0%) | $23,306 |
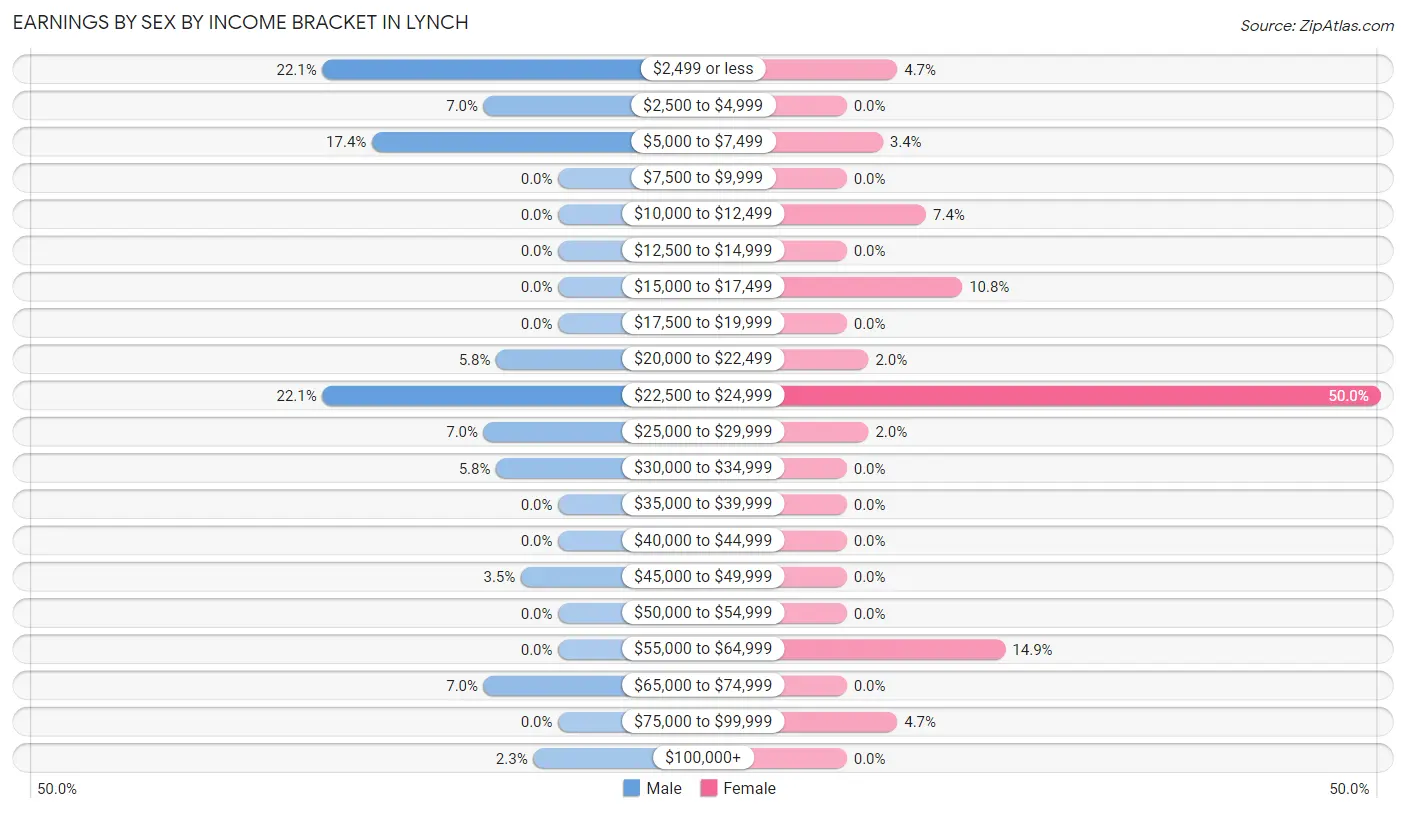
Earnings by Sex by Income Bracket in Lynch
The most common earnings brackets in Lynch are $2,499 or less for men (19 | 22.1%) and $22,500 to $24,999 for women (74 | 50.0%).
| Income | Male | Female |
| $2,499 or less | 19 (22.1%) | 7 (4.7%) |
| $2,500 to $4,999 | 6 (7.0%) | 0 (0.0%) |
| $5,000 to $7,499 | 15 (17.4%) | 5 (3.4%) |
| $7,500 to $9,999 | 0 (0.0%) | 0 (0.0%) |
| $10,000 to $12,499 | 0 (0.0%) | 11 (7.4%) |
| $12,500 to $14,999 | 0 (0.0%) | 0 (0.0%) |
| $15,000 to $17,499 | 0 (0.0%) | 16 (10.8%) |
| $17,500 to $19,999 | 0 (0.0%) | 0 (0.0%) |
| $20,000 to $22,499 | 5 (5.8%) | 3 (2.0%) |
| $22,500 to $24,999 | 19 (22.1%) | 74 (50.0%) |
| $25,000 to $29,999 | 6 (7.0%) | 3 (2.0%) |
| $30,000 to $34,999 | 5 (5.8%) | 0 (0.0%) |
| $35,000 to $39,999 | 0 (0.0%) | 0 (0.0%) |
| $40,000 to $44,999 | 0 (0.0%) | 0 (0.0%) |
| $45,000 to $49,999 | 3 (3.5%) | 0 (0.0%) |
| $50,000 to $54,999 | 0 (0.0%) | 0 (0.0%) |
| $55,000 to $64,999 | 0 (0.0%) | 22 (14.9%) |
| $65,000 to $74,999 | 6 (7.0%) | 0 (0.0%) |
| $75,000 to $99,999 | 0 (0.0%) | 7 (4.7%) |
| $100,000+ | 2 (2.3%) | 0 (0.0%) |
| Total | 86 (100.0%) | 148 (100.0%) |
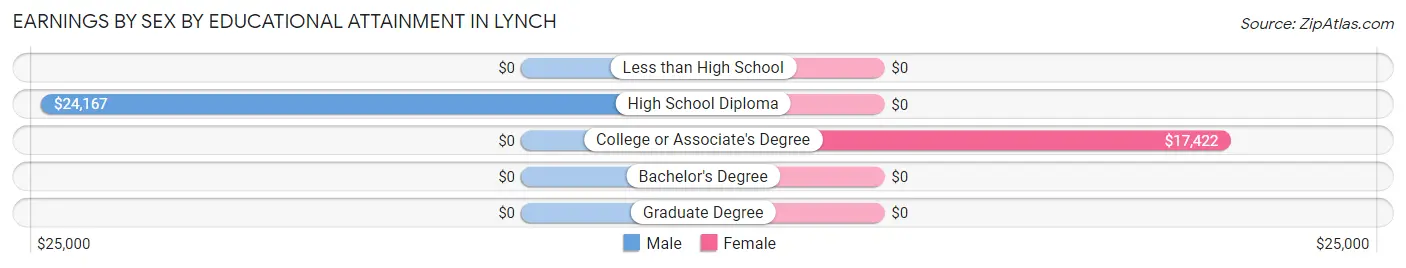
Earnings by Sex by Educational Attainment in Lynch
| Educational Attainment | Male Income | Female Income |
| Less than High School | - | - |
| High School Diploma | $24,167 | $0 |
| College or Associate's Degree | - | - |
| Bachelor's Degree | - | - |
| Graduate Degree | - | - |
| Total | - | - |
Family Income in Lynch
Family Income Brackets in Lynch
According to the Lynch family income data, there are 54 families falling into the $25,000 to $34,999 income range, which is the most common income bracket and makes up 25.1% of all families.
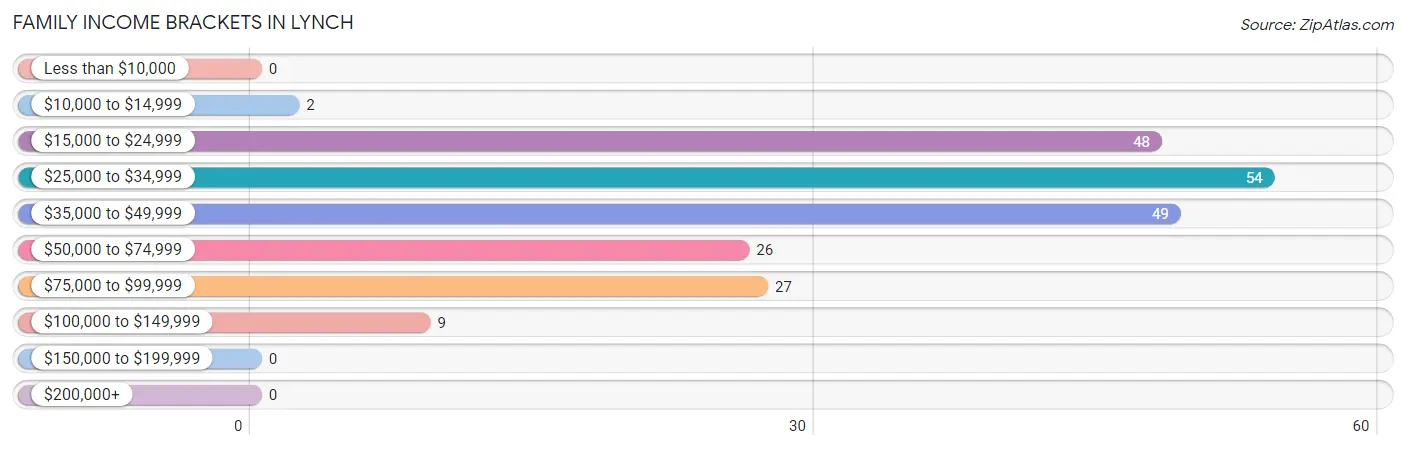
| Income Bracket | # Families | % Families |
| Less than $10,000 | 0 | 0.0% |
| $10,000 to $14,999 | 2 | 0.9% |
| $15,000 to $24,999 | 48 | 22.3% |
| $25,000 to $34,999 | 54 | 25.1% |
| $35,000 to $49,999 | 49 | 22.8% |
| $50,000 to $74,999 | 26 | 12.1% |
| $75,000 to $99,999 | 27 | 12.6% |
| $100,000 to $149,999 | 9 | 4.2% |
| $150,000 to $199,999 | 0 | 0.0% |
| $200,000+ | 0 | 0.0% |
Family Income by Famaliy Size in Lynch
3-person families (19 | 8.8%) account for the highest median family income in Lynch with $48,958 per family, while 2-person families (171 | 79.5%) have the highest median income of $18,360 per family member.
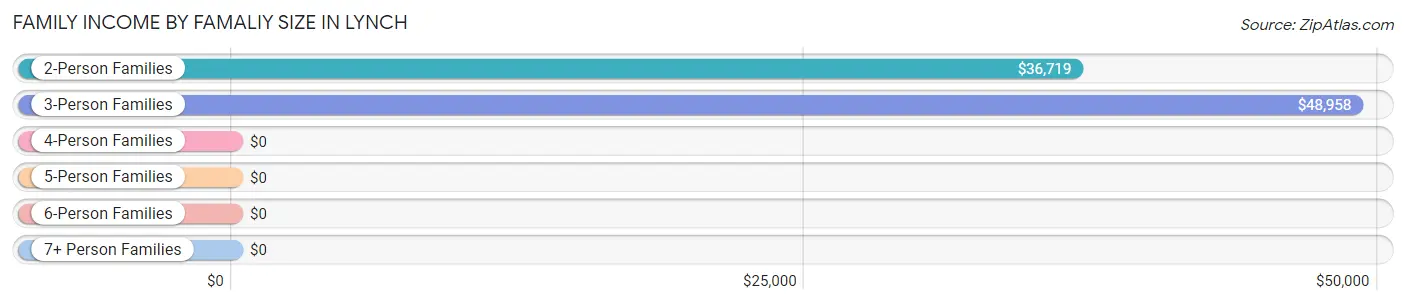
| Income Bracket | # Families | Median Income |
| 2-Person Families | 171 (79.5%) | $36,719 |
| 3-Person Families | 19 (8.8%) | $48,958 |
| 4-Person Families | 12 (5.6%) | $0 |
| 5-Person Families | 0 (0.0%) | $0 |
| 6-Person Families | 13 (6.0%) | $0 |
| 7+ Person Families | 0 (0.0%) | $0 |
| Total | 215 (100.0%) | $36,094 |
Family Income by Number of Earners in Lynch
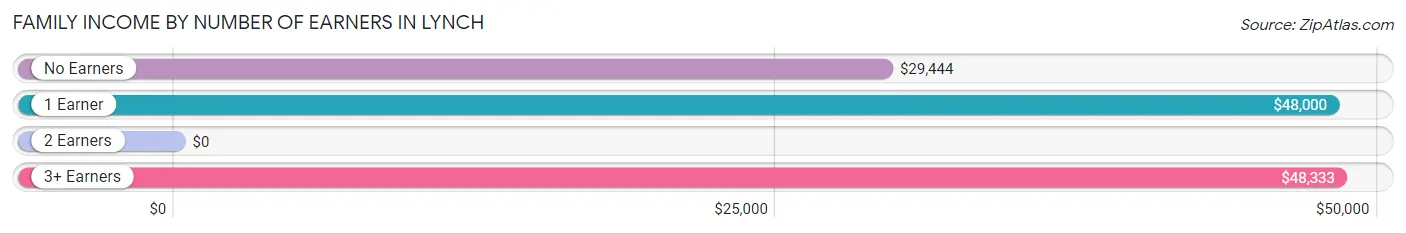
| Number of Earners | # Families | Median Income |
| No Earners | 114 (53.0%) | $29,444 |
| 1 Earner | 40 (18.6%) | $48,000 |
| 2 Earners | 47 (21.9%) | $0 |
| 3+ Earners | 14 (6.5%) | $48,333 |
| Total | 215 (100.0%) | $36,094 |
Household Income in Lynch
Household Income Brackets in Lynch
With 64 households falling in the category, the $35,000 to $49,999 income range is the most frequent in Lynch, accounting for 22.2% of all households.
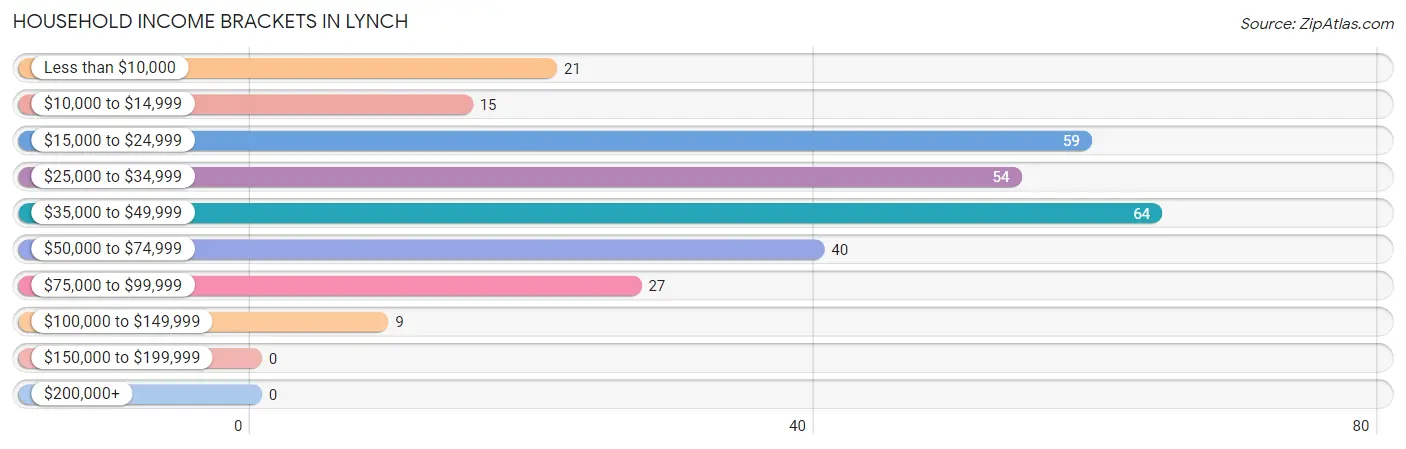
| Income Bracket | # Households | % Households |
| Less than $10,000 | 21 | 7.3% |
| $10,000 to $14,999 | 15 | 5.2% |
| $15,000 to $24,999 | 59 | 20.4% |
| $25,000 to $34,999 | 54 | 18.7% |
| $35,000 to $49,999 | 64 | 22.1% |
| $50,000 to $74,999 | 40 | 13.8% |
| $75,000 to $99,999 | 27 | 9.3% |
| $100,000 to $149,999 | 9 | 3.1% |
| $150,000 to $199,999 | 0 | 0.0% |
| $200,000+ | 0 | 0.0% |
Household Income by Householder Age in Lynch
The median household income in Lynch is $29,954, with the highest median household income of $35,982 found in the 65+ years age bracket for the primary householder. A total of 115 households (39.8%) fall into this category. Meanwhile, the 15 to 24 years age bracket for the primary householder has the lowest median household income of $0, with 5 households (1.7%) in this group.
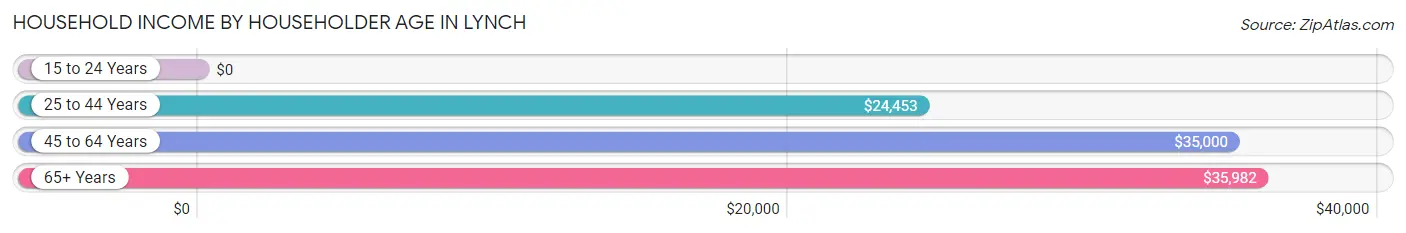
| Income Bracket | # Households | Median Income |
| 15 to 24 Years | 5 (1.7%) | $0 |
| 25 to 44 Years | 25 (8.6%) | $24,453 |
| 45 to 64 Years | 144 (49.8%) | $35,000 |
| 65+ Years | 115 (39.8%) | $35,982 |
| Total | 289 (100.0%) | $29,954 |
Poverty in Lynch
Income Below Poverty by Sex and Age in Lynch
With 26.4% poverty level for males and 35.8% for females among the residents of Lynch, under 5 year old males and under 5 year old females are the most vulnerable to poverty, with 6 males (100.0%) and 6 females (100.0%) in their respective age groups living below the poverty level.
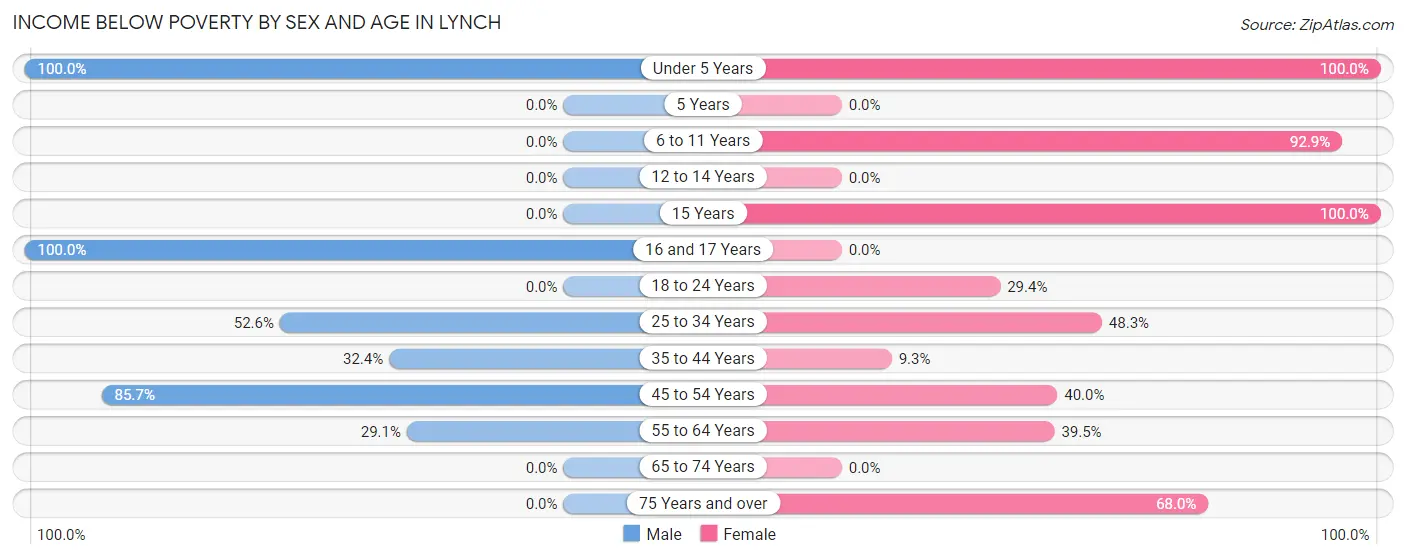
| Age Bracket | Male | Female |
| Under 5 Years | 6 (100.0%) | 6 (100.0%) |
| 5 Years | 0 (0.0%) | 0 (0.0%) |
| 6 to 11 Years | 0 (0.0%) | 39 (92.9%) |
| 12 to 14 Years | 0 (0.0%) | 0 (0.0%) |
| 15 Years | 0 (0.0%) | 4 (100.0%) |
| 16 and 17 Years | 6 (100.0%) | 0 (0.0%) |
| 18 to 24 Years | 0 (0.0%) | 5 (29.4%) |
| 25 to 34 Years | 10 (52.6%) | 14 (48.3%) |
| 35 to 44 Years | 11 (32.4%) | 5 (9.3%) |
| 45 to 54 Years | 12 (85.7%) | 18 (40.0%) |
| 55 to 64 Years | 34 (29.1%) | 30 (39.5%) |
| 65 to 74 Years | 0 (0.0%) | 0 (0.0%) |
| 75 Years and over | 0 (0.0%) | 17 (68.0%) |
| Total | 79 (26.4%) | 138 (35.8%) |
Income Above Poverty by Sex and Age in Lynch
According to the poverty statistics in Lynch, males aged 6 to 11 years and females aged 12 to 14 years are the age groups that are most secure financially, with 100.0% of males and 100.0% of females in these age groups living above the poverty line.
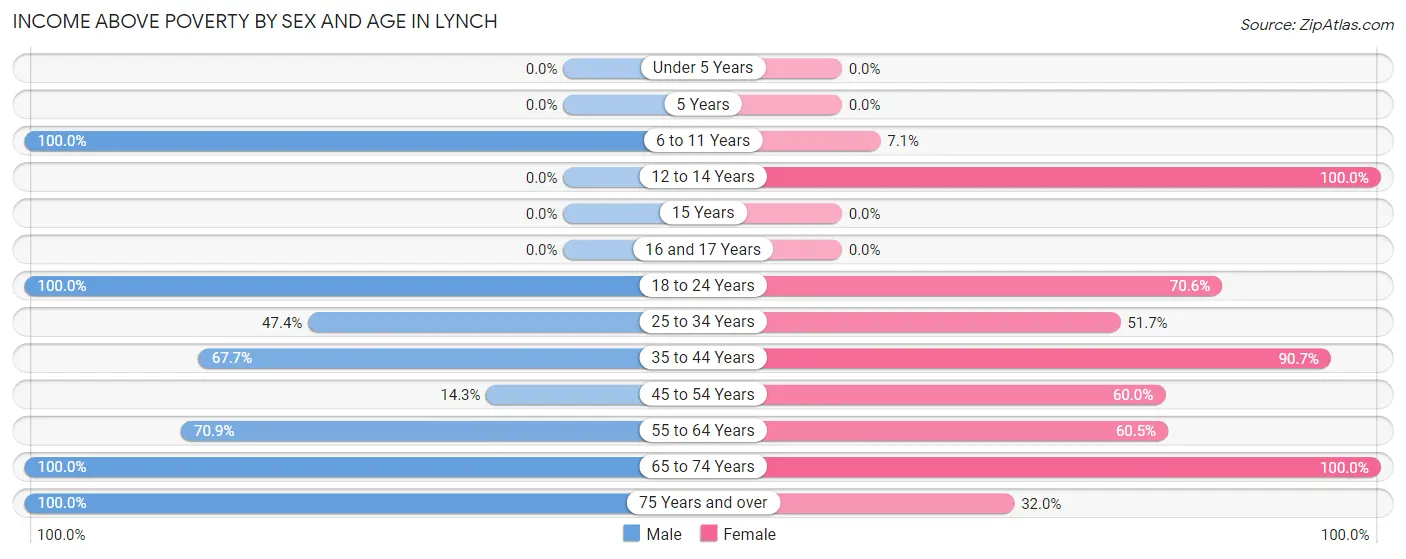
| Age Bracket | Male | Female |
| Under 5 Years | 0 (0.0%) | 0 (0.0%) |
| 5 Years | 0 (0.0%) | 0 (0.0%) |
| 6 to 11 Years | 2 (100.0%) | 3 (7.1%) |
| 12 to 14 Years | 0 (0.0%) | 8 (100.0%) |
| 15 Years | 0 (0.0%) | 0 (0.0%) |
| 16 and 17 Years | 0 (0.0%) | 0 (0.0%) |
| 18 to 24 Years | 11 (100.0%) | 12 (70.6%) |
| 25 to 34 Years | 9 (47.4%) | 15 (51.7%) |
| 35 to 44 Years | 23 (67.6%) | 49 (90.7%) |
| 45 to 54 Years | 2 (14.3%) | 27 (60.0%) |
| 55 to 64 Years | 83 (70.9%) | 46 (60.5%) |
| 65 to 74 Years | 77 (100.0%) | 79 (100.0%) |
| 75 Years and over | 13 (100.0%) | 8 (32.0%) |
| Total | 220 (73.6%) | 247 (64.2%) |
Income Below Poverty Among Married-Couple Families in Lynch
The poverty statistics for married-couple families in Lynch show that 18.9% or 30 of the total 159 families live below the poverty line. Families with 3 or 4 children have the highest poverty rate of 100.0%, comprising of 5 families. On the other hand, families with no children have the lowest poverty rate of 14.4%, which includes 20 families.
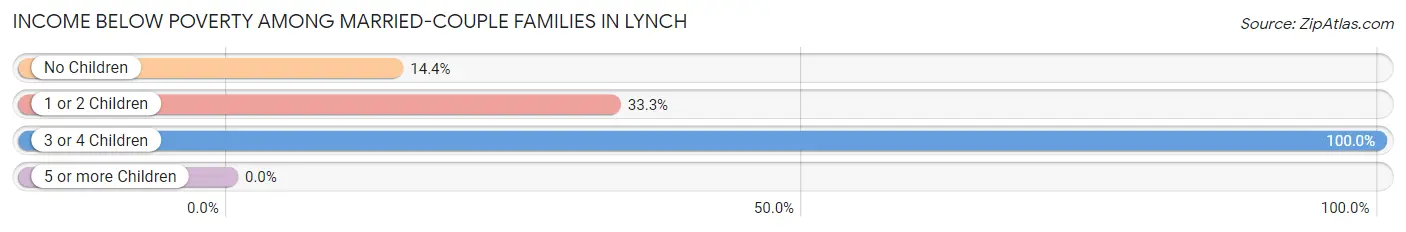
| Children | Above Poverty | Below Poverty |
| No Children | 119 (85.6%) | 20 (14.4%) |
| 1 or 2 Children | 10 (66.7%) | 5 (33.3%) |
| 3 or 4 Children | 0 (0.0%) | 5 (100.0%) |
| 5 or more Children | 0 (0.0%) | 0 (0.0%) |
| Total | 129 (81.1%) | 30 (18.9%) |
Income Below Poverty Among Single-Parent Households in Lynch
According to the poverty data in Lynch, 27.3% or 6 single-father households and 23.5% or 8 single-mother households are living below the poverty line. Among single-father households, those with 1 or 2 children have the highest poverty rate, with 6 households (100.0%) experiencing poverty. Likewise, among single-mother households, those with 3 or 4 children have the highest poverty rate, with 8 households (100.0%) falling below the poverty line.
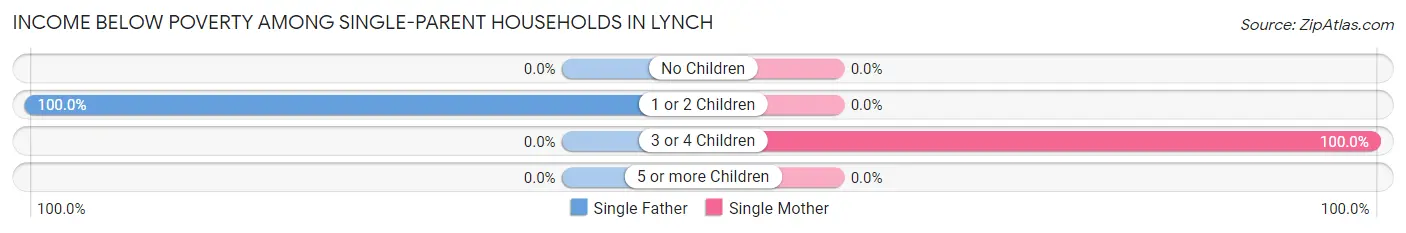
| Children | Single Father | Single Mother |
| No Children | 0 (0.0%) | 0 (0.0%) |
| 1 or 2 Children | 6 (100.0%) | 0 (0.0%) |
| 3 or 4 Children | 0 (0.0%) | 8 (100.0%) |
| 5 or more Children | 0 (0.0%) | 0 (0.0%) |
| Total | 6 (27.3%) | 8 (23.5%) |
Income Below Poverty Among Married-Couple vs Single-Parent Households in Lynch
The poverty data for Lynch shows that 30 of the married-couple family households (18.9%) and 14 of the single-parent households (25.0%) are living below the poverty level. Within the married-couple family households, those with 3 or 4 children have the highest poverty rate, with 5 households (100.0%) falling below the poverty line. Among the single-parent households, those with 3 or 4 children have the highest poverty rate, with 8 household (100.0%) living below poverty.
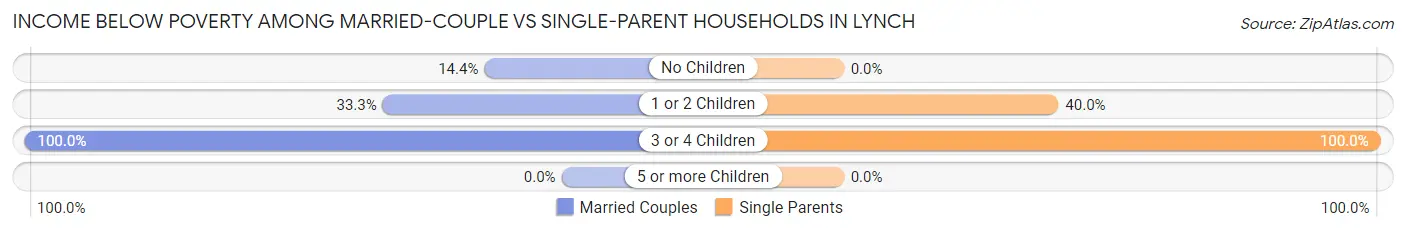
| Children | Married-Couple Families | Single-Parent Households |
| No Children | 20 (14.4%) | 0 (0.0%) |
| 1 or 2 Children | 5 (33.3%) | 6 (40.0%) |
| 3 or 4 Children | 5 (100.0%) | 8 (100.0%) |
| 5 or more Children | 0 (0.0%) | 0 (0.0%) |
| Total | 30 (18.9%) | 14 (25.0%) |
Race in Lynch
The most populous races in Lynch are White / Caucasian (545 | 79.7%), Black / African American (125 | 18.3%), and Two or more Races (14 | 2.1%).
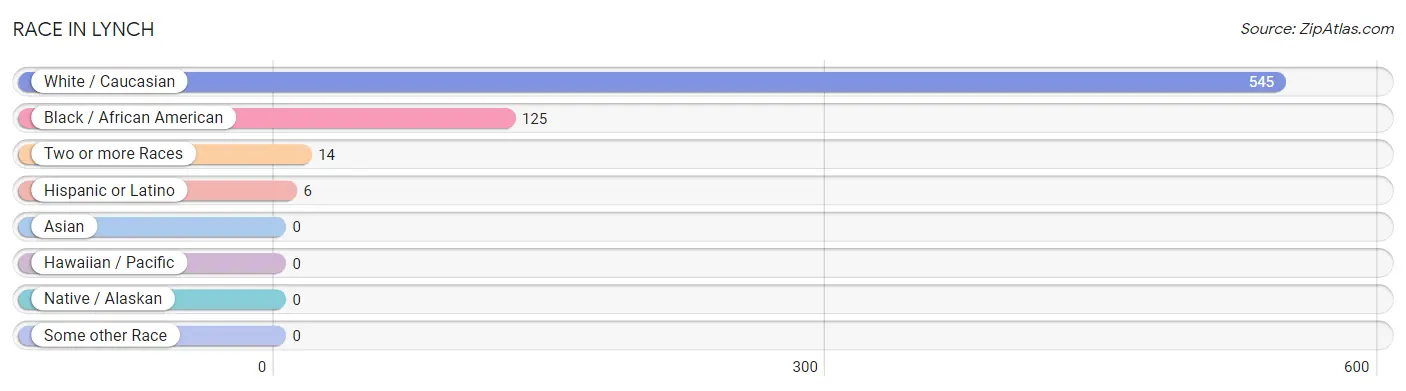
| Race | # Population | % Population |
| Asian | 0 | 0.0% |
| Black / African American | 125 | 18.3% |
| Hawaiian / Pacific | 0 | 0.0% |
| Hispanic or Latino | 6 | 0.9% |
| Native / Alaskan | 0 | 0.0% |
| White / Caucasian | 545 | 79.7% |
| Two or more Races | 14 | 2.1% |
| Some other Race | 0 | 0.0% |
| Total | 684 | 100.0% |
Ancestry in Lynch
The most populous ancestries reported in Lynch are Irish (71 | 10.4%), English (43 | 6.3%), Hungarian (20 | 2.9%), Dutch (14 | 2.1%), and German (14 | 2.1%), together accounting for 23.7% of all Lynch residents.
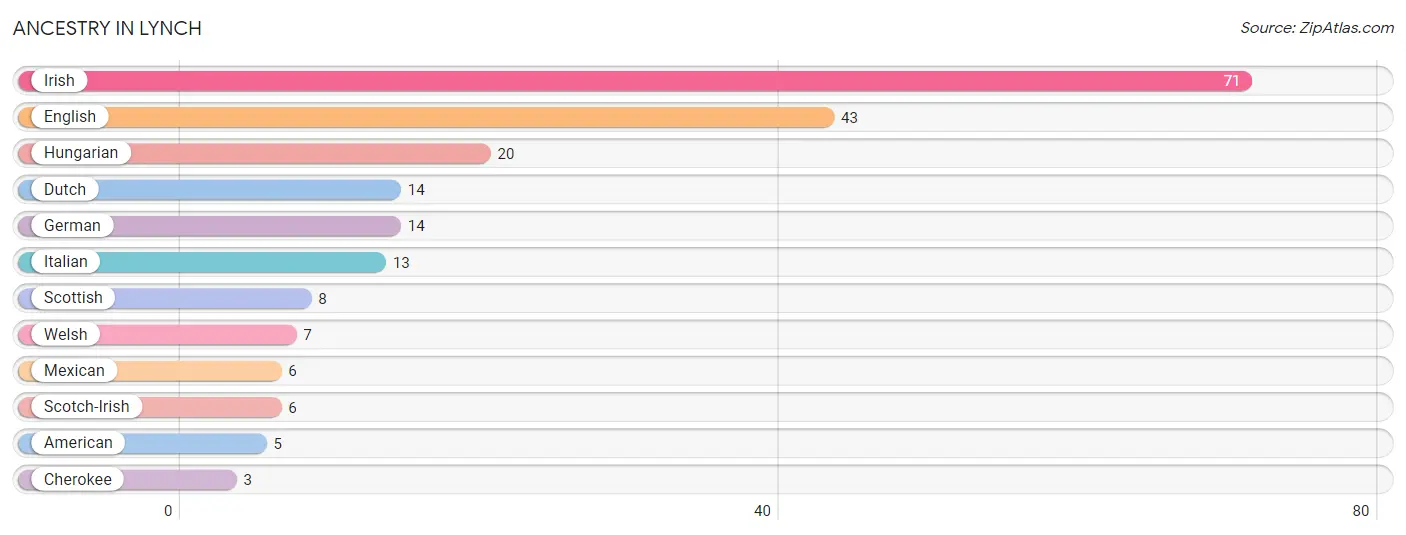
| Ancestry | # Population | % Population |
| American | 5 | 0.7% |
| Cherokee | 3 | 0.4% |
| Dutch | 14 | 2.1% |
| English | 43 | 6.3% |
| German | 14 | 2.1% |
| Hungarian | 20 | 2.9% |
| Irish | 71 | 10.4% |
| Italian | 13 | 1.9% |
| Mexican | 6 | 0.9% |
| Scotch-Irish | 6 | 0.9% |
| Scottish | 8 | 1.2% |
| Welsh | 7 | 1.0% | View All 12 Rows |
Immigrants in Lynch

| Immigration Origin | # Population | % Population | View All 0 Rows |
Sex and Age in Lynch
Sex and Age in Lynch
The most populous age groups in Lynch are 60 to 64 Years (78 | 26.1%) for men and 65 to 69 Years (59 | 15.3%) for women.
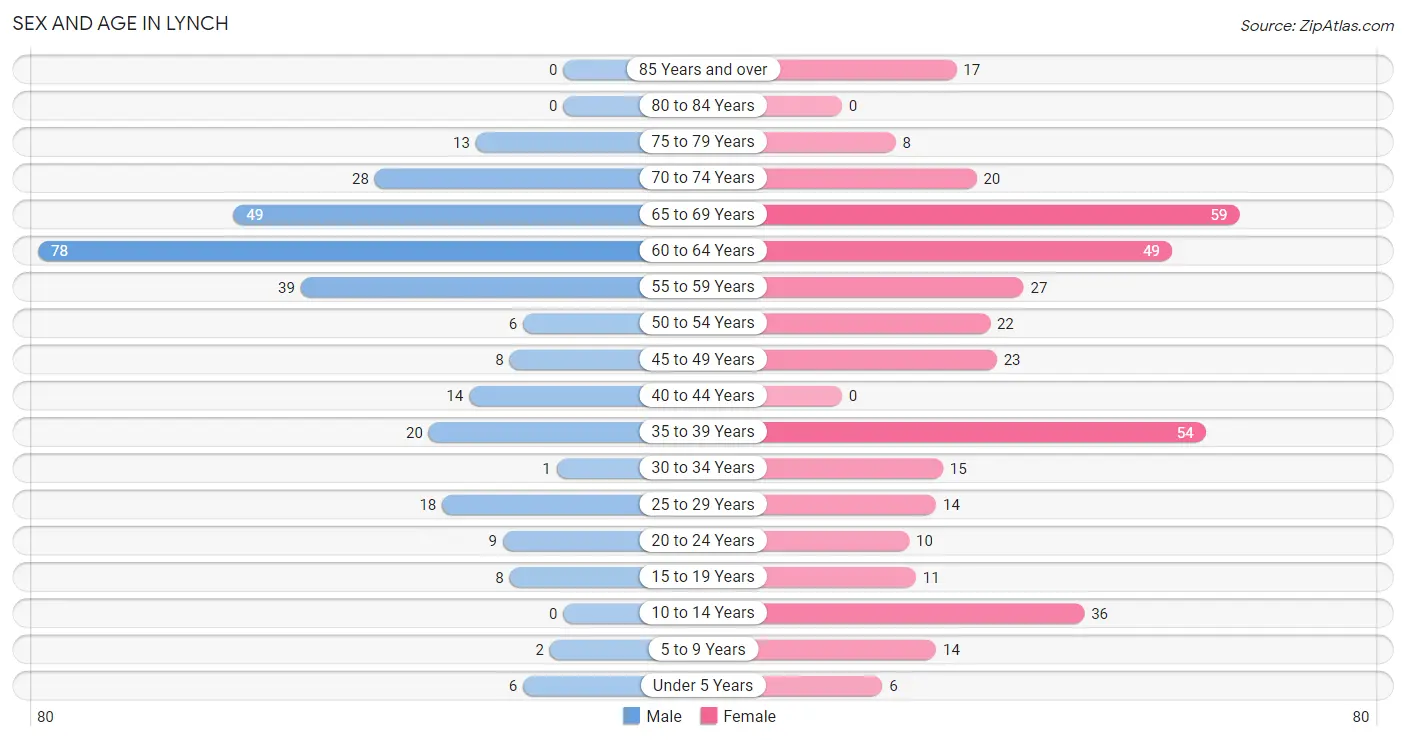
| Age Bracket | Male | Female |
| Under 5 Years | 6 (2.0%) | 6 (1.6%) |
| 5 to 9 Years | 2 (0.7%) | 14 (3.6%) |
| 10 to 14 Years | 0 (0.0%) | 36 (9.3%) |
| 15 to 19 Years | 8 (2.7%) | 11 (2.9%) |
| 20 to 24 Years | 9 (3.0%) | 10 (2.6%) |
| 25 to 29 Years | 18 (6.0%) | 14 (3.6%) |
| 30 to 34 Years | 1 (0.3%) | 15 (3.9%) |
| 35 to 39 Years | 20 (6.7%) | 54 (14.0%) |
| 40 to 44 Years | 14 (4.7%) | 0 (0.0%) |
| 45 to 49 Years | 8 (2.7%) | 23 (6.0%) |
| 50 to 54 Years | 6 (2.0%) | 22 (5.7%) |
| 55 to 59 Years | 39 (13.0%) | 27 (7.0%) |
| 60 to 64 Years | 78 (26.1%) | 49 (12.7%) |
| 65 to 69 Years | 49 (16.4%) | 59 (15.3%) |
| 70 to 74 Years | 28 (9.4%) | 20 (5.2%) |
| 75 to 79 Years | 13 (4.3%) | 8 (2.1%) |
| 80 to 84 Years | 0 (0.0%) | 0 (0.0%) |
| 85 Years and over | 0 (0.0%) | 17 (4.4%) |
| Total | 299 (100.0%) | 385 (100.0%) |
Families and Households in Lynch
Median Family Size in Lynch
The median family size in Lynch is 2.75 persons per family, with single female/mother families (34 | 15.8%) accounting for the largest median family size of 3.26 persons per family. On the other hand, married-couple families (159 | 74.0%) represent the smallest median family size with 2.64 persons per family.
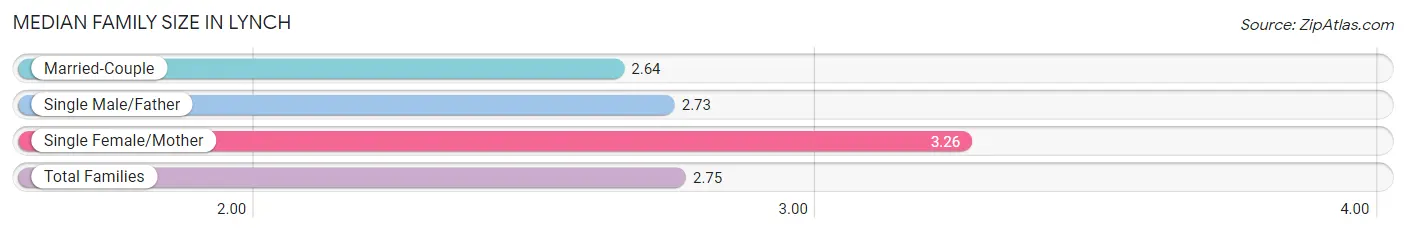
| Family Type | # Families | Family Size |
| Married-Couple | 159 (74.0%) | 2.64 |
| Single Male/Father | 22 (10.2%) | 2.73 |
| Single Female/Mother | 34 (15.8%) | 3.26 |
| Total Families | 215 (100.0%) | 2.75 |
Median Household Size in Lynch
The median household size in Lynch is 2.37 persons per household, with single female/mother households (34 | 11.8%) accounting for the largest median household size of 3.26 persons per household. non-family households (74 | 25.6%) represent the smallest median household size with 1.18 persons per household.
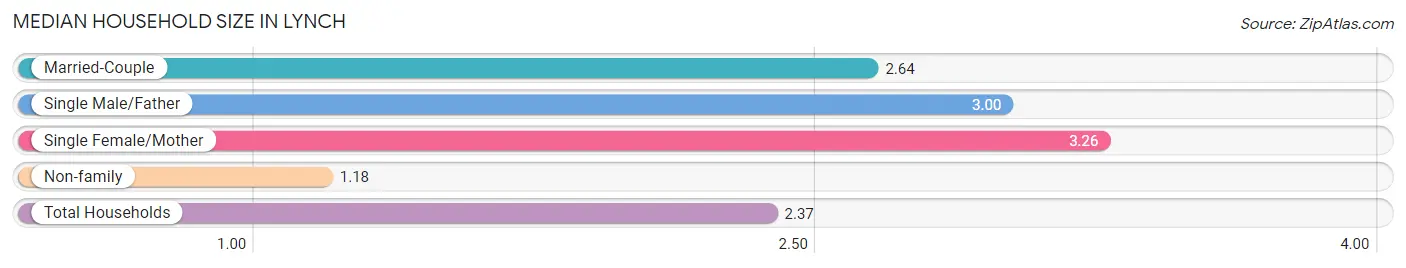
| Household Type | # Households | Household Size |
| Married-Couple | 159 (55.0%) | 2.64 |
| Single Male/Father | 22 (7.6%) | 3.00 |
| Single Female/Mother | 34 (11.8%) | 3.26 |
| Non-family | 74 (25.6%) | 1.18 |
| Total Households | 289 (100.0%) | 2.37 |
Household Size by Marriage Status in Lynch
Out of a total of 289 households in Lynch, 215 (74.4%) are family households, while 74 (25.6%) are nonfamily households. The most numerous type of family households are 2-person households, comprising 165, and the most common type of nonfamily households are 1-person households, comprising 65.
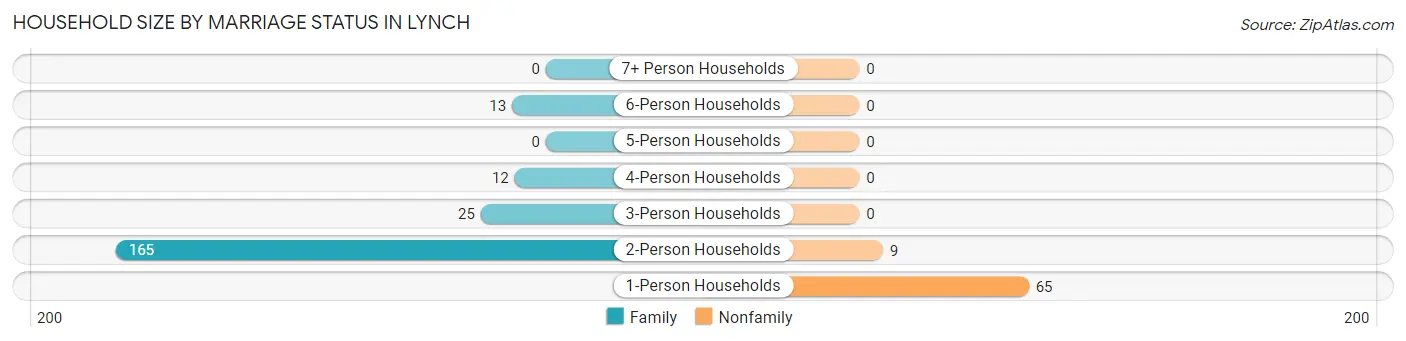
| Household Size | Family Households | Nonfamily Households |
| 1-Person Households | - | 65 (22.5%) |
| 2-Person Households | 165 (57.1%) | 9 (3.1%) |
| 3-Person Households | 25 (8.6%) | 0 (0.0%) |
| 4-Person Households | 12 (4.2%) | 0 (0.0%) |
| 5-Person Households | 0 (0.0%) | 0 (0.0%) |
| 6-Person Households | 13 (4.5%) | 0 (0.0%) |
| 7+ Person Households | 0 (0.0%) | 0 (0.0%) |
| Total | 215 (74.4%) | 74 (25.6%) |
Female Fertility in Lynch
Fertility by Age in Lynch
| Age Bracket | Women with Births | Births / 1,000 Women |
| 15 to 19 years | 0 (0.0%) | 0.0 |
| 20 to 34 years | 0 (0.0%) | 0.0 |
| 35 to 50 years | 0 (0.0%) | 0.0 |
| Total | 0 (0.0%) | 0.0 |
Fertility by Age by Marriage Status in Lynch
| Age Bracket | Married | Unmarried |
| 15 to 19 years | 0 (0.0%) | 0 (0.0%) |
| 20 to 34 years | 0 (0.0%) | 0 (0.0%) |
| 35 to 50 years | 0 (0.0%) | 0 (0.0%) |
| Total | 0 (0.0%) | 0 (0.0%) |
Fertility by Education in Lynch
| Educational Attainment | Women with Births | Births / 1,000 Women |
| Less than High School | 0 (0.0%) | 0.0 |
| High School Diploma | 0 (0.0%) | 0.0 |
| College or Associate's Degree | 0 (0.0%) | 0.0 |
| Bachelor's Degree | 0 (0.0%) | 0.0 |
| Graduate Degree | 0 (0.0%) | 0.0 |
| Total | 0 (0.0%) | 0.0 |
Fertility by Education by Marriage Status in Lynch
| Educational Attainment | Married | Unmarried |
| Less than High School | 0 (0.0%) | 0 (0.0%) |
| High School Diploma | 0 (0.0%) | 0 (0.0%) |
| College or Associate's Degree | 0 (0.0%) | 0 (0.0%) |
| Bachelor's Degree | 0 (0.0%) | 0 (0.0%) |
| Graduate Degree | 0 (0.0%) | 0 (0.0%) |
| Total | 0 (0.0%) | 0 (0.0%) |
Employment Characteristics in Lynch
Employment by Class of Employer in Lynch
Among the 217 employed individuals in Lynch, private company employees (68 | 31.3%), federal government employees (49 | 22.6%), and self-employed (not incorporated) (38 | 17.5%) make up the most common classes of employment.
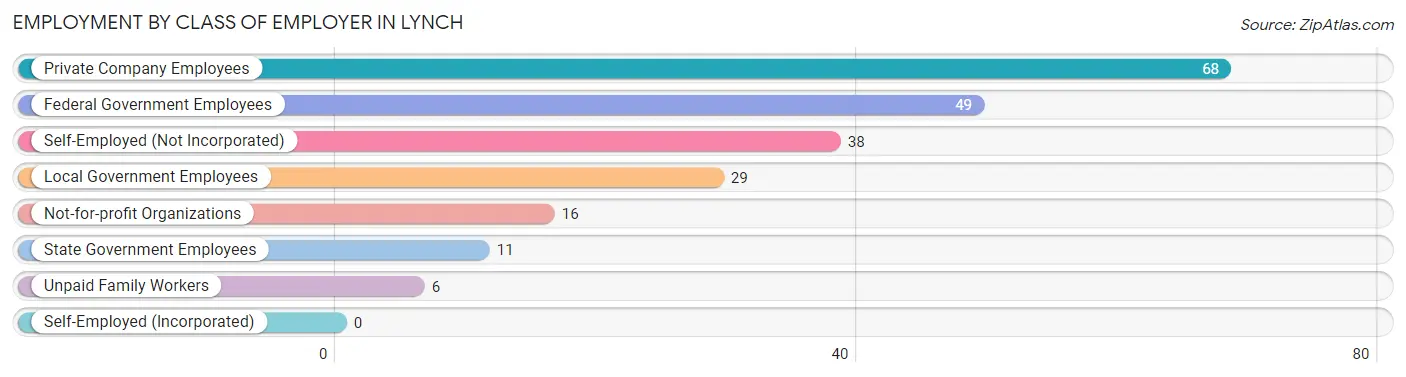
| Employer Class | # Employees | % Employees |
| Private Company Employees | 68 | 31.3% |
| Self-Employed (Incorporated) | 0 | 0.0% |
| Self-Employed (Not Incorporated) | 38 | 17.5% |
| Not-for-profit Organizations | 16 | 7.4% |
| Local Government Employees | 29 | 13.4% |
| State Government Employees | 11 | 5.1% |
| Federal Government Employees | 49 | 22.6% |
| Unpaid Family Workers | 6 | 2.8% |
| Total | 217 | 100.0% |
Employment Status by Age in Lynch
According to the labor force statistics for Lynch, out of the total population over 16 years of age (616), 37.5% or 231 individuals are in the labor force, with 6.1% or 14 of them unemployed. The age group with the highest labor force participation rate is 20 to 24 years, with 100.0% or 19 individuals in the labor force. Within the labor force, the 25 to 29 years age range has the highest percentage of unemployed individuals, with 50.0% or 9 of them being unemployed.
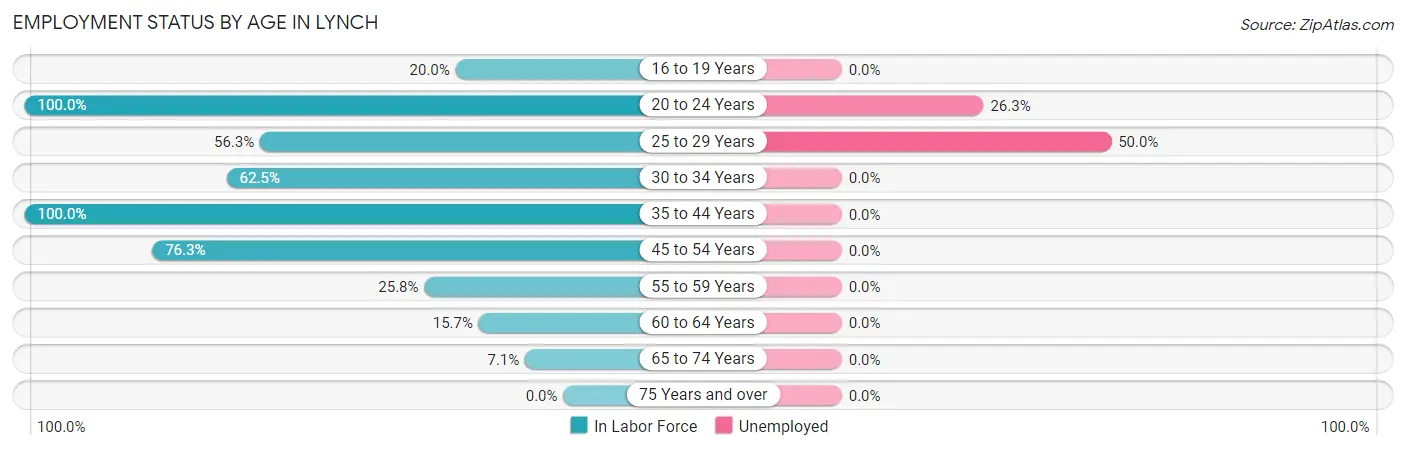
| Age Bracket | In Labor Force | Unemployed |
| 16 to 19 Years | 3 (20.0%) | 0 (0.0%) |
| 20 to 24 Years | 19 (100.0%) | 5 (26.3%) |
| 25 to 29 Years | 18 (56.3%) | 9 (50.0%) |
| 30 to 34 Years | 10 (62.5%) | 0 (0.0%) |
| 35 to 44 Years | 88 (100.0%) | 0 (0.0%) |
| 45 to 54 Years | 45 (76.3%) | 0 (0.0%) |
| 55 to 59 Years | 17 (25.8%) | 0 (0.0%) |
| 60 to 64 Years | 20 (15.7%) | 0 (0.0%) |
| 65 to 74 Years | 11 (7.1%) | 0 (0.0%) |
| 75 Years and over | 0 (0.0%) | 0 (0.0%) |
| Total | 231 (37.5%) | 14 (6.1%) |
Employment Status by Educational Attainment in Lynch
According to labor force statistics for Lynch, 51.0% of individuals (198) out of the total population between 25 and 64 years of age (388) are in the labor force, with 4.5% or 9 of them being unemployed. The group with the highest labor force participation rate are those with the educational attainment of bachelor's degree or higher, with 69.6% or 55 individuals in the labor force. Within the labor force, individuals with high school diploma education have the highest percentage of unemployment, with 25.7% or 9 of them being unemployed.
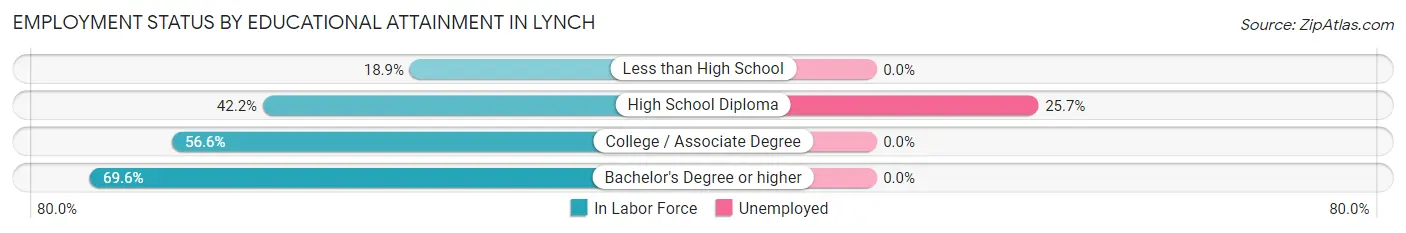
| Educational Attainment | In Labor Force | Unemployed |
| Less than High School | 10 (18.9%) | 0 (0.0%) |
| High School Diploma | 35 (42.2%) | 21 (25.7%) |
| College / Associate Degree | 98 (56.6%) | 0 (0.0%) |
| Bachelor's Degree or higher | 55 (69.6%) | 0 (0.0%) |
| Total | 198 (51.0%) | 17 (4.5%) |
Employment Occupations by Sex in Lynch
Management, Business, Science and Arts Occupations
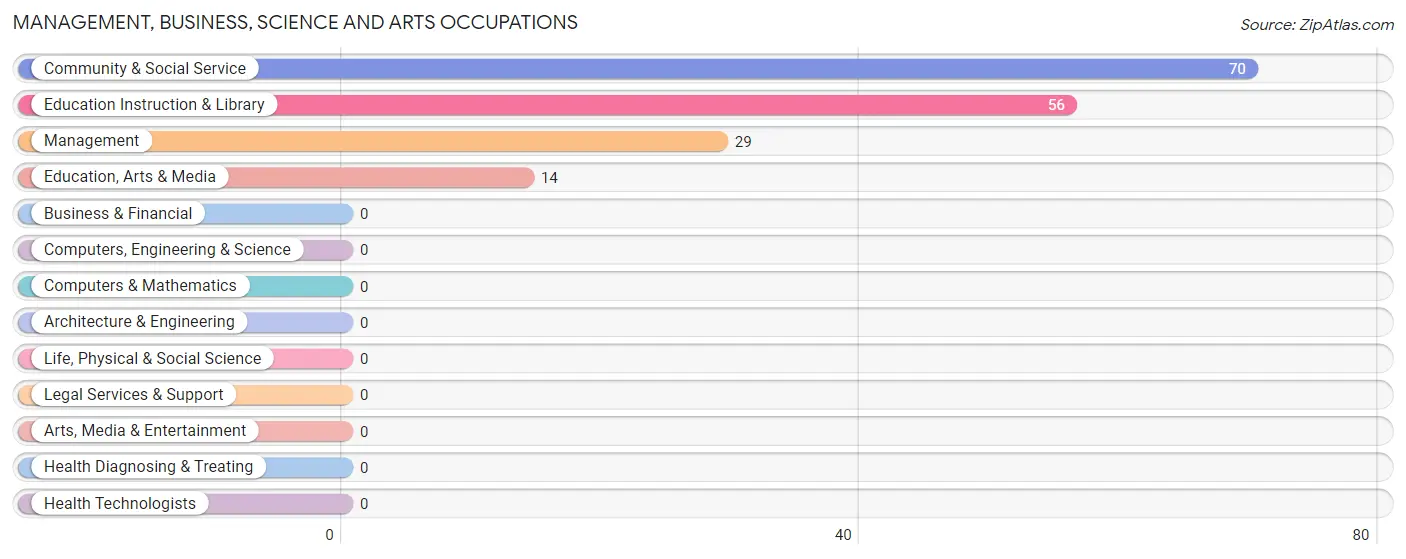
The most common Management, Business, Science and Arts occupations in Lynch are Community & Social Service (70 | 32.3%), Education Instruction & Library (56 | 25.8%), Management (29 | 13.4%), and Education, Arts & Media (14 | 6.5%).
Management, Business, Science and Arts Occupations by Sex
Within the Management, Business, Science and Arts occupations in Lynch, the most male-oriented occupations are Education, Arts & Media (64.3%), Management (58.6%), and Community & Social Service (12.9%), while the most female-oriented occupations are Education Instruction & Library (100.0%), Community & Social Service (87.1%), and Management (41.4%).
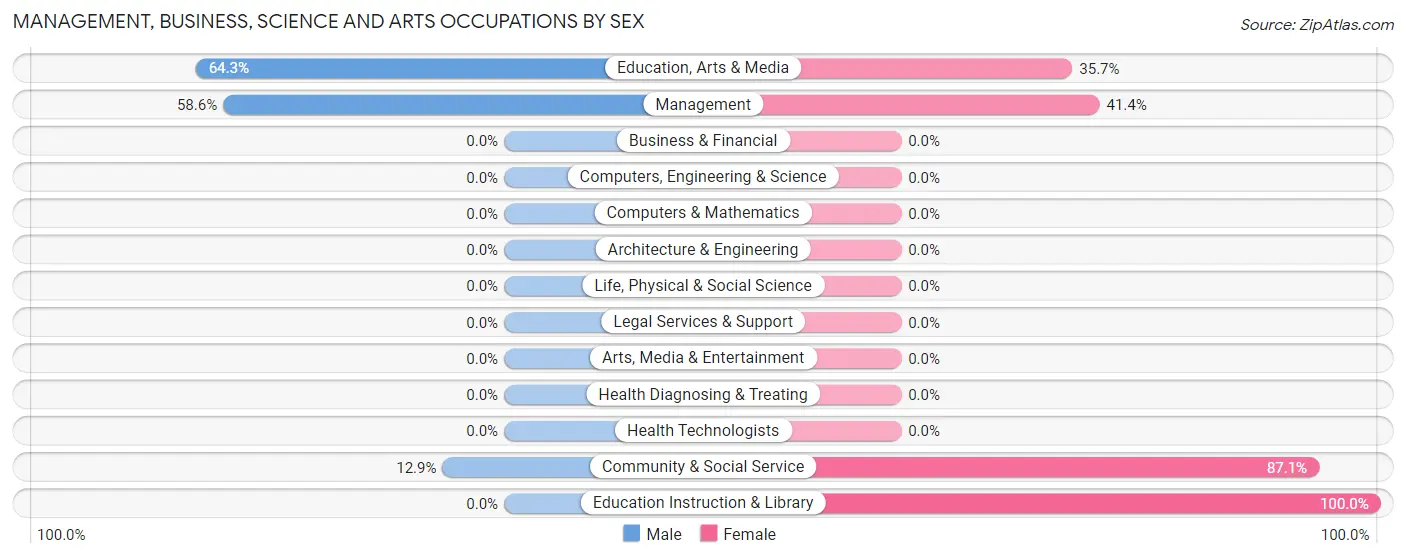
| Occupation | Male | Female |
| Management | 17 (58.6%) | 12 (41.4%) |
| Business & Financial | 0 (0.0%) | 0 (0.0%) |
| Computers, Engineering & Science | 0 (0.0%) | 0 (0.0%) |
| Computers & Mathematics | 0 (0.0%) | 0 (0.0%) |
| Architecture & Engineering | 0 (0.0%) | 0 (0.0%) |
| Life, Physical & Social Science | 0 (0.0%) | 0 (0.0%) |
| Community & Social Service | 9 (12.9%) | 61 (87.1%) |
| Education, Arts & Media | 9 (64.3%) | 5 (35.7%) |
| Legal Services & Support | 0 (0.0%) | 0 (0.0%) |
| Education Instruction & Library | 0 (0.0%) | 56 (100.0%) |
| Arts, Media & Entertainment | 0 (0.0%) | 0 (0.0%) |
| Health Diagnosing & Treating | 0 (0.0%) | 0 (0.0%) |
| Health Technologists | 0 (0.0%) | 0 (0.0%) |
| Total (Category) | 26 (26.3%) | 73 (73.7%) |
| Total (Overall) | 78 (35.9%) | 139 (64.1%) |
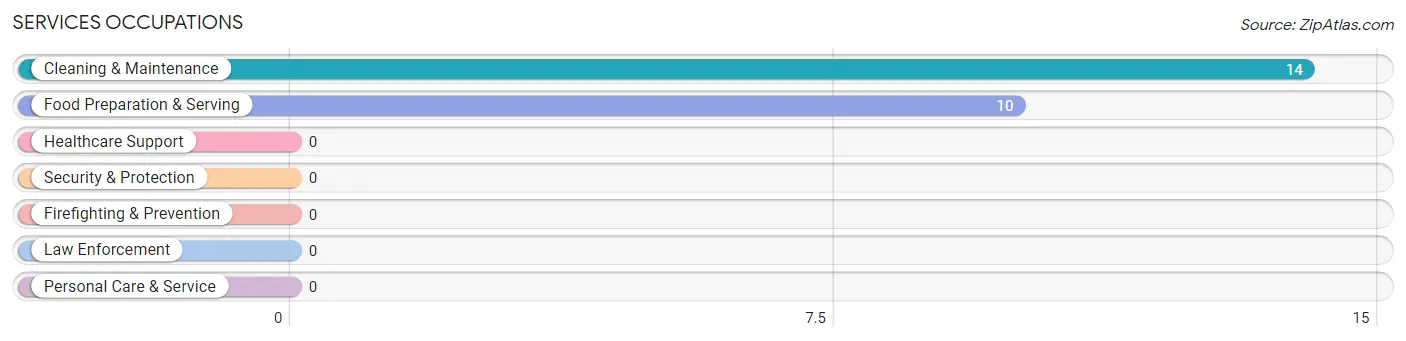
Services Occupations
The most common Services occupations in Lynch are Cleaning & Maintenance (14 | 6.5%), and Food Preparation & Serving (10 | 4.6%).
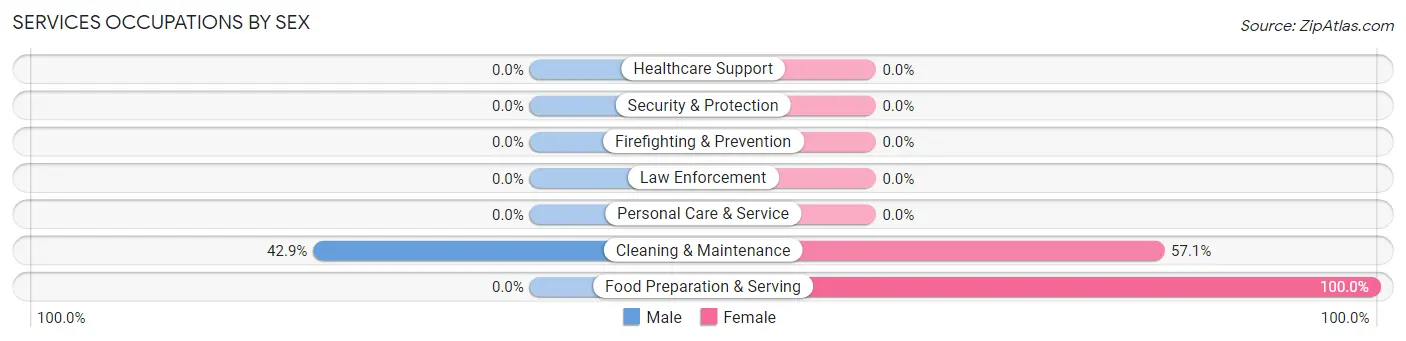
Services Occupations by Sex
| Occupation | Male | Female |
| Healthcare Support | 0 (0.0%) | 0 (0.0%) |
| Security & Protection | 0 (0.0%) | 0 (0.0%) |
| Firefighting & Prevention | 0 (0.0%) | 0 (0.0%) |
| Law Enforcement | 0 (0.0%) | 0 (0.0%) |
| Food Preparation & Serving | 0 (0.0%) | 10 (100.0%) |
| Cleaning & Maintenance | 6 (42.9%) | 8 (57.1%) |
| Personal Care & Service | 0 (0.0%) | 0 (0.0%) |
| Total (Category) | 6 (25.0%) | 18 (75.0%) |
| Total (Overall) | 78 (35.9%) | 139 (64.1%) |
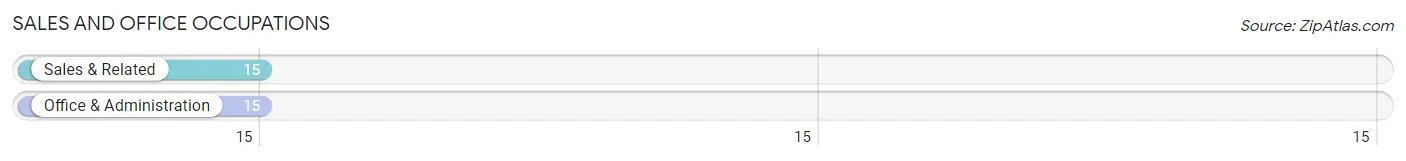
Sales and Office Occupations
The most common Sales and Office occupations in Lynch are Sales & Related (15 | 6.9%), and Office & Administration (15 | 6.9%).
Sales and Office Occupations by Sex
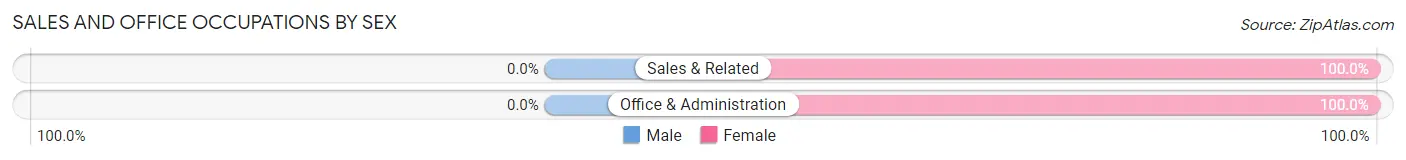
| Occupation | Male | Female |
| Sales & Related | 0 (0.0%) | 15 (100.0%) |
| Office & Administration | 0 (0.0%) | 15 (100.0%) |
| Total (Category) | 0 (0.0%) | 30 (100.0%) |
| Total (Overall) | 78 (35.9%) | 139 (64.1%) |
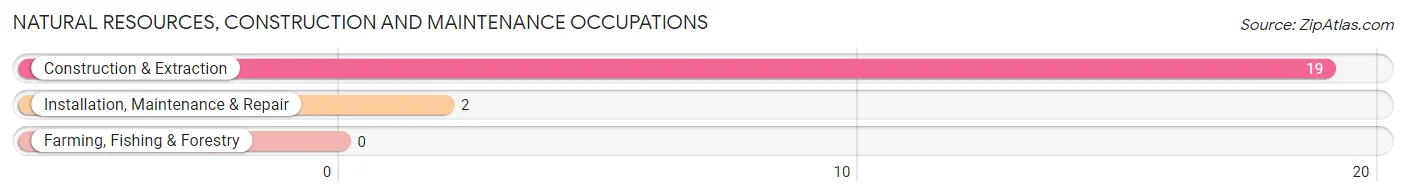
Natural Resources, Construction and Maintenance Occupations
The most common Natural Resources, Construction and Maintenance occupations in Lynch are Construction & Extraction (19 | 8.8%), and Installation, Maintenance & Repair (2 | 0.9%).
Natural Resources, Construction and Maintenance Occupations by Sex
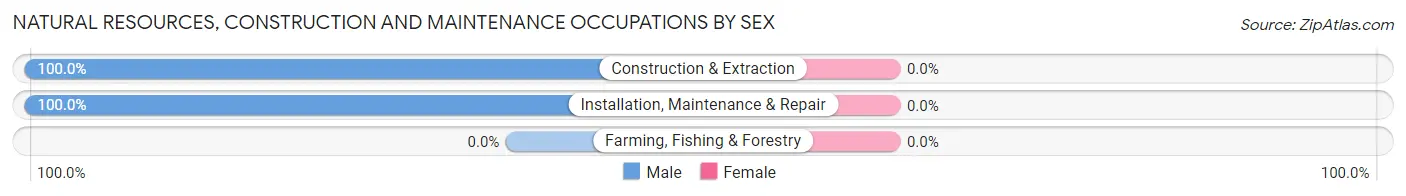
| Occupation | Male | Female |
| Farming, Fishing & Forestry | 0 (0.0%) | 0 (0.0%) |
| Construction & Extraction | 19 (100.0%) | 0 (0.0%) |
| Installation, Maintenance & Repair | 2 (100.0%) | 0 (0.0%) |
| Total (Category) | 21 (100.0%) | 0 (0.0%) |
| Total (Overall) | 78 (35.9%) | 139 (64.1%) |
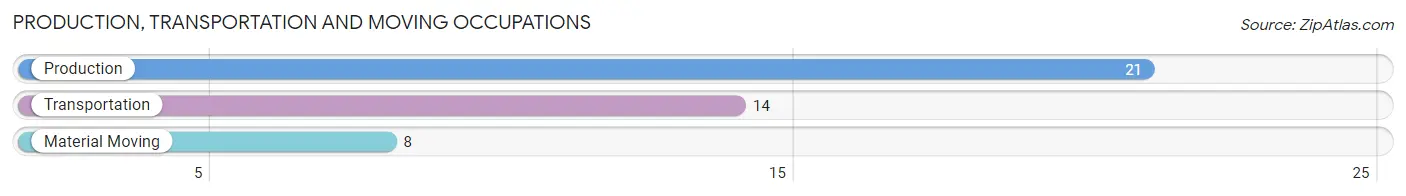
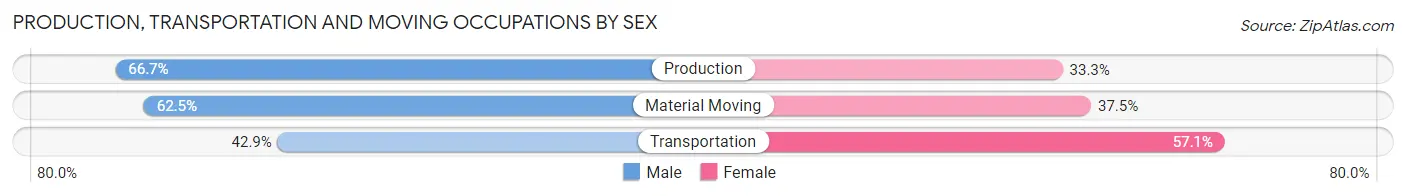
Production, Transportation and Moving Occupations
The most common Production, Transportation and Moving occupations in Lynch are Production (21 | 9.7%), Transportation (14 | 6.5%), and Material Moving (8 | 3.7%).
Production, Transportation and Moving Occupations by Sex
| Occupation | Male | Female |
| Production | 14 (66.7%) | 7 (33.3%) |
| Transportation | 6 (42.9%) | 8 (57.1%) |
| Material Moving | 5 (62.5%) | 3 (37.5%) |
| Total (Category) | 25 (58.1%) | 18 (41.9%) |
| Total (Overall) | 78 (35.9%) | 139 (64.1%) |
Employment Industries by Sex in Lynch
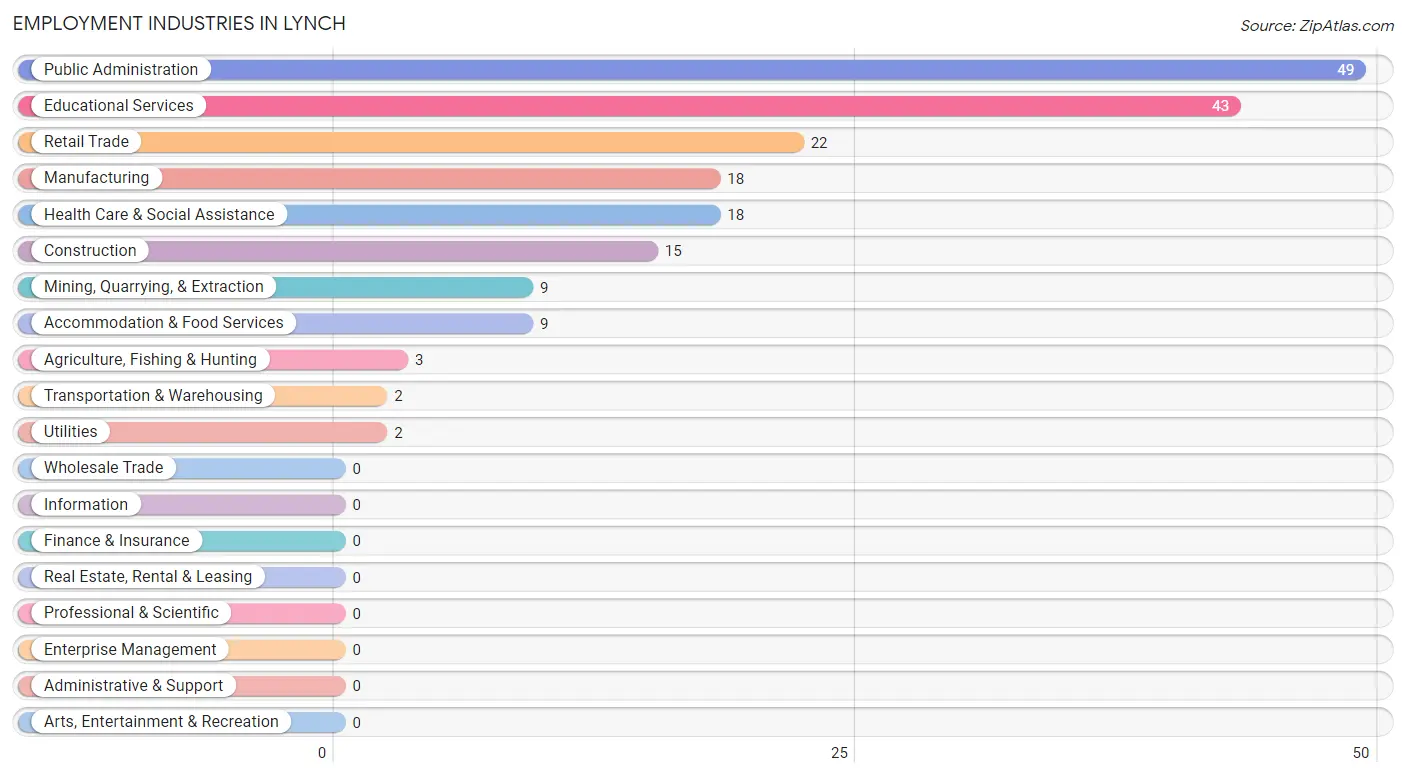
Employment Industries in Lynch
The major employment industries in Lynch include Public Administration (49 | 22.6%), Educational Services (43 | 19.8%), Retail Trade (22 | 10.1%), Manufacturing (18 | 8.3%), and Health Care & Social Assistance (18 | 8.3%).
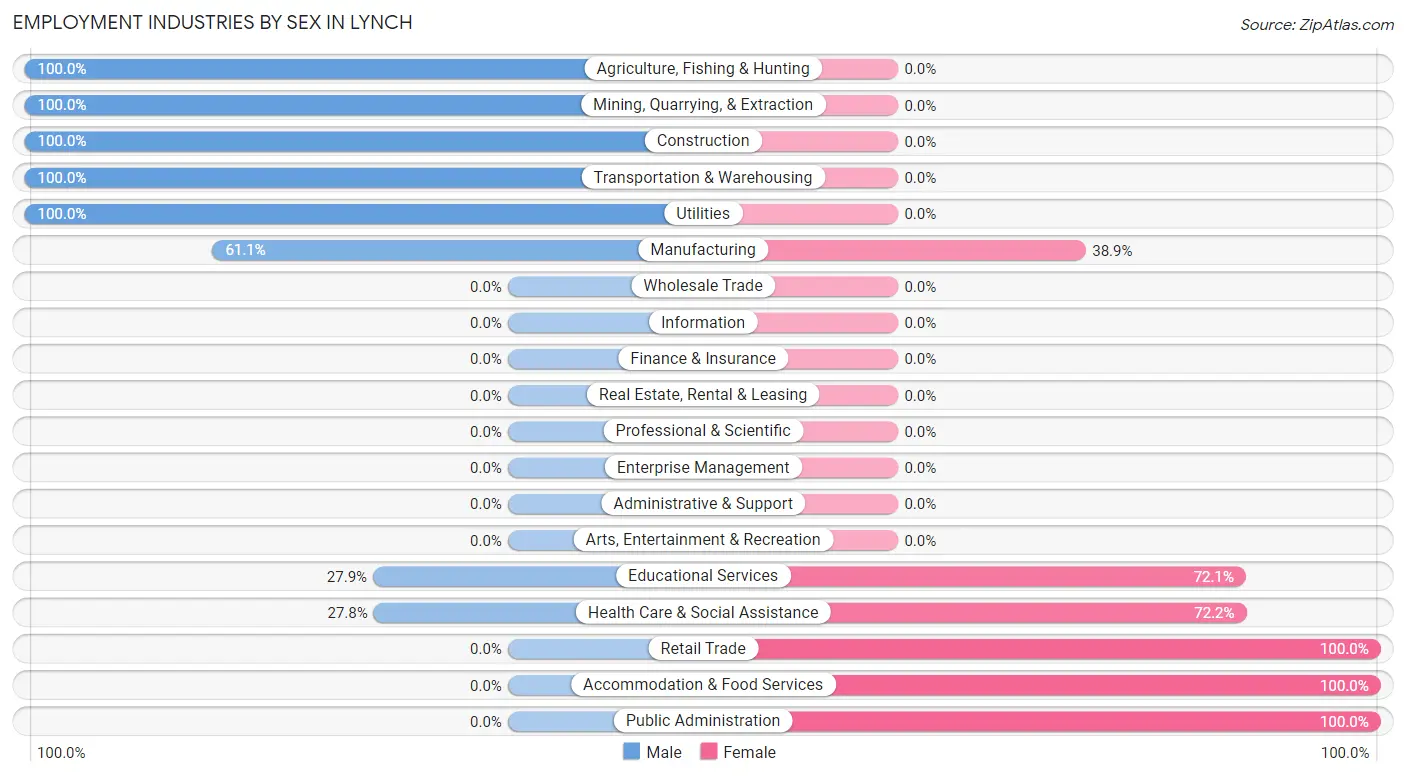
Employment Industries by Sex in Lynch
The Lynch industries that see more men than women are Agriculture, Fishing & Hunting (100.0%), Mining, Quarrying, & Extraction (100.0%), and Construction (100.0%), whereas the industries that tend to have a higher number of women are Retail Trade (100.0%), Accommodation & Food Services (100.0%), and Public Administration (100.0%).
| Industry | Male | Female |
| Agriculture, Fishing & Hunting | 3 (100.0%) | 0 (0.0%) |
| Mining, Quarrying, & Extraction | 9 (100.0%) | 0 (0.0%) |
| Construction | 15 (100.0%) | 0 (0.0%) |
| Manufacturing | 11 (61.1%) | 7 (38.9%) |
| Wholesale Trade | 0 (0.0%) | 0 (0.0%) |
| Retail Trade | 0 (0.0%) | 22 (100.0%) |
| Transportation & Warehousing | 2 (100.0%) | 0 (0.0%) |
| Utilities | 2 (100.0%) | 0 (0.0%) |
| Information | 0 (0.0%) | 0 (0.0%) |
| Finance & Insurance | 0 (0.0%) | 0 (0.0%) |
| Real Estate, Rental & Leasing | 0 (0.0%) | 0 (0.0%) |
| Professional & Scientific | 0 (0.0%) | 0 (0.0%) |
| Enterprise Management | 0 (0.0%) | 0 (0.0%) |
| Administrative & Support | 0 (0.0%) | 0 (0.0%) |
| Educational Services | 12 (27.9%) | 31 (72.1%) |
| Health Care & Social Assistance | 5 (27.8%) | 13 (72.2%) |
| Arts, Entertainment & Recreation | 0 (0.0%) | 0 (0.0%) |
| Accommodation & Food Services | 0 (0.0%) | 9 (100.0%) |
| Public Administration | 0 (0.0%) | 49 (100.0%) |
| Total | 78 (35.9%) | 139 (64.1%) |
Education in Lynch
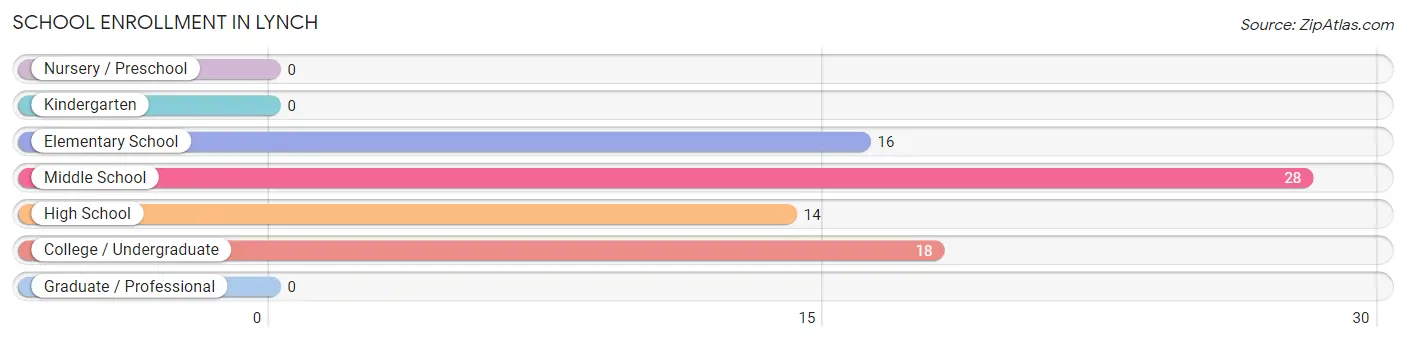
School Enrollment in Lynch
The most common levels of schooling among the 76 students in Lynch are middle school (28 | 36.8%), college / undergraduate (18 | 23.7%), and elementary school (16 | 21.0%).
| School Level | # Students | % Students |
| Nursery / Preschool | 0 | 0.0% |
| Kindergarten | 0 | 0.0% |
| Elementary School | 16 | 21.0% |
| Middle School | 28 | 36.8% |
| High School | 14 | 18.4% |
| College / Undergraduate | 18 | 23.7% |
| Graduate / Professional | 0 | 0.0% |
| Total | 76 | 100.0% |
School Enrollment by Age by Funding Source in Lynch
Out of a total of 76 students who are enrolled in schools in Lynch, 9 (11.8%) attend a private institution, while the remaining 67 (88.2%) are enrolled in public schools. The age group of 35 years and over has the highest likelihood of being enrolled in private schools, with 4 (44.4% in the age bracket) enrolled. Conversely, the age group of 15 to 17 year olds has the lowest likelihood of being enrolled in a private school, with 10 (100.0% in the age bracket) attending a public institution.
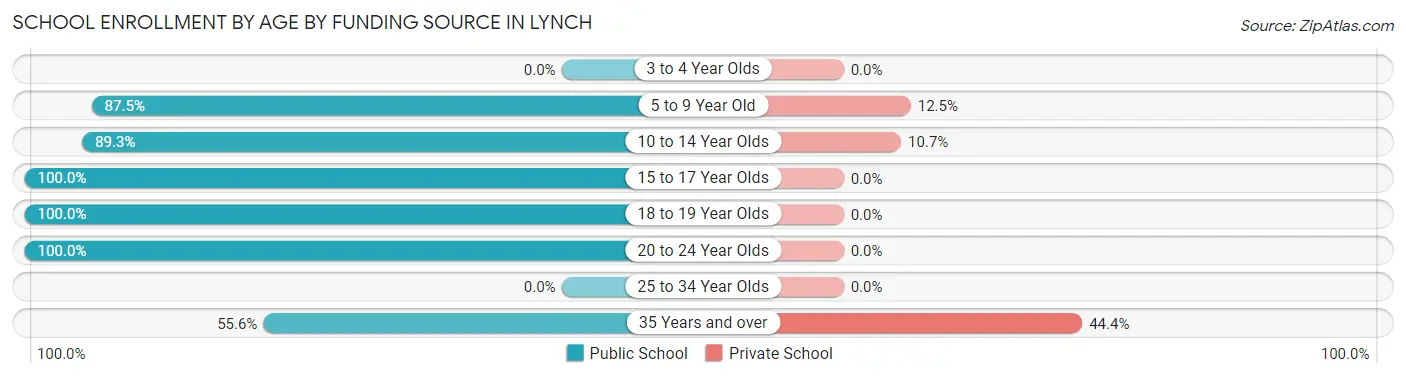
| Age Bracket | Public School | Private School |
| 3 to 4 Year Olds | 0 (0.0%) | 0 (0.0%) |
| 5 to 9 Year Old | 14 (87.5%) | 2 (12.5%) |
| 10 to 14 Year Olds | 25 (89.3%) | 3 (10.7%) |
| 15 to 17 Year Olds | 10 (100.0%) | 0 (0.0%) |
| 18 to 19 Year Olds | 6 (100.0%) | 0 (0.0%) |
| 20 to 24 Year Olds | 7 (100.0%) | 0 (0.0%) |
| 25 to 34 Year Olds | 0 (0.0%) | 0 (0.0%) |
| 35 Years and over | 5 (55.6%) | 4 (44.4%) |
| Total | 67 (88.2%) | 9 (11.8%) |
Educational Attainment by Field of Study in Lynch
Psychology (49 | 49.0%), education (19 | 19.0%), liberal arts & history (11 | 11.0%), computers & mathematics (7 | 7.0%), and science & technology (7 | 7.0%) are the most common fields of study among 100 individuals in Lynch who have obtained a bachelor's degree or higher.
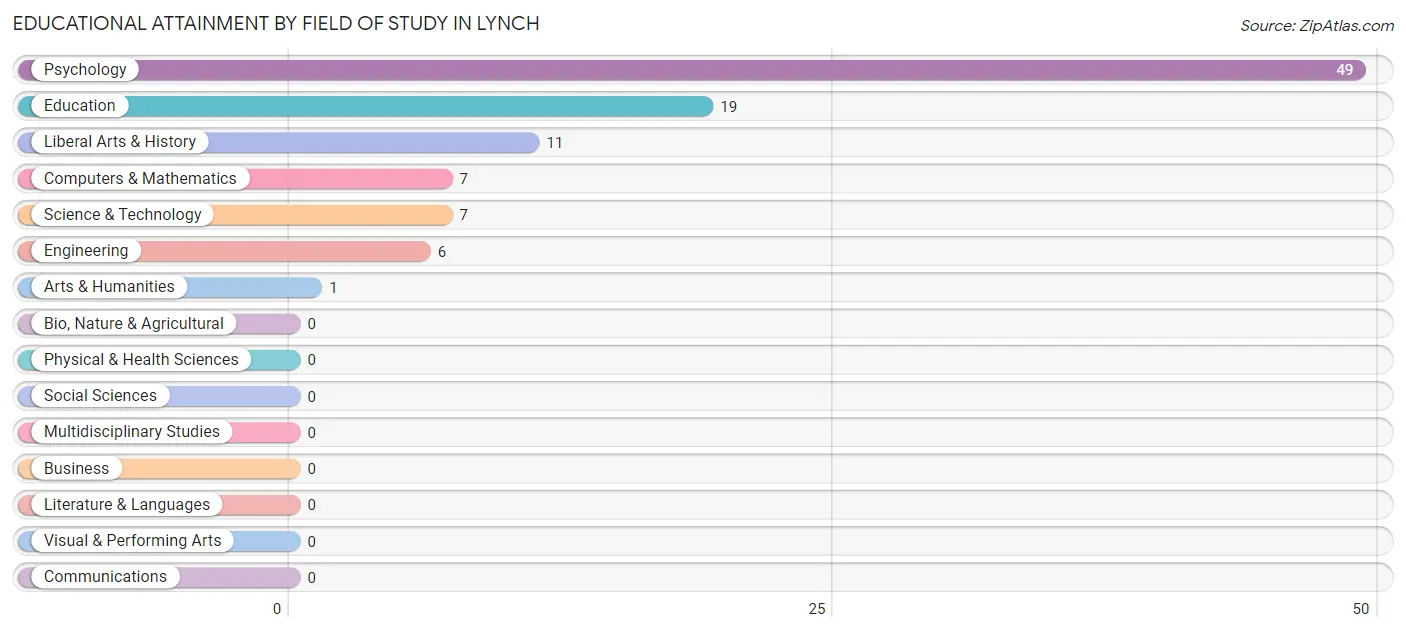
| Field of Study | # Graduates | % Graduates |
| Computers & Mathematics | 7 | 7.0% |
| Bio, Nature & Agricultural | 0 | 0.0% |
| Physical & Health Sciences | 0 | 0.0% |
| Psychology | 49 | 49.0% |
| Social Sciences | 0 | 0.0% |
| Engineering | 6 | 6.0% |
| Multidisciplinary Studies | 0 | 0.0% |
| Science & Technology | 7 | 7.0% |
| Business | 0 | 0.0% |
| Education | 19 | 19.0% |
| Literature & Languages | 0 | 0.0% |
| Liberal Arts & History | 11 | 11.0% |
| Visual & Performing Arts | 0 | 0.0% |
| Communications | 0 | 0.0% |
| Arts & Humanities | 1 | 1.0% |
| Total | 100 | 100.0% |
Transportation & Commute in Lynch
Vehicle Availability by Sex in Lynch
The most prevalent vehicle ownership categories in Lynch are males with 2 vehicles (47, accounting for 60.3%) and females with 2 vehicles (34, making up 33.8%).
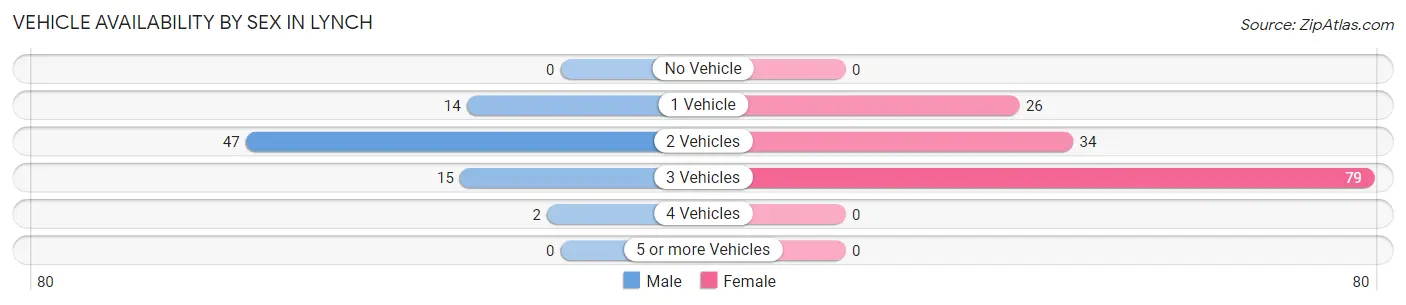
| Vehicles Available | Male | Female |
| No Vehicle | 0 (0.0%) | 0 (0.0%) |
| 1 Vehicle | 14 (17.9%) | 26 (18.7%) |
| 2 Vehicles | 47 (60.3%) | 34 (24.5%) |
| 3 Vehicles | 15 (19.2%) | 79 (56.8%) |
| 4 Vehicles | 2 (2.6%) | 0 (0.0%) |
| 5 or more Vehicles | 0 (0.0%) | 0 (0.0%) |
| Total | 78 (100.0%) | 139 (100.0%) |
Commute Time in Lynch
The most frequently occuring commute durations in Lynch are 60 to 89 minutes (52 commuters, 24.3%), 10 to 14 minutes (35 commuters, 16.4%), and 15 to 19 minutes (28 commuters, 13.1%).
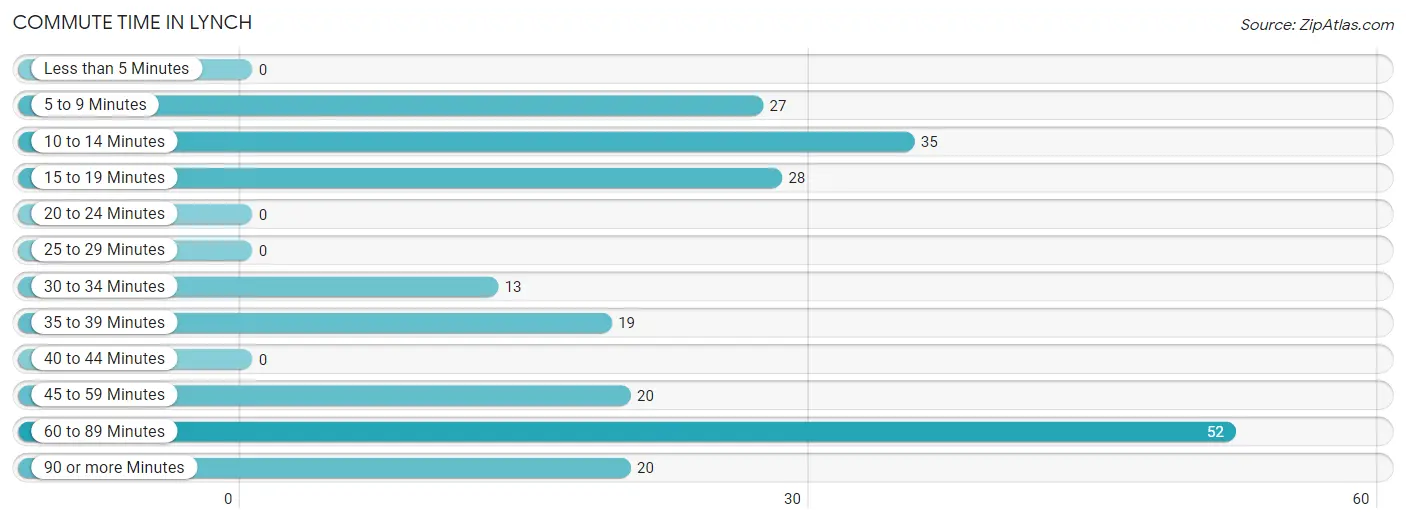
| Commute Time | # Commuters | % Commuters |
| Less than 5 Minutes | 0 | 0.0% |
| 5 to 9 Minutes | 27 | 12.6% |
| 10 to 14 Minutes | 35 | 16.4% |
| 15 to 19 Minutes | 28 | 13.1% |
| 20 to 24 Minutes | 0 | 0.0% |
| 25 to 29 Minutes | 0 | 0.0% |
| 30 to 34 Minutes | 13 | 6.1% |
| 35 to 39 Minutes | 19 | 8.9% |
| 40 to 44 Minutes | 0 | 0.0% |
| 45 to 59 Minutes | 20 | 9.3% |
| 60 to 89 Minutes | 52 | 24.3% |
| 90 or more Minutes | 20 | 9.3% |
Commute Time by Sex in Lynch
The most common commute times in Lynch are 90 or more minutes (20 commuters, 25.6%) for males and 60 to 89 minutes (49 commuters, 36.0%) for females.
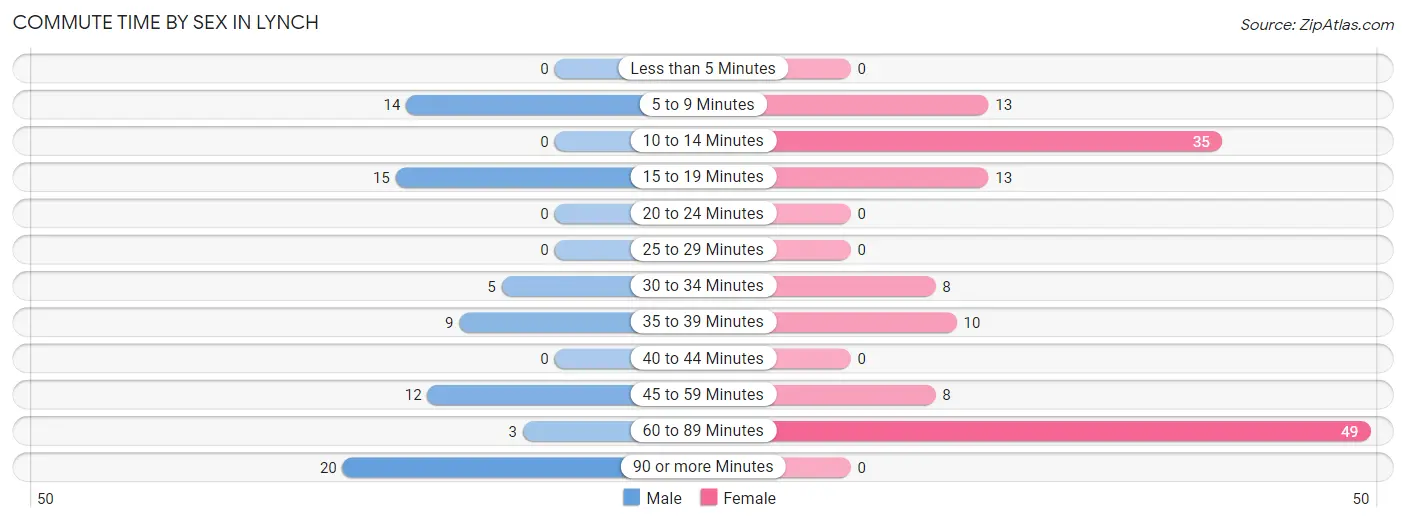
| Commute Time | Male | Female |
| Less than 5 Minutes | 0 (0.0%) | 0 (0.0%) |
| 5 to 9 Minutes | 14 (17.9%) | 13 (9.6%) |
| 10 to 14 Minutes | 0 (0.0%) | 35 (25.7%) |
| 15 to 19 Minutes | 15 (19.2%) | 13 (9.6%) |
| 20 to 24 Minutes | 0 (0.0%) | 0 (0.0%) |
| 25 to 29 Minutes | 0 (0.0%) | 0 (0.0%) |
| 30 to 34 Minutes | 5 (6.4%) | 8 (5.9%) |
| 35 to 39 Minutes | 9 (11.5%) | 10 (7.3%) |
| 40 to 44 Minutes | 0 (0.0%) | 0 (0.0%) |
| 45 to 59 Minutes | 12 (15.4%) | 8 (5.9%) |
| 60 to 89 Minutes | 3 (3.8%) | 49 (36.0%) |
| 90 or more Minutes | 20 (25.6%) | 0 (0.0%) |
Time of Departure to Work by Sex in Lynch
The most frequent times of departure to work in Lynch are 12:00 PM to 3:59 PM (20, 25.6%) for males and 5:00 AM to 5:29 AM (55, 40.4%) for females.
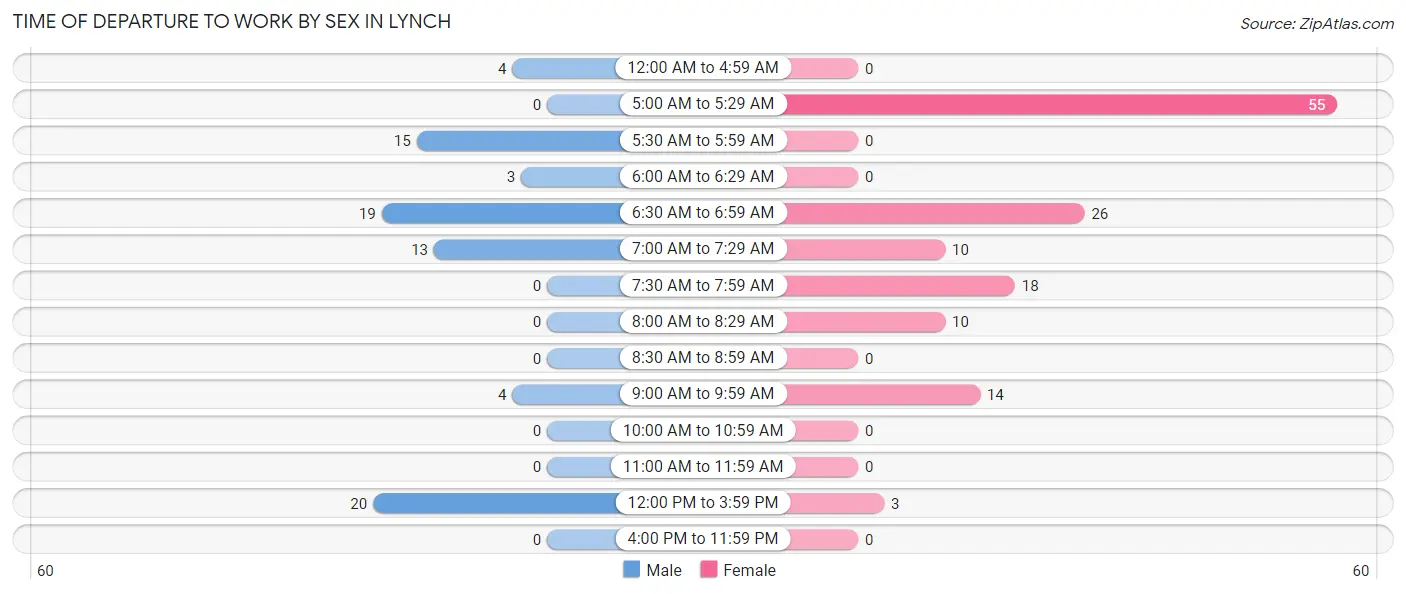
| Time of Departure | Male | Female |
| 12:00 AM to 4:59 AM | 4 (5.1%) | 0 (0.0%) |
| 5:00 AM to 5:29 AM | 0 (0.0%) | 55 (40.4%) |
| 5:30 AM to 5:59 AM | 15 (19.2%) | 0 (0.0%) |
| 6:00 AM to 6:29 AM | 3 (3.8%) | 0 (0.0%) |
| 6:30 AM to 6:59 AM | 19 (24.4%) | 26 (19.1%) |
| 7:00 AM to 7:29 AM | 13 (16.7%) | 10 (7.3%) |
| 7:30 AM to 7:59 AM | 0 (0.0%) | 18 (13.2%) |
| 8:00 AM to 8:29 AM | 0 (0.0%) | 10 (7.3%) |
| 8:30 AM to 8:59 AM | 0 (0.0%) | 0 (0.0%) |
| 9:00 AM to 9:59 AM | 4 (5.1%) | 14 (10.3%) |
| 10:00 AM to 10:59 AM | 0 (0.0%) | 0 (0.0%) |
| 11:00 AM to 11:59 AM | 0 (0.0%) | 0 (0.0%) |
| 12:00 PM to 3:59 PM | 20 (25.6%) | 3 (2.2%) |
| 4:00 PM to 11:59 PM | 0 (0.0%) | 0 (0.0%) |
| Total | 78 (100.0%) | 136 (100.0%) |
Housing Occupancy in Lynch
Occupancy by Ownership in Lynch
Of the total 289 dwellings in Lynch, owner-occupied units account for 203 (70.2%), while renter-occupied units make up 86 (29.8%).
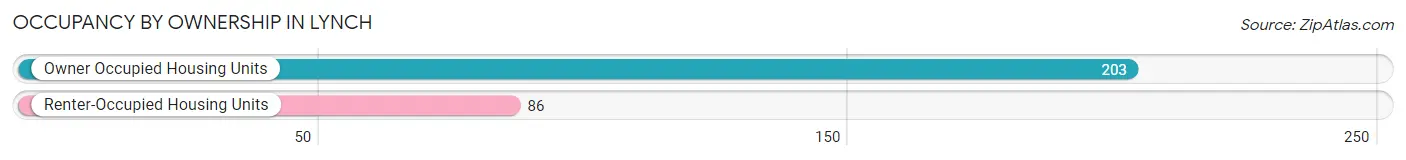
| Occupancy | # Housing Units | % Housing Units |
| Owner Occupied Housing Units | 203 | 70.2% |
| Renter-Occupied Housing Units | 86 | 29.8% |
| Total Occupied Housing Units | 289 | 100.0% |
Occupancy by Household Size in Lynch
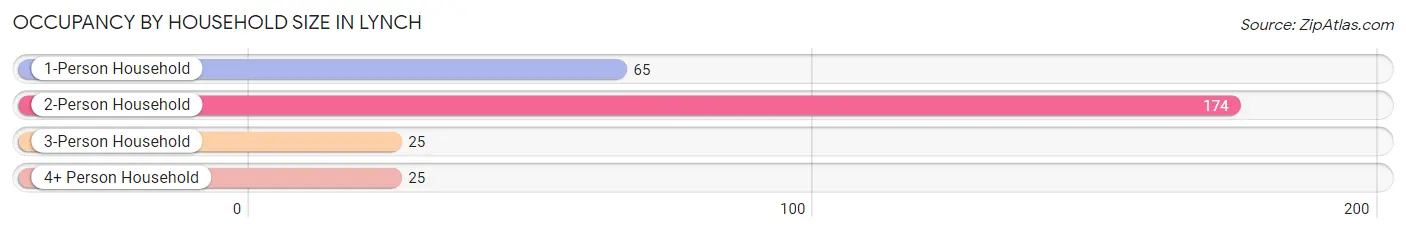
| Household Size | # Housing Units | % Housing Units |
| 1-Person Household | 65 | 22.5% |
| 2-Person Household | 174 | 60.2% |
| 3-Person Household | 25 | 8.6% |
| 4+ Person Household | 25 | 8.6% |
| Total Housing Units | 289 | 100.0% |
Occupancy by Ownership by Household Size in Lynch
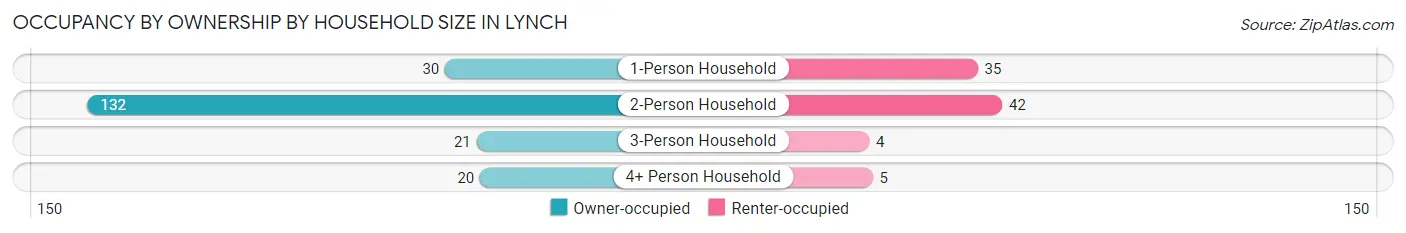
| Household Size | Owner-occupied | Renter-occupied |
| 1-Person Household | 30 (46.2%) | 35 (53.8%) |
| 2-Person Household | 132 (75.9%) | 42 (24.1%) |
| 3-Person Household | 21 (84.0%) | 4 (16.0%) |
| 4+ Person Household | 20 (80.0%) | 5 (20.0%) |
| Total Housing Units | 203 (70.2%) | 86 (29.8%) |
Occupancy by Educational Attainment in Lynch
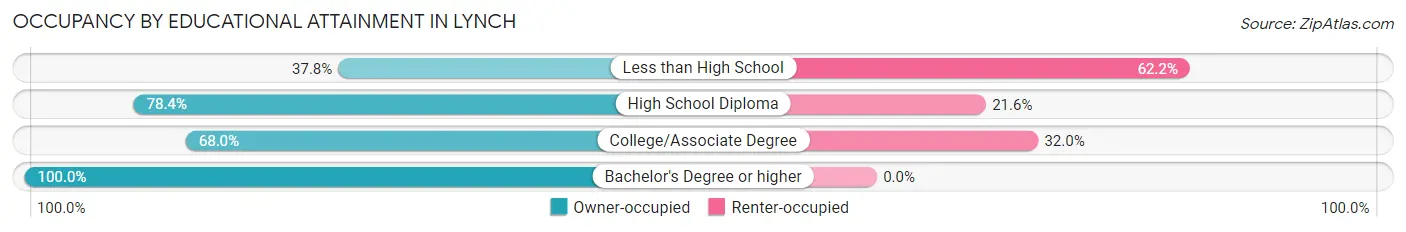
| Household Size | Owner-occupied | Renter-occupied |
| Less than High School | 14 (37.8%) | 23 (62.2%) |
| High School Diploma | 29 (78.4%) | 8 (21.6%) |
| College/Associate Degree | 117 (68.0%) | 55 (32.0%) |
| Bachelor's Degree or higher | 43 (100.0%) | 0 (0.0%) |
Occupancy by Age of Householder in Lynch
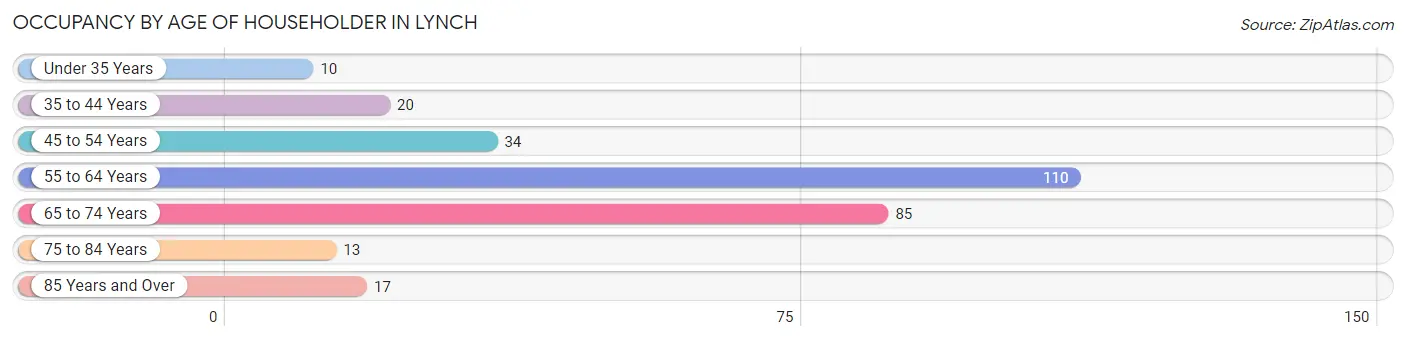
| Age Bracket | # Households | % Households |
| Under 35 Years | 10 | 3.5% |
| 35 to 44 Years | 20 | 6.9% |
| 45 to 54 Years | 34 | 11.8% |
| 55 to 64 Years | 110 | 38.1% |
| 65 to 74 Years | 85 | 29.4% |
| 75 to 84 Years | 13 | 4.5% |
| 85 Years and Over | 17 | 5.9% |
| Total | 289 | 100.0% |
Housing Finances in Lynch
Median Income by Occupancy in Lynch
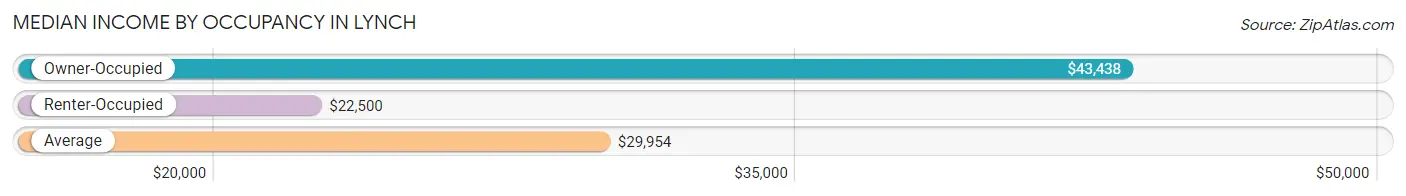
| Occupancy Type | # Households | Median Income |
| Owner-Occupied | 203 (70.2%) | $43,438 |
| Renter-Occupied | 86 (29.8%) | $22,500 |
| Average | 289 (100.0%) | $29,954 |
Occupancy by Householder Income Bracket in Lynch
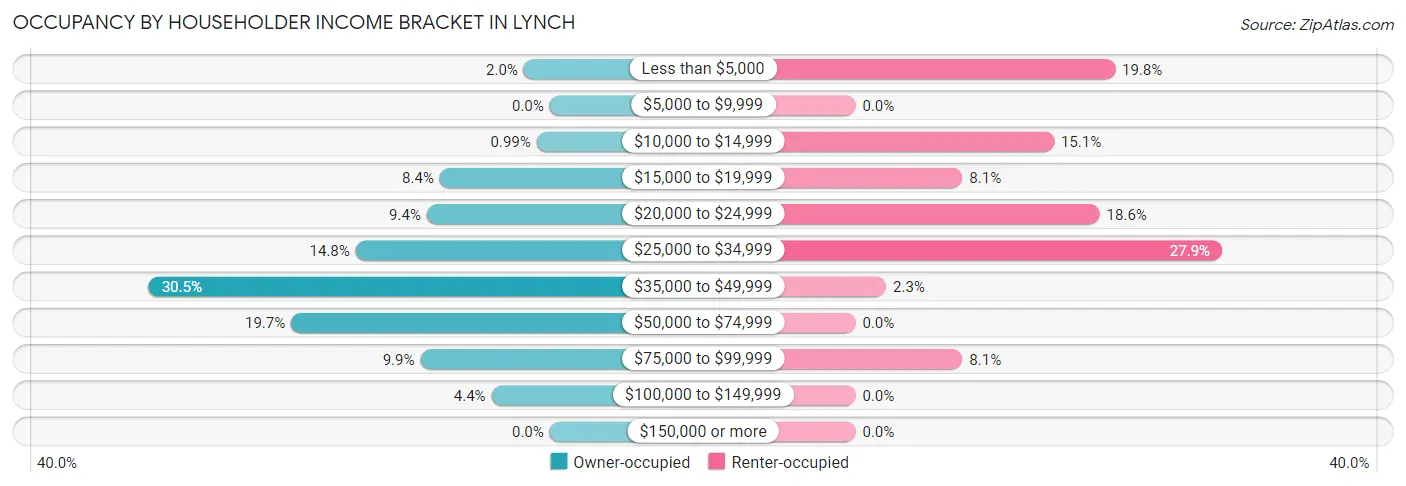
| Income Bracket | Owner-occupied | Renter-occupied |
| Less than $5,000 | 4 (2.0%) | 17 (19.8%) |
| $5,000 to $9,999 | 0 (0.0%) | 0 (0.0%) |
| $10,000 to $14,999 | 2 (1.0%) | 13 (15.1%) |
| $15,000 to $19,999 | 17 (8.4%) | 7 (8.1%) |
| $20,000 to $24,999 | 19 (9.4%) | 16 (18.6%) |
| $25,000 to $34,999 | 30 (14.8%) | 24 (27.9%) |
| $35,000 to $49,999 | 62 (30.5%) | 2 (2.3%) |
| $50,000 to $74,999 | 40 (19.7%) | 0 (0.0%) |
| $75,000 to $99,999 | 20 (9.9%) | 7 (8.1%) |
| $100,000 to $149,999 | 9 (4.4%) | 0 (0.0%) |
| $150,000 or more | 0 (0.0%) | 0 (0.0%) |
| Total | 203 (100.0%) | 86 (100.0%) |
Monthly Housing Cost Tiers in Lynch
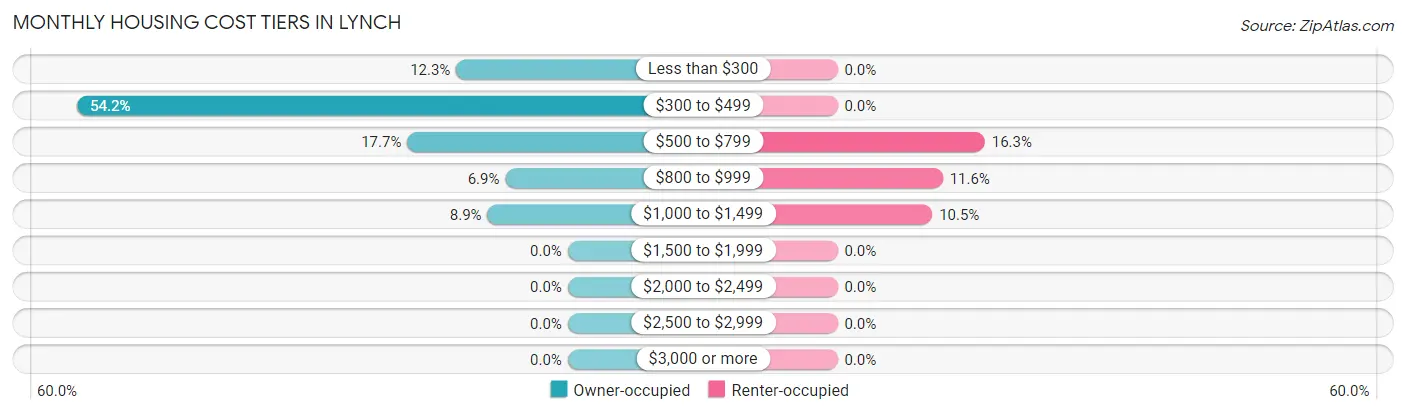
| Monthly Cost | Owner-occupied | Renter-occupied |
| Less than $300 | 25 (12.3%) | 0 (0.0%) |
| $300 to $499 | 110 (54.2%) | 0 (0.0%) |
| $500 to $799 | 36 (17.7%) | 14 (16.3%) |
| $800 to $999 | 14 (6.9%) | 10 (11.6%) |
| $1,000 to $1,499 | 18 (8.9%) | 9 (10.5%) |
| $1,500 to $1,999 | 0 (0.0%) | 0 (0.0%) |
| $2,000 to $2,499 | 0 (0.0%) | 0 (0.0%) |
| $2,500 to $2,999 | 0 (0.0%) | 0 (0.0%) |
| $3,000 or more | 0 (0.0%) | 0 (0.0%) |
| Total | 203 (100.0%) | 86 (100.0%) |
Physical Housing Characteristics in Lynch
Housing Structures in Lynch
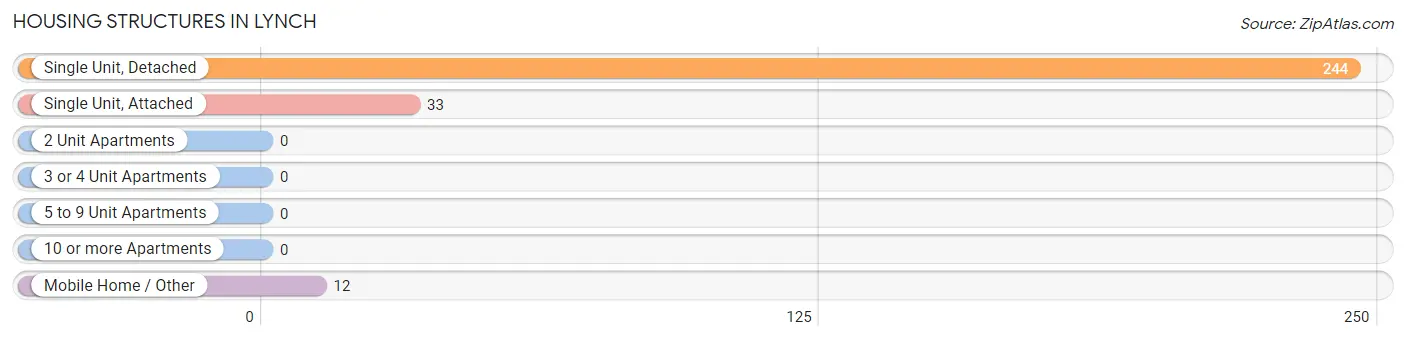
| Structure Type | # Housing Units | % Housing Units |
| Single Unit, Detached | 244 | 84.4% |
| Single Unit, Attached | 33 | 11.4% |
| 2 Unit Apartments | 0 | 0.0% |
| 3 or 4 Unit Apartments | 0 | 0.0% |
| 5 to 9 Unit Apartments | 0 | 0.0% |
| 10 or more Apartments | 0 | 0.0% |
| Mobile Home / Other | 12 | 4.2% |
| Total | 289 | 100.0% |
Housing Structures by Occupancy in Lynch
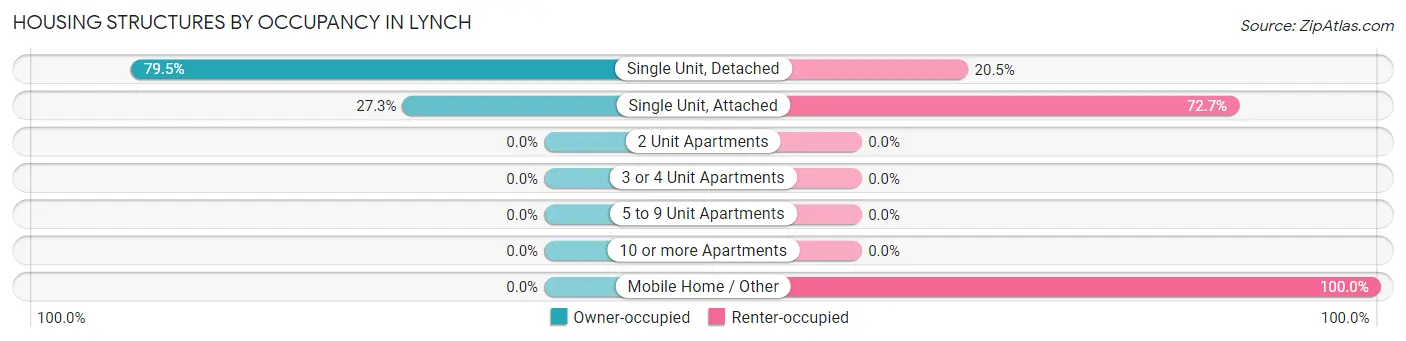
| Structure Type | Owner-occupied | Renter-occupied |
| Single Unit, Detached | 194 (79.5%) | 50 (20.5%) |
| Single Unit, Attached | 9 (27.3%) | 24 (72.7%) |
| 2 Unit Apartments | 0 (0.0%) | 0 (0.0%) |
| 3 or 4 Unit Apartments | 0 (0.0%) | 0 (0.0%) |
| 5 to 9 Unit Apartments | 0 (0.0%) | 0 (0.0%) |
| 10 or more Apartments | 0 (0.0%) | 0 (0.0%) |
| Mobile Home / Other | 0 (0.0%) | 12 (100.0%) |
| Total | 203 (70.2%) | 86 (29.8%) |
Housing Structures by Number of Rooms in Lynch
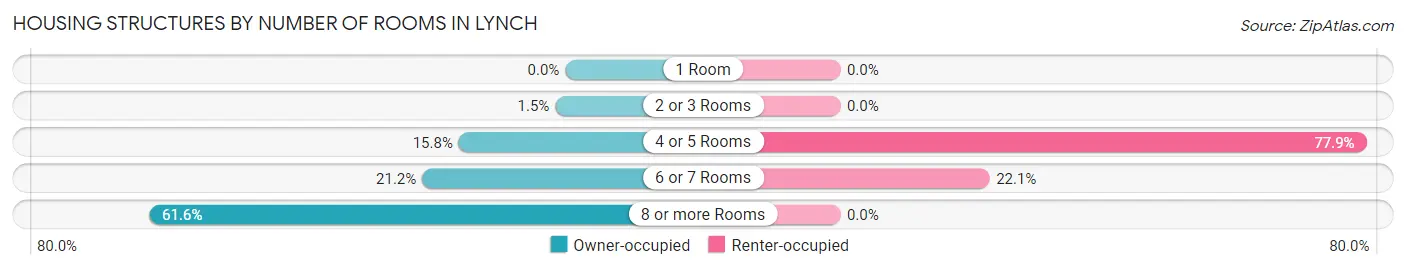
| Number of Rooms | Owner-occupied | Renter-occupied |
| 1 Room | 0 (0.0%) | 0 (0.0%) |
| 2 or 3 Rooms | 3 (1.5%) | 0 (0.0%) |
| 4 or 5 Rooms | 32 (15.8%) | 67 (77.9%) |
| 6 or 7 Rooms | 43 (21.2%) | 19 (22.1%) |
| 8 or more Rooms | 125 (61.6%) | 0 (0.0%) |
| Total | 203 (100.0%) | 86 (100.0%) |
Housing Structure by Heating Type in Lynch
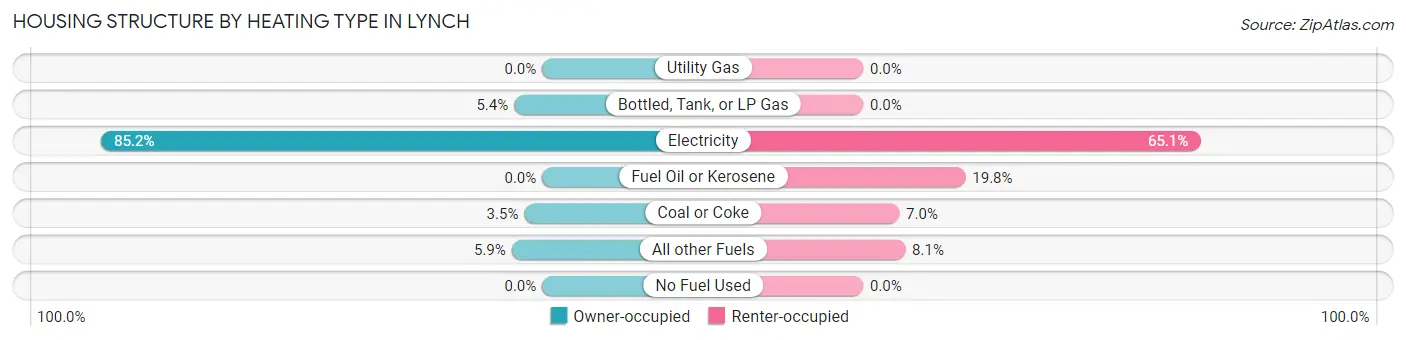
| Heating Type | Owner-occupied | Renter-occupied |
| Utility Gas | 0 (0.0%) | 0 (0.0%) |
| Bottled, Tank, or LP Gas | 11 (5.4%) | 0 (0.0%) |
| Electricity | 173 (85.2%) | 56 (65.1%) |
| Fuel Oil or Kerosene | 0 (0.0%) | 17 (19.8%) |
| Coal or Coke | 7 (3.5%) | 6 (7.0%) |
| All other Fuels | 12 (5.9%) | 7 (8.1%) |
| No Fuel Used | 0 (0.0%) | 0 (0.0%) |
| Total | 203 (100.0%) | 86 (100.0%) |
Household Vehicle Usage in Lynch
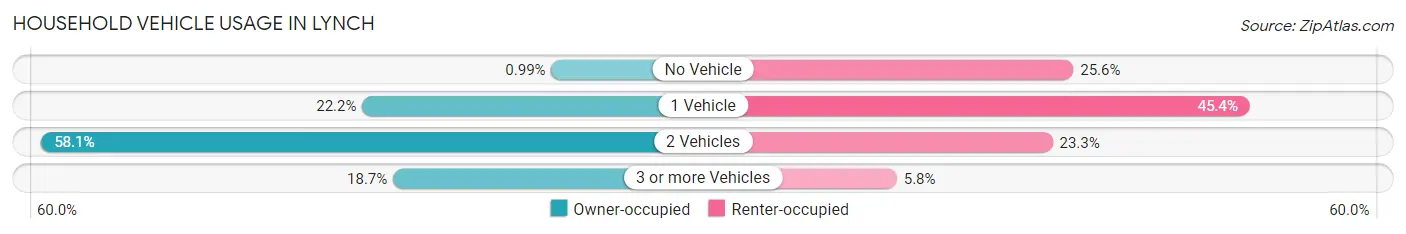
| Vehicles per Household | Owner-occupied | Renter-occupied |
| No Vehicle | 2 (1.0%) | 22 (25.6%) |
| 1 Vehicle | 45 (22.2%) | 39 (45.4%) |
| 2 Vehicles | 118 (58.1%) | 20 (23.3%) |
| 3 or more Vehicles | 38 (18.7%) | 5 (5.8%) |
| Total | 203 (100.0%) | 86 (100.0%) |
Real Estate & Mortgages in Lynch
Real Estate and Mortgage Overview in Lynch
| Characteristic | Without Mortgage | With Mortgage |
| Housing Units | 172 | 31 |
| Median Property Value | $53,400 | $82,100 |
| Median Household Income | $45,357 | $0 |
| Monthly Housing Costs | $409 | $0 |
| Real Estate Taxes | $586 | $0 |
Property Value by Mortgage Status in Lynch
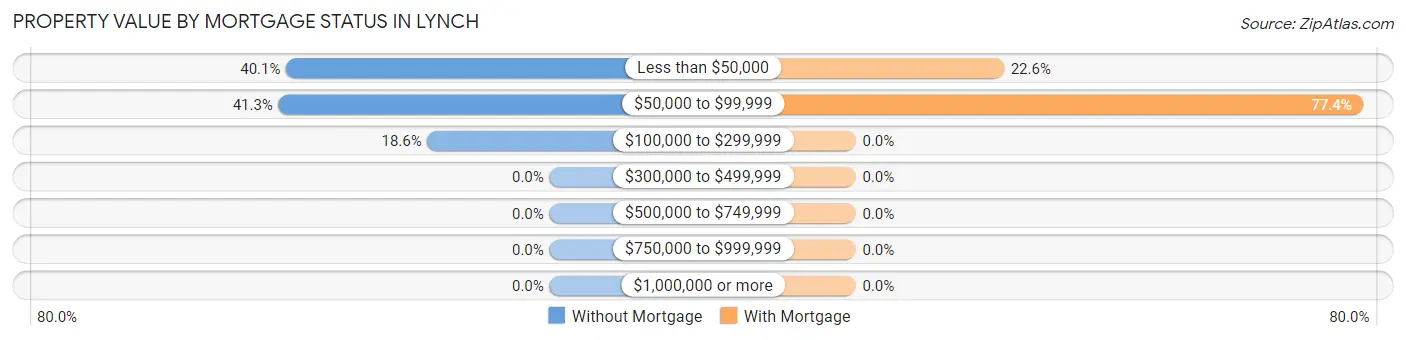
| Property Value | Without Mortgage | With Mortgage |
| Less than $50,000 | 69 (40.1%) | 7 (22.6%) |
| $50,000 to $99,999 | 71 (41.3%) | 24 (77.4%) |
| $100,000 to $299,999 | 32 (18.6%) | 0 (0.0%) |
| $300,000 to $499,999 | 0 (0.0%) | 0 (0.0%) |
| $500,000 to $749,999 | 0 (0.0%) | 0 (0.0%) |
| $750,000 to $999,999 | 0 (0.0%) | 0 (0.0%) |
| $1,000,000 or more | 0 (0.0%) | 0 (0.0%) |
| Total | 172 (100.0%) | 31 (100.0%) |
Household Income by Mortgage Status in Lynch
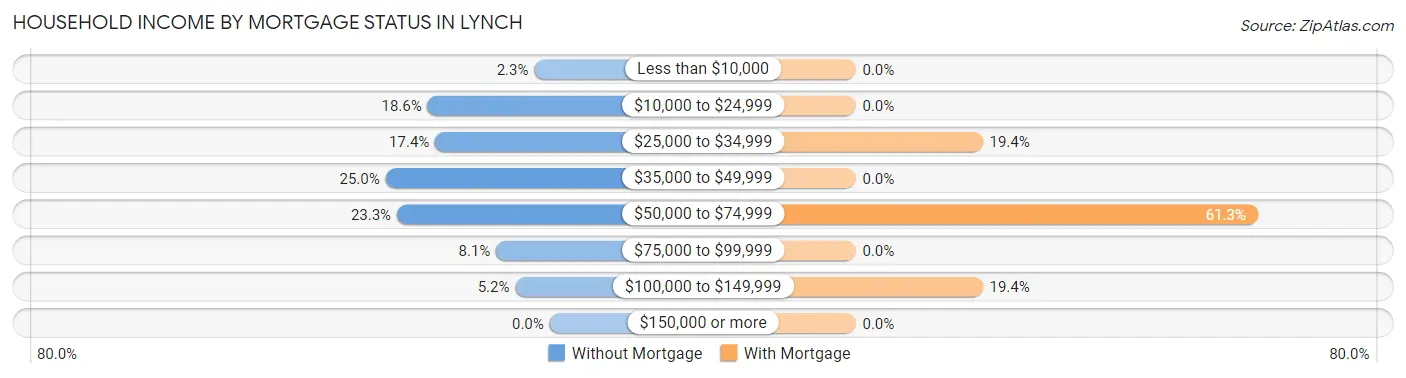
| Household Income | Without Mortgage | With Mortgage |
| Less than $10,000 | 4 (2.3%) | 0 (0.0%) |
| $10,000 to $24,999 | 32 (18.6%) | 0 (0.0%) |
| $25,000 to $34,999 | 30 (17.4%) | 6 (19.4%) |
| $35,000 to $49,999 | 43 (25.0%) | 0 (0.0%) |
| $50,000 to $74,999 | 40 (23.3%) | 19 (61.3%) |
| $75,000 to $99,999 | 14 (8.1%) | 0 (0.0%) |
| $100,000 to $149,999 | 9 (5.2%) | 6 (19.4%) |
| $150,000 or more | 0 (0.0%) | 0 (0.0%) |
| Total | 172 (100.0%) | 31 (100.0%) |
Property Value to Household Income Ratio in Lynch
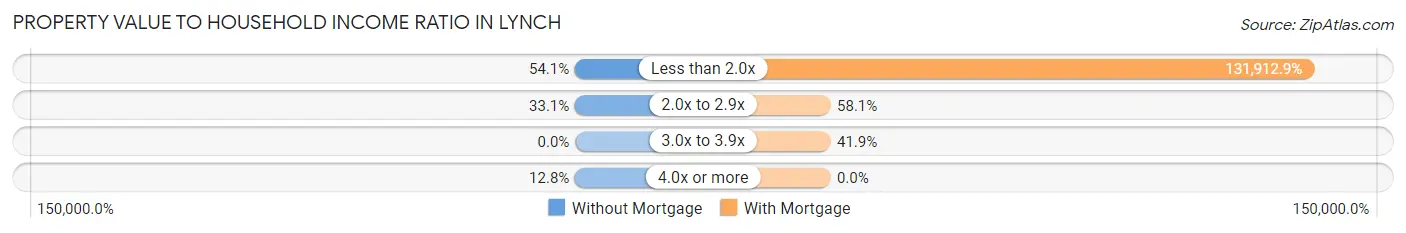
| Value-to-Income Ratio | Without Mortgage | With Mortgage |
| Less than 2.0x | 93 (54.1%) | 40,893 (131,912.9%) |
| 2.0x to 2.9x | 57 (33.1%) | 18 (58.1%) |
| 3.0x to 3.9x | 0 (0.0%) | 13 (41.9%) |
| 4.0x or more | 22 (12.8%) | 0 (0.0%) |
| Total | 172 (100.0%) | 31 (100.0%) |
Real Estate Taxes by Mortgage Status in Lynch
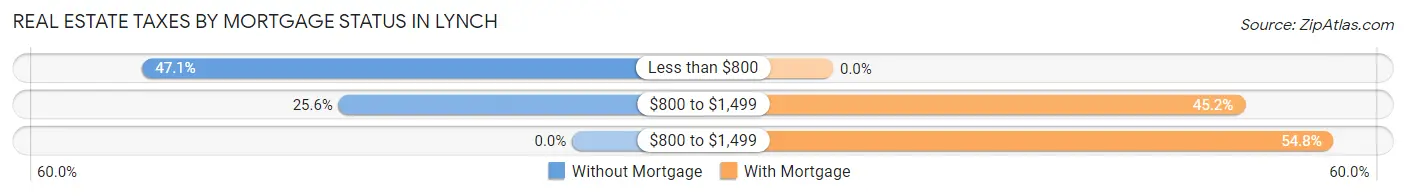
| Property Taxes | Without Mortgage | With Mortgage |
| Less than $800 | 81 (47.1%) | 0 (0.0%) |
| $800 to $1,499 | 44 (25.6%) | 14 (45.2%) |
| $800 to $1,499 | 0 (0.0%) | 17 (54.8%) |
| Total | 172 (100.0%) | 31 (100.0%) |
Health & Disability in Lynch
Health Insurance Coverage by Age in Lynch
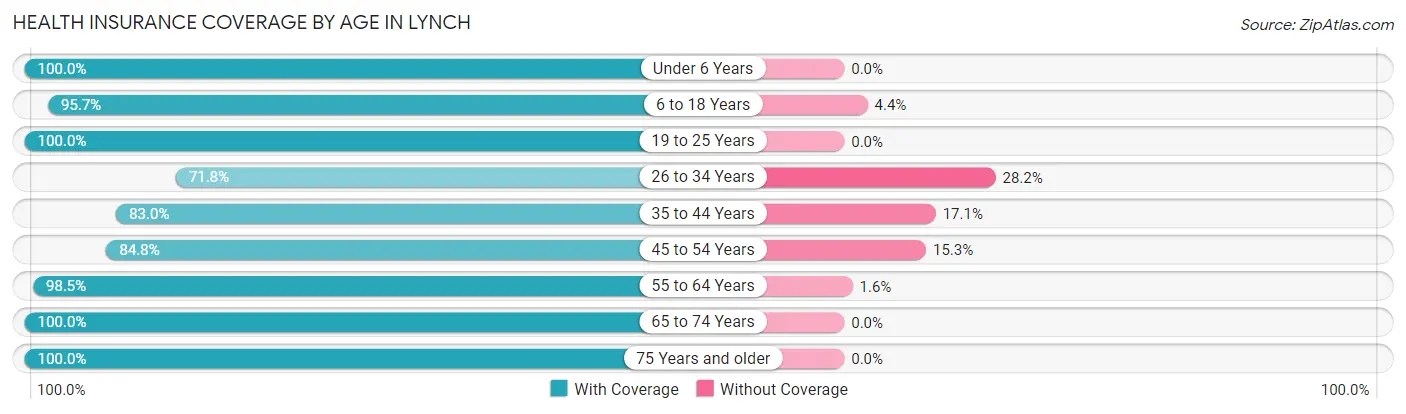
| Age Bracket | With Coverage | Without Coverage |
| Under 6 Years | 12 (100.0%) | 0 (0.0%) |
| 6 to 18 Years | 66 (95.7%) | 3 (4.3%) |
| 19 to 25 Years | 30 (100.0%) | 0 (0.0%) |
| 26 to 34 Years | 28 (71.8%) | 11 (28.2%) |
| 35 to 44 Years | 73 (83.0%) | 15 (17.1%) |
| 45 to 54 Years | 50 (84.8%) | 9 (15.2%) |
| 55 to 64 Years | 190 (98.5%) | 3 (1.5%) |
| 65 to 74 Years | 156 (100.0%) | 0 (0.0%) |
| 75 Years and older | 38 (100.0%) | 0 (0.0%) |
| Total | 643 (94.0%) | 41 (6.0%) |
Health Insurance Coverage by Citizenship Status in Lynch
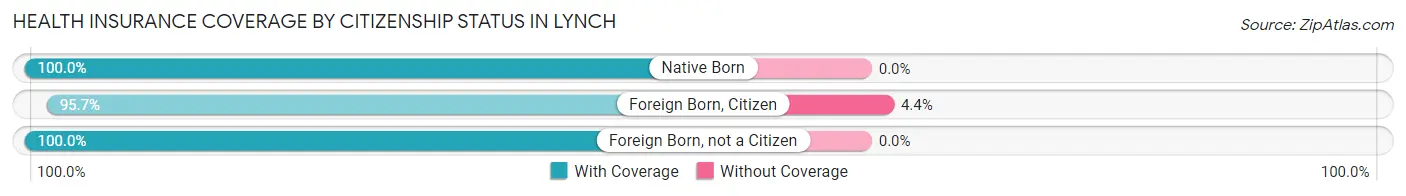
| Citizenship Status | With Coverage | Without Coverage |
| Native Born | 12 (100.0%) | 0 (0.0%) |
| Foreign Born, Citizen | 66 (95.7%) | 3 (4.3%) |
| Foreign Born, not a Citizen | 30 (100.0%) | 0 (0.0%) |
Health Insurance Coverage by Household Income in Lynch
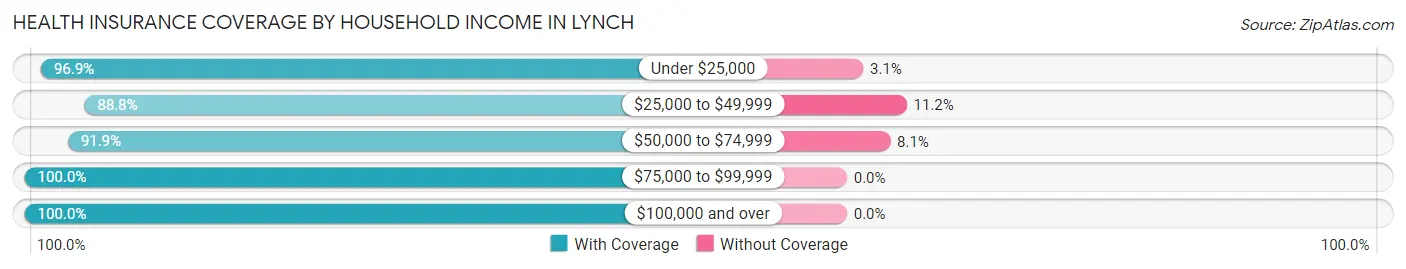
| Household Income | With Coverage | Without Coverage |
| Under $25,000 | 222 (96.9%) | 7 (3.1%) |
| $25,000 to $49,999 | 222 (88.8%) | 28 (11.2%) |
| $50,000 to $74,999 | 68 (91.9%) | 6 (8.1%) |
| $75,000 to $99,999 | 110 (100.0%) | 0 (0.0%) |
| $100,000 and over | 21 (100.0%) | 0 (0.0%) |
Public vs Private Health Insurance Coverage by Age in Lynch
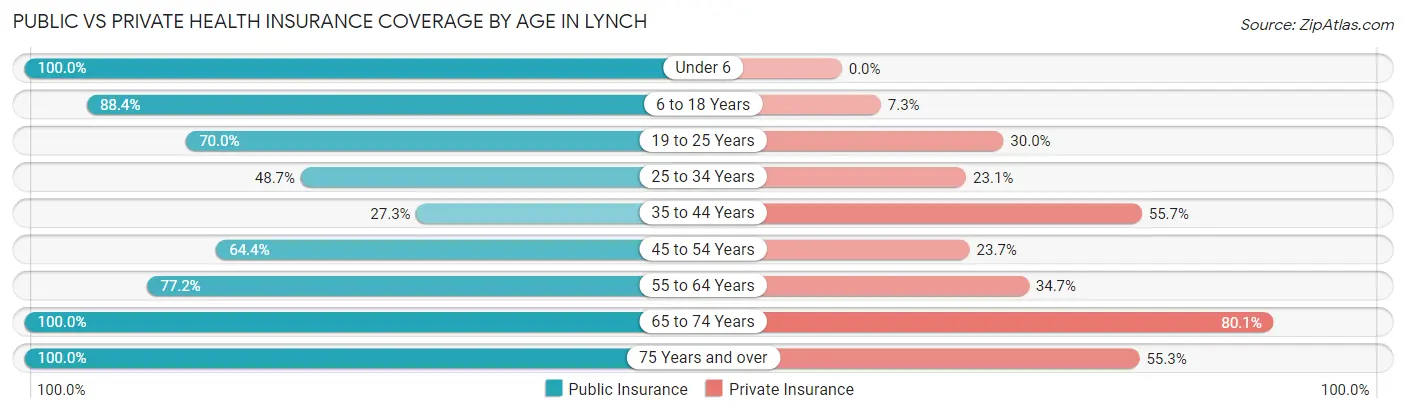
| Age Bracket | Public Insurance | Private Insurance |
| Under 6 | 12 (100.0%) | 0 (0.0%) |
| 6 to 18 Years | 61 (88.4%) | 5 (7.2%) |
| 19 to 25 Years | 21 (70.0%) | 9 (30.0%) |
| 25 to 34 Years | 19 (48.7%) | 9 (23.1%) |
| 35 to 44 Years | 24 (27.3%) | 49 (55.7%) |
| 45 to 54 Years | 38 (64.4%) | 14 (23.7%) |
| 55 to 64 Years | 149 (77.2%) | 67 (34.7%) |
| 65 to 74 Years | 156 (100.0%) | 125 (80.1%) |
| 75 Years and over | 38 (100.0%) | 21 (55.3%) |
| Total | 518 (75.7%) | 299 (43.7%) |
Disability Status by Sex by Age in Lynch
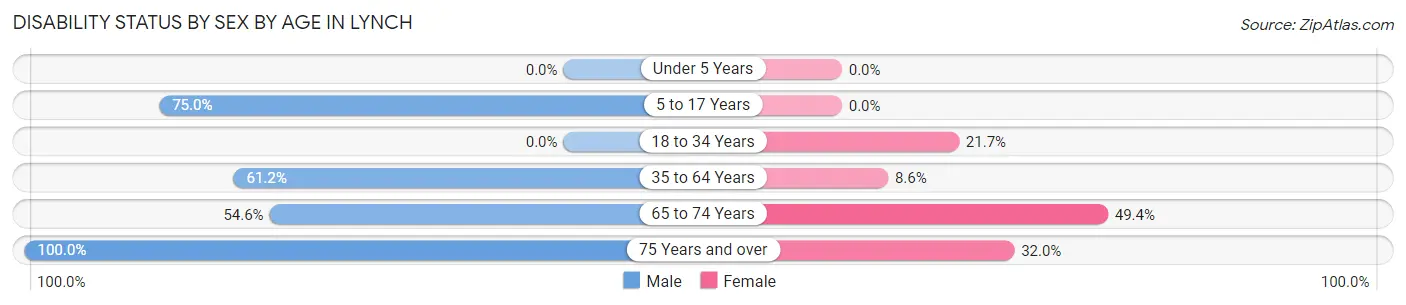
| Age Bracket | Male | Female |
| Under 5 Years | 0 (0.0%) | 0 (0.0%) |
| 5 to 17 Years | 6 (75.0%) | 0 (0.0%) |
| 18 to 34 Years | 0 (0.0%) | 10 (21.7%) |
| 35 to 64 Years | 101 (61.2%) | 15 (8.6%) |
| 65 to 74 Years | 42 (54.5%) | 39 (49.4%) |
| 75 Years and over | 13 (100.0%) | 8 (32.0%) |
Disability Class by Sex by Age in Lynch
Disability Class: Hearing Difficulty
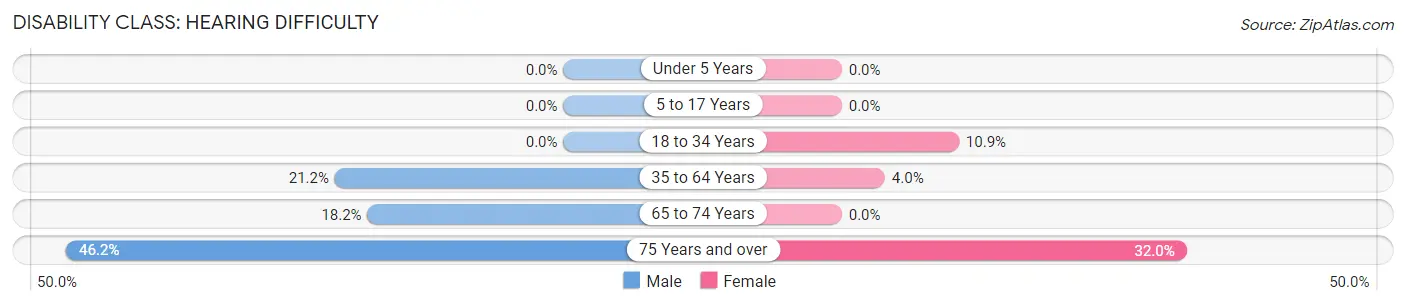
| Age Bracket | Male | Female |
| Under 5 Years | 0 (0.0%) | 0 (0.0%) |
| 5 to 17 Years | 0 (0.0%) | 0 (0.0%) |
| 18 to 34 Years | 0 (0.0%) | 5 (10.9%) |
| 35 to 64 Years | 35 (21.2%) | 7 (4.0%) |
| 65 to 74 Years | 14 (18.2%) | 0 (0.0%) |
| 75 Years and over | 6 (46.2%) | 8 (32.0%) |
Disability Class: Vision Difficulty
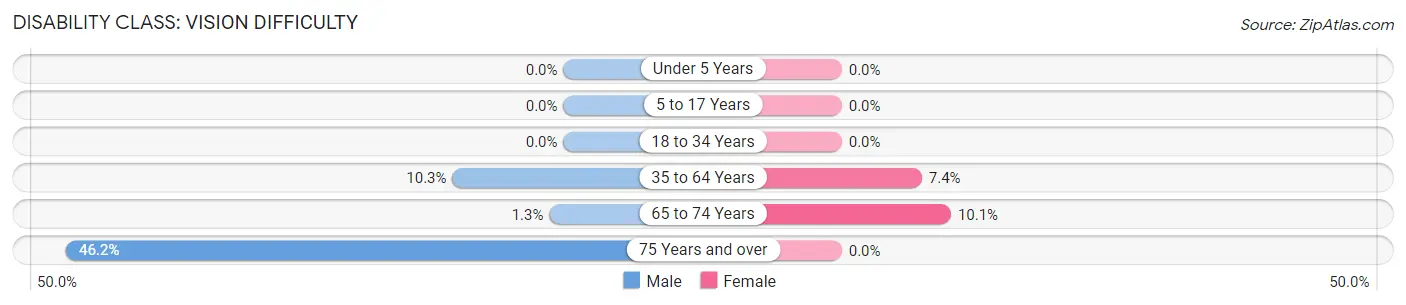
| Age Bracket | Male | Female |
| Under 5 Years | 0 (0.0%) | 0 (0.0%) |
| 5 to 17 Years | 0 (0.0%) | 0 (0.0%) |
| 18 to 34 Years | 0 (0.0%) | 0 (0.0%) |
| 35 to 64 Years | 17 (10.3%) | 13 (7.4%) |
| 65 to 74 Years | 1 (1.3%) | 8 (10.1%) |
| 75 Years and over | 6 (46.2%) | 0 (0.0%) |
Disability Class: Cognitive Difficulty
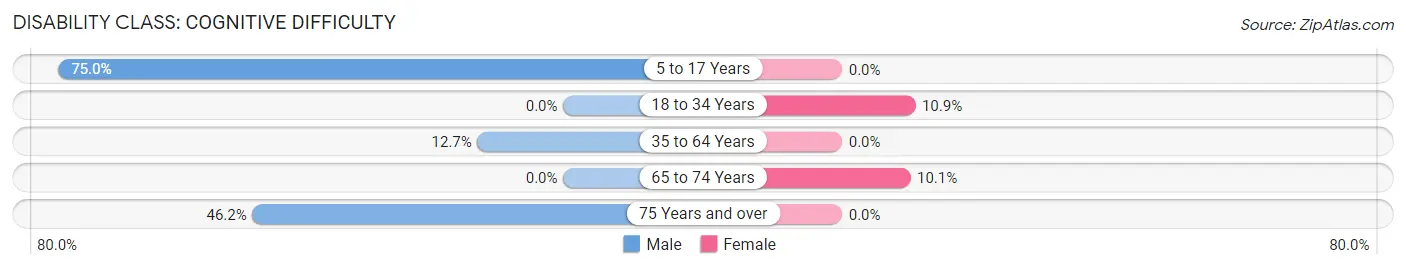
| Age Bracket | Male | Female |
| 5 to 17 Years | 6 (75.0%) | 0 (0.0%) |
| 18 to 34 Years | 0 (0.0%) | 5 (10.9%) |
| 35 to 64 Years | 21 (12.7%) | 0 (0.0%) |
| 65 to 74 Years | 0 (0.0%) | 8 (10.1%) |
| 75 Years and over | 6 (46.2%) | 0 (0.0%) |
Disability Class: Ambulatory Difficulty
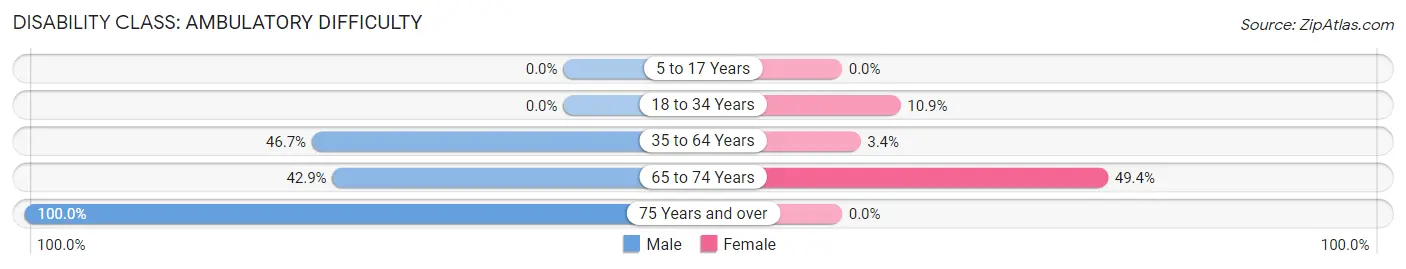
| Age Bracket | Male | Female |
| 5 to 17 Years | 0 (0.0%) | 0 (0.0%) |
| 18 to 34 Years | 0 (0.0%) | 5 (10.9%) |
| 35 to 64 Years | 77 (46.7%) | 6 (3.4%) |
| 65 to 74 Years | 33 (42.9%) | 39 (49.4%) |
| 75 Years and over | 13 (100.0%) | 0 (0.0%) |
Disability Class: Self-Care Difficulty
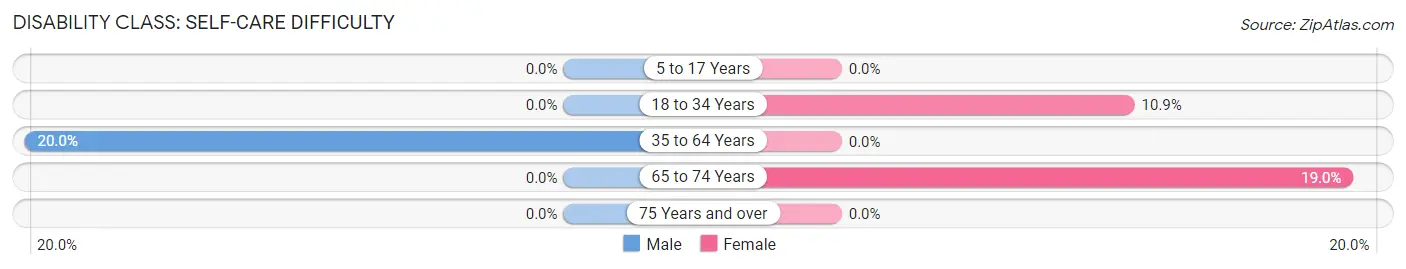
| Age Bracket | Male | Female |
| 5 to 17 Years | 0 (0.0%) | 0 (0.0%) |
| 18 to 34 Years | 0 (0.0%) | 5 (10.9%) |
| 35 to 64 Years | 33 (20.0%) | 0 (0.0%) |
| 65 to 74 Years | 0 (0.0%) | 15 (19.0%) |
| 75 Years and over | 0 (0.0%) | 0 (0.0%) |
Technology Access in Lynch
Computing Device Access in Lynch
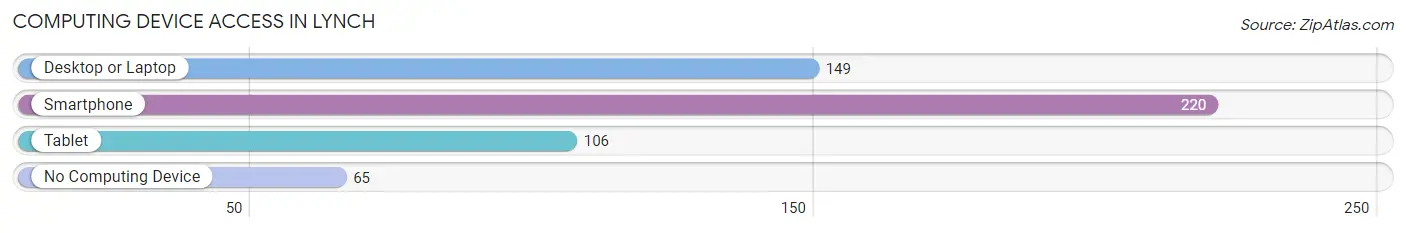
| Device Type | # Households | % Households |
| Desktop or Laptop | 149 | 51.6% |
| Smartphone | 220 | 76.1% |
| Tablet | 106 | 36.7% |
| No Computing Device | 65 | 22.5% |
| Total | 289 | 100.0% |
Internet Access in Lynch
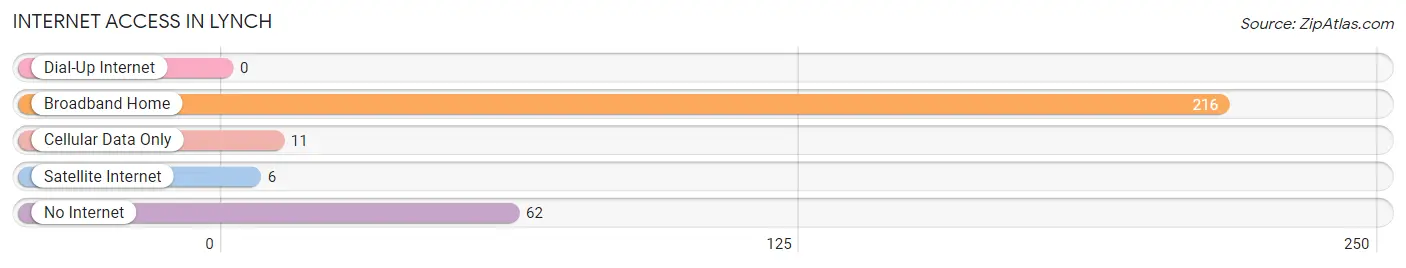
| Internet Type | # Households | % Households |
| Dial-Up Internet | 0 | 0.0% |
| Broadband Home | 216 | 74.7% |
| Cellular Data Only | 11 | 3.8% |
| Satellite Internet | 6 | 2.1% |
| No Internet | 62 | 21.4% |
| Total | 289 | 100.0% |
Lynch Summary
Lynch, Kentucky is a small city located in Harlan County, Kentucky. It is situated in the Appalachian Mountains and is the county seat of Harlan County. The city has a population of approximately 1,500 people and is the largest city in the county.
The city of Lynch was founded in 1917 by the United States Coal and Coke Company. The company was looking for a place to build a coal mining town and chose the area due to its proximity to the coal mines in the area. The city was named after John Lynch, the president of the company.
The city of Lynch is located in the Appalachian Mountains and is surrounded by the Cumberland Mountains. The city is situated at an elevation of 1,400 feet and is located in the Eastern Time Zone. The climate in Lynch is humid and subtropical, with temperatures ranging from the low 30s in the winter to the mid-80s in the summer.
The economy of Lynch is largely based on coal mining and related industries. The city is home to several coal mines, including the Lynch Mine, which is the largest underground coal mine in the United States. The city also has a number of other industries, including manufacturing, retail, and tourism.
The demographics of Lynch are largely white, with a small African American population. The median household income in Lynch is $25,000, which is lower than the national average. The poverty rate in Lynch is also higher than the national average, with approximately 25% of the population living below the poverty line.
The city of Lynch is served by the Harlan County Public Schools system. The city also has a number of private schools, including the Lynch Christian Academy and the Lynch Academy of Arts and Sciences.
The city of Lynch is home to a number of attractions, including the Lynch Museum, which is dedicated to the history of the city and the coal mining industry. The city also has a number of parks, including the Lynch City Park, which is home to a number of recreational activities.
The city of Lynch is a great place to live and work. It has a rich history and culture, and is home to a number of businesses and industries. The city is also home to a number of attractions, making it a great place to visit and explore.
Common Questions
What is Per Capita Income in Lynch?
Per Capita income in Lynch is $18,894.
What is the Median Family Income in Lynch?
Median Family Income in Lynch is $36,094.
What is the Median Household income in Lynch?
Median Household Income in Lynch is $29,954.
What is Inequality or Gini Index in Lynch?
Inequality or Gini Index in Lynch is 0.38.
What is the Total Population of Lynch?
Total Population of Lynch is 684.
What is the Total Male Population of Lynch?
Total Male Population of Lynch is 299.
What is the Total Female Population of Lynch?
Total Female Population of Lynch is 385.
What is the Ratio of Males per 100 Females in Lynch?
There are 77.66 Males per 100 Females in Lynch.
What is the Ratio of Females per 100 Males in Lynch?
There are 128.76 Females per 100 Males in Lynch.
What is the Median Population Age in Lynch?
Median Population Age in Lynch is 59.1 Years.
What is the Average Family Size in Lynch
Average Family Size in Lynch is 2.8 People.
What is the Average Household Size in Lynch
Average Household Size in Lynch is 2.4 People.
How Large is the Labor Force in Lynch?
There are 231 People in the Labor Forcein in Lynch.
What is the Percentage of People in the Labor Force in Lynch?
37.5% of People are in the Labor Force in Lynch.
What is the Unemployment Rate in Lynch?
Unemployment Rate in Lynch is 6.1%.