Brodhead, KY Map & Demographics
Brodhead Map
Brodhead Overview
$17,615
PER CAPITA INCOME
$60,208
AVG FAMILY INCOME
$28,750
AVG HOUSEHOLD INCOME
9.0%
WAGE / INCOME GAP [ % ]
91.0¢/ $1
WAGE / INCOME GAP [ $ ]
0.51
INEQUALITY / GINI INDEX
1,361
TOTAL POPULATION
616
MALE POPULATION
745
FEMALE POPULATION
82.68
MALES / 100 FEMALES
120.94
FEMALES / 100 MALES
34.3
MEDIAN AGE
3.4
AVG FAMILY SIZE
2.7
AVG HOUSEHOLD SIZE
537
LABOR FORCE [ PEOPLE ]
52.8%
PERCENT IN LABOR FORCE
12.1%
UNEMPLOYMENT RATE
Brodhead Zip Codes
Brodhead Area Codes
Income in Brodhead
Income Overview in Brodhead
Per Capita Income in Brodhead is $17,615, while median incomes of families and households are $60,208 and $28,750 respectively.
| Characteristic | Number | Measure |
| Per Capita Income | 1,361 | $17,615 |
| Median Family Income | 303 | $60,208 |
| Mean Family Income | 303 | $61,185 |
| Median Household Income | 470 | $28,750 |
| Mean Household Income | 470 | $46,941 |
| Income Deficit | 303 | $0 |
| Wage / Income Gap (%) | 1,361 | 9.03% |
| Wage / Income Gap ($) | 1,361 | 90.97¢ per $1 |
| Gini / Inequality Index | 1,361 | 0.51 |
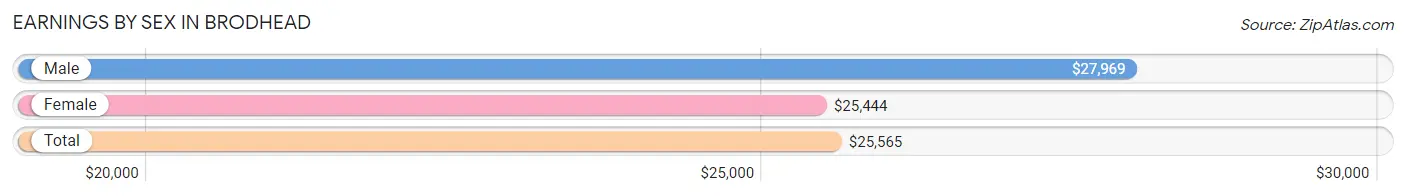
Earnings by Sex in Brodhead
Average Earnings in Brodhead are $25,565, $27,969 for men and $25,444 for women, a difference of 9.0%.
| Sex | Number | Average Earnings |
| Male | 311 (55.7%) | $27,969 |
| Female | 247 (44.3%) | $25,444 |
| Total | 558 (100.0%) | $25,565 |
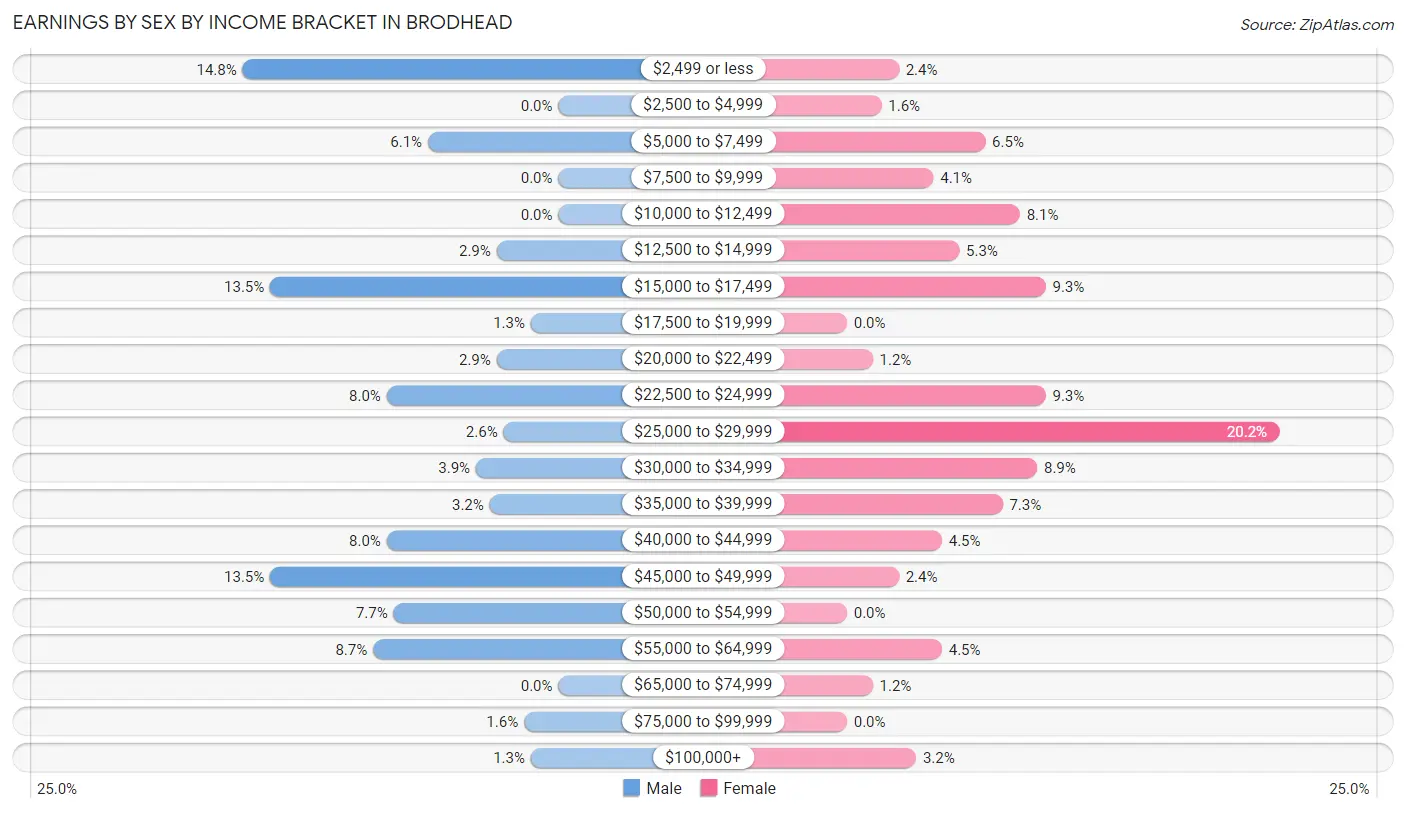
Earnings by Sex by Income Bracket in Brodhead
The most common earnings brackets in Brodhead are $2,499 or less for men (46 | 14.8%) and $25,000 to $29,999 for women (50 | 20.2%).
| Income | Male | Female |
| $2,499 or less | 46 (14.8%) | 6 (2.4%) |
| $2,500 to $4,999 | 0 (0.0%) | 4 (1.6%) |
| $5,000 to $7,499 | 19 (6.1%) | 16 (6.5%) |
| $7,500 to $9,999 | 0 (0.0%) | 10 (4.1%) |
| $10,000 to $12,499 | 0 (0.0%) | 20 (8.1%) |
| $12,500 to $14,999 | 9 (2.9%) | 13 (5.3%) |
| $15,000 to $17,499 | 42 (13.5%) | 23 (9.3%) |
| $17,500 to $19,999 | 4 (1.3%) | 0 (0.0%) |
| $20,000 to $22,499 | 9 (2.9%) | 3 (1.2%) |
| $22,500 to $24,999 | 25 (8.0%) | 23 (9.3%) |
| $25,000 to $29,999 | 8 (2.6%) | 50 (20.2%) |
| $30,000 to $34,999 | 12 (3.9%) | 22 (8.9%) |
| $35,000 to $39,999 | 10 (3.2%) | 18 (7.3%) |
| $40,000 to $44,999 | 25 (8.0%) | 11 (4.4%) |
| $45,000 to $49,999 | 42 (13.5%) | 6 (2.4%) |
| $50,000 to $54,999 | 24 (7.7%) | 0 (0.0%) |
| $55,000 to $64,999 | 27 (8.7%) | 11 (4.4%) |
| $65,000 to $74,999 | 0 (0.0%) | 3 (1.2%) |
| $75,000 to $99,999 | 5 (1.6%) | 0 (0.0%) |
| $100,000+ | 4 (1.3%) | 8 (3.2%) |
| Total | 311 (100.0%) | 247 (100.0%) |
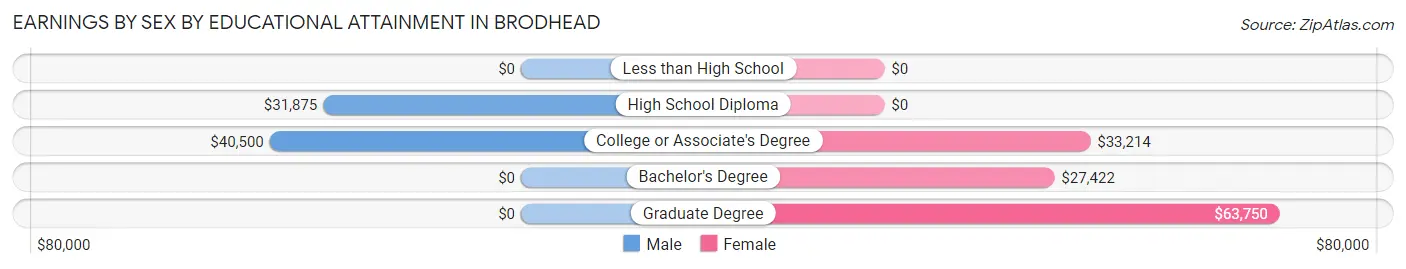
Earnings by Sex by Educational Attainment in Brodhead
Average earnings in Brodhead are $37,625 for men and $26,935 for women, a difference of 28.4%. Men with an educational attainment of college or associate's degree enjoy the highest average annual earnings of $40,500, while those with high school diploma education earn the least with $31,875. Women with an educational attainment of graduate degree earn the most with the average annual earnings of $63,750, while those with bachelor's degree education have the smallest earnings of $27,422.
| Educational Attainment | Male Income | Female Income |
| Less than High School | - | - |
| High School Diploma | $31,875 | $0 |
| College or Associate's Degree | $40,500 | $33,214 |
| Bachelor's Degree | - | - |
| Graduate Degree | - | - |
| Total | $37,625 | $26,935 |
Family Income in Brodhead
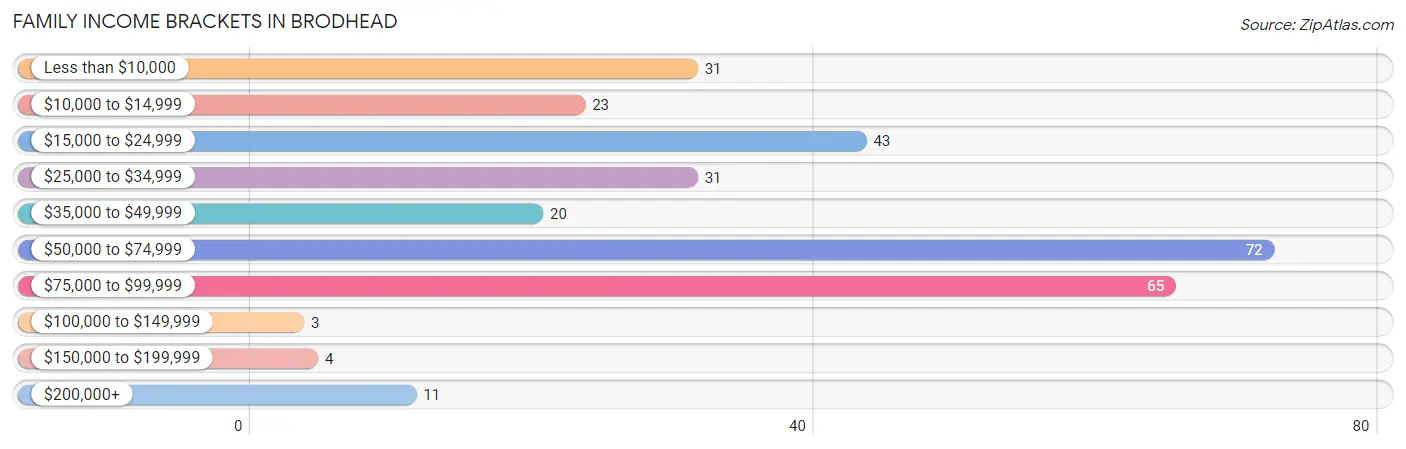
Family Income Brackets in Brodhead
According to the Brodhead family income data, there are 72 families falling into the $50,000 to $74,999 income range, which is the most common income bracket and makes up 23.8% of all families. Conversely, the $100,000 to $149,999 income bracket is the least frequent group with only 3 families (1.0%) belonging to this category.
| Income Bracket | # Families | % Families |
| Less than $10,000 | 31 | 10.2% |
| $10,000 to $14,999 | 23 | 7.6% |
| $15,000 to $24,999 | 43 | 14.2% |
| $25,000 to $34,999 | 31 | 10.2% |
| $35,000 to $49,999 | 20 | 6.6% |
| $50,000 to $74,999 | 72 | 23.8% |
| $75,000 to $99,999 | 65 | 21.5% |
| $100,000 to $149,999 | 3 | 1.0% |
| $150,000 to $199,999 | 4 | 1.3% |
| $200,000+ | 11 | 3.6% |
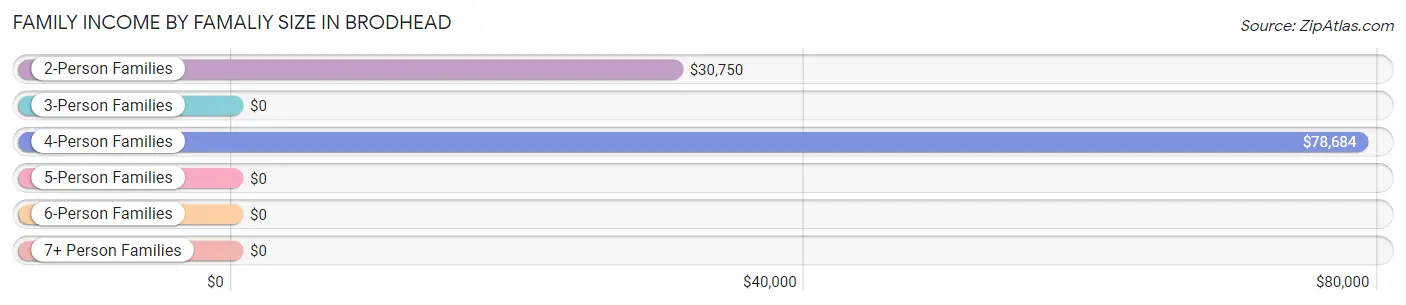
Family Income by Famaliy Size in Brodhead
4-person families (104 | 34.3%) account for the highest median family income in Brodhead with $78,684 per family, while 4-person families (104 | 34.3%) have the highest median income of $19,671 per family member.
| Income Bracket | # Families | Median Income |
| 2-Person Families | 102 (33.7%) | $30,750 |
| 3-Person Families | 67 (22.1%) | $0 |
| 4-Person Families | 104 (34.3%) | $78,684 |
| 5-Person Families | 26 (8.6%) | $0 |
| 6-Person Families | 4 (1.3%) | $0 |
| 7+ Person Families | 0 (0.0%) | $0 |
| Total | 303 (100.0%) | $60,208 |
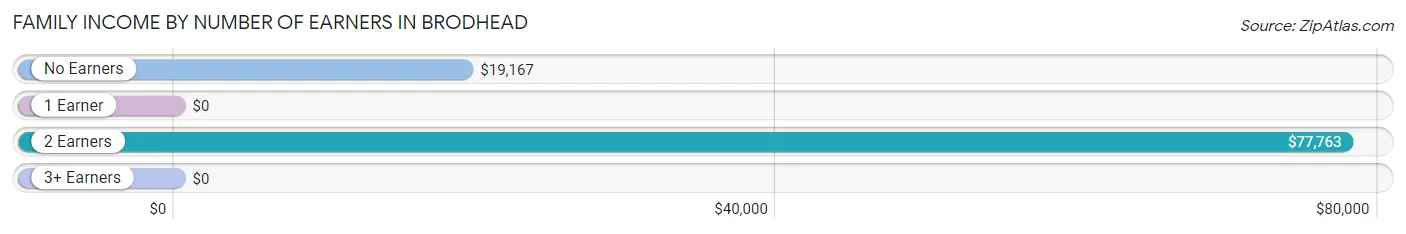
Family Income by Number of Earners in Brodhead
| Number of Earners | # Families | Median Income |
| No Earners | 56 (18.5%) | $19,167 |
| 1 Earner | 96 (31.7%) | $0 |
| 2 Earners | 132 (43.6%) | $77,763 |
| 3+ Earners | 19 (6.3%) | $0 |
| Total | 303 (100.0%) | $60,208 |
Household Income in Brodhead
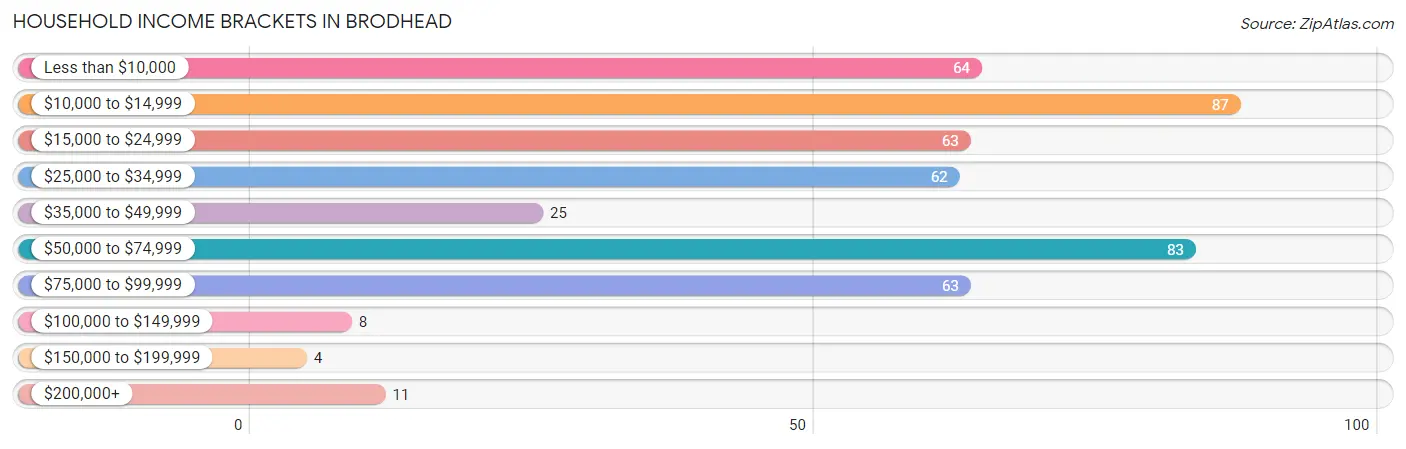
Household Income Brackets in Brodhead
With 87 households falling in the category, the $10,000 to $14,999 income range is the most frequent in Brodhead, accounting for 18.5% of all households. In contrast, only 4 households (0.9%) fall into the $150,000 to $199,999 income bracket, making it the least populous group.
| Income Bracket | # Households | % Households |
| Less than $10,000 | 64 | 13.6% |
| $10,000 to $14,999 | 87 | 18.5% |
| $15,000 to $24,999 | 63 | 13.4% |
| $25,000 to $34,999 | 62 | 13.2% |
| $35,000 to $49,999 | 25 | 5.3% |
| $50,000 to $74,999 | 83 | 17.7% |
| $75,000 to $99,999 | 63 | 13.4% |
| $100,000 to $149,999 | 8 | 1.7% |
| $150,000 to $199,999 | 4 | 0.9% |
| $200,000+ | 11 | 2.3% |
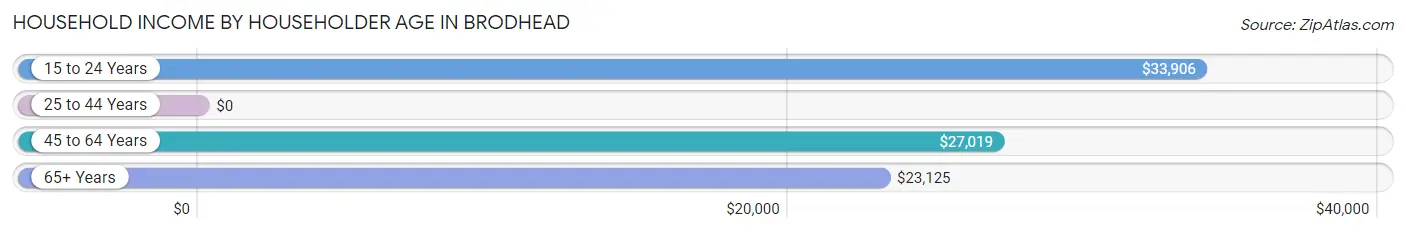
Household Income by Householder Age in Brodhead
The median household income in Brodhead is $28,750, with the highest median household income of $33,906 found in the 15 to 24 years age bracket for the primary householder. A total of 30 households (6.4%) fall into this category. Meanwhile, the 25 to 44 years age bracket for the primary householder has the lowest median household income of $0, with 123 households (26.2%) in this group.
| Income Bracket | # Households | Median Income |
| 15 to 24 Years | 30 (6.4%) | $33,906 |
| 25 to 44 Years | 123 (26.2%) | $0 |
| 45 to 64 Years | 219 (46.6%) | $27,019 |
| 65+ Years | 98 (20.8%) | $23,125 |
| Total | 470 (100.0%) | $28,750 |
Poverty in Brodhead
Income Below Poverty by Sex and Age in Brodhead
With 31.7% poverty level for males and 35.1% for females among the residents of Brodhead, 6 to 11 year old males and 12 to 14 year old females are the most vulnerable to poverty, with 46 males (66.7%) and 5 females (100.0%) in their respective age groups living below the poverty level.
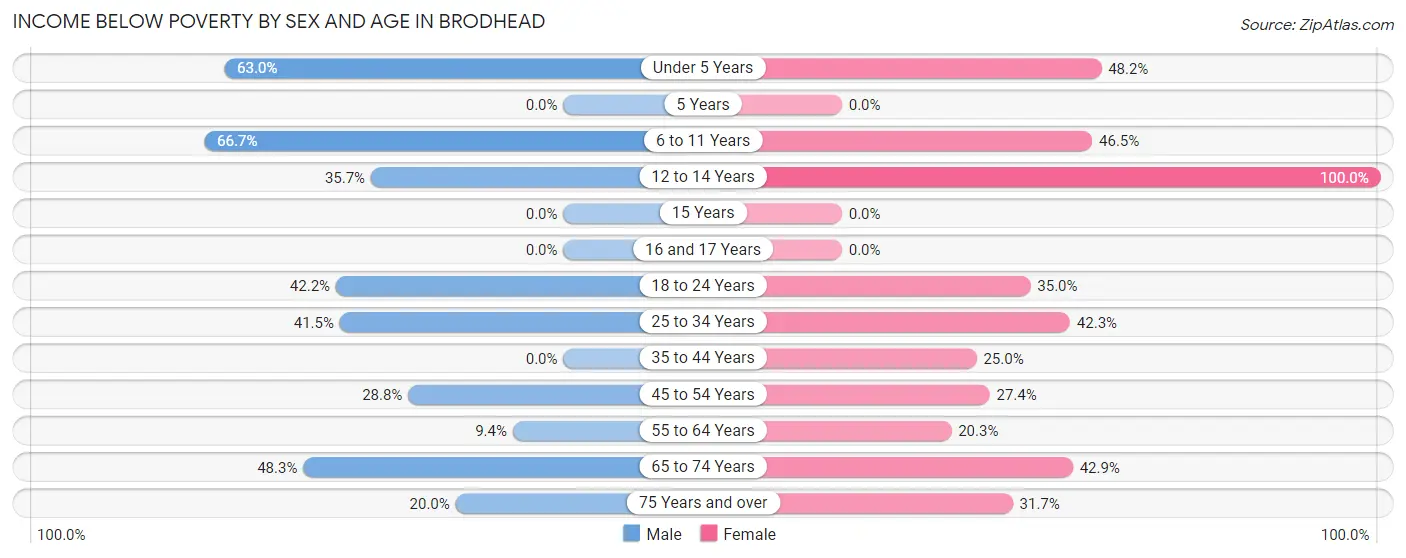
| Age Bracket | Male | Female |
| Under 5 Years | 17 (63.0%) | 39 (48.1%) |
| 5 Years | 0 (0.0%) | 0 (0.0%) |
| 6 to 11 Years | 46 (66.7%) | 46 (46.5%) |
| 12 to 14 Years | 5 (35.7%) | 5 (100.0%) |
| 15 Years | 0 (0.0%) | 0 (0.0%) |
| 16 and 17 Years | 0 (0.0%) | 0 (0.0%) |
| 18 to 24 Years | 19 (42.2%) | 21 (35.0%) |
| 25 to 34 Years | 39 (41.5%) | 47 (42.3%) |
| 35 to 44 Years | 0 (0.0%) | 6 (25.0%) |
| 45 to 54 Years | 36 (28.8%) | 34 (27.4%) |
| 55 to 64 Years | 3 (9.4%) | 13 (20.3%) |
| 65 to 74 Years | 14 (48.3%) | 15 (42.9%) |
| 75 Years and over | 4 (20.0%) | 13 (31.7%) |
| Total | 183 (31.7%) | 239 (35.1%) |
Income Above Poverty by Sex and Age in Brodhead
According to the poverty statistics in Brodhead, males aged 5 years and females aged 5 years are the age groups that are most secure financially, with 100.0% of males and 100.0% of females in these age groups living above the poverty line.
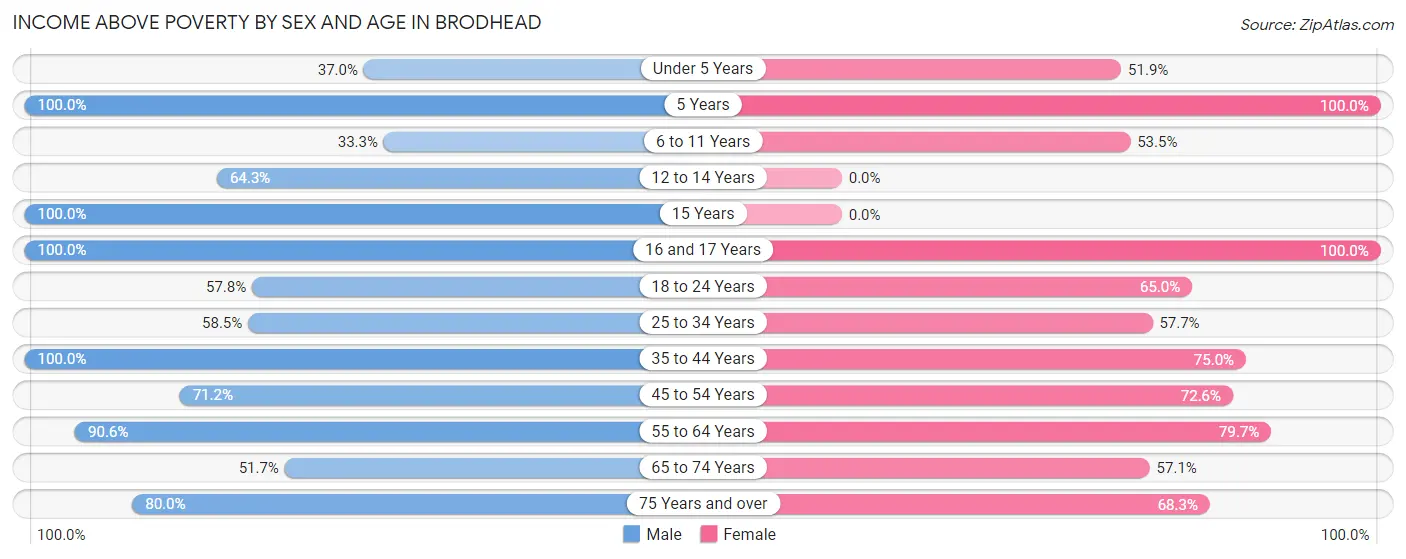
| Age Bracket | Male | Female |
| Under 5 Years | 10 (37.0%) | 42 (51.8%) |
| 5 Years | 25 (100.0%) | 20 (100.0%) |
| 6 to 11 Years | 23 (33.3%) | 53 (53.5%) |
| 12 to 14 Years | 9 (64.3%) | 0 (0.0%) |
| 15 Years | 4 (100.0%) | 0 (0.0%) |
| 16 and 17 Years | 13 (100.0%) | 17 (100.0%) |
| 18 to 24 Years | 26 (57.8%) | 39 (65.0%) |
| 25 to 34 Years | 55 (58.5%) | 64 (57.7%) |
| 35 to 44 Years | 80 (100.0%) | 18 (75.0%) |
| 45 to 54 Years | 89 (71.2%) | 90 (72.6%) |
| 55 to 64 Years | 29 (90.6%) | 51 (79.7%) |
| 65 to 74 Years | 15 (51.7%) | 20 (57.1%) |
| 75 Years and over | 16 (80.0%) | 28 (68.3%) |
| Total | 394 (68.3%) | 442 (64.9%) |
Income Below Poverty Among Married-Couple Families in Brodhead
The poverty statistics for married-couple families in Brodhead show that 13.6% or 27 of the total 199 families live below the poverty line. Families with 3 or 4 children have the highest poverty rate of 37.5%, comprising of 9 families. On the other hand, families with no children have the lowest poverty rate of 4.3%, which includes 4 families.
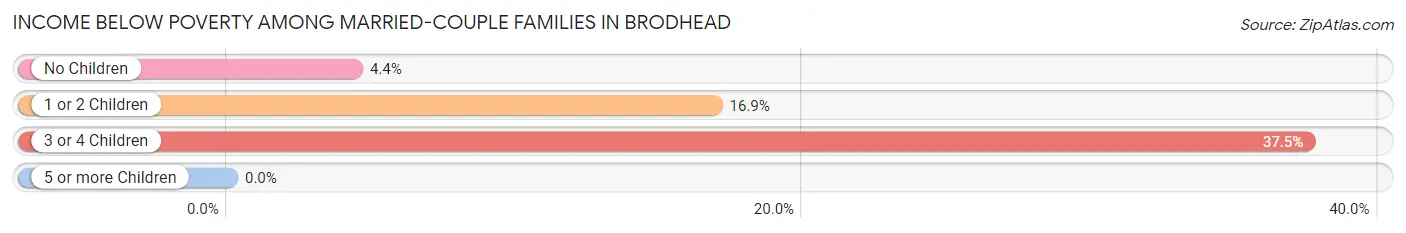
| Children | Above Poverty | Below Poverty |
| No Children | 88 (95.7%) | 4 (4.3%) |
| 1 or 2 Children | 69 (83.1%) | 14 (16.9%) |
| 3 or 4 Children | 15 (62.5%) | 9 (37.5%) |
| 5 or more Children | 0 (0.0%) | 0 (0.0%) |
| Total | 172 (86.4%) | 27 (13.6%) |
Income Below Poverty Among Single-Parent Households in Brodhead
According to the poverty data in Brodhead, 37.5% or 3 single-father households and 45.8% or 44 single-mother households are living below the poverty line. Among single-father households, those with 1 or 2 children have the highest poverty rate, with 3 households (100.0%) experiencing poverty. Likewise, among single-mother households, those with 3 or 4 children have the highest poverty rate, with 19 households (100.0%) falling below the poverty line.
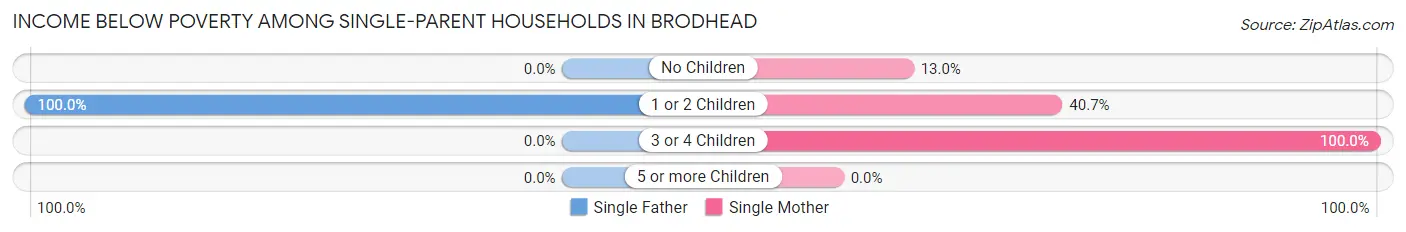
| Children | Single Father | Single Mother |
| No Children | 0 (0.0%) | 3 (13.0%) |
| 1 or 2 Children | 3 (100.0%) | 22 (40.7%) |
| 3 or 4 Children | 0 (0.0%) | 19 (100.0%) |
| 5 or more Children | 0 (0.0%) | 0 (0.0%) |
| Total | 3 (37.5%) | 44 (45.8%) |
Income Below Poverty Among Married-Couple vs Single-Parent Households in Brodhead
The poverty data for Brodhead shows that 27 of the married-couple family households (13.6%) and 47 of the single-parent households (45.2%) are living below the poverty level. Within the married-couple family households, those with 3 or 4 children have the highest poverty rate, with 9 households (37.5%) falling below the poverty line. Among the single-parent households, those with 3 or 4 children have the highest poverty rate, with 19 household (79.2%) living below poverty.
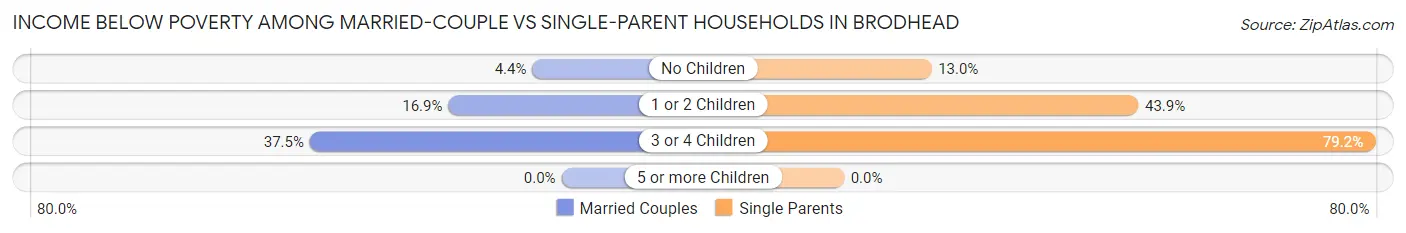
| Children | Married-Couple Families | Single-Parent Households |
| No Children | 4 (4.3%) | 3 (13.0%) |
| 1 or 2 Children | 14 (16.9%) | 25 (43.9%) |
| 3 or 4 Children | 9 (37.5%) | 19 (79.2%) |
| 5 or more Children | 0 (0.0%) | 0 (0.0%) |
| Total | 27 (13.6%) | 47 (45.2%) |
Race in Brodhead
The most populous races in Brodhead are White / Caucasian (1,342 | 98.6%), Two or more Races (19 | 1.4%), and Hispanic or Latino (6 | 0.4%).
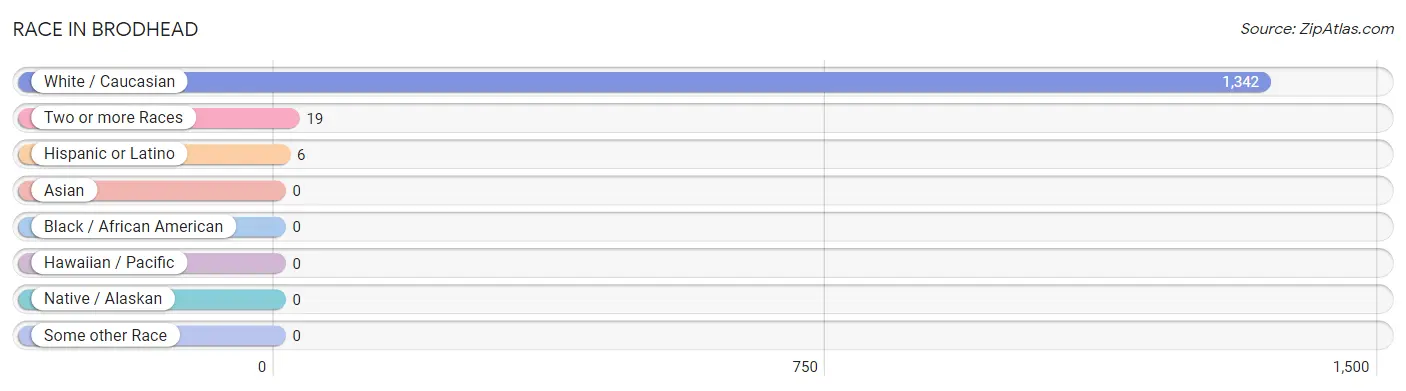
| Race | # Population | % Population |
| Asian | 0 | 0.0% |
| Black / African American | 0 | 0.0% |
| Hawaiian / Pacific | 0 | 0.0% |
| Hispanic or Latino | 6 | 0.4% |
| Native / Alaskan | 0 | 0.0% |
| White / Caucasian | 1,342 | 98.6% |
| Two or more Races | 19 | 1.4% |
| Some other Race | 0 | 0.0% |
| Total | 1,361 | 100.0% |
Ancestry in Brodhead
The most populous ancestries reported in Brodhead are American (187 | 13.7%), Irish (157 | 11.5%), English (137 | 10.1%), German (133 | 9.8%), and European (9 | 0.7%), together accounting for 45.8% of all Brodhead residents.
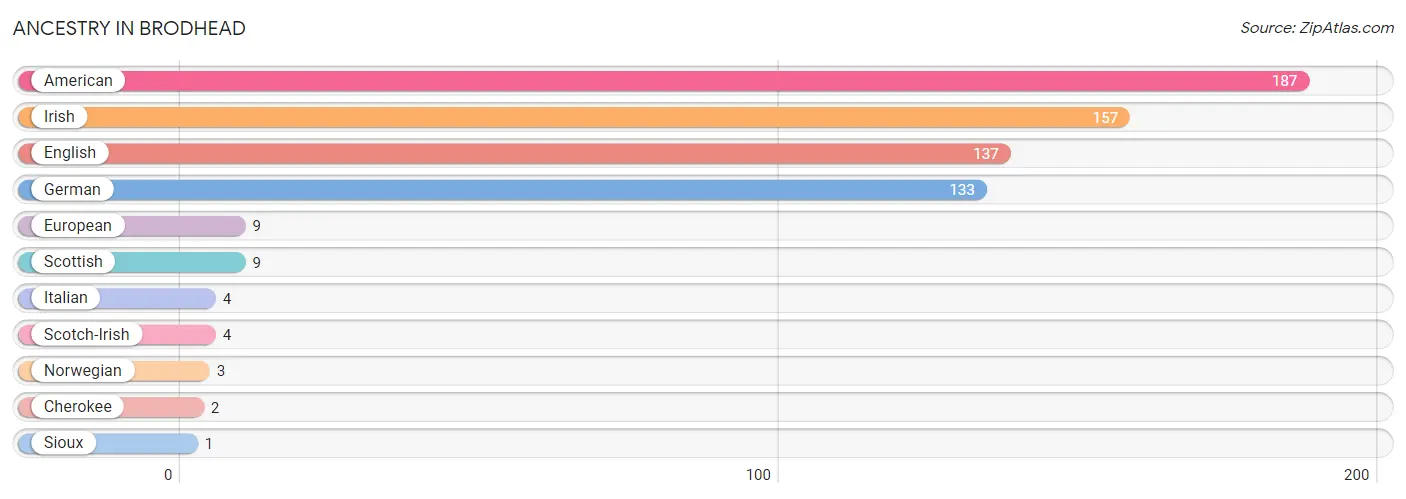
| Ancestry | # Population | % Population |
| American | 187 | 13.7% |
| Cherokee | 2 | 0.2% |
| English | 137 | 10.1% |
| European | 9 | 0.7% |
| German | 133 | 9.8% |
| Irish | 157 | 11.5% |
| Italian | 4 | 0.3% |
| Norwegian | 3 | 0.2% |
| Scotch-Irish | 4 | 0.3% |
| Scottish | 9 | 0.7% |
| Sioux | 1 | 0.1% | View All 11 Rows |
Immigrants in Brodhead

| Immigration Origin | # Population | % Population | View All 0 Rows |
Sex and Age in Brodhead
Sex and Age in Brodhead
The most populous age groups in Brodhead are 5 to 9 Years (67 | 10.9%) for men and 5 to 9 Years (110 | 14.8%) for women.
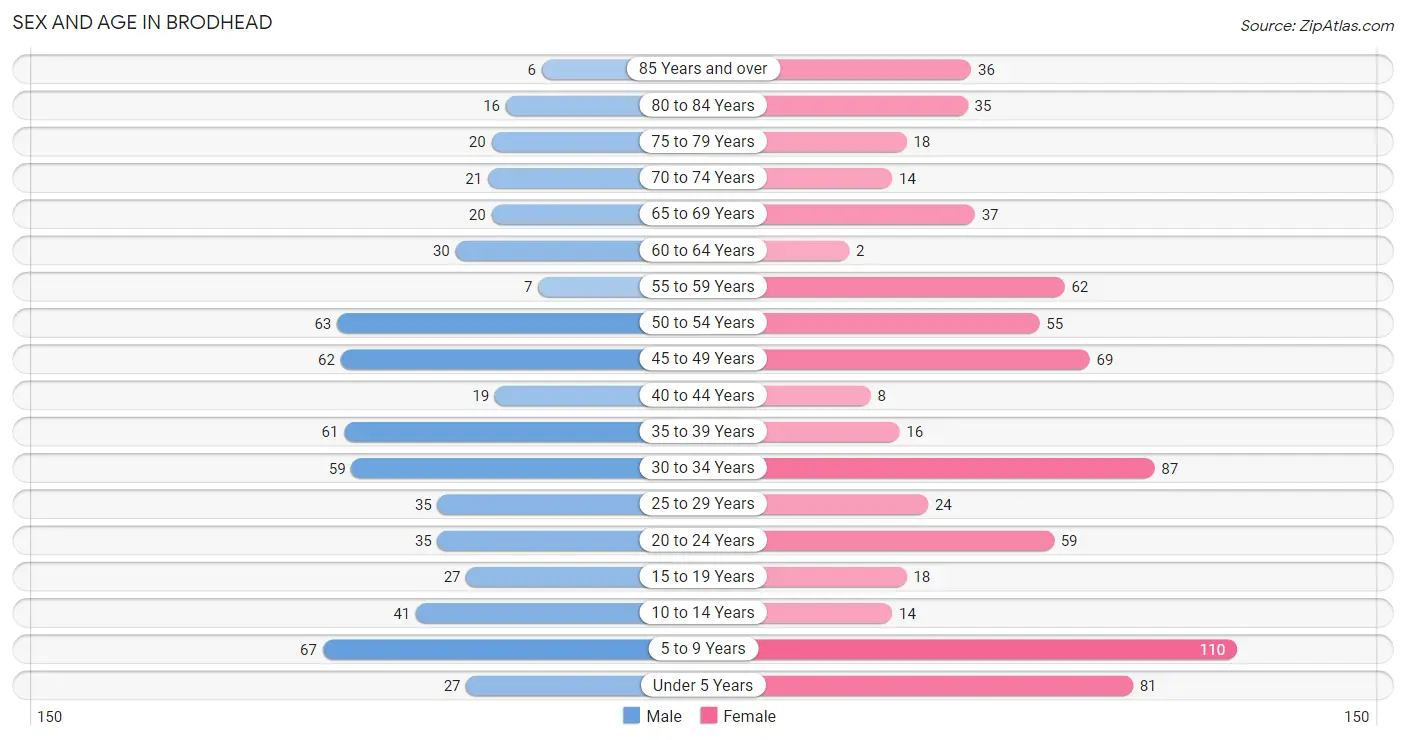
| Age Bracket | Male | Female |
| Under 5 Years | 27 (4.4%) | 81 (10.9%) |
| 5 to 9 Years | 67 (10.9%) | 110 (14.8%) |
| 10 to 14 Years | 41 (6.7%) | 14 (1.9%) |
| 15 to 19 Years | 27 (4.4%) | 18 (2.4%) |
| 20 to 24 Years | 35 (5.7%) | 59 (7.9%) |
| 25 to 29 Years | 35 (5.7%) | 24 (3.2%) |
| 30 to 34 Years | 59 (9.6%) | 87 (11.7%) |
| 35 to 39 Years | 61 (9.9%) | 16 (2.1%) |
| 40 to 44 Years | 19 (3.1%) | 8 (1.1%) |
| 45 to 49 Years | 62 (10.1%) | 69 (9.3%) |
| 50 to 54 Years | 63 (10.2%) | 55 (7.4%) |
| 55 to 59 Years | 7 (1.1%) | 62 (8.3%) |
| 60 to 64 Years | 30 (4.9%) | 2 (0.3%) |
| 65 to 69 Years | 20 (3.3%) | 37 (5.0%) |
| 70 to 74 Years | 21 (3.4%) | 14 (1.9%) |
| 75 to 79 Years | 20 (3.3%) | 18 (2.4%) |
| 80 to 84 Years | 16 (2.6%) | 35 (4.7%) |
| 85 Years and over | 6 (1.0%) | 36 (4.8%) |
| Total | 616 (100.0%) | 745 (100.0%) |
Families and Households in Brodhead
Median Family Size in Brodhead
The median family size in Brodhead is 3.41 persons per family, with married-couple families (199 | 65.7%) accounting for the largest median family size of 3.57 persons per family. On the other hand, single male/father families (8 | 2.6%) represent the smallest median family size with 2.75 persons per family.
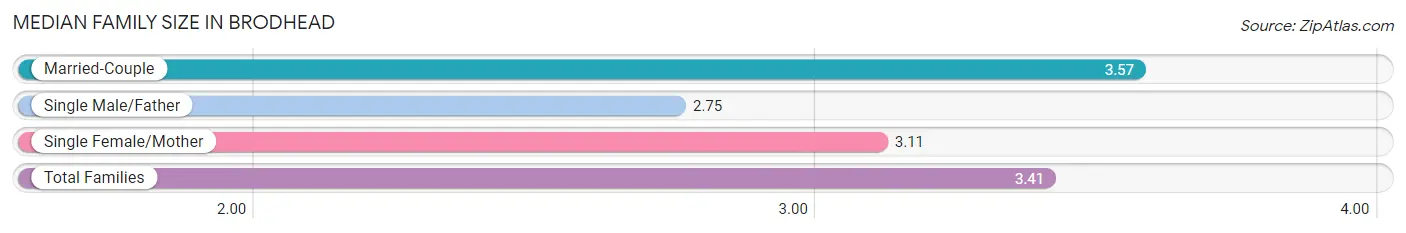
| Family Type | # Families | Family Size |
| Married-Couple | 199 (65.7%) | 3.57 |
| Single Male/Father | 8 (2.6%) | 2.75 |
| Single Female/Mother | 96 (31.7%) | 3.11 |
| Total Families | 303 (100.0%) | 3.41 |
Median Household Size in Brodhead
The median household size in Brodhead is 2.68 persons per household, with married-couple households (199 | 42.3%) accounting for the largest median household size of 3.57 persons per household. non-family households (167 | 35.5%) represent the smallest median household size with 1.23 persons per household.
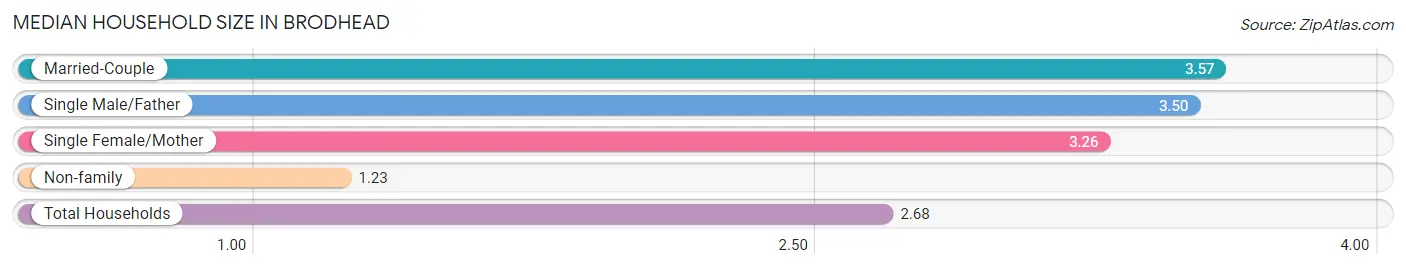
| Household Type | # Households | Household Size |
| Married-Couple | 199 (42.3%) | 3.57 |
| Single Male/Father | 8 (1.7%) | 3.50 |
| Single Female/Mother | 96 (20.4%) | 3.26 |
| Non-family | 167 (35.5%) | 1.23 |
| Total Households | 470 (100.0%) | 2.68 |
Household Size by Marriage Status in Brodhead
Out of a total of 470 households in Brodhead, 303 (64.5%) are family households, while 167 (35.5%) are nonfamily households. The most numerous type of family households are 4-person households, comprising 101, and the most common type of nonfamily households are 1-person households, comprising 141.
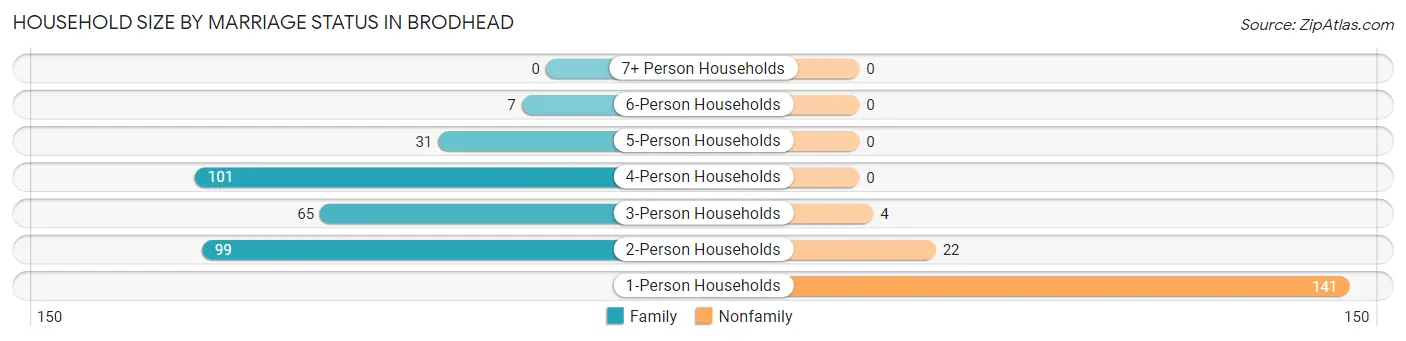
| Household Size | Family Households | Nonfamily Households |
| 1-Person Households | - | 141 (30.0%) |
| 2-Person Households | 99 (21.1%) | 22 (4.7%) |
| 3-Person Households | 65 (13.8%) | 4 (0.9%) |
| 4-Person Households | 101 (21.5%) | 0 (0.0%) |
| 5-Person Households | 31 (6.6%) | 0 (0.0%) |
| 6-Person Households | 7 (1.5%) | 0 (0.0%) |
| 7+ Person Households | 0 (0.0%) | 0 (0.0%) |
| Total | 303 (64.5%) | 167 (35.5%) |
Female Fertility in Brodhead
Fertility by Age in Brodhead
Average fertility rate in Brodhead is 103.0 births per 1,000 women. Women in the age bracket of 35 to 50 years have the highest fertility rate with 129.0 births per 1,000 women. Women in the age bracket of 20 to 34 years acount for 58.6% of all women with births.
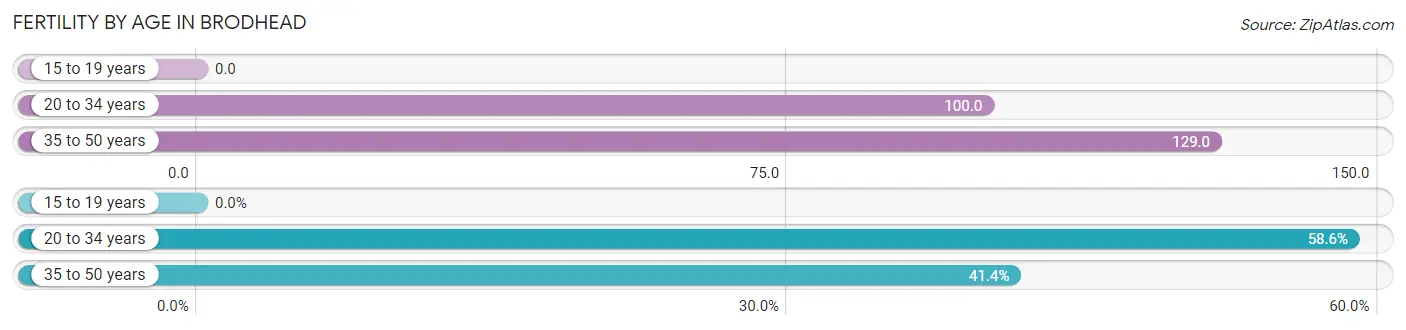
| Age Bracket | Women with Births | Births / 1,000 Women |
| 15 to 19 years | 0 (0.0%) | 0.0 |
| 20 to 34 years | 17 (58.6%) | 100.0 |
| 35 to 50 years | 12 (41.4%) | 129.0 |
| Total | 29 (100.0%) | 103.0 |
Fertility by Age by Marriage Status in Brodhead
51.7% of women with births (29) in Brodhead are married. The highest percentage of unmarried women with births falls into 20 to 34 years age bracket with 82.4% of them unmarried at the time of birth, while the lowest percentage of unmarried women with births belong to 35 to 50 years age bracket with 0.0% of them unmarried.
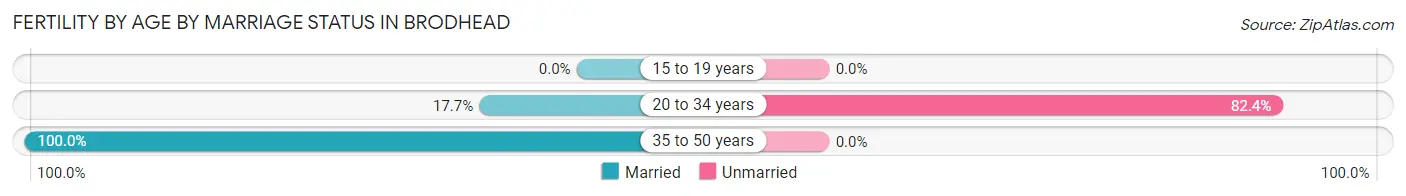
| Age Bracket | Married | Unmarried |
| 15 to 19 years | 0 (0.0%) | 0 (0.0%) |
| 20 to 34 years | 3 (17.6%) | 14 (82.4%) |
| 35 to 50 years | 12 (100.0%) | 0 (0.0%) |
| Total | 15 (51.7%) | 14 (48.3%) |
Fertility by Education in Brodhead
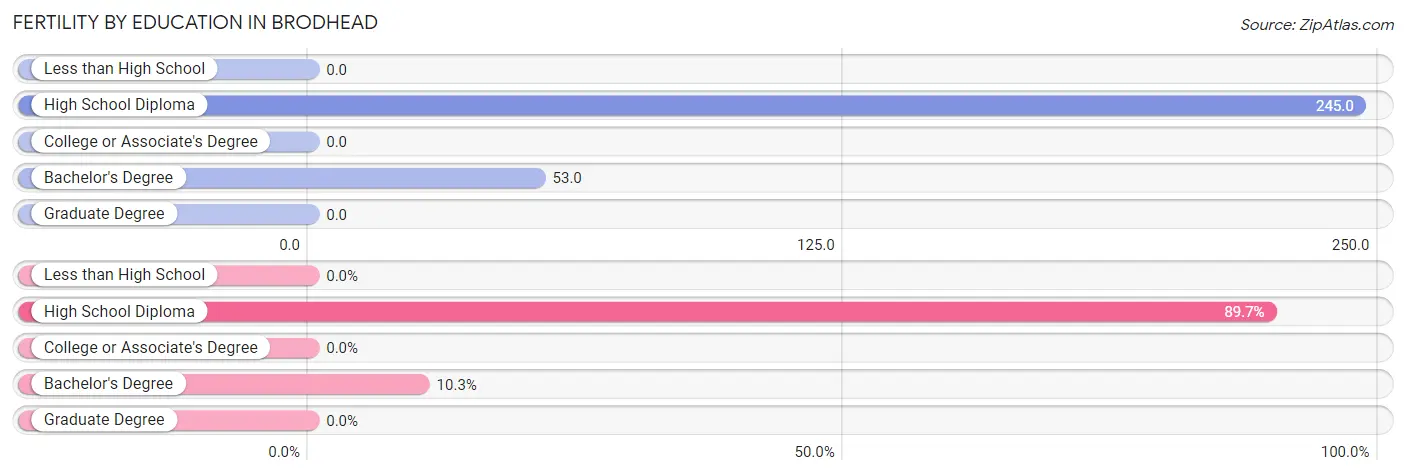
| Educational Attainment | Women with Births | Births / 1,000 Women |
| Less than High School | 0 (0.0%) | 0.0 |
| High School Diploma | 26 (89.7%) | 245.0 |
| College or Associate's Degree | 0 (0.0%) | 0.0 |
| Bachelor's Degree | 3 (10.3%) | 53.0 |
| Graduate Degree | 0 (0.0%) | 0.0 |
| Total | 29 (100.0%) | 103.0 |
Fertility by Education by Marriage Status in Brodhead
48.3% of women with births in Brodhead are unmarried. Women with the educational attainment of bachelor's degree are most likely to be married with 100.0% of them married at childbirth, while women with the educational attainment of high school diploma are least likely to be married with 53.8% of them unmarried at childbirth.
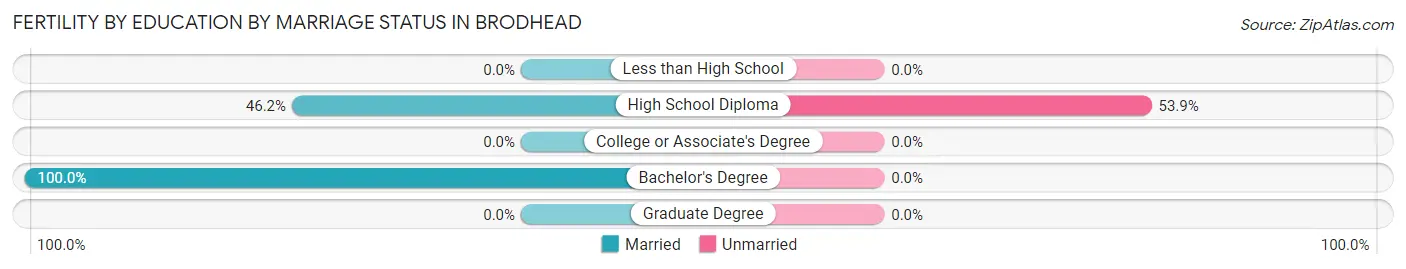
| Educational Attainment | Married | Unmarried |
| Less than High School | 0 (0.0%) | 0 (0.0%) |
| High School Diploma | 12 (46.2%) | 14 (53.8%) |
| College or Associate's Degree | 0 (0.0%) | 0 (0.0%) |
| Bachelor's Degree | 3 (100.0%) | 0 (0.0%) |
| Graduate Degree | 0 (0.0%) | 0 (0.0%) |
| Total | 15 (51.7%) | 14 (48.3%) |
Employment Characteristics in Brodhead
Employment by Class of Employer in Brodhead
Among the 458 employed individuals in Brodhead, private company employees (286 | 62.5%), not-for-profit organizations (68 | 14.8%), and self-employed (not incorporated) (44 | 9.6%) make up the most common classes of employment.
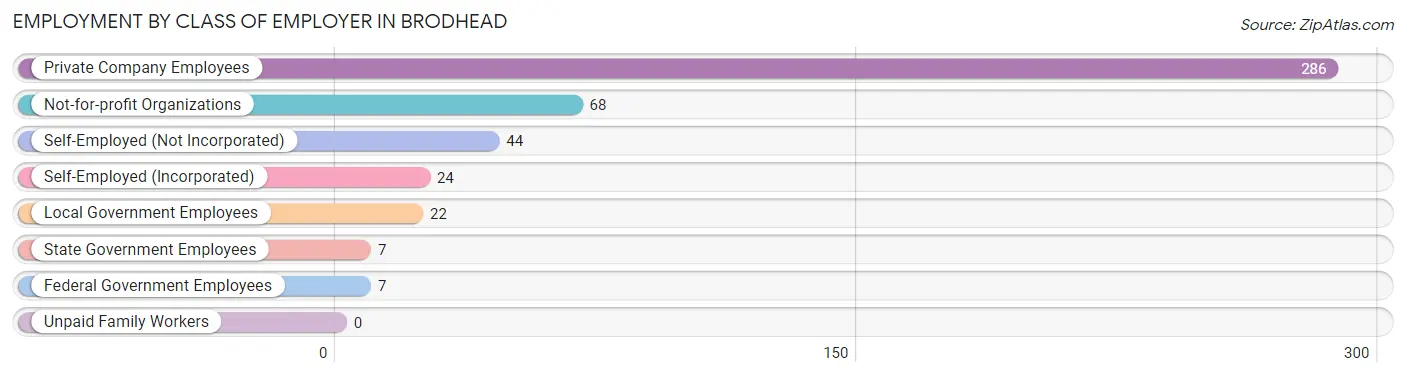
| Employer Class | # Employees | % Employees |
| Private Company Employees | 286 | 62.5% |
| Self-Employed (Incorporated) | 24 | 5.2% |
| Self-Employed (Not Incorporated) | 44 | 9.6% |
| Not-for-profit Organizations | 68 | 14.8% |
| Local Government Employees | 22 | 4.8% |
| State Government Employees | 7 | 1.5% |
| Federal Government Employees | 7 | 1.5% |
| Unpaid Family Workers | 0 | 0.0% |
| Total | 458 | 100.0% |
Employment Status by Age in Brodhead
According to the labor force statistics for Brodhead, out of the total population over 16 years of age (1,017), 52.8% or 537 individuals are in the labor force, with 12.1% or 65 of them unemployed. The age group with the highest labor force participation rate is 35 to 44 years, with 88.5% or 92 individuals in the labor force. Within the labor force, the 20 to 24 years age range has the highest percentage of unemployed individuals, with 31.1% or 23 of them being unemployed.
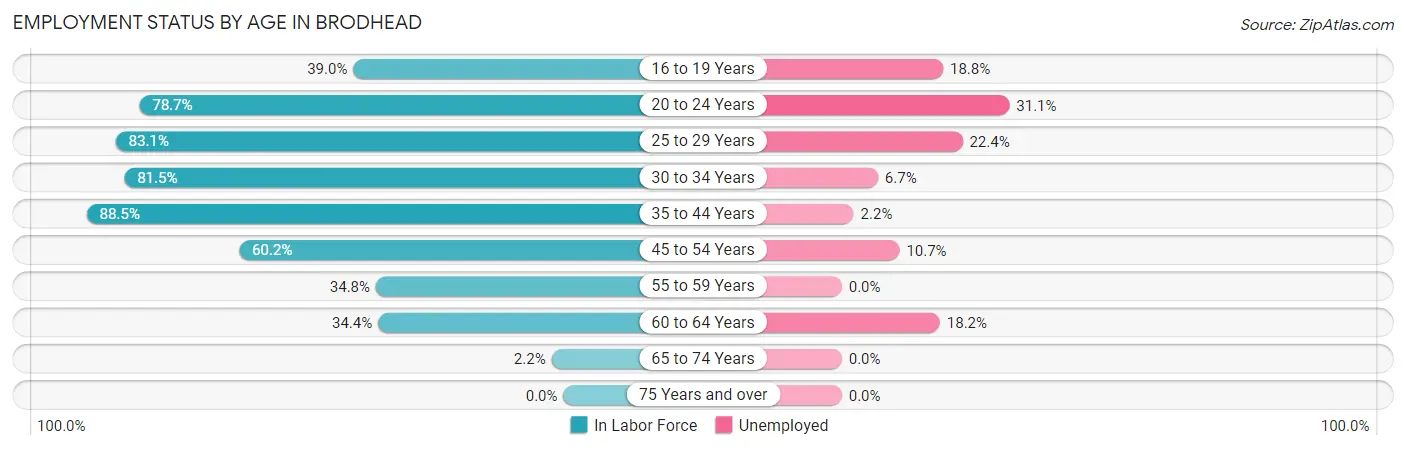
| Age Bracket | In Labor Force | Unemployed |
| 16 to 19 Years | 16 (39.0%) | 3 (18.8%) |
| 20 to 24 Years | 74 (78.7%) | 23 (31.1%) |
| 25 to 29 Years | 49 (83.1%) | 11 (22.4%) |
| 30 to 34 Years | 119 (81.5%) | 8 (6.7%) |
| 35 to 44 Years | 92 (88.5%) | 2 (2.2%) |
| 45 to 54 Years | 150 (60.2%) | 16 (10.7%) |
| 55 to 59 Years | 24 (34.8%) | 0 (0.0%) |
| 60 to 64 Years | 11 (34.4%) | 2 (18.2%) |
| 65 to 74 Years | 2 (2.2%) | 0 (0.0%) |
| 75 Years and over | 0 (0.0%) | 0 (0.0%) |
| Total | 537 (52.8%) | 65 (12.1%) |
Employment Status by Educational Attainment in Brodhead
According to labor force statistics for Brodhead, 67.5% of individuals (445) out of the total population between 25 and 64 years of age (659) are in the labor force, with 8.8% or 39 of them being unemployed. The group with the highest labor force participation rate are those with the educational attainment of bachelor's degree or higher, with 93.5% or 100 individuals in the labor force. Within the labor force, individuals with less than high school education have the highest percentage of unemployment, with 57.9% or 11 of them being unemployed.
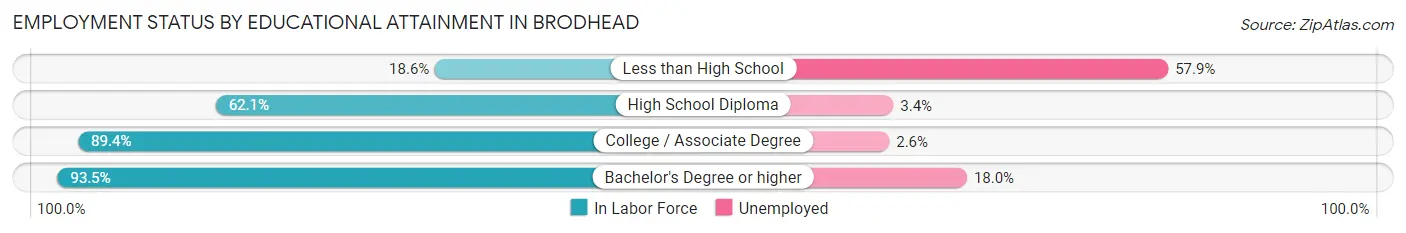
| Educational Attainment | In Labor Force | Unemployed |
| Less than High School | 19 (18.6%) | 59 (57.9%) |
| High School Diploma | 174 (62.1%) | 10 (3.4%) |
| College / Associate Degree | 152 (89.4%) | 4 (2.6%) |
| Bachelor's Degree or higher | 100 (93.5%) | 19 (18.0%) |
| Total | 445 (67.5%) | 58 (8.8%) |
Employment Occupations by Sex in Brodhead
Management, Business, Science and Arts Occupations
The most common Management, Business, Science and Arts occupations in Brodhead are Health Diagnosing & Treating (53 | 11.2%), Management (21 | 4.4%), Computers, Engineering & Science (20 | 4.2%), Architecture & Engineering (20 | 4.2%), and Health Technologists (19 | 4.0%).
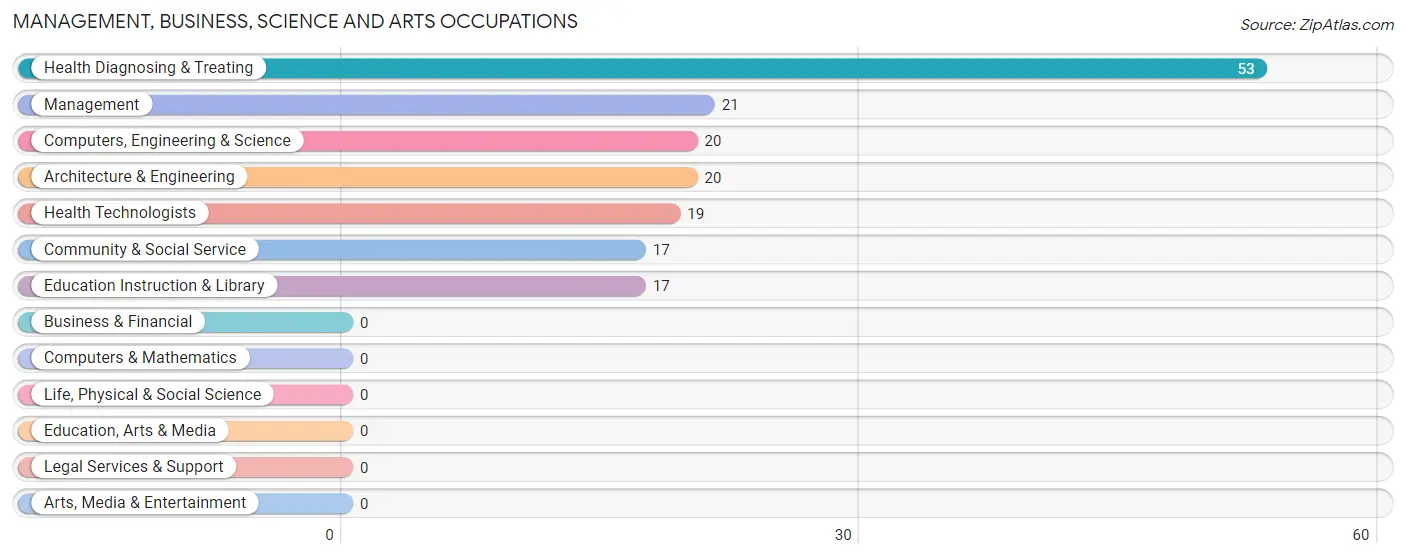
Management, Business, Science and Arts Occupations by Sex
Within the Management, Business, Science and Arts occupations in Brodhead, the most male-oriented occupations are Management (100.0%), Computers, Engineering & Science (100.0%), and Architecture & Engineering (100.0%), while the most female-oriented occupations are Community & Social Service (100.0%), Education Instruction & Library (100.0%), and Health Diagnosing & Treating (100.0%).
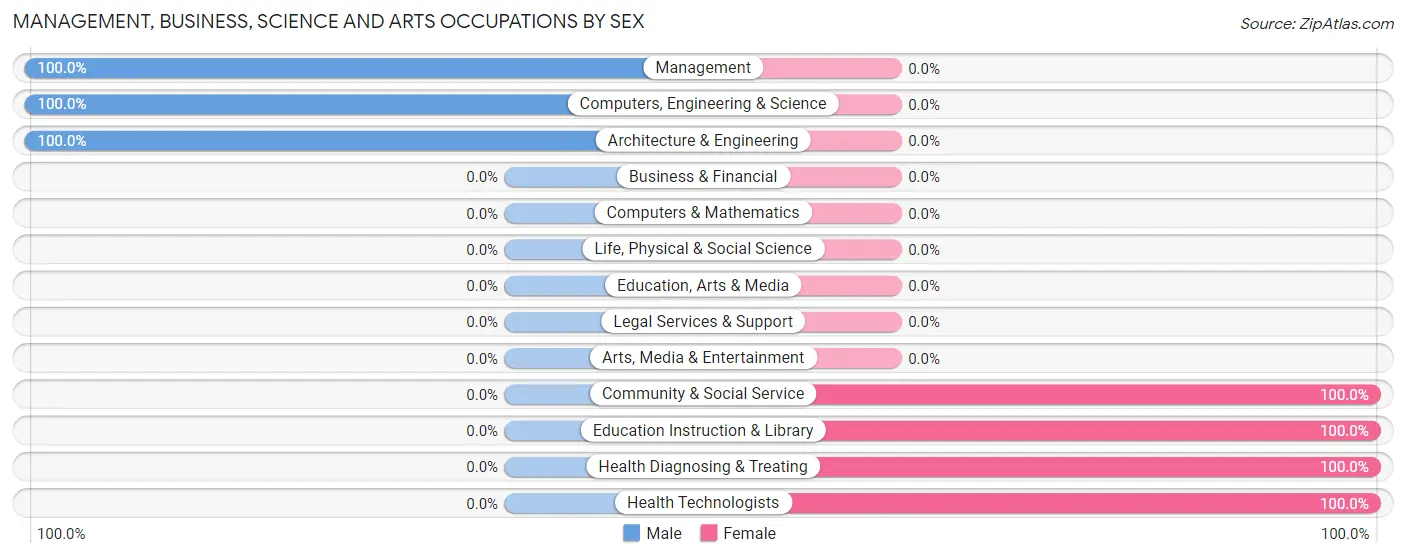
| Occupation | Male | Female |
| Management | 21 (100.0%) | 0 (0.0%) |
| Business & Financial | 0 (0.0%) | 0 (0.0%) |
| Computers, Engineering & Science | 20 (100.0%) | 0 (0.0%) |
| Computers & Mathematics | 0 (0.0%) | 0 (0.0%) |
| Architecture & Engineering | 20 (100.0%) | 0 (0.0%) |
| Life, Physical & Social Science | 0 (0.0%) | 0 (0.0%) |
| Community & Social Service | 0 (0.0%) | 17 (100.0%) |
| Education, Arts & Media | 0 (0.0%) | 0 (0.0%) |
| Legal Services & Support | 0 (0.0%) | 0 (0.0%) |
| Education Instruction & Library | 0 (0.0%) | 17 (100.0%) |
| Arts, Media & Entertainment | 0 (0.0%) | 0 (0.0%) |
| Health Diagnosing & Treating | 0 (0.0%) | 53 (100.0%) |
| Health Technologists | 0 (0.0%) | 19 (100.0%) |
| Total (Category) | 41 (36.9%) | 70 (63.1%) |
| Total (Overall) | 275 (58.3%) | 197 (41.7%) |
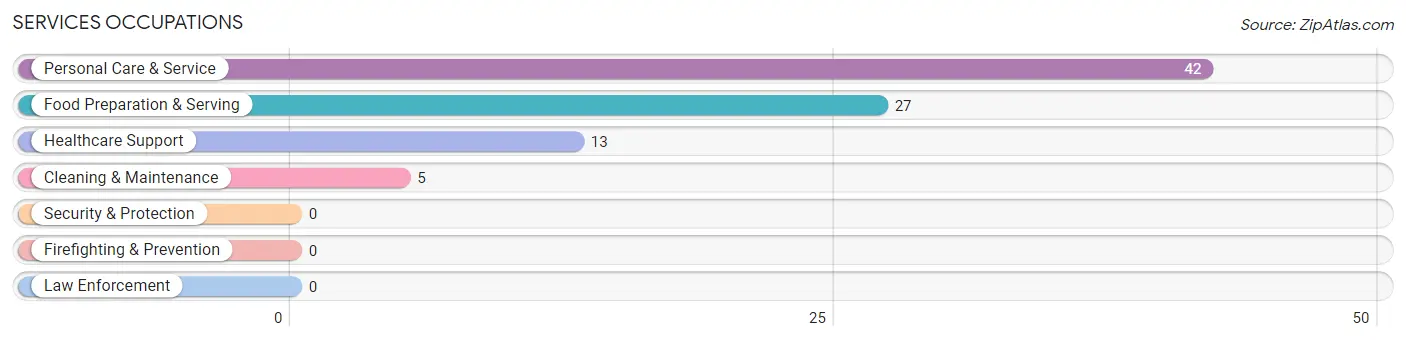
Services Occupations
The most common Services occupations in Brodhead are Personal Care & Service (42 | 8.9%), Food Preparation & Serving (27 | 5.7%), Healthcare Support (13 | 2.8%), and Cleaning & Maintenance (5 | 1.1%).
Services Occupations by Sex
Within the Services occupations in Brodhead, the most male-oriented occupations are Food Preparation & Serving (81.5%), Personal Care & Service (69.1%), and Cleaning & Maintenance (40.0%), while the most female-oriented occupations are Healthcare Support (100.0%), Cleaning & Maintenance (60.0%), and Personal Care & Service (30.9%).
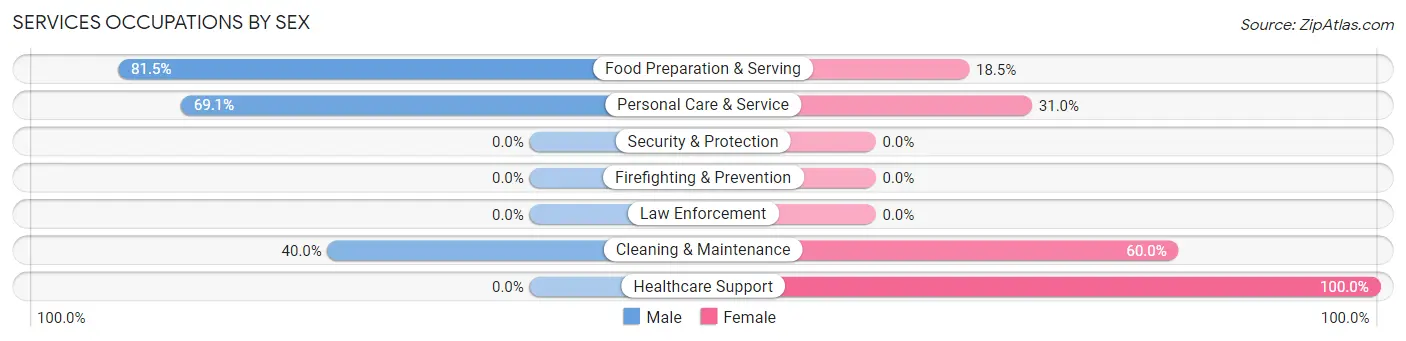
| Occupation | Male | Female |
| Healthcare Support | 0 (0.0%) | 13 (100.0%) |
| Security & Protection | 0 (0.0%) | 0 (0.0%) |
| Firefighting & Prevention | 0 (0.0%) | 0 (0.0%) |
| Law Enforcement | 0 (0.0%) | 0 (0.0%) |
| Food Preparation & Serving | 22 (81.5%) | 5 (18.5%) |
| Cleaning & Maintenance | 2 (40.0%) | 3 (60.0%) |
| Personal Care & Service | 29 (69.1%) | 13 (30.9%) |
| Total (Category) | 53 (60.9%) | 34 (39.1%) |
| Total (Overall) | 275 (58.3%) | 197 (41.7%) |
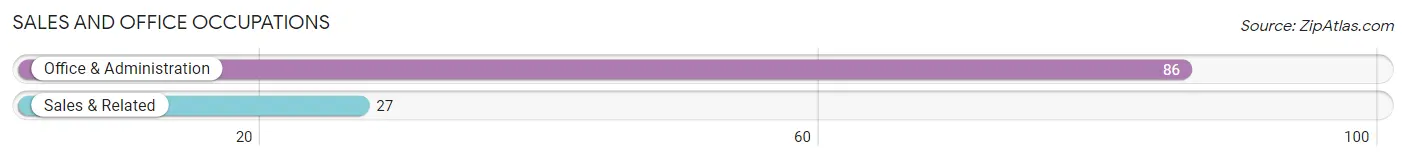
Sales and Office Occupations
The most common Sales and Office occupations in Brodhead are Office & Administration (86 | 18.2%), and Sales & Related (27 | 5.7%).
Sales and Office Occupations by Sex
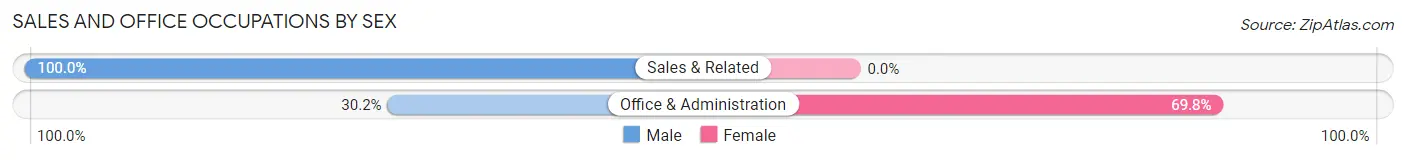
| Occupation | Male | Female |
| Sales & Related | 27 (100.0%) | 0 (0.0%) |
| Office & Administration | 26 (30.2%) | 60 (69.8%) |
| Total (Category) | 53 (46.9%) | 60 (53.1%) |
| Total (Overall) | 275 (58.3%) | 197 (41.7%) |
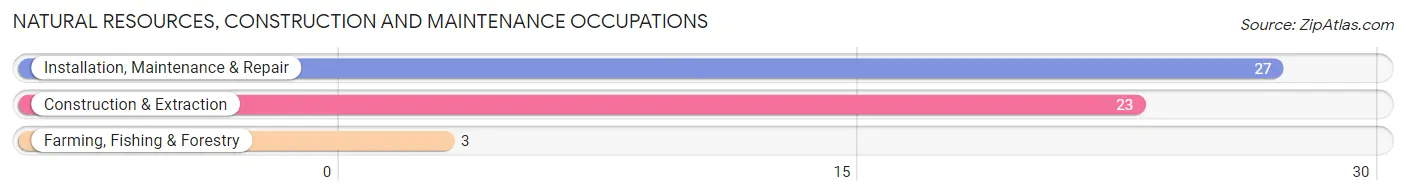
Natural Resources, Construction and Maintenance Occupations
The most common Natural Resources, Construction and Maintenance occupations in Brodhead are Installation, Maintenance & Repair (27 | 5.7%), Construction & Extraction (23 | 4.9%), and Farming, Fishing & Forestry (3 | 0.6%).
Natural Resources, Construction and Maintenance Occupations by Sex
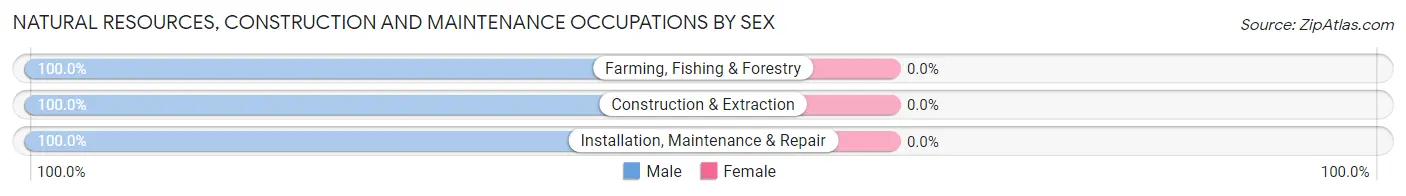
| Occupation | Male | Female |
| Farming, Fishing & Forestry | 3 (100.0%) | 0 (0.0%) |
| Construction & Extraction | 23 (100.0%) | 0 (0.0%) |
| Installation, Maintenance & Repair | 27 (100.0%) | 0 (0.0%) |
| Total (Category) | 53 (100.0%) | 0 (0.0%) |
| Total (Overall) | 275 (58.3%) | 197 (41.7%) |
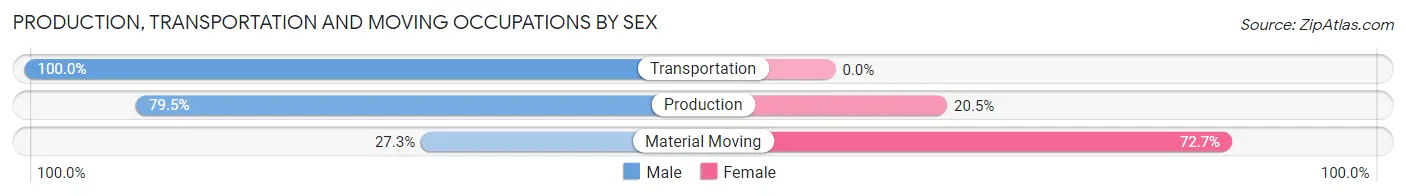
Production, Transportation and Moving Occupations
The most common Production, Transportation and Moving occupations in Brodhead are Production (83 | 17.6%), Material Moving (22 | 4.7%), and Transportation (3 | 0.6%).
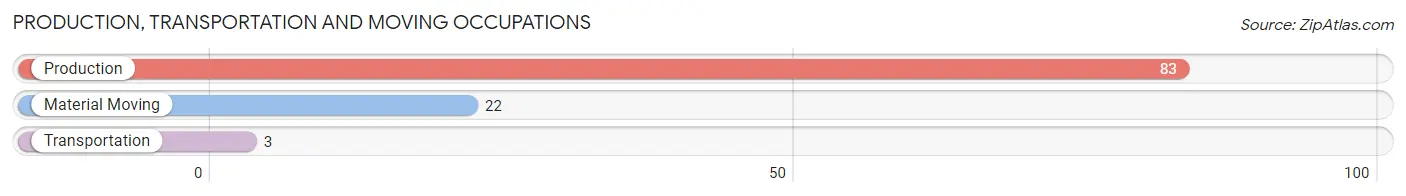
Production, Transportation and Moving Occupations by Sex
| Occupation | Male | Female |
| Production | 66 (79.5%) | 17 (20.5%) |
| Transportation | 3 (100.0%) | 0 (0.0%) |
| Material Moving | 6 (27.3%) | 16 (72.7%) |
| Total (Category) | 75 (69.4%) | 33 (30.6%) |
| Total (Overall) | 275 (58.3%) | 197 (41.7%) |
Employment Industries by Sex in Brodhead
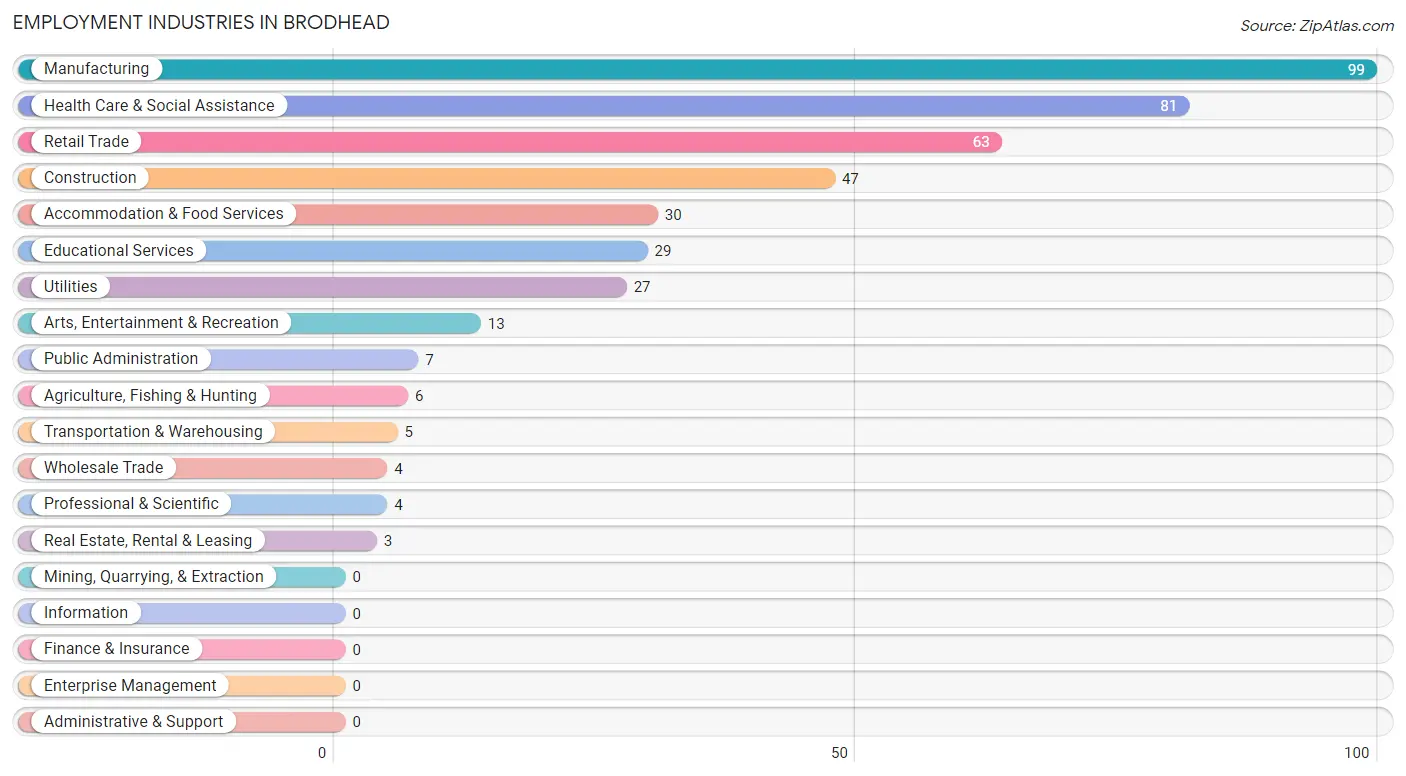
Employment Industries in Brodhead
The major employment industries in Brodhead include Manufacturing (99 | 21.0%), Health Care & Social Assistance (81 | 17.2%), Retail Trade (63 | 13.4%), Construction (47 | 10.0%), and Accommodation & Food Services (30 | 6.4%).
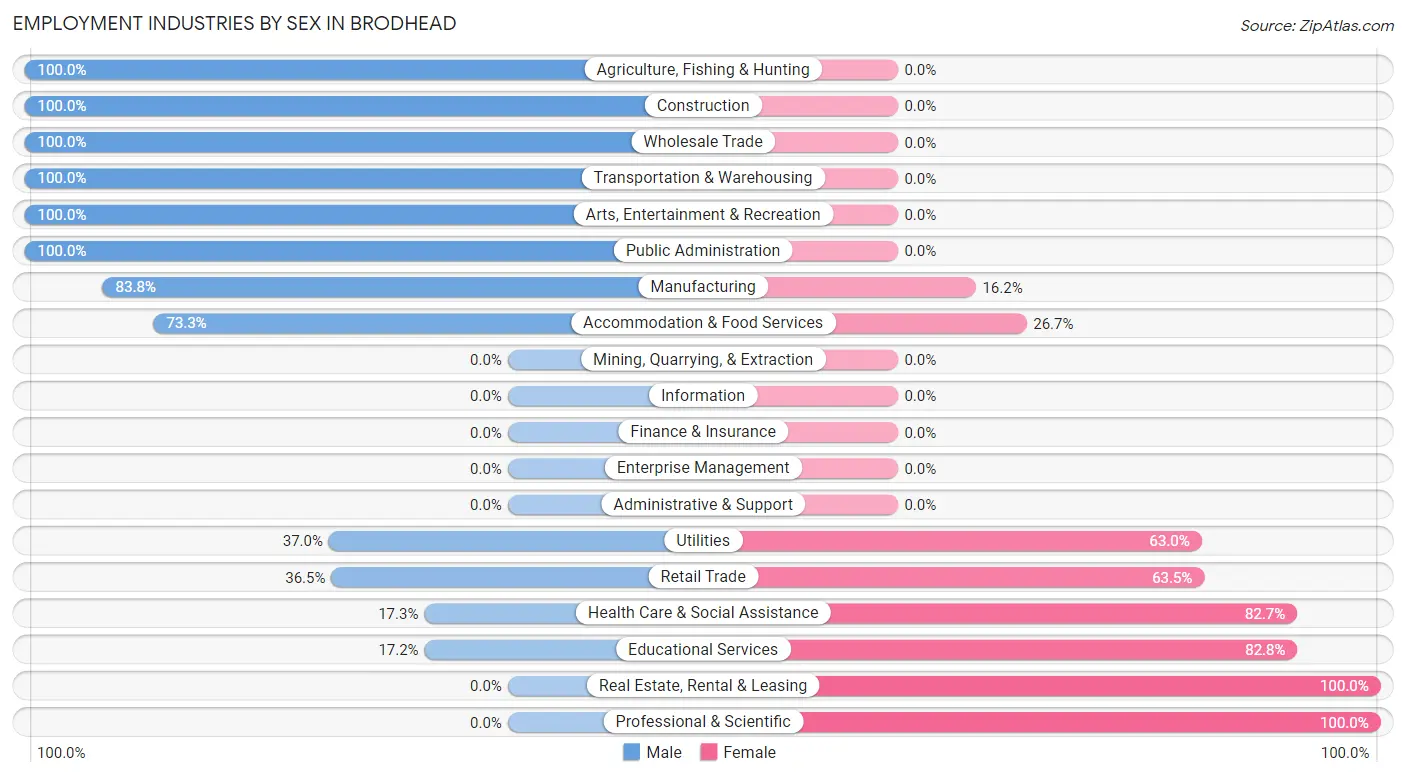
Employment Industries by Sex in Brodhead
The Brodhead industries that see more men than women are Agriculture, Fishing & Hunting (100.0%), Construction (100.0%), and Wholesale Trade (100.0%), whereas the industries that tend to have a higher number of women are Real Estate, Rental & Leasing (100.0%), Professional & Scientific (100.0%), and Educational Services (82.8%).
| Industry | Male | Female |
| Agriculture, Fishing & Hunting | 6 (100.0%) | 0 (0.0%) |
| Mining, Quarrying, & Extraction | 0 (0.0%) | 0 (0.0%) |
| Construction | 47 (100.0%) | 0 (0.0%) |
| Manufacturing | 83 (83.8%) | 16 (16.2%) |
| Wholesale Trade | 4 (100.0%) | 0 (0.0%) |
| Retail Trade | 23 (36.5%) | 40 (63.5%) |
| Transportation & Warehousing | 5 (100.0%) | 0 (0.0%) |
| Utilities | 10 (37.0%) | 17 (63.0%) |
| Information | 0 (0.0%) | 0 (0.0%) |
| Finance & Insurance | 0 (0.0%) | 0 (0.0%) |
| Real Estate, Rental & Leasing | 0 (0.0%) | 3 (100.0%) |
| Professional & Scientific | 0 (0.0%) | 4 (100.0%) |
| Enterprise Management | 0 (0.0%) | 0 (0.0%) |
| Administrative & Support | 0 (0.0%) | 0 (0.0%) |
| Educational Services | 5 (17.2%) | 24 (82.8%) |
| Health Care & Social Assistance | 14 (17.3%) | 67 (82.7%) |
| Arts, Entertainment & Recreation | 13 (100.0%) | 0 (0.0%) |
| Accommodation & Food Services | 22 (73.3%) | 8 (26.7%) |
| Public Administration | 7 (100.0%) | 0 (0.0%) |
| Total | 275 (58.3%) | 197 (41.7%) |
Education in Brodhead
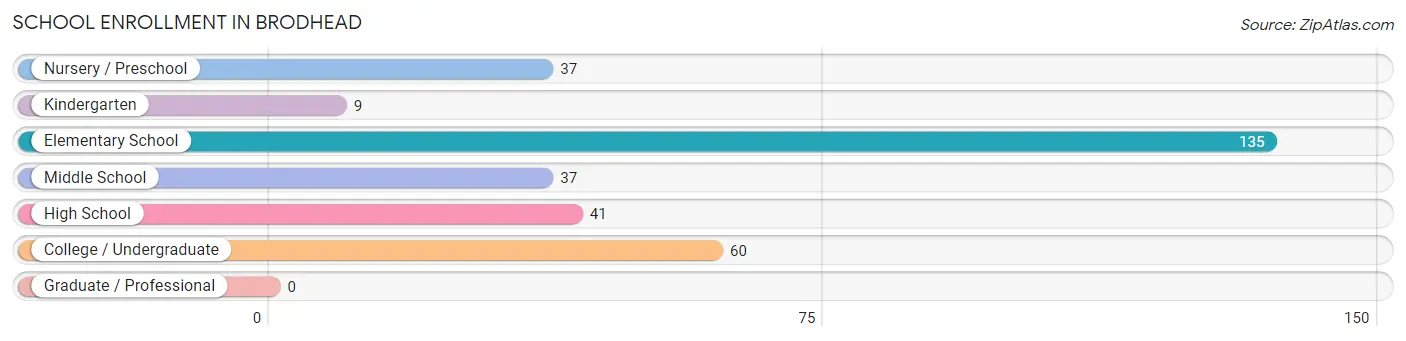
School Enrollment in Brodhead
The most common levels of schooling among the 319 students in Brodhead are elementary school (135 | 42.3%), college / undergraduate (60 | 18.8%), and high school (41 | 12.9%).
| School Level | # Students | % Students |
| Nursery / Preschool | 37 | 11.6% |
| Kindergarten | 9 | 2.8% |
| Elementary School | 135 | 42.3% |
| Middle School | 37 | 11.6% |
| High School | 41 | 12.9% |
| College / Undergraduate | 60 | 18.8% |
| Graduate / Professional | 0 | 0.0% |
| Total | 319 | 100.0% |
School Enrollment by Age by Funding Source in Brodhead
Out of a total of 319 students who are enrolled in schools in Brodhead, 8 (2.5%) attend a private institution, while the remaining 311 (97.5%) are enrolled in public schools. The age group of 25 to 34 year olds has the highest likelihood of being enrolled in private schools, with 8 (100.0% in the age bracket) enrolled. Conversely, the age group of 3 to 4 year olds has the lowest likelihood of being enrolled in a private school, with 15 (100.0% in the age bracket) attending a public institution.
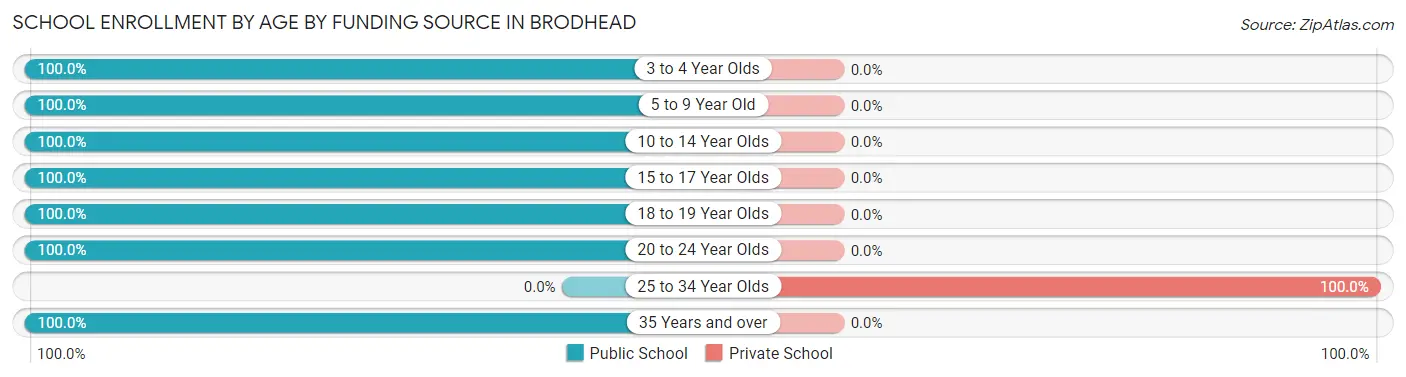
| Age Bracket | Public School | Private School |
| 3 to 4 Year Olds | 15 (100.0%) | 0 (0.0%) |
| 5 to 9 Year Old | 157 (100.0%) | 0 (0.0%) |
| 10 to 14 Year Olds | 46 (100.0%) | 0 (0.0%) |
| 15 to 17 Year Olds | 34 (100.0%) | 0 (0.0%) |
| 18 to 19 Year Olds | 7 (100.0%) | 0 (0.0%) |
| 20 to 24 Year Olds | 32 (100.0%) | 0 (0.0%) |
| 25 to 34 Year Olds | 0 (0.0%) | 8 (100.0%) |
| 35 Years and over | 20 (100.0%) | 0 (0.0%) |
| Total | 311 (97.5%) | 8 (2.5%) |
Educational Attainment by Field of Study in Brodhead
Science & technology (44 | 30.3%), education (29 | 20.0%), business (28 | 19.3%), literature & languages (16 | 11.0%), and visual & performing arts (10 | 6.9%) are the most common fields of study among 145 individuals in Brodhead who have obtained a bachelor's degree or higher.
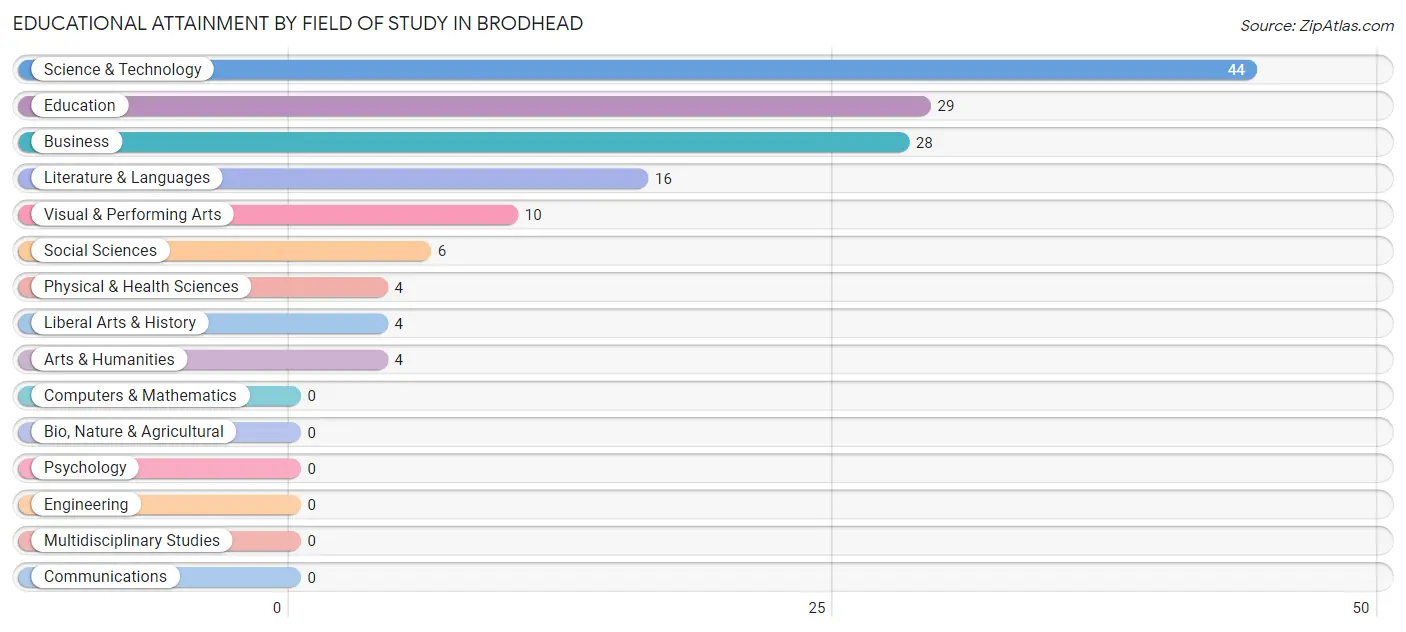
| Field of Study | # Graduates | % Graduates |
| Computers & Mathematics | 0 | 0.0% |
| Bio, Nature & Agricultural | 0 | 0.0% |
| Physical & Health Sciences | 4 | 2.8% |
| Psychology | 0 | 0.0% |
| Social Sciences | 6 | 4.1% |
| Engineering | 0 | 0.0% |
| Multidisciplinary Studies | 0 | 0.0% |
| Science & Technology | 44 | 30.3% |
| Business | 28 | 19.3% |
| Education | 29 | 20.0% |
| Literature & Languages | 16 | 11.0% |
| Liberal Arts & History | 4 | 2.8% |
| Visual & Performing Arts | 10 | 6.9% |
| Communications | 0 | 0.0% |
| Arts & Humanities | 4 | 2.8% |
| Total | 145 | 100.0% |
Transportation & Commute in Brodhead
Vehicle Availability by Sex in Brodhead
The most prevalent vehicle ownership categories in Brodhead are males with 2 vehicles (117, accounting for 43.7%) and females with 2 vehicles (88, making up 61.6%).
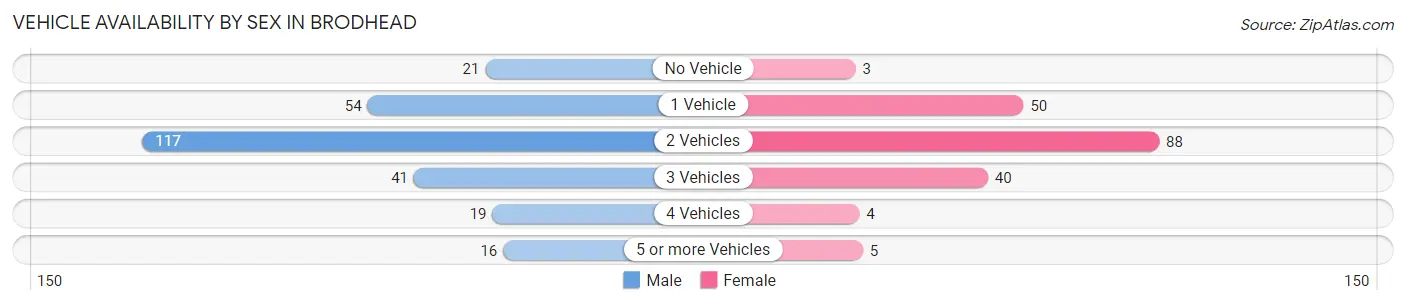
| Vehicles Available | Male | Female |
| No Vehicle | 21 (7.8%) | 3 (1.6%) |
| 1 Vehicle | 54 (20.2%) | 50 (26.3%) |
| 2 Vehicles | 117 (43.7%) | 88 (46.3%) |
| 3 Vehicles | 41 (15.3%) | 40 (21.0%) |
| 4 Vehicles | 19 (7.1%) | 4 (2.1%) |
| 5 or more Vehicles | 16 (6.0%) | 5 (2.6%) |
| Total | 268 (100.0%) | 190 (100.0%) |
Commute Time in Brodhead
The most frequently occuring commute durations in Brodhead are 5 to 9 minutes (79 commuters, 18.1%), 10 to 14 minutes (79 commuters, 18.1%), and 20 to 24 minutes (77 commuters, 17.7%).
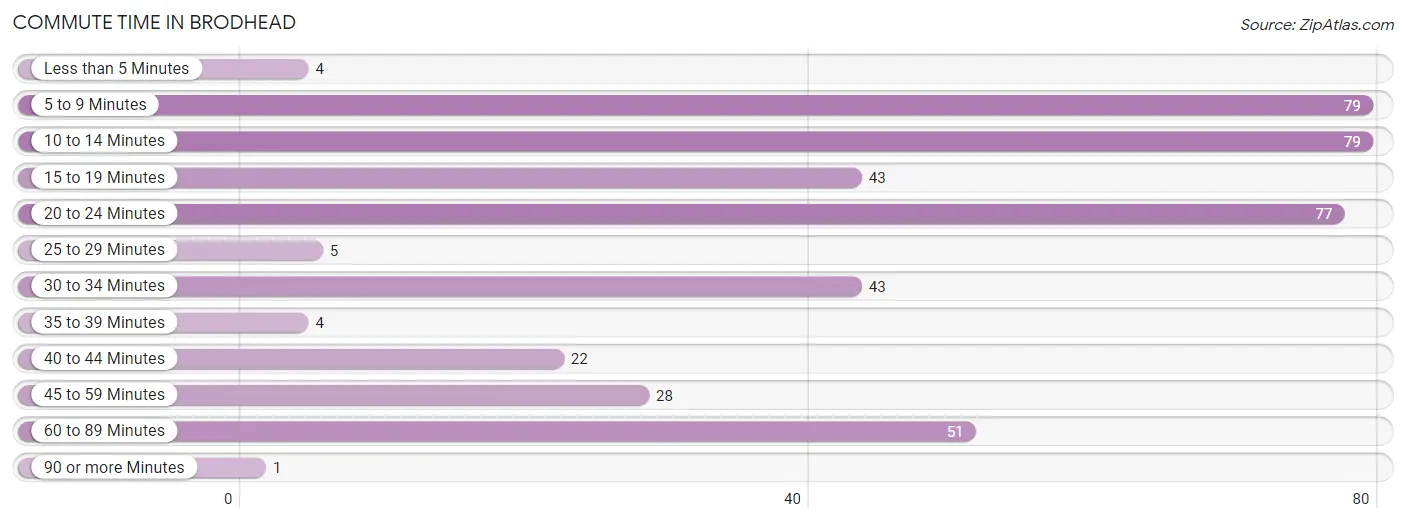
| Commute Time | # Commuters | % Commuters |
| Less than 5 Minutes | 4 | 0.9% |
| 5 to 9 Minutes | 79 | 18.1% |
| 10 to 14 Minutes | 79 | 18.1% |
| 15 to 19 Minutes | 43 | 9.9% |
| 20 to 24 Minutes | 77 | 17.7% |
| 25 to 29 Minutes | 5 | 1.1% |
| 30 to 34 Minutes | 43 | 9.9% |
| 35 to 39 Minutes | 4 | 0.9% |
| 40 to 44 Minutes | 22 | 5.1% |
| 45 to 59 Minutes | 28 | 6.4% |
| 60 to 89 Minutes | 51 | 11.7% |
| 90 or more Minutes | 1 | 0.2% |
Commute Time by Sex in Brodhead
The most common commute times in Brodhead are 60 to 89 minutes (51 commuters, 20.4%) for males and 20 to 24 minutes (45 commuters, 24.2%) for females.
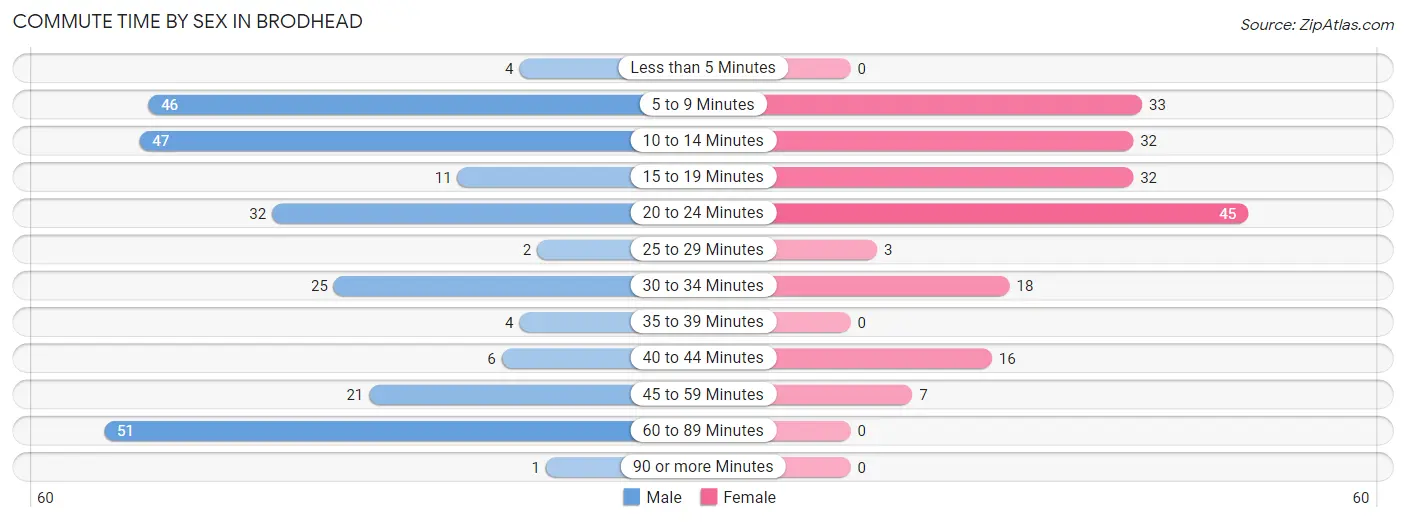
| Commute Time | Male | Female |
| Less than 5 Minutes | 4 (1.6%) | 0 (0.0%) |
| 5 to 9 Minutes | 46 (18.4%) | 33 (17.7%) |
| 10 to 14 Minutes | 47 (18.8%) | 32 (17.2%) |
| 15 to 19 Minutes | 11 (4.4%) | 32 (17.2%) |
| 20 to 24 Minutes | 32 (12.8%) | 45 (24.2%) |
| 25 to 29 Minutes | 2 (0.8%) | 3 (1.6%) |
| 30 to 34 Minutes | 25 (10.0%) | 18 (9.7%) |
| 35 to 39 Minutes | 4 (1.6%) | 0 (0.0%) |
| 40 to 44 Minutes | 6 (2.4%) | 16 (8.6%) |
| 45 to 59 Minutes | 21 (8.4%) | 7 (3.8%) |
| 60 to 89 Minutes | 51 (20.4%) | 0 (0.0%) |
| 90 or more Minutes | 1 (0.4%) | 0 (0.0%) |
Time of Departure to Work by Sex in Brodhead
The most frequent times of departure to work in Brodhead are 12:00 AM to 4:59 AM (46, 18.4%) for males and 7:30 AM to 7:59 AM (54, 29.0%) for females.
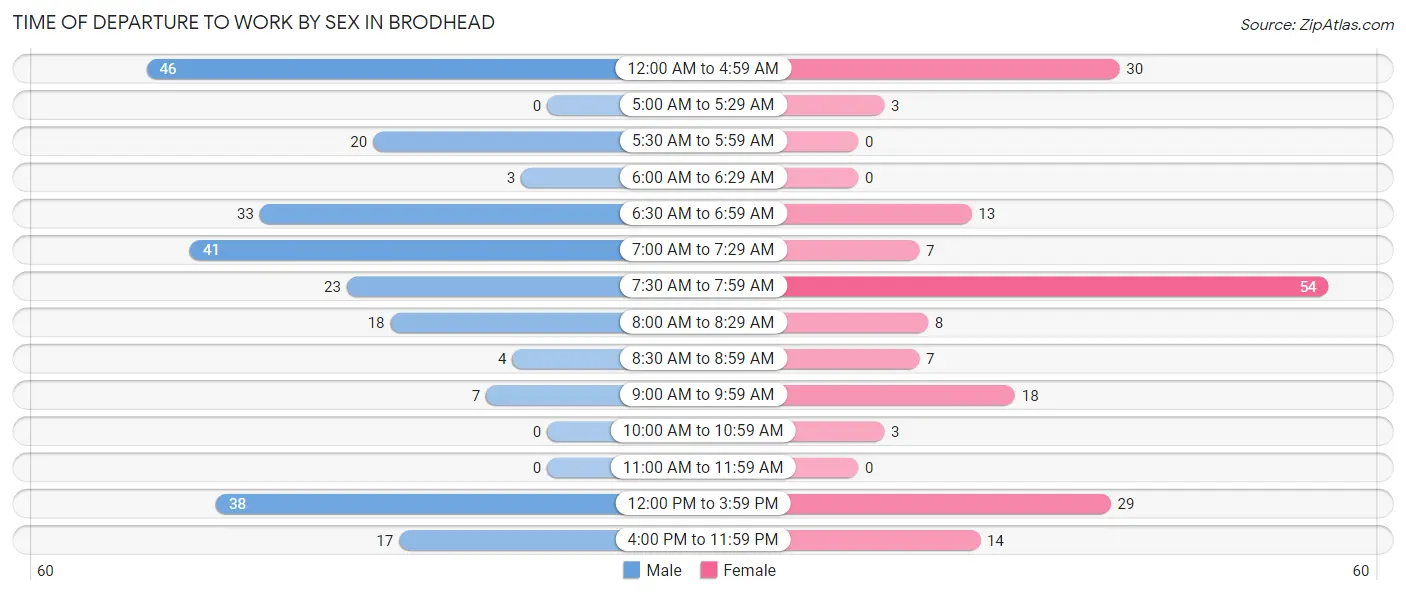
| Time of Departure | Male | Female |
| 12:00 AM to 4:59 AM | 46 (18.4%) | 30 (16.1%) |
| 5:00 AM to 5:29 AM | 0 (0.0%) | 3 (1.6%) |
| 5:30 AM to 5:59 AM | 20 (8.0%) | 0 (0.0%) |
| 6:00 AM to 6:29 AM | 3 (1.2%) | 0 (0.0%) |
| 6:30 AM to 6:59 AM | 33 (13.2%) | 13 (7.0%) |
| 7:00 AM to 7:29 AM | 41 (16.4%) | 7 (3.8%) |
| 7:30 AM to 7:59 AM | 23 (9.2%) | 54 (29.0%) |
| 8:00 AM to 8:29 AM | 18 (7.2%) | 8 (4.3%) |
| 8:30 AM to 8:59 AM | 4 (1.6%) | 7 (3.8%) |
| 9:00 AM to 9:59 AM | 7 (2.8%) | 18 (9.7%) |
| 10:00 AM to 10:59 AM | 0 (0.0%) | 3 (1.6%) |
| 11:00 AM to 11:59 AM | 0 (0.0%) | 0 (0.0%) |
| 12:00 PM to 3:59 PM | 38 (15.2%) | 29 (15.6%) |
| 4:00 PM to 11:59 PM | 17 (6.8%) | 14 (7.5%) |
| Total | 250 (100.0%) | 186 (100.0%) |
Housing Occupancy in Brodhead
Occupancy by Ownership in Brodhead
Of the total 470 dwellings in Brodhead, owner-occupied units account for 179 (38.1%), while renter-occupied units make up 291 (61.9%).
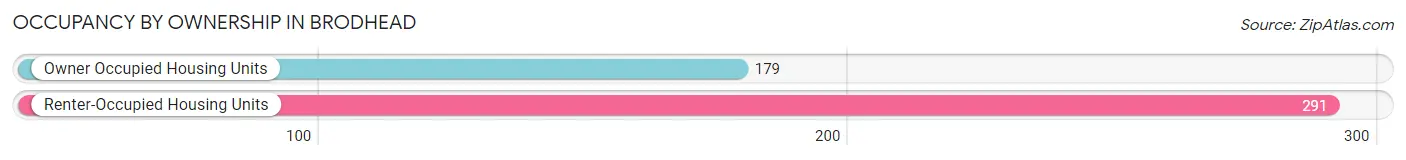
| Occupancy | # Housing Units | % Housing Units |
| Owner Occupied Housing Units | 179 | 38.1% |
| Renter-Occupied Housing Units | 291 | 61.9% |
| Total Occupied Housing Units | 470 | 100.0% |
Occupancy by Household Size in Brodhead
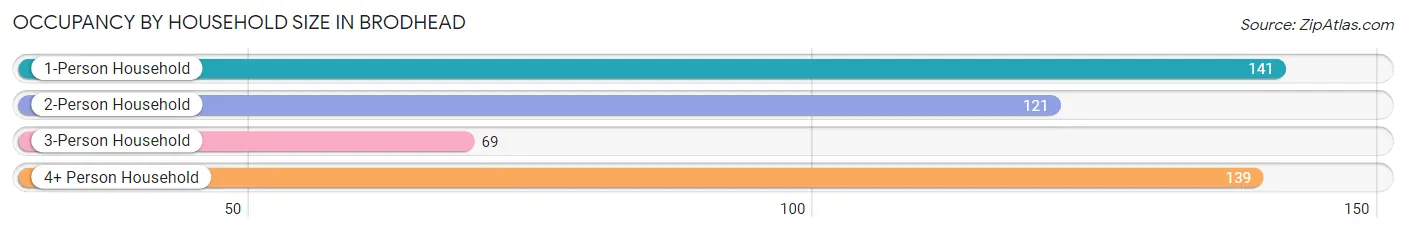
| Household Size | # Housing Units | % Housing Units |
| 1-Person Household | 141 | 30.0% |
| 2-Person Household | 121 | 25.7% |
| 3-Person Household | 69 | 14.7% |
| 4+ Person Household | 139 | 29.6% |
| Total Housing Units | 470 | 100.0% |
Occupancy by Ownership by Household Size in Brodhead
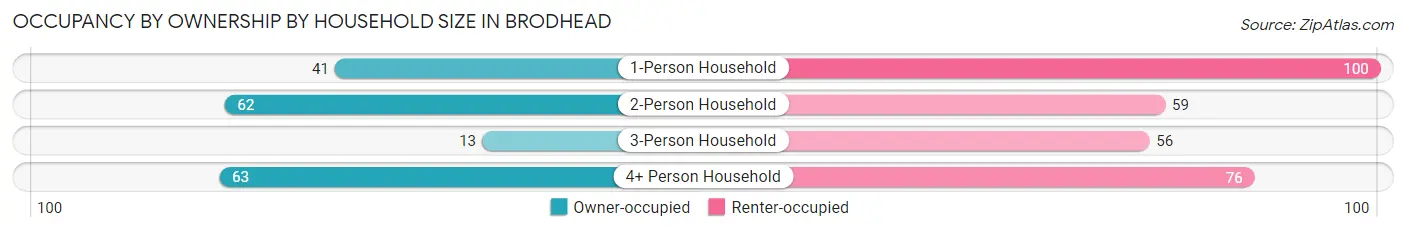
| Household Size | Owner-occupied | Renter-occupied |
| 1-Person Household | 41 (29.1%) | 100 (70.9%) |
| 2-Person Household | 62 (51.2%) | 59 (48.8%) |
| 3-Person Household | 13 (18.8%) | 56 (81.2%) |
| 4+ Person Household | 63 (45.3%) | 76 (54.7%) |
| Total Housing Units | 179 (38.1%) | 291 (61.9%) |
Occupancy by Educational Attainment in Brodhead
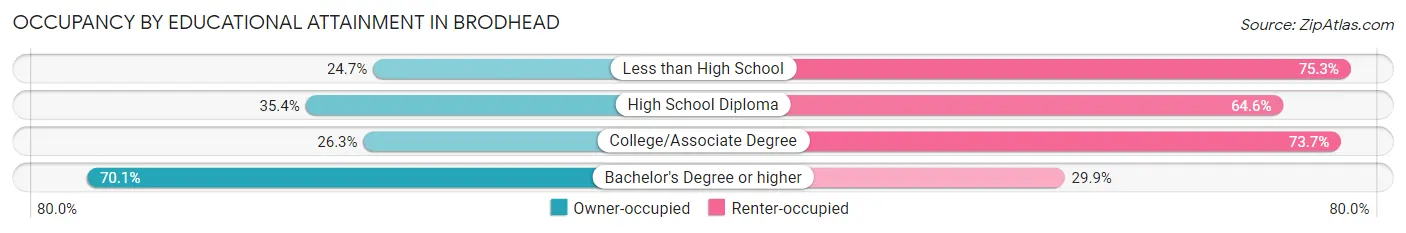
| Household Size | Owner-occupied | Renter-occupied |
| Less than High School | 24 (24.7%) | 73 (75.3%) |
| High School Diploma | 56 (35.4%) | 102 (64.6%) |
| College/Associate Degree | 31 (26.3%) | 87 (73.7%) |
| Bachelor's Degree or higher | 68 (70.1%) | 29 (29.9%) |
Occupancy by Age of Householder in Brodhead
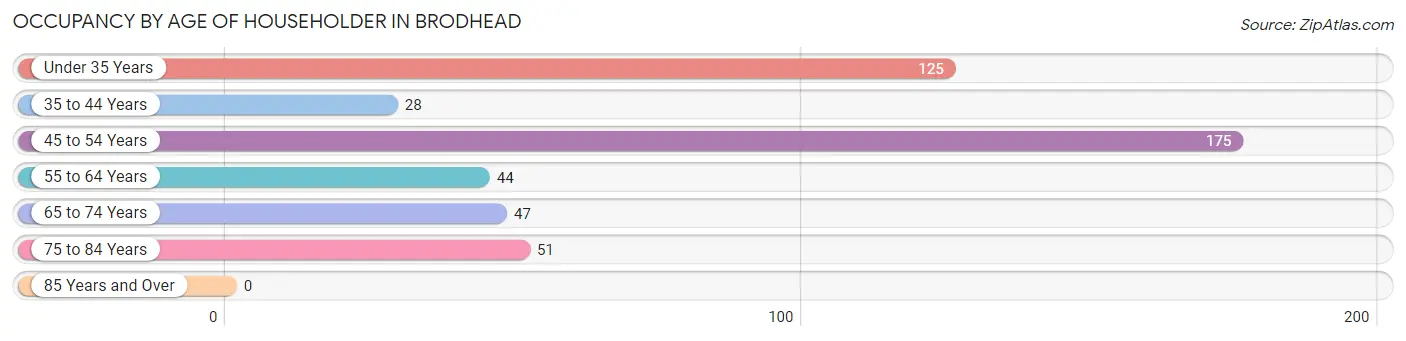
| Age Bracket | # Households | % Households |
| Under 35 Years | 125 | 26.6% |
| 35 to 44 Years | 28 | 6.0% |
| 45 to 54 Years | 175 | 37.2% |
| 55 to 64 Years | 44 | 9.4% |
| 65 to 74 Years | 47 | 10.0% |
| 75 to 84 Years | 51 | 10.8% |
| 85 Years and Over | 0 | 0.0% |
| Total | 470 | 100.0% |
Housing Finances in Brodhead
Median Income by Occupancy in Brodhead
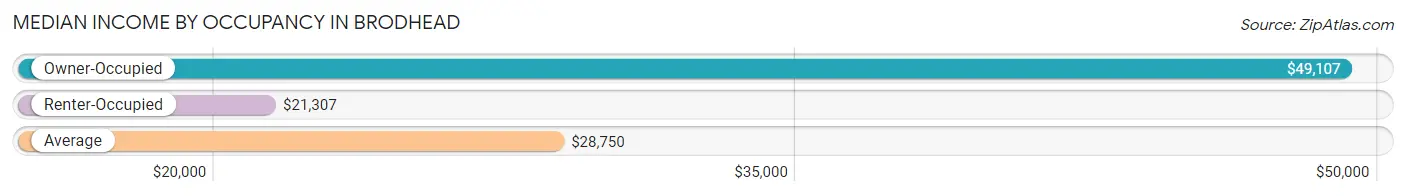
| Occupancy Type | # Households | Median Income |
| Owner-Occupied | 179 (38.1%) | $49,107 |
| Renter-Occupied | 291 (61.9%) | $21,307 |
| Average | 470 (100.0%) | $28,750 |
Occupancy by Householder Income Bracket in Brodhead
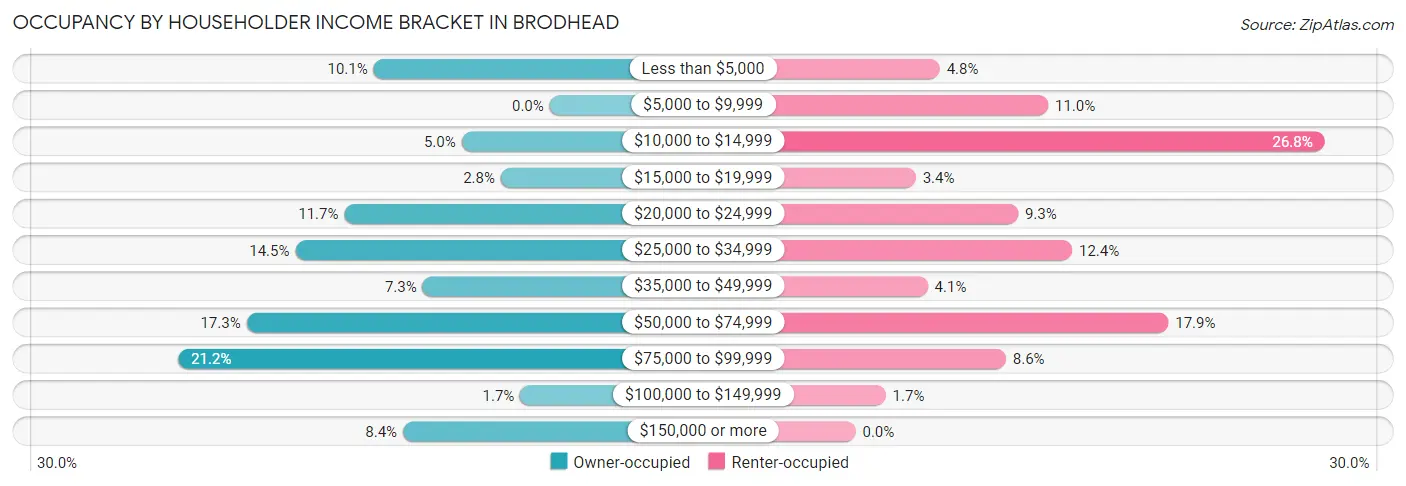
| Income Bracket | Owner-occupied | Renter-occupied |
| Less than $5,000 | 18 (10.1%) | 14 (4.8%) |
| $5,000 to $9,999 | 0 (0.0%) | 32 (11.0%) |
| $10,000 to $14,999 | 9 (5.0%) | 78 (26.8%) |
| $15,000 to $19,999 | 5 (2.8%) | 10 (3.4%) |
| $20,000 to $24,999 | 21 (11.7%) | 27 (9.3%) |
| $25,000 to $34,999 | 26 (14.5%) | 36 (12.4%) |
| $35,000 to $49,999 | 13 (7.3%) | 12 (4.1%) |
| $50,000 to $74,999 | 31 (17.3%) | 52 (17.9%) |
| $75,000 to $99,999 | 38 (21.2%) | 25 (8.6%) |
| $100,000 to $149,999 | 3 (1.7%) | 5 (1.7%) |
| $150,000 or more | 15 (8.4%) | 0 (0.0%) |
| Total | 179 (100.0%) | 291 (100.0%) |
Monthly Housing Cost Tiers in Brodhead
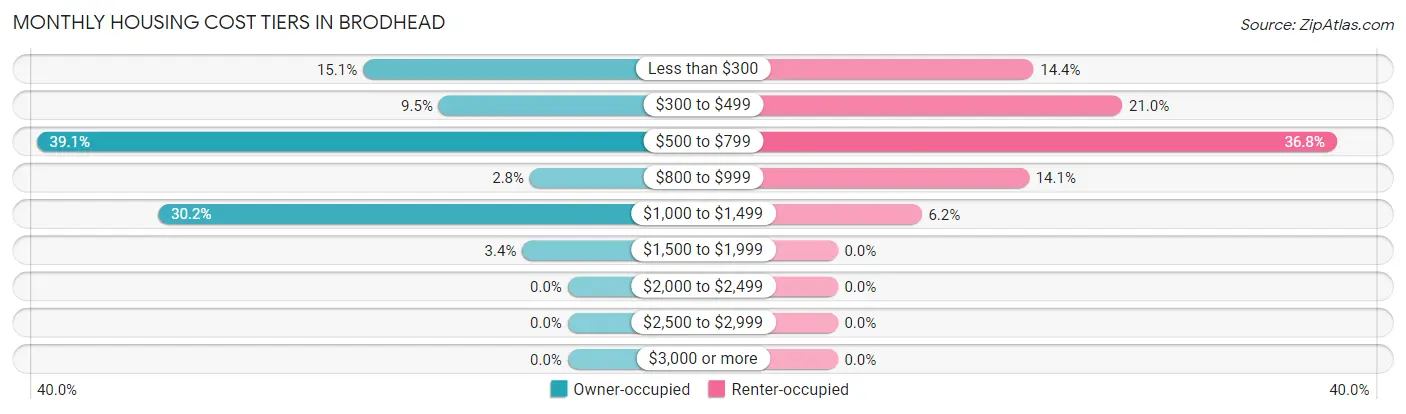
| Monthly Cost | Owner-occupied | Renter-occupied |
| Less than $300 | 27 (15.1%) | 42 (14.4%) |
| $300 to $499 | 17 (9.5%) | 61 (21.0%) |
| $500 to $799 | 70 (39.1%) | 107 (36.8%) |
| $800 to $999 | 5 (2.8%) | 41 (14.1%) |
| $1,000 to $1,499 | 54 (30.2%) | 18 (6.2%) |
| $1,500 to $1,999 | 6 (3.4%) | 0 (0.0%) |
| $2,000 to $2,499 | 0 (0.0%) | 0 (0.0%) |
| $2,500 to $2,999 | 0 (0.0%) | 0 (0.0%) |
| $3,000 or more | 0 (0.0%) | 0 (0.0%) |
| Total | 179 (100.0%) | 291 (100.0%) |
Physical Housing Characteristics in Brodhead
Housing Structures in Brodhead
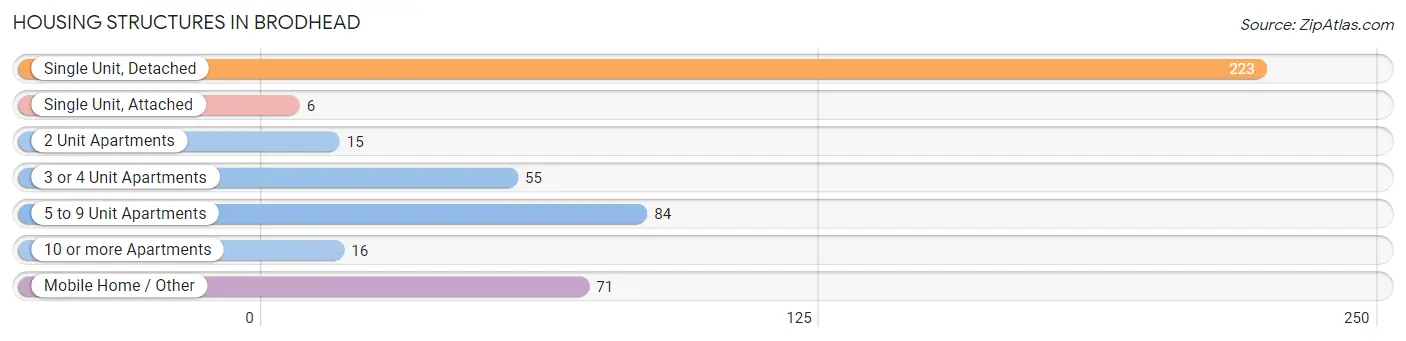
| Structure Type | # Housing Units | % Housing Units |
| Single Unit, Detached | 223 | 47.4% |
| Single Unit, Attached | 6 | 1.3% |
| 2 Unit Apartments | 15 | 3.2% |
| 3 or 4 Unit Apartments | 55 | 11.7% |
| 5 to 9 Unit Apartments | 84 | 17.9% |
| 10 or more Apartments | 16 | 3.4% |
| Mobile Home / Other | 71 | 15.1% |
| Total | 470 | 100.0% |
Housing Structures by Occupancy in Brodhead
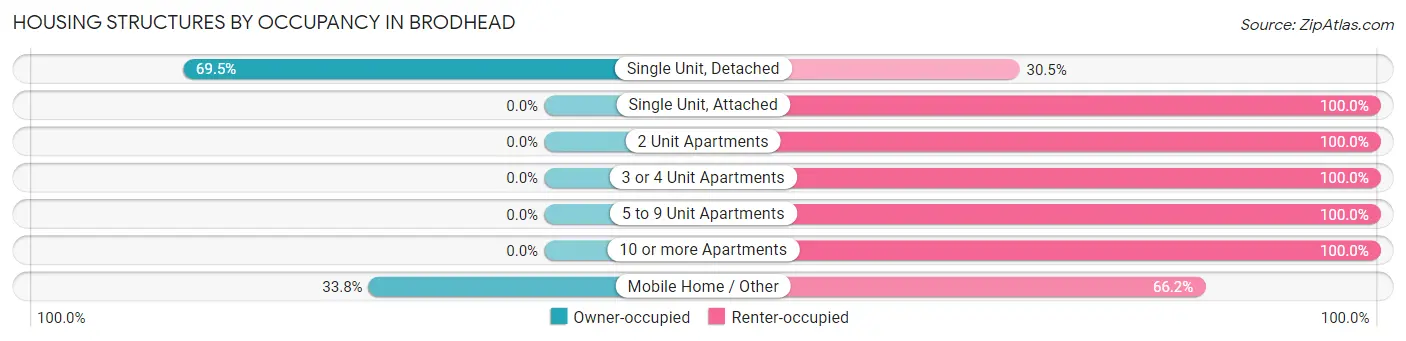
| Structure Type | Owner-occupied | Renter-occupied |
| Single Unit, Detached | 155 (69.5%) | 68 (30.5%) |
| Single Unit, Attached | 0 (0.0%) | 6 (100.0%) |
| 2 Unit Apartments | 0 (0.0%) | 15 (100.0%) |
| 3 or 4 Unit Apartments | 0 (0.0%) | 55 (100.0%) |
| 5 to 9 Unit Apartments | 0 (0.0%) | 84 (100.0%) |
| 10 or more Apartments | 0 (0.0%) | 16 (100.0%) |
| Mobile Home / Other | 24 (33.8%) | 47 (66.2%) |
| Total | 179 (38.1%) | 291 (61.9%) |
Housing Structures by Number of Rooms in Brodhead
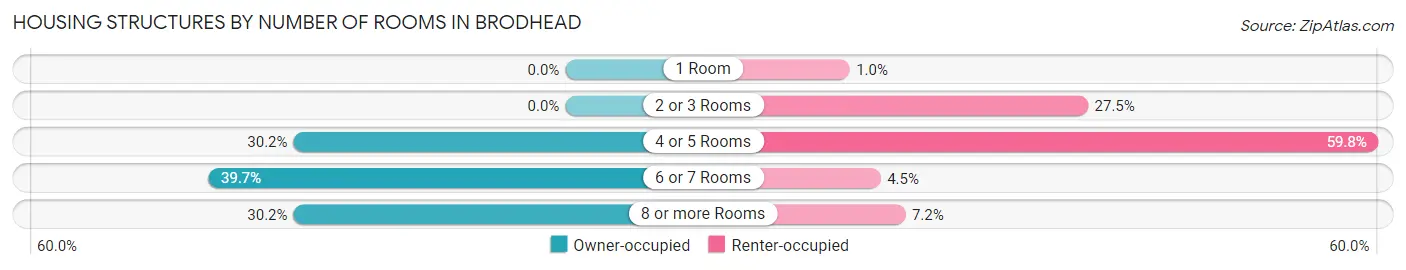
| Number of Rooms | Owner-occupied | Renter-occupied |
| 1 Room | 0 (0.0%) | 3 (1.0%) |
| 2 or 3 Rooms | 0 (0.0%) | 80 (27.5%) |
| 4 or 5 Rooms | 54 (30.2%) | 174 (59.8%) |
| 6 or 7 Rooms | 71 (39.7%) | 13 (4.5%) |
| 8 or more Rooms | 54 (30.2%) | 21 (7.2%) |
| Total | 179 (100.0%) | 291 (100.0%) |
Housing Structure by Heating Type in Brodhead
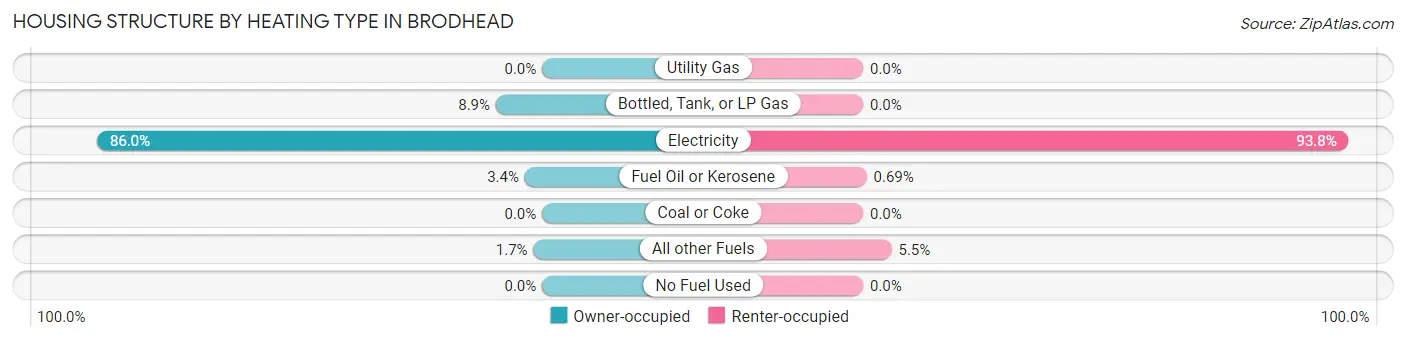
| Heating Type | Owner-occupied | Renter-occupied |
| Utility Gas | 0 (0.0%) | 0 (0.0%) |
| Bottled, Tank, or LP Gas | 16 (8.9%) | 0 (0.0%) |
| Electricity | 154 (86.0%) | 273 (93.8%) |
| Fuel Oil or Kerosene | 6 (3.4%) | 2 (0.7%) |
| Coal or Coke | 0 (0.0%) | 0 (0.0%) |
| All other Fuels | 3 (1.7%) | 16 (5.5%) |
| No Fuel Used | 0 (0.0%) | 0 (0.0%) |
| Total | 179 (100.0%) | 291 (100.0%) |
Household Vehicle Usage in Brodhead
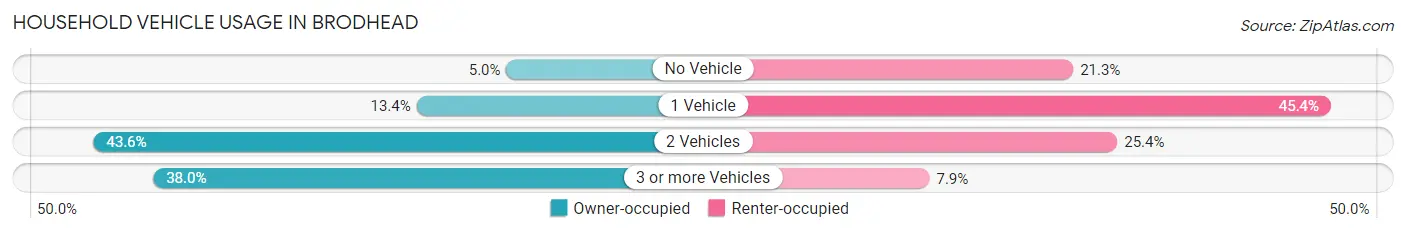
| Vehicles per Household | Owner-occupied | Renter-occupied |
| No Vehicle | 9 (5.0%) | 62 (21.3%) |
| 1 Vehicle | 24 (13.4%) | 132 (45.4%) |
| 2 Vehicles | 78 (43.6%) | 74 (25.4%) |
| 3 or more Vehicles | 68 (38.0%) | 23 (7.9%) |
| Total | 179 (100.0%) | 291 (100.0%) |
Real Estate & Mortgages in Brodhead
Real Estate and Mortgage Overview in Brodhead
| Characteristic | Without Mortgage | With Mortgage |
| Housing Units | 73 | 106 |
| Median Property Value | $153,600 | $120,800 |
| Median Household Income | - | - |
| Monthly Housing Costs | $382 | $0 |
| Real Estate Taxes | - | - |
Property Value by Mortgage Status in Brodhead
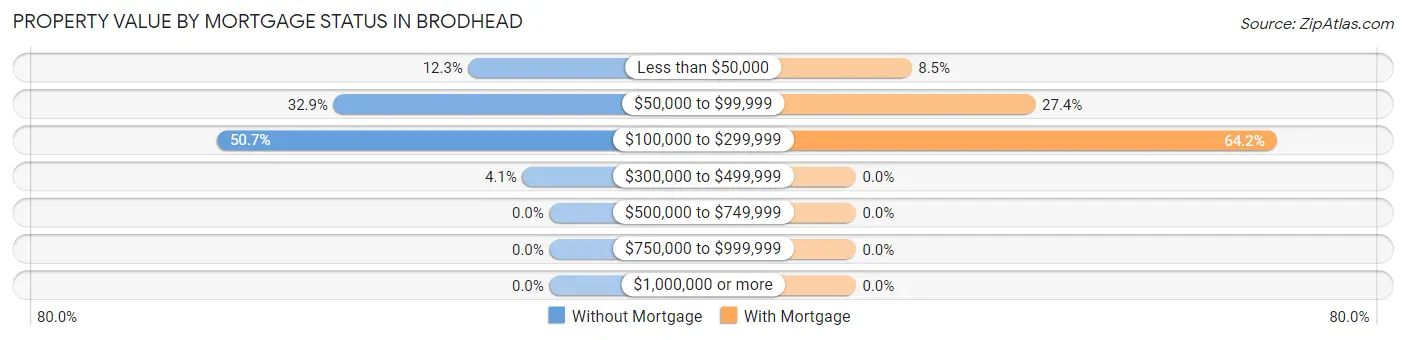
| Property Value | Without Mortgage | With Mortgage |
| Less than $50,000 | 9 (12.3%) | 9 (8.5%) |
| $50,000 to $99,999 | 24 (32.9%) | 29 (27.4%) |
| $100,000 to $299,999 | 37 (50.7%) | 68 (64.1%) |
| $300,000 to $499,999 | 3 (4.1%) | 0 (0.0%) |
| $500,000 to $749,999 | 0 (0.0%) | 0 (0.0%) |
| $750,000 to $999,999 | 0 (0.0%) | 0 (0.0%) |
| $1,000,000 or more | 0 (0.0%) | 0 (0.0%) |
| Total | 73 (100.0%) | 106 (100.0%) |
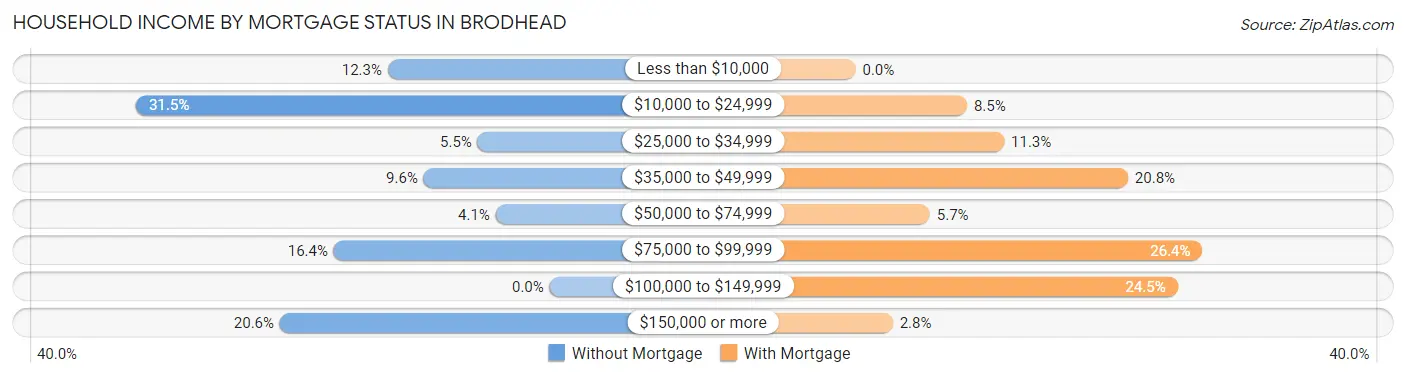
Household Income by Mortgage Status in Brodhead
| Household Income | Without Mortgage | With Mortgage |
| Less than $10,000 | 9 (12.3%) | 0 (0.0%) |
| $10,000 to $24,999 | 23 (31.5%) | 9 (8.5%) |
| $25,000 to $34,999 | 4 (5.5%) | 12 (11.3%) |
| $35,000 to $49,999 | 7 (9.6%) | 22 (20.7%) |
| $50,000 to $74,999 | 3 (4.1%) | 6 (5.7%) |
| $75,000 to $99,999 | 12 (16.4%) | 28 (26.4%) |
| $100,000 to $149,999 | 0 (0.0%) | 26 (24.5%) |
| $150,000 or more | 15 (20.5%) | 3 (2.8%) |
| Total | 73 (100.0%) | 106 (100.0%) |
Property Value to Household Income Ratio in Brodhead
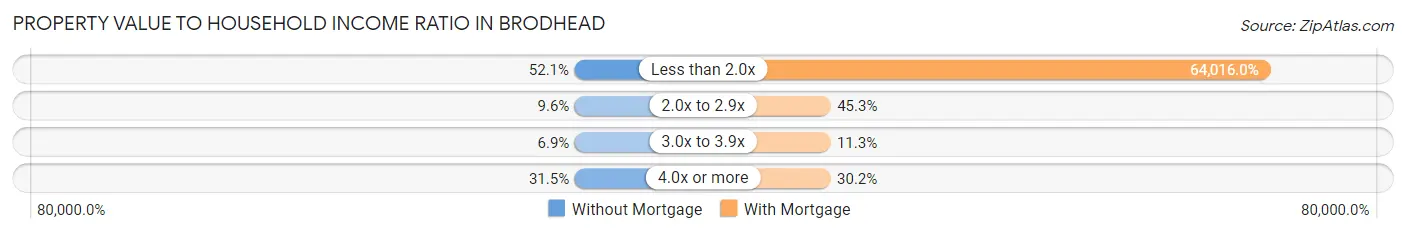
| Value-to-Income Ratio | Without Mortgage | With Mortgage |
| Less than 2.0x | 38 (52.0%) | 67,857 (64,016.0%) |
| 2.0x to 2.9x | 7 (9.6%) | 48 (45.3%) |
| 3.0x to 3.9x | 5 (6.9%) | 12 (11.3%) |
| 4.0x or more | 23 (31.5%) | 32 (30.2%) |
| Total | 73 (100.0%) | 106 (100.0%) |
Real Estate Taxes by Mortgage Status in Brodhead
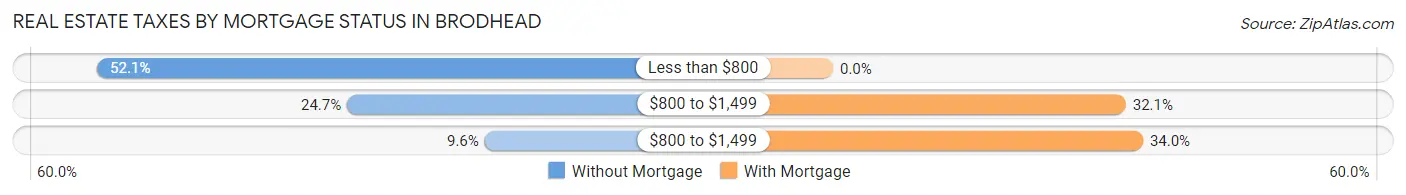
| Property Taxes | Without Mortgage | With Mortgage |
| Less than $800 | 38 (52.0%) | 0 (0.0%) |
| $800 to $1,499 | 18 (24.7%) | 34 (32.1%) |
| $800 to $1,499 | 7 (9.6%) | 36 (34.0%) |
| Total | 73 (100.0%) | 106 (100.0%) |
Health & Disability in Brodhead
Health Insurance Coverage by Age in Brodhead
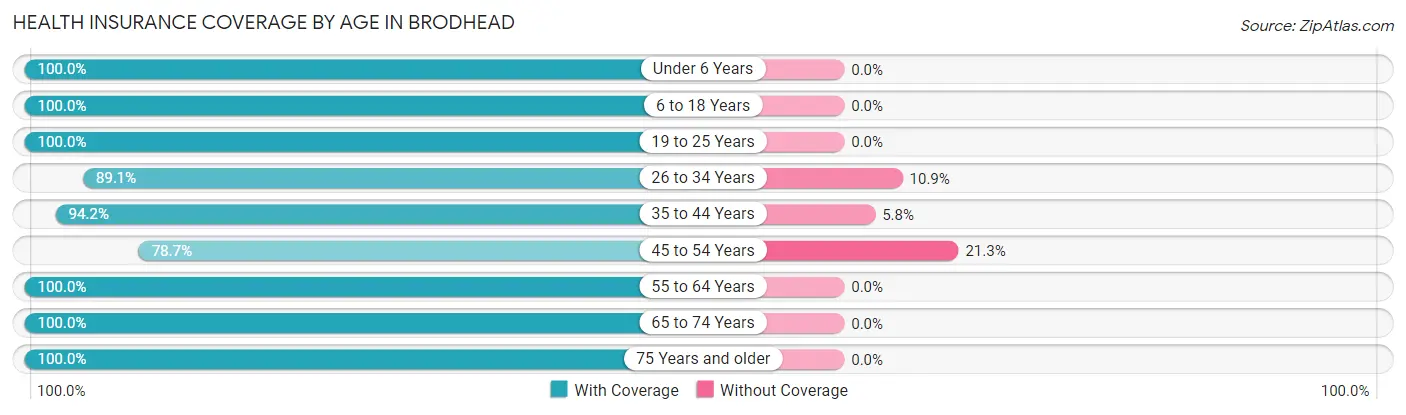
| Age Bracket | With Coverage | Without Coverage |
| Under 6 Years | 153 (100.0%) | 0 (0.0%) |
| 6 to 18 Years | 229 (100.0%) | 0 (0.0%) |
| 19 to 25 Years | 118 (100.0%) | 0 (0.0%) |
| 26 to 34 Years | 164 (89.1%) | 20 (10.9%) |
| 35 to 44 Years | 98 (94.2%) | 6 (5.8%) |
| 45 to 54 Years | 196 (78.7%) | 53 (21.3%) |
| 55 to 64 Years | 96 (100.0%) | 0 (0.0%) |
| 65 to 74 Years | 64 (100.0%) | 0 (0.0%) |
| 75 Years and older | 61 (100.0%) | 0 (0.0%) |
| Total | 1,179 (93.7%) | 79 (6.3%) |
Health Insurance Coverage by Citizenship Status in Brodhead
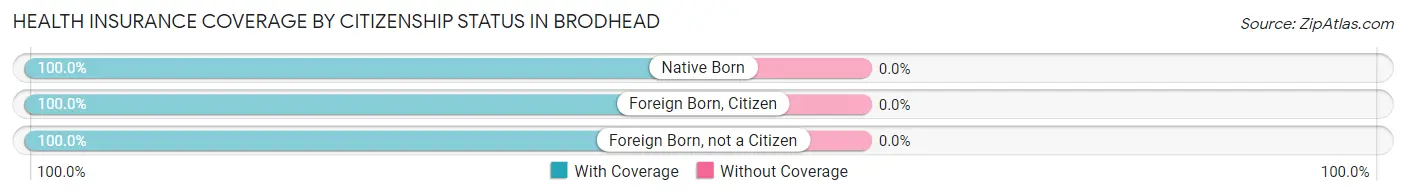
| Citizenship Status | With Coverage | Without Coverage |
| Native Born | 153 (100.0%) | 0 (0.0%) |
| Foreign Born, Citizen | 229 (100.0%) | 0 (0.0%) |
| Foreign Born, not a Citizen | 118 (100.0%) | 0 (0.0%) |
Health Insurance Coverage by Household Income in Brodhead
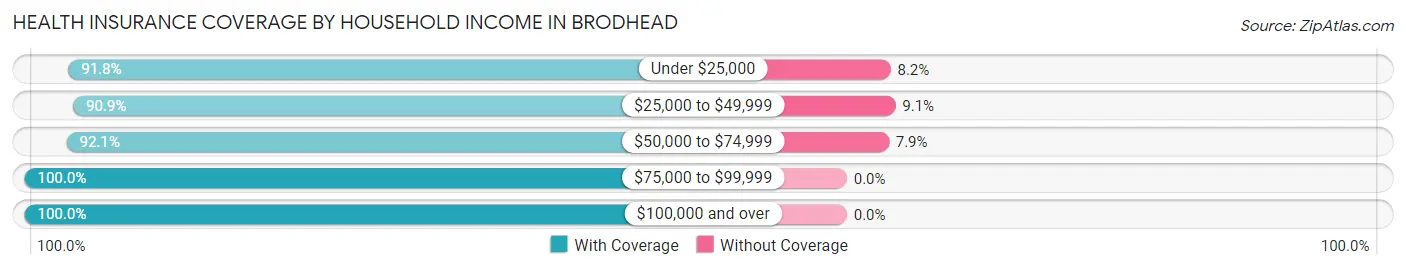
| Household Income | With Coverage | Without Coverage |
| Under $25,000 | 392 (91.8%) | 35 (8.2%) |
| $25,000 to $49,999 | 200 (90.9%) | 20 (9.1%) |
| $50,000 to $74,999 | 281 (92.1%) | 24 (7.9%) |
| $75,000 to $99,999 | 222 (100.0%) | 0 (0.0%) |
| $100,000 and over | 84 (100.0%) | 0 (0.0%) |
Public vs Private Health Insurance Coverage by Age in Brodhead
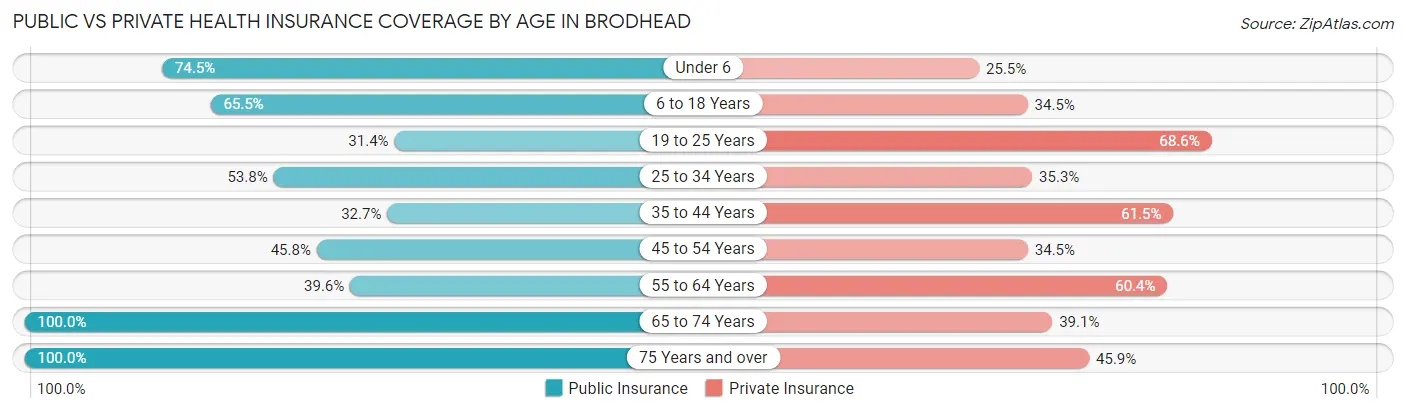
| Age Bracket | Public Insurance | Private Insurance |
| Under 6 | 114 (74.5%) | 39 (25.5%) |
| 6 to 18 Years | 150 (65.5%) | 79 (34.5%) |
| 19 to 25 Years | 37 (31.4%) | 81 (68.6%) |
| 25 to 34 Years | 99 (53.8%) | 65 (35.3%) |
| 35 to 44 Years | 34 (32.7%) | 64 (61.5%) |
| 45 to 54 Years | 114 (45.8%) | 86 (34.5%) |
| 55 to 64 Years | 38 (39.6%) | 58 (60.4%) |
| 65 to 74 Years | 64 (100.0%) | 25 (39.1%) |
| 75 Years and over | 61 (100.0%) | 28 (45.9%) |
| Total | 711 (56.5%) | 525 (41.7%) |
Disability Status by Sex by Age in Brodhead
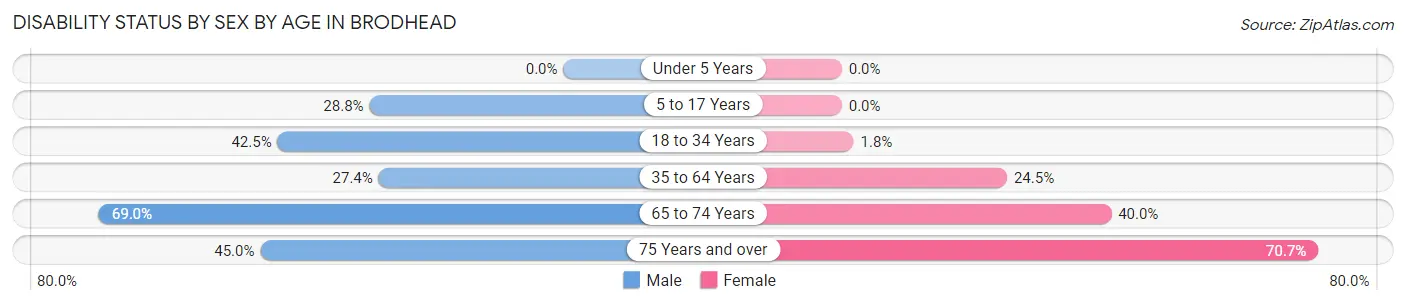
| Age Bracket | Male | Female |
| Under 5 Years | 0 (0.0%) | 0 (0.0%) |
| 5 to 17 Years | 36 (28.8%) | 0 (0.0%) |
| 18 to 34 Years | 59 (42.4%) | 3 (1.8%) |
| 35 to 64 Years | 65 (27.4%) | 52 (24.5%) |
| 65 to 74 Years | 20 (69.0%) | 14 (40.0%) |
| 75 Years and over | 9 (45.0%) | 29 (70.7%) |
Disability Class by Sex by Age in Brodhead
Disability Class: Hearing Difficulty
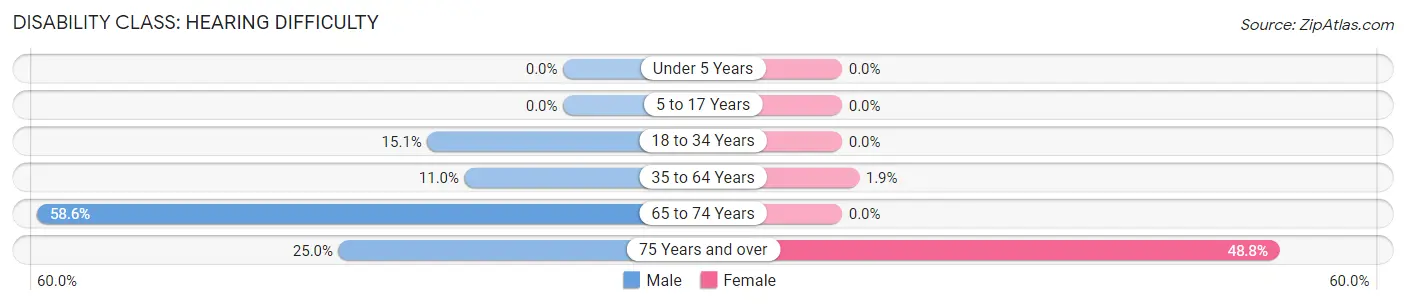
| Age Bracket | Male | Female |
| Under 5 Years | 0 (0.0%) | 0 (0.0%) |
| 5 to 17 Years | 0 (0.0%) | 0 (0.0%) |
| 18 to 34 Years | 21 (15.1%) | 0 (0.0%) |
| 35 to 64 Years | 26 (11.0%) | 4 (1.9%) |
| 65 to 74 Years | 17 (58.6%) | 0 (0.0%) |
| 75 Years and over | 5 (25.0%) | 20 (48.8%) |
Disability Class: Vision Difficulty
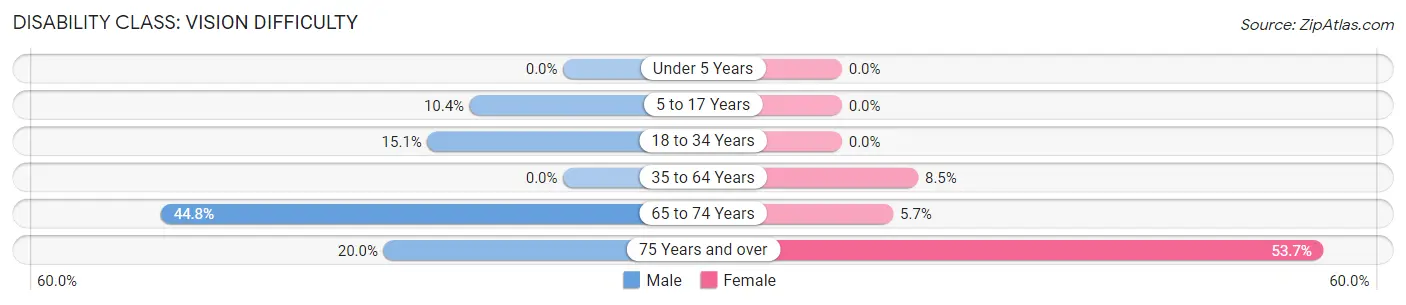
| Age Bracket | Male | Female |
| Under 5 Years | 0 (0.0%) | 0 (0.0%) |
| 5 to 17 Years | 13 (10.4%) | 0 (0.0%) |
| 18 to 34 Years | 21 (15.1%) | 0 (0.0%) |
| 35 to 64 Years | 0 (0.0%) | 18 (8.5%) |
| 65 to 74 Years | 13 (44.8%) | 2 (5.7%) |
| 75 Years and over | 4 (20.0%) | 22 (53.7%) |
Disability Class: Cognitive Difficulty
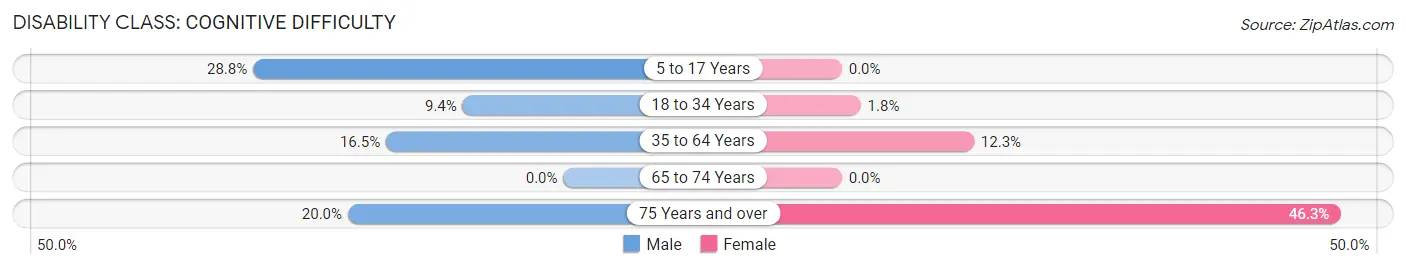
| Age Bracket | Male | Female |
| 5 to 17 Years | 36 (28.8%) | 0 (0.0%) |
| 18 to 34 Years | 13 (9.3%) | 3 (1.8%) |
| 35 to 64 Years | 39 (16.5%) | 26 (12.3%) |
| 65 to 74 Years | 0 (0.0%) | 0 (0.0%) |
| 75 Years and over | 4 (20.0%) | 19 (46.3%) |
Disability Class: Ambulatory Difficulty
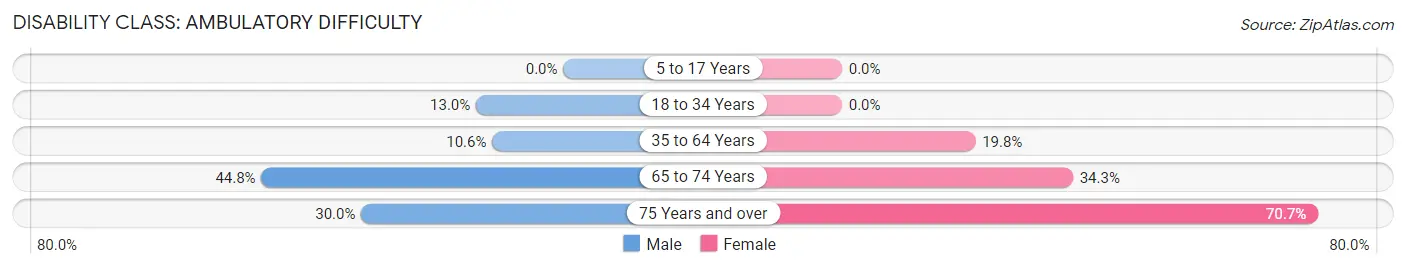
| Age Bracket | Male | Female |
| 5 to 17 Years | 0 (0.0%) | 0 (0.0%) |
| 18 to 34 Years | 18 (13.0%) | 0 (0.0%) |
| 35 to 64 Years | 25 (10.5%) | 42 (19.8%) |
| 65 to 74 Years | 13 (44.8%) | 12 (34.3%) |
| 75 Years and over | 6 (30.0%) | 29 (70.7%) |
Disability Class: Self-Care Difficulty
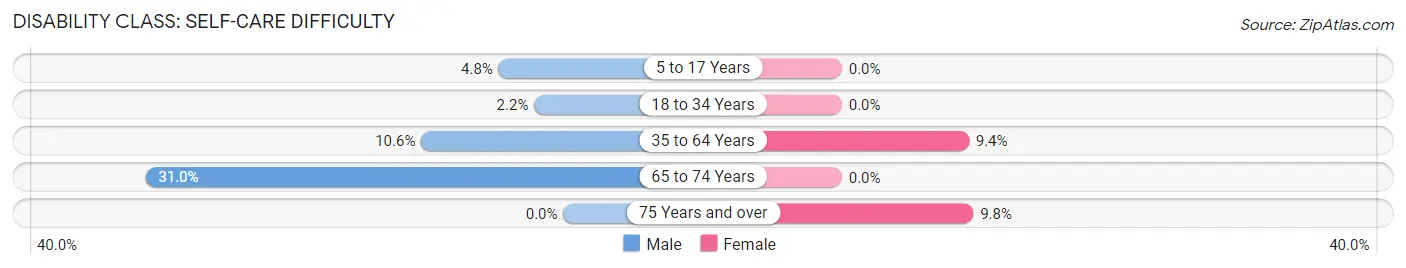
| Age Bracket | Male | Female |
| 5 to 17 Years | 6 (4.8%) | 0 (0.0%) |
| 18 to 34 Years | 3 (2.2%) | 0 (0.0%) |
| 35 to 64 Years | 25 (10.5%) | 20 (9.4%) |
| 65 to 74 Years | 9 (31.0%) | 0 (0.0%) |
| 75 Years and over | 0 (0.0%) | 4 (9.8%) |
Technology Access in Brodhead
Computing Device Access in Brodhead
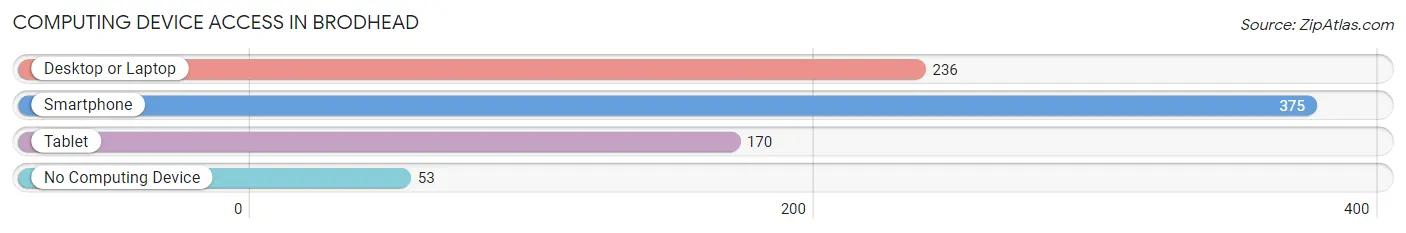
| Device Type | # Households | % Households |
| Desktop or Laptop | 236 | 50.2% |
| Smartphone | 375 | 79.8% |
| Tablet | 170 | 36.2% |
| No Computing Device | 53 | 11.3% |
| Total | 470 | 100.0% |
Internet Access in Brodhead
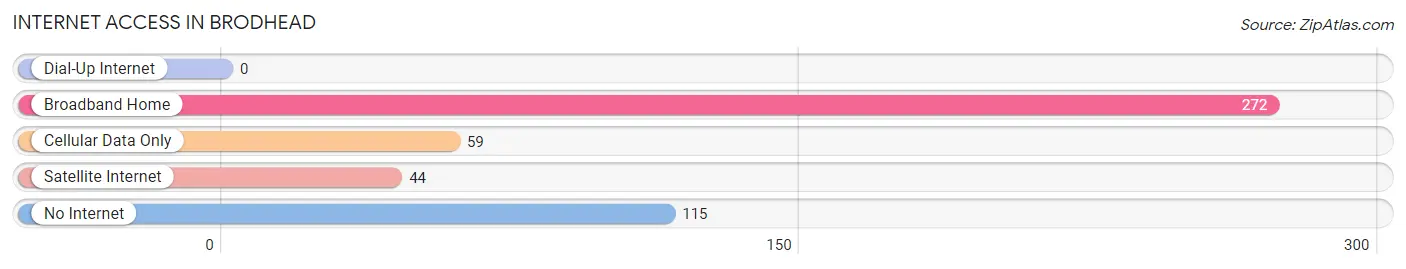
| Internet Type | # Households | % Households |
| Dial-Up Internet | 0 | 0.0% |
| Broadband Home | 272 | 57.9% |
| Cellular Data Only | 59 | 12.6% |
| Satellite Internet | 44 | 9.4% |
| No Internet | 115 | 24.5% |
| Total | 470 | 100.0% |
Brodhead Summary
Brodhead is a small city located in Rockcastle County, Kentucky. It is situated in the foothills of the Appalachian Mountains, and is part of the larger Lexington-Fayette metropolitan area. The city has a population of approximately 1,500 people, and is known for its rural charm and friendly atmosphere.
Geography
Brodhead is located in the southeastern corner of Rockcastle County, approximately 40 miles southeast of Lexington. The city is situated in the foothills of the Appalachian Mountains, and is surrounded by rolling hills and lush forests. The city is located at the intersection of US Route 25 and KY Route 461, and is easily accessible from both Lexington and Knoxville.
The climate in Brodhead is humid subtropical, with hot summers and mild winters. The average annual temperature is around 60 degrees Fahrenheit, and the average annual precipitation is around 45 inches.
Economy
The economy of Brodhead is largely based on agriculture and tourism. The city is home to several small farms, and the surrounding area is known for its production of tobacco, corn, and hay. The city is also home to several small businesses, including restaurants, shops, and a local winery.
Tourism is an important part of the local economy, as the city is home to several attractions, including the Brodhead Museum, the Brodhead Historical Society, and the Brodhead Country Club. The city is also home to several festivals and events throughout the year, including the Brodhead Festival of Lights and the Brodhead Bluegrass Festival.
Demographics
As of the 2010 census, the population of Brodhead was 1,500. The racial makeup of the city was 95.3% White, 1.7% African American, 0.3% Native American, 0.7% Asian, and 2.0% from other races. The median household income was $30,000, and the median family income was $35,000.
The city is home to several churches, including the First Baptist Church, the First United Methodist Church, and the Church of the Nazarene. The city is also home to several schools, including Brodhead Elementary School, Brodhead Middle School, and Brodhead High School.
Conclusion
Brodhead is a small city located in Rockcastle County, Kentucky. It is situated in the foothills of the Appalachian Mountains, and is part of the larger Lexington-Fayette metropolitan area. The city has a population of approximately 1,500 people, and is known for its rural charm and friendly atmosphere. The economy of Brodhead is largely based on agriculture and tourism, and the city is home to several attractions, including the Brodhead Museum, the Brodhead Historical Society, and the Brodhead Country Club. The racial makeup of the city is 95.3% White, 1.7% African American, 0.3% Native American, 0.7% Asian, and 2.0% from other races. The median household income was $30,000, and the median family income was $35,000.
Common Questions
What is Per Capita Income in Brodhead?
Per Capita income in Brodhead is $17,615.
What is the Median Family Income in Brodhead?
Median Family Income in Brodhead is $60,208.
What is the Median Household income in Brodhead?
Median Household Income in Brodhead is $28,750.
What is Income or Wage Gap in Brodhead?
Income or Wage Gap in Brodhead is 9.0%.
Women in Brodhead earn 91.0 cents for every dollar earned by a man.
What is Inequality or Gini Index in Brodhead?
Inequality or Gini Index in Brodhead is 0.51.
What is the Total Population of Brodhead?
Total Population of Brodhead is 1,361.
What is the Total Male Population of Brodhead?
Total Male Population of Brodhead is 616.
What is the Total Female Population of Brodhead?
Total Female Population of Brodhead is 745.
What is the Ratio of Males per 100 Females in Brodhead?
There are 82.68 Males per 100 Females in Brodhead.
What is the Ratio of Females per 100 Males in Brodhead?
There are 120.94 Females per 100 Males in Brodhead.
What is the Median Population Age in Brodhead?
Median Population Age in Brodhead is 34.3 Years.
What is the Average Family Size in Brodhead
Average Family Size in Brodhead is 3.4 People.
What is the Average Household Size in Brodhead
Average Household Size in Brodhead is 2.7 People.
How Large is the Labor Force in Brodhead?
There are 537 People in the Labor Forcein in Brodhead.
What is the Percentage of People in the Labor Force in Brodhead?
52.8% of People are in the Labor Force in Brodhead.
What is the Unemployment Rate in Brodhead?
Unemployment Rate in Brodhead is 12.1%.