Avilla, IN Map & Demographics
Avilla Map
Avilla Overview
$32,870
PER CAPITA INCOME
$83,929
AVG FAMILY INCOME
$77,583
AVG HOUSEHOLD INCOME
34.3%
WAGE / INCOME GAP [ % ]
65.7¢/ $1
WAGE / INCOME GAP [ $ ]
0.36
INEQUALITY / GINI INDEX
2,702
TOTAL POPULATION
1,291
MALE POPULATION
1,411
FEMALE POPULATION
91.50
MALES / 100 FEMALES
109.30
FEMALES / 100 MALES
35.9
MEDIAN AGE
3.2
AVG FAMILY SIZE
2.7
AVG HOUSEHOLD SIZE
1,385
LABOR FORCE [ PEOPLE ]
66.9%
PERCENT IN LABOR FORCE
2.6%
UNEMPLOYMENT RATE
Avilla Zip Codes
Avilla Area Codes
Income in Avilla
Income Overview in Avilla
Per Capita Income in Avilla is $32,870, while median incomes of families and households are $83,929 and $77,583 respectively.
| Characteristic | Number | Measure |
| Per Capita Income | 2,702 | $32,870 |
| Median Family Income | 638 | $83,929 |
| Mean Family Income | 638 | $93,171 |
| Median Household Income | 968 | $77,583 |
| Mean Household Income | 968 | $81,575 |
| Income Deficit | 638 | $0 |
| Wage / Income Gap (%) | 2,702 | 34.34% |
| Wage / Income Gap ($) | 2,702 | 65.66¢ per $1 |
| Gini / Inequality Index | 2,702 | 0.36 |
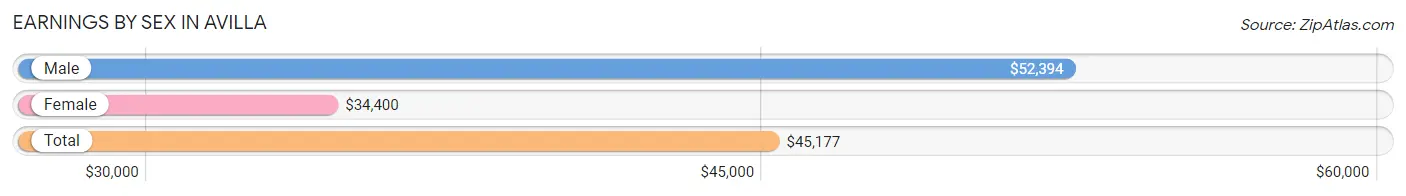
Earnings by Sex in Avilla
Average Earnings in Avilla are $45,177, $52,394 for men and $34,400 for women, a difference of 34.3%.
| Sex | Number | Average Earnings |
| Male | 774 (52.1%) | $52,394 |
| Female | 711 (47.9%) | $34,400 |
| Total | 1,485 (100.0%) | $45,177 |
Earnings by Sex by Income Bracket in Avilla
The most common earnings brackets in Avilla are $100,000+ for men (122 | 15.8%) and $30,000 to $34,999 for women (105 | 14.8%).
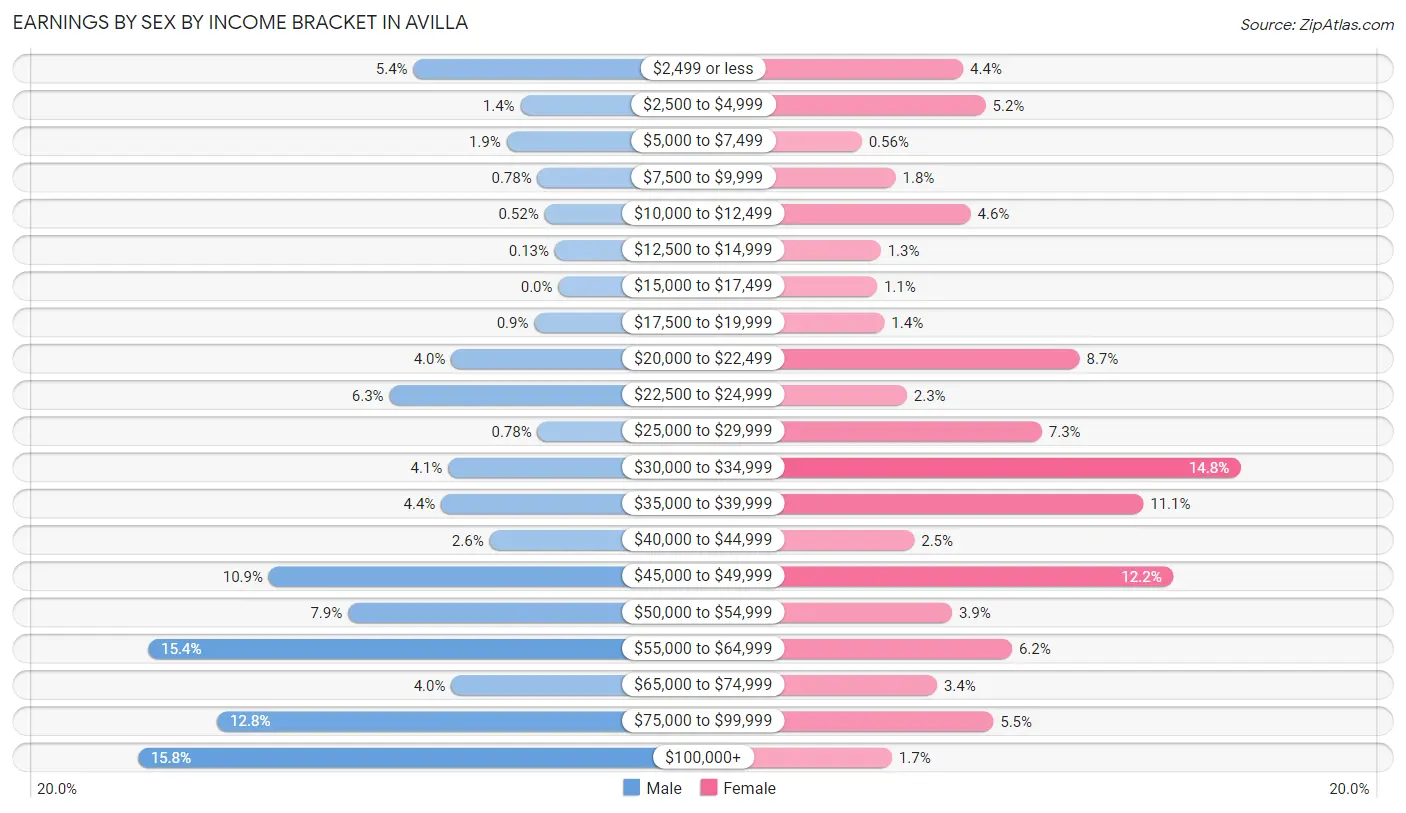
| Income | Male | Female |
| $2,499 or less | 42 (5.4%) | 31 (4.4%) |
| $2,500 to $4,999 | 11 (1.4%) | 37 (5.2%) |
| $5,000 to $7,499 | 15 (1.9%) | 4 (0.6%) |
| $7,500 to $9,999 | 6 (0.8%) | 13 (1.8%) |
| $10,000 to $12,499 | 4 (0.5%) | 33 (4.6%) |
| $12,500 to $14,999 | 1 (0.1%) | 9 (1.3%) |
| $15,000 to $17,499 | 0 (0.0%) | 8 (1.1%) |
| $17,500 to $19,999 | 7 (0.9%) | 10 (1.4%) |
| $20,000 to $22,499 | 31 (4.0%) | 62 (8.7%) |
| $22,500 to $24,999 | 49 (6.3%) | 16 (2.2%) |
| $25,000 to $29,999 | 6 (0.8%) | 52 (7.3%) |
| $30,000 to $34,999 | 32 (4.1%) | 105 (14.8%) |
| $35,000 to $39,999 | 34 (4.4%) | 79 (11.1%) |
| $40,000 to $44,999 | 20 (2.6%) | 18 (2.5%) |
| $45,000 to $49,999 | 84 (10.8%) | 87 (12.2%) |
| $50,000 to $54,999 | 61 (7.9%) | 28 (3.9%) |
| $55,000 to $64,999 | 119 (15.4%) | 44 (6.2%) |
| $65,000 to $74,999 | 31 (4.0%) | 24 (3.4%) |
| $75,000 to $99,999 | 99 (12.8%) | 39 (5.5%) |
| $100,000+ | 122 (15.8%) | 12 (1.7%) |
| Total | 774 (100.0%) | 711 (100.0%) |
Earnings by Sex by Educational Attainment in Avilla
Average earnings in Avilla are $56,475 for men and $35,699 for women, a difference of 36.8%. Men with an educational attainment of bachelor's degree enjoy the highest average annual earnings of $66,563, while those with less than high school education earn the least with $50,893. Women with an educational attainment of college or associate's degree earn the most with the average annual earnings of $42,000, while those with high school diploma education have the smallest earnings of $33,372.
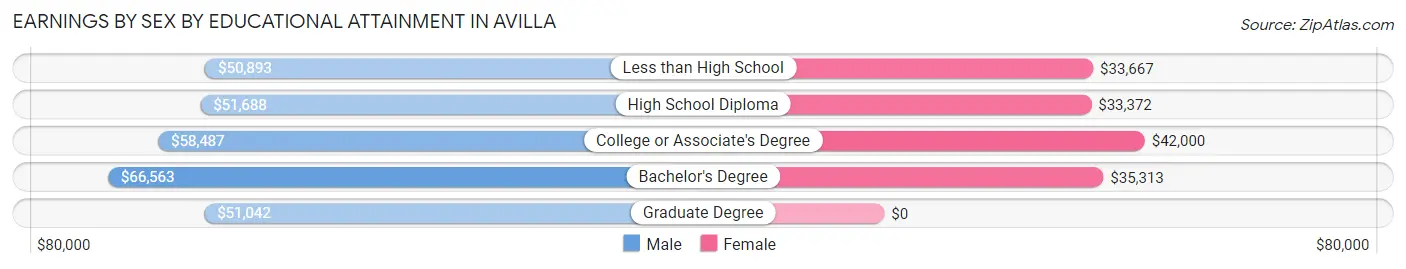
| Educational Attainment | Male Income | Female Income |
| Less than High School | $50,893 | $33,667 |
| High School Diploma | $51,688 | $33,372 |
| College or Associate's Degree | $58,487 | $42,000 |
| Bachelor's Degree | $66,563 | $35,313 |
| Graduate Degree | $51,042 | $0 |
| Total | $56,475 | $35,699 |
Family Income in Avilla
Family Income Brackets in Avilla
According to the Avilla family income data, there are 132 families falling into the $100,000 to $149,999 income range, which is the most common income bracket and makes up 20.7% of all families. Conversely, the less than $10,000 income bracket is the least frequent group with only 6 families (0.9%) belonging to this category.
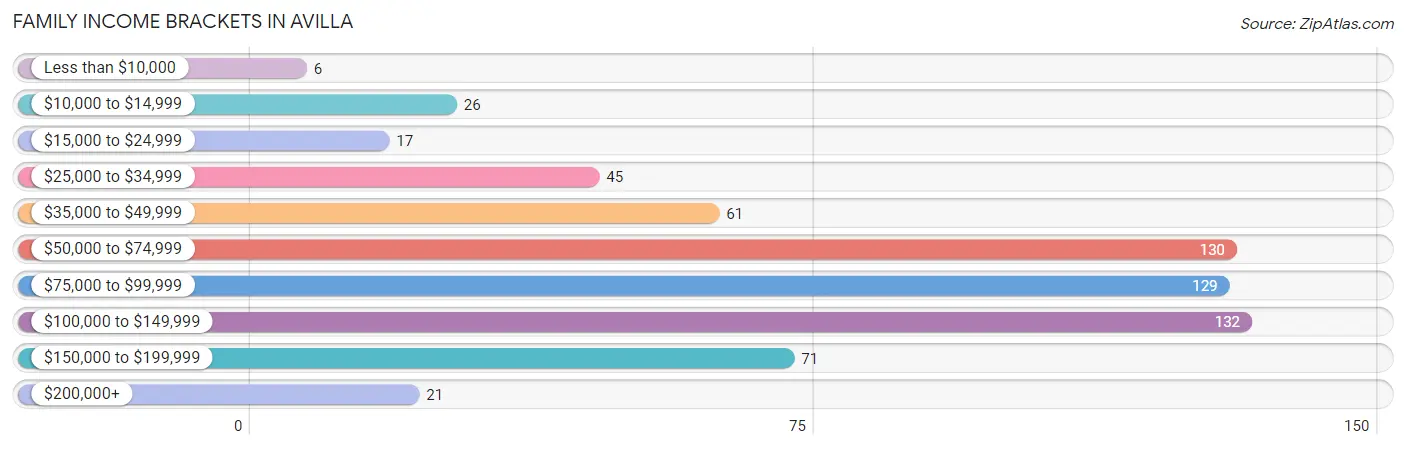
| Income Bracket | # Families | % Families |
| Less than $10,000 | 6 | 0.9% |
| $10,000 to $14,999 | 26 | 4.1% |
| $15,000 to $24,999 | 17 | 2.7% |
| $25,000 to $34,999 | 45 | 7.1% |
| $35,000 to $49,999 | 61 | 9.6% |
| $50,000 to $74,999 | 130 | 20.4% |
| $75,000 to $99,999 | 129 | 20.2% |
| $100,000 to $149,999 | 132 | 20.7% |
| $150,000 to $199,999 | 71 | 11.1% |
| $200,000+ | 21 | 3.3% |
Family Income by Famaliy Size in Avilla
5-person families (29 | 4.5%) account for the highest median family income in Avilla with $119,583 per family, while 2-person families (283 | 44.4%) have the highest median income of $37,537 per family member.
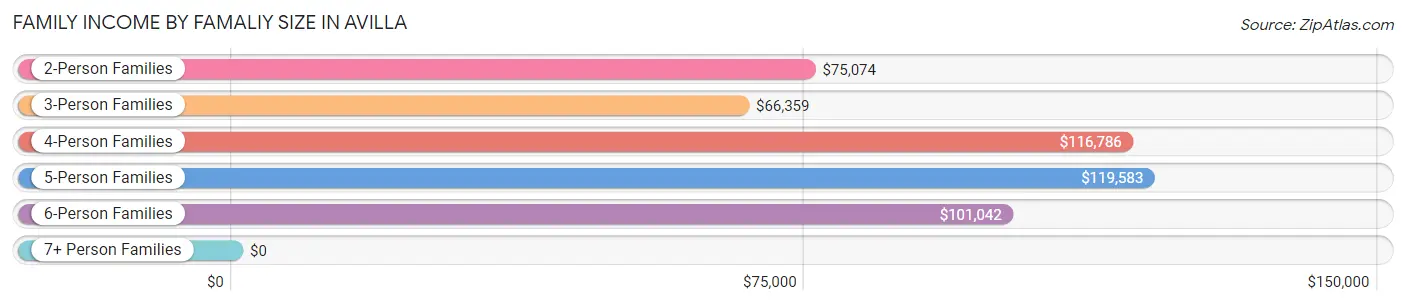
| Income Bracket | # Families | Median Income |
| 2-Person Families | 283 (44.4%) | $75,074 |
| 3-Person Families | 101 (15.8%) | $66,359 |
| 4-Person Families | 208 (32.6%) | $116,786 |
| 5-Person Families | 29 (4.5%) | $119,583 |
| 6-Person Families | 17 (2.7%) | $101,042 |
| 7+ Person Families | 0 (0.0%) | $0 |
| Total | 638 (100.0%) | $83,929 |
Family Income by Number of Earners in Avilla
The median family income in Avilla is $83,929, with families comprising 3+ earners (89) having the highest median family income of $118,750, while families with no earners (54) have the lowest median family income of $38,750, accounting for 14.0% and 8.5% of families, respectively.

| Number of Earners | # Families | Median Income |
| No Earners | 54 (8.5%) | $38,750 |
| 1 Earner | 200 (31.4%) | $51,875 |
| 2 Earners | 295 (46.2%) | $98,920 |
| 3+ Earners | 89 (14.0%) | $118,750 |
| Total | 638 (100.0%) | $83,929 |
Household Income in Avilla
Household Income Brackets in Avilla
With 229 households falling in the category, the $75,000 to $99,999 income range is the most frequent in Avilla, accounting for 23.7% of all households. In contrast, only 16 households (1.7%) fall into the less than $10,000 income bracket, making it the least populous group.
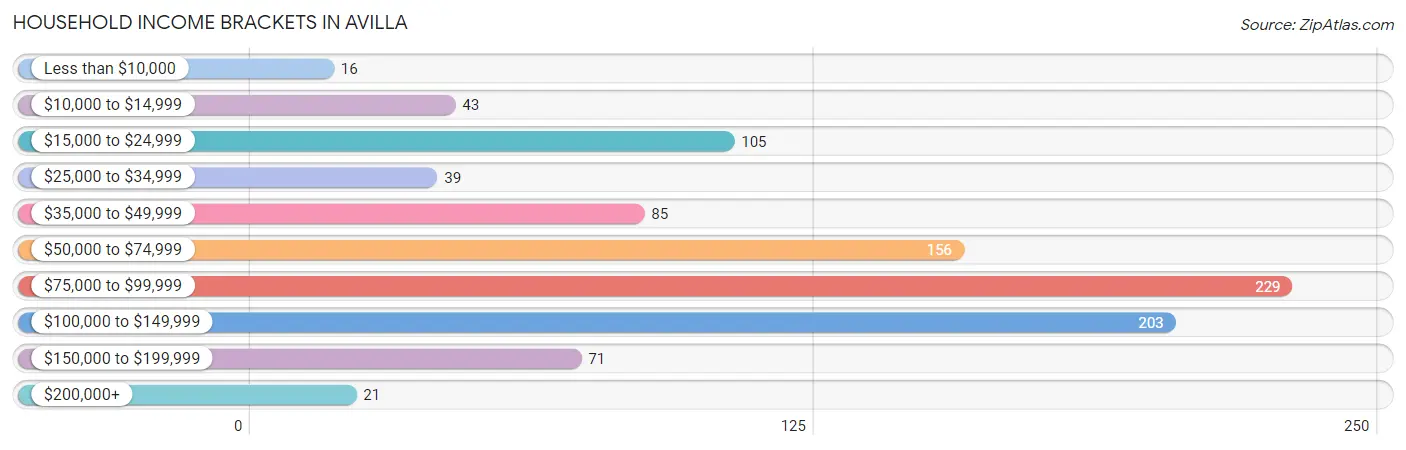
| Income Bracket | # Households | % Households |
| Less than $10,000 | 16 | 1.7% |
| $10,000 to $14,999 | 43 | 4.4% |
| $15,000 to $24,999 | 105 | 10.8% |
| $25,000 to $34,999 | 39 | 4.0% |
| $35,000 to $49,999 | 85 | 8.8% |
| $50,000 to $74,999 | 156 | 16.1% |
| $75,000 to $99,999 | 229 | 23.7% |
| $100,000 to $149,999 | 203 | 21.0% |
| $150,000 to $199,999 | 71 | 7.3% |
| $200,000+ | 21 | 2.2% |
Household Income by Householder Age in Avilla
The median household income in Avilla is $77,583, with the highest median household income of $90,250 found in the 25 to 44 years age bracket for the primary householder. A total of 364 households (37.6%) fall into this category. Meanwhile, the 65+ years age bracket for the primary householder has the lowest median household income of $25,893, with 191 households (19.7%) in this group.
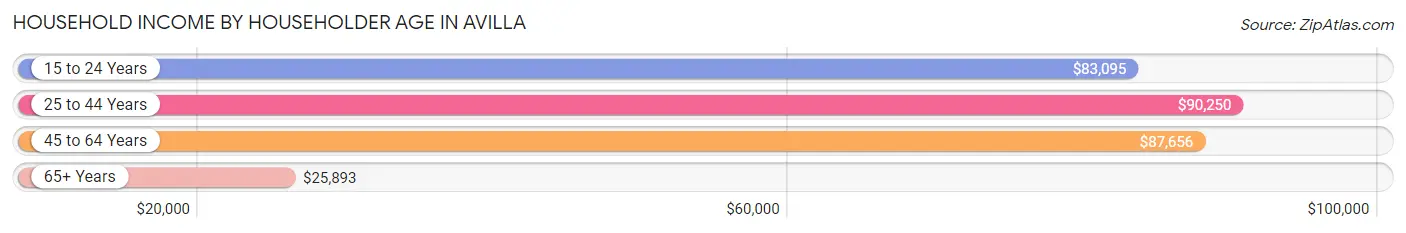
| Income Bracket | # Households | Median Income |
| 15 to 24 Years | 56 (5.8%) | $83,095 |
| 25 to 44 Years | 364 (37.6%) | $90,250 |
| 45 to 64 Years | 357 (36.9%) | $87,656 |
| 65+ Years | 191 (19.7%) | $25,893 |
| Total | 968 (100.0%) | $77,583 |
Poverty in Avilla
Income Below Poverty by Sex and Age in Avilla
With 7.6% poverty level for males and 5.7% for females among the residents of Avilla, 18 to 24 year old males and 75 year old and over females are the most vulnerable to poverty, with 44 males (37.6%) and 15 females (29.4%) in their respective age groups living below the poverty level.
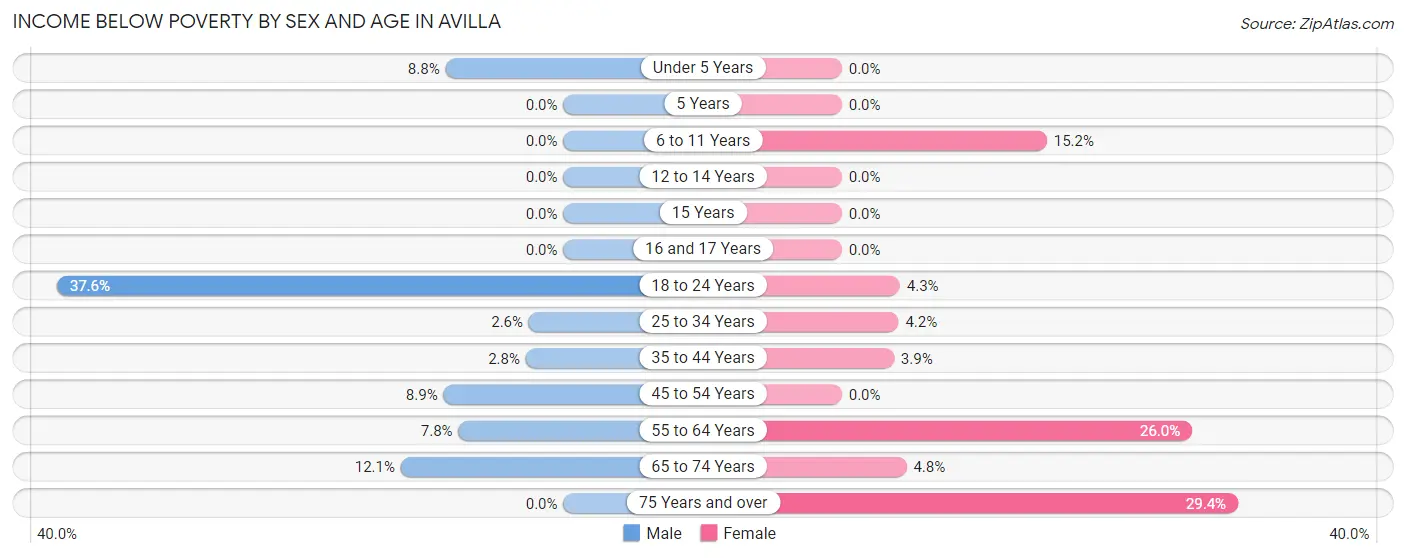
| Age Bracket | Male | Female |
| Under 5 Years | 7 (8.7%) | 0 (0.0%) |
| 5 Years | 0 (0.0%) | 0 (0.0%) |
| 6 to 11 Years | 0 (0.0%) | 7 (15.2%) |
| 12 to 14 Years | 0 (0.0%) | 0 (0.0%) |
| 15 Years | 0 (0.0%) | 0 (0.0%) |
| 16 and 17 Years | 0 (0.0%) | 0 (0.0%) |
| 18 to 24 Years | 44 (37.6%) | 5 (4.3%) |
| 25 to 34 Years | 6 (2.6%) | 8 (4.2%) |
| 35 to 44 Years | 5 (2.8%) | 6 (3.9%) |
| 45 to 54 Years | 21 (8.9%) | 0 (0.0%) |
| 55 to 64 Years | 6 (7.8%) | 26 (26.0%) |
| 65 to 74 Years | 7 (12.1%) | 6 (4.8%) |
| 75 Years and over | 0 (0.0%) | 15 (29.4%) |
| Total | 96 (7.6%) | 73 (5.7%) |
Income Above Poverty by Sex and Age in Avilla
According to the poverty statistics in Avilla, males aged 5 years and females aged under 5 years are the age groups that are most secure financially, with 100.0% of males and 100.0% of females in these age groups living above the poverty line.
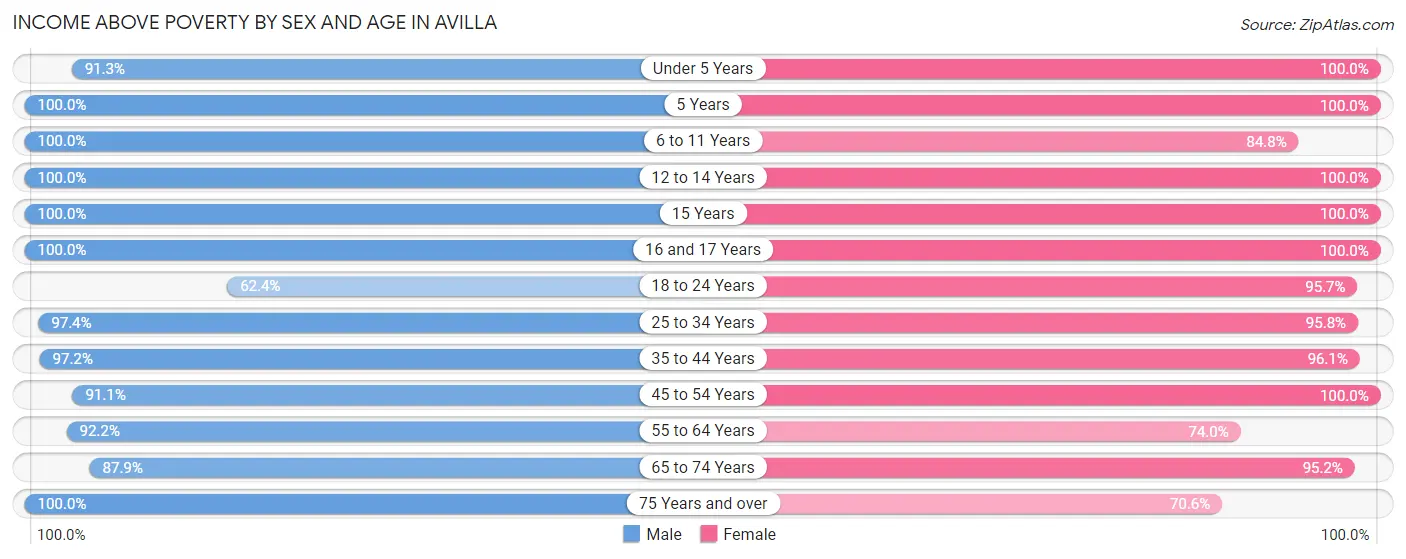
| Age Bracket | Male | Female |
| Under 5 Years | 73 (91.2%) | 130 (100.0%) |
| 5 Years | 13 (100.0%) | 78 (100.0%) |
| 6 to 11 Years | 99 (100.0%) | 39 (84.8%) |
| 12 to 14 Years | 78 (100.0%) | 41 (100.0%) |
| 15 Years | 4 (100.0%) | 11 (100.0%) |
| 16 and 17 Years | 23 (100.0%) | 27 (100.0%) |
| 18 to 24 Years | 73 (62.4%) | 111 (95.7%) |
| 25 to 34 Years | 228 (97.4%) | 182 (95.8%) |
| 35 to 44 Years | 174 (97.2%) | 149 (96.1%) |
| 45 to 54 Years | 215 (91.1%) | 221 (100.0%) |
| 55 to 64 Years | 71 (92.2%) | 74 (74.0%) |
| 65 to 74 Years | 51 (87.9%) | 119 (95.2%) |
| 75 Years and over | 57 (100.0%) | 36 (70.6%) |
| Total | 1,159 (92.3%) | 1,218 (94.4%) |
Income Below Poverty Among Married-Couple Families in Avilla
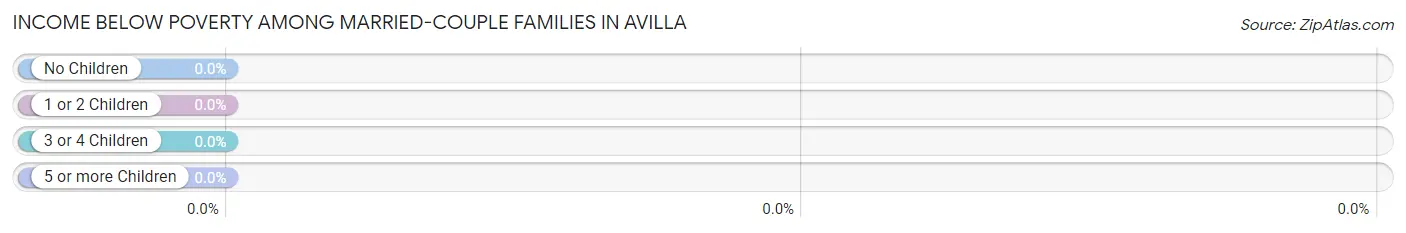
| Children | Above Poverty | Below Poverty |
| No Children | 232 (100.0%) | 0 (0.0%) |
| 1 or 2 Children | 161 (100.0%) | 0 (0.0%) |
| 3 or 4 Children | 26 (100.0%) | 0 (0.0%) |
| 5 or more Children | 0 (0.0%) | 0 (0.0%) |
| Total | 419 (100.0%) | 0 (0.0%) |
Income Below Poverty Among Single-Parent Households in Avilla
According to the poverty data in Avilla, 40.9% or 27 single-father households and 3.3% or 5 single-mother households are living below the poverty line. Among single-father households, those with no children have the highest poverty rate, with 21 households (100.0%) experiencing poverty. Likewise, among single-mother households, those with no children have the highest poverty rate, with 5 households (13.9%) falling below the poverty line.
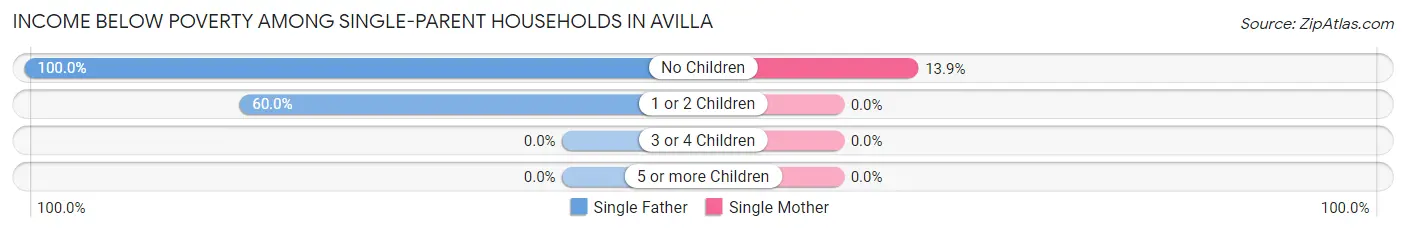
| Children | Single Father | Single Mother |
| No Children | 21 (100.0%) | 5 (13.9%) |
| 1 or 2 Children | 6 (60.0%) | 0 (0.0%) |
| 3 or 4 Children | 0 (0.0%) | 0 (0.0%) |
| 5 or more Children | 0 (0.0%) | 0 (0.0%) |
| Total | 27 (40.9%) | 5 (3.3%) |
Income Below Poverty Among Married-Couple vs Single-Parent Households in Avilla
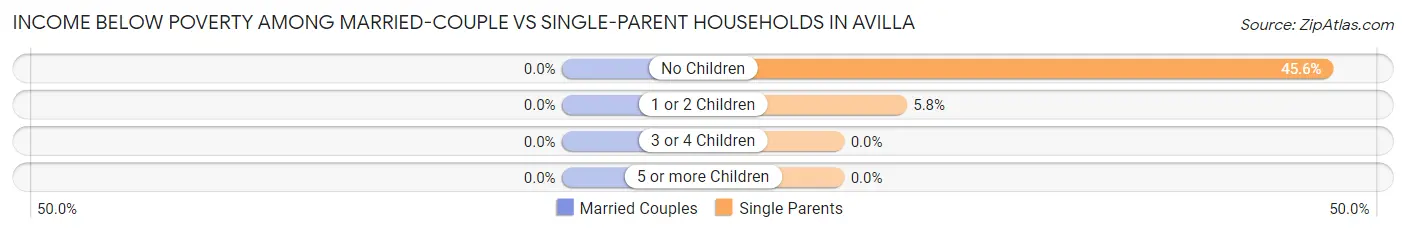
| Children | Married-Couple Families | Single-Parent Households |
| No Children | 0 (0.0%) | 26 (45.6%) |
| 1 or 2 Children | 0 (0.0%) | 6 (5.8%) |
| 3 or 4 Children | 0 (0.0%) | 0 (0.0%) |
| 5 or more Children | 0 (0.0%) | 0 (0.0%) |
| Total | 0 (0.0%) | 32 (14.6%) |
Race in Avilla
The most populous races in Avilla are White / Caucasian (2,548 | 94.3%), Two or more Races (116 | 4.3%), and Hispanic or Latino (38 | 1.4%).
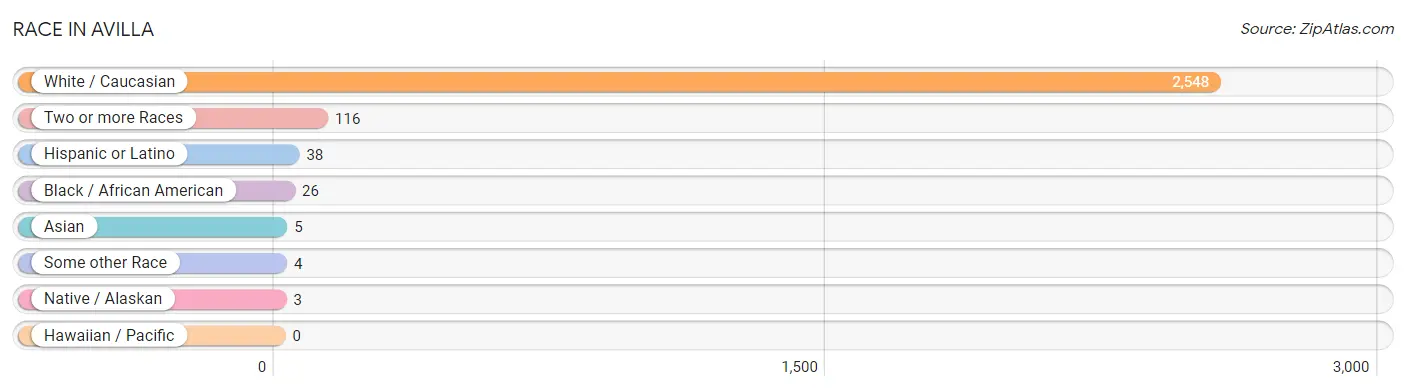
| Race | # Population | % Population |
| Asian | 5 | 0.2% |
| Black / African American | 26 | 1.0% |
| Hawaiian / Pacific | 0 | 0.0% |
| Hispanic or Latino | 38 | 1.4% |
| Native / Alaskan | 3 | 0.1% |
| White / Caucasian | 2,548 | 94.3% |
| Two or more Races | 116 | 4.3% |
| Some other Race | 4 | 0.2% |
| Total | 2,702 | 100.0% |
Ancestry in Avilla
The most populous ancestries reported in Avilla are German (602 | 22.3%), European (453 | 16.8%), Irish (338 | 12.5%), English (274 | 10.1%), and French (222 | 8.2%), together accounting for 69.9% of all Avilla residents.
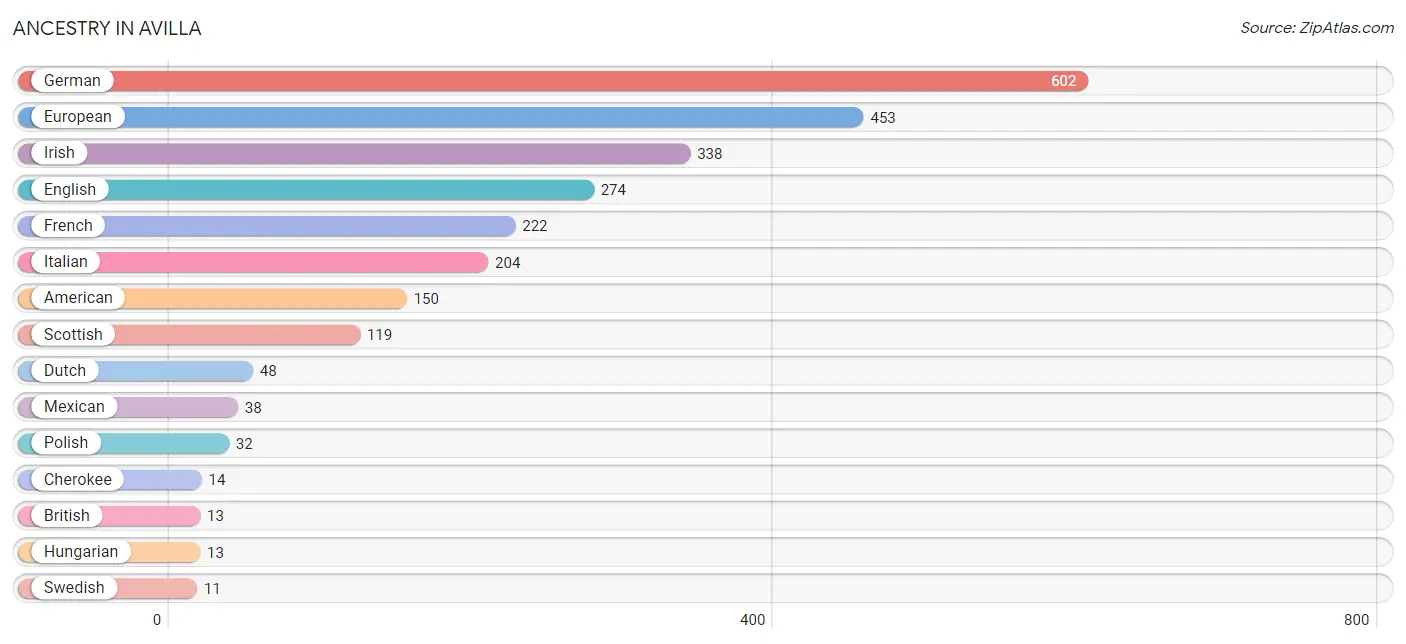
| Ancestry | # Population | % Population |
| African | 9 | 0.3% |
| American | 150 | 5.6% |
| Belgian | 6 | 0.2% |
| Blackfeet | 3 | 0.1% |
| British | 13 | 0.5% |
| Canadian | 6 | 0.2% |
| Cherokee | 14 | 0.5% |
| Dutch | 48 | 1.8% |
| English | 274 | 10.1% |
| European | 453 | 16.8% |
| French | 222 | 8.2% |
| French Canadian | 5 | 0.2% |
| German | 602 | 22.3% |
| Hungarian | 13 | 0.5% |
| Irish | 338 | 12.5% |
| Italian | 204 | 7.5% |
| Lithuanian | 7 | 0.3% |
| Mexican | 38 | 1.4% |
| Norwegian | 5 | 0.2% |
| Pennsylvania German | 2 | 0.1% |
| Polish | 32 | 1.2% |
| Portuguese | 6 | 0.2% |
| Scandinavian | 6 | 0.2% |
| Scotch-Irish | 10 | 0.4% |
| Scottish | 119 | 4.4% |
| Subsaharan African | 9 | 0.3% |
| Swedish | 11 | 0.4% |
| Thai | 5 | 0.2% | View All 28 Rows |
Immigrants in Avilla
The most numerous immigrant groups reported in Avilla came from Europe (7 | 0.3%), Germany (7 | 0.3%), Western Europe (7 | 0.3%), and Canada (6 | 0.2%), together accounting for 1.0% of all Avilla residents.
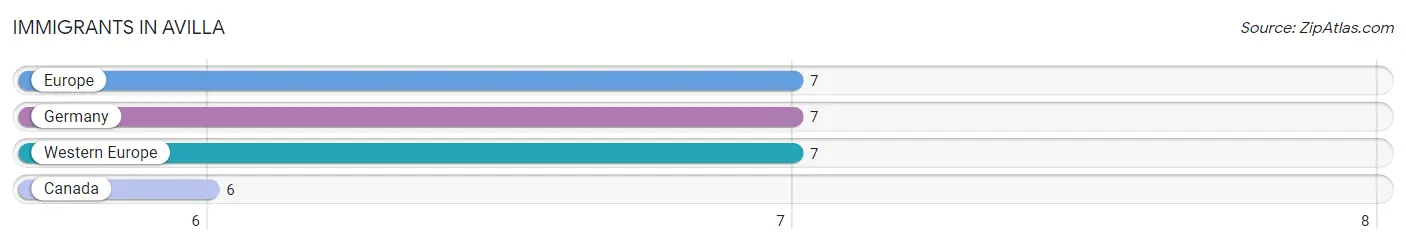
| Immigration Origin | # Population | % Population |
| Canada | 6 | 0.2% |
| Europe | 7 | 0.3% |
| Germany | 7 | 0.3% |
| Western Europe | 7 | 0.3% | View All 4 Rows |
Sex and Age in Avilla
Sex and Age in Avilla
The most populous age groups in Avilla are 50 to 54 Years (133 | 10.3%) for men and 5 to 9 Years (139 | 9.9%) for women.
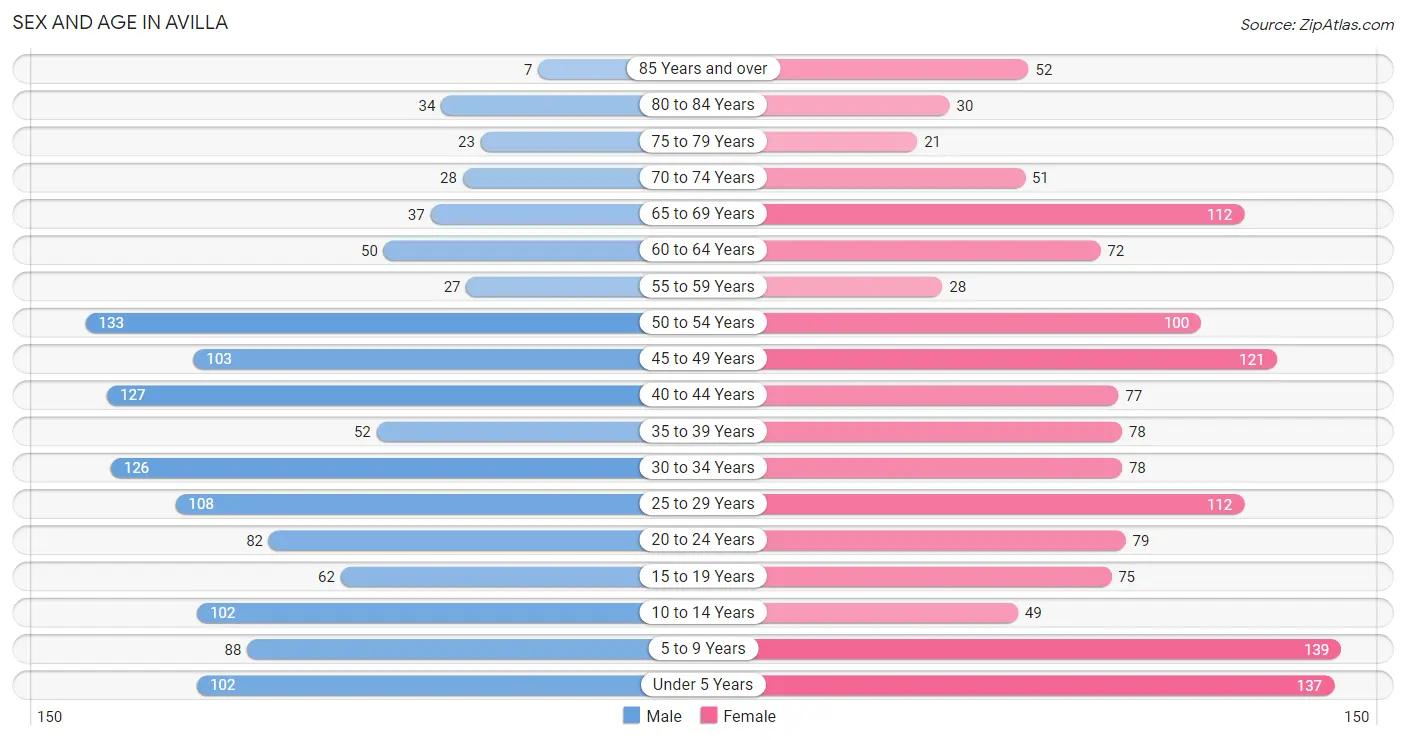
| Age Bracket | Male | Female |
| Under 5 Years | 102 (7.9%) | 137 (9.7%) |
| 5 to 9 Years | 88 (6.8%) | 139 (9.9%) |
| 10 to 14 Years | 102 (7.9%) | 49 (3.5%) |
| 15 to 19 Years | 62 (4.8%) | 75 (5.3%) |
| 20 to 24 Years | 82 (6.4%) | 79 (5.6%) |
| 25 to 29 Years | 108 (8.4%) | 112 (7.9%) |
| 30 to 34 Years | 126 (9.8%) | 78 (5.5%) |
| 35 to 39 Years | 52 (4.0%) | 78 (5.5%) |
| 40 to 44 Years | 127 (9.8%) | 77 (5.5%) |
| 45 to 49 Years | 103 (8.0%) | 121 (8.6%) |
| 50 to 54 Years | 133 (10.3%) | 100 (7.1%) |
| 55 to 59 Years | 27 (2.1%) | 28 (2.0%) |
| 60 to 64 Years | 50 (3.9%) | 72 (5.1%) |
| 65 to 69 Years | 37 (2.9%) | 112 (7.9%) |
| 70 to 74 Years | 28 (2.2%) | 51 (3.6%) |
| 75 to 79 Years | 23 (1.8%) | 21 (1.5%) |
| 80 to 84 Years | 34 (2.6%) | 30 (2.1%) |
| 85 Years and over | 7 (0.5%) | 52 (3.7%) |
| Total | 1,291 (100.0%) | 1,411 (100.0%) |
Families and Households in Avilla
Median Family Size in Avilla
The median family size in Avilla is 3.19 persons per family, with married-couple families (419 | 65.7%) accounting for the largest median family size of 3.33 persons per family. On the other hand, single male/father families (66 | 10.3%) represent the smallest median family size with 2.89 persons per family.
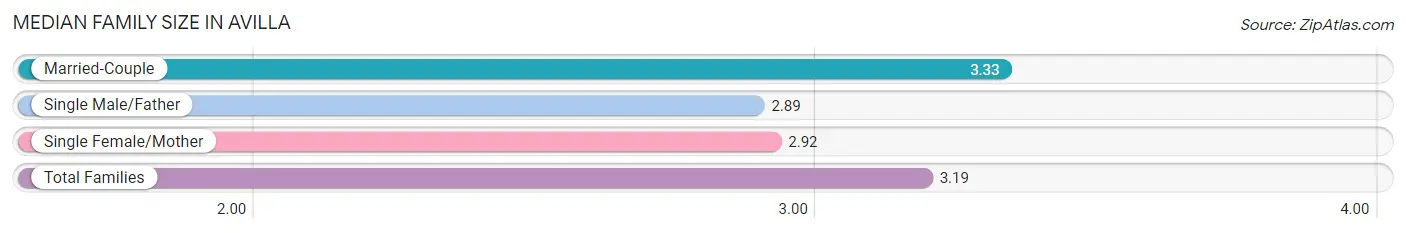
| Family Type | # Families | Family Size |
| Married-Couple | 419 (65.7%) | 3.33 |
| Single Male/Father | 66 (10.3%) | 2.89 |
| Single Female/Mother | 153 (24.0%) | 2.92 |
| Total Families | 638 (100.0%) | 3.19 |
Median Household Size in Avilla
The median household size in Avilla is 2.67 persons per household, with single female/mother households (153 | 15.8%) accounting for the largest median household size of 3.34 persons per household. non-family households (330 | 34.1%) represent the smallest median household size with 1.43 persons per household.
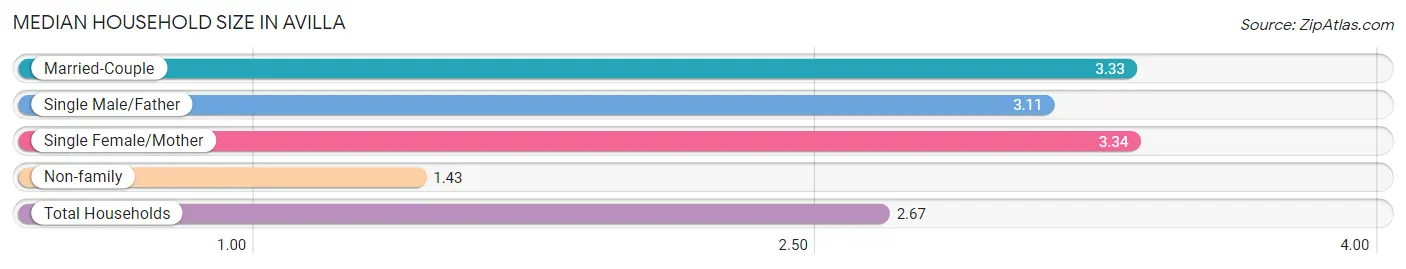
| Household Type | # Households | Household Size |
| Married-Couple | 419 (43.3%) | 3.33 |
| Single Male/Father | 66 (6.8%) | 3.11 |
| Single Female/Mother | 153 (15.8%) | 3.34 |
| Non-family | 330 (34.1%) | 1.43 |
| Total Households | 968 (100.0%) | 2.67 |
Household Size by Marriage Status in Avilla
Out of a total of 968 households in Avilla, 638 (65.9%) are family households, while 330 (34.1%) are nonfamily households. The most numerous type of family households are 2-person households, comprising 250, and the most common type of nonfamily households are 1-person households, comprising 237.
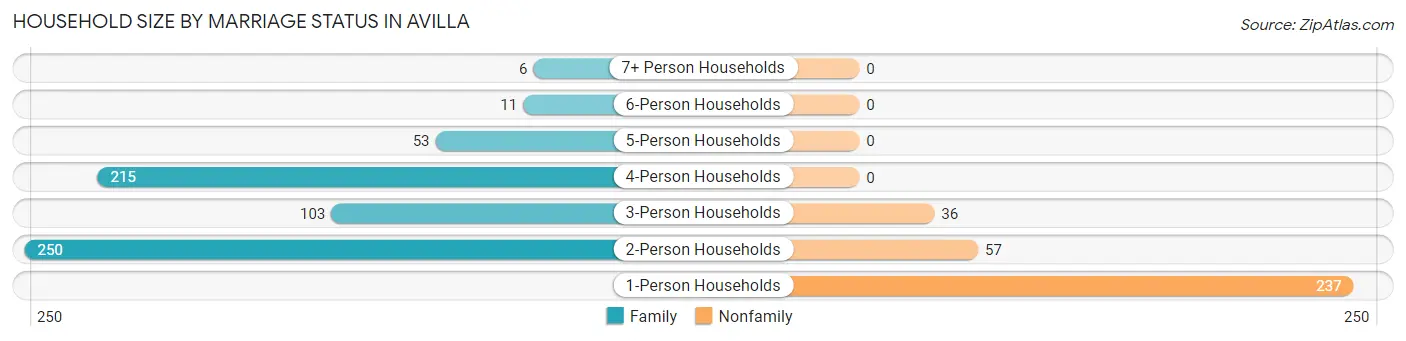
| Household Size | Family Households | Nonfamily Households |
| 1-Person Households | - | 237 (24.5%) |
| 2-Person Households | 250 (25.8%) | 57 (5.9%) |
| 3-Person Households | 103 (10.6%) | 36 (3.7%) |
| 4-Person Households | 215 (22.2%) | 0 (0.0%) |
| 5-Person Households | 53 (5.5%) | 0 (0.0%) |
| 6-Person Households | 11 (1.1%) | 0 (0.0%) |
| 7+ Person Households | 6 (0.6%) | 0 (0.0%) |
| Total | 638 (65.9%) | 330 (34.1%) |
Female Fertility in Avilla
Fertility by Age in Avilla
Average fertility rate in Avilla is 18.0 births per 1,000 women. Women in the age bracket of 20 to 34 years have the highest fertility rate with 45.0 births per 1,000 women. Women in the age bracket of 20 to 34 years acount for 100.0% of all women with births.
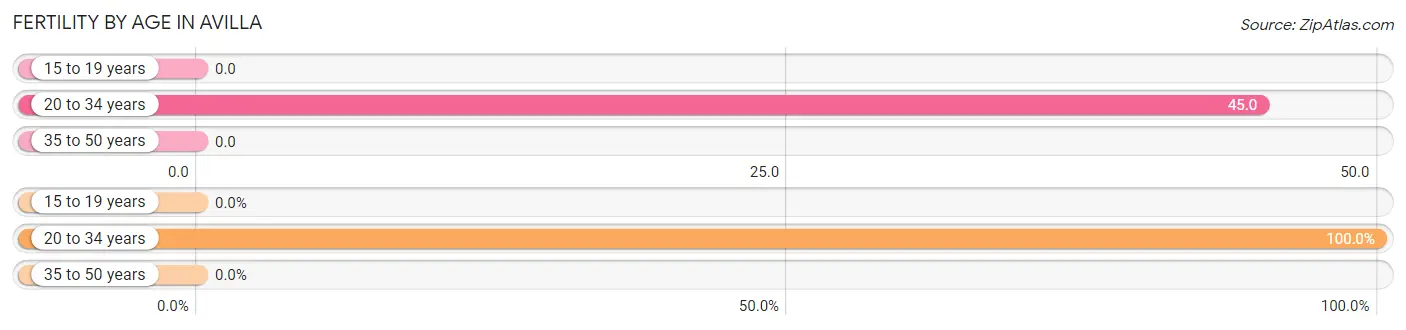
| Age Bracket | Women with Births | Births / 1,000 Women |
| 15 to 19 years | 0 (0.0%) | 0.0 |
| 20 to 34 years | 12 (100.0%) | 45.0 |
| 35 to 50 years | 0 (0.0%) | 0.0 |
| Total | 12 (100.0%) | 18.0 |
Fertility by Age by Marriage Status in Avilla
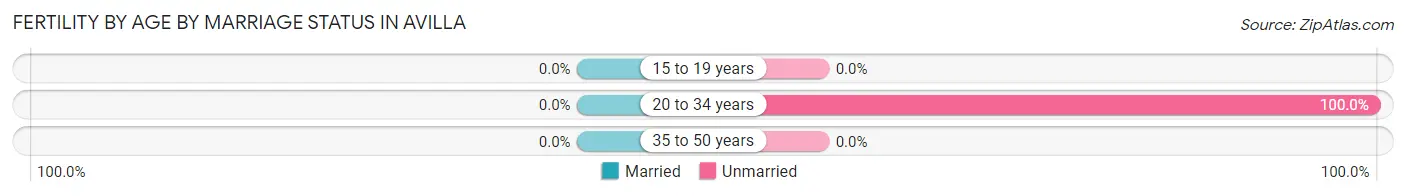
| Age Bracket | Married | Unmarried |
| 15 to 19 years | 0 (0.0%) | 0 (0.0%) |
| 20 to 34 years | 0 (0.0%) | 12 (100.0%) |
| 35 to 50 years | 0 (0.0%) | 0 (0.0%) |
| Total | 0 (0.0%) | 12 (100.0%) |
Fertility by Education in Avilla
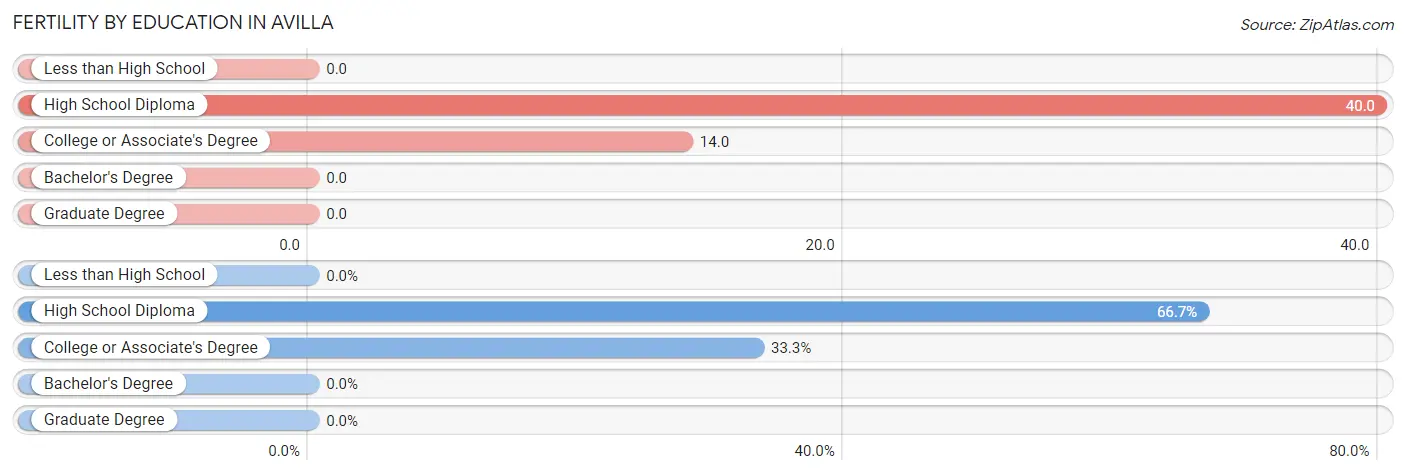
| Educational Attainment | Women with Births | Births / 1,000 Women |
| Less than High School | 0 (0.0%) | 0.0 |
| High School Diploma | 8 (66.7%) | 40.0 |
| College or Associate's Degree | 4 (33.3%) | 14.0 |
| Bachelor's Degree | 0 (0.0%) | 0.0 |
| Graduate Degree | 0 (0.0%) | 0.0 |
| Total | 12 (100.0%) | 18.0 |
Fertility by Education by Marriage Status in Avilla
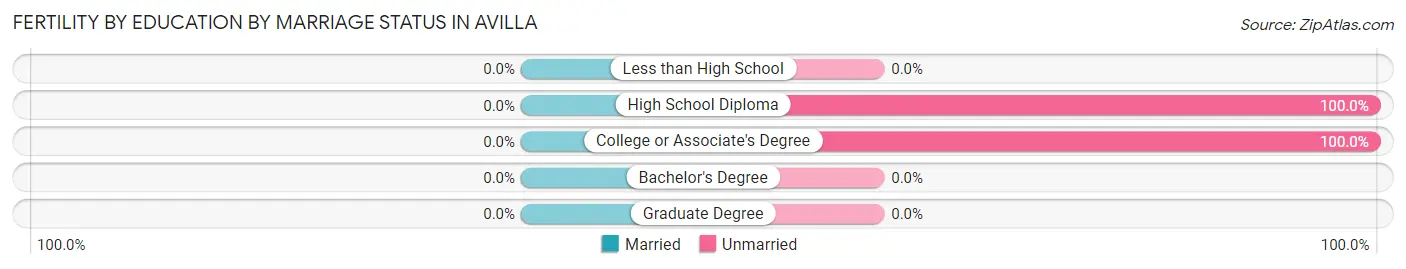
| Educational Attainment | Married | Unmarried |
| Less than High School | 0 (0.0%) | 0 (0.0%) |
| High School Diploma | 0 (0.0%) | 8 (100.0%) |
| College or Associate's Degree | 0 (0.0%) | 4 (100.0%) |
| Bachelor's Degree | 0 (0.0%) | 0 (0.0%) |
| Graduate Degree | 0 (0.0%) | 0 (0.0%) |
| Total | 0 (0.0%) | 12 (100.0%) |
Employment Characteristics in Avilla
Employment by Class of Employer in Avilla
Among the 1,341 employed individuals in Avilla, private company employees (976 | 72.8%), not-for-profit organizations (115 | 8.6%), and local government employees (102 | 7.6%) make up the most common classes of employment.
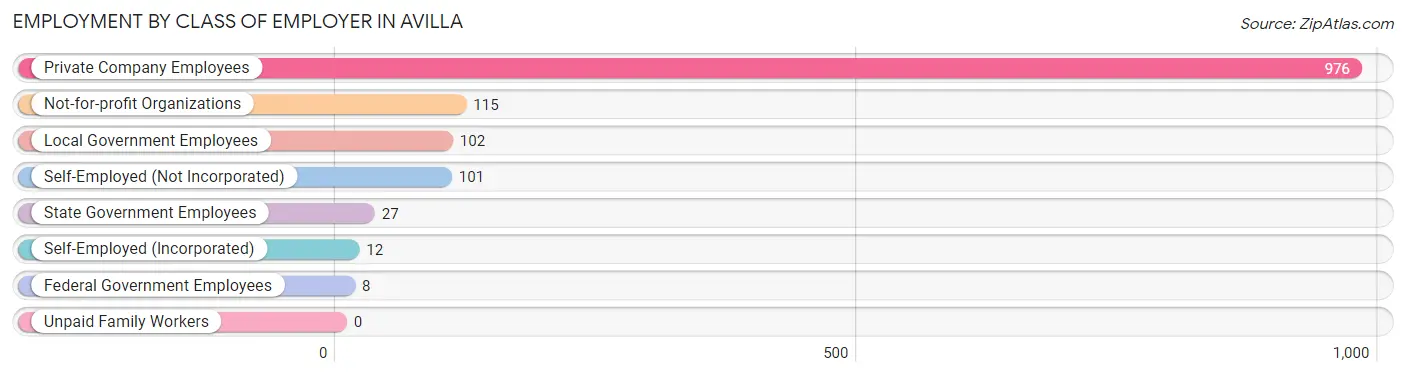
| Employer Class | # Employees | % Employees |
| Private Company Employees | 976 | 72.8% |
| Self-Employed (Incorporated) | 12 | 0.9% |
| Self-Employed (Not Incorporated) | 101 | 7.5% |
| Not-for-profit Organizations | 115 | 8.6% |
| Local Government Employees | 102 | 7.6% |
| State Government Employees | 27 | 2.0% |
| Federal Government Employees | 8 | 0.6% |
| Unpaid Family Workers | 0 | 0.0% |
| Total | 1,341 | 100.0% |
Employment Status by Age in Avilla
According to the labor force statistics for Avilla, out of the total population over 16 years of age (2,070), 66.9% or 1,385 individuals are in the labor force, with 2.6% or 36 of them unemployed. The age group with the highest labor force participation rate is 25 to 29 years, with 97.3% or 214 individuals in the labor force. Within the labor force, the 60 to 64 years age range has the highest percentage of unemployed individuals, with 10.5% or 6 of them being unemployed.
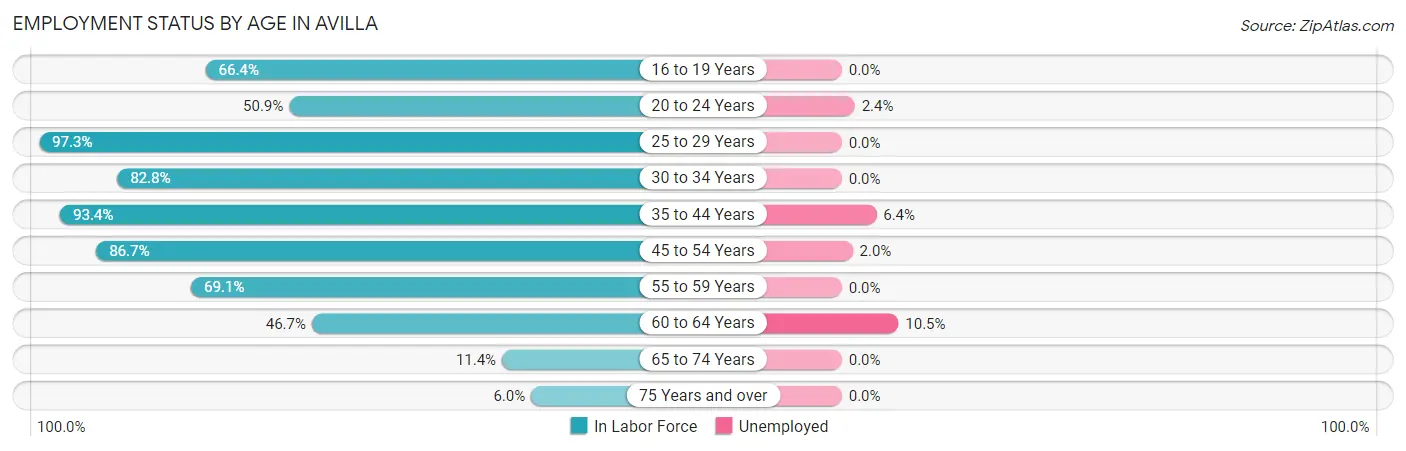
| Age Bracket | In Labor Force | Unemployed |
| 16 to 19 Years | 81 (66.4%) | 0 (0.0%) |
| 20 to 24 Years | 82 (50.9%) | 2 (2.4%) |
| 25 to 29 Years | 214 (97.3%) | 0 (0.0%) |
| 30 to 34 Years | 169 (82.8%) | 0 (0.0%) |
| 35 to 44 Years | 312 (93.4%) | 20 (6.4%) |
| 45 to 54 Years | 396 (86.7%) | 8 (2.0%) |
| 55 to 59 Years | 38 (69.1%) | 0 (0.0%) |
| 60 to 64 Years | 57 (46.7%) | 6 (10.5%) |
| 65 to 74 Years | 26 (11.4%) | 0 (0.0%) |
| 75 Years and over | 10 (6.0%) | 0 (0.0%) |
| Total | 1,385 (66.9%) | 36 (2.6%) |
Employment Status by Educational Attainment in Avilla
According to labor force statistics for Avilla, 85.2% of individuals (1,186) out of the total population between 25 and 64 years of age (1,392) are in the labor force, with 2.9% or 34 of them being unemployed. The group with the highest labor force participation rate are those with the educational attainment of high school diploma, with 88.9% or 463 individuals in the labor force. Within the labor force, individuals with high school diploma education have the highest percentage of unemployment, with 7.3% or 34 of them being unemployed.
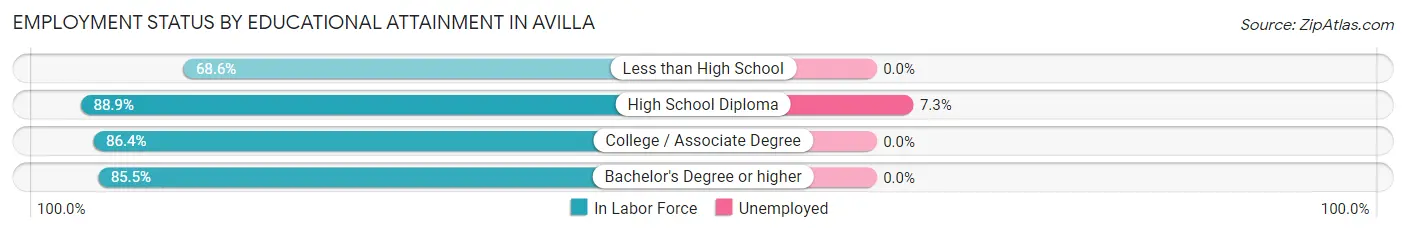
| Educational Attainment | In Labor Force | Unemployed |
| Less than High School | 107 (68.6%) | 0 (0.0%) |
| High School Diploma | 463 (88.9%) | 38 (7.3%) |
| College / Associate Degree | 427 (86.4%) | 0 (0.0%) |
| Bachelor's Degree or higher | 189 (85.5%) | 0 (0.0%) |
| Total | 1,186 (85.2%) | 40 (2.9%) |
Employment Occupations by Sex in Avilla
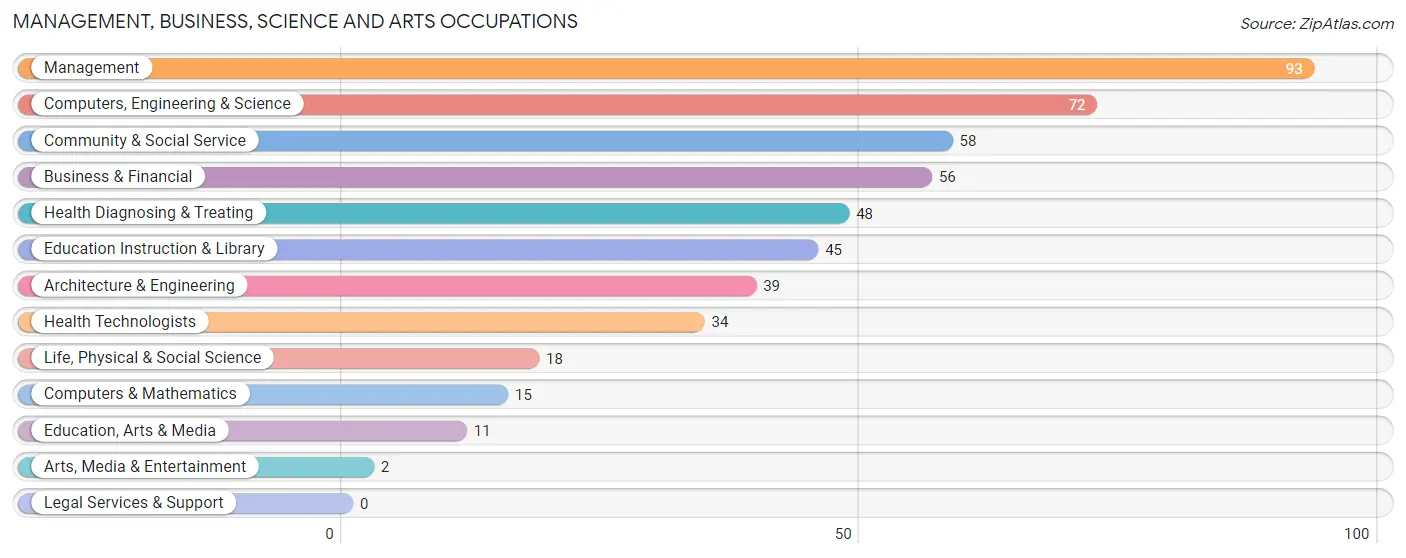
Management, Business, Science and Arts Occupations
The most common Management, Business, Science and Arts occupations in Avilla are Management (93 | 6.9%), Computers, Engineering & Science (72 | 5.3%), Community & Social Service (58 | 4.3%), Business & Financial (56 | 4.2%), and Health Diagnosing & Treating (48 | 3.6%).
Management, Business, Science and Arts Occupations by Sex
Within the Management, Business, Science and Arts occupations in Avilla, the most male-oriented occupations are Computers & Mathematics (100.0%), Architecture & Engineering (87.2%), and Computers, Engineering & Science (84.7%), while the most female-oriented occupations are Education, Arts & Media (100.0%), Arts, Media & Entertainment (100.0%), and Business & Financial (91.1%).
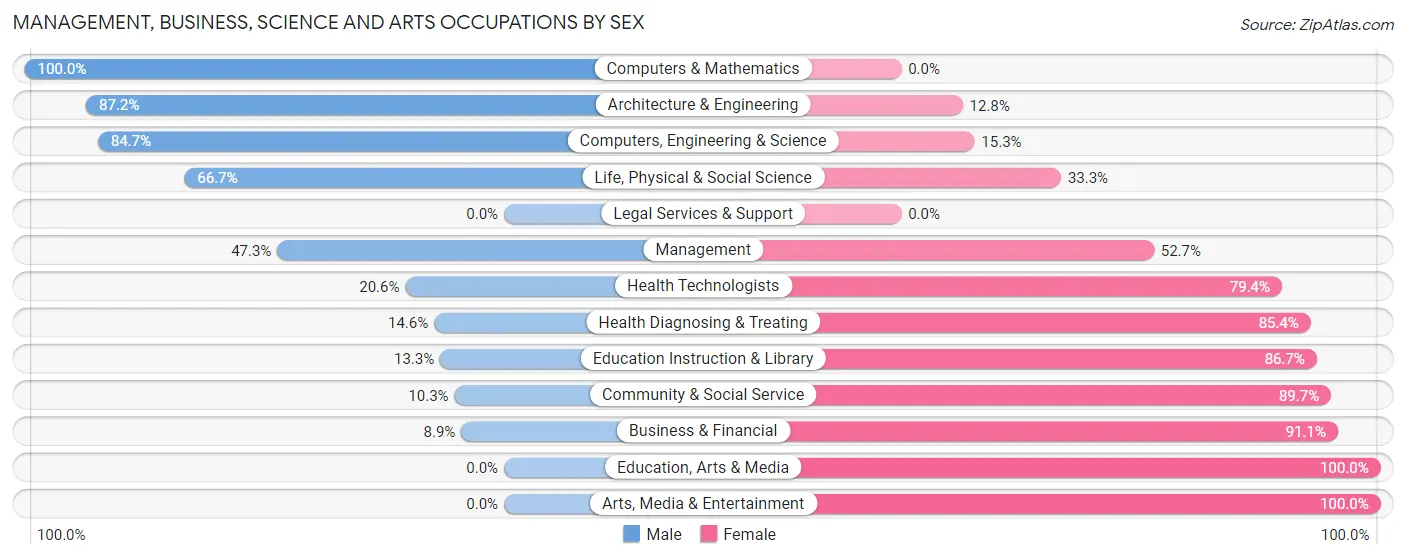
| Occupation | Male | Female |
| Management | 44 (47.3%) | 49 (52.7%) |
| Business & Financial | 5 (8.9%) | 51 (91.1%) |
| Computers, Engineering & Science | 61 (84.7%) | 11 (15.3%) |
| Computers & Mathematics | 15 (100.0%) | 0 (0.0%) |
| Architecture & Engineering | 34 (87.2%) | 5 (12.8%) |
| Life, Physical & Social Science | 12 (66.7%) | 6 (33.3%) |
| Community & Social Service | 6 (10.3%) | 52 (89.7%) |
| Education, Arts & Media | 0 (0.0%) | 11 (100.0%) |
| Legal Services & Support | 0 (0.0%) | 0 (0.0%) |
| Education Instruction & Library | 6 (13.3%) | 39 (86.7%) |
| Arts, Media & Entertainment | 0 (0.0%) | 2 (100.0%) |
| Health Diagnosing & Treating | 7 (14.6%) | 41 (85.4%) |
| Health Technologists | 7 (20.6%) | 27 (79.4%) |
| Total (Category) | 123 (37.6%) | 204 (62.4%) |
| Total (Overall) | 688 (51.0%) | 661 (49.0%) |
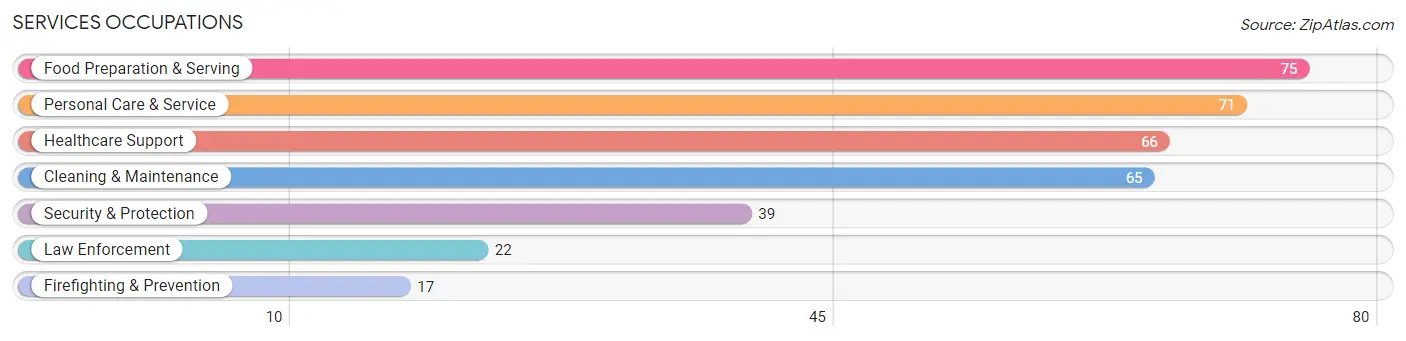
Services Occupations
The most common Services occupations in Avilla are Food Preparation & Serving (75 | 5.6%), Personal Care & Service (71 | 5.3%), Healthcare Support (66 | 4.9%), Cleaning & Maintenance (65 | 4.8%), and Security & Protection (39 | 2.9%).
Services Occupations by Sex
Within the Services occupations in Avilla, the most male-oriented occupations are Security & Protection (100.0%), Firefighting & Prevention (100.0%), and Law Enforcement (100.0%), while the most female-oriented occupations are Healthcare Support (93.9%), Cleaning & Maintenance (84.6%), and Food Preparation & Serving (70.7%).
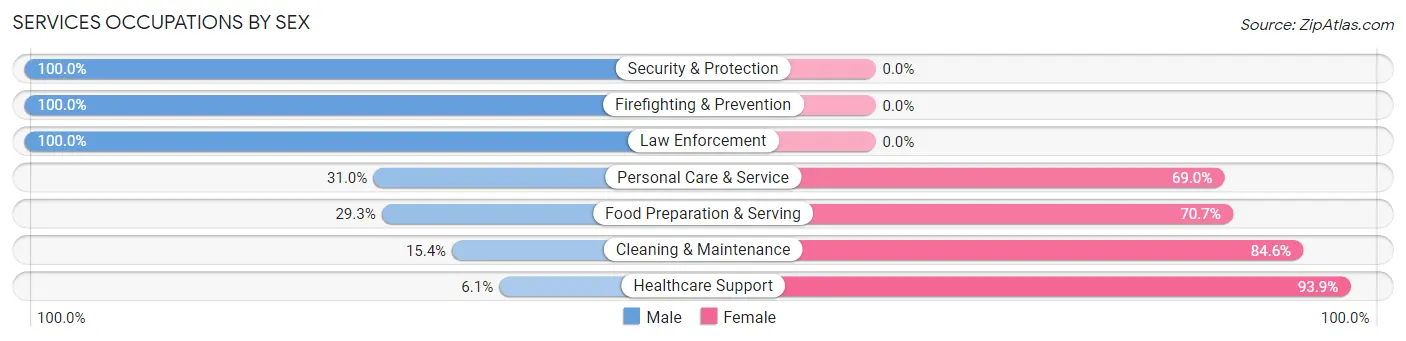
| Occupation | Male | Female |
| Healthcare Support | 4 (6.1%) | 62 (93.9%) |
| Security & Protection | 39 (100.0%) | 0 (0.0%) |
| Firefighting & Prevention | 17 (100.0%) | 0 (0.0%) |
| Law Enforcement | 22 (100.0%) | 0 (0.0%) |
| Food Preparation & Serving | 22 (29.3%) | 53 (70.7%) |
| Cleaning & Maintenance | 10 (15.4%) | 55 (84.6%) |
| Personal Care & Service | 22 (31.0%) | 49 (69.0%) |
| Total (Category) | 97 (30.7%) | 219 (69.3%) |
| Total (Overall) | 688 (51.0%) | 661 (49.0%) |
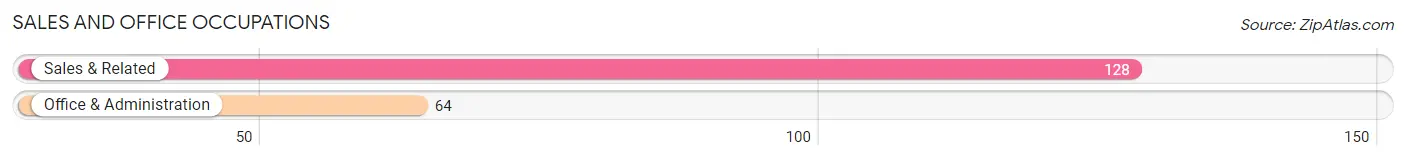
Sales and Office Occupations
The most common Sales and Office occupations in Avilla are Sales & Related (128 | 9.5%), and Office & Administration (64 | 4.7%).
Sales and Office Occupations by Sex
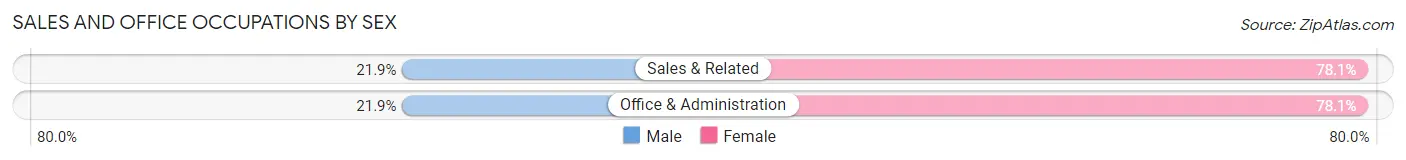
| Occupation | Male | Female |
| Sales & Related | 28 (21.9%) | 100 (78.1%) |
| Office & Administration | 14 (21.9%) | 50 (78.1%) |
| Total (Category) | 42 (21.9%) | 150 (78.1%) |
| Total (Overall) | 688 (51.0%) | 661 (49.0%) |
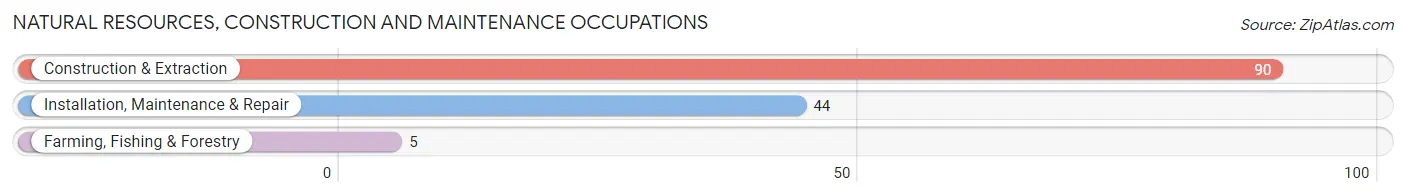
Natural Resources, Construction and Maintenance Occupations
The most common Natural Resources, Construction and Maintenance occupations in Avilla are Construction & Extraction (90 | 6.7%), Installation, Maintenance & Repair (44 | 3.3%), and Farming, Fishing & Forestry (5 | 0.4%).
Natural Resources, Construction and Maintenance Occupations by Sex
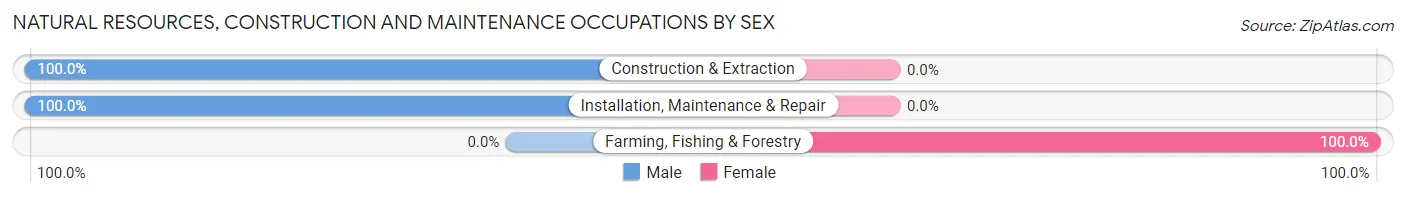
| Occupation | Male | Female |
| Farming, Fishing & Forestry | 0 (0.0%) | 5 (100.0%) |
| Construction & Extraction | 90 (100.0%) | 0 (0.0%) |
| Installation, Maintenance & Repair | 44 (100.0%) | 0 (0.0%) |
| Total (Category) | 134 (96.4%) | 5 (3.6%) |
| Total (Overall) | 688 (51.0%) | 661 (49.0%) |
Production, Transportation and Moving Occupations
The most common Production, Transportation and Moving occupations in Avilla are Production (292 | 21.6%), Transportation (42 | 3.1%), and Material Moving (41 | 3.0%).
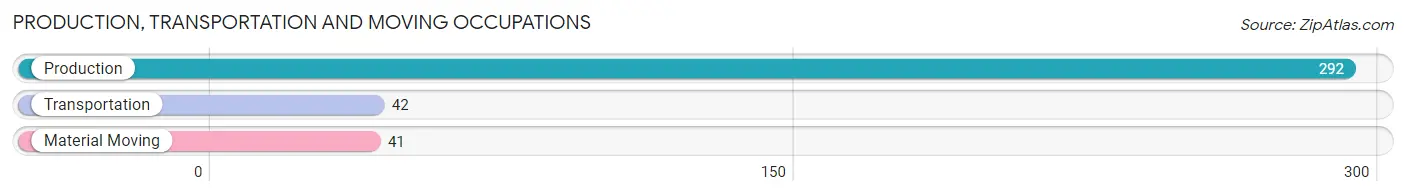
Production, Transportation and Moving Occupations by Sex
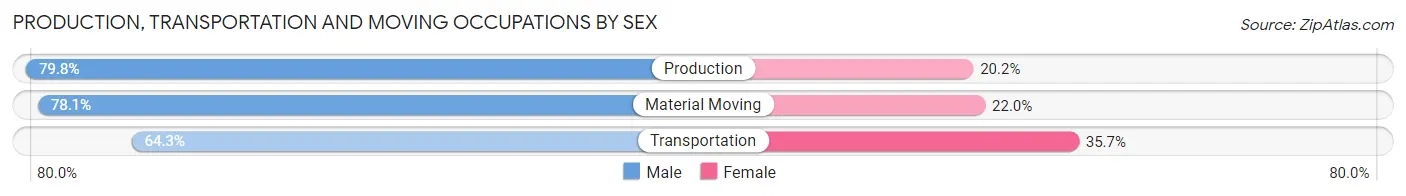
| Occupation | Male | Female |
| Production | 233 (79.8%) | 59 (20.2%) |
| Transportation | 27 (64.3%) | 15 (35.7%) |
| Material Moving | 32 (78.0%) | 9 (22.0%) |
| Total (Category) | 292 (77.9%) | 83 (22.1%) |
| Total (Overall) | 688 (51.0%) | 661 (49.0%) |
Employment Industries by Sex in Avilla
Employment Industries in Avilla
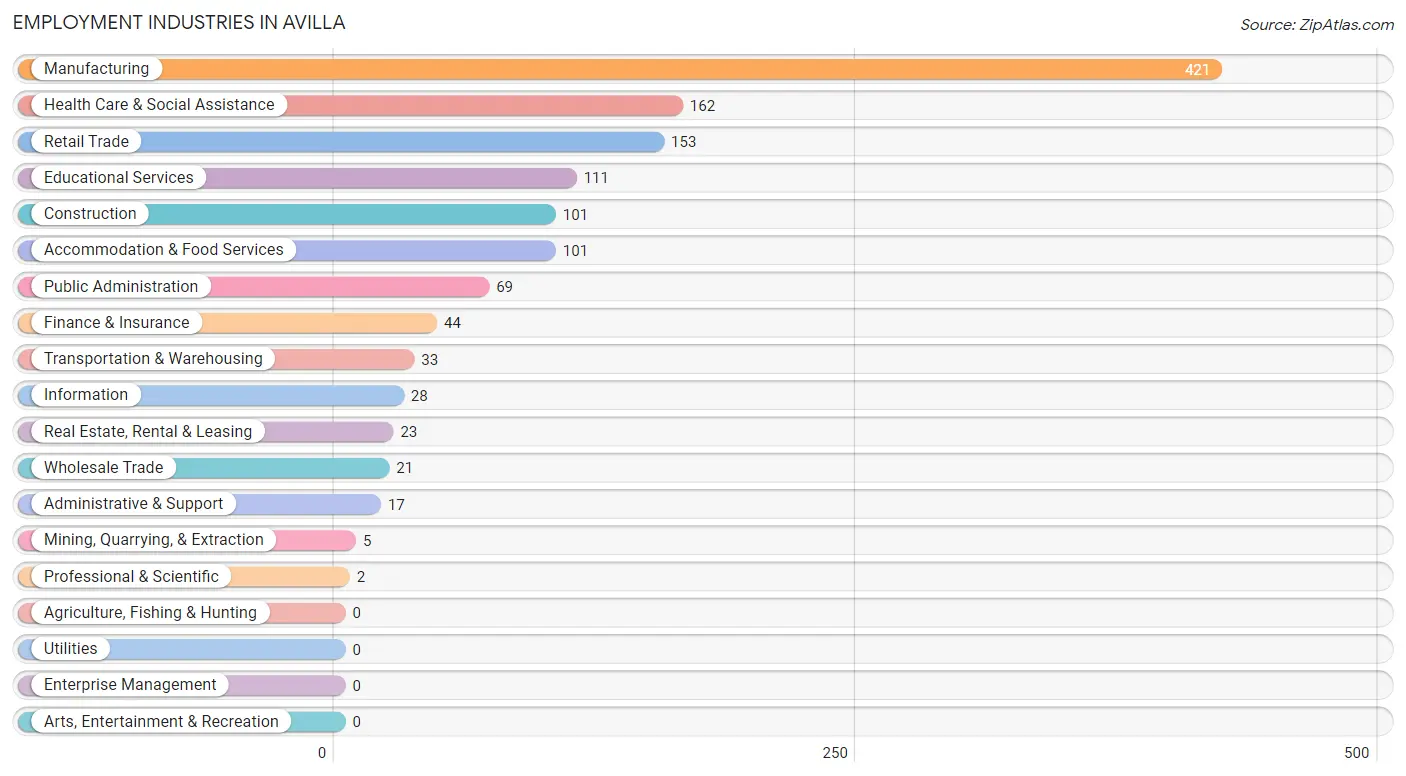
The major employment industries in Avilla include Manufacturing (421 | 31.2%), Health Care & Social Assistance (162 | 12.0%), Retail Trade (153 | 11.3%), Educational Services (111 | 8.2%), and Construction (101 | 7.5%).
Employment Industries by Sex in Avilla
The Avilla industries that see more men than women are Mining, Quarrying, & Extraction (100.0%), Transportation & Warehousing (100.0%), and Construction (94.1%), whereas the industries that tend to have a higher number of women are Professional & Scientific (100.0%), Educational Services (87.4%), and Health Care & Social Assistance (86.4%).
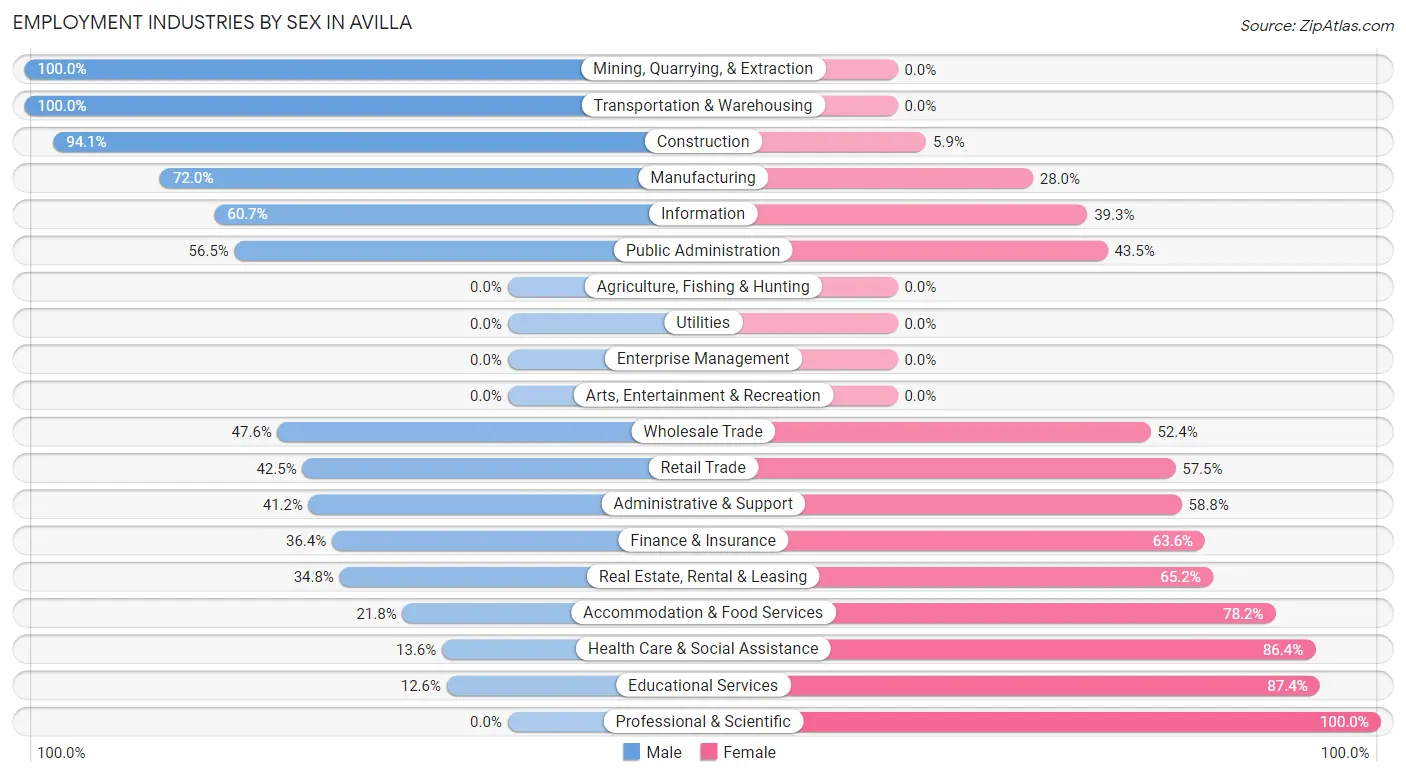
| Industry | Male | Female |
| Agriculture, Fishing & Hunting | 0 (0.0%) | 0 (0.0%) |
| Mining, Quarrying, & Extraction | 5 (100.0%) | 0 (0.0%) |
| Construction | 95 (94.1%) | 6 (5.9%) |
| Manufacturing | 303 (72.0%) | 118 (28.0%) |
| Wholesale Trade | 10 (47.6%) | 11 (52.4%) |
| Retail Trade | 65 (42.5%) | 88 (57.5%) |
| Transportation & Warehousing | 33 (100.0%) | 0 (0.0%) |
| Utilities | 0 (0.0%) | 0 (0.0%) |
| Information | 17 (60.7%) | 11 (39.3%) |
| Finance & Insurance | 16 (36.4%) | 28 (63.6%) |
| Real Estate, Rental & Leasing | 8 (34.8%) | 15 (65.2%) |
| Professional & Scientific | 0 (0.0%) | 2 (100.0%) |
| Enterprise Management | 0 (0.0%) | 0 (0.0%) |
| Administrative & Support | 7 (41.2%) | 10 (58.8%) |
| Educational Services | 14 (12.6%) | 97 (87.4%) |
| Health Care & Social Assistance | 22 (13.6%) | 140 (86.4%) |
| Arts, Entertainment & Recreation | 0 (0.0%) | 0 (0.0%) |
| Accommodation & Food Services | 22 (21.8%) | 79 (78.2%) |
| Public Administration | 39 (56.5%) | 30 (43.5%) |
| Total | 688 (51.0%) | 661 (49.0%) |
Education in Avilla
School Enrollment in Avilla
The most common levels of schooling among the 492 students in Avilla are elementary school (124 | 25.2%), middle school (119 | 24.2%), and high school (94 | 19.1%).
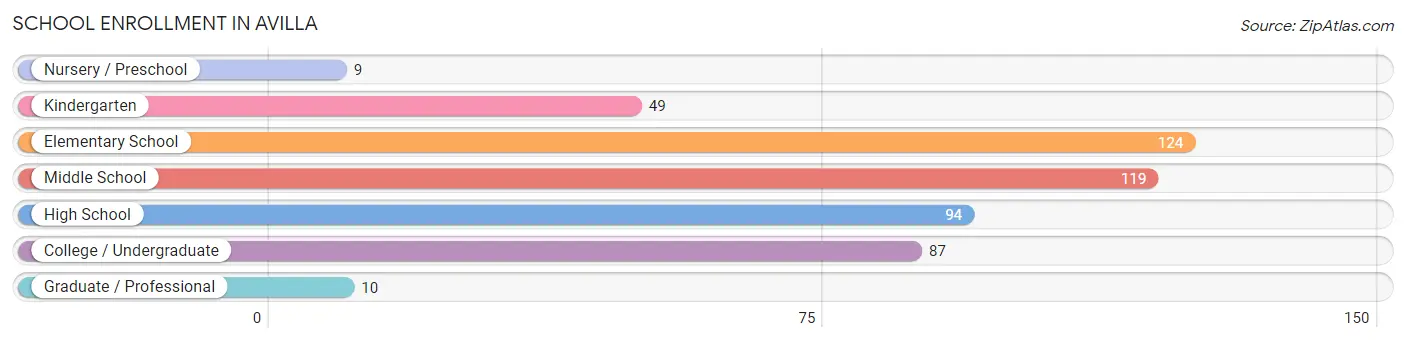
| School Level | # Students | % Students |
| Nursery / Preschool | 9 | 1.8% |
| Kindergarten | 49 | 10.0% |
| Elementary School | 124 | 25.2% |
| Middle School | 119 | 24.2% |
| High School | 94 | 19.1% |
| College / Undergraduate | 87 | 17.7% |
| Graduate / Professional | 10 | 2.0% |
| Total | 492 | 100.0% |
School Enrollment by Age by Funding Source in Avilla
Out of a total of 492 students who are enrolled in schools in Avilla, 122 (24.8%) attend a private institution, while the remaining 370 (75.2%) are enrolled in public schools. The age group of 3 to 4 year olds has the highest likelihood of being enrolled in private schools, with 3 (100.0% in the age bracket) enrolled. Conversely, the age group of 15 to 17 year olds has the lowest likelihood of being enrolled in a private school, with 61 (100.0% in the age bracket) attending a public institution.
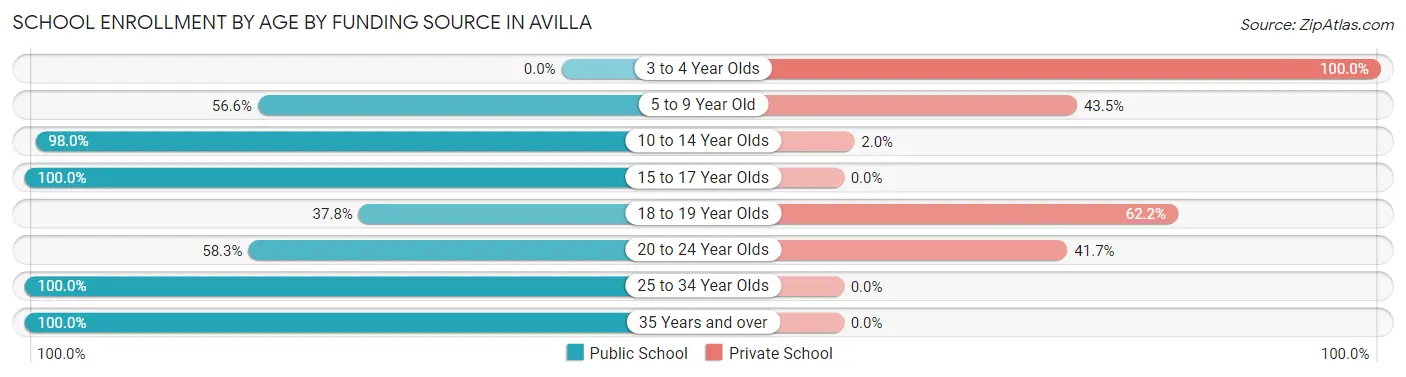
| Age Bracket | Public School | Private School |
| 3 to 4 Year Olds | 0 (0.0%) | 3 (100.0%) |
| 5 to 9 Year Old | 95 (56.6%) | 73 (43.4%) |
| 10 to 14 Year Olds | 148 (98.0%) | 3 (2.0%) |
| 15 to 17 Year Olds | 61 (100.0%) | 0 (0.0%) |
| 18 to 19 Year Olds | 17 (37.8%) | 28 (62.2%) |
| 20 to 24 Year Olds | 21 (58.3%) | 15 (41.7%) |
| 25 to 34 Year Olds | 17 (100.0%) | 0 (0.0%) |
| 35 Years and over | 11 (100.0%) | 0 (0.0%) |
| Total | 370 (75.2%) | 122 (24.8%) |
Educational Attainment by Field of Study in Avilla
Education (72 | 27.1%), business (65 | 24.4%), arts & humanities (29 | 10.9%), science & technology (26 | 9.8%), and computers & mathematics (23 | 8.6%) are the most common fields of study among 266 individuals in Avilla who have obtained a bachelor's degree or higher.
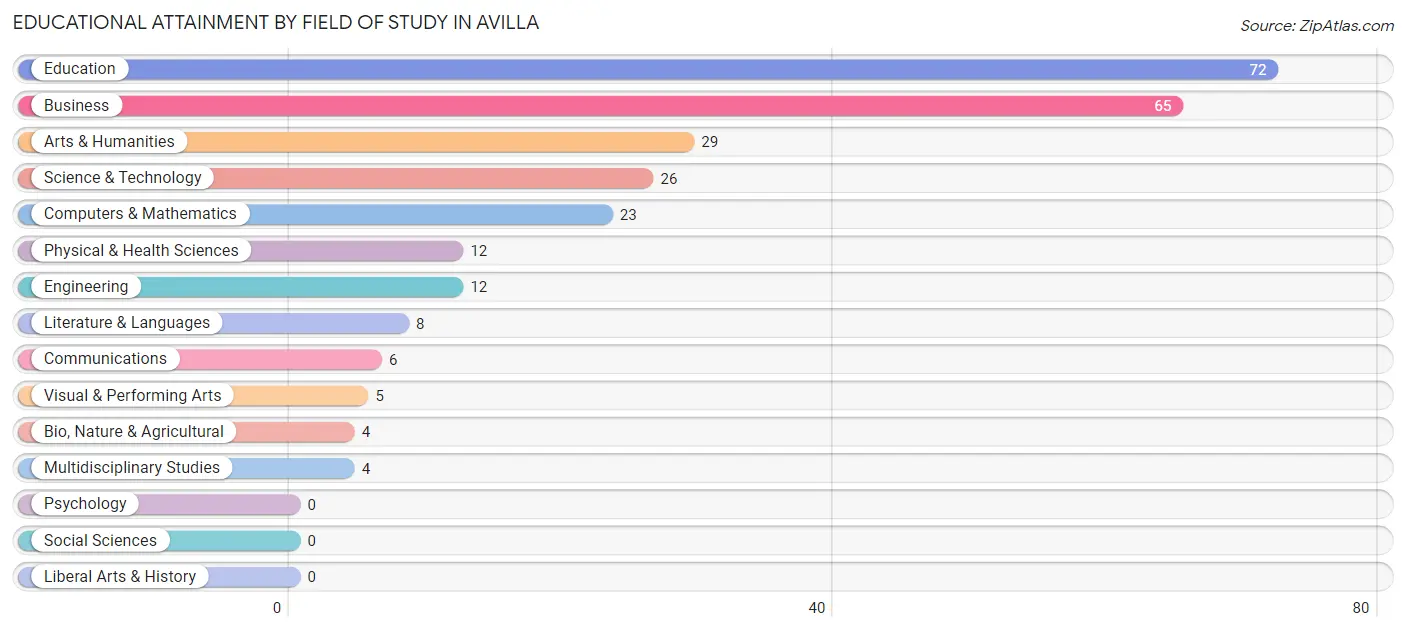
| Field of Study | # Graduates | % Graduates |
| Computers & Mathematics | 23 | 8.6% |
| Bio, Nature & Agricultural | 4 | 1.5% |
| Physical & Health Sciences | 12 | 4.5% |
| Psychology | 0 | 0.0% |
| Social Sciences | 0 | 0.0% |
| Engineering | 12 | 4.5% |
| Multidisciplinary Studies | 4 | 1.5% |
| Science & Technology | 26 | 9.8% |
| Business | 65 | 24.4% |
| Education | 72 | 27.1% |
| Literature & Languages | 8 | 3.0% |
| Liberal Arts & History | 0 | 0.0% |
| Visual & Performing Arts | 5 | 1.9% |
| Communications | 6 | 2.3% |
| Arts & Humanities | 29 | 10.9% |
| Total | 266 | 100.0% |
Transportation & Commute in Avilla
Vehicle Availability by Sex in Avilla
The most prevalent vehicle ownership categories in Avilla are males with 2 vehicles (412, accounting for 60.8%) and females with 2 vehicles (324, making up 63.1%).
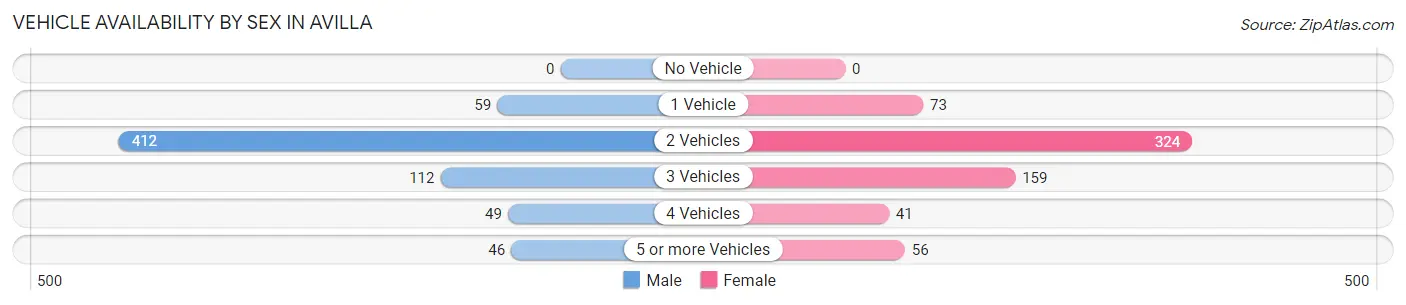
| Vehicles Available | Male | Female |
| No Vehicle | 0 (0.0%) | 0 (0.0%) |
| 1 Vehicle | 59 (8.7%) | 73 (11.2%) |
| 2 Vehicles | 412 (60.8%) | 324 (49.6%) |
| 3 Vehicles | 112 (16.5%) | 159 (24.3%) |
| 4 Vehicles | 49 (7.2%) | 41 (6.3%) |
| 5 or more Vehicles | 46 (6.8%) | 56 (8.6%) |
| Total | 678 (100.0%) | 653 (100.0%) |
Commute Time in Avilla
The most frequently occuring commute durations in Avilla are 15 to 19 minutes (275 commuters, 21.1%), 10 to 14 minutes (198 commuters, 15.2%), and 45 to 59 minutes (186 commuters, 14.3%).
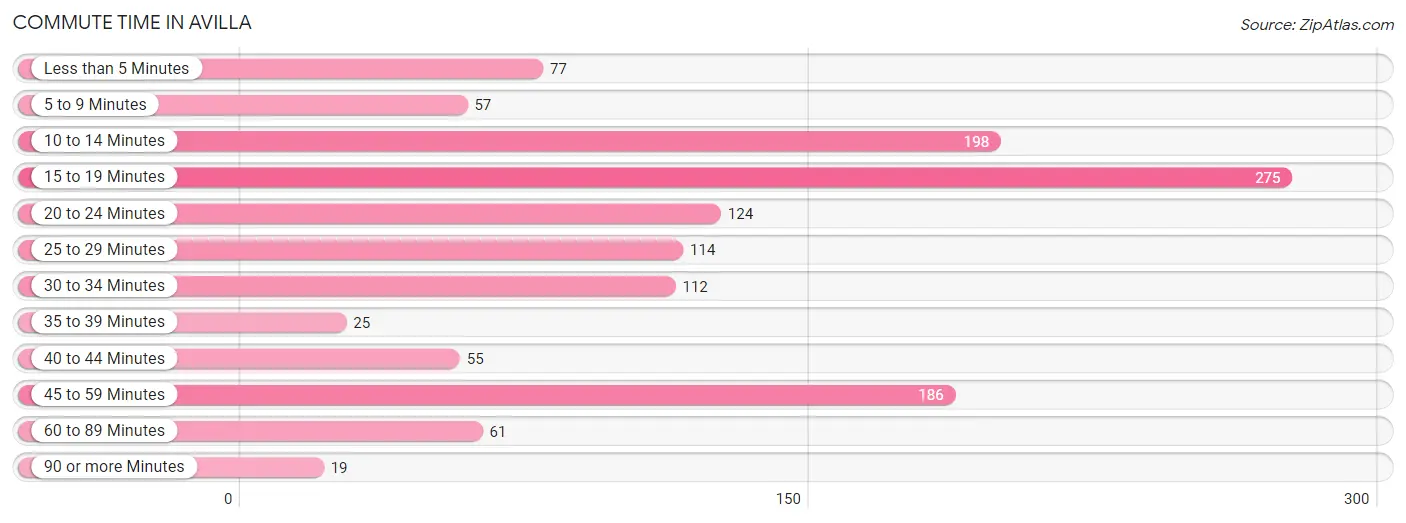
| Commute Time | # Commuters | % Commuters |
| Less than 5 Minutes | 77 | 5.9% |
| 5 to 9 Minutes | 57 | 4.4% |
| 10 to 14 Minutes | 198 | 15.2% |
| 15 to 19 Minutes | 275 | 21.1% |
| 20 to 24 Minutes | 124 | 9.5% |
| 25 to 29 Minutes | 114 | 8.7% |
| 30 to 34 Minutes | 112 | 8.6% |
| 35 to 39 Minutes | 25 | 1.9% |
| 40 to 44 Minutes | 55 | 4.2% |
| 45 to 59 Minutes | 186 | 14.3% |
| 60 to 89 Minutes | 61 | 4.7% |
| 90 or more Minutes | 19 | 1.5% |
Commute Time by Sex in Avilla
The most common commute times in Avilla are 45 to 59 minutes (141 commuters, 20.9%) for males and 15 to 19 minutes (151 commuters, 24.1%) for females.
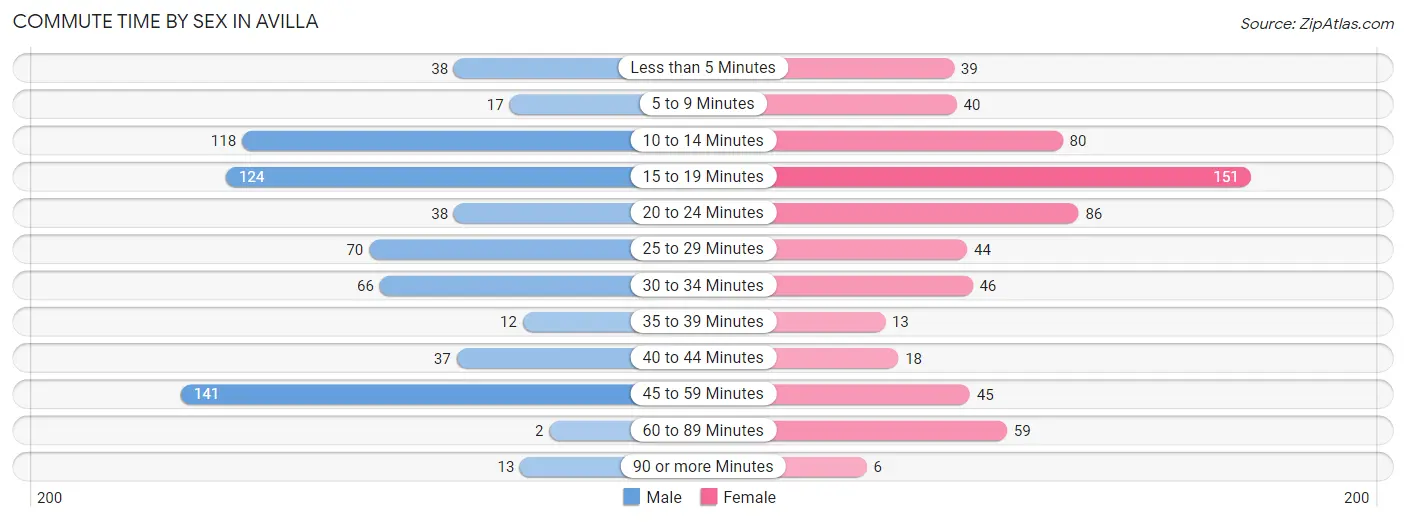
| Commute Time | Male | Female |
| Less than 5 Minutes | 38 (5.6%) | 39 (6.2%) |
| 5 to 9 Minutes | 17 (2.5%) | 40 (6.4%) |
| 10 to 14 Minutes | 118 (17.5%) | 80 (12.8%) |
| 15 to 19 Minutes | 124 (18.3%) | 151 (24.1%) |
| 20 to 24 Minutes | 38 (5.6%) | 86 (13.7%) |
| 25 to 29 Minutes | 70 (10.4%) | 44 (7.0%) |
| 30 to 34 Minutes | 66 (9.8%) | 46 (7.3%) |
| 35 to 39 Minutes | 12 (1.8%) | 13 (2.1%) |
| 40 to 44 Minutes | 37 (5.5%) | 18 (2.9%) |
| 45 to 59 Minutes | 141 (20.9%) | 45 (7.2%) |
| 60 to 89 Minutes | 2 (0.3%) | 59 (9.4%) |
| 90 or more Minutes | 13 (1.9%) | 6 (1.0%) |
Time of Departure to Work by Sex in Avilla
The most frequent times of departure to work in Avilla are 6:30 AM to 6:59 AM (191, 28.2%) for males and 7:30 AM to 7:59 AM (96, 15.3%) for females.
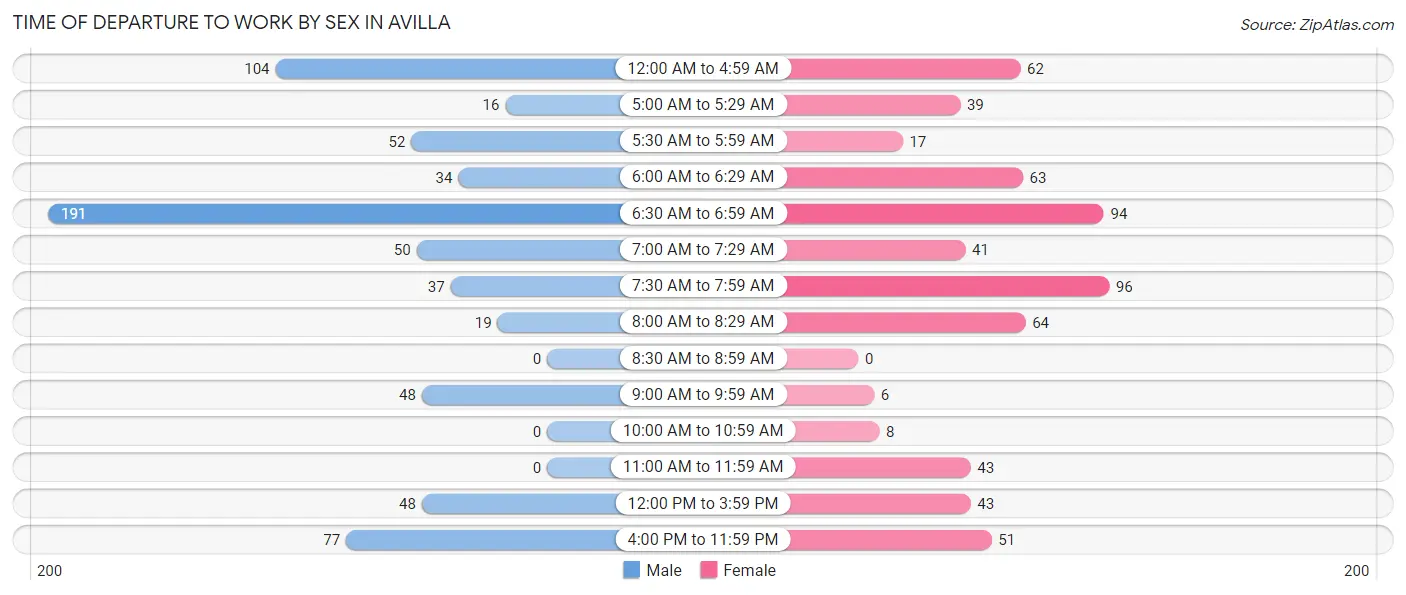
| Time of Departure | Male | Female |
| 12:00 AM to 4:59 AM | 104 (15.4%) | 62 (9.9%) |
| 5:00 AM to 5:29 AM | 16 (2.4%) | 39 (6.2%) |
| 5:30 AM to 5:59 AM | 52 (7.7%) | 17 (2.7%) |
| 6:00 AM to 6:29 AM | 34 (5.0%) | 63 (10.1%) |
| 6:30 AM to 6:59 AM | 191 (28.2%) | 94 (15.0%) |
| 7:00 AM to 7:29 AM | 50 (7.4%) | 41 (6.5%) |
| 7:30 AM to 7:59 AM | 37 (5.5%) | 96 (15.3%) |
| 8:00 AM to 8:29 AM | 19 (2.8%) | 64 (10.2%) |
| 8:30 AM to 8:59 AM | 0 (0.0%) | 0 (0.0%) |
| 9:00 AM to 9:59 AM | 48 (7.1%) | 6 (1.0%) |
| 10:00 AM to 10:59 AM | 0 (0.0%) | 8 (1.3%) |
| 11:00 AM to 11:59 AM | 0 (0.0%) | 43 (6.9%) |
| 12:00 PM to 3:59 PM | 48 (7.1%) | 43 (6.9%) |
| 4:00 PM to 11:59 PM | 77 (11.4%) | 51 (8.1%) |
| Total | 676 (100.0%) | 627 (100.0%) |
Housing Occupancy in Avilla
Occupancy by Ownership in Avilla
Of the total 968 dwellings in Avilla, owner-occupied units account for 756 (78.1%), while renter-occupied units make up 212 (21.9%).
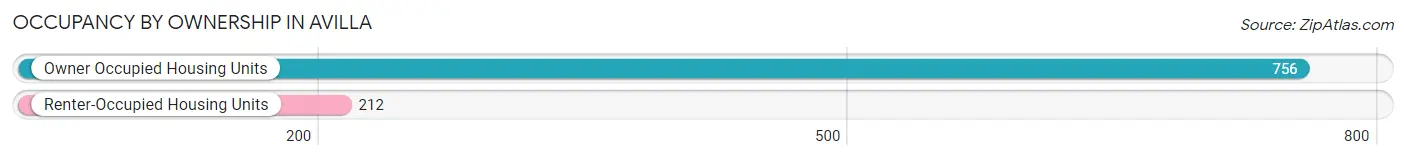
| Occupancy | # Housing Units | % Housing Units |
| Owner Occupied Housing Units | 756 | 78.1% |
| Renter-Occupied Housing Units | 212 | 21.9% |
| Total Occupied Housing Units | 968 | 100.0% |
Occupancy by Household Size in Avilla
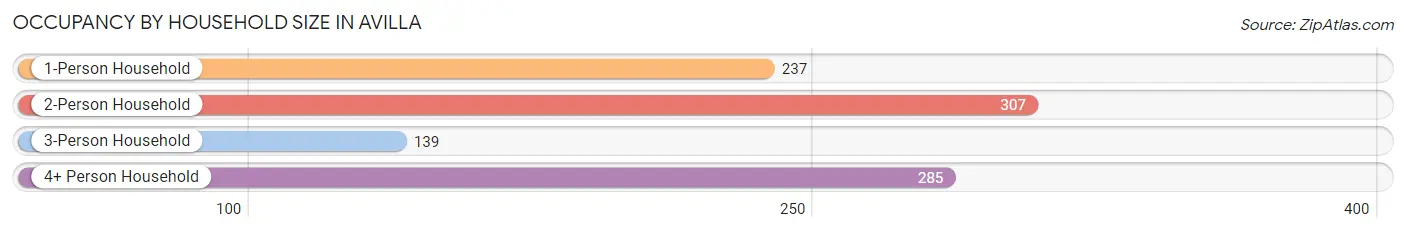
| Household Size | # Housing Units | % Housing Units |
| 1-Person Household | 237 | 24.5% |
| 2-Person Household | 307 | 31.7% |
| 3-Person Household | 139 | 14.4% |
| 4+ Person Household | 285 | 29.4% |
| Total Housing Units | 968 | 100.0% |
Occupancy by Ownership by Household Size in Avilla
| Household Size | Owner-occupied | Renter-occupied |
| 1-Person Household | 133 (56.1%) | 104 (43.9%) |
| 2-Person Household | 243 (79.1%) | 64 (20.8%) |
| 3-Person Household | 125 (89.9%) | 14 (10.1%) |
| 4+ Person Household | 255 (89.5%) | 30 (10.5%) |
| Total Housing Units | 756 (78.1%) | 212 (21.9%) |
Occupancy by Educational Attainment in Avilla
| Household Size | Owner-occupied | Renter-occupied |
| Less than High School | 77 (61.6%) | 48 (38.4%) |
| High School Diploma | 229 (73.2%) | 84 (26.8%) |
| College/Associate Degree | 312 (83.2%) | 63 (16.8%) |
| Bachelor's Degree or higher | 138 (89.0%) | 17 (11.0%) |
Occupancy by Age of Householder in Avilla
| Age Bracket | # Households | % Households |
| Under 35 Years | 244 | 25.2% |
| 35 to 44 Years | 176 | 18.2% |
| 45 to 54 Years | 223 | 23.0% |
| 55 to 64 Years | 134 | 13.8% |
| 65 to 74 Years | 116 | 12.0% |
| 75 to 84 Years | 65 | 6.7% |
| 85 Years and Over | 10 | 1.0% |
| Total | 968 | 100.0% |
Housing Finances in Avilla
Median Income by Occupancy in Avilla
| Occupancy Type | # Households | Median Income |
| Owner-Occupied | 756 (78.1%) | $81,364 |
| Renter-Occupied | 212 (21.9%) | $37,083 |
| Average | 968 (100.0%) | $77,583 |
Occupancy by Householder Income Bracket in Avilla
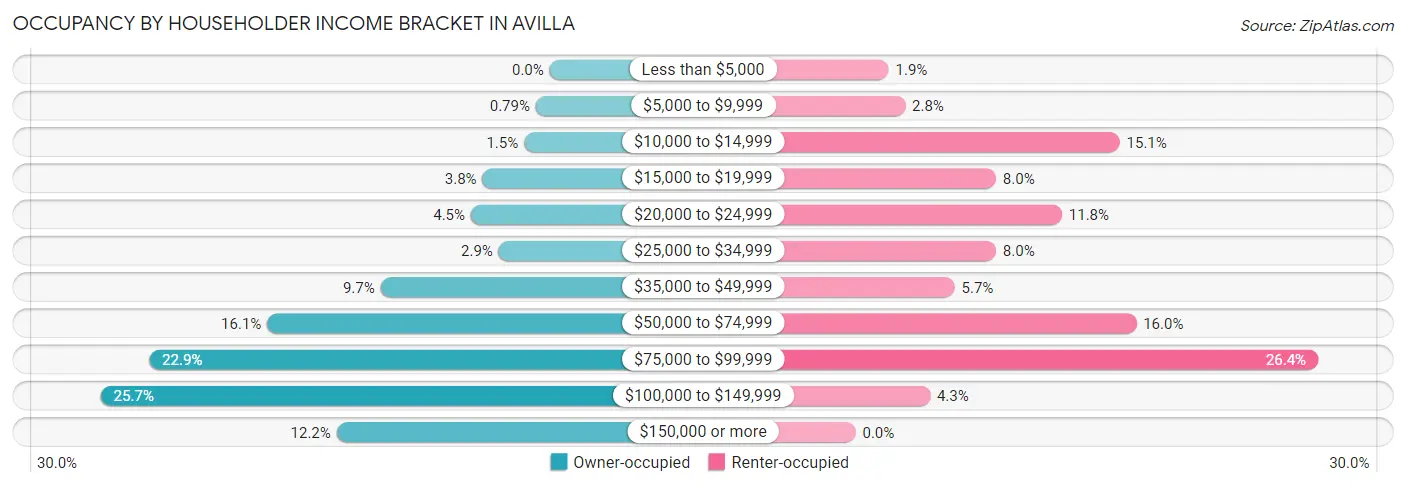
| Income Bracket | Owner-occupied | Renter-occupied |
| Less than $5,000 | 0 (0.0%) | 4 (1.9%) |
| $5,000 to $9,999 | 6 (0.8%) | 6 (2.8%) |
| $10,000 to $14,999 | 11 (1.5%) | 32 (15.1%) |
| $15,000 to $19,999 | 29 (3.8%) | 17 (8.0%) |
| $20,000 to $24,999 | 34 (4.5%) | 25 (11.8%) |
| $25,000 to $34,999 | 22 (2.9%) | 17 (8.0%) |
| $35,000 to $49,999 | 73 (9.7%) | 12 (5.7%) |
| $50,000 to $74,999 | 122 (16.1%) | 34 (16.0%) |
| $75,000 to $99,999 | 173 (22.9%) | 56 (26.4%) |
| $100,000 to $149,999 | 194 (25.7%) | 9 (4.3%) |
| $150,000 or more | 92 (12.2%) | 0 (0.0%) |
| Total | 756 (100.0%) | 212 (100.0%) |
Monthly Housing Cost Tiers in Avilla
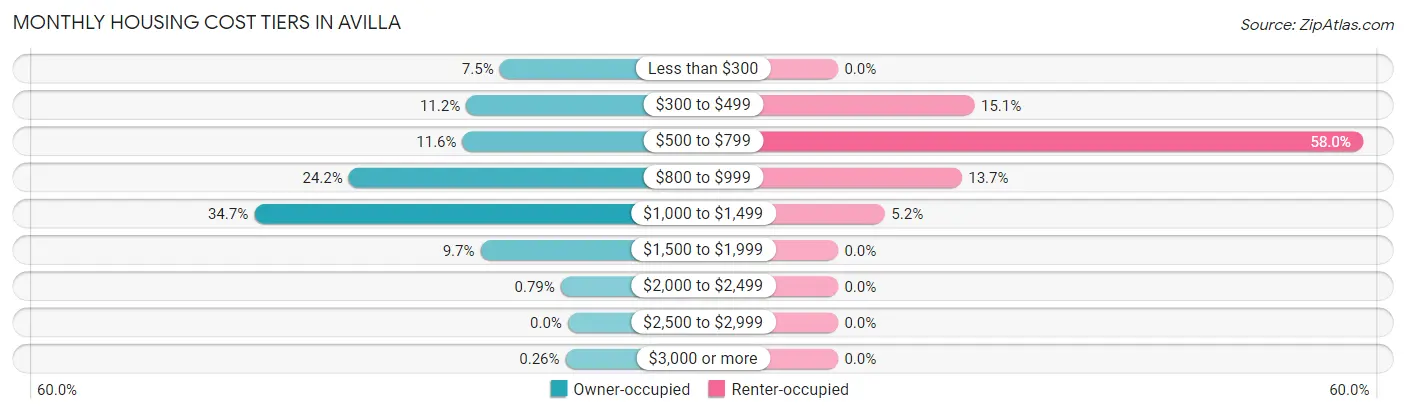
| Monthly Cost | Owner-occupied | Renter-occupied |
| Less than $300 | 57 (7.5%) | 0 (0.0%) |
| $300 to $499 | 85 (11.2%) | 32 (15.1%) |
| $500 to $799 | 88 (11.6%) | 123 (58.0%) |
| $800 to $999 | 183 (24.2%) | 29 (13.7%) |
| $1,000 to $1,499 | 262 (34.7%) | 11 (5.2%) |
| $1,500 to $1,999 | 73 (9.7%) | 0 (0.0%) |
| $2,000 to $2,499 | 6 (0.8%) | 0 (0.0%) |
| $2,500 to $2,999 | 0 (0.0%) | 0 (0.0%) |
| $3,000 or more | 2 (0.3%) | 0 (0.0%) |
| Total | 756 (100.0%) | 212 (100.0%) |
Physical Housing Characteristics in Avilla
Housing Structures in Avilla
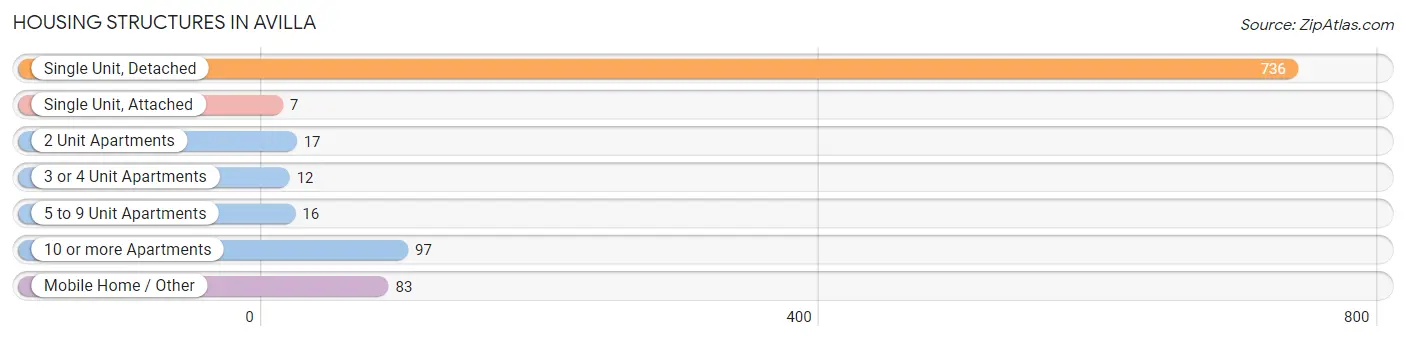
| Structure Type | # Housing Units | % Housing Units |
| Single Unit, Detached | 736 | 76.0% |
| Single Unit, Attached | 7 | 0.7% |
| 2 Unit Apartments | 17 | 1.8% |
| 3 or 4 Unit Apartments | 12 | 1.2% |
| 5 to 9 Unit Apartments | 16 | 1.7% |
| 10 or more Apartments | 97 | 10.0% |
| Mobile Home / Other | 83 | 8.6% |
| Total | 968 | 100.0% |
Housing Structures by Occupancy in Avilla
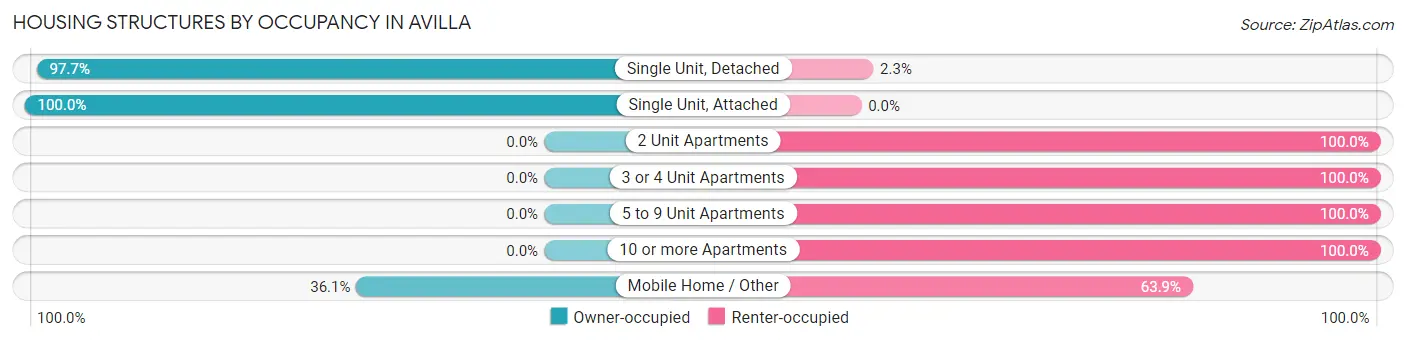
| Structure Type | Owner-occupied | Renter-occupied |
| Single Unit, Detached | 719 (97.7%) | 17 (2.3%) |
| Single Unit, Attached | 7 (100.0%) | 0 (0.0%) |
| 2 Unit Apartments | 0 (0.0%) | 17 (100.0%) |
| 3 or 4 Unit Apartments | 0 (0.0%) | 12 (100.0%) |
| 5 to 9 Unit Apartments | 0 (0.0%) | 16 (100.0%) |
| 10 or more Apartments | 0 (0.0%) | 97 (100.0%) |
| Mobile Home / Other | 30 (36.1%) | 53 (63.9%) |
| Total | 756 (78.1%) | 212 (21.9%) |
Housing Structures by Number of Rooms in Avilla
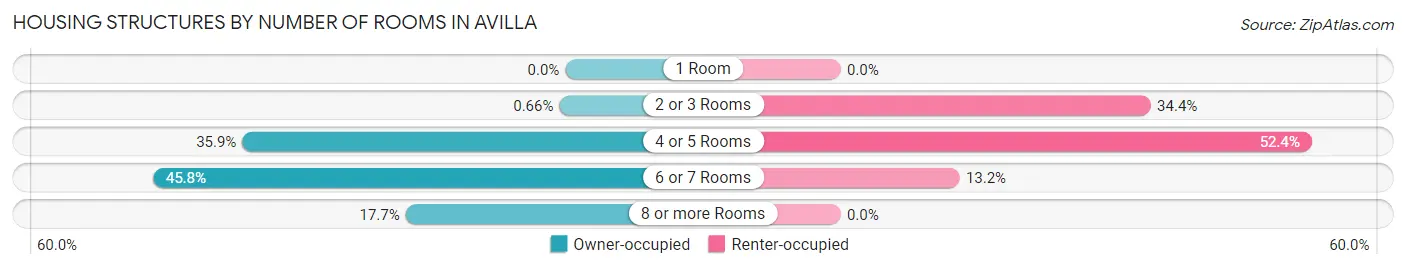
| Number of Rooms | Owner-occupied | Renter-occupied |
| 1 Room | 0 (0.0%) | 0 (0.0%) |
| 2 or 3 Rooms | 5 (0.7%) | 73 (34.4%) |
| 4 or 5 Rooms | 271 (35.8%) | 111 (52.4%) |
| 6 or 7 Rooms | 346 (45.8%) | 28 (13.2%) |
| 8 or more Rooms | 134 (17.7%) | 0 (0.0%) |
| Total | 756 (100.0%) | 212 (100.0%) |
Housing Structure by Heating Type in Avilla
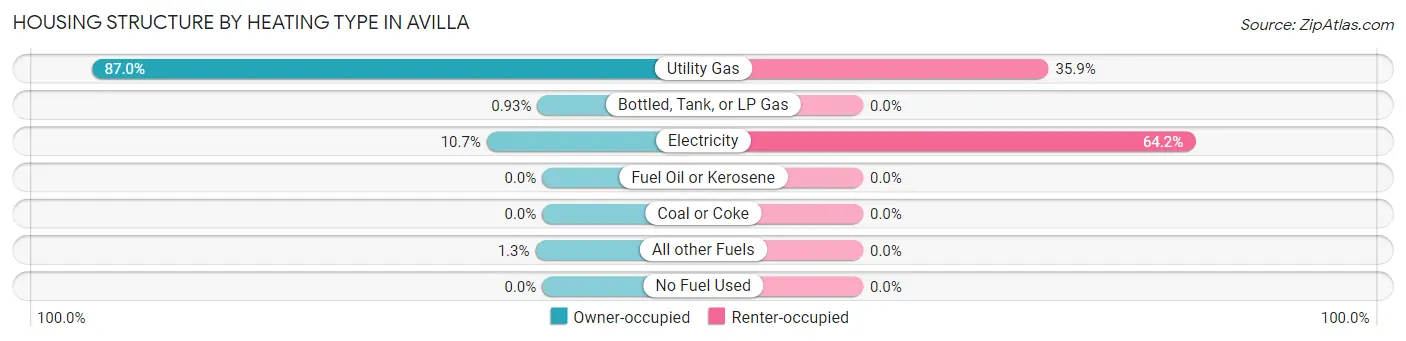
| Heating Type | Owner-occupied | Renter-occupied |
| Utility Gas | 658 (87.0%) | 76 (35.8%) |
| Bottled, Tank, or LP Gas | 7 (0.9%) | 0 (0.0%) |
| Electricity | 81 (10.7%) | 136 (64.1%) |
| Fuel Oil or Kerosene | 0 (0.0%) | 0 (0.0%) |
| Coal or Coke | 0 (0.0%) | 0 (0.0%) |
| All other Fuels | 10 (1.3%) | 0 (0.0%) |
| No Fuel Used | 0 (0.0%) | 0 (0.0%) |
| Total | 756 (100.0%) | 212 (100.0%) |
Household Vehicle Usage in Avilla
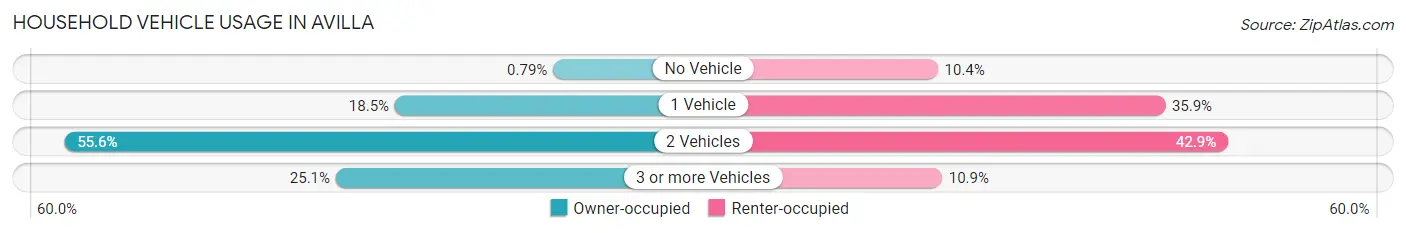
| Vehicles per Household | Owner-occupied | Renter-occupied |
| No Vehicle | 6 (0.8%) | 22 (10.4%) |
| 1 Vehicle | 140 (18.5%) | 76 (35.8%) |
| 2 Vehicles | 420 (55.6%) | 91 (42.9%) |
| 3 or more Vehicles | 190 (25.1%) | 23 (10.8%) |
| Total | 756 (100.0%) | 212 (100.0%) |
Real Estate & Mortgages in Avilla
Real Estate and Mortgage Overview in Avilla
| Characteristic | Without Mortgage | With Mortgage |
| Housing Units | 165 | 591 |
| Median Property Value | $143,800 | $153,800 |
| Median Household Income | $51,250 | $80 |
| Monthly Housing Costs | $393 | $2 |
| Real Estate Taxes | - | - |
Property Value by Mortgage Status in Avilla
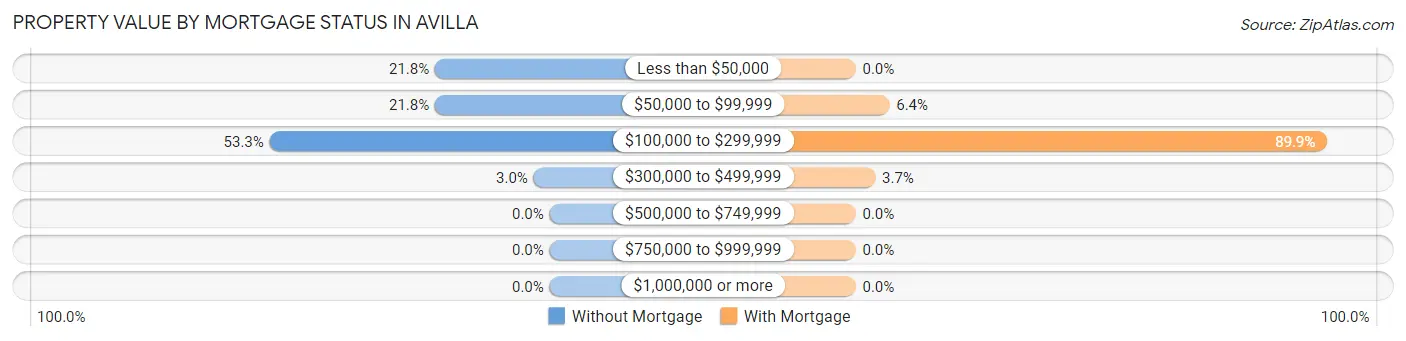
| Property Value | Without Mortgage | With Mortgage |
| Less than $50,000 | 36 (21.8%) | 0 (0.0%) |
| $50,000 to $99,999 | 36 (21.8%) | 38 (6.4%) |
| $100,000 to $299,999 | 88 (53.3%) | 531 (89.8%) |
| $300,000 to $499,999 | 5 (3.0%) | 22 (3.7%) |
| $500,000 to $749,999 | 0 (0.0%) | 0 (0.0%) |
| $750,000 to $999,999 | 0 (0.0%) | 0 (0.0%) |
| $1,000,000 or more | 0 (0.0%) | 0 (0.0%) |
| Total | 165 (100.0%) | 591 (100.0%) |
Household Income by Mortgage Status in Avilla
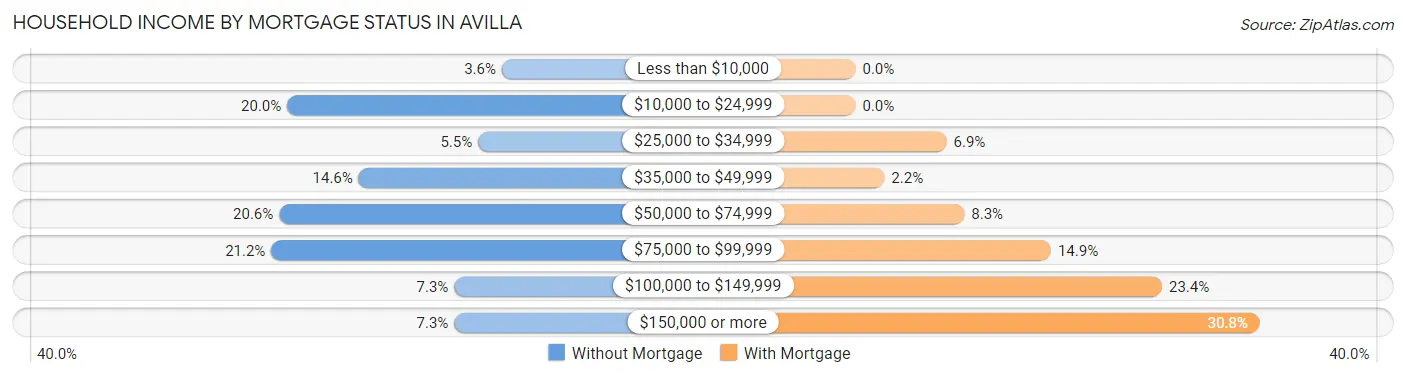
| Household Income | Without Mortgage | With Mortgage |
| Less than $10,000 | 6 (3.6%) | 0 (0.0%) |
| $10,000 to $24,999 | 33 (20.0%) | 0 (0.0%) |
| $25,000 to $34,999 | 9 (5.4%) | 41 (6.9%) |
| $35,000 to $49,999 | 24 (14.5%) | 13 (2.2%) |
| $50,000 to $74,999 | 34 (20.6%) | 49 (8.3%) |
| $75,000 to $99,999 | 35 (21.2%) | 88 (14.9%) |
| $100,000 to $149,999 | 12 (7.3%) | 138 (23.4%) |
| $150,000 or more | 12 (7.3%) | 182 (30.8%) |
| Total | 165 (100.0%) | 591 (100.0%) |
Property Value to Household Income Ratio in Avilla
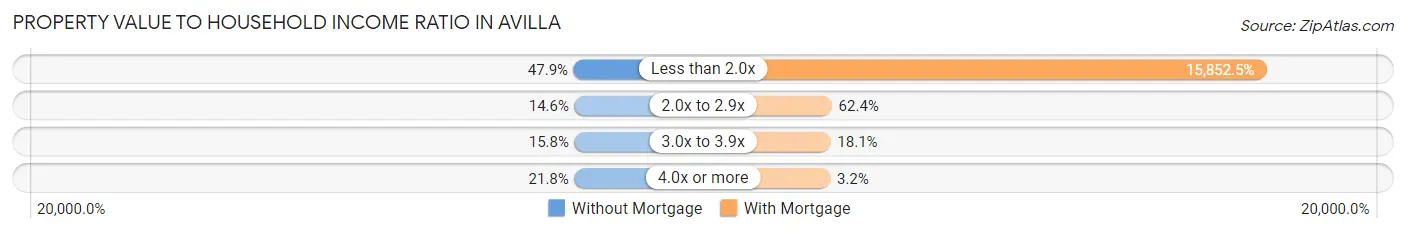
| Value-to-Income Ratio | Without Mortgage | With Mortgage |
| Less than 2.0x | 79 (47.9%) | 93,688 (15,852.4%) |
| 2.0x to 2.9x | 24 (14.5%) | 369 (62.4%) |
| 3.0x to 3.9x | 26 (15.8%) | 107 (18.1%) |
| 4.0x or more | 36 (21.8%) | 19 (3.2%) |
| Total | 165 (100.0%) | 591 (100.0%) |
Real Estate Taxes by Mortgage Status in Avilla
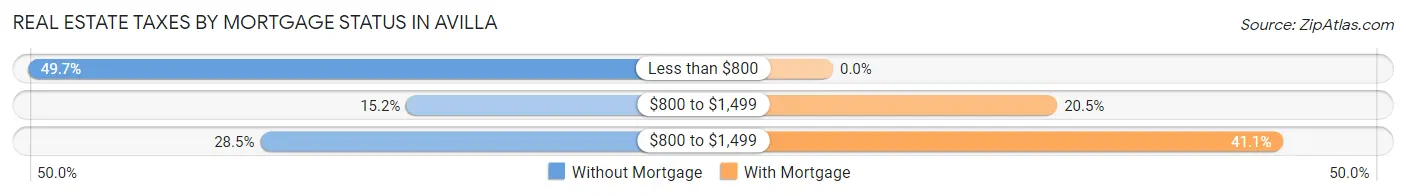
| Property Taxes | Without Mortgage | With Mortgage |
| Less than $800 | 82 (49.7%) | 0 (0.0%) |
| $800 to $1,499 | 25 (15.1%) | 121 (20.5%) |
| $800 to $1,499 | 47 (28.5%) | 243 (41.1%) |
| Total | 165 (100.0%) | 591 (100.0%) |
Health & Disability in Avilla
Health Insurance Coverage by Age in Avilla
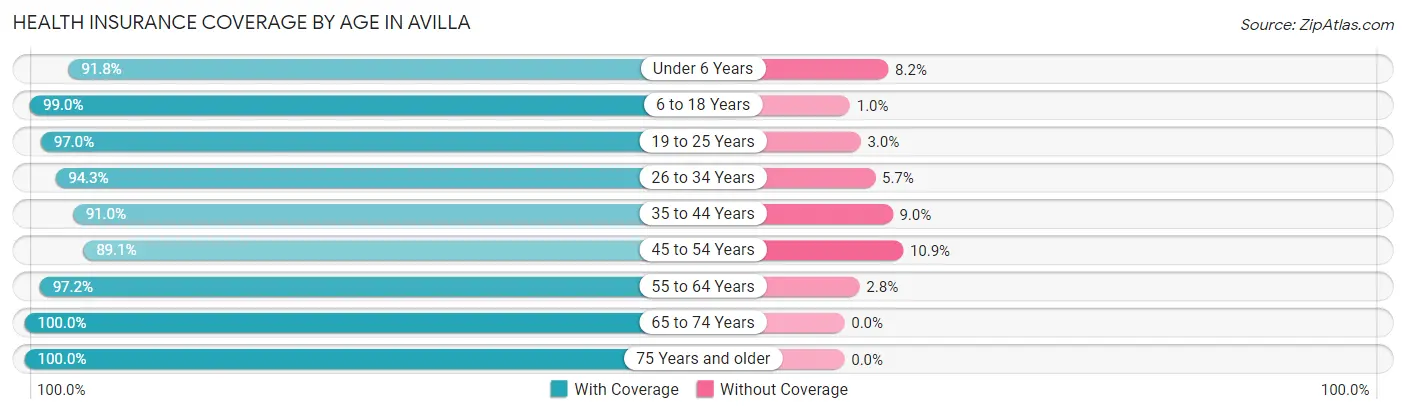
| Age Bracket | With Coverage | Without Coverage |
| Under 6 Years | 303 (91.8%) | 27 (8.2%) |
| 6 to 18 Years | 389 (99.0%) | 4 (1.0%) |
| 19 to 25 Years | 225 (97.0%) | 7 (3.0%) |
| 26 to 34 Years | 362 (94.3%) | 22 (5.7%) |
| 35 to 44 Years | 304 (91.0%) | 30 (9.0%) |
| 45 to 54 Years | 407 (89.1%) | 50 (10.9%) |
| 55 to 64 Years | 172 (97.2%) | 5 (2.8%) |
| 65 to 74 Years | 183 (100.0%) | 0 (0.0%) |
| 75 Years and older | 108 (100.0%) | 0 (0.0%) |
| Total | 2,453 (94.4%) | 145 (5.6%) |
Health Insurance Coverage by Citizenship Status in Avilla
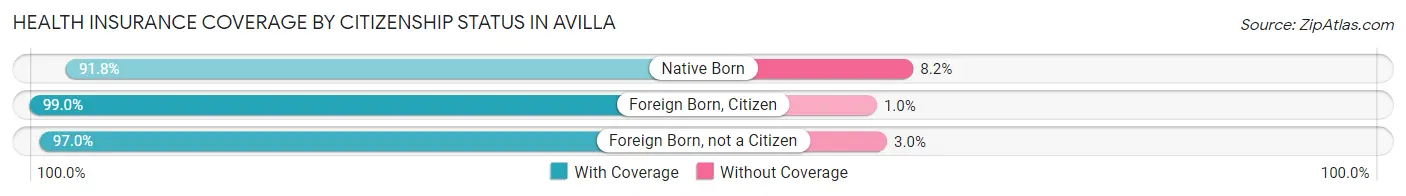
| Citizenship Status | With Coverage | Without Coverage |
| Native Born | 303 (91.8%) | 27 (8.2%) |
| Foreign Born, Citizen | 389 (99.0%) | 4 (1.0%) |
| Foreign Born, not a Citizen | 225 (97.0%) | 7 (3.0%) |
Health Insurance Coverage by Household Income in Avilla
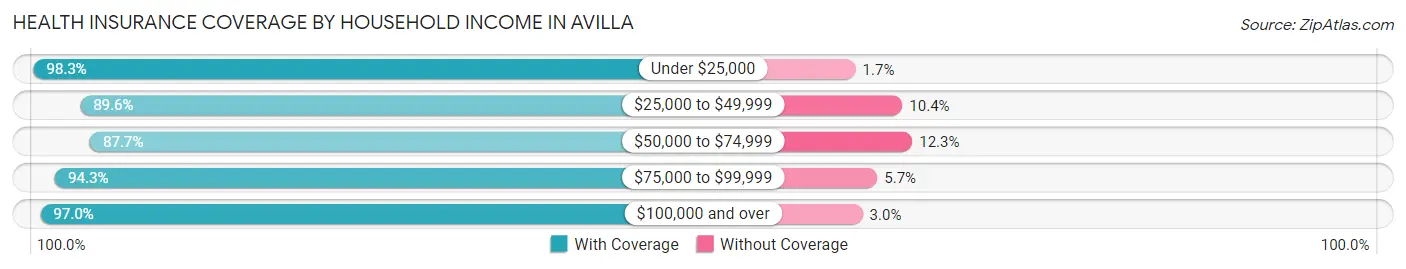
| Household Income | With Coverage | Without Coverage |
| Under $25,000 | 237 (98.3%) | 4 (1.7%) |
| $25,000 to $49,999 | 215 (89.6%) | 25 (10.4%) |
| $50,000 to $74,999 | 336 (87.7%) | 47 (12.3%) |
| $75,000 to $99,999 | 609 (94.3%) | 37 (5.7%) |
| $100,000 and over | 1,044 (97.0%) | 32 (3.0%) |
Public vs Private Health Insurance Coverage by Age in Avilla
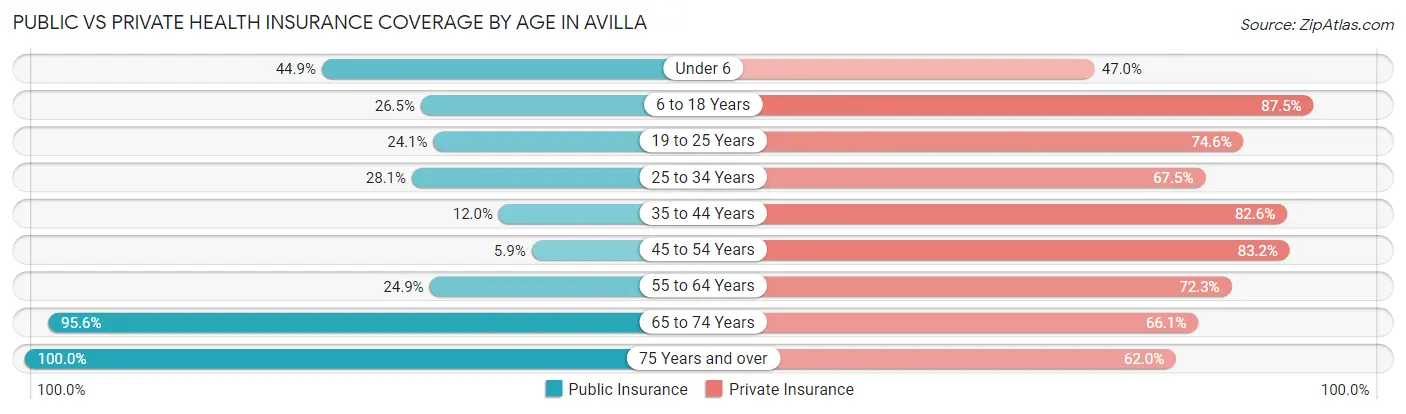
| Age Bracket | Public Insurance | Private Insurance |
| Under 6 | 148 (44.9%) | 155 (47.0%) |
| 6 to 18 Years | 104 (26.5%) | 344 (87.5%) |
| 19 to 25 Years | 56 (24.1%) | 173 (74.6%) |
| 25 to 34 Years | 108 (28.1%) | 259 (67.4%) |
| 35 to 44 Years | 40 (12.0%) | 276 (82.6%) |
| 45 to 54 Years | 27 (5.9%) | 380 (83.2%) |
| 55 to 64 Years | 44 (24.9%) | 128 (72.3%) |
| 65 to 74 Years | 175 (95.6%) | 121 (66.1%) |
| 75 Years and over | 108 (100.0%) | 67 (62.0%) |
| Total | 810 (31.2%) | 1,903 (73.3%) |
Disability Status by Sex by Age in Avilla
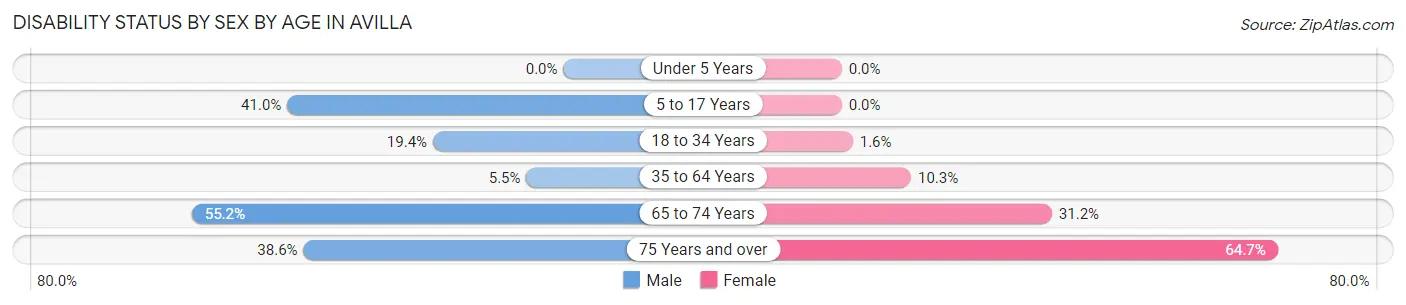
| Age Bracket | Male | Female |
| Under 5 Years | 0 (0.0%) | 0 (0.0%) |
| 5 to 17 Years | 89 (41.0%) | 0 (0.0%) |
| 18 to 34 Years | 68 (19.4%) | 5 (1.6%) |
| 35 to 64 Years | 27 (5.5%) | 49 (10.3%) |
| 65 to 74 Years | 32 (55.2%) | 39 (31.2%) |
| 75 Years and over | 22 (38.6%) | 33 (64.7%) |
Disability Class by Sex by Age in Avilla
Disability Class: Hearing Difficulty
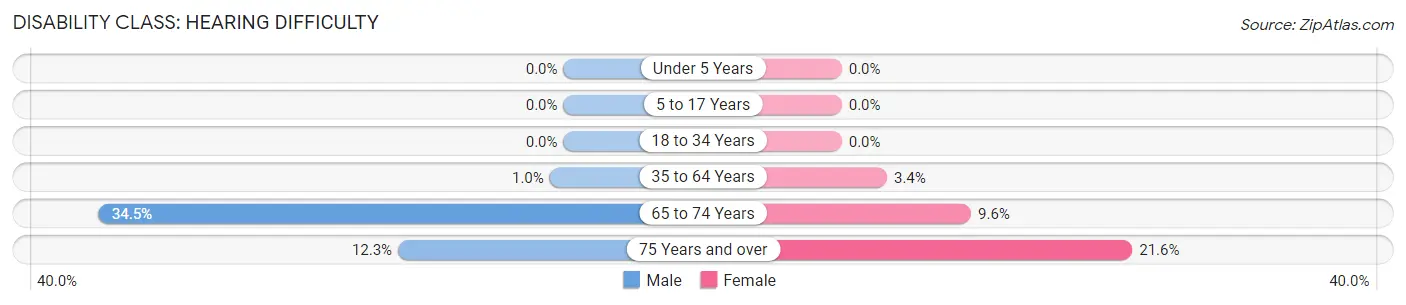
| Age Bracket | Male | Female |
| Under 5 Years | 0 (0.0%) | 0 (0.0%) |
| 5 to 17 Years | 0 (0.0%) | 0 (0.0%) |
| 18 to 34 Years | 0 (0.0%) | 0 (0.0%) |
| 35 to 64 Years | 5 (1.0%) | 16 (3.4%) |
| 65 to 74 Years | 20 (34.5%) | 12 (9.6%) |
| 75 Years and over | 7 (12.3%) | 11 (21.6%) |
Disability Class: Vision Difficulty
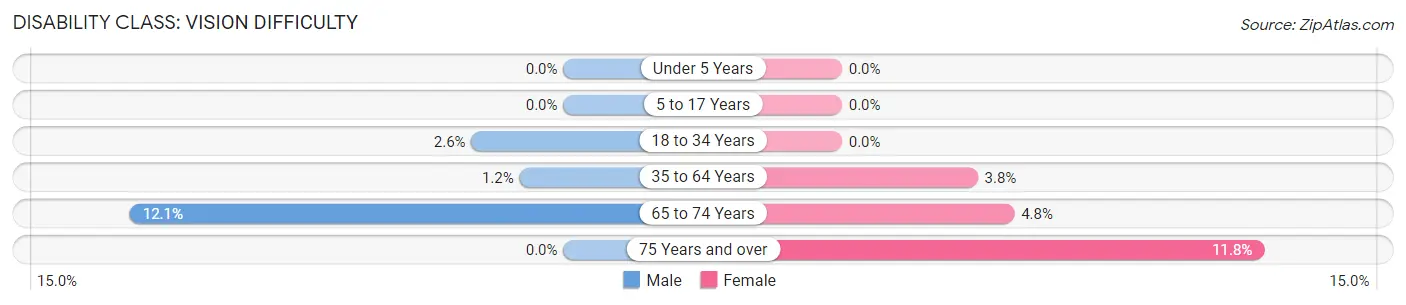
| Age Bracket | Male | Female |
| Under 5 Years | 0 (0.0%) | 0 (0.0%) |
| 5 to 17 Years | 0 (0.0%) | 0 (0.0%) |
| 18 to 34 Years | 9 (2.6%) | 0 (0.0%) |
| 35 to 64 Years | 6 (1.2%) | 18 (3.8%) |
| 65 to 74 Years | 7 (12.1%) | 6 (4.8%) |
| 75 Years and over | 0 (0.0%) | 6 (11.8%) |
Disability Class: Cognitive Difficulty
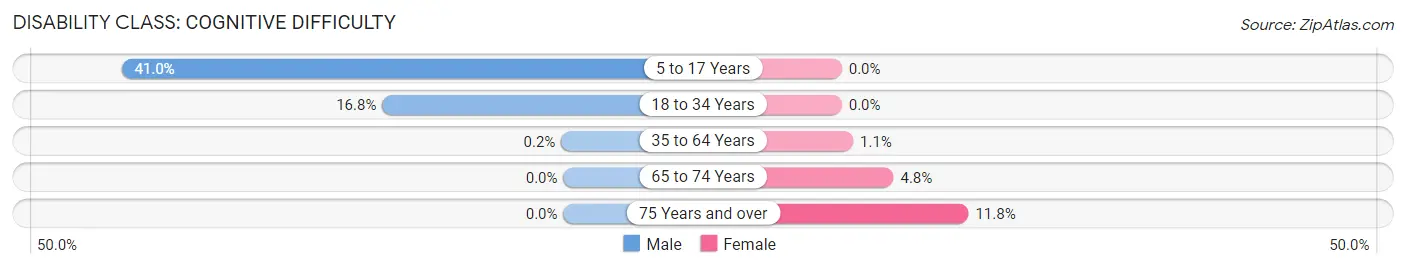
| Age Bracket | Male | Female |
| 5 to 17 Years | 89 (41.0%) | 0 (0.0%) |
| 18 to 34 Years | 59 (16.8%) | 0 (0.0%) |
| 35 to 64 Years | 1 (0.2%) | 5 (1.1%) |
| 65 to 74 Years | 0 (0.0%) | 6 (4.8%) |
| 75 Years and over | 0 (0.0%) | 6 (11.8%) |
Disability Class: Ambulatory Difficulty
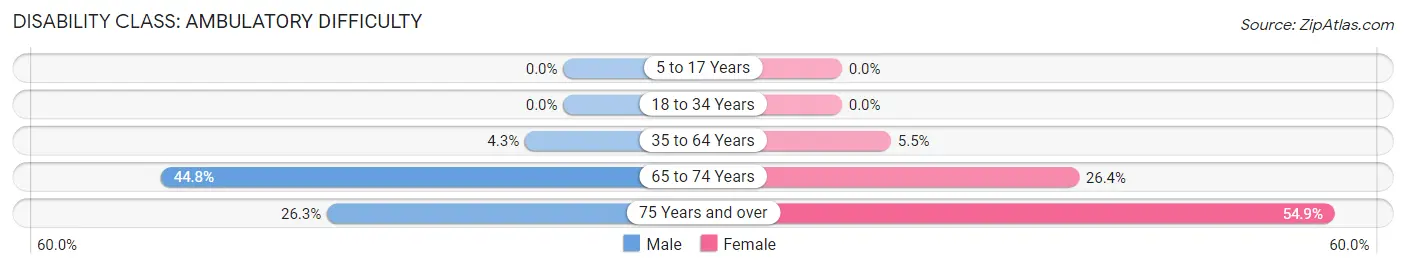
| Age Bracket | Male | Female |
| 5 to 17 Years | 0 (0.0%) | 0 (0.0%) |
| 18 to 34 Years | 0 (0.0%) | 0 (0.0%) |
| 35 to 64 Years | 21 (4.3%) | 26 (5.5%) |
| 65 to 74 Years | 26 (44.8%) | 33 (26.4%) |
| 75 Years and over | 15 (26.3%) | 28 (54.9%) |
Disability Class: Self-Care Difficulty
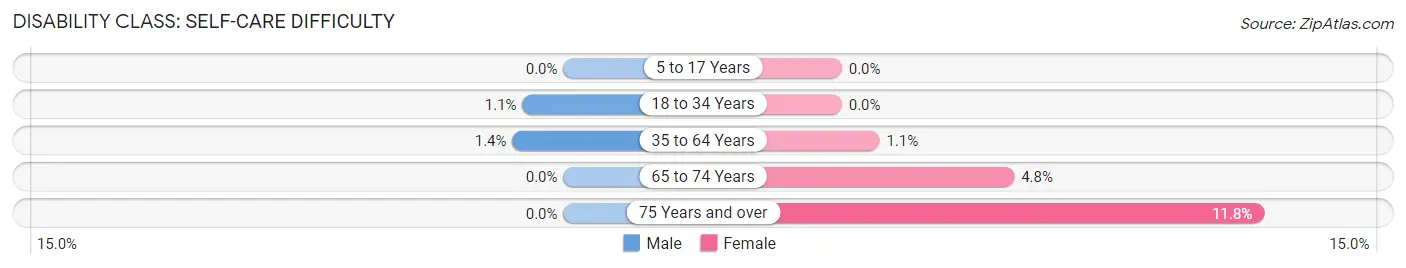
| Age Bracket | Male | Female |
| 5 to 17 Years | 0 (0.0%) | 0 (0.0%) |
| 18 to 34 Years | 4 (1.1%) | 0 (0.0%) |
| 35 to 64 Years | 7 (1.4%) | 5 (1.1%) |
| 65 to 74 Years | 0 (0.0%) | 6 (4.8%) |
| 75 Years and over | 0 (0.0%) | 6 (11.8%) |
Technology Access in Avilla
Computing Device Access in Avilla
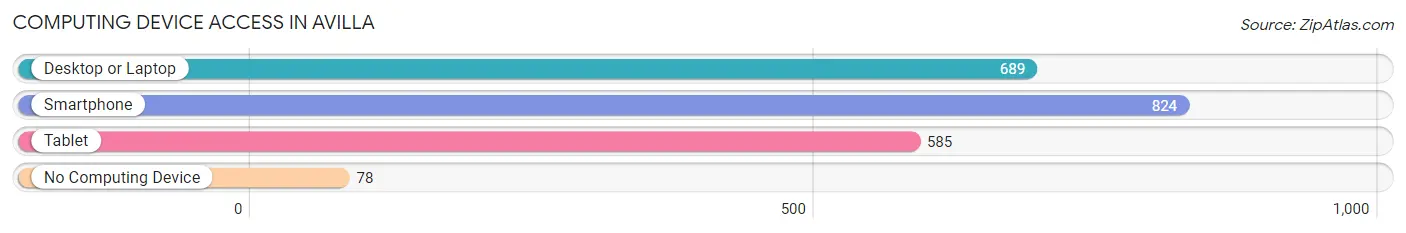
| Device Type | # Households | % Households |
| Desktop or Laptop | 689 | 71.2% |
| Smartphone | 824 | 85.1% |
| Tablet | 585 | 60.4% |
| No Computing Device | 78 | 8.1% |
| Total | 968 | 100.0% |
Internet Access in Avilla
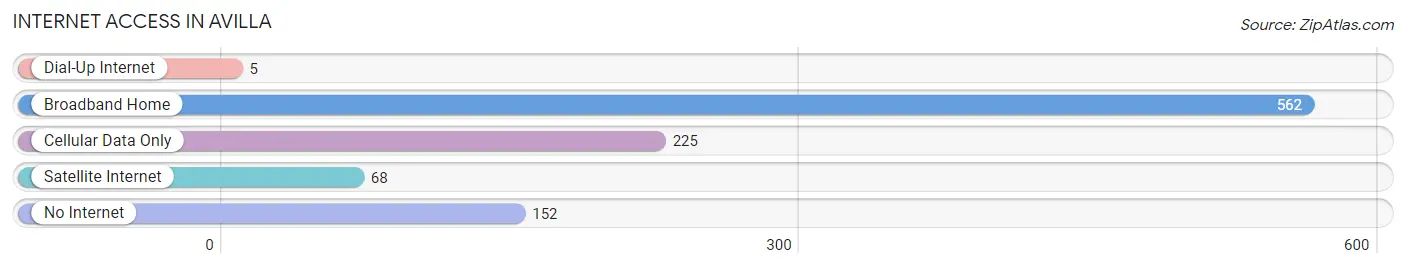
| Internet Type | # Households | % Households |
| Dial-Up Internet | 5 | 0.5% |
| Broadband Home | 562 | 58.1% |
| Cellular Data Only | 225 | 23.2% |
| Satellite Internet | 68 | 7.0% |
| No Internet | 152 | 15.7% |
| Total | 968 | 100.0% |
Avilla Summary
Avilla, Indiana is a small town located in Noble County, Indiana. It is situated in the northeastern corner of the state, just south of the Michigan border. The town was founded in 1837 and has a population of approximately 1,400 people.
Avilla is located in the heart of the Kankakee Valley, which is a region of rolling hills and farmland. The town is surrounded by a number of small lakes and rivers, including the Little Elkhart River, which runs through the center of town. The town is also home to a number of parks and recreational areas, including the Avilla Nature Preserve, which is a popular spot for bird watching and hiking.
Avilla has a rich history that dates back to its founding in 1837. The town was originally settled by a group of German immigrants who were looking for a place to call home. The town was named after the Avilla family, who were among the first settlers. The town grew slowly over the years, but it was not until the late 19th century that it began to experience significant growth.
Avilla's economy is largely based on agriculture and manufacturing. The town is home to a number of small businesses, including a number of farms and factories. The town is also home to a number of small retail stores, restaurants, and other businesses.
Avilla is served by a number of public schools, including Avilla Elementary School, Avilla Middle School, and Avilla High School. The town is also home to a number of private schools, including Avilla Christian Academy and Avilla Academy.
Avilla is a predominantly white town, with a population that is approximately 95% white. The town is also home to a small Hispanic population, as well as a small African American population. The median household income in Avilla is approximately $45,000, which is slightly lower than the national average.
Avilla is a small town with a rich history and a strong sense of community. The town is home to a number of parks and recreational areas, as well as a number of small businesses. The town is also home to a number of schools, both public and private. Avilla is a great place to live and work, and it is a great place to raise a family.
Common Questions
What is Per Capita Income in Avilla?
Per Capita income in Avilla is $32,870.
What is the Median Family Income in Avilla?
Median Family Income in Avilla is $83,929.
What is the Median Household income in Avilla?
Median Household Income in Avilla is $77,583.
What is Income or Wage Gap in Avilla?
Income or Wage Gap in Avilla is 34.3%.
Women in Avilla earn 65.7 cents for every dollar earned by a man.
What is Inequality or Gini Index in Avilla?
Inequality or Gini Index in Avilla is 0.36.
What is the Total Population of Avilla?
Total Population of Avilla is 2,702.
What is the Total Male Population of Avilla?
Total Male Population of Avilla is 1,291.
What is the Total Female Population of Avilla?
Total Female Population of Avilla is 1,411.
What is the Ratio of Males per 100 Females in Avilla?
There are 91.50 Males per 100 Females in Avilla.
What is the Ratio of Females per 100 Males in Avilla?
There are 109.30 Females per 100 Males in Avilla.
What is the Median Population Age in Avilla?
Median Population Age in Avilla is 35.9 Years.
What is the Average Family Size in Avilla
Average Family Size in Avilla is 3.2 People.
What is the Average Household Size in Avilla
Average Household Size in Avilla is 2.7 People.
How Large is the Labor Force in Avilla?
There are 1,385 People in the Labor Forcein in Avilla.
What is the Percentage of People in the Labor Force in Avilla?
66.9% of People are in the Labor Force in Avilla.
What is the Unemployment Rate in Avilla?
Unemployment Rate in Avilla is 2.6%.