Idaville, IN Map & Demographics
Idaville Map
Idaville Overview
$28,559
PER CAPITA INCOME
$56,042
AVG FAMILY INCOME
$46,304
AVG HOUSEHOLD INCOME
1.8%
WAGE / INCOME GAP [ % ]
98.2¢/ $1
WAGE / INCOME GAP [ $ ]
0.35
INEQUALITY / GINI INDEX
332
TOTAL POPULATION
147
MALE POPULATION
185
FEMALE POPULATION
79.46
MALES / 100 FEMALES
125.85
FEMALES / 100 MALES
51.1
MEDIAN AGE
2.5
AVG FAMILY SIZE
1.6
AVG HOUSEHOLD SIZE
165
LABOR FORCE [ PEOPLE ]
58.1%
PERCENT IN LABOR FORCE
Idaville Zip Codes
Idaville Area Codes
Income in Idaville
Income Overview in Idaville
Per Capita Income in Idaville is $28,559, while median incomes of families and households are $56,042 and $46,304 respectively.
| Characteristic | Number | Measure |
| Per Capita Income | 332 | $28,559 |
| Median Family Income | 83 | $56,042 |
| Mean Family Income | 83 | $58,563 |
| Median Household Income | 204 | $46,304 |
| Mean Household Income | 204 | $46,845 |
| Income Deficit | 83 | $0 |
| Wage / Income Gap (%) | 332 | 1.76% |
| Wage / Income Gap ($) | 332 | 98.24¢ per $1 |
| Gini / Inequality Index | 332 | 0.35 |
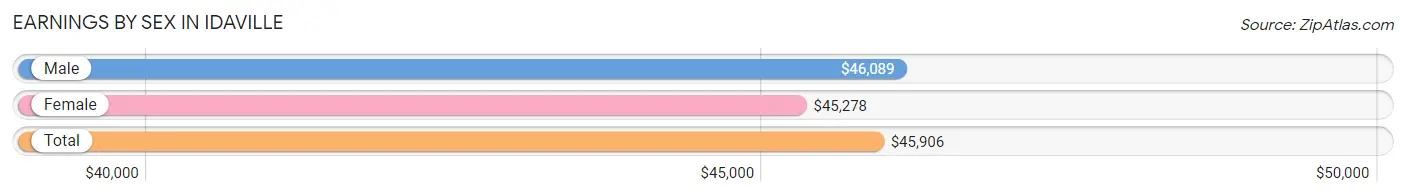
Earnings by Sex in Idaville
Average Earnings in Idaville are $45,906, $46,089 for men and $45,278 for women, a difference of 1.8%.
| Sex | Number | Average Earnings |
| Male | 111 (63.4%) | $46,089 |
| Female | 64 (36.6%) | $45,278 |
| Total | 175 (100.0%) | $45,906 |
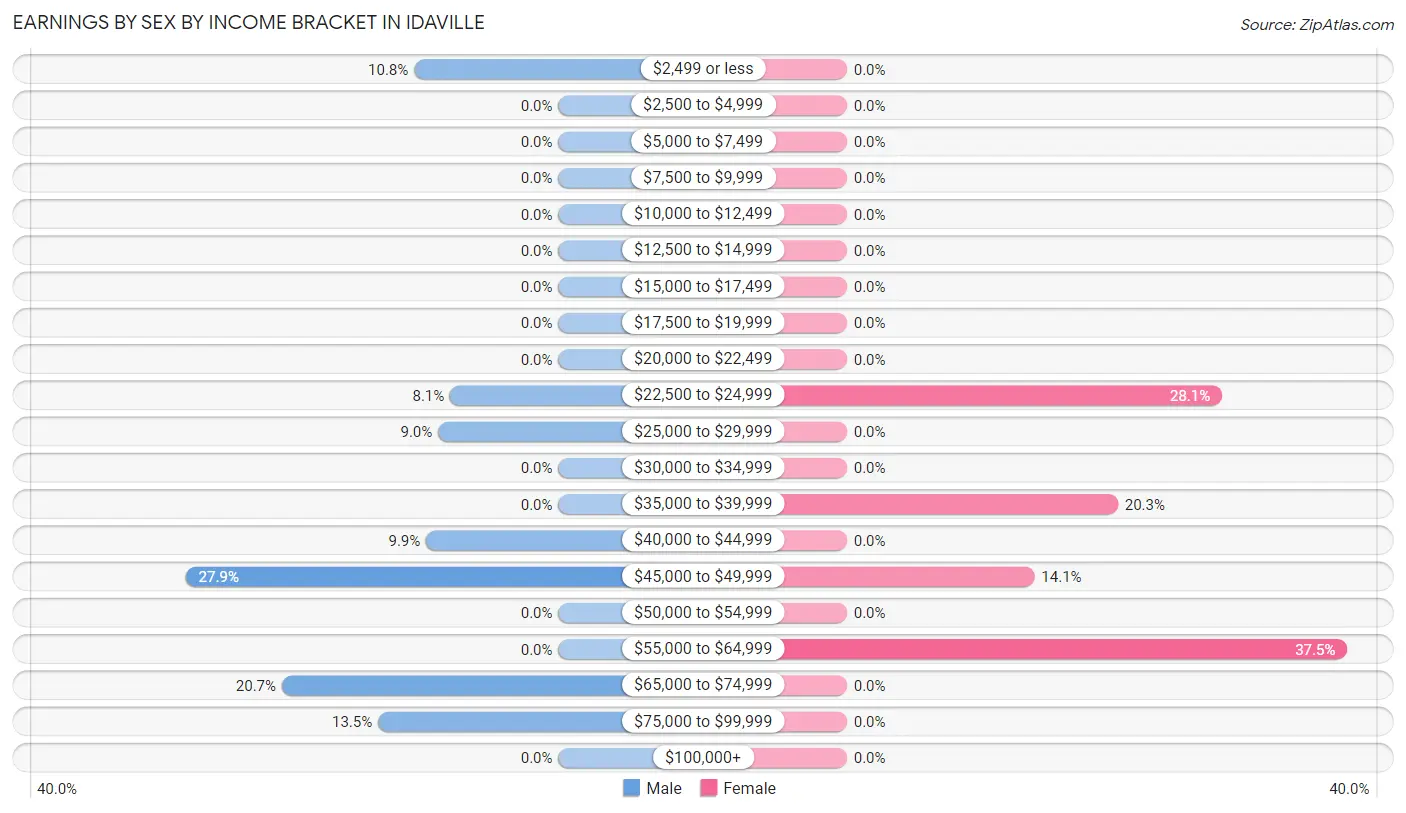
Earnings by Sex by Income Bracket in Idaville
The most common earnings brackets in Idaville are $45,000 to $49,999 for men (31 | 27.9%) and $55,000 to $64,999 for women (24 | 37.5%).
| Income | Male | Female |
| $2,499 or less | 12 (10.8%) | 0 (0.0%) |
| $2,500 to $4,999 | 0 (0.0%) | 0 (0.0%) |
| $5,000 to $7,499 | 0 (0.0%) | 0 (0.0%) |
| $7,500 to $9,999 | 0 (0.0%) | 0 (0.0%) |
| $10,000 to $12,499 | 0 (0.0%) | 0 (0.0%) |
| $12,500 to $14,999 | 0 (0.0%) | 0 (0.0%) |
| $15,000 to $17,499 | 0 (0.0%) | 0 (0.0%) |
| $17,500 to $19,999 | 0 (0.0%) | 0 (0.0%) |
| $20,000 to $22,499 | 0 (0.0%) | 0 (0.0%) |
| $22,500 to $24,999 | 9 (8.1%) | 18 (28.1%) |
| $25,000 to $29,999 | 10 (9.0%) | 0 (0.0%) |
| $30,000 to $34,999 | 0 (0.0%) | 0 (0.0%) |
| $35,000 to $39,999 | 0 (0.0%) | 13 (20.3%) |
| $40,000 to $44,999 | 11 (9.9%) | 0 (0.0%) |
| $45,000 to $49,999 | 31 (27.9%) | 9 (14.1%) |
| $50,000 to $54,999 | 0 (0.0%) | 0 (0.0%) |
| $55,000 to $64,999 | 0 (0.0%) | 24 (37.5%) |
| $65,000 to $74,999 | 23 (20.7%) | 0 (0.0%) |
| $75,000 to $99,999 | 15 (13.5%) | 0 (0.0%) |
| $100,000+ | 0 (0.0%) | 0 (0.0%) |
| Total | 111 (100.0%) | 64 (100.0%) |
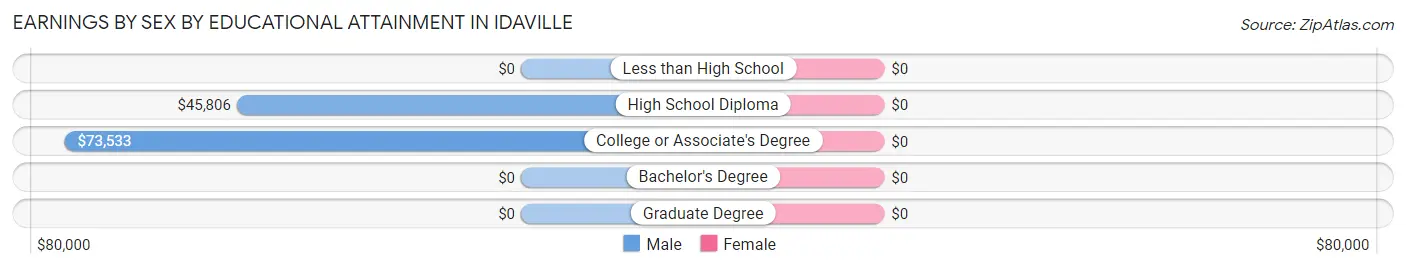
Earnings by Sex by Educational Attainment in Idaville
| Educational Attainment | Male Income | Female Income |
| Less than High School | - | - |
| High School Diploma | $45,806 | $0 |
| College or Associate's Degree | $73,533 | $0 |
| Bachelor's Degree | - | - |
| Graduate Degree | - | - |
| Total | $46,573 | $45,278 |
Family Income in Idaville
Family Income Brackets in Idaville
According to the Idaville family income data, there are 33 families falling into the $35,000 to $49,999 income range, which is the most common income bracket and makes up 39.8% of all families.
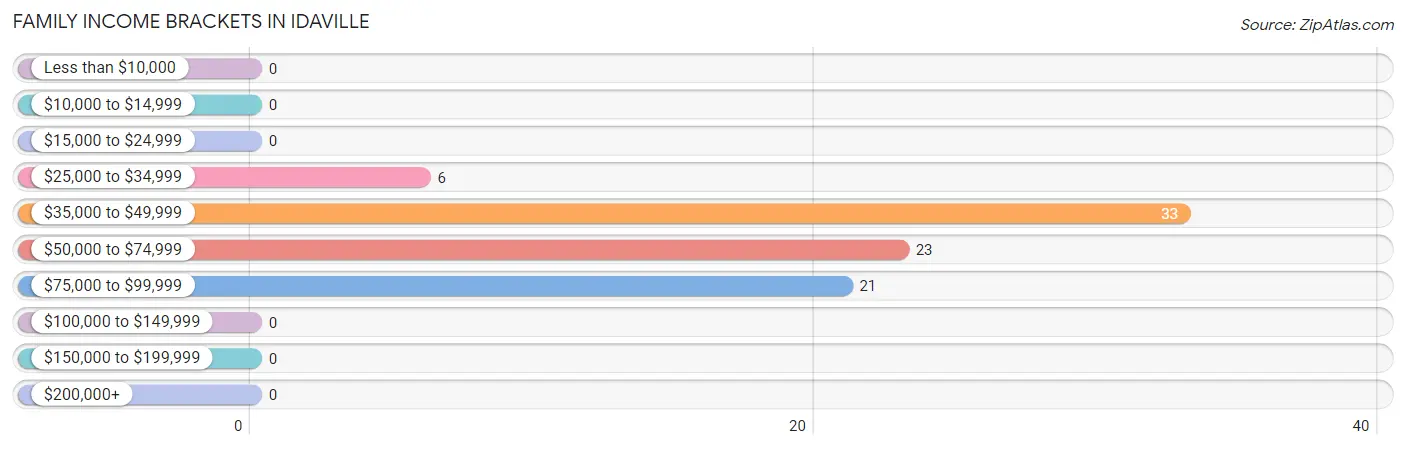
| Income Bracket | # Families | % Families |
| Less than $10,000 | 0 | 0.0% |
| $10,000 to $14,999 | 0 | 0.0% |
| $15,000 to $24,999 | 0 | 0.0% |
| $25,000 to $34,999 | 6 | 7.2% |
| $35,000 to $49,999 | 33 | 39.8% |
| $50,000 to $74,999 | 23 | 27.7% |
| $75,000 to $99,999 | 21 | 25.3% |
| $100,000 to $149,999 | 0 | 0.0% |
| $150,000 to $199,999 | 0 | 0.0% |
| $200,000+ | 0 | 0.0% |
Family Income by Famaliy Size in Idaville
2-person families (52 | 62.6%) account for the highest median family income in Idaville with $44,250 per family, while 2-person families (52 | 62.6%) have the highest median income of $22,125 per family member.
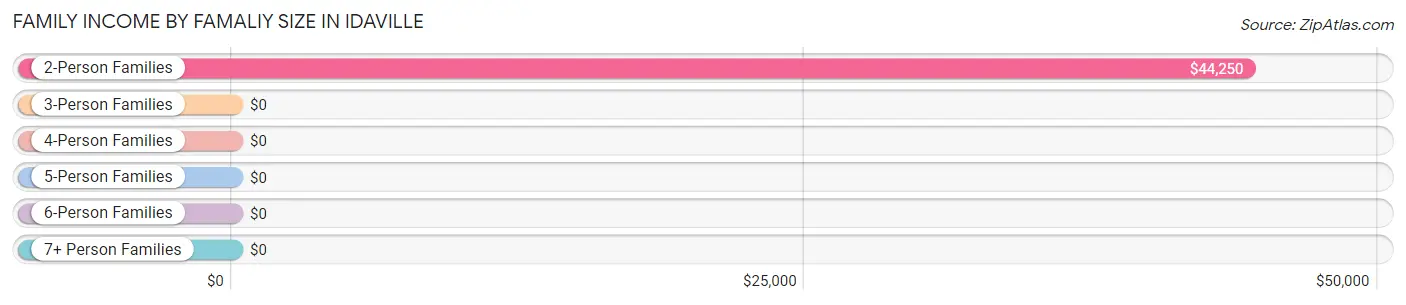
| Income Bracket | # Families | Median Income |
| 2-Person Families | 52 (62.6%) | $44,250 |
| 3-Person Families | 21 (25.3%) | $0 |
| 4-Person Families | 10 (12.0%) | $0 |
| 5-Person Families | 0 (0.0%) | $0 |
| 6-Person Families | 0 (0.0%) | $0 |
| 7+ Person Families | 0 (0.0%) | $0 |
| Total | 83 (100.0%) | $56,042 |
Family Income by Number of Earners in Idaville
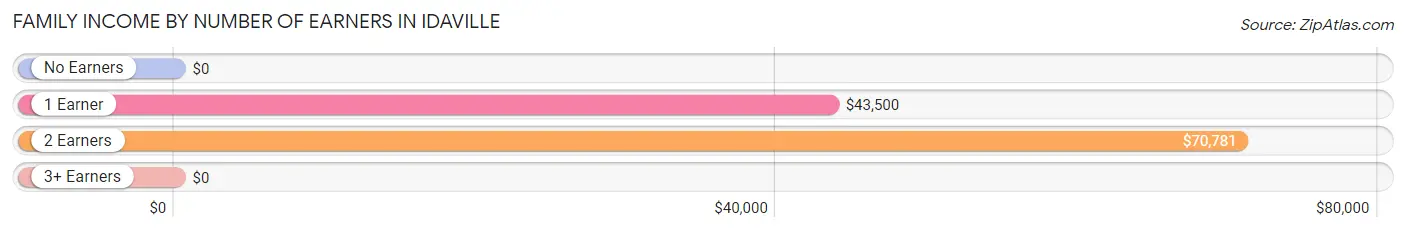
| Number of Earners | # Families | Median Income |
| No Earners | 6 (7.2%) | $0 |
| 1 Earner | 54 (65.1%) | $43,500 |
| 2 Earners | 23 (27.7%) | $70,781 |
| 3+ Earners | 0 (0.0%) | $0 |
| Total | 83 (100.0%) | $56,042 |
Household Income in Idaville
Household Income Brackets in Idaville
With 56 households falling in the category, the $35,000 to $49,999 income range is the most frequent in Idaville, accounting for 27.5% of all households.
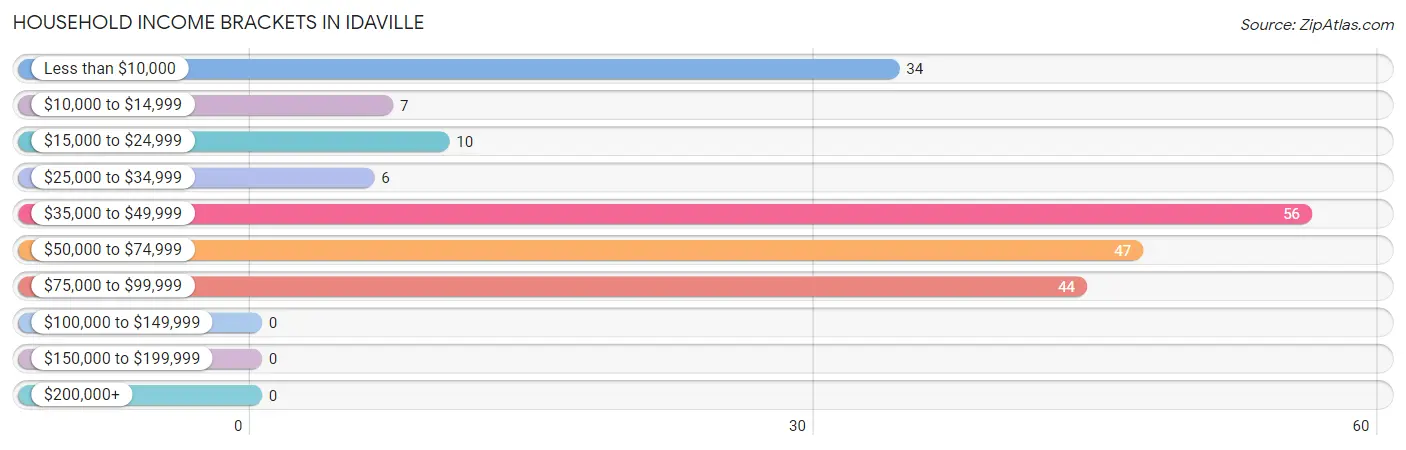
| Income Bracket | # Households | % Households |
| Less than $10,000 | 34 | 16.7% |
| $10,000 to $14,999 | 7 | 3.4% |
| $15,000 to $24,999 | 10 | 4.9% |
| $25,000 to $34,999 | 6 | 2.9% |
| $35,000 to $49,999 | 56 | 27.5% |
| $50,000 to $74,999 | 47 | 23.0% |
| $75,000 to $99,999 | 44 | 21.6% |
| $100,000 to $149,999 | 0 | 0.0% |
| $150,000 to $199,999 | 0 | 0.0% |
| $200,000+ | 0 | 0.0% |
Household Income by Householder Age in Idaville
The median household income in Idaville is $46,304, with the highest median household income of $62,656 found in the 45 to 64 years age bracket for the primary householder. A total of 137 households (67.2%) fall into this category.
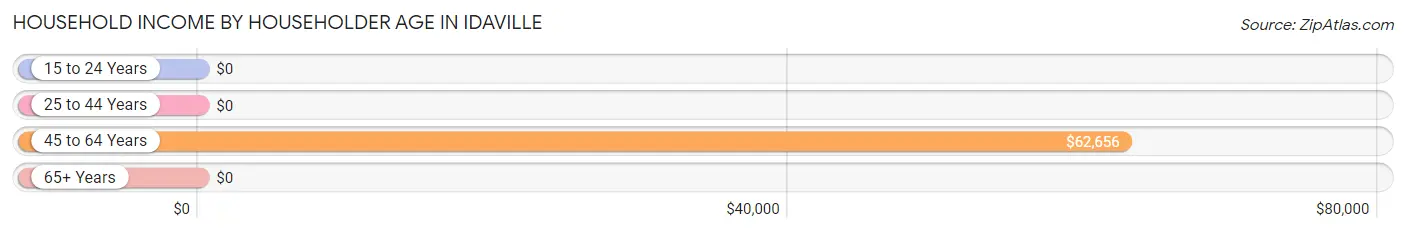
| Income Bracket | # Households | Median Income |
| 15 to 24 Years | 0 (0.0%) | $0 |
| 25 to 44 Years | 33 (16.2%) | $0 |
| 45 to 64 Years | 137 (67.2%) | $62,656 |
| 65+ Years | 34 (16.7%) | $0 |
| Total | 204 (100.0%) | $46,304 |
Poverty in Idaville
Income Below Poverty by Sex and Age in Idaville
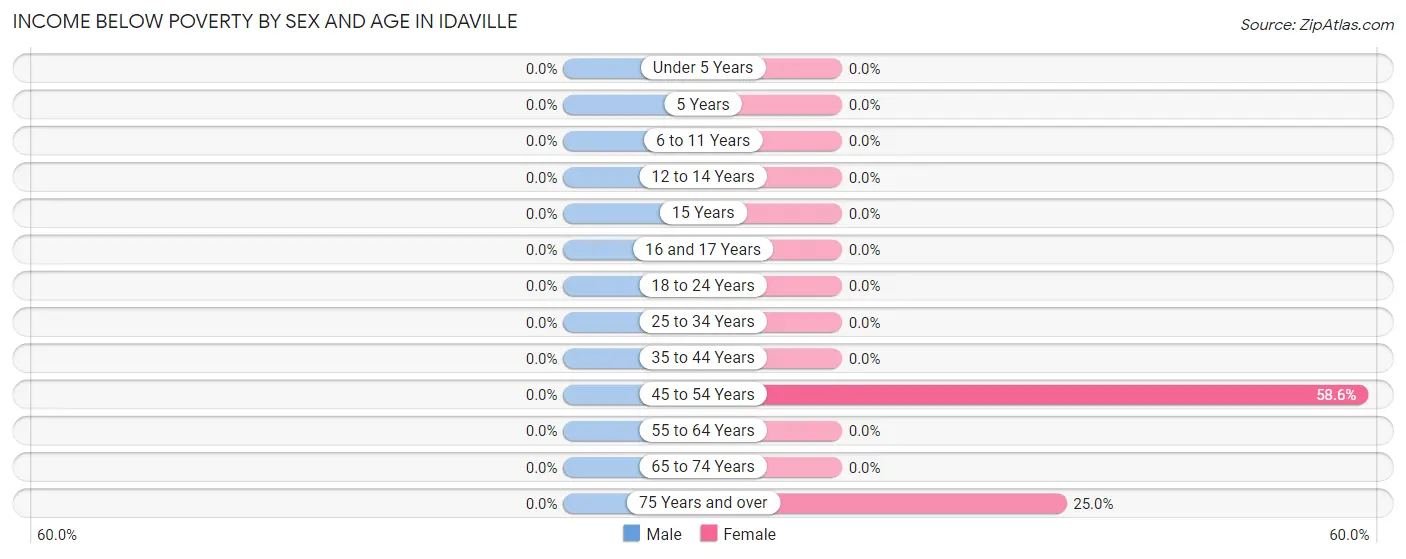
| Age Bracket | Male | Female |
| Under 5 Years | 0 (0.0%) | 0 (0.0%) |
| 5 Years | 0 (0.0%) | 0 (0.0%) |
| 6 to 11 Years | 0 (0.0%) | 0 (0.0%) |
| 12 to 14 Years | 0 (0.0%) | 0 (0.0%) |
| 15 Years | 0 (0.0%) | 0 (0.0%) |
| 16 and 17 Years | 0 (0.0%) | 0 (0.0%) |
| 18 to 24 Years | 0 (0.0%) | 0 (0.0%) |
| 25 to 34 Years | 0 (0.0%) | 0 (0.0%) |
| 35 to 44 Years | 0 (0.0%) | 0 (0.0%) |
| 45 to 54 Years | 0 (0.0%) | 34 (58.6%) |
| 55 to 64 Years | 0 (0.0%) | 0 (0.0%) |
| 65 to 74 Years | 0 (0.0%) | 0 (0.0%) |
| 75 Years and over | 0 (0.0%) | 7 (25.0%) |
| Total | 0 (0.0%) | 41 (22.2%) |
Income Above Poverty by Sex and Age in Idaville
According to the poverty statistics in Idaville, males aged 5 years and females aged under 5 years are the age groups that are most secure financially, with 100.0% of males and 100.0% of females in these age groups living above the poverty line.
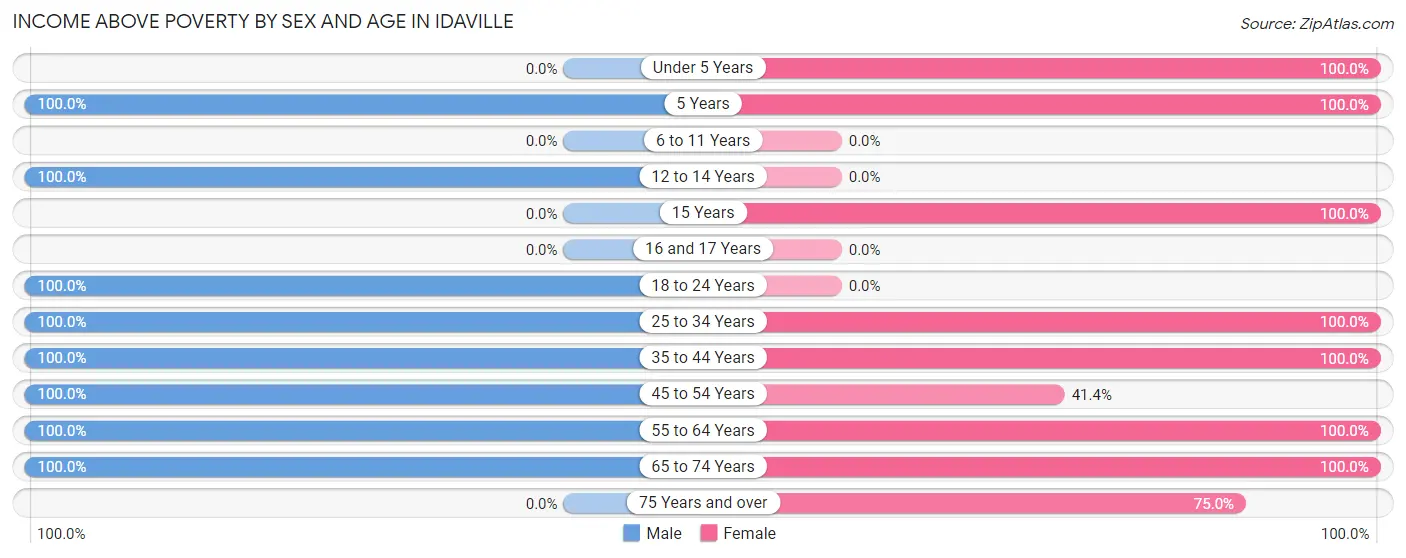
| Age Bracket | Male | Female |
| Under 5 Years | 0 (0.0%) | 8 (100.0%) |
| 5 Years | 9 (100.0%) | 7 (100.0%) |
| 6 to 11 Years | 0 (0.0%) | 0 (0.0%) |
| 12 to 14 Years | 10 (100.0%) | 0 (0.0%) |
| 15 Years | 0 (0.0%) | 14 (100.0%) |
| 16 and 17 Years | 0 (0.0%) | 0 (0.0%) |
| 18 to 24 Years | 12 (100.0%) | 0 (0.0%) |
| 25 to 34 Years | 9 (100.0%) | 10 (100.0%) |
| 35 to 44 Years | 16 (100.0%) | 13 (100.0%) |
| 45 to 54 Years | 22 (100.0%) | 24 (41.4%) |
| 55 to 64 Years | 63 (100.0%) | 41 (100.0%) |
| 65 to 74 Years | 6 (100.0%) | 6 (100.0%) |
| 75 Years and over | 0 (0.0%) | 21 (75.0%) |
| Total | 147 (100.0%) | 144 (77.8%) |
Income Below Poverty Among Married-Couple Families in Idaville
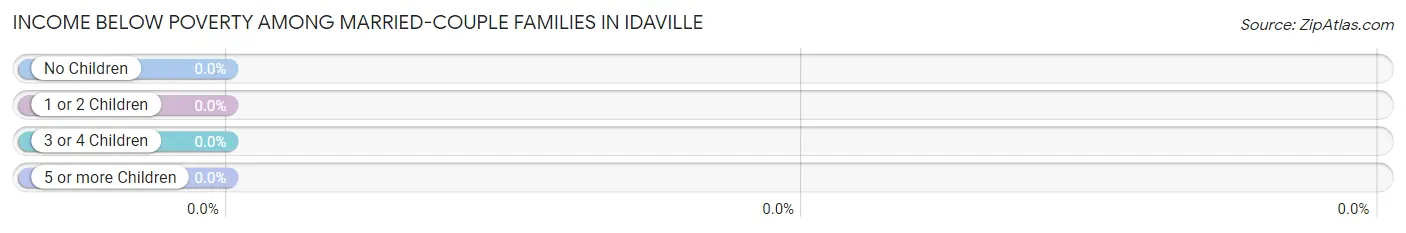
| Children | Above Poverty | Below Poverty |
| No Children | 39 (100.0%) | 0 (0.0%) |
| 1 or 2 Children | 10 (100.0%) | 0 (0.0%) |
| 3 or 4 Children | 0 (0.0%) | 0 (0.0%) |
| 5 or more Children | 0 (0.0%) | 0 (0.0%) |
| Total | 49 (100.0%) | 0 (0.0%) |
Income Below Poverty Among Single-Parent Households in Idaville
| Children | Single Father | Single Mother |
| No Children | 0 (0.0%) | 0 (0.0%) |
| 1 or 2 Children | 0 (0.0%) | 0 (0.0%) |
| 3 or 4 Children | 0 (0.0%) | 0 (0.0%) |
| 5 or more Children | 0 (0.0%) | 0 (0.0%) |
| Total | 0 (0.0%) | 0 (0.0%) |
Income Below Poverty Among Married-Couple vs Single-Parent Households in Idaville
| Children | Married-Couple Families | Single-Parent Households |
| No Children | 0 (0.0%) | 0 (0.0%) |
| 1 or 2 Children | 0 (0.0%) | 0 (0.0%) |
| 3 or 4 Children | 0 (0.0%) | 0 (0.0%) |
| 5 or more Children | 0 (0.0%) | 0 (0.0%) |
| Total | 0 (0.0%) | 0 (0.0%) |
Race in Idaville
The most populous races in Idaville are , and White / Caucasian (332 | 100.0%).
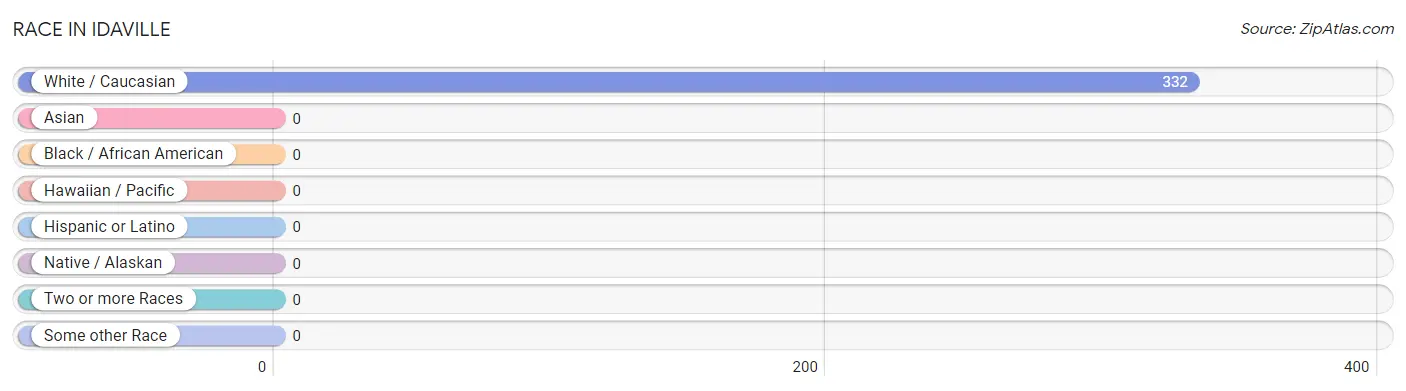
| Race | # Population | % Population |
| Asian | 0 | 0.0% |
| Black / African American | 0 | 0.0% |
| Hawaiian / Pacific | 0 | 0.0% |
| Hispanic or Latino | 0 | 0.0% |
| Native / Alaskan | 0 | 0.0% |
| White / Caucasian | 332 | 100.0% |
| Two or more Races | 0 | 0.0% |
| Some other Race | 0 | 0.0% |
| Total | 332 | 100.0% |
Ancestry in Idaville
The most populous ancestries reported in Idaville are American (92 | 27.7%), German (55 | 16.6%), Scottish (34 | 10.2%), Italian (24 | 7.2%), and English (16 | 4.8%), together accounting for 66.6% of all Idaville residents.
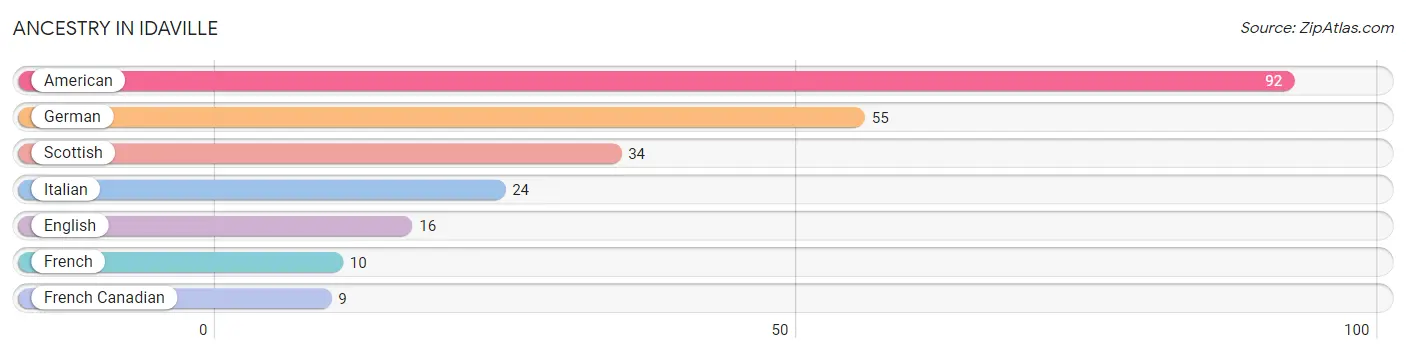
| Ancestry | # Population | % Population |
| American | 92 | 27.7% |
| English | 16 | 4.8% |
| French | 10 | 3.0% |
| French Canadian | 9 | 2.7% |
| German | 55 | 16.6% |
| Italian | 24 | 7.2% |
| Scottish | 34 | 10.2% | View All 7 Rows |
Immigrants in Idaville

| Immigration Origin | # Population | % Population | View All 0 Rows |
Sex and Age in Idaville
Sex and Age in Idaville
The most populous age groups in Idaville are 55 to 59 Years (40 | 27.2%) for men and 50 to 54 Years (49 | 26.5%) for women.
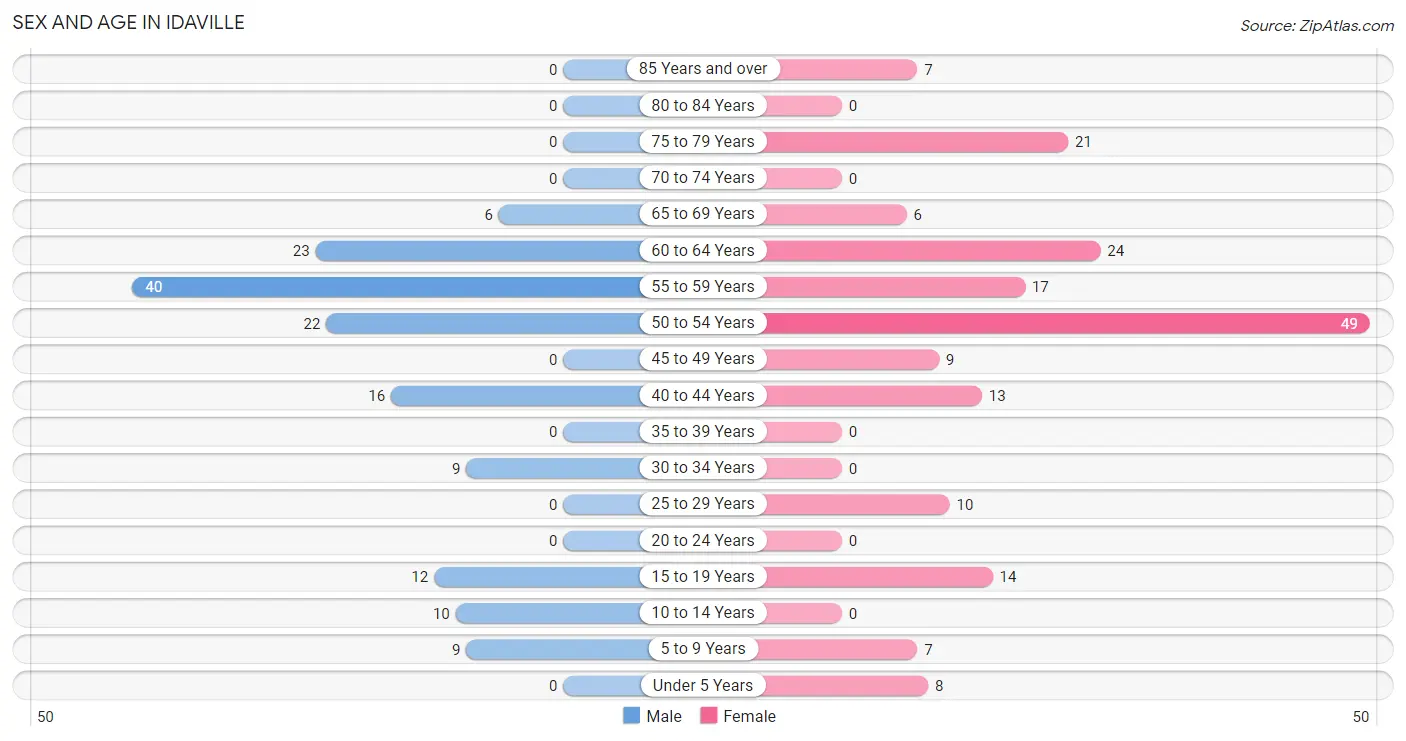
| Age Bracket | Male | Female |
| Under 5 Years | 0 (0.0%) | 8 (4.3%) |
| 5 to 9 Years | 9 (6.1%) | 7 (3.8%) |
| 10 to 14 Years | 10 (6.8%) | 0 (0.0%) |
| 15 to 19 Years | 12 (8.2%) | 14 (7.6%) |
| 20 to 24 Years | 0 (0.0%) | 0 (0.0%) |
| 25 to 29 Years | 0 (0.0%) | 10 (5.4%) |
| 30 to 34 Years | 9 (6.1%) | 0 (0.0%) |
| 35 to 39 Years | 0 (0.0%) | 0 (0.0%) |
| 40 to 44 Years | 16 (10.9%) | 13 (7.0%) |
| 45 to 49 Years | 0 (0.0%) | 9 (4.9%) |
| 50 to 54 Years | 22 (15.0%) | 49 (26.5%) |
| 55 to 59 Years | 40 (27.2%) | 17 (9.2%) |
| 60 to 64 Years | 23 (15.7%) | 24 (13.0%) |
| 65 to 69 Years | 6 (4.1%) | 6 (3.2%) |
| 70 to 74 Years | 0 (0.0%) | 0 (0.0%) |
| 75 to 79 Years | 0 (0.0%) | 21 (11.4%) |
| 80 to 84 Years | 0 (0.0%) | 0 (0.0%) |
| 85 Years and over | 0 (0.0%) | 7 (3.8%) |
| Total | 147 (100.0%) | 185 (100.0%) |
Families and Households in Idaville
Median Family Size in Idaville
The median family size in Idaville is 2.54 persons per family, with single male/father families (10 | 12.0%) accounting for the largest median family size of 3.4 persons per family. On the other hand, single female/mother families (24 | 28.9%) represent the smallest median family size with 1.96 persons per family.
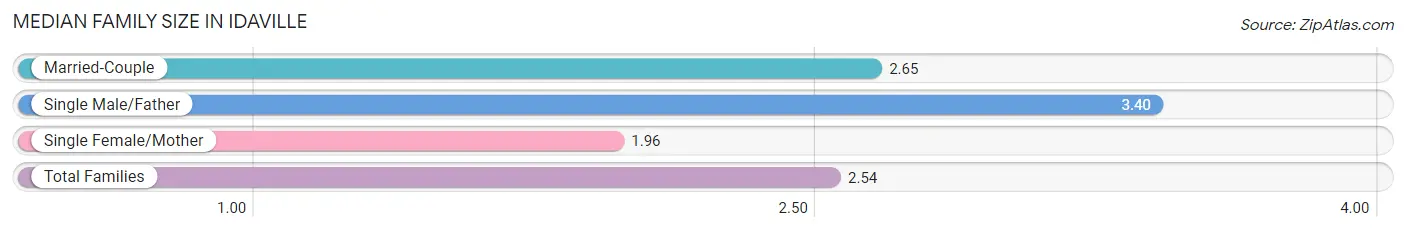
| Family Type | # Families | Family Size |
| Married-Couple | 49 (59.0%) | 2.65 |
| Single Male/Father | 10 (12.0%) | 3.40 |
| Single Female/Mother | 24 (28.9%) | 1.96 |
| Total Families | 83 (100.0%) | 2.54 |
Median Household Size in Idaville
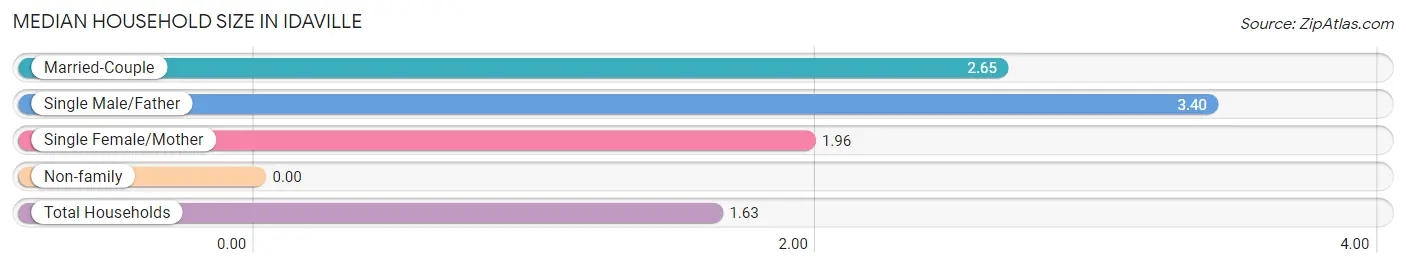
| Household Type | # Households | Household Size |
| Married-Couple | 49 (24.0%) | 2.65 |
| Single Male/Father | 10 (4.9%) | 3.40 |
| Single Female/Mother | 24 (11.8%) | 1.96 |
| Non-family | 121 (59.3%) | - |
| Total Households | 204 (100.0%) | 1.63 |
Household Size by Marriage Status in Idaville
Out of a total of 204 households in Idaville, 83 (40.7%) are family households, while 121 (59.3%) are nonfamily households. The most numerous type of family households are 2-person households, comprising 52, and the most common type of nonfamily households are 1-person households, comprising 121.
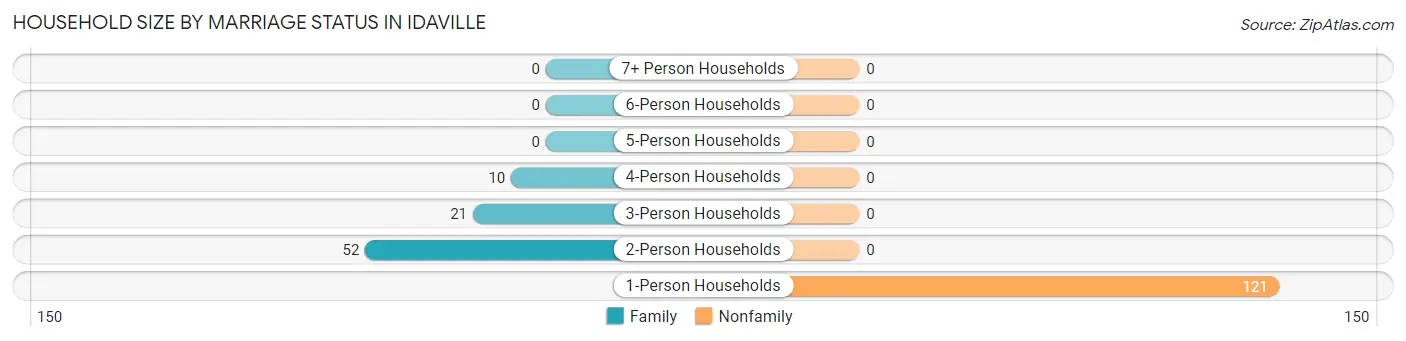
| Household Size | Family Households | Nonfamily Households |
| 1-Person Households | - | 121 (59.3%) |
| 2-Person Households | 52 (25.5%) | 0 (0.0%) |
| 3-Person Households | 21 (10.3%) | 0 (0.0%) |
| 4-Person Households | 10 (4.9%) | 0 (0.0%) |
| 5-Person Households | 0 (0.0%) | 0 (0.0%) |
| 6-Person Households | 0 (0.0%) | 0 (0.0%) |
| 7+ Person Households | 0 (0.0%) | 0 (0.0%) |
| Total | 83 (40.7%) | 121 (59.3%) |
Female Fertility in Idaville
Fertility by Age in Idaville
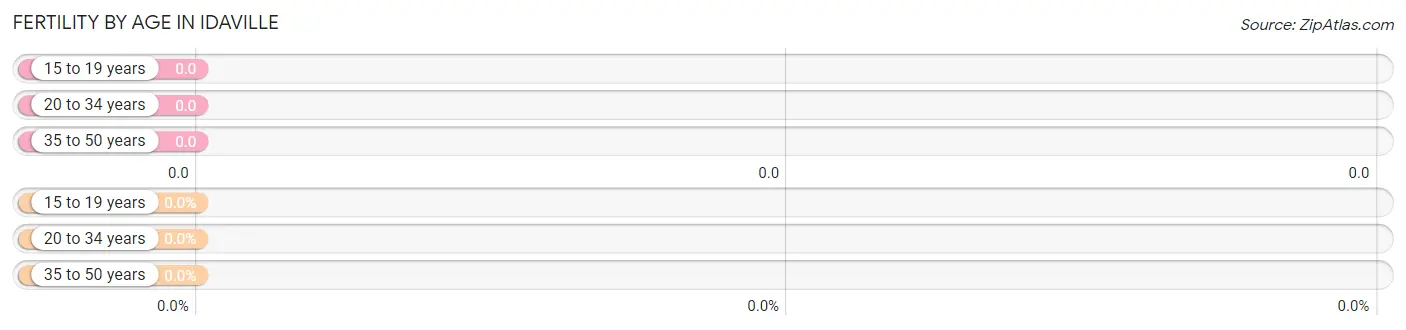
| Age Bracket | Women with Births | Births / 1,000 Women |
| 15 to 19 years | 0 (0.0%) | 0.0 |
| 20 to 34 years | 0 (0.0%) | 0.0 |
| 35 to 50 years | 0 (0.0%) | 0.0 |
| Total | 0 (0.0%) | 0.0 |
Fertility by Age by Marriage Status in Idaville
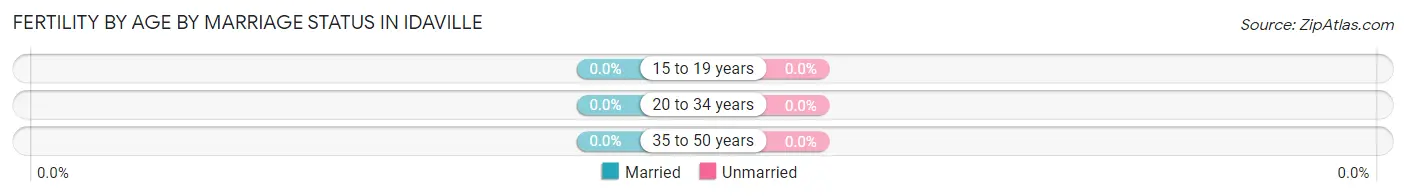
| Age Bracket | Married | Unmarried |
| 15 to 19 years | 0 (0.0%) | 0 (0.0%) |
| 20 to 34 years | 0 (0.0%) | 0 (0.0%) |
| 35 to 50 years | 0 (0.0%) | 0 (0.0%) |
| Total | 0 (0.0%) | 0 (0.0%) |
Fertility by Education in Idaville
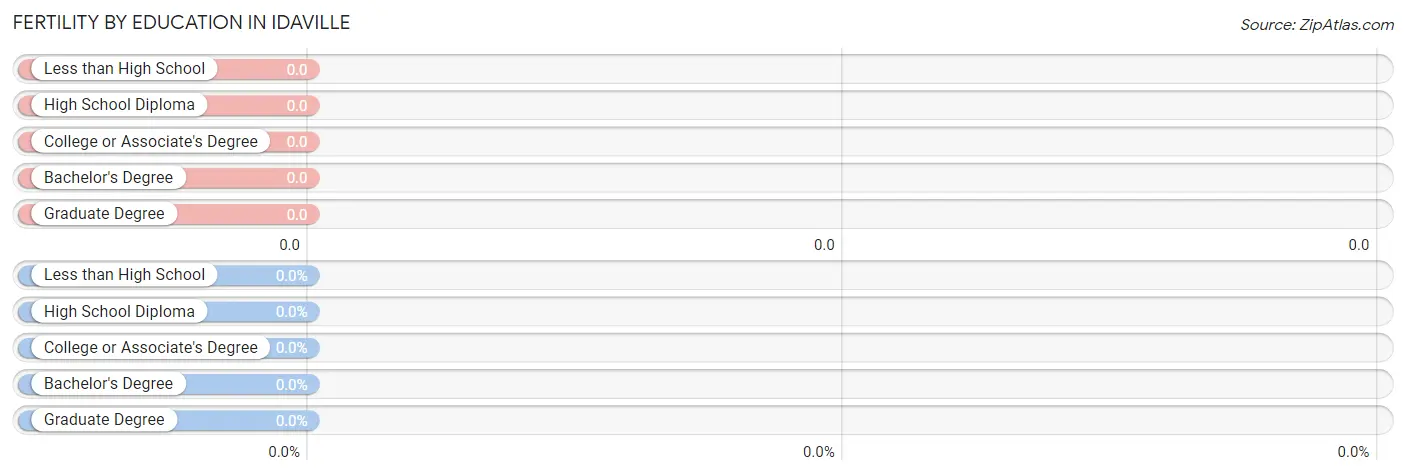
| Educational Attainment | Women with Births | Births / 1,000 Women |
| Less than High School | 0 (0.0%) | 0.0 |
| High School Diploma | 0 (0.0%) | 0.0 |
| College or Associate's Degree | 0 (0.0%) | 0.0 |
| Bachelor's Degree | 0 (0.0%) | 0.0 |
| Graduate Degree | 0 (0.0%) | 0.0 |
| Total | 0 (0.0%) | 0.0 |
Fertility by Education by Marriage Status in Idaville
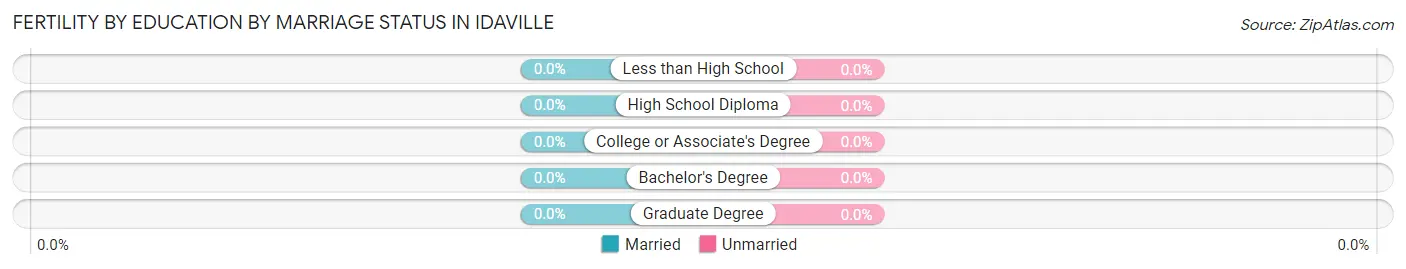
| Educational Attainment | Married | Unmarried |
| Less than High School | 0 (0.0%) | 0 (0.0%) |
| High School Diploma | 0 (0.0%) | 0 (0.0%) |
| College or Associate's Degree | 0 (0.0%) | 0 (0.0%) |
| Bachelor's Degree | 0 (0.0%) | 0 (0.0%) |
| Graduate Degree | 0 (0.0%) | 0 (0.0%) |
| Total | 0 (0.0%) | 0 (0.0%) |
Employment Characteristics in Idaville
Employment by Class of Employer in Idaville
Among the 165 employed individuals in Idaville, private company employees (104 | 63.0%), local government employees (37 | 22.4%), and state government employees (24 | 14.5%) make up the most common classes of employment.
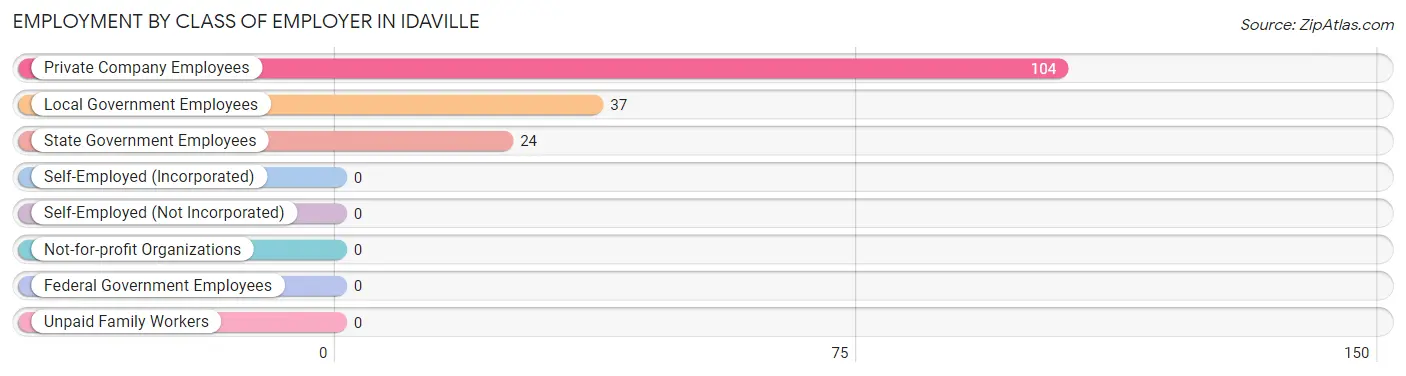
| Employer Class | # Employees | % Employees |
| Private Company Employees | 104 | 63.0% |
| Self-Employed (Incorporated) | 0 | 0.0% |
| Self-Employed (Not Incorporated) | 0 | 0.0% |
| Not-for-profit Organizations | 0 | 0.0% |
| Local Government Employees | 37 | 22.4% |
| State Government Employees | 24 | 14.5% |
| Federal Government Employees | 0 | 0.0% |
| Unpaid Family Workers | 0 | 0.0% |
| Total | 165 | 100.0% |
Employment Status by Age in Idaville
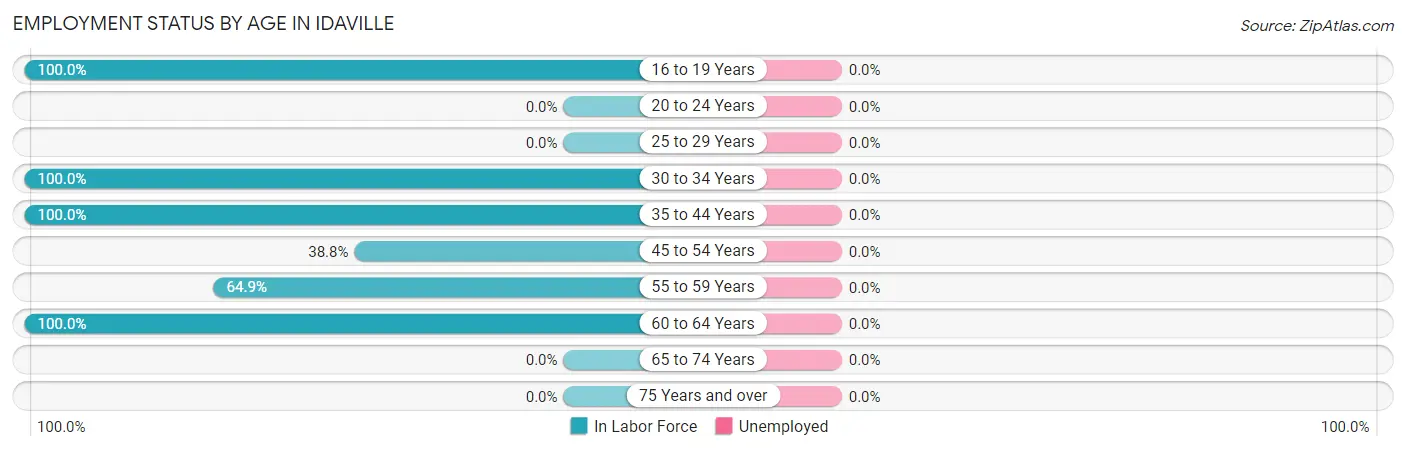
| Age Bracket | In Labor Force | Unemployed |
| 16 to 19 Years | 12 (100.0%) | 0 (0.0%) |
| 20 to 24 Years | 0 (0.0%) | 0 (0.0%) |
| 25 to 29 Years | 0 (0.0%) | 0 (0.0%) |
| 30 to 34 Years | 9 (100.0%) | 0 (0.0%) |
| 35 to 44 Years | 29 (100.0%) | 0 (0.0%) |
| 45 to 54 Years | 31 (38.8%) | 0 (0.0%) |
| 55 to 59 Years | 37 (64.9%) | 0 (0.0%) |
| 60 to 64 Years | 47 (100.0%) | 0 (0.0%) |
| 65 to 74 Years | 0 (0.0%) | 0 (0.0%) |
| 75 Years and over | 0 (0.0%) | 0 (0.0%) |
| Total | 165 (58.1%) | 0 (0.0%) |
Employment Status by Educational Attainment in Idaville
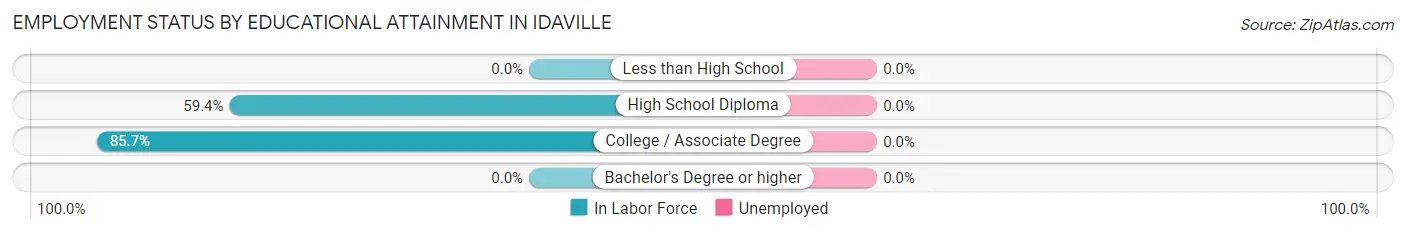
| Educational Attainment | In Labor Force | Unemployed |
| Less than High School | 0 (0.0%) | 0 (0.0%) |
| High School Diploma | 63 (59.4%) | 0 (0.0%) |
| College / Associate Degree | 90 (85.7%) | 0 (0.0%) |
| Bachelor's Degree or higher | 0 (0.0%) | 0 (0.0%) |
| Total | 153 (65.9%) | 0 (0.0%) |
Employment Occupations by Sex in Idaville
Management, Business, Science and Arts Occupations
The most common Management, Business, Science and Arts occupations in Idaville are Computers, Engineering & Science (12 | 7.3%), Life, Physical & Social Science (12 | 7.3%), Community & Social Service (6 | 3.6%), Arts, Media & Entertainment (6 | 3.6%), and Management (5 | 3.0%).
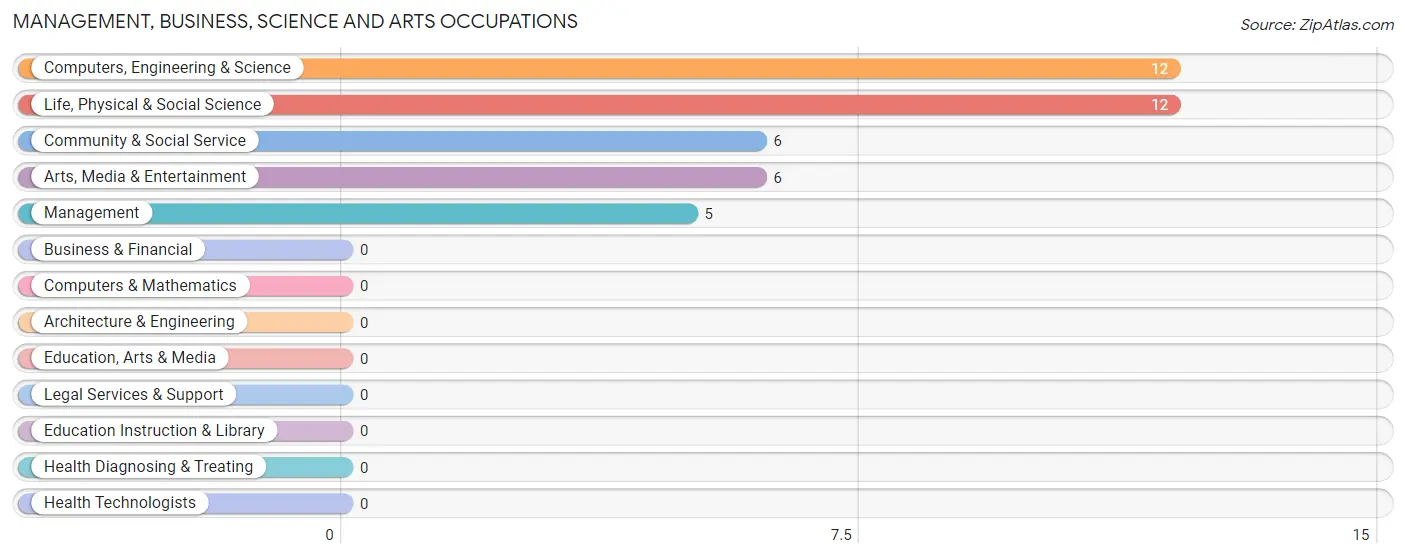
Management, Business, Science and Arts Occupations by Sex
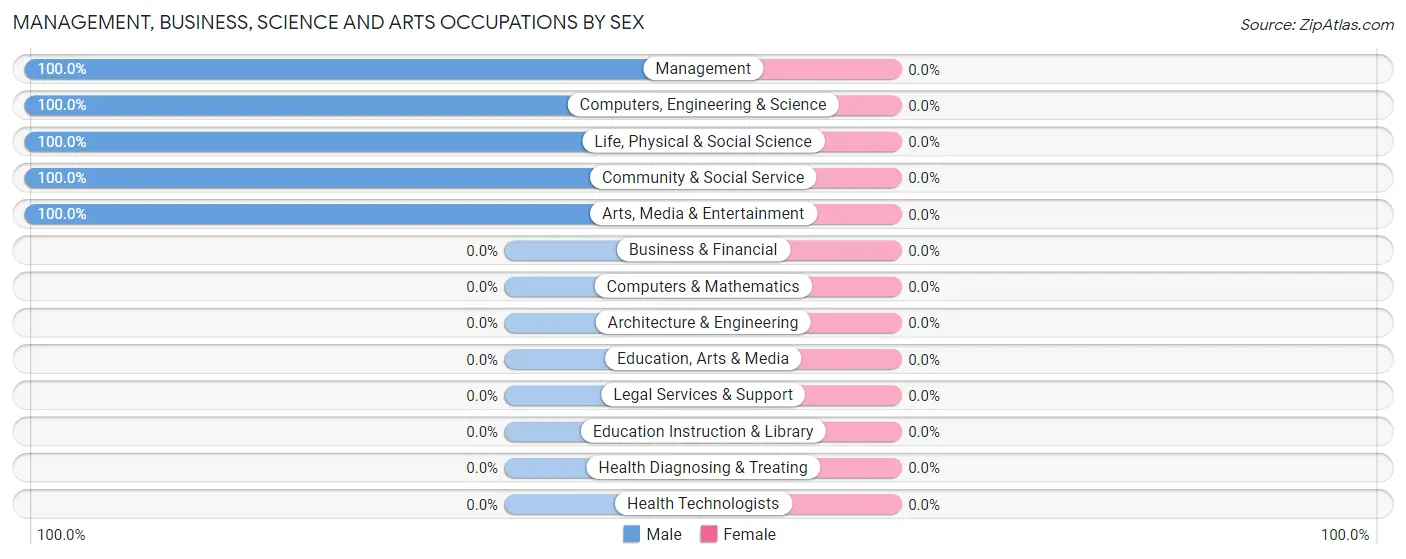
| Occupation | Male | Female |
| Management | 5 (100.0%) | 0 (0.0%) |
| Business & Financial | 0 (0.0%) | 0 (0.0%) |
| Computers, Engineering & Science | 12 (100.0%) | 0 (0.0%) |
| Computers & Mathematics | 0 (0.0%) | 0 (0.0%) |
| Architecture & Engineering | 0 (0.0%) | 0 (0.0%) |
| Life, Physical & Social Science | 12 (100.0%) | 0 (0.0%) |
| Community & Social Service | 6 (100.0%) | 0 (0.0%) |
| Education, Arts & Media | 0 (0.0%) | 0 (0.0%) |
| Legal Services & Support | 0 (0.0%) | 0 (0.0%) |
| Education Instruction & Library | 0 (0.0%) | 0 (0.0%) |
| Arts, Media & Entertainment | 6 (100.0%) | 0 (0.0%) |
| Health Diagnosing & Treating | 0 (0.0%) | 0 (0.0%) |
| Health Technologists | 0 (0.0%) | 0 (0.0%) |
| Total (Category) | 23 (100.0%) | 0 (0.0%) |
| Total (Overall) | 111 (67.3%) | 54 (32.7%) |
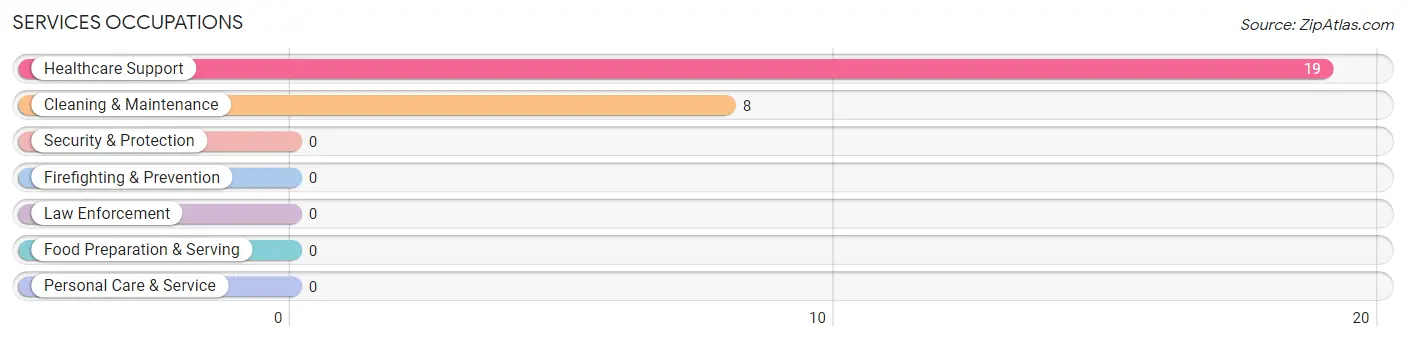
Services Occupations
The most common Services occupations in Idaville are Healthcare Support (19 | 11.5%), and Cleaning & Maintenance (8 | 4.9%).
Services Occupations by Sex
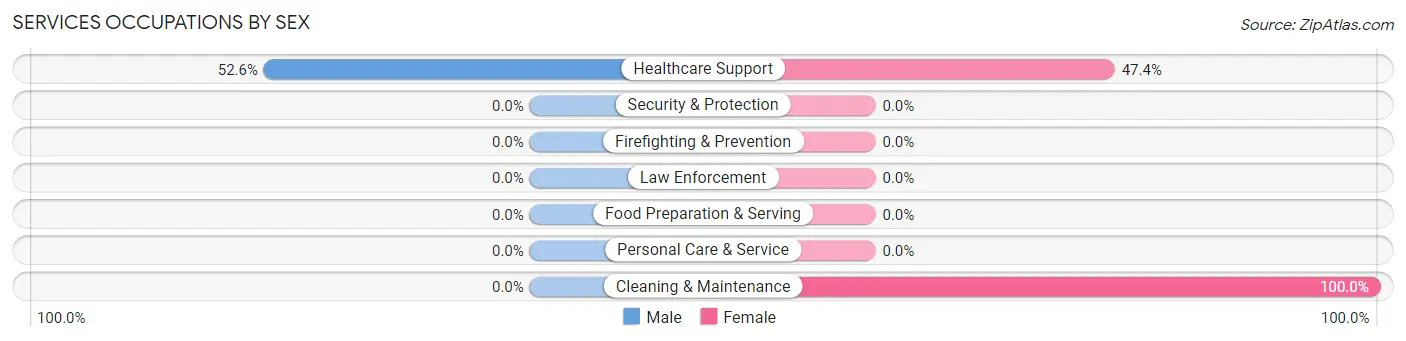
| Occupation | Male | Female |
| Healthcare Support | 10 (52.6%) | 9 (47.4%) |
| Security & Protection | 0 (0.0%) | 0 (0.0%) |
| Firefighting & Prevention | 0 (0.0%) | 0 (0.0%) |
| Law Enforcement | 0 (0.0%) | 0 (0.0%) |
| Food Preparation & Serving | 0 (0.0%) | 0 (0.0%) |
| Cleaning & Maintenance | 0 (0.0%) | 8 (100.0%) |
| Personal Care & Service | 0 (0.0%) | 0 (0.0%) |
| Total (Category) | 10 (37.0%) | 17 (63.0%) |
| Total (Overall) | 111 (67.3%) | 54 (32.7%) |
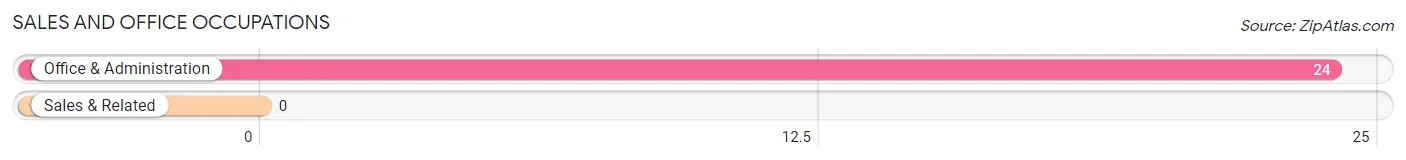
Sales and Office Occupations
The most common Sales and Office occupations in Idaville are , and Office & Administration (24 | 14.5%).
Sales and Office Occupations by Sex
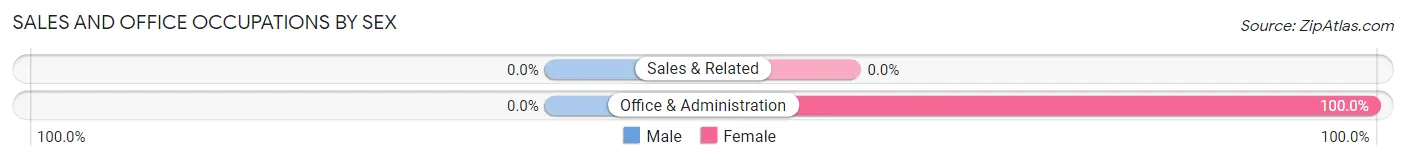
| Occupation | Male | Female |
| Sales & Related | 0 (0.0%) | 0 (0.0%) |
| Office & Administration | 0 (0.0%) | 24 (100.0%) |
| Total (Category) | 0 (0.0%) | 24 (100.0%) |
| Total (Overall) | 111 (67.3%) | 54 (32.7%) |
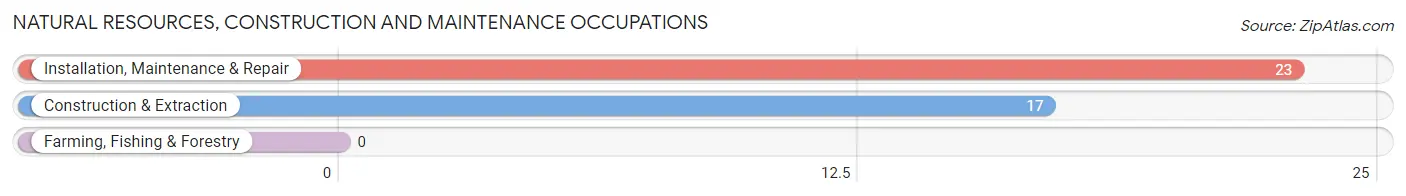
Natural Resources, Construction and Maintenance Occupations
The most common Natural Resources, Construction and Maintenance occupations in Idaville are Installation, Maintenance & Repair (23 | 13.9%), and Construction & Extraction (17 | 10.3%).
Natural Resources, Construction and Maintenance Occupations by Sex
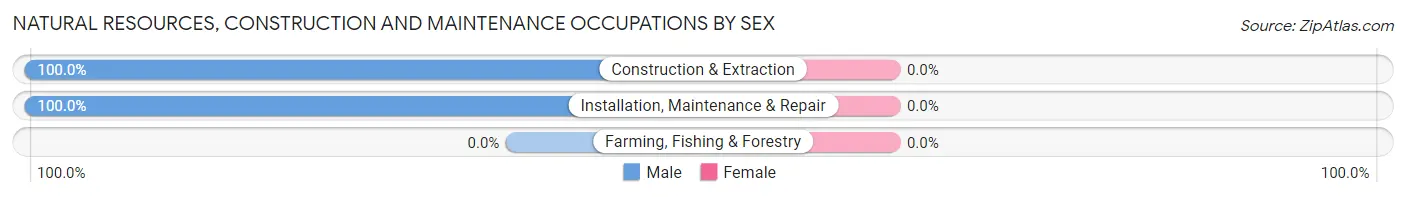
| Occupation | Male | Female |
| Farming, Fishing & Forestry | 0 (0.0%) | 0 (0.0%) |
| Construction & Extraction | 17 (100.0%) | 0 (0.0%) |
| Installation, Maintenance & Repair | 23 (100.0%) | 0 (0.0%) |
| Total (Category) | 40 (100.0%) | 0 (0.0%) |
| Total (Overall) | 111 (67.3%) | 54 (32.7%) |
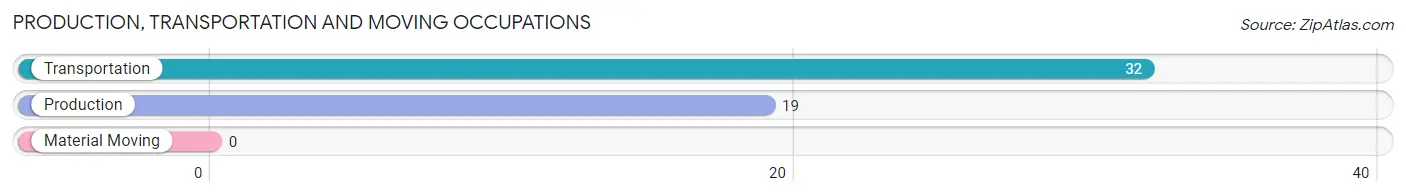
Production, Transportation and Moving Occupations
The most common Production, Transportation and Moving occupations in Idaville are Transportation (32 | 19.4%), and Production (19 | 11.5%).
Production, Transportation and Moving Occupations by Sex
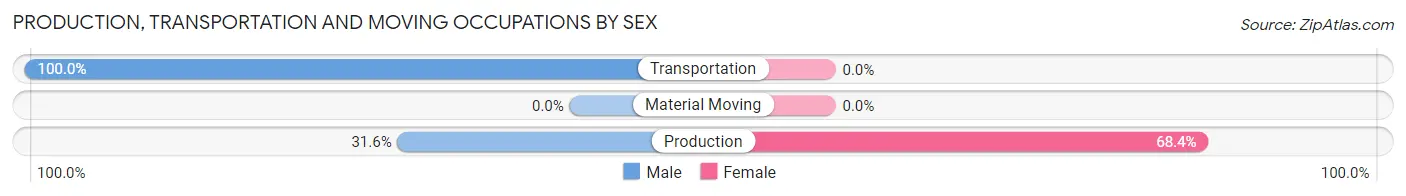
| Occupation | Male | Female |
| Production | 6 (31.6%) | 13 (68.4%) |
| Transportation | 32 (100.0%) | 0 (0.0%) |
| Material Moving | 0 (0.0%) | 0 (0.0%) |
| Total (Category) | 38 (74.5%) | 13 (25.5%) |
| Total (Overall) | 111 (67.3%) | 54 (32.7%) |
Employment Industries by Sex in Idaville
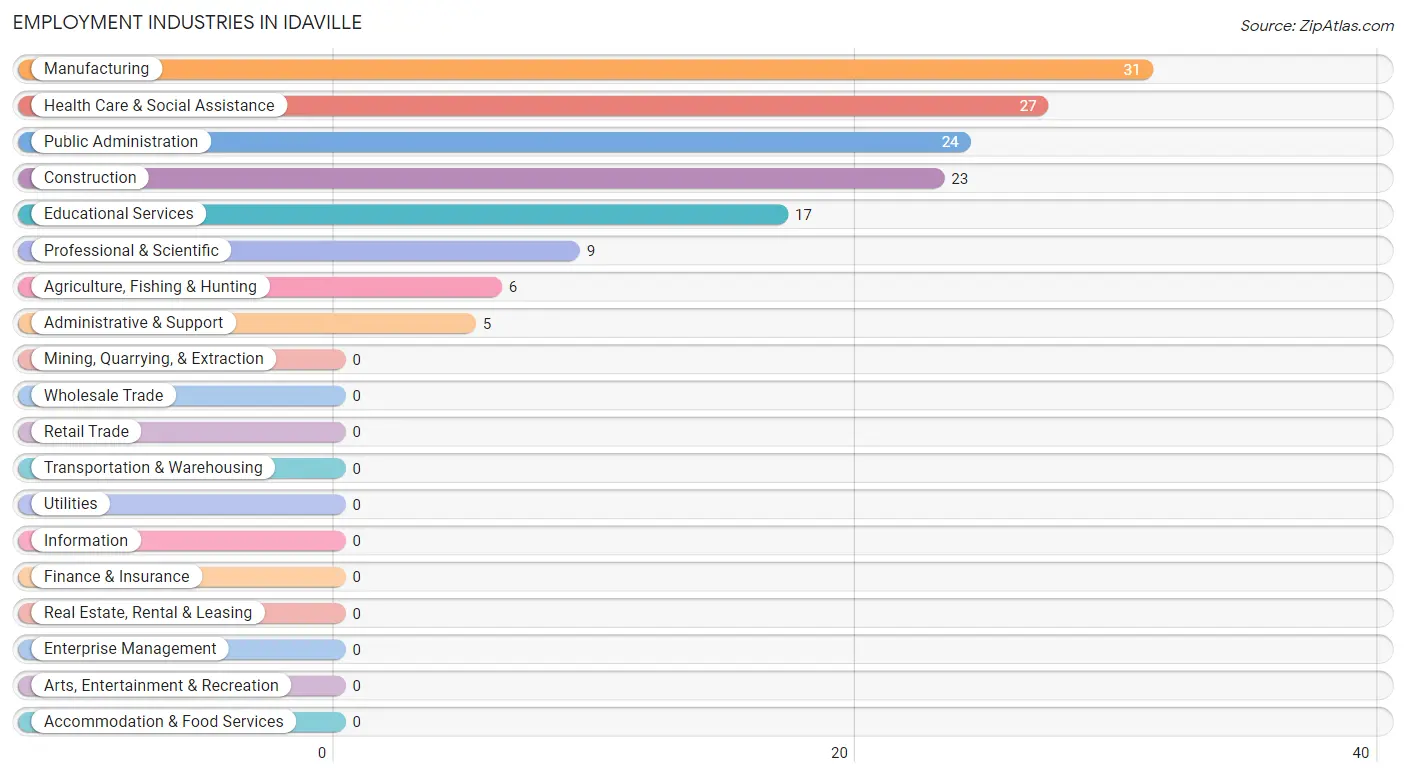
Employment Industries in Idaville
The major employment industries in Idaville include Manufacturing (31 | 18.8%), Health Care & Social Assistance (27 | 16.4%), Public Administration (24 | 14.5%), Construction (23 | 13.9%), and Educational Services (17 | 10.3%).
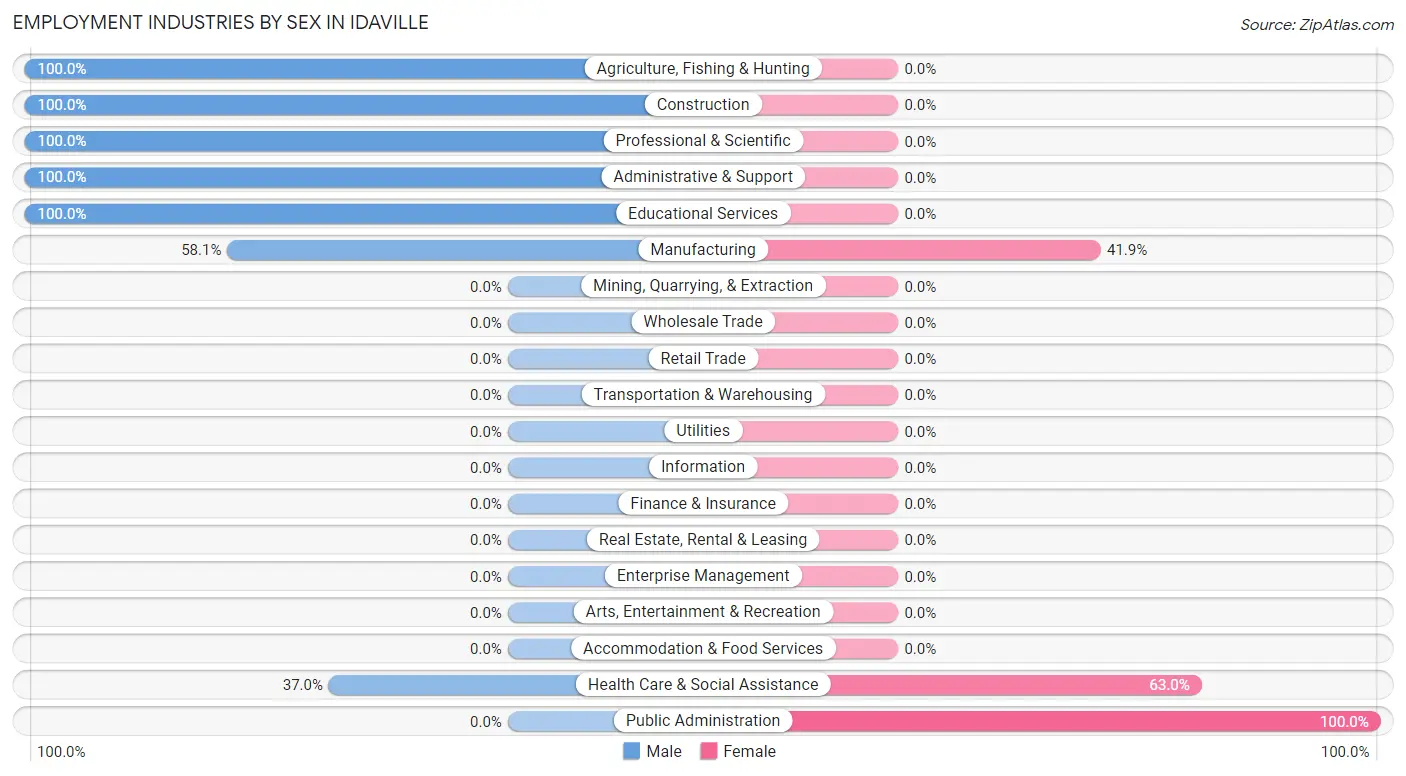
Employment Industries by Sex in Idaville
The Idaville industries that see more men than women are Agriculture, Fishing & Hunting (100.0%), Construction (100.0%), and Professional & Scientific (100.0%), whereas the industries that tend to have a higher number of women are Public Administration (100.0%), Health Care & Social Assistance (63.0%), and Manufacturing (41.9%).
| Industry | Male | Female |
| Agriculture, Fishing & Hunting | 6 (100.0%) | 0 (0.0%) |
| Mining, Quarrying, & Extraction | 0 (0.0%) | 0 (0.0%) |
| Construction | 23 (100.0%) | 0 (0.0%) |
| Manufacturing | 18 (58.1%) | 13 (41.9%) |
| Wholesale Trade | 0 (0.0%) | 0 (0.0%) |
| Retail Trade | 0 (0.0%) | 0 (0.0%) |
| Transportation & Warehousing | 0 (0.0%) | 0 (0.0%) |
| Utilities | 0 (0.0%) | 0 (0.0%) |
| Information | 0 (0.0%) | 0 (0.0%) |
| Finance & Insurance | 0 (0.0%) | 0 (0.0%) |
| Real Estate, Rental & Leasing | 0 (0.0%) | 0 (0.0%) |
| Professional & Scientific | 9 (100.0%) | 0 (0.0%) |
| Enterprise Management | 0 (0.0%) | 0 (0.0%) |
| Administrative & Support | 5 (100.0%) | 0 (0.0%) |
| Educational Services | 17 (100.0%) | 0 (0.0%) |
| Health Care & Social Assistance | 10 (37.0%) | 17 (63.0%) |
| Arts, Entertainment & Recreation | 0 (0.0%) | 0 (0.0%) |
| Accommodation & Food Services | 0 (0.0%) | 0 (0.0%) |
| Public Administration | 0 (0.0%) | 24 (100.0%) |
| Total | 111 (67.3%) | 54 (32.7%) |
Education in Idaville
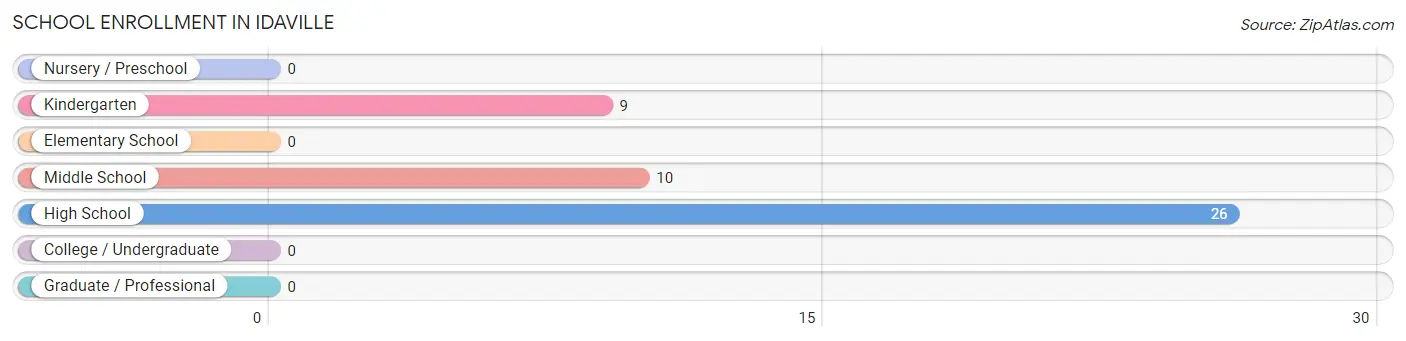
School Enrollment in Idaville
The most common levels of schooling among the 45 students in Idaville are high school (26 | 57.8%), middle school (10 | 22.2%), and kindergarten (9 | 20.0%).
| School Level | # Students | % Students |
| Nursery / Preschool | 0 | 0.0% |
| Kindergarten | 9 | 20.0% |
| Elementary School | 0 | 0.0% |
| Middle School | 10 | 22.2% |
| High School | 26 | 57.8% |
| College / Undergraduate | 0 | 0.0% |
| Graduate / Professional | 0 | 0.0% |
| Total | 45 | 100.0% |
School Enrollment by Age by Funding Source in Idaville
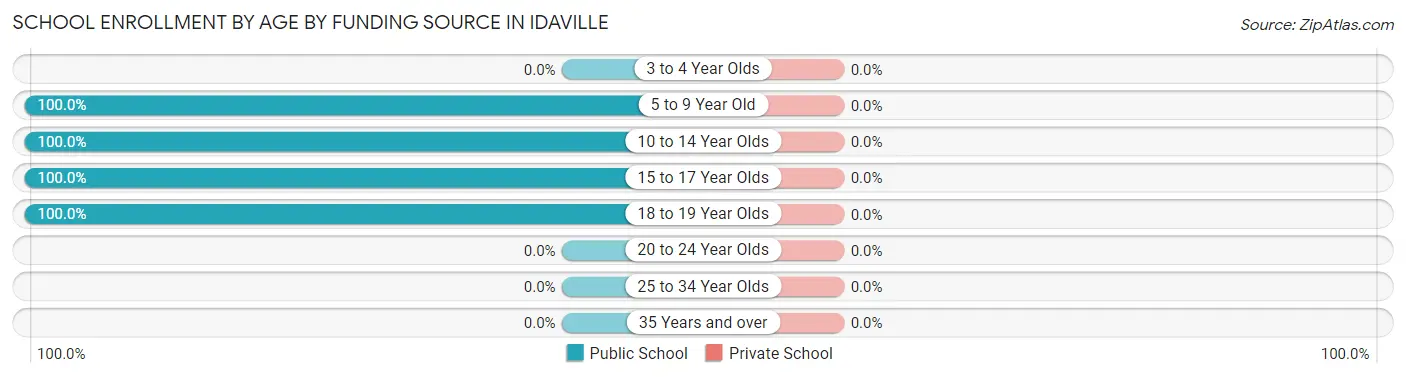
| Age Bracket | Public School | Private School |
| 3 to 4 Year Olds | 0 (0.0%) | 0 (0.0%) |
| 5 to 9 Year Old | 9 (100.0%) | 0 (0.0%) |
| 10 to 14 Year Olds | 10 (100.0%) | 0 (0.0%) |
| 15 to 17 Year Olds | 14 (100.0%) | 0 (0.0%) |
| 18 to 19 Year Olds | 12 (100.0%) | 0 (0.0%) |
| 20 to 24 Year Olds | 0 (0.0%) | 0 (0.0%) |
| 25 to 34 Year Olds | 0 (0.0%) | 0 (0.0%) |
| 35 Years and over | 0 (0.0%) | 0 (0.0%) |
| Total | 45 (100.0%) | 0 (0.0%) |
Educational Attainment by Field of Study in Idaville
Psychology (10 | 38.5%), arts & humanities (10 | 38.5%), and science & technology (6 | 23.1%) are the most common fields of study among 26 individuals in Idaville who have obtained a bachelor's degree or higher.
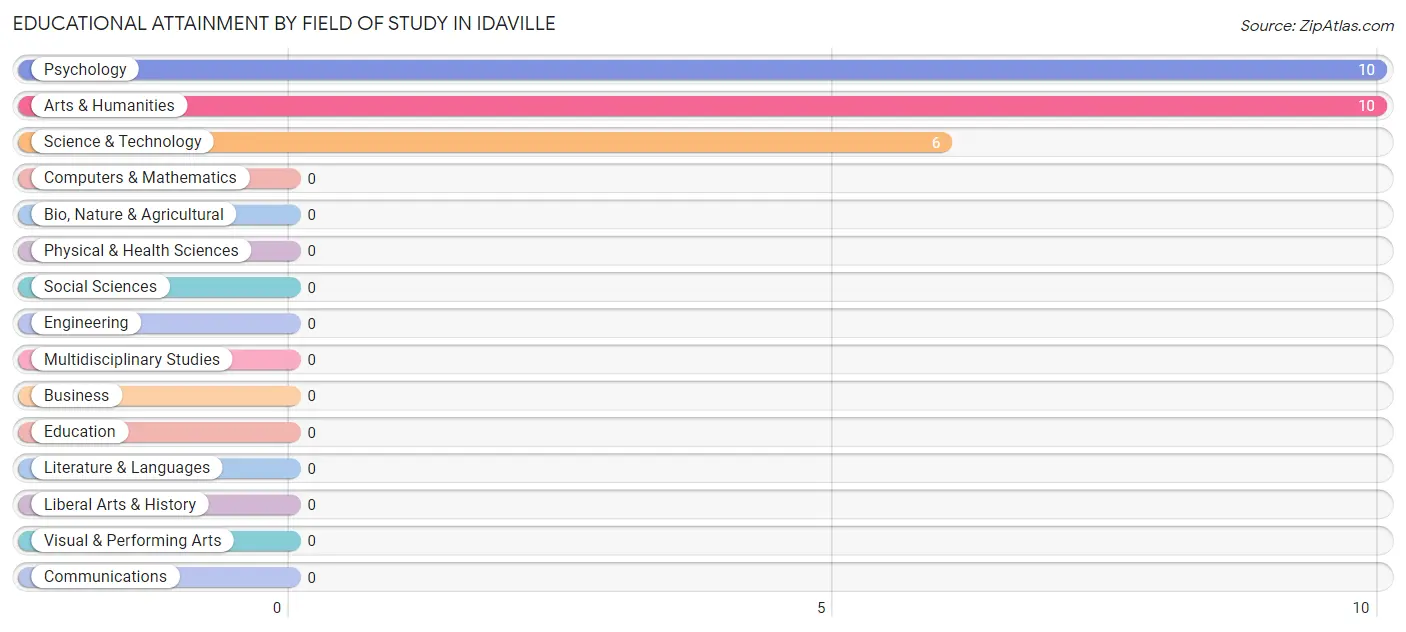
| Field of Study | # Graduates | % Graduates |
| Computers & Mathematics | 0 | 0.0% |
| Bio, Nature & Agricultural | 0 | 0.0% |
| Physical & Health Sciences | 0 | 0.0% |
| Psychology | 10 | 38.5% |
| Social Sciences | 0 | 0.0% |
| Engineering | 0 | 0.0% |
| Multidisciplinary Studies | 0 | 0.0% |
| Science & Technology | 6 | 23.1% |
| Business | 0 | 0.0% |
| Education | 0 | 0.0% |
| Literature & Languages | 0 | 0.0% |
| Liberal Arts & History | 0 | 0.0% |
| Visual & Performing Arts | 0 | 0.0% |
| Communications | 0 | 0.0% |
| Arts & Humanities | 10 | 38.5% |
| Total | 26 | 100.0% |
Transportation & Commute in Idaville
Vehicle Availability by Sex in Idaville
The most prevalent vehicle ownership categories in Idaville are males with 2 vehicles (43, accounting for 38.7%) and females with 2 vehicles (33, making up 79.6%).
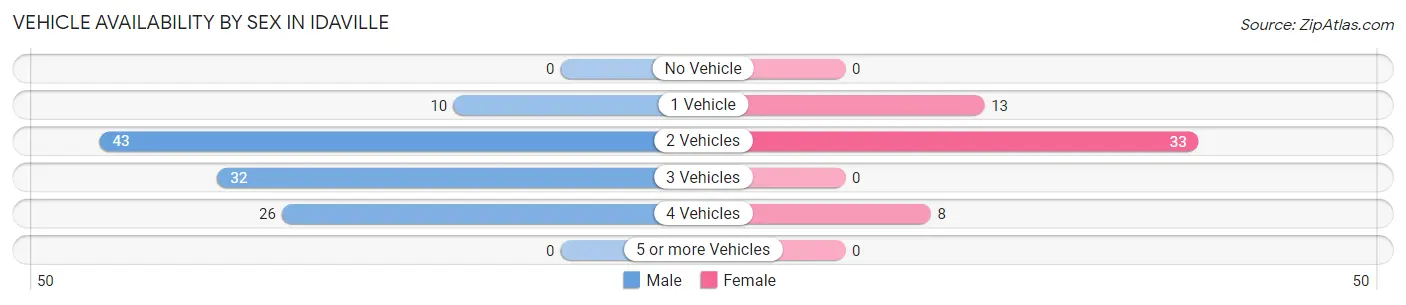
| Vehicles Available | Male | Female |
| No Vehicle | 0 (0.0%) | 0 (0.0%) |
| 1 Vehicle | 10 (9.0%) | 13 (24.1%) |
| 2 Vehicles | 43 (38.7%) | 33 (61.1%) |
| 3 Vehicles | 32 (28.8%) | 0 (0.0%) |
| 4 Vehicles | 26 (23.4%) | 8 (14.8%) |
| 5 or more Vehicles | 0 (0.0%) | 0 (0.0%) |
| Total | 111 (100.0%) | 54 (100.0%) |
Commute Time in Idaville
The most frequently occuring commute durations in Idaville are 15 to 19 minutes (65 commuters, 39.4%), 45 to 59 minutes (24 commuters, 14.5%), and 90 or more minutes (23 commuters, 13.9%).
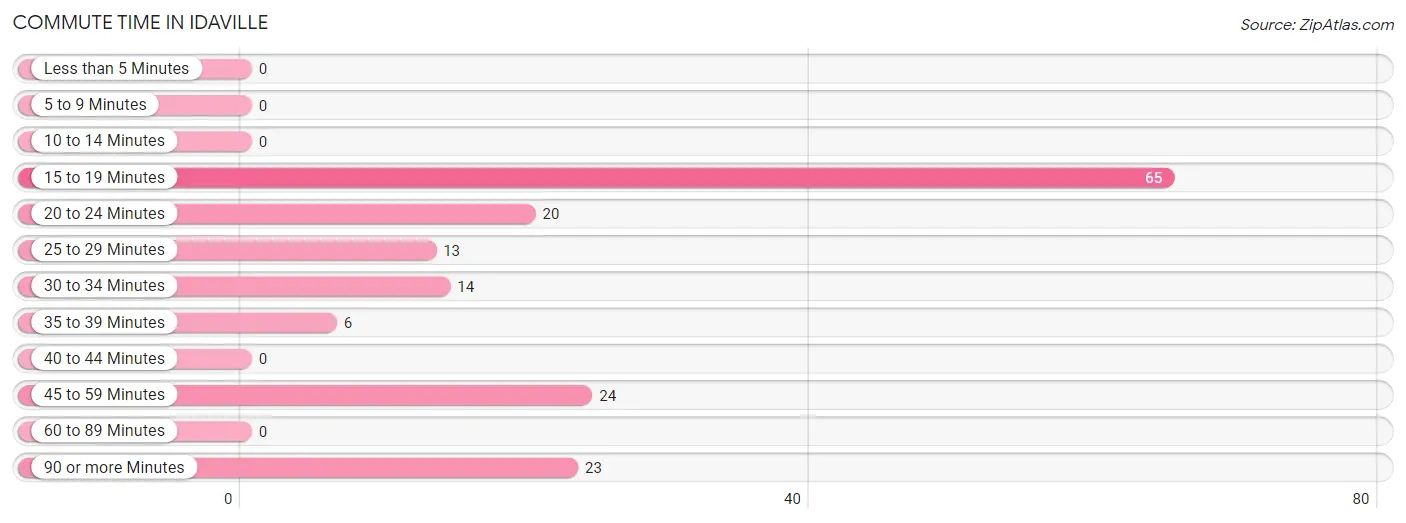
| Commute Time | # Commuters | % Commuters |
| Less than 5 Minutes | 0 | 0.0% |
| 5 to 9 Minutes | 0 | 0.0% |
| 10 to 14 Minutes | 0 | 0.0% |
| 15 to 19 Minutes | 65 | 39.4% |
| 20 to 24 Minutes | 20 | 12.1% |
| 25 to 29 Minutes | 13 | 7.9% |
| 30 to 34 Minutes | 14 | 8.5% |
| 35 to 39 Minutes | 6 | 3.6% |
| 40 to 44 Minutes | 0 | 0.0% |
| 45 to 59 Minutes | 24 | 14.5% |
| 60 to 89 Minutes | 0 | 0.0% |
| 90 or more Minutes | 23 | 13.9% |
Commute Time by Sex in Idaville
The most common commute times in Idaville are 15 to 19 minutes (32 commuters, 28.8%) for males and 15 to 19 minutes (33 commuters, 61.1%) for females.
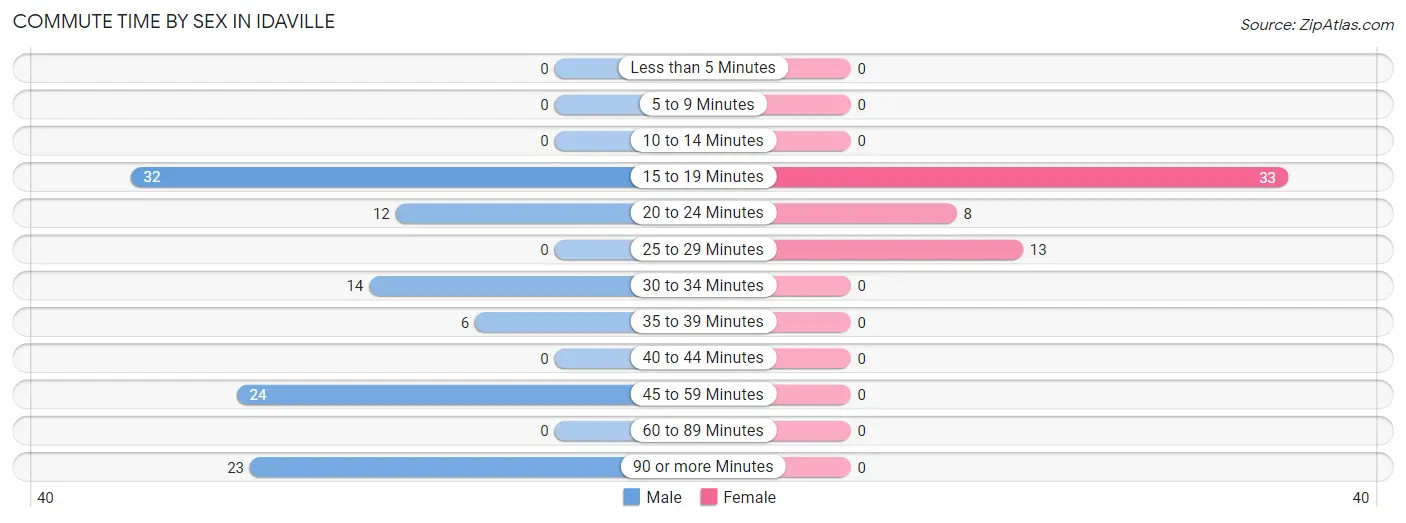
| Commute Time | Male | Female |
| Less than 5 Minutes | 0 (0.0%) | 0 (0.0%) |
| 5 to 9 Minutes | 0 (0.0%) | 0 (0.0%) |
| 10 to 14 Minutes | 0 (0.0%) | 0 (0.0%) |
| 15 to 19 Minutes | 32 (28.8%) | 33 (61.1%) |
| 20 to 24 Minutes | 12 (10.8%) | 8 (14.8%) |
| 25 to 29 Minutes | 0 (0.0%) | 13 (24.1%) |
| 30 to 34 Minutes | 14 (12.6%) | 0 (0.0%) |
| 35 to 39 Minutes | 6 (5.4%) | 0 (0.0%) |
| 40 to 44 Minutes | 0 (0.0%) | 0 (0.0%) |
| 45 to 59 Minutes | 24 (21.6%) | 0 (0.0%) |
| 60 to 89 Minutes | 0 (0.0%) | 0 (0.0%) |
| 90 or more Minutes | 23 (20.7%) | 0 (0.0%) |
Time of Departure to Work by Sex in Idaville
The most frequent times of departure to work in Idaville are 7:30 AM to 7:59 AM (42, 37.8%) for males and 6:30 AM to 6:59 AM (24, 44.4%) for females.
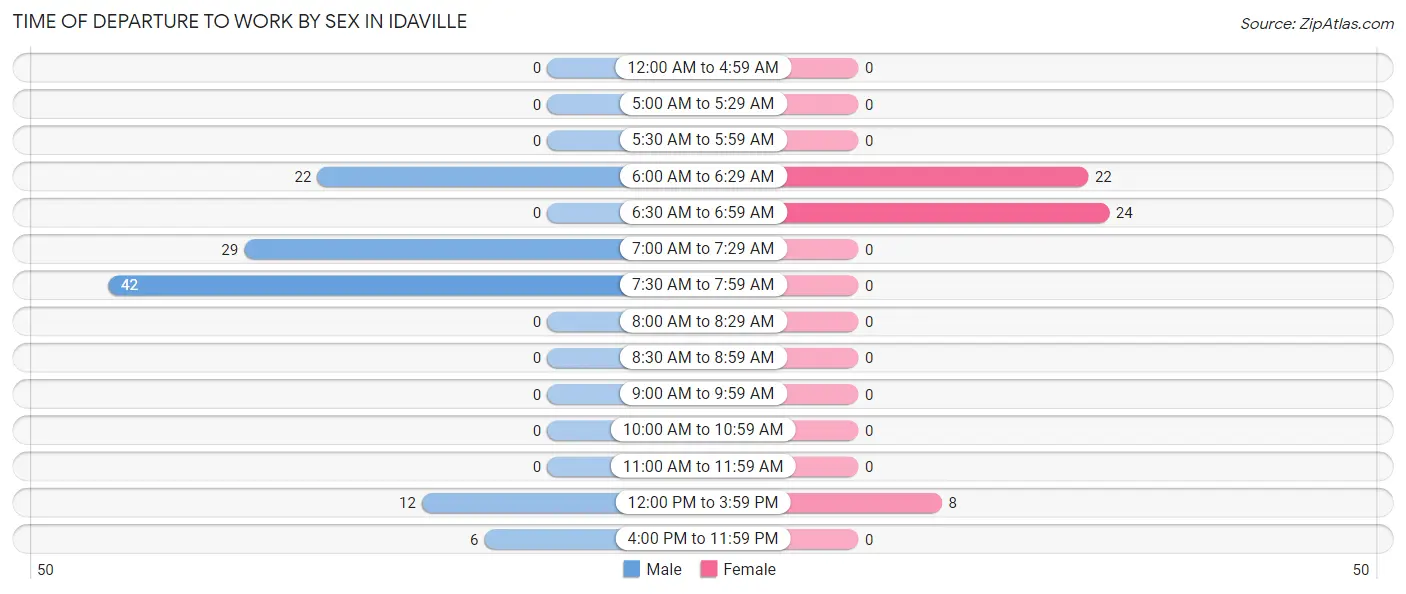
| Time of Departure | Male | Female |
| 12:00 AM to 4:59 AM | 0 (0.0%) | 0 (0.0%) |
| 5:00 AM to 5:29 AM | 0 (0.0%) | 0 (0.0%) |
| 5:30 AM to 5:59 AM | 0 (0.0%) | 0 (0.0%) |
| 6:00 AM to 6:29 AM | 22 (19.8%) | 22 (40.7%) |
| 6:30 AM to 6:59 AM | 0 (0.0%) | 24 (44.4%) |
| 7:00 AM to 7:29 AM | 29 (26.1%) | 0 (0.0%) |
| 7:30 AM to 7:59 AM | 42 (37.8%) | 0 (0.0%) |
| 8:00 AM to 8:29 AM | 0 (0.0%) | 0 (0.0%) |
| 8:30 AM to 8:59 AM | 0 (0.0%) | 0 (0.0%) |
| 9:00 AM to 9:59 AM | 0 (0.0%) | 0 (0.0%) |
| 10:00 AM to 10:59 AM | 0 (0.0%) | 0 (0.0%) |
| 11:00 AM to 11:59 AM | 0 (0.0%) | 0 (0.0%) |
| 12:00 PM to 3:59 PM | 12 (10.8%) | 8 (14.8%) |
| 4:00 PM to 11:59 PM | 6 (5.4%) | 0 (0.0%) |
| Total | 111 (100.0%) | 54 (100.0%) |
Housing Occupancy in Idaville
Occupancy by Ownership in Idaville
Of the total 204 dwellings in Idaville, owner-occupied units account for 137 (67.2%), while renter-occupied units make up 67 (32.8%).
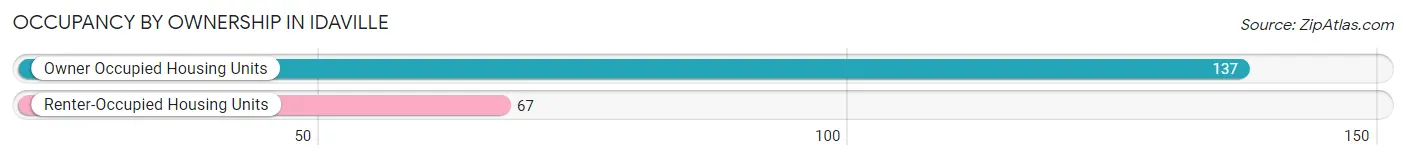
| Occupancy | # Housing Units | % Housing Units |
| Owner Occupied Housing Units | 137 | 67.2% |
| Renter-Occupied Housing Units | 67 | 32.8% |
| Total Occupied Housing Units | 204 | 100.0% |
Occupancy by Household Size in Idaville
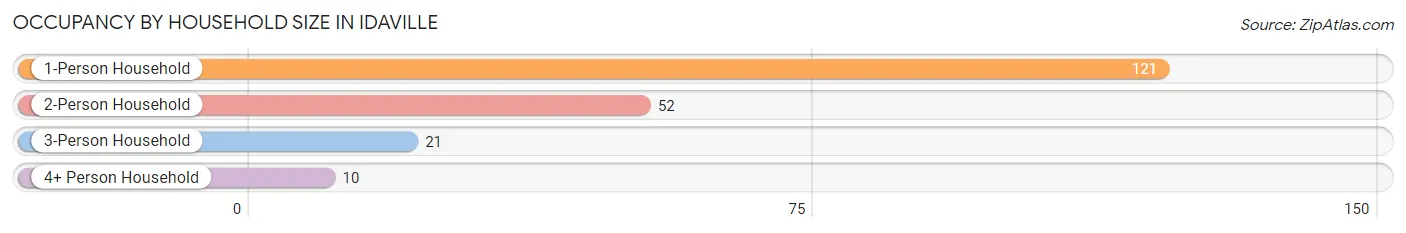
| Household Size | # Housing Units | % Housing Units |
| 1-Person Household | 121 | 59.3% |
| 2-Person Household | 52 | 25.5% |
| 3-Person Household | 21 | 10.3% |
| 4+ Person Household | 10 | 4.9% |
| Total Housing Units | 204 | 100.0% |
Occupancy by Ownership by Household Size in Idaville
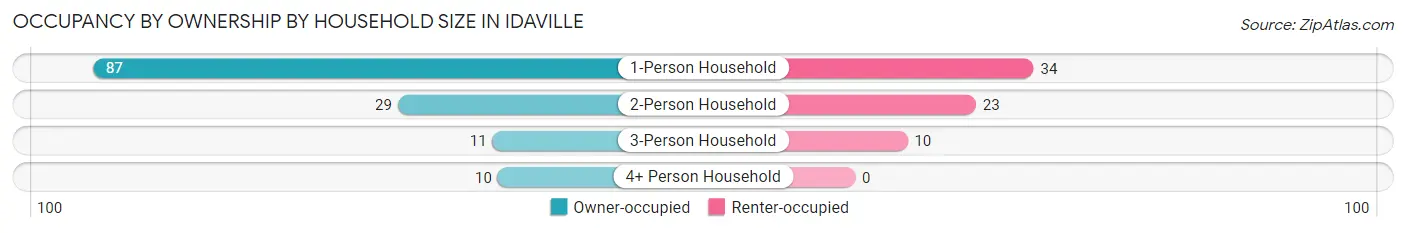
| Household Size | Owner-occupied | Renter-occupied |
| 1-Person Household | 87 (71.9%) | 34 (28.1%) |
| 2-Person Household | 29 (55.8%) | 23 (44.2%) |
| 3-Person Household | 11 (52.4%) | 10 (47.6%) |
| 4+ Person Household | 10 (100.0%) | 0 (0.0%) |
| Total Housing Units | 137 (67.2%) | 67 (32.8%) |
Occupancy by Educational Attainment in Idaville
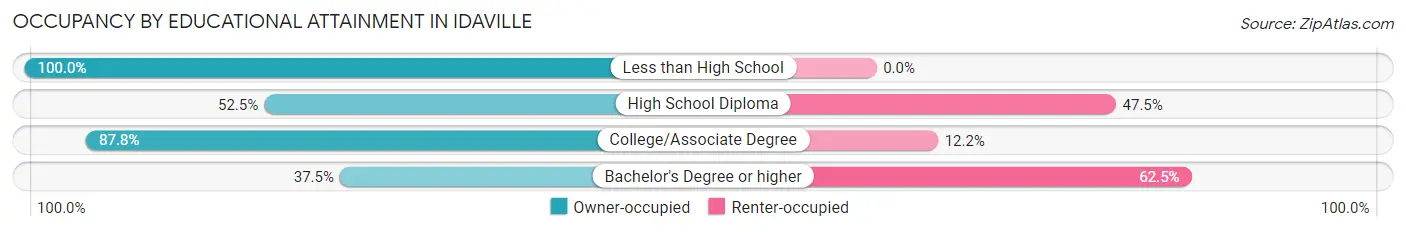
| Household Size | Owner-occupied | Renter-occupied |
| Less than High School | 7 (100.0%) | 0 (0.0%) |
| High School Diploma | 52 (52.5%) | 47 (47.5%) |
| College/Associate Degree | 72 (87.8%) | 10 (12.2%) |
| Bachelor's Degree or higher | 6 (37.5%) | 10 (62.5%) |
Occupancy by Age of Householder in Idaville
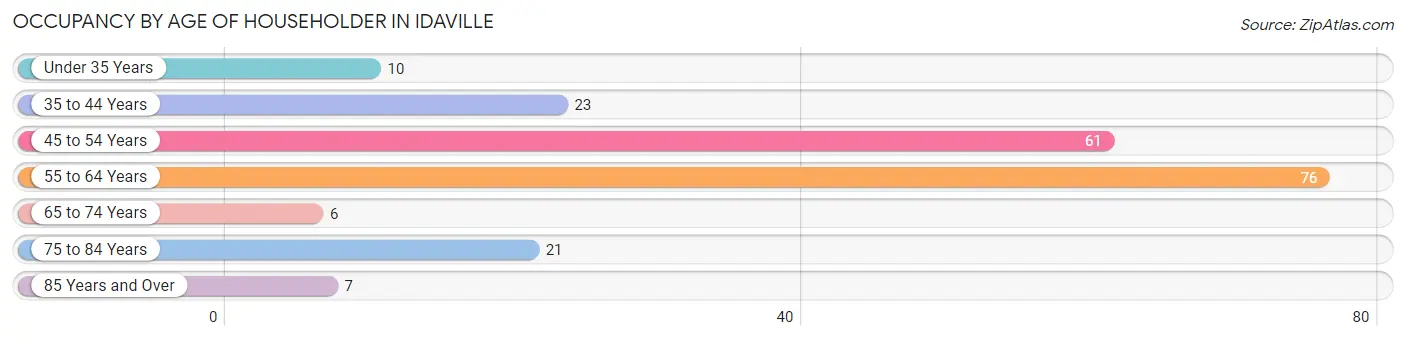
| Age Bracket | # Households | % Households |
| Under 35 Years | 10 | 4.9% |
| 35 to 44 Years | 23 | 11.3% |
| 45 to 54 Years | 61 | 29.9% |
| 55 to 64 Years | 76 | 37.2% |
| 65 to 74 Years | 6 | 2.9% |
| 75 to 84 Years | 21 | 10.3% |
| 85 Years and Over | 7 | 3.4% |
| Total | 204 | 100.0% |
Housing Finances in Idaville
Median Income by Occupancy in Idaville
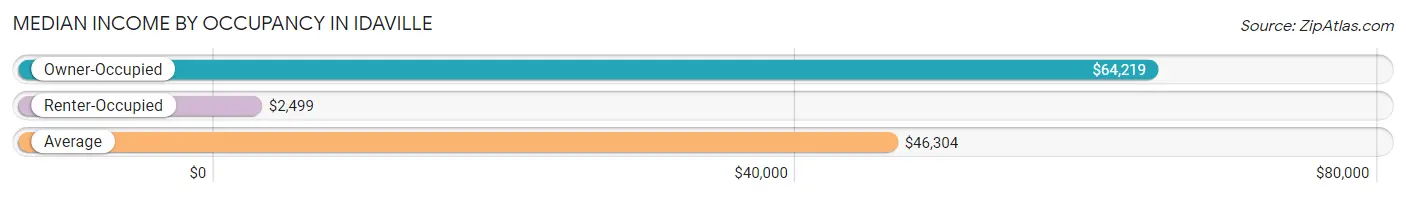
| Occupancy Type | # Households | Median Income |
| Owner-Occupied | 137 (67.2%) | $64,219 |
| Renter-Occupied | 67 (32.8%) | $2,499 |
| Average | 204 (100.0%) | $46,304 |
Occupancy by Householder Income Bracket in Idaville
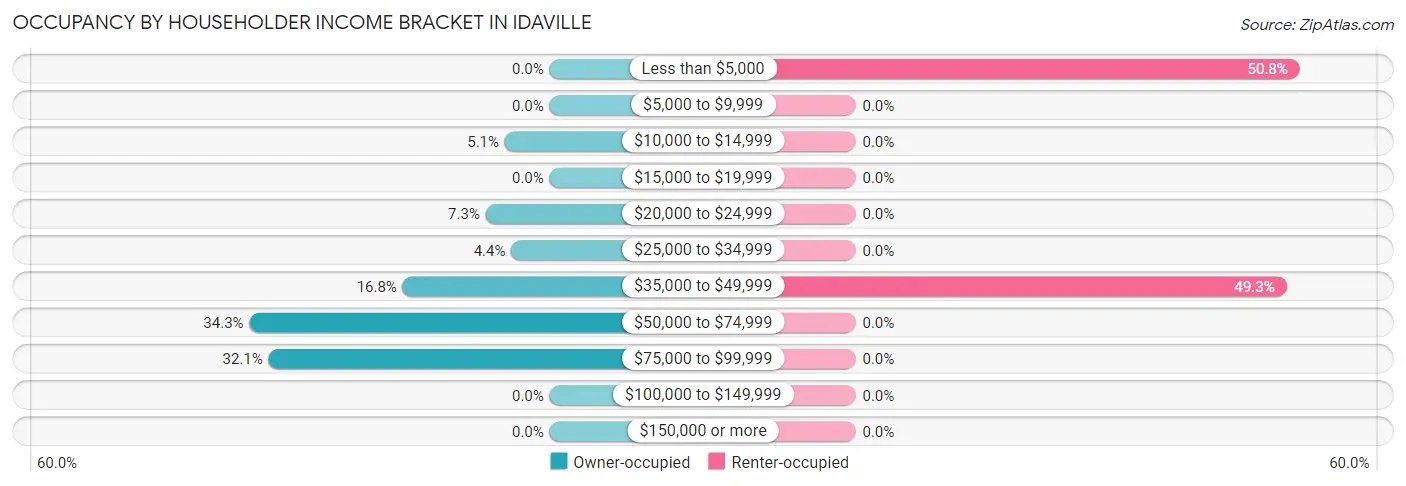
| Income Bracket | Owner-occupied | Renter-occupied |
| Less than $5,000 | 0 (0.0%) | 34 (50.7%) |
| $5,000 to $9,999 | 0 (0.0%) | 0 (0.0%) |
| $10,000 to $14,999 | 7 (5.1%) | 0 (0.0%) |
| $15,000 to $19,999 | 0 (0.0%) | 0 (0.0%) |
| $20,000 to $24,999 | 10 (7.3%) | 0 (0.0%) |
| $25,000 to $34,999 | 6 (4.4%) | 0 (0.0%) |
| $35,000 to $49,999 | 23 (16.8%) | 33 (49.2%) |
| $50,000 to $74,999 | 47 (34.3%) | 0 (0.0%) |
| $75,000 to $99,999 | 44 (32.1%) | 0 (0.0%) |
| $100,000 to $149,999 | 0 (0.0%) | 0 (0.0%) |
| $150,000 or more | 0 (0.0%) | 0 (0.0%) |
| Total | 137 (100.0%) | 67 (100.0%) |
Monthly Housing Cost Tiers in Idaville
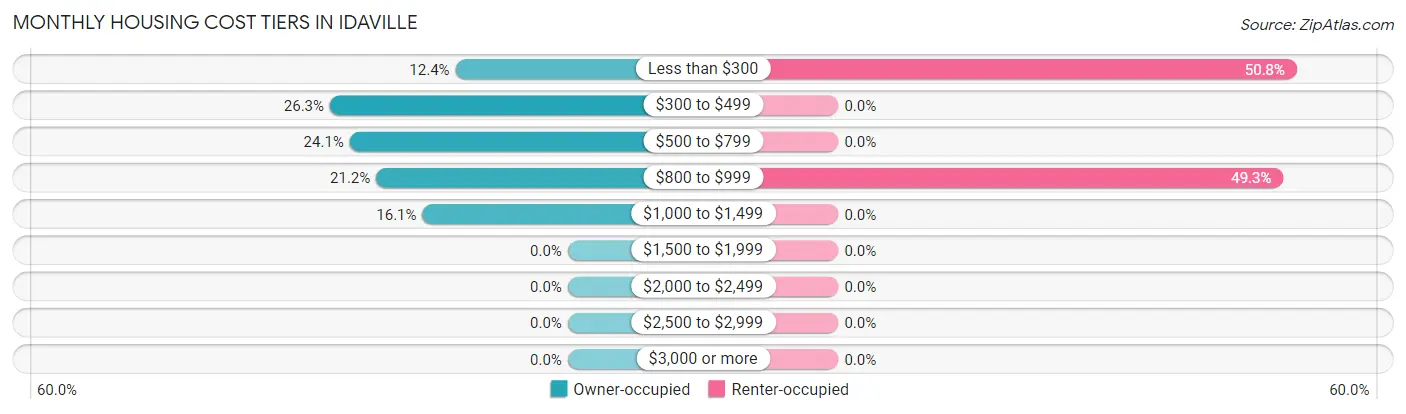
| Monthly Cost | Owner-occupied | Renter-occupied |
| Less than $300 | 17 (12.4%) | 34 (50.7%) |
| $300 to $499 | 36 (26.3%) | 0 (0.0%) |
| $500 to $799 | 33 (24.1%) | 0 (0.0%) |
| $800 to $999 | 29 (21.2%) | 33 (49.2%) |
| $1,000 to $1,499 | 22 (16.1%) | 0 (0.0%) |
| $1,500 to $1,999 | 0 (0.0%) | 0 (0.0%) |
| $2,000 to $2,499 | 0 (0.0%) | 0 (0.0%) |
| $2,500 to $2,999 | 0 (0.0%) | 0 (0.0%) |
| $3,000 or more | 0 (0.0%) | 0 (0.0%) |
| Total | 137 (100.0%) | 67 (100.0%) |
Physical Housing Characteristics in Idaville
Housing Structures in Idaville
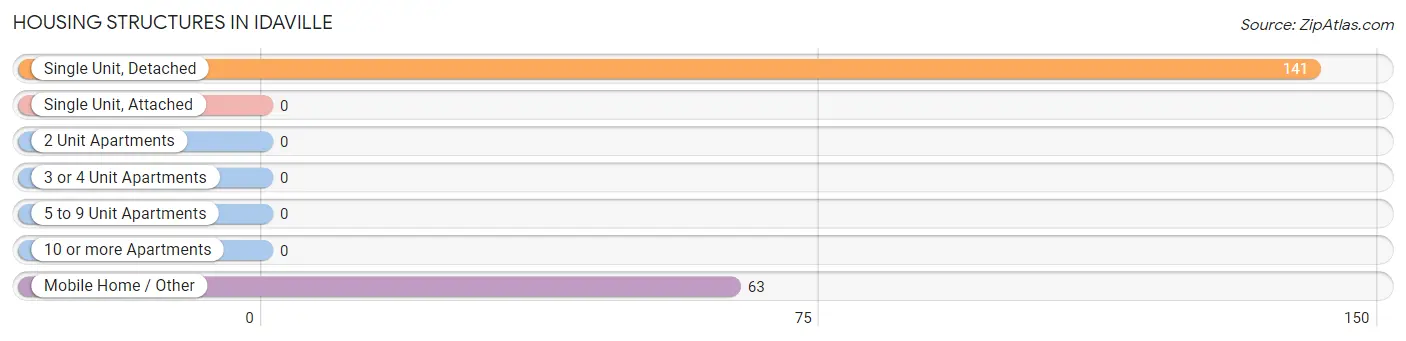
| Structure Type | # Housing Units | % Housing Units |
| Single Unit, Detached | 141 | 69.1% |
| Single Unit, Attached | 0 | 0.0% |
| 2 Unit Apartments | 0 | 0.0% |
| 3 or 4 Unit Apartments | 0 | 0.0% |
| 5 to 9 Unit Apartments | 0 | 0.0% |
| 10 or more Apartments | 0 | 0.0% |
| Mobile Home / Other | 63 | 30.9% |
| Total | 204 | 100.0% |
Housing Structures by Occupancy in Idaville
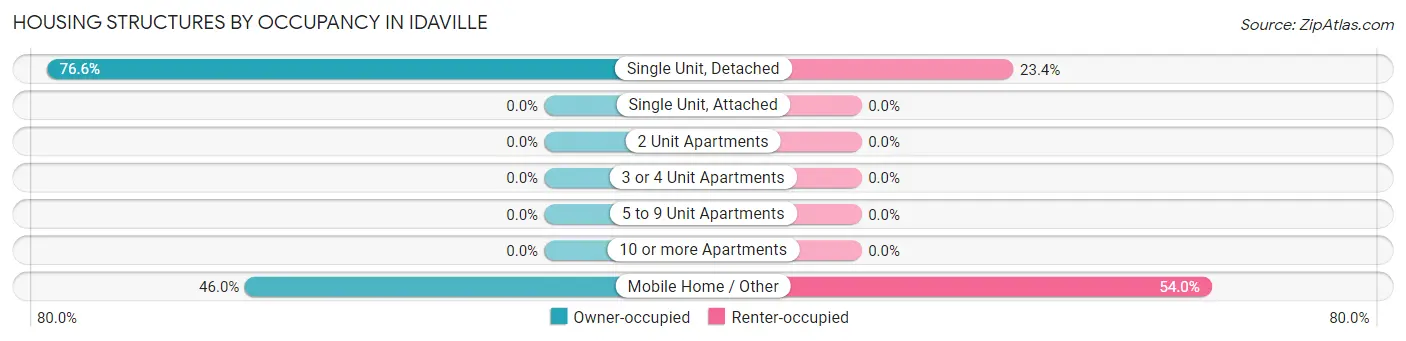
| Structure Type | Owner-occupied | Renter-occupied |
| Single Unit, Detached | 108 (76.6%) | 33 (23.4%) |
| Single Unit, Attached | 0 (0.0%) | 0 (0.0%) |
| 2 Unit Apartments | 0 (0.0%) | 0 (0.0%) |
| 3 or 4 Unit Apartments | 0 (0.0%) | 0 (0.0%) |
| 5 to 9 Unit Apartments | 0 (0.0%) | 0 (0.0%) |
| 10 or more Apartments | 0 (0.0%) | 0 (0.0%) |
| Mobile Home / Other | 29 (46.0%) | 34 (54.0%) |
| Total | 137 (67.2%) | 67 (32.8%) |
Housing Structures by Number of Rooms in Idaville
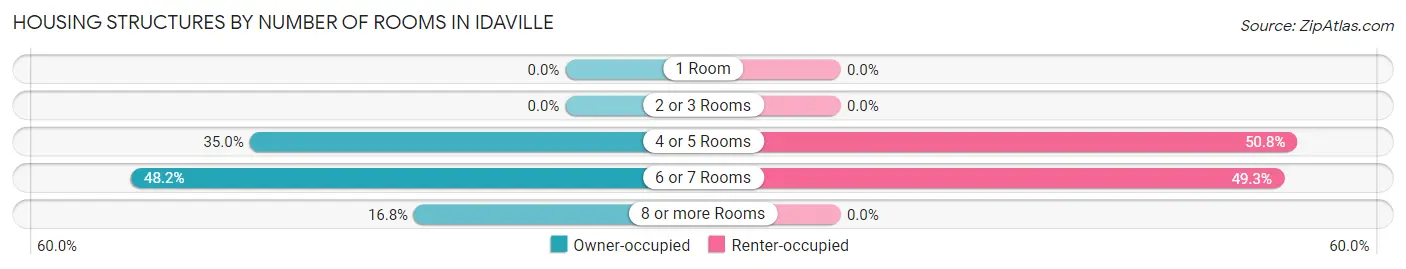
| Number of Rooms | Owner-occupied | Renter-occupied |
| 1 Room | 0 (0.0%) | 0 (0.0%) |
| 2 or 3 Rooms | 0 (0.0%) | 0 (0.0%) |
| 4 or 5 Rooms | 48 (35.0%) | 34 (50.7%) |
| 6 or 7 Rooms | 66 (48.2%) | 33 (49.2%) |
| 8 or more Rooms | 23 (16.8%) | 0 (0.0%) |
| Total | 137 (100.0%) | 67 (100.0%) |
Housing Structure by Heating Type in Idaville
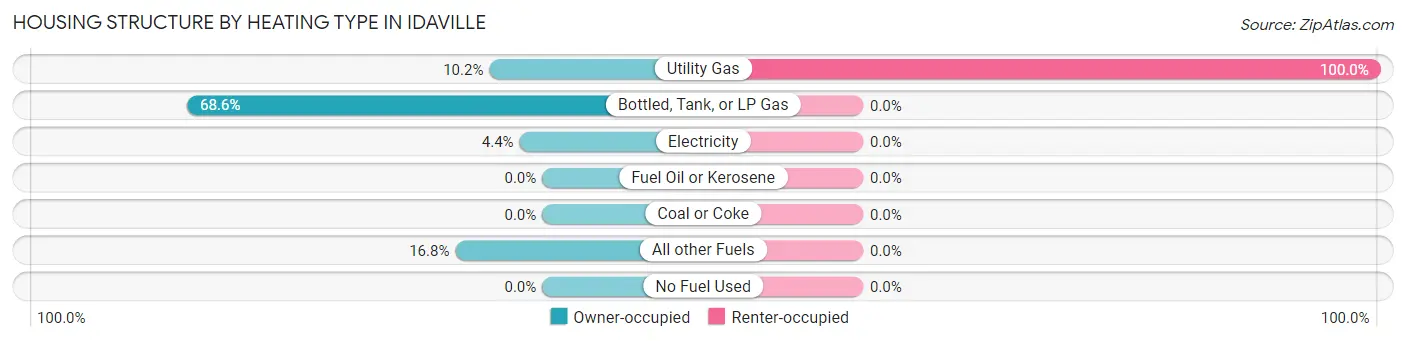
| Heating Type | Owner-occupied | Renter-occupied |
| Utility Gas | 14 (10.2%) | 67 (100.0%) |
| Bottled, Tank, or LP Gas | 94 (68.6%) | 0 (0.0%) |
| Electricity | 6 (4.4%) | 0 (0.0%) |
| Fuel Oil or Kerosene | 0 (0.0%) | 0 (0.0%) |
| Coal or Coke | 0 (0.0%) | 0 (0.0%) |
| All other Fuels | 23 (16.8%) | 0 (0.0%) |
| No Fuel Used | 0 (0.0%) | 0 (0.0%) |
| Total | 137 (100.0%) | 67 (100.0%) |
Household Vehicle Usage in Idaville
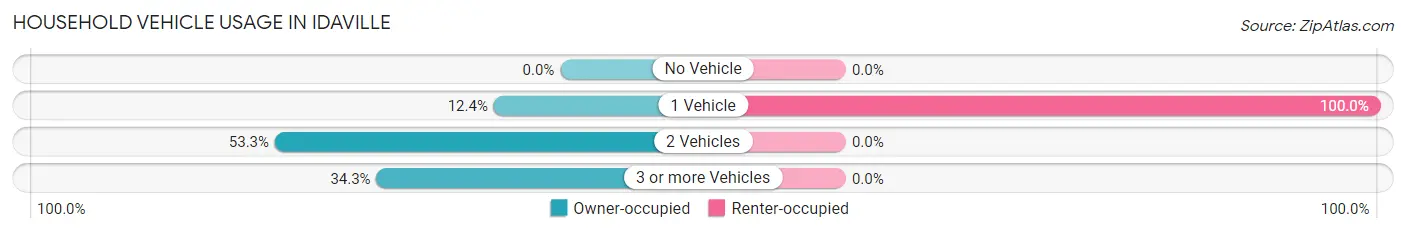
| Vehicles per Household | Owner-occupied | Renter-occupied |
| No Vehicle | 0 (0.0%) | 0 (0.0%) |
| 1 Vehicle | 17 (12.4%) | 67 (100.0%) |
| 2 Vehicles | 73 (53.3%) | 0 (0.0%) |
| 3 or more Vehicles | 47 (34.3%) | 0 (0.0%) |
| Total | 137 (100.0%) | 67 (100.0%) |
Real Estate & Mortgages in Idaville
Real Estate and Mortgage Overview in Idaville
| Characteristic | Without Mortgage | With Mortgage |
| Housing Units | 53 | 84 |
| Median Property Value | $62,800 | $147,500 |
| Median Household Income | $78,750 | $0 |
| Monthly Housing Costs | $321 | $0 |
| Real Estate Taxes | $280 | $0 |
Property Value by Mortgage Status in Idaville
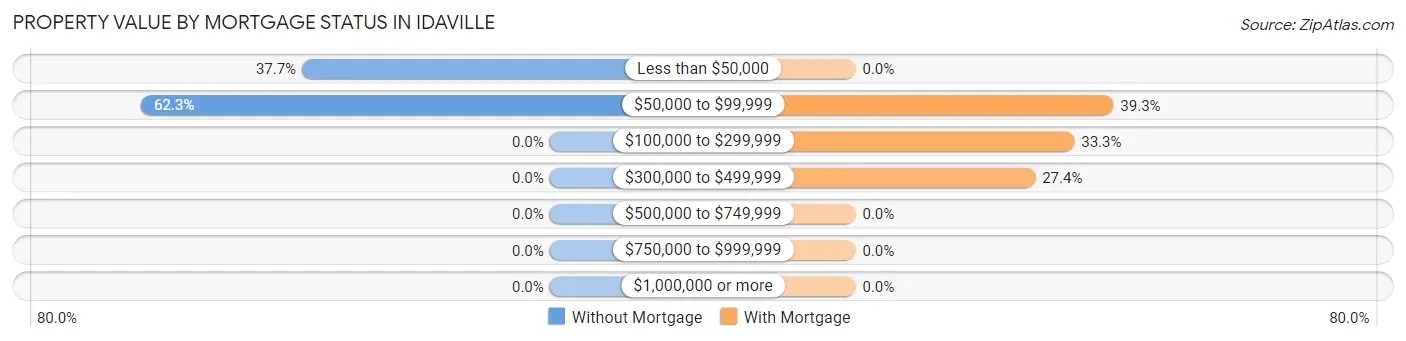
| Property Value | Without Mortgage | With Mortgage |
| Less than $50,000 | 20 (37.7%) | 0 (0.0%) |
| $50,000 to $99,999 | 33 (62.3%) | 33 (39.3%) |
| $100,000 to $299,999 | 0 (0.0%) | 28 (33.3%) |
| $300,000 to $499,999 | 0 (0.0%) | 23 (27.4%) |
| $500,000 to $749,999 | 0 (0.0%) | 0 (0.0%) |
| $750,000 to $999,999 | 0 (0.0%) | 0 (0.0%) |
| $1,000,000 or more | 0 (0.0%) | 0 (0.0%) |
| Total | 53 (100.0%) | 84 (100.0%) |
Household Income by Mortgage Status in Idaville
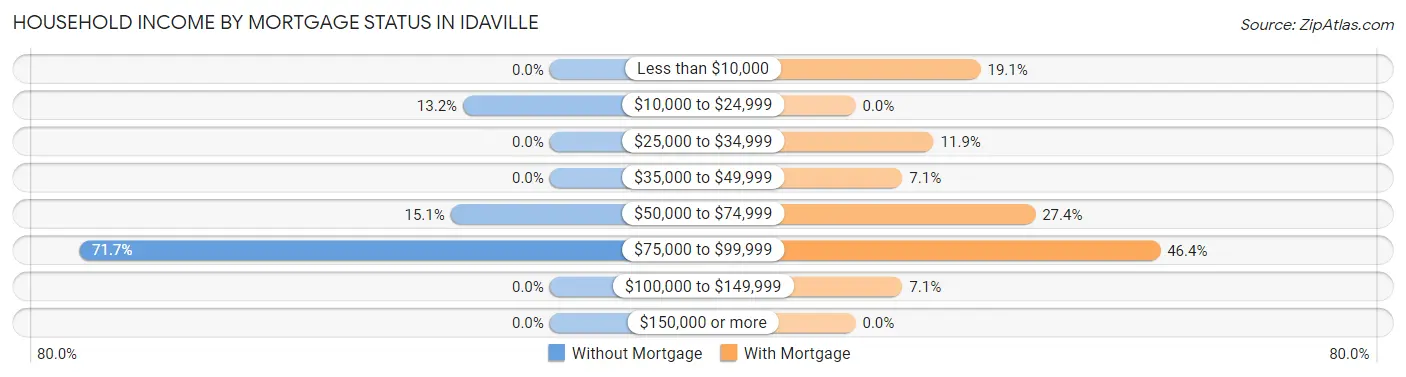
| Household Income | Without Mortgage | With Mortgage |
| Less than $10,000 | 0 (0.0%) | 16 (19.1%) |
| $10,000 to $24,999 | 7 (13.2%) | 0 (0.0%) |
| $25,000 to $34,999 | 0 (0.0%) | 10 (11.9%) |
| $35,000 to $49,999 | 0 (0.0%) | 6 (7.1%) |
| $50,000 to $74,999 | 8 (15.1%) | 23 (27.4%) |
| $75,000 to $99,999 | 38 (71.7%) | 39 (46.4%) |
| $100,000 to $149,999 | 0 (0.0%) | 6 (7.1%) |
| $150,000 or more | 0 (0.0%) | 0 (0.0%) |
| Total | 53 (100.0%) | 84 (100.0%) |
Property Value to Household Income Ratio in Idaville
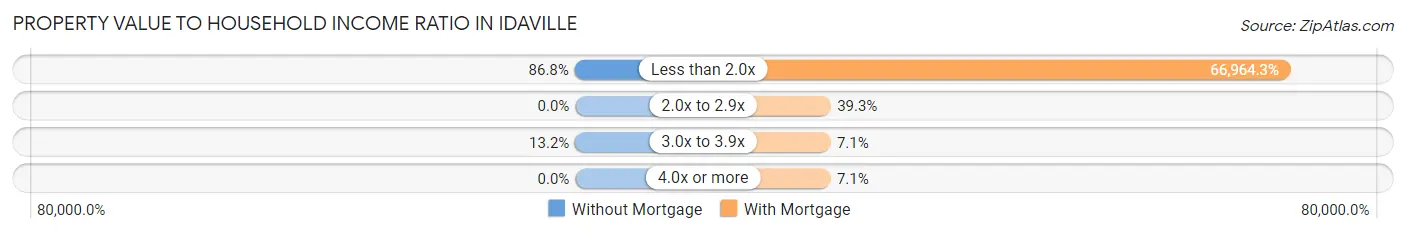
| Value-to-Income Ratio | Without Mortgage | With Mortgage |
| Less than 2.0x | 46 (86.8%) | 56,250 (66,964.3%) |
| 2.0x to 2.9x | 0 (0.0%) | 33 (39.3%) |
| 3.0x to 3.9x | 7 (13.2%) | 6 (7.1%) |
| 4.0x or more | 0 (0.0%) | 6 (7.1%) |
| Total | 53 (100.0%) | 84 (100.0%) |
Real Estate Taxes by Mortgage Status in Idaville
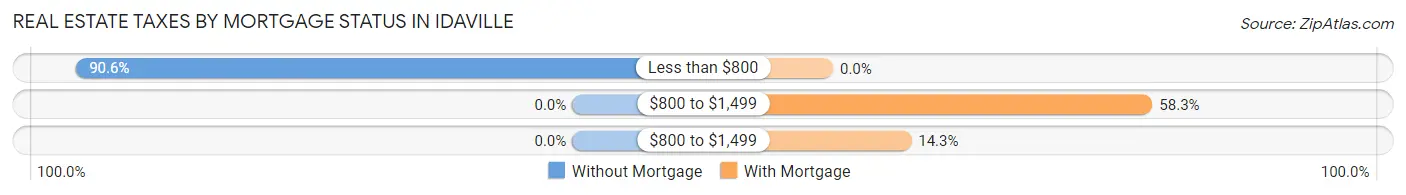
| Property Taxes | Without Mortgage | With Mortgage |
| Less than $800 | 48 (90.6%) | 0 (0.0%) |
| $800 to $1,499 | 0 (0.0%) | 49 (58.3%) |
| $800 to $1,499 | 0 (0.0%) | 12 (14.3%) |
| Total | 53 (100.0%) | 84 (100.0%) |
Health & Disability in Idaville
Health Insurance Coverage by Age in Idaville
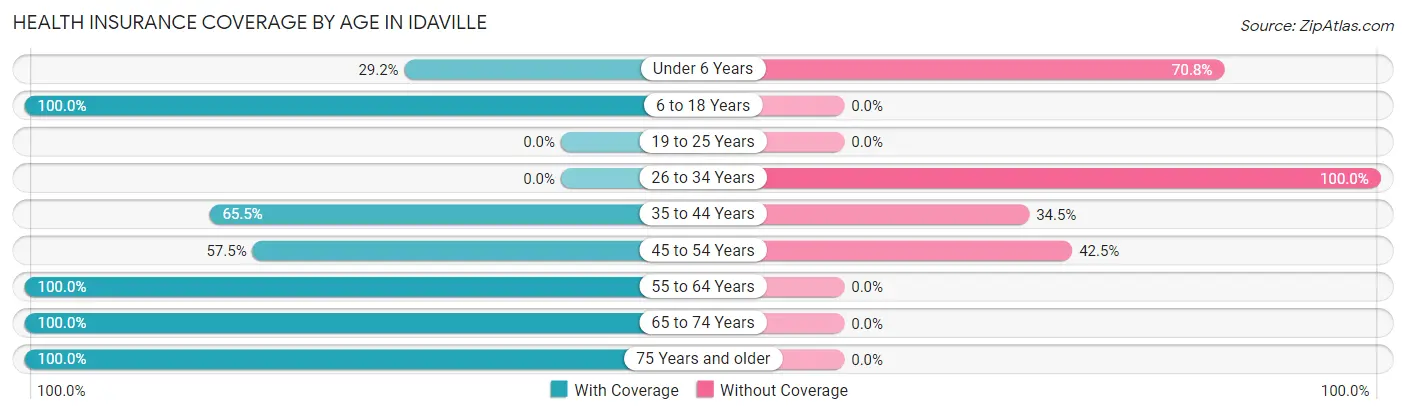
| Age Bracket | With Coverage | Without Coverage |
| Under 6 Years | 7 (29.2%) | 17 (70.8%) |
| 6 to 18 Years | 36 (100.0%) | 0 (0.0%) |
| 19 to 25 Years | 0 (0.0%) | 0 (0.0%) |
| 26 to 34 Years | 0 (0.0%) | 19 (100.0%) |
| 35 to 44 Years | 19 (65.5%) | 10 (34.5%) |
| 45 to 54 Years | 46 (57.5%) | 34 (42.5%) |
| 55 to 64 Years | 104 (100.0%) | 0 (0.0%) |
| 65 to 74 Years | 12 (100.0%) | 0 (0.0%) |
| 75 Years and older | 28 (100.0%) | 0 (0.0%) |
| Total | 252 (75.9%) | 80 (24.1%) |
Health Insurance Coverage by Citizenship Status in Idaville
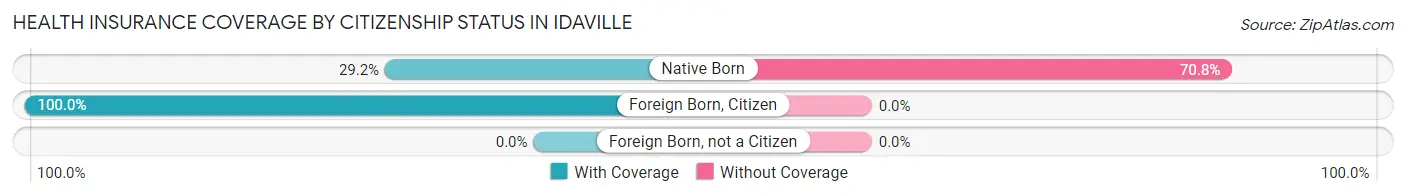
| Citizenship Status | With Coverage | Without Coverage |
| Native Born | 7 (29.2%) | 17 (70.8%) |
| Foreign Born, Citizen | 36 (100.0%) | 0 (0.0%) |
| Foreign Born, not a Citizen | 0 (0.0%) | 0 (0.0%) |
Health Insurance Coverage by Household Income in Idaville
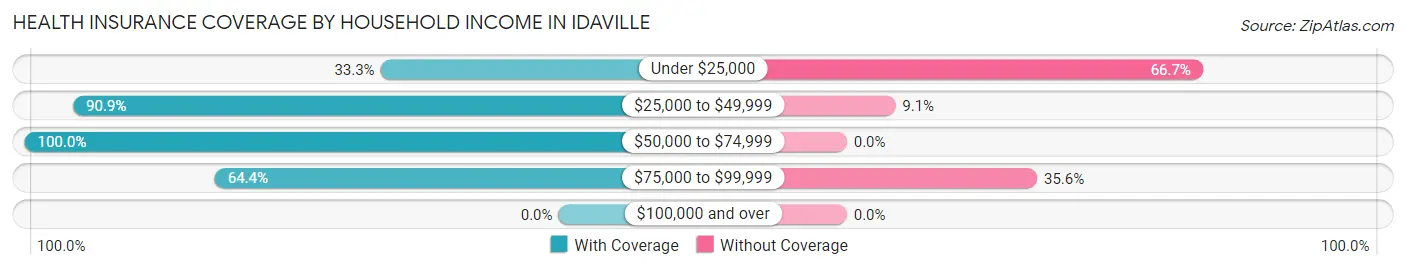
| Household Income | With Coverage | Without Coverage |
| Under $25,000 | 17 (33.3%) | 34 (66.7%) |
| $25,000 to $49,999 | 100 (90.9%) | 10 (9.1%) |
| $50,000 to $74,999 | 70 (100.0%) | 0 (0.0%) |
| $75,000 to $99,999 | 65 (64.4%) | 36 (35.6%) |
| $100,000 and over | 0 (0.0%) | 0 (0.0%) |
Public vs Private Health Insurance Coverage by Age in Idaville
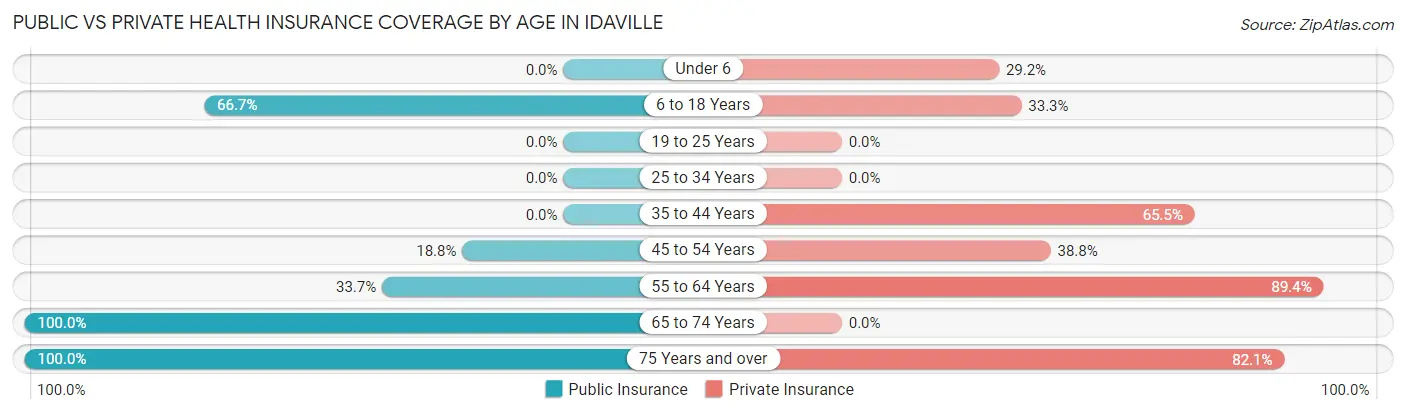
| Age Bracket | Public Insurance | Private Insurance |
| Under 6 | 0 (0.0%) | 7 (29.2%) |
| 6 to 18 Years | 24 (66.7%) | 12 (33.3%) |
| 19 to 25 Years | 0 (0.0%) | 0 (0.0%) |
| 25 to 34 Years | 0 (0.0%) | 0 (0.0%) |
| 35 to 44 Years | 0 (0.0%) | 19 (65.5%) |
| 45 to 54 Years | 15 (18.8%) | 31 (38.8%) |
| 55 to 64 Years | 35 (33.7%) | 93 (89.4%) |
| 65 to 74 Years | 12 (100.0%) | 0 (0.0%) |
| 75 Years and over | 28 (100.0%) | 23 (82.1%) |
| Total | 114 (34.3%) | 185 (55.7%) |
Disability Status by Sex by Age in Idaville
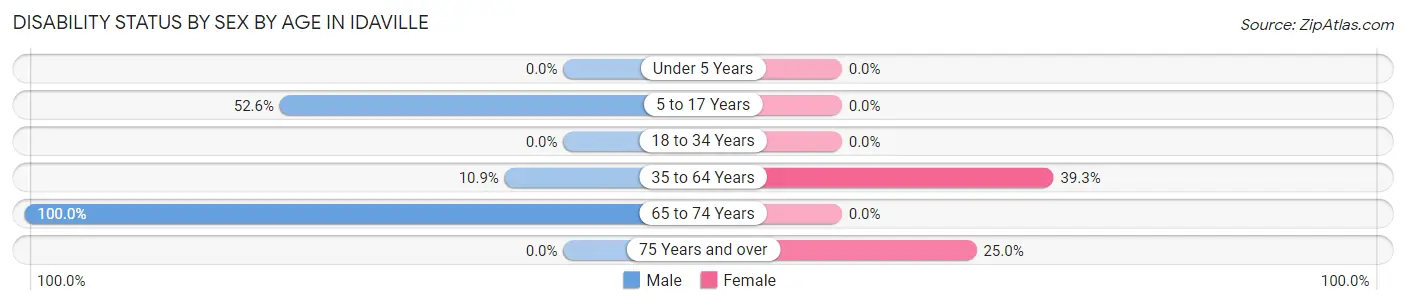
| Age Bracket | Male | Female |
| Under 5 Years | 0 (0.0%) | 0 (0.0%) |
| 5 to 17 Years | 10 (52.6%) | 0 (0.0%) |
| 18 to 34 Years | 0 (0.0%) | 0 (0.0%) |
| 35 to 64 Years | 11 (10.9%) | 44 (39.3%) |
| 65 to 74 Years | 6 (100.0%) | 0 (0.0%) |
| 75 Years and over | 0 (0.0%) | 7 (25.0%) |
Disability Class by Sex by Age in Idaville
Disability Class: Hearing Difficulty
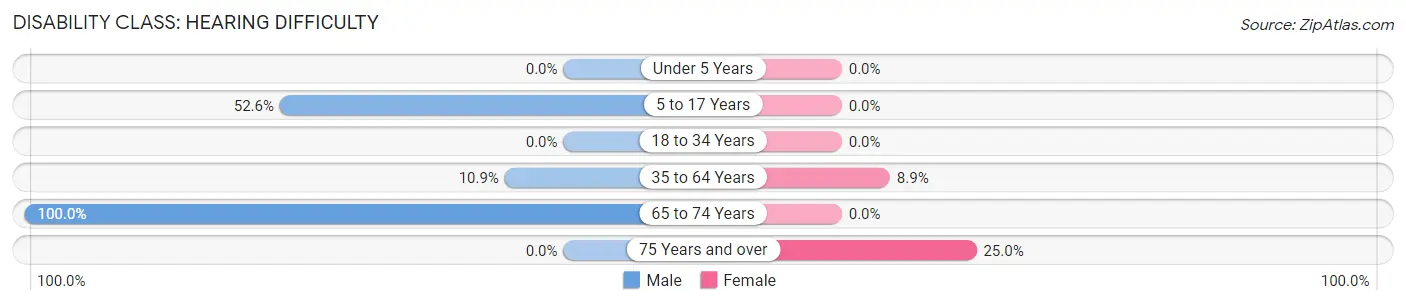
| Age Bracket | Male | Female |
| Under 5 Years | 0 (0.0%) | 0 (0.0%) |
| 5 to 17 Years | 10 (52.6%) | 0 (0.0%) |
| 18 to 34 Years | 0 (0.0%) | 0 (0.0%) |
| 35 to 64 Years | 11 (10.9%) | 10 (8.9%) |
| 65 to 74 Years | 6 (100.0%) | 0 (0.0%) |
| 75 Years and over | 0 (0.0%) | 7 (25.0%) |
Disability Class: Vision Difficulty
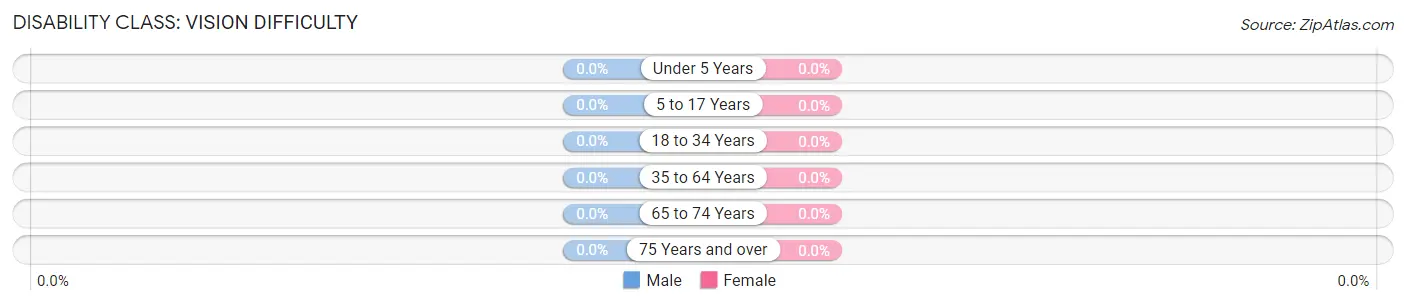
| Age Bracket | Male | Female |
| Under 5 Years | 0 (0.0%) | 0 (0.0%) |
| 5 to 17 Years | 0 (0.0%) | 0 (0.0%) |
| 18 to 34 Years | 0 (0.0%) | 0 (0.0%) |
| 35 to 64 Years | 0 (0.0%) | 0 (0.0%) |
| 65 to 74 Years | 0 (0.0%) | 0 (0.0%) |
| 75 Years and over | 0 (0.0%) | 0 (0.0%) |
Disability Class: Cognitive Difficulty
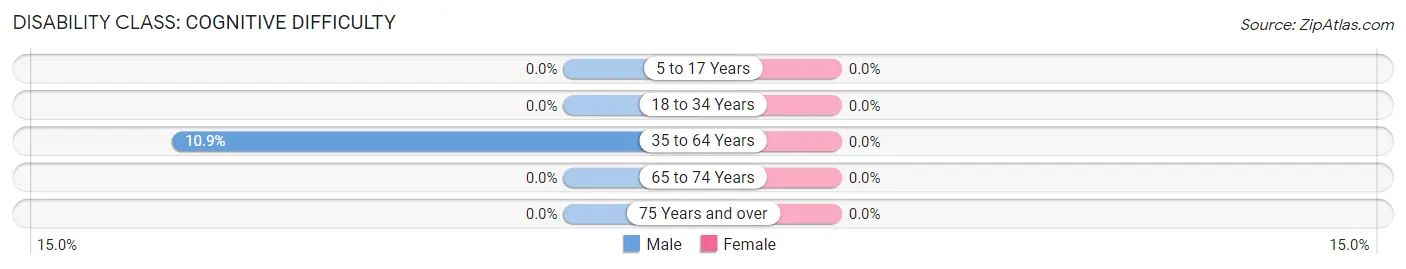
| Age Bracket | Male | Female |
| 5 to 17 Years | 0 (0.0%) | 0 (0.0%) |
| 18 to 34 Years | 0 (0.0%) | 0 (0.0%) |
| 35 to 64 Years | 11 (10.9%) | 0 (0.0%) |
| 65 to 74 Years | 0 (0.0%) | 0 (0.0%) |
| 75 Years and over | 0 (0.0%) | 0 (0.0%) |
Disability Class: Ambulatory Difficulty
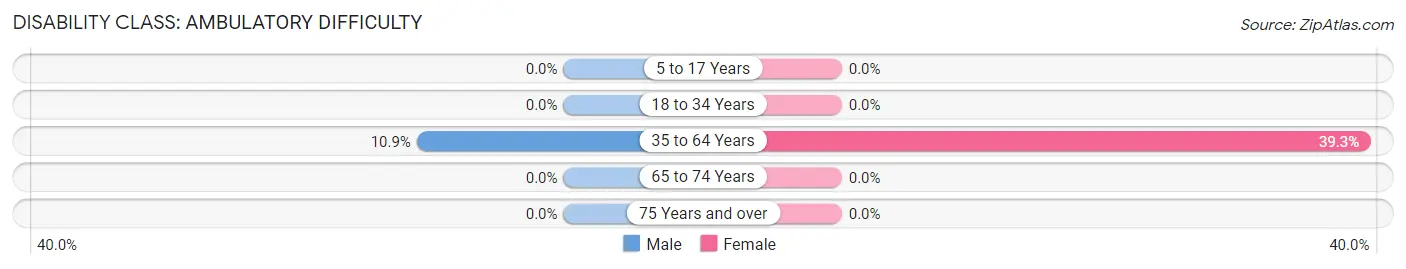
| Age Bracket | Male | Female |
| 5 to 17 Years | 0 (0.0%) | 0 (0.0%) |
| 18 to 34 Years | 0 (0.0%) | 0 (0.0%) |
| 35 to 64 Years | 11 (10.9%) | 44 (39.3%) |
| 65 to 74 Years | 0 (0.0%) | 0 (0.0%) |
| 75 Years and over | 0 (0.0%) | 0 (0.0%) |
Disability Class: Self-Care Difficulty
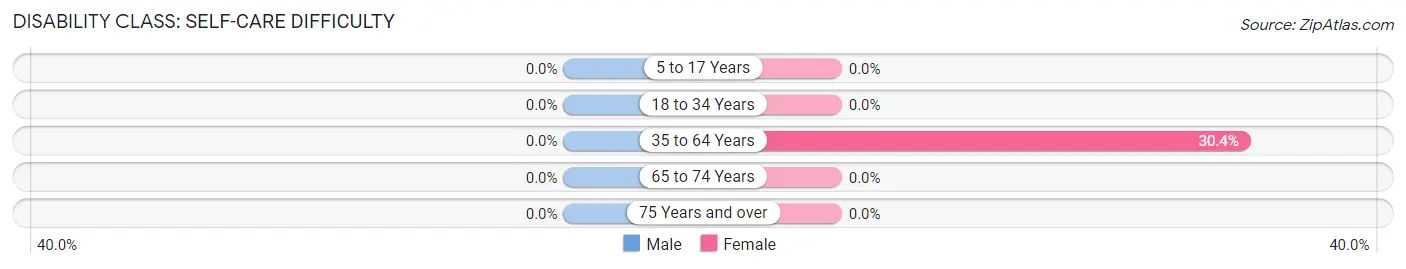
| Age Bracket | Male | Female |
| 5 to 17 Years | 0 (0.0%) | 0 (0.0%) |
| 18 to 34 Years | 0 (0.0%) | 0 (0.0%) |
| 35 to 64 Years | 0 (0.0%) | 34 (30.4%) |
| 65 to 74 Years | 0 (0.0%) | 0 (0.0%) |
| 75 Years and over | 0 (0.0%) | 0 (0.0%) |
Technology Access in Idaville
Computing Device Access in Idaville
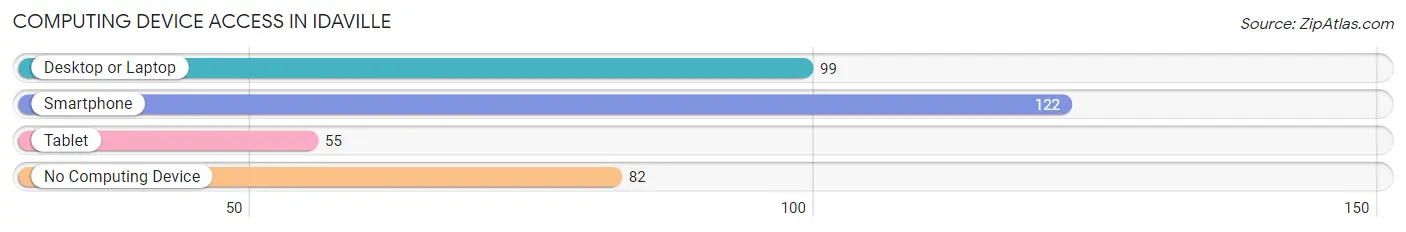
| Device Type | # Households | % Households |
| Desktop or Laptop | 99 | 48.5% |
| Smartphone | 122 | 59.8% |
| Tablet | 55 | 27.0% |
| No Computing Device | 82 | 40.2% |
| Total | 204 | 100.0% |
Internet Access in Idaville
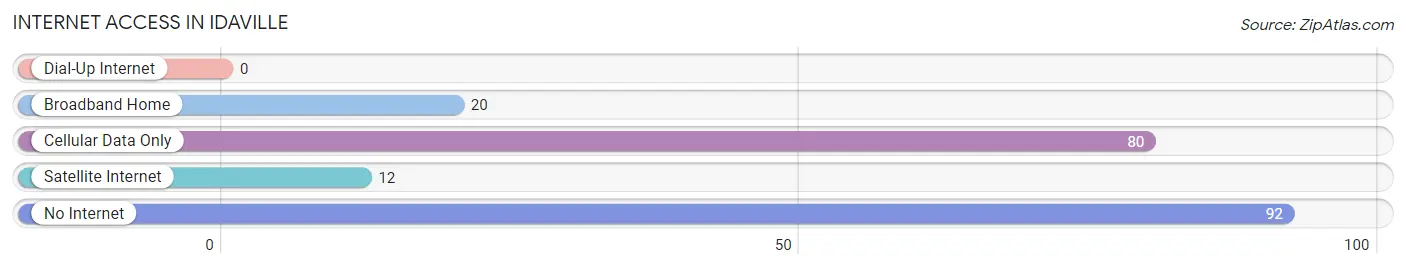
| Internet Type | # Households | % Households |
| Dial-Up Internet | 0 | 0.0% |
| Broadband Home | 20 | 9.8% |
| Cellular Data Only | 80 | 39.2% |
| Satellite Internet | 12 | 5.9% |
| No Internet | 92 | 45.1% |
| Total | 204 | 100.0% |
Idaville Summary
Idaville, Indiana is a small town located in White County, Indiana. It is situated in the northwest corner of the state, just south of the Illinois border. The town was founded in 1837 and has a population of approximately 1,000 people.
Idaville is located in the Tippecanoe River Valley, which is part of the Wabash Valley. The town is situated on the banks of the Tippecanoe River, which is a tributary of the Wabash River. The town is surrounded by rolling hills and farmland, and is home to a variety of wildlife.
Idaville is a rural community with a strong agricultural heritage. The town is home to several farms, including dairy, beef, and poultry farms. The town is also home to a variety of small businesses, including a grocery store, a hardware store, and a few restaurants.
The town is served by the Idaville Community School Corporation, which consists of two elementary schools, a middle school, and a high school. The town is also home to a branch of the White County Public Library.
Idaville is a predominantly white community, with a population that is approximately 95% white. The median household income in Idaville is $41,000, which is slightly lower than the median household income for the state of Indiana. The town has a poverty rate of approximately 10%, which is slightly higher than the state average.
Idaville is a small town with a rich history. The town was founded in 1837 by a group of settlers from Ohio. The town was named after the daughter of one of the settlers, Ida. The town was originally a farming community, and the settlers grew a variety of crops, including corn, wheat, and oats.
The town was also home to a variety of industries, including a sawmill, a gristmill, and a woolen mill. The town was also home to a variety of churches, including the Methodist Episcopal Church, the Presbyterian Church, and the United Brethren Church.
Idaville is a small town with a strong sense of community. The town is home to a variety of civic organizations, including the Idaville Lions Club, the Idaville Historical Society, and the Idaville Chamber of Commerce. The town also hosts a variety of annual events, including the Idaville Fall Festival and the Idaville Christmas Parade.
Idaville is a small town with a lot to offer. The town is home to a variety of businesses, churches, and civic organizations, and is a great place to live and raise a family. The town is also home to a variety of wildlife, and is a great place to explore the outdoors. Idaville is a great place to call home.
Common Questions
What is Per Capita Income in Idaville?
Per Capita income in Idaville is $28,559.
What is the Median Family Income in Idaville?
Median Family Income in Idaville is $56,042.
What is the Median Household income in Idaville?
Median Household Income in Idaville is $46,304.
What is Income or Wage Gap in Idaville?
Income or Wage Gap in Idaville is 1.8%.
Women in Idaville earn 98.2 cents for every dollar earned by a man.
What is Inequality or Gini Index in Idaville?
Inequality or Gini Index in Idaville is 0.35.
What is the Total Population of Idaville?
Total Population of Idaville is 332.
What is the Total Male Population of Idaville?
Total Male Population of Idaville is 147.
What is the Total Female Population of Idaville?
Total Female Population of Idaville is 185.
What is the Ratio of Males per 100 Females in Idaville?
There are 79.46 Males per 100 Females in Idaville.
What is the Ratio of Females per 100 Males in Idaville?
There are 125.85 Females per 100 Males in Idaville.
What is the Median Population Age in Idaville?
Median Population Age in Idaville is 51.1 Years.
What is the Average Family Size in Idaville
Average Family Size in Idaville is 2.5 People.
What is the Average Household Size in Idaville
Average Household Size in Idaville is 1.6 People.
How Large is the Labor Force in Idaville?
There are 165 People in the Labor Forcein in Idaville.
What is the Percentage of People in the Labor Force in Idaville?
58.1% of People are in the Labor Force in Idaville.