Zip Codes with the Highest Percentage of Population Employed in Life, Physical & Social Science in Muncie, IN
RELATED REPORTS & OPTIONS
Life, Physical & Social Science
Muncie
Compare Zip Codes
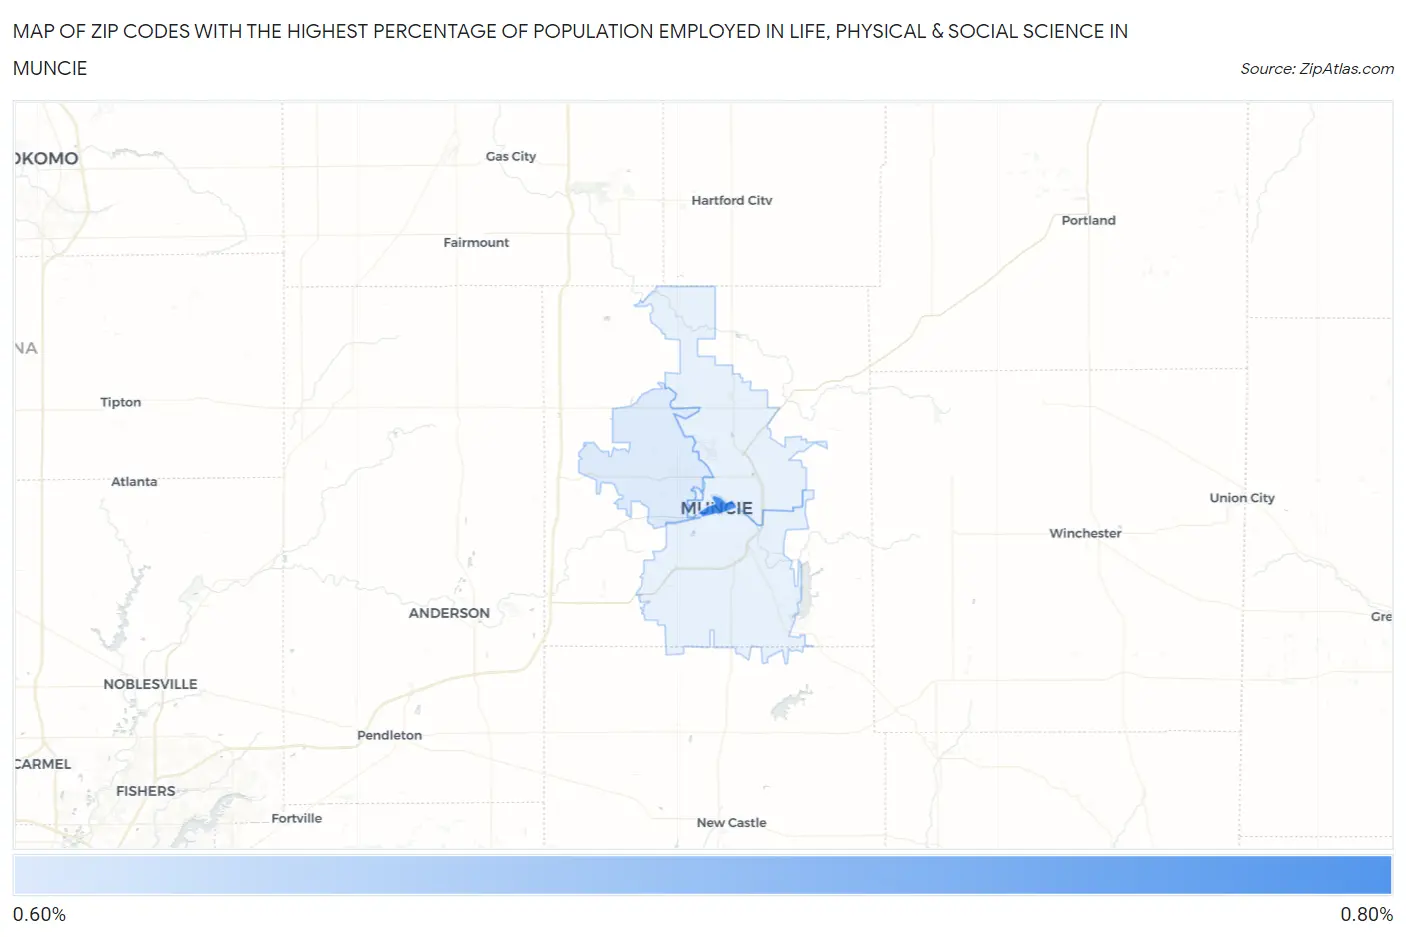
Map of Zip Codes with the Highest Percentage of Population Employed in Life, Physical & Social Science in Muncie
0.64%
0.77%
Zip Codes with the Highest Percentage of Population Employed in Life, Physical & Social Science in Muncie, IN
| Zip Code | % Employed | vs State | vs National | |
| 1. | 47305 | 0.77% | 0.83%(-0.061)#186 | 1.1%(-0.321)#11,309 |
| 2. | 47304 | 0.64% | 0.83%(-0.189)#224 | 1.1%(-0.449)#12,750 |
1
Common Questions
What are the Top 3 Zip Codes with the Highest Percentage of Population Employed in Life, Physical & Social Science in Muncie, IN?
Top 3 Zip Codes with the Highest Percentage of Population Employed in Life, Physical & Social Science in Muncie, IN are:
What zip code has the Highest Percentage of Population Employed in Life, Physical & Social Science in Muncie, IN?
47305 has the Highest Percentage of Population Employed in Life, Physical & Social Science in Muncie, IN with 0.77%.
What is the Percentage of Population Employed in Life, Physical & Social Science in Muncie, IN?
Percentage of Population Employed in Life, Physical & Social Science in Muncie is 0.14%.
What is the Percentage of Population Employed in Life, Physical & Social Science in Indiana?
Percentage of Population Employed in Life, Physical & Social Science in Indiana is 0.83%.
What is the Percentage of Population Employed in Life, Physical & Social Science in the United States?
Percentage of Population Employed in Life, Physical & Social Science in the United States is 1.1%.