New Whiteland, IN Map & Demographics
New Whiteland Map
New Whiteland Overview
$30,125
PER CAPITA INCOME
$86,250
AVG FAMILY INCOME
$83,958
AVG HOUSEHOLD INCOME
12.1%
WAGE / INCOME GAP [ % ]
87.9¢/ $1
WAGE / INCOME GAP [ $ ]
0.27
INEQUALITY / GINI INDEX
5,591
TOTAL POPULATION
2,814
MALE POPULATION
2,777
FEMALE POPULATION
101.33
MALES / 100 FEMALES
98.69
FEMALES / 100 MALES
38.3
MEDIAN AGE
3.1
AVG FAMILY SIZE
2.8
AVG HOUSEHOLD SIZE
2,823
LABOR FORCE [ PEOPLE ]
64.3%
PERCENT IN LABOR FORCE
1.2%
UNEMPLOYMENT RATE
New Whiteland Area Codes
Income in New Whiteland
Income Overview in New Whiteland
Per Capita Income in New Whiteland is $30,125, while median incomes of families and households are $86,250 and $83,958 respectively.
| Characteristic | Number | Measure |
| Per Capita Income | 5,591 | $30,125 |
| Median Family Income | 1,482 | $86,250 |
| Mean Family Income | 1,482 | $87,550 |
| Median Household Income | 1,977 | $83,958 |
| Mean Household Income | 1,977 | $83,149 |
| Income Deficit | 1,482 | $0 |
| Wage / Income Gap (%) | 5,591 | 12.15% |
| Wage / Income Gap ($) | 5,591 | 87.85¢ per $1 |
| Gini / Inequality Index | 5,591 | 0.27 |
Earnings by Sex in New Whiteland
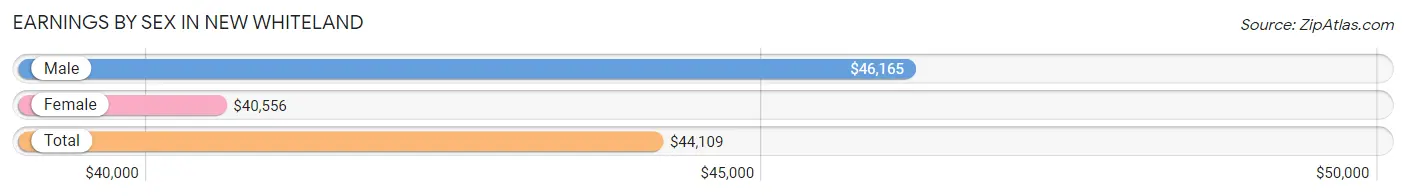
Average Earnings in New Whiteland are $44,109, $46,165 for men and $40,556 for women, a difference of 12.1%.
| Sex | Number | Average Earnings |
| Male | 1,664 (54.0%) | $46,165 |
| Female | 1,420 (46.0%) | $40,556 |
| Total | 3,084 (100.0%) | $44,109 |
Earnings by Sex by Income Bracket in New Whiteland
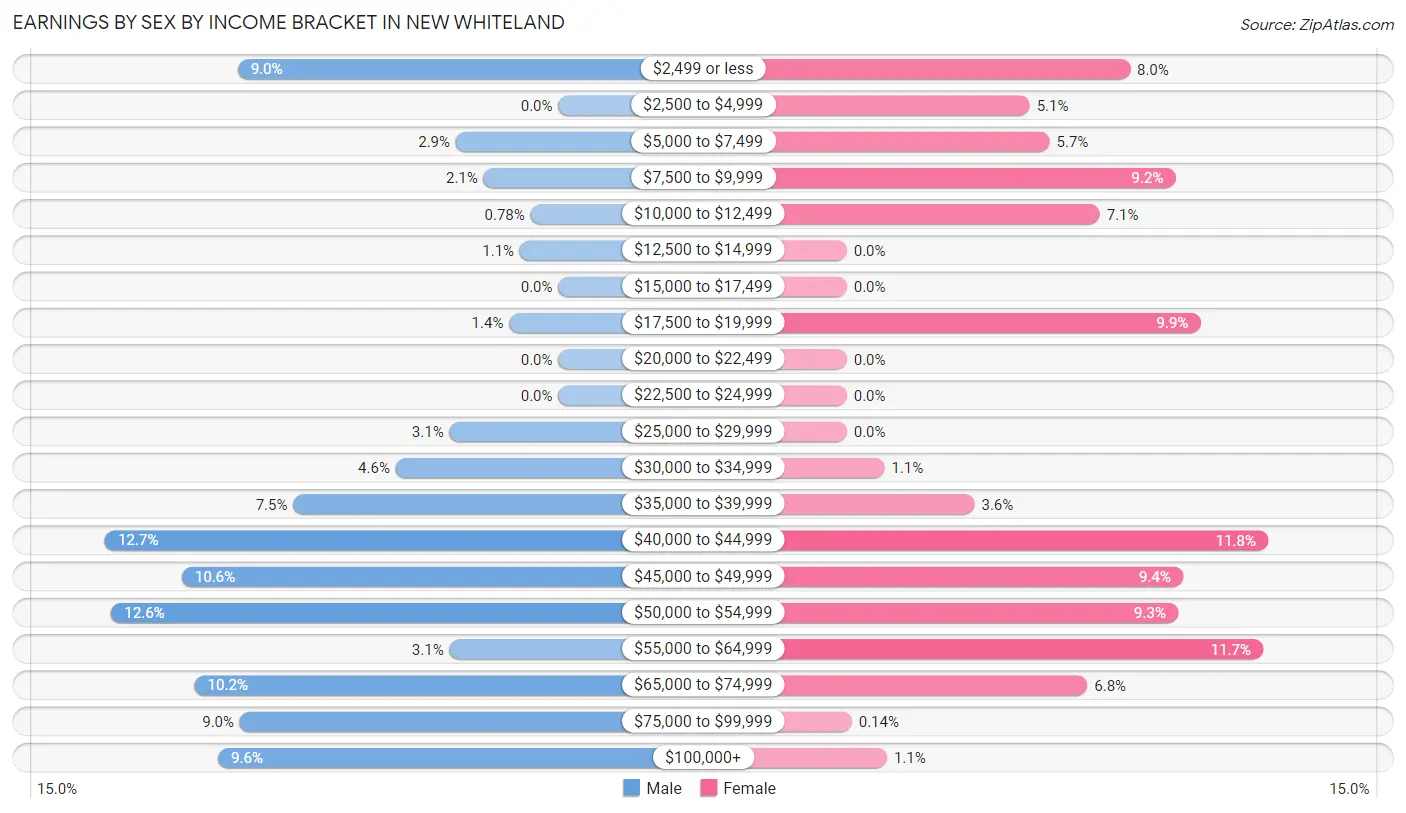
The most common earnings brackets in New Whiteland are $40,000 to $44,999 for men (212 | 12.7%) and $40,000 to $44,999 for women (168 | 11.8%).
| Income | Male | Female |
| $2,499 or less | 150 (9.0%) | 113 (8.0%) |
| $2,500 to $4,999 | 0 (0.0%) | 73 (5.1%) |
| $5,000 to $7,499 | 48 (2.9%) | 81 (5.7%) |
| $7,500 to $9,999 | 35 (2.1%) | 131 (9.2%) |
| $10,000 to $12,499 | 13 (0.8%) | 101 (7.1%) |
| $12,500 to $14,999 | 18 (1.1%) | 0 (0.0%) |
| $15,000 to $17,499 | 0 (0.0%) | 0 (0.0%) |
| $17,500 to $19,999 | 23 (1.4%) | 141 (9.9%) |
| $20,000 to $22,499 | 0 (0.0%) | 0 (0.0%) |
| $22,500 to $24,999 | 0 (0.0%) | 0 (0.0%) |
| $25,000 to $29,999 | 51 (3.1%) | 0 (0.0%) |
| $30,000 to $34,999 | 76 (4.6%) | 15 (1.1%) |
| $35,000 to $39,999 | 124 (7.4%) | 51 (3.6%) |
| $40,000 to $44,999 | 212 (12.7%) | 168 (11.8%) |
| $45,000 to $49,999 | 176 (10.6%) | 134 (9.4%) |
| $50,000 to $54,999 | 209 (12.6%) | 132 (9.3%) |
| $55,000 to $64,999 | 51 (3.1%) | 166 (11.7%) |
| $65,000 to $74,999 | 170 (10.2%) | 96 (6.8%) |
| $75,000 to $99,999 | 149 (8.9%) | 2 (0.1%) |
| $100,000+ | 159 (9.6%) | 16 (1.1%) |
| Total | 1,664 (100.0%) | 1,420 (100.0%) |
Earnings by Sex by Educational Attainment in New Whiteland
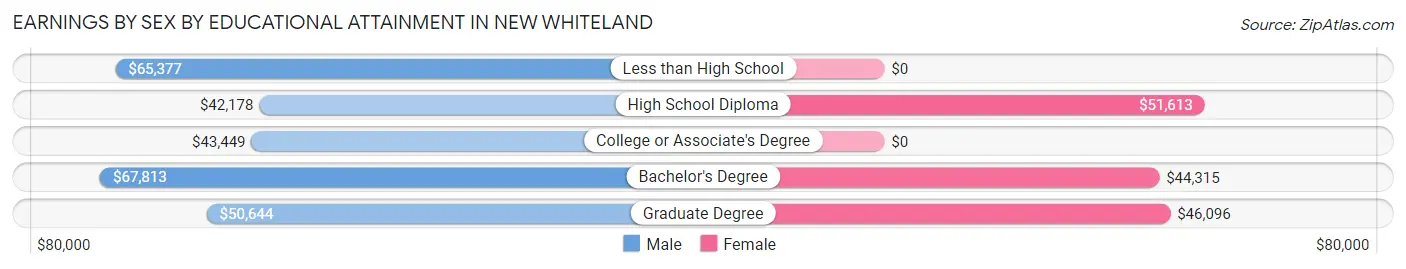
Average earnings in New Whiteland are $50,480 for men and $43,625 for women, a difference of 13.6%. Men with an educational attainment of bachelor's degree enjoy the highest average annual earnings of $67,813, while those with high school diploma education earn the least with $42,178. Women with an educational attainment of high school diploma earn the most with the average annual earnings of $51,613, while those with bachelor's degree education have the smallest earnings of $44,315.
| Educational Attainment | Male Income | Female Income |
| Less than High School | $65,377 | $0 |
| High School Diploma | $42,178 | $51,613 |
| College or Associate's Degree | $43,449 | $0 |
| Bachelor's Degree | $67,813 | $44,315 |
| Graduate Degree | $50,644 | $46,096 |
| Total | $50,480 | $43,625 |
Family Income in New Whiteland
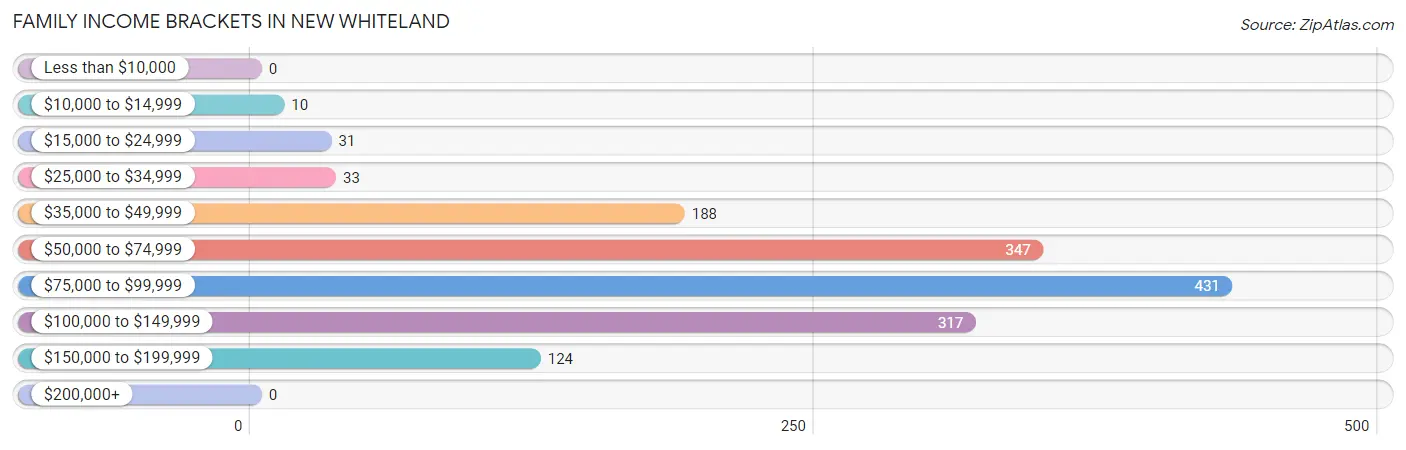
Family Income Brackets in New Whiteland
According to the New Whiteland family income data, there are 431 families falling into the $75,000 to $99,999 income range, which is the most common income bracket and makes up 29.1% of all families.
| Income Bracket | # Families | % Families |
| Less than $10,000 | 0 | 0.0% |
| $10,000 to $14,999 | 10 | 0.7% |
| $15,000 to $24,999 | 31 | 2.1% |
| $25,000 to $34,999 | 33 | 2.2% |
| $35,000 to $49,999 | 188 | 12.7% |
| $50,000 to $74,999 | 347 | 23.4% |
| $75,000 to $99,999 | 431 | 29.1% |
| $100,000 to $149,999 | 317 | 21.4% |
| $150,000 to $199,999 | 124 | 8.4% |
| $200,000+ | 0 | 0.0% |
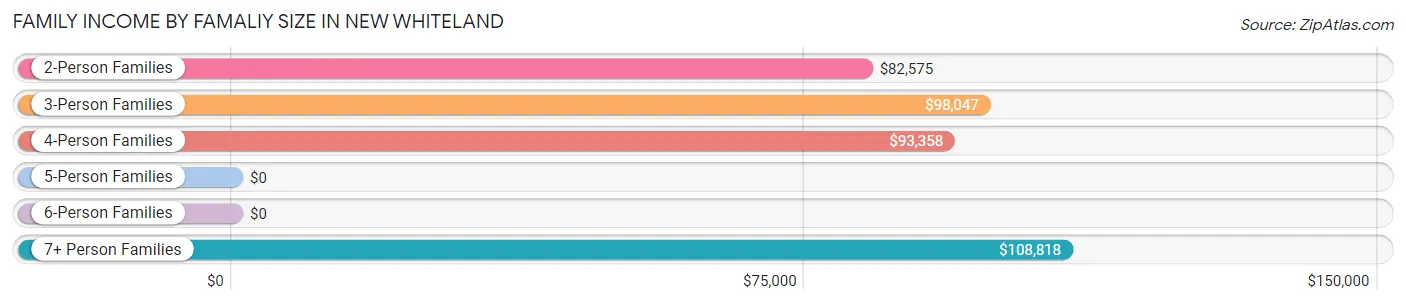
Family Income by Famaliy Size in New Whiteland
7+ person families (112 | 7.6%) account for the highest median family income in New Whiteland with $108,818 per family, while 2-person families (725 | 48.9%) have the highest median income of $41,288 per family member.
| Income Bracket | # Families | Median Income |
| 2-Person Families | 725 (48.9%) | $82,575 |
| 3-Person Families | 303 (20.4%) | $98,047 |
| 4-Person Families | 234 (15.8%) | $93,358 |
| 5-Person Families | 77 (5.2%) | $0 |
| 6-Person Families | 31 (2.1%) | $0 |
| 7+ Person Families | 112 (7.6%) | $108,818 |
| Total | 1,482 (100.0%) | $86,250 |
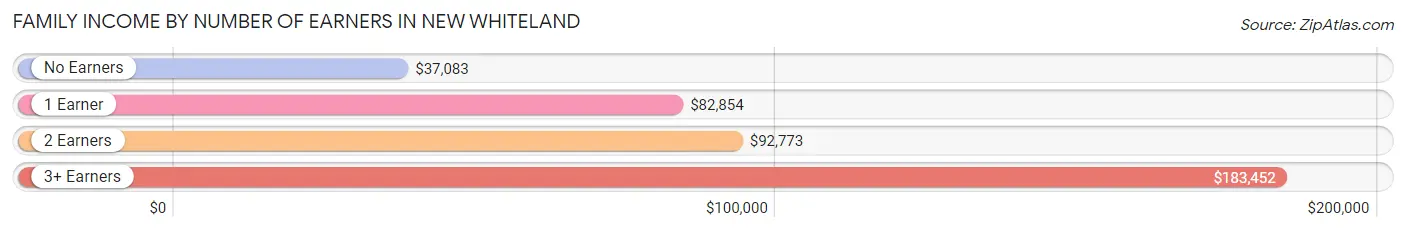
Family Income by Number of Earners in New Whiteland
The median family income in New Whiteland is $86,250, with families comprising 3+ earners (138) having the highest median family income of $183,452, while families with no earners (178) have the lowest median family income of $37,083, accounting for 9.3% and 12.0% of families, respectively.
| Number of Earners | # Families | Median Income |
| No Earners | 178 (12.0%) | $37,083 |
| 1 Earner | 557 (37.6%) | $82,854 |
| 2 Earners | 609 (41.1%) | $92,773 |
| 3+ Earners | 138 (9.3%) | $183,452 |
| Total | 1,482 (100.0%) | $86,250 |
Household Income in New Whiteland
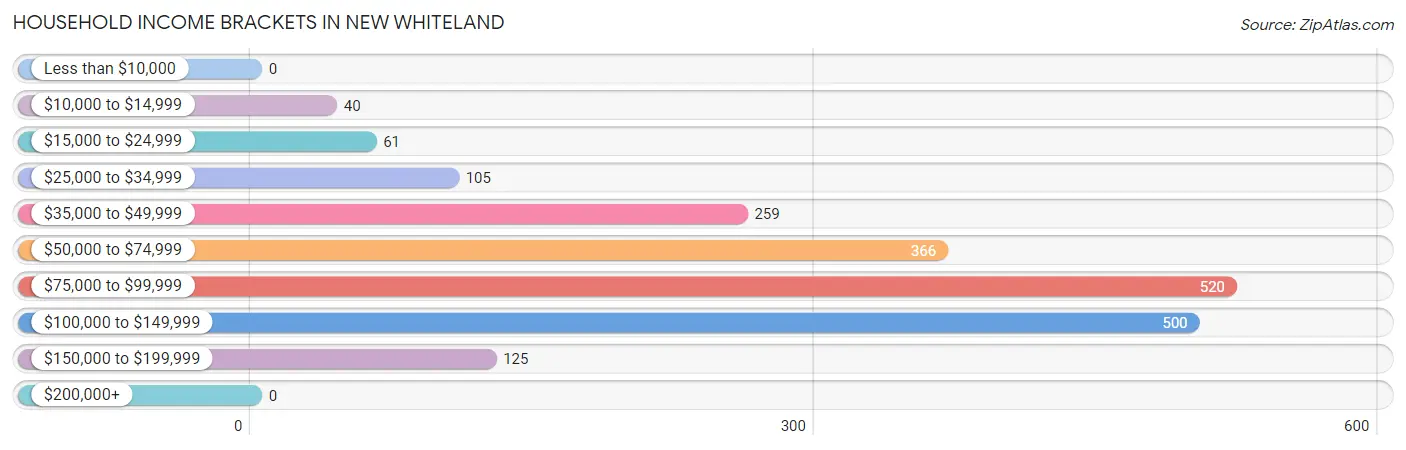
Household Income Brackets in New Whiteland
With 520 households falling in the category, the $75,000 to $99,999 income range is the most frequent in New Whiteland, accounting for 26.3% of all households.
| Income Bracket | # Households | % Households |
| Less than $10,000 | 0 | 0.0% |
| $10,000 to $14,999 | 40 | 2.0% |
| $15,000 to $24,999 | 61 | 3.1% |
| $25,000 to $34,999 | 105 | 5.3% |
| $35,000 to $49,999 | 259 | 13.1% |
| $50,000 to $74,999 | 366 | 18.5% |
| $75,000 to $99,999 | 520 | 26.3% |
| $100,000 to $149,999 | 500 | 25.3% |
| $150,000 to $199,999 | 125 | 6.3% |
| $200,000+ | 0 | 0.0% |
Household Income by Householder Age in New Whiteland
The median household income in New Whiteland is $83,958, with the highest median household income of $93,565 found in the 45 to 64 years age bracket for the primary householder. A total of 727 households (36.8%) fall into this category. Meanwhile, the 15 to 24 years age bracket for the primary householder has the lowest median household income of $0, with 59 households (3.0%) in this group.
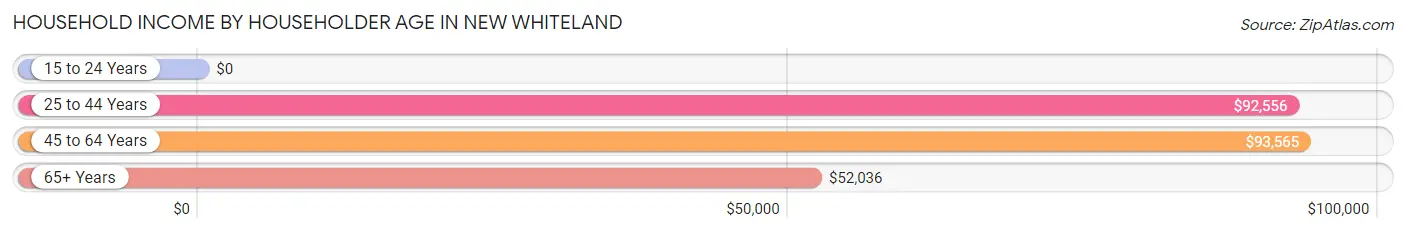
| Income Bracket | # Households | Median Income |
| 15 to 24 Years | 59 (3.0%) | $0 |
| 25 to 44 Years | 654 (33.1%) | $92,556 |
| 45 to 64 Years | 727 (36.8%) | $93,565 |
| 65+ Years | 537 (27.2%) | $52,036 |
| Total | 1,977 (100.0%) | $83,958 |
Poverty in New Whiteland
Income Below Poverty by Sex and Age in New Whiteland
With 3.4% poverty level for males and 11.6% for females among the residents of New Whiteland, 6 to 11 year old males and 18 to 24 year old females are the most vulnerable to poverty, with 59 males (34.1%) and 75 females (41.7%) in their respective age groups living below the poverty level.
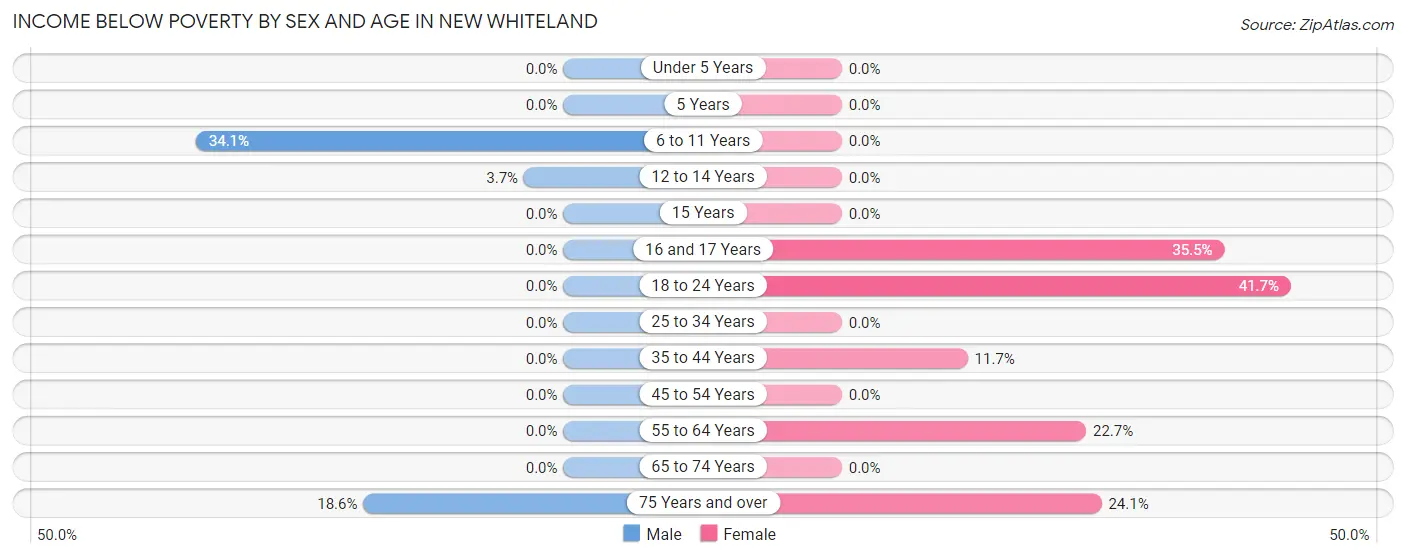
| Age Bracket | Male | Female |
| Under 5 Years | 0 (0.0%) | 0 (0.0%) |
| 5 Years | 0 (0.0%) | 0 (0.0%) |
| 6 to 11 Years | 59 (34.1%) | 0 (0.0%) |
| 12 to 14 Years | 10 (3.7%) | 0 (0.0%) |
| 15 Years | 0 (0.0%) | 0 (0.0%) |
| 16 and 17 Years | 0 (0.0%) | 38 (35.5%) |
| 18 to 24 Years | 0 (0.0%) | 75 (41.7%) |
| 25 to 34 Years | 0 (0.0%) | 0 (0.0%) |
| 35 to 44 Years | 0 (0.0%) | 48 (11.7%) |
| 45 to 54 Years | 0 (0.0%) | 0 (0.0%) |
| 55 to 64 Years | 0 (0.0%) | 102 (22.7%) |
| 65 to 74 Years | 0 (0.0%) | 0 (0.0%) |
| 75 Years and over | 26 (18.6%) | 60 (24.1%) |
| Total | 95 (3.4%) | 323 (11.6%) |
Income Above Poverty by Sex and Age in New Whiteland
According to the poverty statistics in New Whiteland, males aged under 5 years and females aged under 5 years are the age groups that are most secure financially, with 100.0% of males and 100.0% of females in these age groups living above the poverty line.
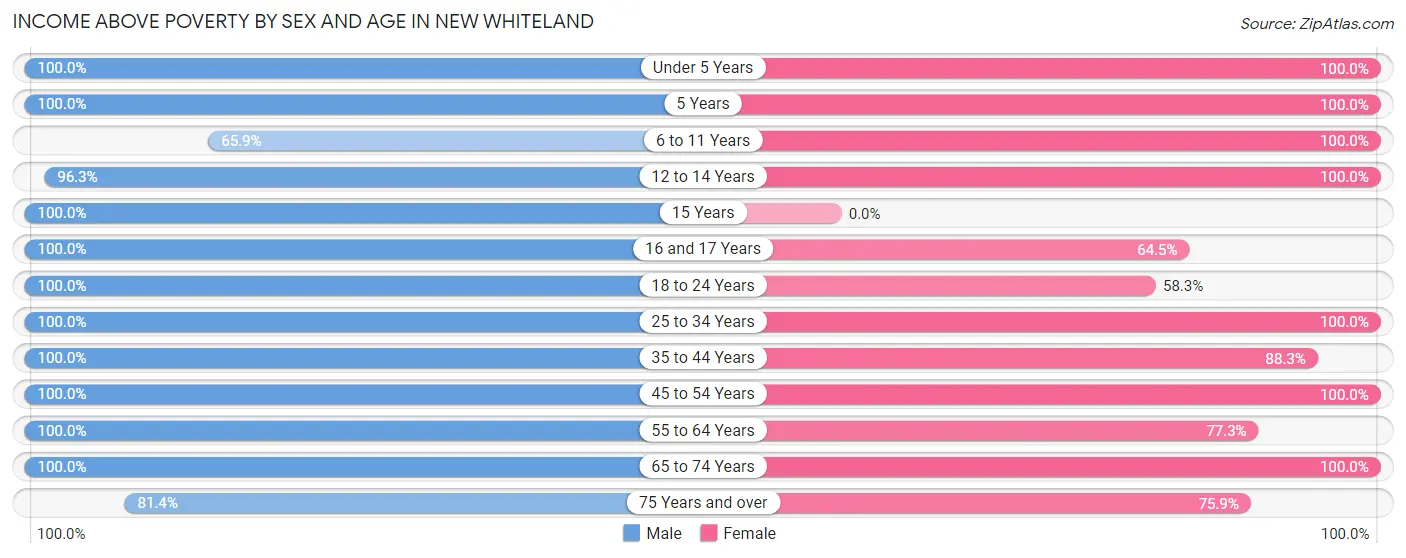
| Age Bracket | Male | Female |
| Under 5 Years | 178 (100.0%) | 183 (100.0%) |
| 5 Years | 30 (100.0%) | 154 (100.0%) |
| 6 to 11 Years | 114 (65.9%) | 76 (100.0%) |
| 12 to 14 Years | 263 (96.3%) | 98 (100.0%) |
| 15 Years | 36 (100.0%) | 0 (0.0%) |
| 16 and 17 Years | 124 (100.0%) | 69 (64.5%) |
| 18 to 24 Years | 276 (100.0%) | 105 (58.3%) |
| 25 to 34 Years | 451 (100.0%) | 349 (100.0%) |
| 35 to 44 Years | 254 (100.0%) | 363 (88.3%) |
| 45 to 54 Years | 282 (100.0%) | 292 (100.0%) |
| 55 to 64 Years | 269 (100.0%) | 348 (77.3%) |
| 65 to 74 Years | 328 (100.0%) | 228 (100.0%) |
| 75 Years and over | 114 (81.4%) | 189 (75.9%) |
| Total | 2,719 (96.6%) | 2,454 (88.4%) |
Income Below Poverty Among Married-Couple Families in New Whiteland
The poverty statistics for married-couple families in New Whiteland show that 2.5% or 30 of the total 1,203 families live below the poverty line. Families with 1 or 2 children have the highest poverty rate of 8.2%, comprising of 30 families. On the other hand, families with no children have the lowest poverty rate of 0.0%, which includes 0 families.
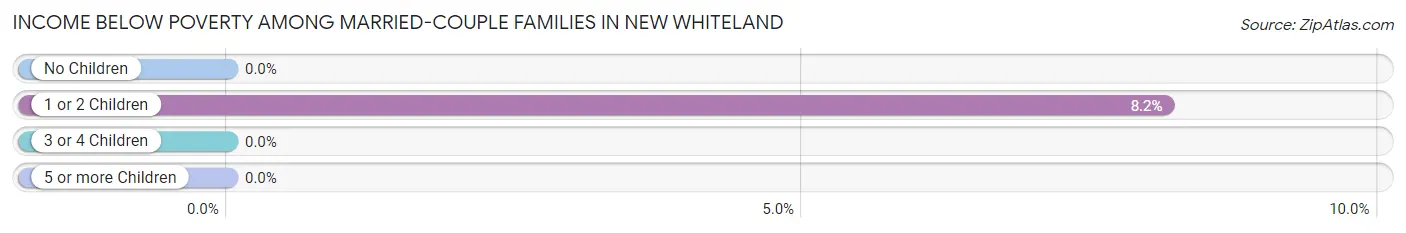
| Children | Above Poverty | Below Poverty |
| No Children | 676 (100.0%) | 0 (0.0%) |
| 1 or 2 Children | 338 (91.8%) | 30 (8.2%) |
| 3 or 4 Children | 104 (100.0%) | 0 (0.0%) |
| 5 or more Children | 55 (100.0%) | 0 (0.0%) |
| Total | 1,173 (97.5%) | 30 (2.5%) |
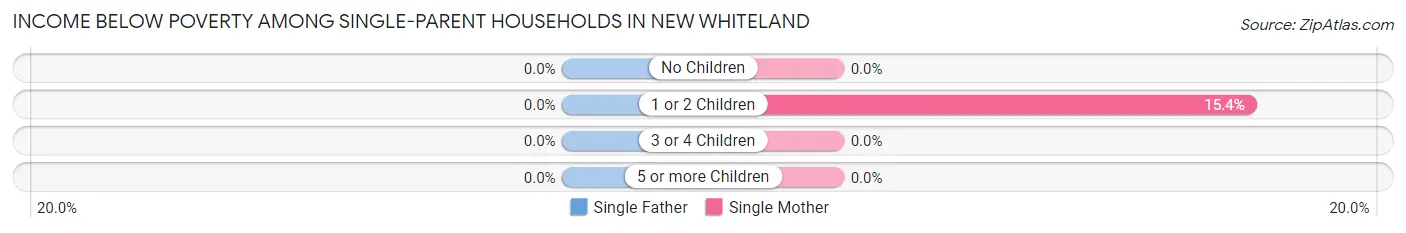
Income Below Poverty Among Single-Parent Households in New Whiteland
| Children | Single Father | Single Mother |
| No Children | 0 (0.0%) | 0 (0.0%) |
| 1 or 2 Children | 0 (0.0%) | 10 (15.4%) |
| 3 or 4 Children | 0 (0.0%) | 0 (0.0%) |
| 5 or more Children | 0 (0.0%) | 0 (0.0%) |
| Total | 0 (0.0%) | 10 (4.6%) |
Income Below Poverty Among Married-Couple vs Single-Parent Households in New Whiteland
The poverty data for New Whiteland shows that 30 of the married-couple family households (2.5%) and 10 of the single-parent households (3.6%) are living below the poverty level. Within the married-couple family households, those with 1 or 2 children have the highest poverty rate, with 30 households (8.2%) falling below the poverty line. Among the single-parent households, those with 1 or 2 children have the highest poverty rate, with 10 household (7.7%) living below poverty.
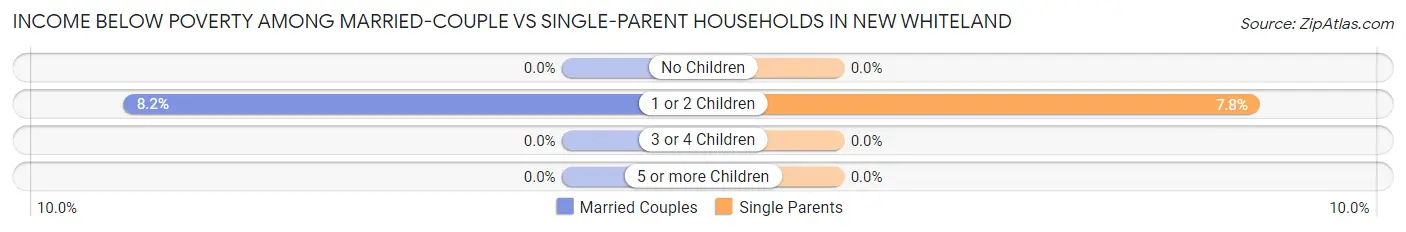
| Children | Married-Couple Families | Single-Parent Households |
| No Children | 0 (0.0%) | 0 (0.0%) |
| 1 or 2 Children | 30 (8.2%) | 10 (7.7%) |
| 3 or 4 Children | 0 (0.0%) | 0 (0.0%) |
| 5 or more Children | 0 (0.0%) | 0 (0.0%) |
| Total | 30 (2.5%) | 10 (3.6%) |
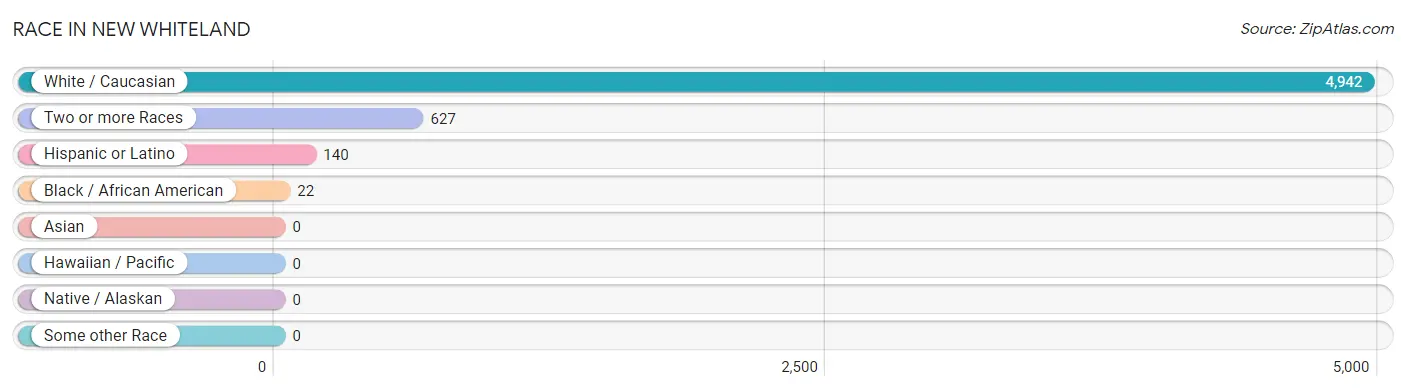
Race in New Whiteland
The most populous races in New Whiteland are White / Caucasian (4,942 | 88.4%), Two or more Races (627 | 11.2%), and Hispanic or Latino (140 | 2.5%).
| Race | # Population | % Population |
| Asian | 0 | 0.0% |
| Black / African American | 22 | 0.4% |
| Hawaiian / Pacific | 0 | 0.0% |
| Hispanic or Latino | 140 | 2.5% |
| Native / Alaskan | 0 | 0.0% |
| White / Caucasian | 4,942 | 88.4% |
| Two or more Races | 627 | 11.2% |
| Some other Race | 0 | 0.0% |
| Total | 5,591 | 100.0% |
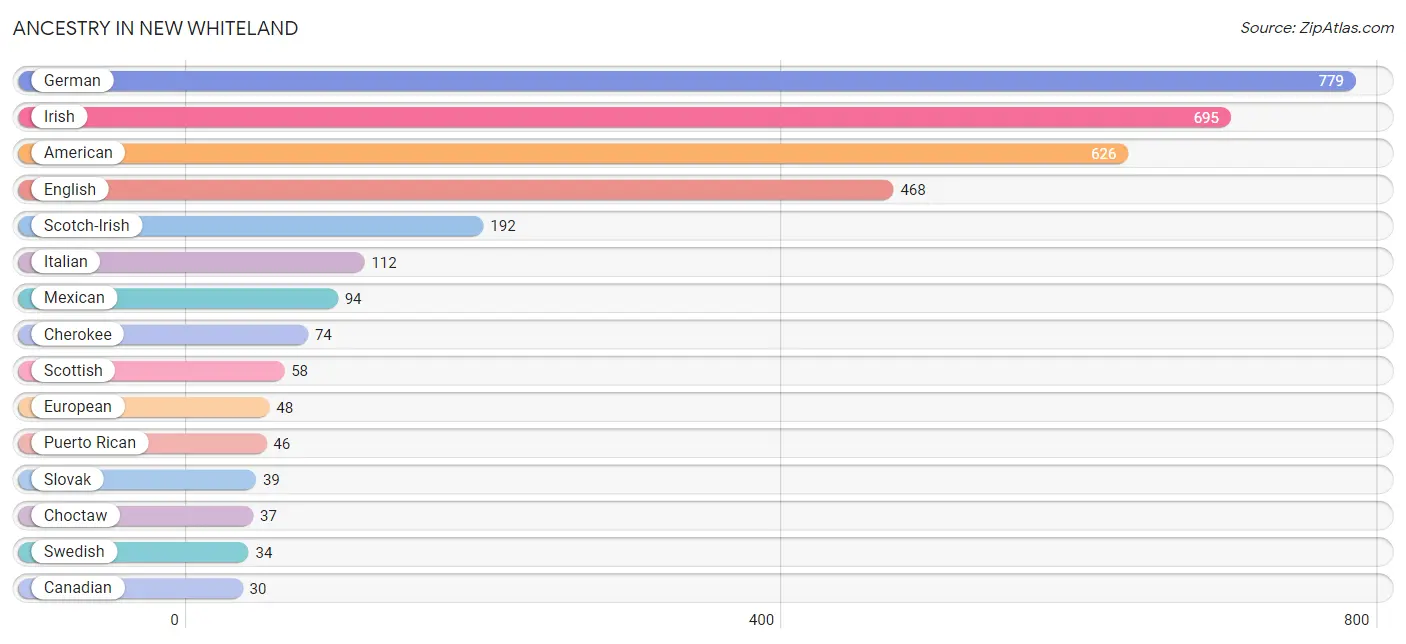
Ancestry in New Whiteland
The most populous ancestries reported in New Whiteland are German (779 | 13.9%), Irish (695 | 12.4%), American (626 | 11.2%), English (468 | 8.4%), and Scotch-Irish (192 | 3.4%), together accounting for 49.4% of all New Whiteland residents.
| Ancestry | # Population | % Population |
| American | 626 | 11.2% |
| Canadian | 30 | 0.5% |
| Cherokee | 74 | 1.3% |
| Choctaw | 37 | 0.7% |
| English | 468 | 8.4% |
| European | 48 | 0.9% |
| German | 779 | 13.9% |
| Irish | 695 | 12.4% |
| Italian | 112 | 2.0% |
| Mexican | 94 | 1.7% |
| Puerto Rican | 46 | 0.8% |
| Scotch-Irish | 192 | 3.4% |
| Scottish | 58 | 1.0% |
| Slovak | 39 | 0.7% |
| Swedish | 34 | 0.6% | View All 15 Rows |
Immigrants in New Whiteland

| Immigration Origin | # Population | % Population | View All 0 Rows |
Sex and Age in New Whiteland
Sex and Age in New Whiteland
The most populous age groups in New Whiteland are 10 to 14 Years (304 | 10.8%) for men and 25 to 29 Years (284 | 10.2%) for women.
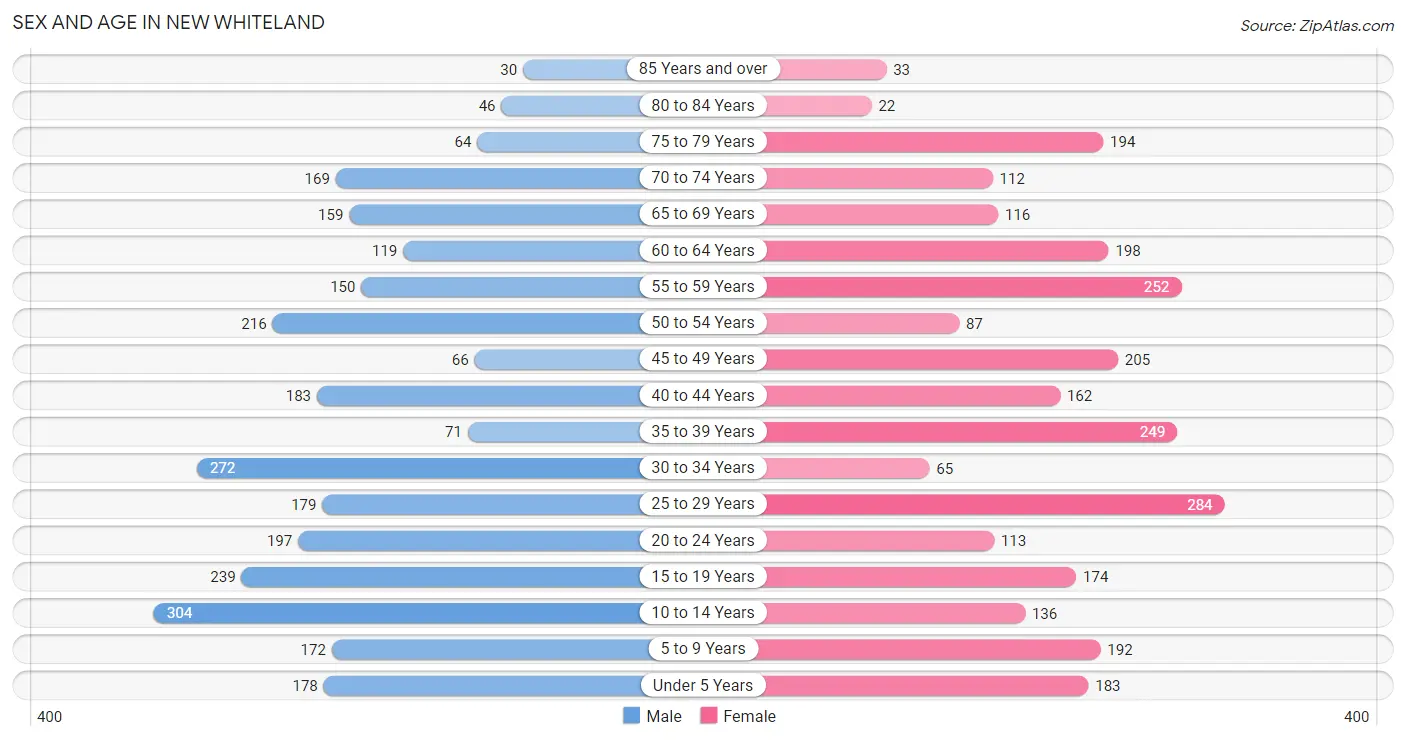
| Age Bracket | Male | Female |
| Under 5 Years | 178 (6.3%) | 183 (6.6%) |
| 5 to 9 Years | 172 (6.1%) | 192 (6.9%) |
| 10 to 14 Years | 304 (10.8%) | 136 (4.9%) |
| 15 to 19 Years | 239 (8.5%) | 174 (6.3%) |
| 20 to 24 Years | 197 (7.0%) | 113 (4.1%) |
| 25 to 29 Years | 179 (6.4%) | 284 (10.2%) |
| 30 to 34 Years | 272 (9.7%) | 65 (2.3%) |
| 35 to 39 Years | 71 (2.5%) | 249 (9.0%) |
| 40 to 44 Years | 183 (6.5%) | 162 (5.8%) |
| 45 to 49 Years | 66 (2.4%) | 205 (7.4%) |
| 50 to 54 Years | 216 (7.7%) | 87 (3.1%) |
| 55 to 59 Years | 150 (5.3%) | 252 (9.1%) |
| 60 to 64 Years | 119 (4.2%) | 198 (7.1%) |
| 65 to 69 Years | 159 (5.7%) | 116 (4.2%) |
| 70 to 74 Years | 169 (6.0%) | 112 (4.0%) |
| 75 to 79 Years | 64 (2.3%) | 194 (7.0%) |
| 80 to 84 Years | 46 (1.6%) | 22 (0.8%) |
| 85 Years and over | 30 (1.1%) | 33 (1.2%) |
| Total | 2,814 (100.0%) | 2,777 (100.0%) |
Families and Households in New Whiteland
Median Family Size in New Whiteland
The median family size in New Whiteland is 3.14 persons per family, with married-couple families (1,203 | 81.2%) accounting for the largest median family size of 3.23 persons per family. On the other hand, single male/father families (64 | 4.3%) represent the smallest median family size with 1.83 persons per family.
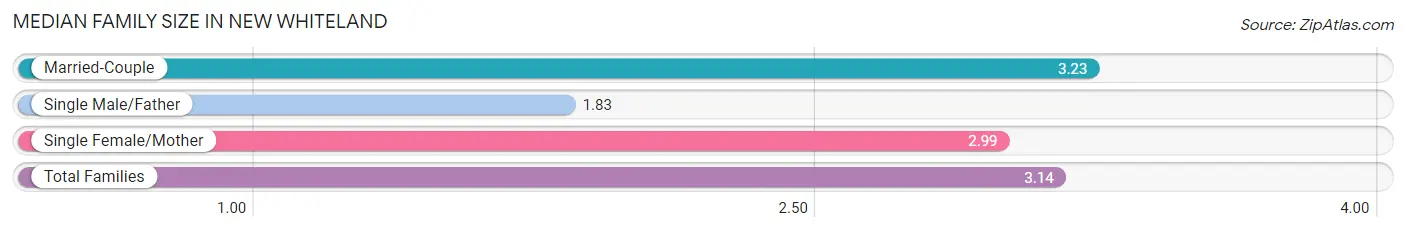
| Family Type | # Families | Family Size |
| Married-Couple | 1,203 (81.2%) | 3.23 |
| Single Male/Father | 64 (4.3%) | 1.83 |
| Single Female/Mother | 215 (14.5%) | 2.99 |
| Total Families | 1,482 (100.0%) | 3.14 |
Median Household Size in New Whiteland
The median household size in New Whiteland is 2.83 persons per household, with married-couple households (1,203 | 60.9%) accounting for the largest median household size of 3.29 persons per household. non-family households (495 | 25.0%) represent the smallest median household size with 1.59 persons per household.
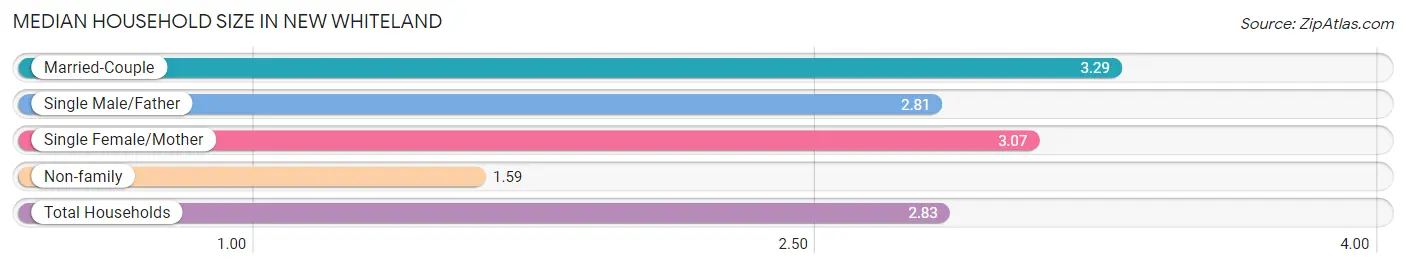
| Household Type | # Households | Household Size |
| Married-Couple | 1,203 (60.9%) | 3.29 |
| Single Male/Father | 64 (3.2%) | 2.81 |
| Single Female/Mother | 215 (10.9%) | 3.07 |
| Non-family | 495 (25.0%) | 1.59 |
| Total Households | 1,977 (100.0%) | 2.83 |
Household Size by Marriage Status in New Whiteland
Out of a total of 1,977 households in New Whiteland, 1,482 (75.0%) are family households, while 495 (25.0%) are nonfamily households. The most numerous type of family households are 2-person households, comprising 661, and the most common type of nonfamily households are 2-person households, comprising 257.
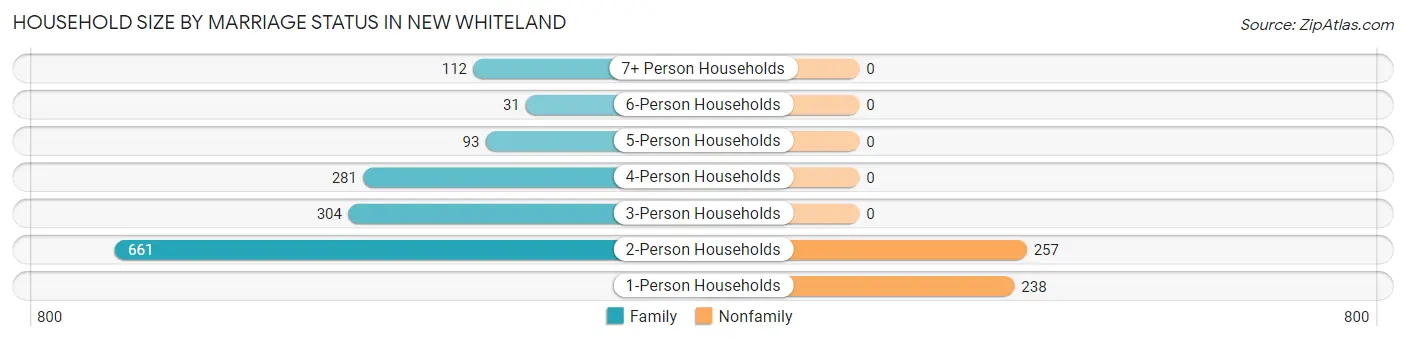
| Household Size | Family Households | Nonfamily Households |
| 1-Person Households | - | 238 (12.0%) |
| 2-Person Households | 661 (33.4%) | 257 (13.0%) |
| 3-Person Households | 304 (15.4%) | 0 (0.0%) |
| 4-Person Households | 281 (14.2%) | 0 (0.0%) |
| 5-Person Households | 93 (4.7%) | 0 (0.0%) |
| 6-Person Households | 31 (1.6%) | 0 (0.0%) |
| 7+ Person Households | 112 (5.7%) | 0 (0.0%) |
| Total | 1,482 (75.0%) | 495 (25.0%) |
Female Fertility in New Whiteland
Fertility by Age in New Whiteland
Average fertility rate in New Whiteland is 69.0 births per 1,000 women. Women in the age bracket of 20 to 34 years have the highest fertility rate with 193.0 births per 1,000 women. Women in the age bracket of 20 to 34 years acount for 100.0% of all women with births.
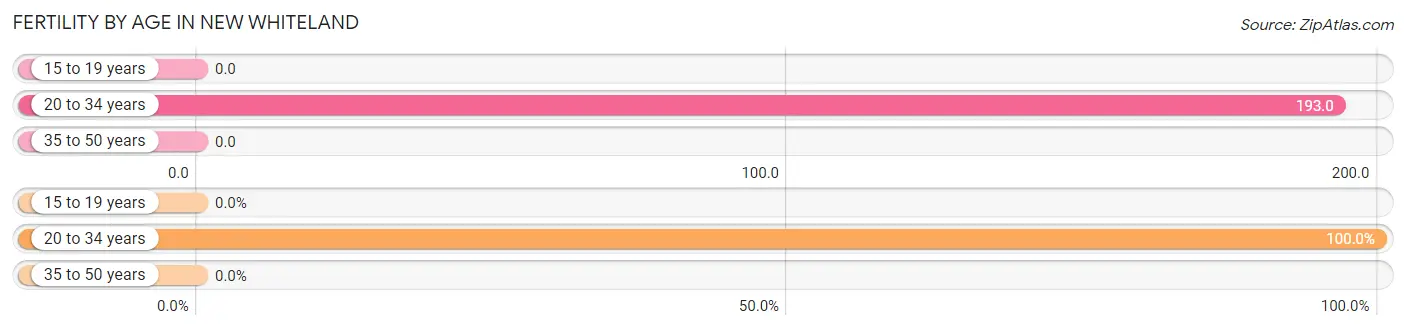
| Age Bracket | Women with Births | Births / 1,000 Women |
| 15 to 19 years | 0 (0.0%) | 0.0 |
| 20 to 34 years | 89 (100.0%) | 193.0 |
| 35 to 50 years | 0 (0.0%) | 0.0 |
| Total | 89 (100.0%) | 69.0 |
Fertility by Age by Marriage Status in New Whiteland
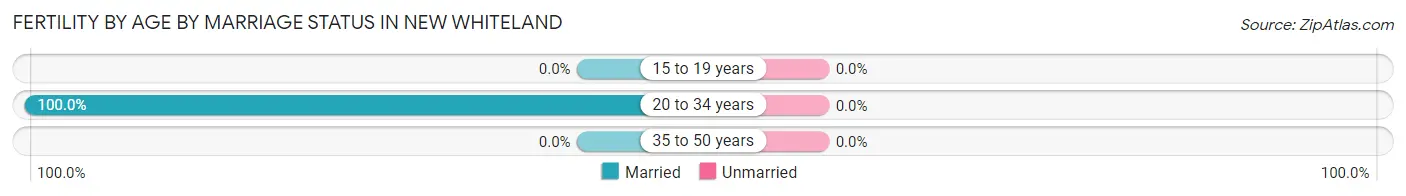
| Age Bracket | Married | Unmarried |
| 15 to 19 years | 0 (0.0%) | 0 (0.0%) |
| 20 to 34 years | 89 (100.0%) | 0 (0.0%) |
| 35 to 50 years | 0 (0.0%) | 0 (0.0%) |
| Total | 89 (100.0%) | 0 (0.0%) |
Fertility by Education in New Whiteland
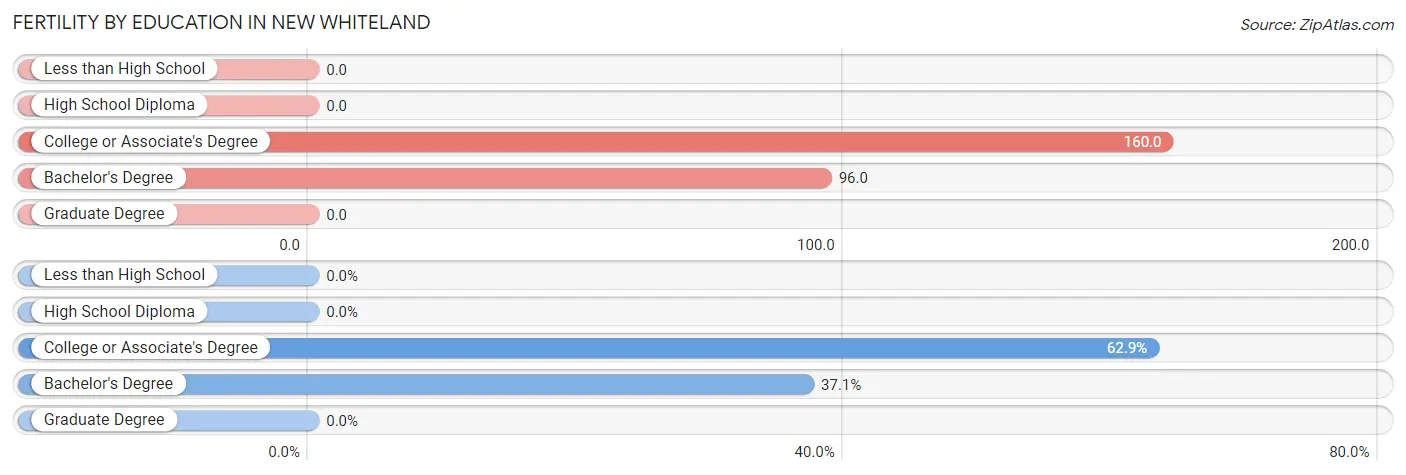
| Educational Attainment | Women with Births | Births / 1,000 Women |
| Less than High School | 0 (0.0%) | 0.0 |
| High School Diploma | 0 (0.0%) | 0.0 |
| College or Associate's Degree | 56 (62.9%) | 160.0 |
| Bachelor's Degree | 33 (37.1%) | 96.0 |
| Graduate Degree | 0 (0.0%) | 0.0 |
| Total | 89 (100.0%) | 69.0 |
Fertility by Education by Marriage Status in New Whiteland
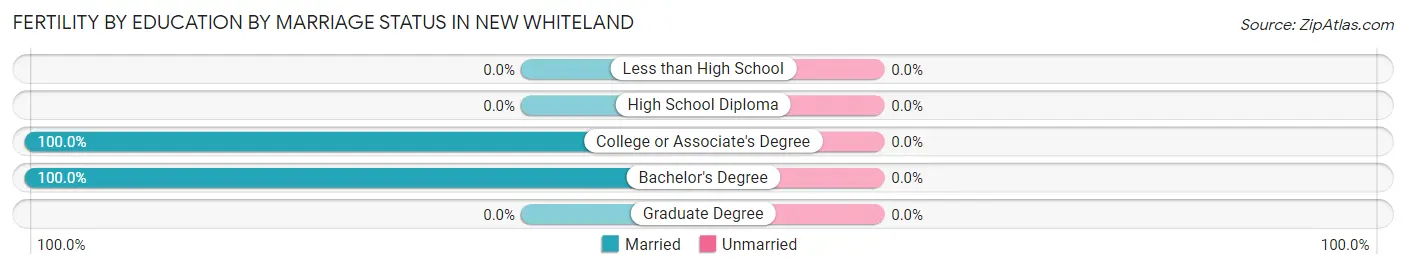
| Educational Attainment | Married | Unmarried |
| Less than High School | 0 (0.0%) | 0 (0.0%) |
| High School Diploma | 0 (0.0%) | 0 (0.0%) |
| College or Associate's Degree | 56 (100.0%) | 0 (0.0%) |
| Bachelor's Degree | 33 (100.0%) | 0 (0.0%) |
| Graduate Degree | 0 (0.0%) | 0 (0.0%) |
| Total | 89 (100.0%) | 0 (0.0%) |
Employment Characteristics in New Whiteland
Employment by Class of Employer in New Whiteland
Among the 2,766 employed individuals in New Whiteland, private company employees (1,660 | 60.0%), local government employees (400 | 14.5%), and not-for-profit organizations (315 | 11.4%) make up the most common classes of employment.
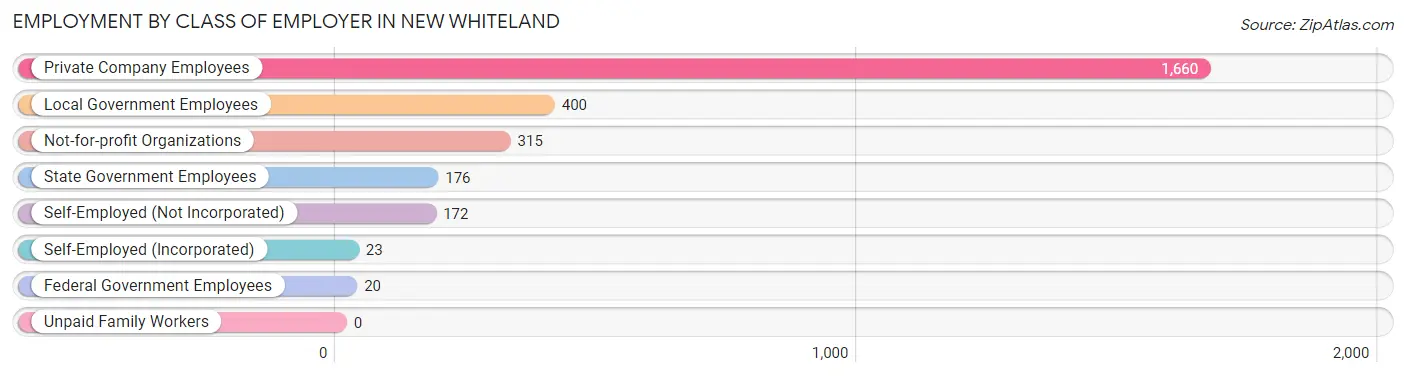
| Employer Class | # Employees | % Employees |
| Private Company Employees | 1,660 | 60.0% |
| Self-Employed (Incorporated) | 23 | 0.8% |
| Self-Employed (Not Incorporated) | 172 | 6.2% |
| Not-for-profit Organizations | 315 | 11.4% |
| Local Government Employees | 400 | 14.5% |
| State Government Employees | 176 | 6.4% |
| Federal Government Employees | 20 | 0.7% |
| Unpaid Family Workers | 0 | 0.0% |
| Total | 2,766 | 100.0% |
Employment Status by Age in New Whiteland
According to the labor force statistics for New Whiteland, out of the total population over 16 years of age (4,390), 64.3% or 2,823 individuals are in the labor force, with 1.2% or 34 of them unemployed. The age group with the highest labor force participation rate is 20 to 24 years, with 100.0% or 310 individuals in the labor force. Within the labor force, the 16 to 19 years age range has the highest percentage of unemployed individuals, with 14.1% or 14 of them being unemployed.
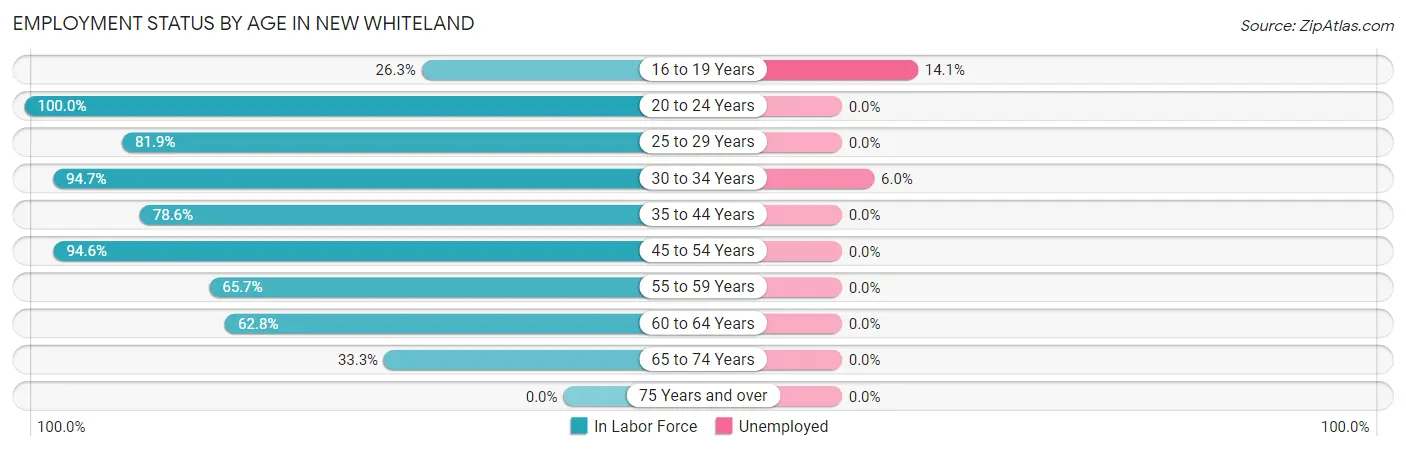
| Age Bracket | In Labor Force | Unemployed |
| 16 to 19 Years | 99 (26.3%) | 14 (14.1%) |
| 20 to 24 Years | 310 (100.0%) | 0 (0.0%) |
| 25 to 29 Years | 379 (81.9%) | 0 (0.0%) |
| 30 to 34 Years | 319 (94.7%) | 19 (6.0%) |
| 35 to 44 Years | 523 (78.6%) | 0 (0.0%) |
| 45 to 54 Years | 543 (94.6%) | 0 (0.0%) |
| 55 to 59 Years | 264 (65.7%) | 0 (0.0%) |
| 60 to 64 Years | 199 (62.8%) | 0 (0.0%) |
| 65 to 74 Years | 185 (33.3%) | 0 (0.0%) |
| 75 Years and over | 0 (0.0%) | 0 (0.0%) |
| Total | 2,823 (64.3%) | 34 (1.2%) |
Employment Status by Educational Attainment in New Whiteland
According to labor force statistics for New Whiteland, 80.7% of individuals (2,226) out of the total population between 25 and 64 years of age (2,758) are in the labor force, with 0.9% or 20 of them being unemployed. The group with the highest labor force participation rate are those with the educational attainment of bachelor's degree or higher, with 88.2% or 788 individuals in the labor force. Within the labor force, individuals with bachelor's degree or higher education have the highest percentage of unemployment, with 2.4% or 19 of them being unemployed.
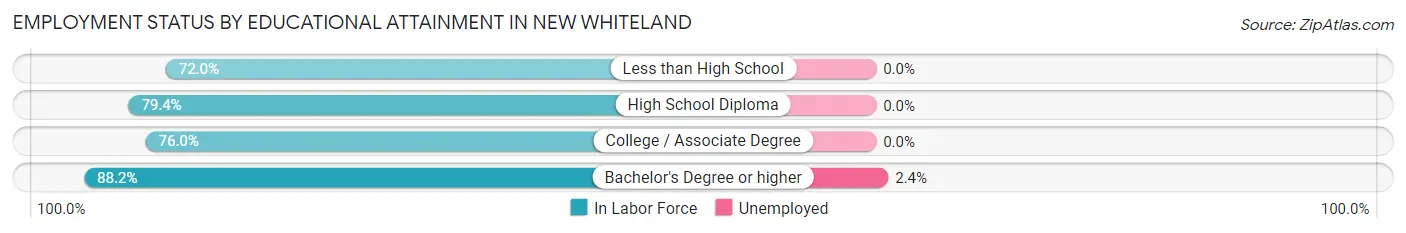
| Educational Attainment | In Labor Force | Unemployed |
| Less than High School | 170 (72.0%) | 0 (0.0%) |
| High School Diploma | 725 (79.4%) | 0 (0.0%) |
| College / Associate Degree | 544 (76.0%) | 0 (0.0%) |
| Bachelor's Degree or higher | 788 (88.2%) | 21 (2.4%) |
| Total | 2,226 (80.7%) | 25 (0.9%) |
Employment Occupations by Sex in New Whiteland
Management, Business, Science and Arts Occupations
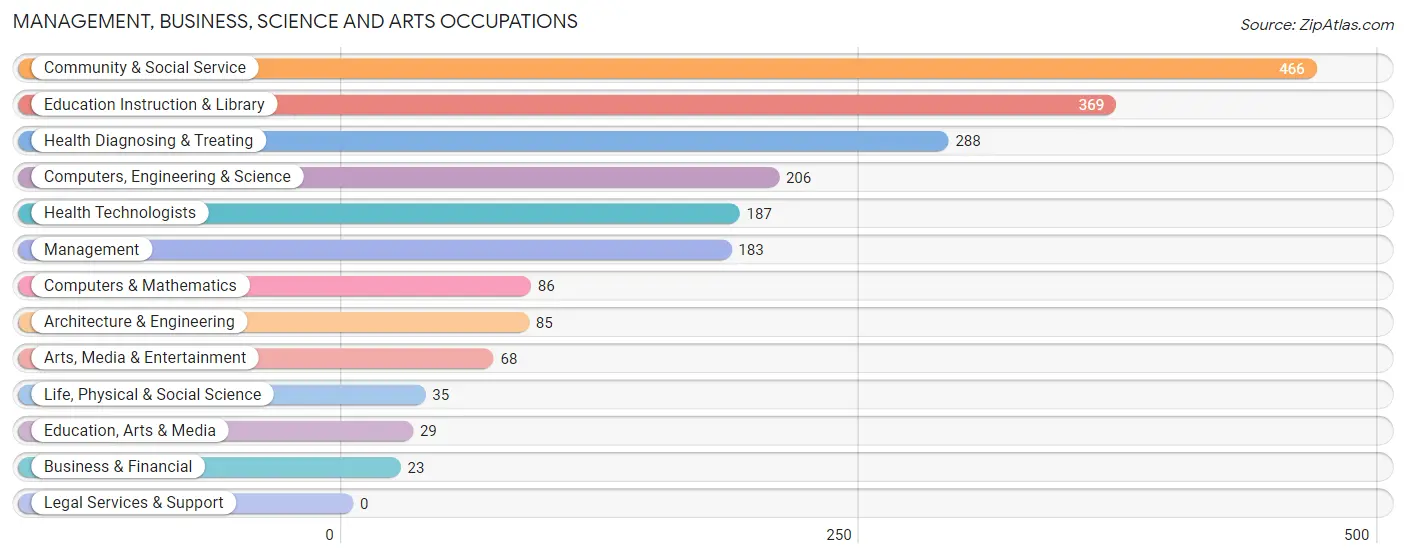
The most common Management, Business, Science and Arts occupations in New Whiteland are Community & Social Service (466 | 16.7%), Education Instruction & Library (369 | 13.2%), Health Diagnosing & Treating (288 | 10.3%), Computers, Engineering & Science (206 | 7.4%), and Health Technologists (187 | 6.7%).
Management, Business, Science and Arts Occupations by Sex
Within the Management, Business, Science and Arts occupations in New Whiteland, the most male-oriented occupations are Business & Financial (100.0%), Life, Physical & Social Science (100.0%), and Education, Arts & Media (100.0%), while the most female-oriented occupations are Arts, Media & Entertainment (100.0%), Health Diagnosing & Treating (100.0%), and Health Technologists (100.0%).
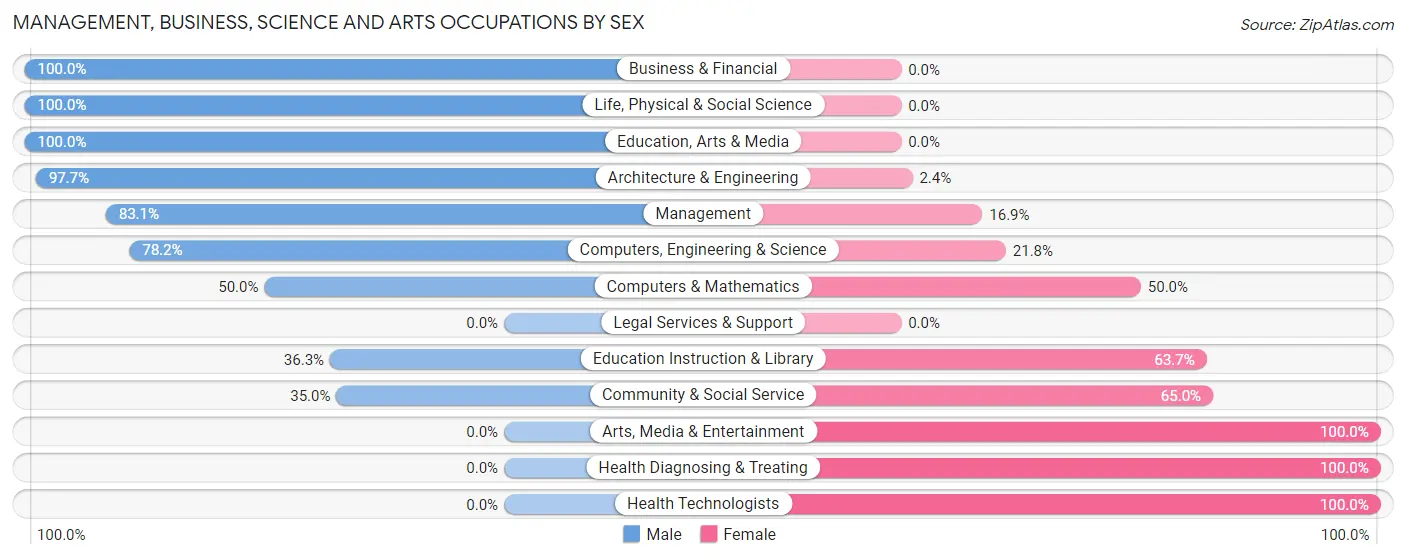
| Occupation | Male | Female |
| Management | 152 (83.1%) | 31 (16.9%) |
| Business & Financial | 23 (100.0%) | 0 (0.0%) |
| Computers, Engineering & Science | 161 (78.2%) | 45 (21.8%) |
| Computers & Mathematics | 43 (50.0%) | 43 (50.0%) |
| Architecture & Engineering | 83 (97.7%) | 2 (2.4%) |
| Life, Physical & Social Science | 35 (100.0%) | 0 (0.0%) |
| Community & Social Service | 163 (35.0%) | 303 (65.0%) |
| Education, Arts & Media | 29 (100.0%) | 0 (0.0%) |
| Legal Services & Support | 0 (0.0%) | 0 (0.0%) |
| Education Instruction & Library | 134 (36.3%) | 235 (63.7%) |
| Arts, Media & Entertainment | 0 (0.0%) | 68 (100.0%) |
| Health Diagnosing & Treating | 0 (0.0%) | 288 (100.0%) |
| Health Technologists | 0 (0.0%) | 187 (100.0%) |
| Total (Category) | 499 (42.8%) | 667 (57.2%) |
| Total (Overall) | 1,512 (54.2%) | 1,276 (45.8%) |
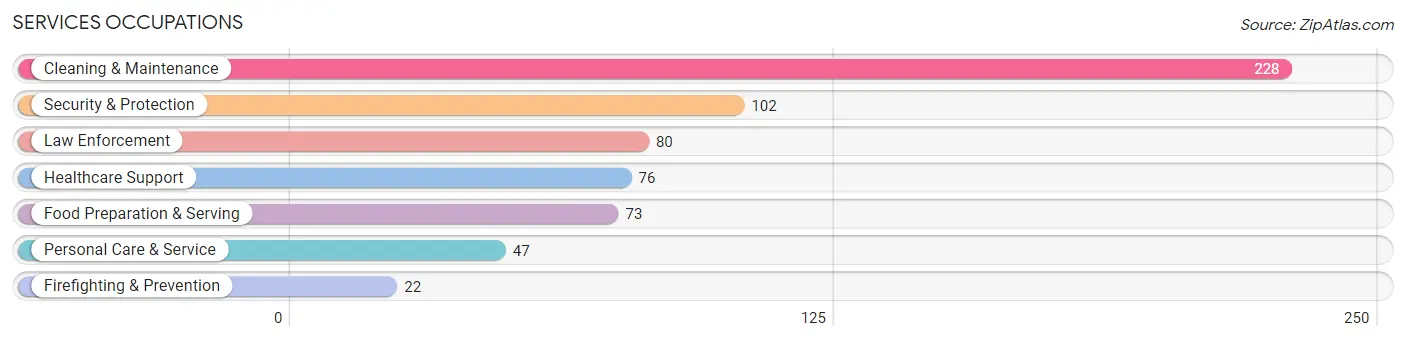
Services Occupations
The most common Services occupations in New Whiteland are Cleaning & Maintenance (228 | 8.2%), Security & Protection (102 | 3.7%), Law Enforcement (80 | 2.9%), Healthcare Support (76 | 2.7%), and Food Preparation & Serving (73 | 2.6%).
Services Occupations by Sex
Within the Services occupations in New Whiteland, the most male-oriented occupations are Security & Protection (100.0%), Firefighting & Prevention (100.0%), and Law Enforcement (100.0%), while the most female-oriented occupations are Healthcare Support (100.0%), Food Preparation & Serving (52.0%), and Personal Care & Service (38.3%).
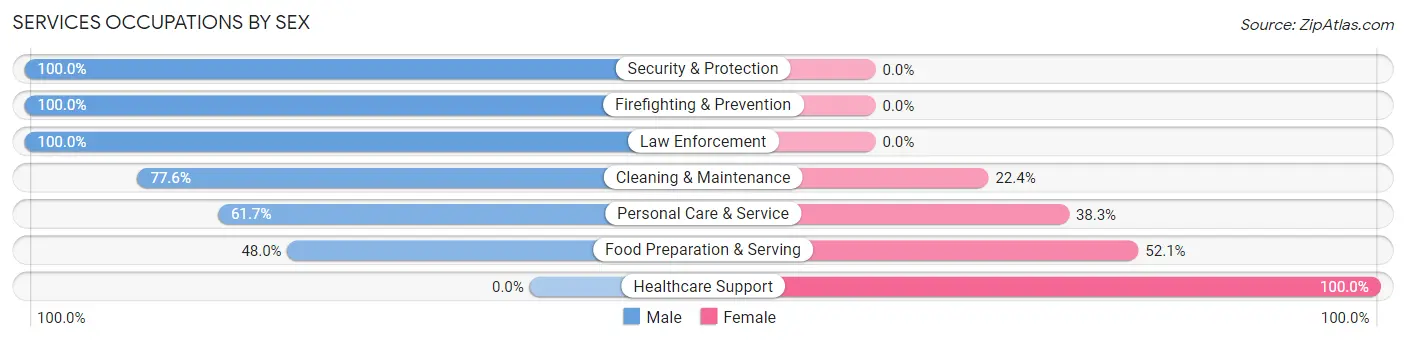
| Occupation | Male | Female |
| Healthcare Support | 0 (0.0%) | 76 (100.0%) |
| Security & Protection | 102 (100.0%) | 0 (0.0%) |
| Firefighting & Prevention | 22 (100.0%) | 0 (0.0%) |
| Law Enforcement | 80 (100.0%) | 0 (0.0%) |
| Food Preparation & Serving | 35 (47.9%) | 38 (52.0%) |
| Cleaning & Maintenance | 177 (77.6%) | 51 (22.4%) |
| Personal Care & Service | 29 (61.7%) | 18 (38.3%) |
| Total (Category) | 343 (65.2%) | 183 (34.8%) |
| Total (Overall) | 1,512 (54.2%) | 1,276 (45.8%) |
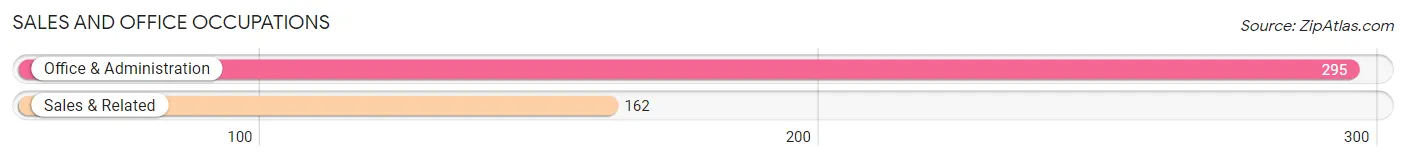
Sales and Office Occupations
The most common Sales and Office occupations in New Whiteland are Office & Administration (295 | 10.6%), and Sales & Related (162 | 5.8%).
Sales and Office Occupations by Sex
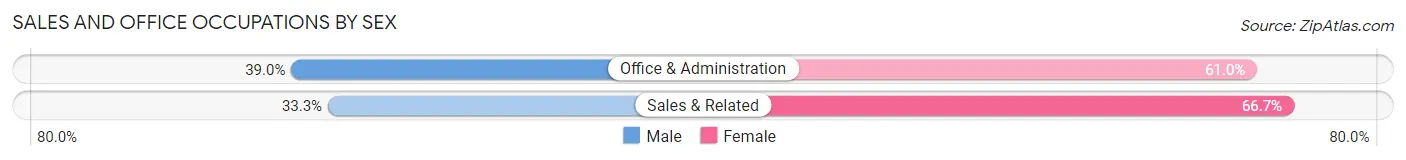
| Occupation | Male | Female |
| Sales & Related | 54 (33.3%) | 108 (66.7%) |
| Office & Administration | 115 (39.0%) | 180 (61.0%) |
| Total (Category) | 169 (37.0%) | 288 (63.0%) |
| Total (Overall) | 1,512 (54.2%) | 1,276 (45.8%) |
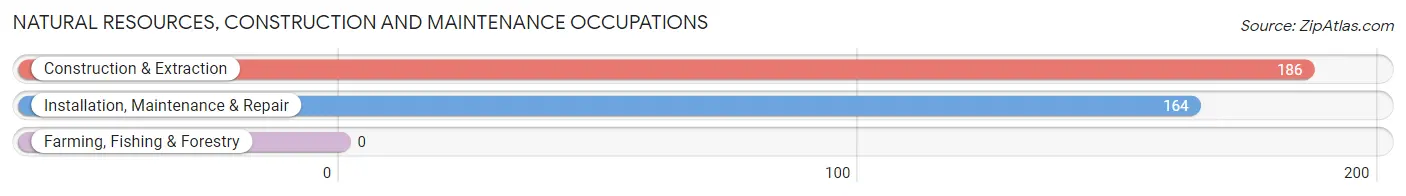
Natural Resources, Construction and Maintenance Occupations
The most common Natural Resources, Construction and Maintenance occupations in New Whiteland are Construction & Extraction (186 | 6.7%), and Installation, Maintenance & Repair (164 | 5.9%).
Natural Resources, Construction and Maintenance Occupations by Sex
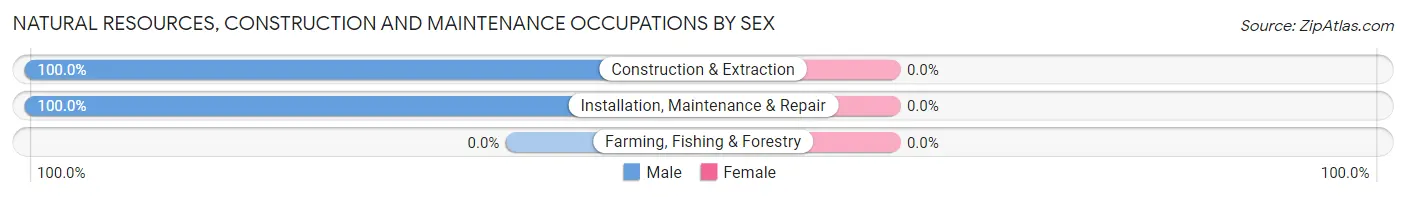
| Occupation | Male | Female |
| Farming, Fishing & Forestry | 0 (0.0%) | 0 (0.0%) |
| Construction & Extraction | 186 (100.0%) | 0 (0.0%) |
| Installation, Maintenance & Repair | 164 (100.0%) | 0 (0.0%) |
| Total (Category) | 350 (100.0%) | 0 (0.0%) |
| Total (Overall) | 1,512 (54.2%) | 1,276 (45.8%) |
Production, Transportation and Moving Occupations
The most common Production, Transportation and Moving occupations in New Whiteland are Production (159 | 5.7%), Material Moving (89 | 3.2%), and Transportation (41 | 1.5%).
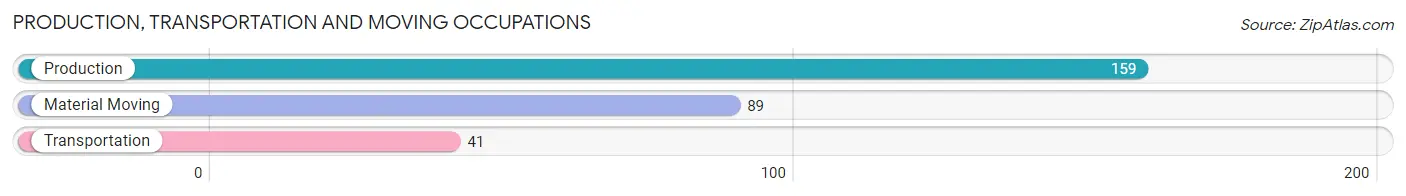
Production, Transportation and Moving Occupations by Sex
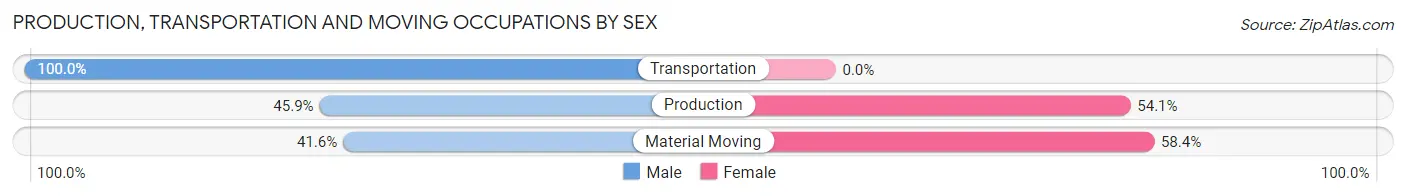
| Occupation | Male | Female |
| Production | 73 (45.9%) | 86 (54.1%) |
| Transportation | 41 (100.0%) | 0 (0.0%) |
| Material Moving | 37 (41.6%) | 52 (58.4%) |
| Total (Category) | 151 (52.2%) | 138 (47.7%) |
| Total (Overall) | 1,512 (54.2%) | 1,276 (45.8%) |
Employment Industries by Sex in New Whiteland
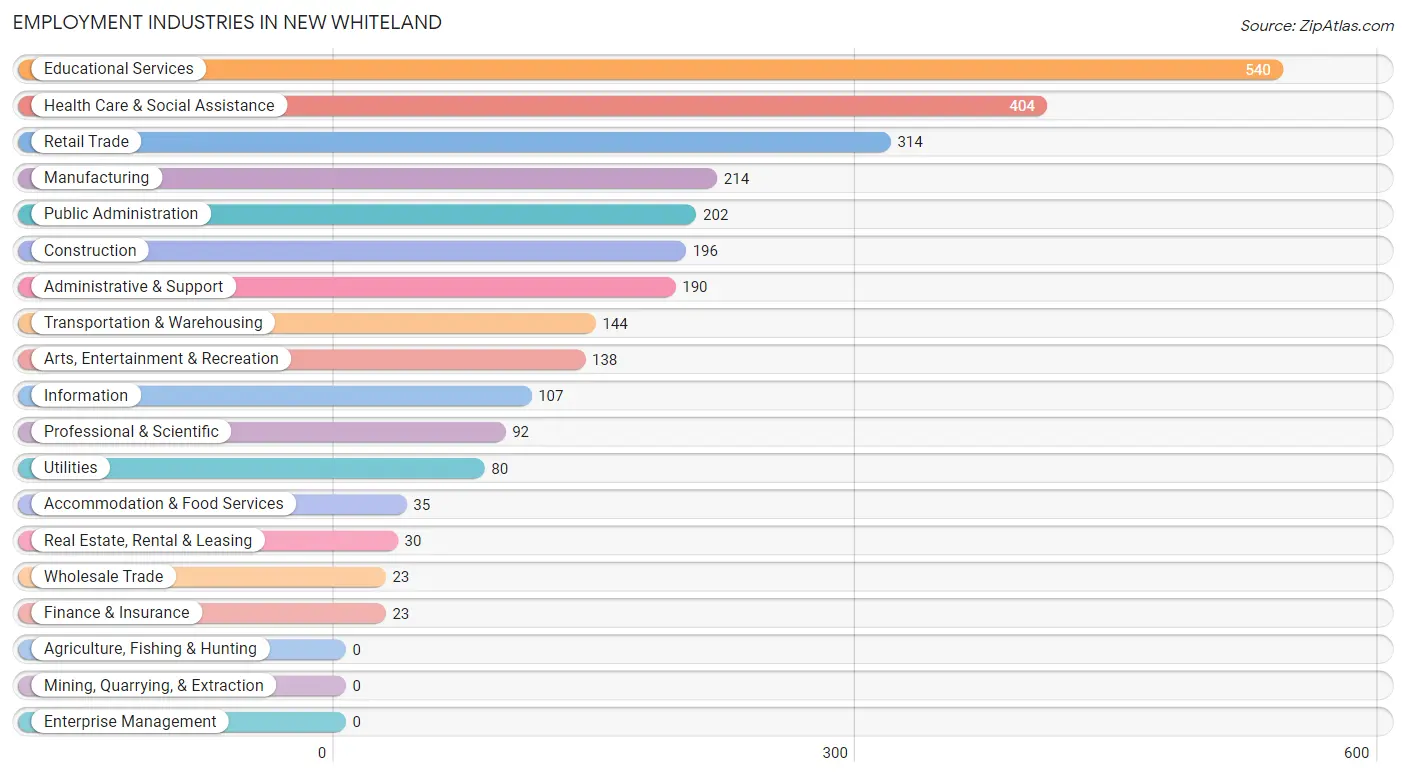
Employment Industries in New Whiteland
The major employment industries in New Whiteland include Educational Services (540 | 19.4%), Health Care & Social Assistance (404 | 14.5%), Retail Trade (314 | 11.3%), Manufacturing (214 | 7.7%), and Public Administration (202 | 7.2%).
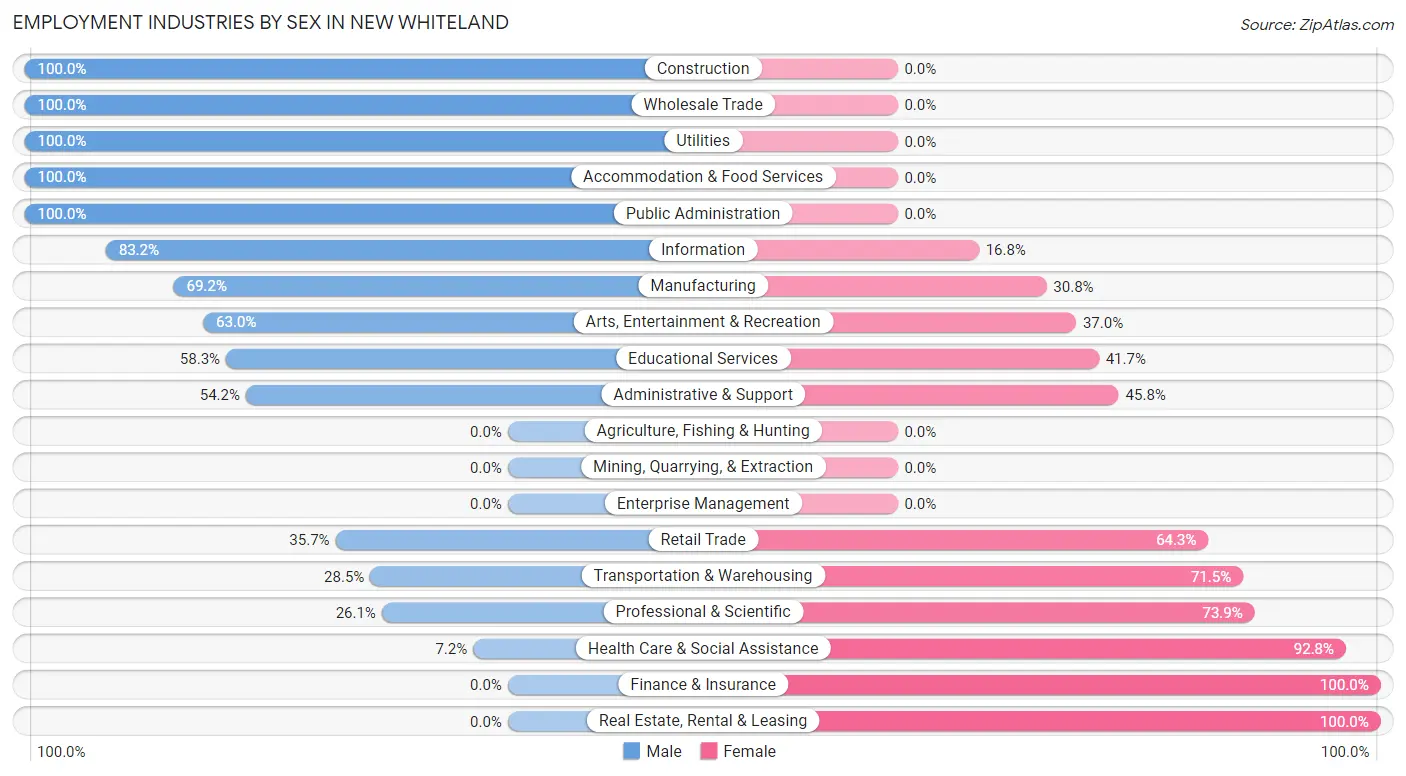
Employment Industries by Sex in New Whiteland
The New Whiteland industries that see more men than women are Construction (100.0%), Wholesale Trade (100.0%), and Utilities (100.0%), whereas the industries that tend to have a higher number of women are Finance & Insurance (100.0%), Real Estate, Rental & Leasing (100.0%), and Health Care & Social Assistance (92.8%).
| Industry | Male | Female |
| Agriculture, Fishing & Hunting | 0 (0.0%) | 0 (0.0%) |
| Mining, Quarrying, & Extraction | 0 (0.0%) | 0 (0.0%) |
| Construction | 196 (100.0%) | 0 (0.0%) |
| Manufacturing | 148 (69.2%) | 66 (30.8%) |
| Wholesale Trade | 23 (100.0%) | 0 (0.0%) |
| Retail Trade | 112 (35.7%) | 202 (64.3%) |
| Transportation & Warehousing | 41 (28.5%) | 103 (71.5%) |
| Utilities | 80 (100.0%) | 0 (0.0%) |
| Information | 89 (83.2%) | 18 (16.8%) |
| Finance & Insurance | 0 (0.0%) | 23 (100.0%) |
| Real Estate, Rental & Leasing | 0 (0.0%) | 30 (100.0%) |
| Professional & Scientific | 24 (26.1%) | 68 (73.9%) |
| Enterprise Management | 0 (0.0%) | 0 (0.0%) |
| Administrative & Support | 103 (54.2%) | 87 (45.8%) |
| Educational Services | 315 (58.3%) | 225 (41.7%) |
| Health Care & Social Assistance | 29 (7.2%) | 375 (92.8%) |
| Arts, Entertainment & Recreation | 87 (63.0%) | 51 (37.0%) |
| Accommodation & Food Services | 35 (100.0%) | 0 (0.0%) |
| Public Administration | 202 (100.0%) | 0 (0.0%) |
| Total | 1,512 (54.2%) | 1,276 (45.8%) |
Education in New Whiteland
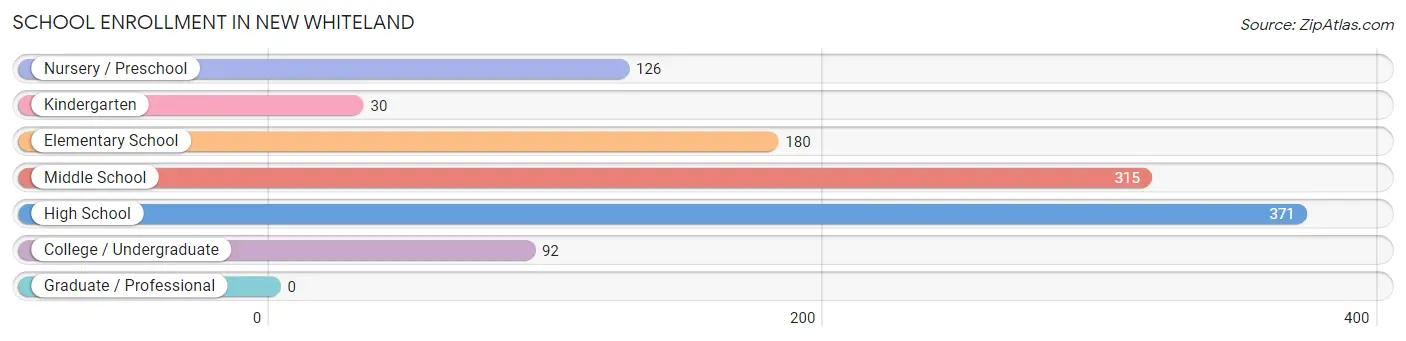
School Enrollment in New Whiteland
The most common levels of schooling among the 1,114 students in New Whiteland are high school (371 | 33.3%), middle school (315 | 28.3%), and elementary school (180 | 16.2%).
| School Level | # Students | % Students |
| Nursery / Preschool | 126 | 11.3% |
| Kindergarten | 30 | 2.7% |
| Elementary School | 180 | 16.2% |
| Middle School | 315 | 28.3% |
| High School | 371 | 33.3% |
| College / Undergraduate | 92 | 8.3% |
| Graduate / Professional | 0 | 0.0% |
| Total | 1,114 | 100.0% |
School Enrollment by Age by Funding Source in New Whiteland
Out of a total of 1,114 students who are enrolled in schools in New Whiteland, 198 (17.8%) attend a private institution, while the remaining 916 (82.2%) are enrolled in public schools. The age group of 20 to 24 year olds has the highest likelihood of being enrolled in private schools, with 75 (100.0% in the age bracket) enrolled. Conversely, the age group of 10 to 14 year olds has the lowest likelihood of being enrolled in a private school, with 421 (100.0% in the age bracket) attending a public institution.
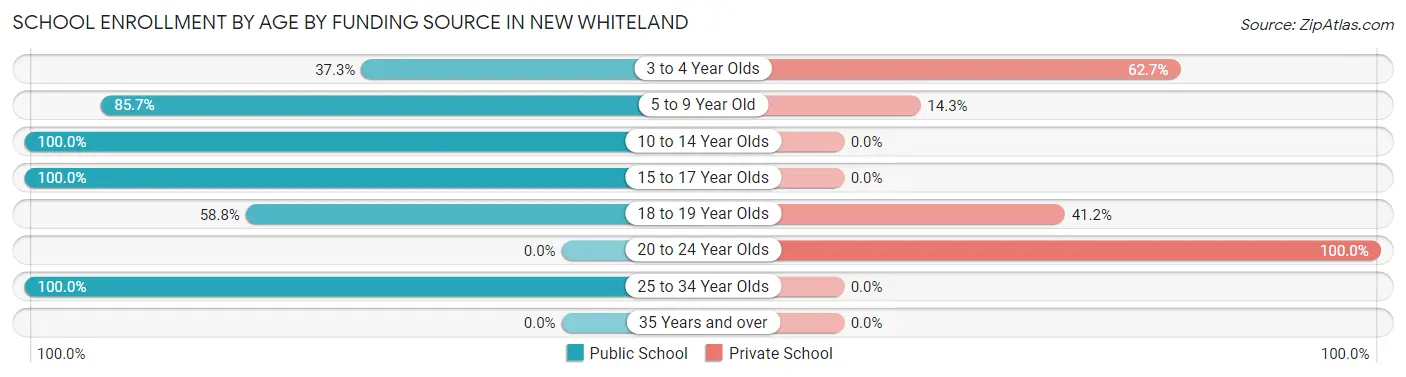
| Age Bracket | Public School | Private School |
| 3 to 4 Year Olds | 47 (37.3%) | 79 (62.7%) |
| 5 to 9 Year Old | 180 (85.7%) | 30 (14.3%) |
| 10 to 14 Year Olds | 421 (100.0%) | 0 (0.0%) |
| 15 to 17 Year Olds | 231 (100.0%) | 0 (0.0%) |
| 18 to 19 Year Olds | 20 (58.8%) | 14 (41.2%) |
| 20 to 24 Year Olds | 0 (0.0%) | 75 (100.0%) |
| 25 to 34 Year Olds | 17 (100.0%) | 0 (0.0%) |
| 35 Years and over | 0 (0.0%) | 0 (0.0%) |
| Total | 916 (82.2%) | 198 (17.8%) |
Educational Attainment by Field of Study in New Whiteland
Education (285 | 30.2%), liberal arts & history (116 | 12.3%), business (79 | 8.4%), communications (66 | 7.0%), and arts & humanities (62 | 6.6%) are the most common fields of study among 942 individuals in New Whiteland who have obtained a bachelor's degree or higher.
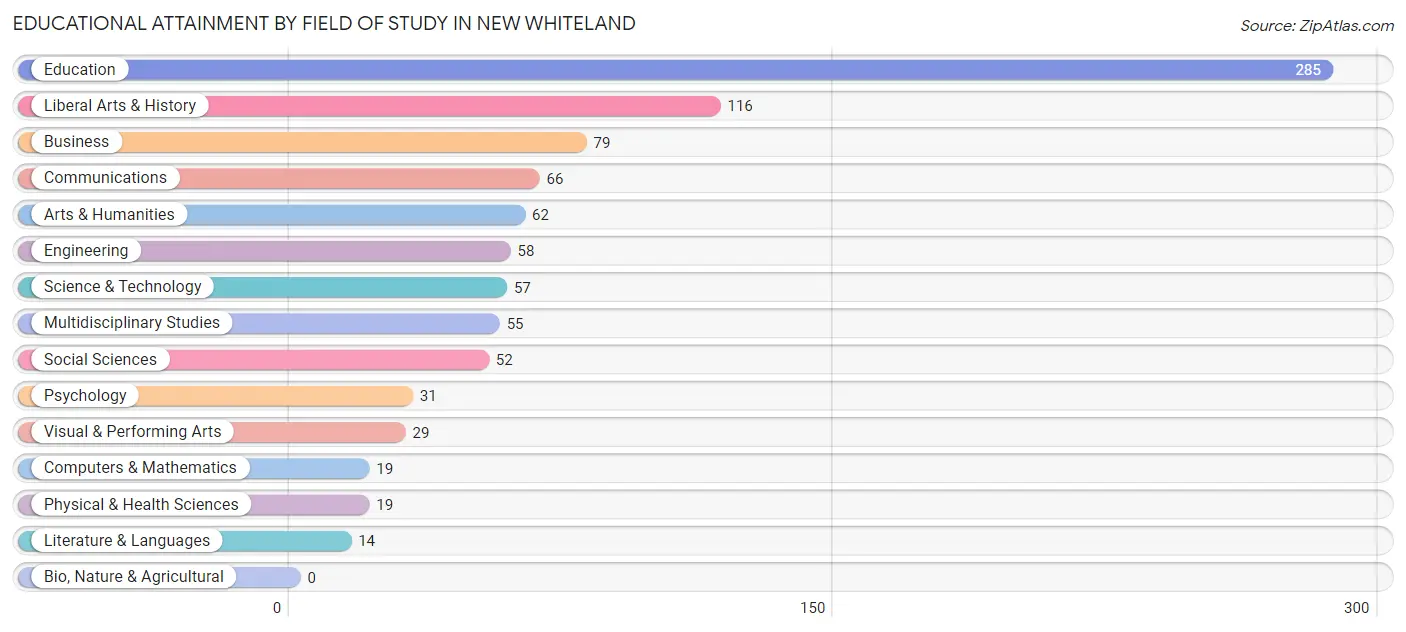
| Field of Study | # Graduates | % Graduates |
| Computers & Mathematics | 19 | 2.0% |
| Bio, Nature & Agricultural | 0 | 0.0% |
| Physical & Health Sciences | 19 | 2.0% |
| Psychology | 31 | 3.3% |
| Social Sciences | 52 | 5.5% |
| Engineering | 58 | 6.2% |
| Multidisciplinary Studies | 55 | 5.8% |
| Science & Technology | 57 | 6.0% |
| Business | 79 | 8.4% |
| Education | 285 | 30.2% |
| Literature & Languages | 14 | 1.5% |
| Liberal Arts & History | 116 | 12.3% |
| Visual & Performing Arts | 29 | 3.1% |
| Communications | 66 | 7.0% |
| Arts & Humanities | 62 | 6.6% |
| Total | 942 | 100.0% |
Transportation & Commute in New Whiteland
Vehicle Availability by Sex in New Whiteland
The most prevalent vehicle ownership categories in New Whiteland are males with 2 vehicles (920, accounting for 61.7%) and females with 2 vehicles (774, making up 72.1%).
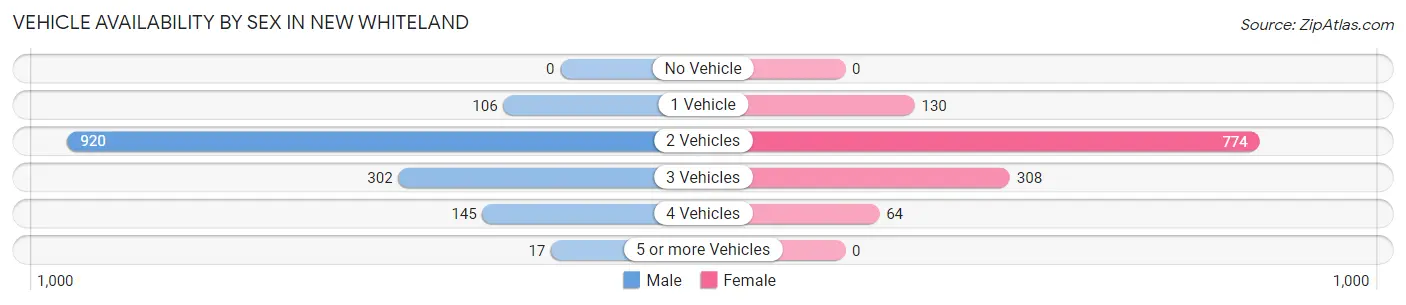
| Vehicles Available | Male | Female |
| No Vehicle | 0 (0.0%) | 0 (0.0%) |
| 1 Vehicle | 106 (7.1%) | 130 (10.2%) |
| 2 Vehicles | 920 (61.7%) | 774 (60.7%) |
| 3 Vehicles | 302 (20.3%) | 308 (24.1%) |
| 4 Vehicles | 145 (9.7%) | 64 (5.0%) |
| 5 or more Vehicles | 17 (1.1%) | 0 (0.0%) |
| Total | 1,490 (100.0%) | 1,276 (100.0%) |
Commute Time in New Whiteland
The most frequently occuring commute durations in New Whiteland are 15 to 19 minutes (435 commuters, 18.9%), 20 to 24 minutes (390 commuters, 16.9%), and 10 to 14 minutes (342 commuters, 14.8%).
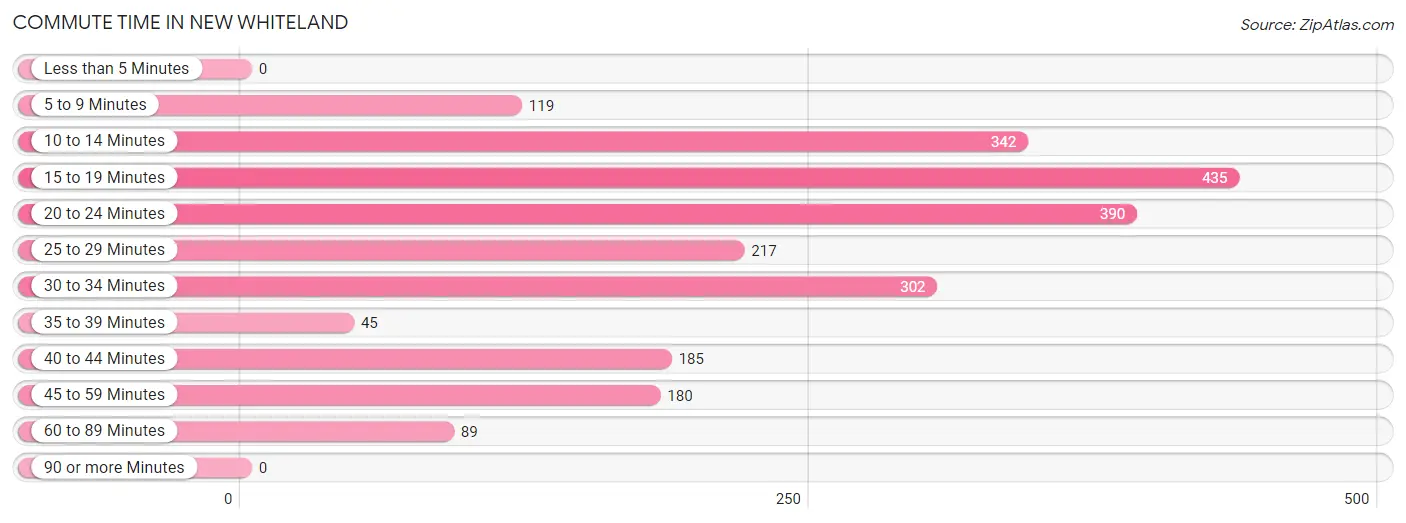
| Commute Time | # Commuters | % Commuters |
| Less than 5 Minutes | 0 | 0.0% |
| 5 to 9 Minutes | 119 | 5.2% |
| 10 to 14 Minutes | 342 | 14.8% |
| 15 to 19 Minutes | 435 | 18.9% |
| 20 to 24 Minutes | 390 | 16.9% |
| 25 to 29 Minutes | 217 | 9.4% |
| 30 to 34 Minutes | 302 | 13.1% |
| 35 to 39 Minutes | 45 | 1.9% |
| 40 to 44 Minutes | 185 | 8.0% |
| 45 to 59 Minutes | 180 | 7.8% |
| 60 to 89 Minutes | 89 | 3.9% |
| 90 or more Minutes | 0 | 0.0% |
Commute Time by Sex in New Whiteland
The most common commute times in New Whiteland are 15 to 19 minutes (308 commuters, 22.9%) for males and 20 to 24 minutes (222 commuters, 23.2%) for females.
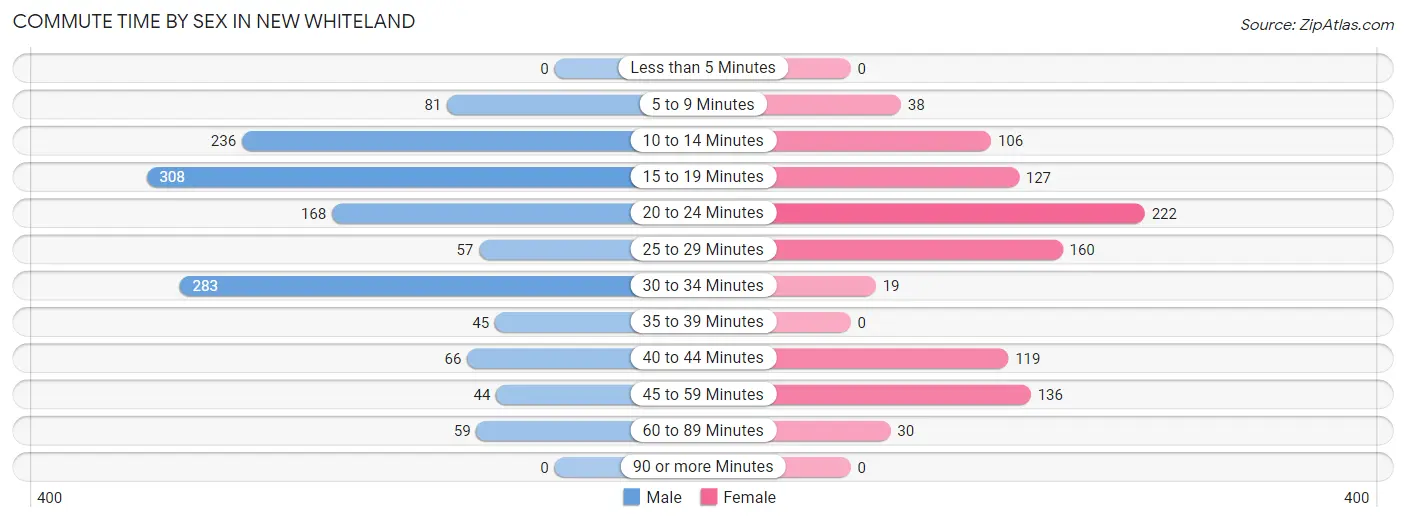
| Commute Time | Male | Female |
| Less than 5 Minutes | 0 (0.0%) | 0 (0.0%) |
| 5 to 9 Minutes | 81 (6.0%) | 38 (4.0%) |
| 10 to 14 Minutes | 236 (17.5%) | 106 (11.1%) |
| 15 to 19 Minutes | 308 (22.9%) | 127 (13.3%) |
| 20 to 24 Minutes | 168 (12.5%) | 222 (23.2%) |
| 25 to 29 Minutes | 57 (4.2%) | 160 (16.7%) |
| 30 to 34 Minutes | 283 (21.0%) | 19 (2.0%) |
| 35 to 39 Minutes | 45 (3.3%) | 0 (0.0%) |
| 40 to 44 Minutes | 66 (4.9%) | 119 (12.4%) |
| 45 to 59 Minutes | 44 (3.3%) | 136 (14.2%) |
| 60 to 89 Minutes | 59 (4.4%) | 30 (3.1%) |
| 90 or more Minutes | 0 (0.0%) | 0 (0.0%) |
Time of Departure to Work by Sex in New Whiteland
The most frequent times of departure to work in New Whiteland are 7:00 AM to 7:29 AM (444, 33.0%) for males and 7:00 AM to 7:29 AM (243, 25.4%) for females.
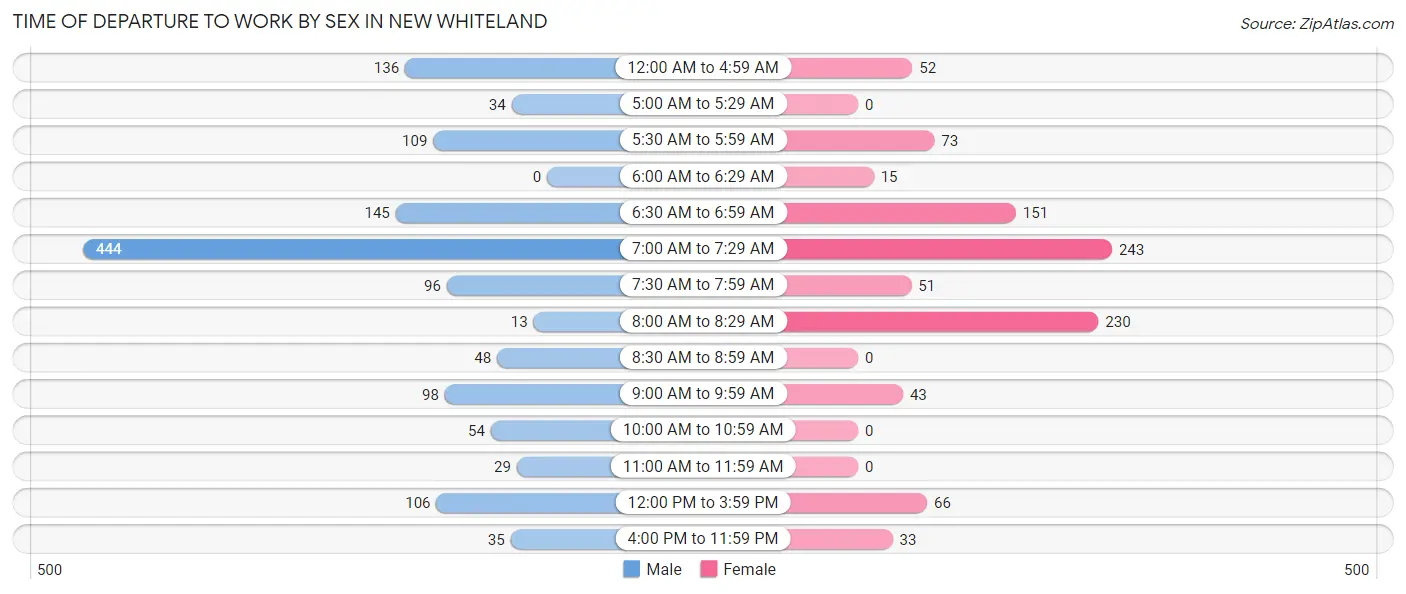
| Time of Departure | Male | Female |
| 12:00 AM to 4:59 AM | 136 (10.1%) | 52 (5.4%) |
| 5:00 AM to 5:29 AM | 34 (2.5%) | 0 (0.0%) |
| 5:30 AM to 5:59 AM | 109 (8.1%) | 73 (7.6%) |
| 6:00 AM to 6:29 AM | 0 (0.0%) | 15 (1.6%) |
| 6:30 AM to 6:59 AM | 145 (10.8%) | 151 (15.8%) |
| 7:00 AM to 7:29 AM | 444 (33.0%) | 243 (25.4%) |
| 7:30 AM to 7:59 AM | 96 (7.1%) | 51 (5.3%) |
| 8:00 AM to 8:29 AM | 13 (1.0%) | 230 (24.0%) |
| 8:30 AM to 8:59 AM | 48 (3.6%) | 0 (0.0%) |
| 9:00 AM to 9:59 AM | 98 (7.3%) | 43 (4.5%) |
| 10:00 AM to 10:59 AM | 54 (4.0%) | 0 (0.0%) |
| 11:00 AM to 11:59 AM | 29 (2.1%) | 0 (0.0%) |
| 12:00 PM to 3:59 PM | 106 (7.9%) | 66 (6.9%) |
| 4:00 PM to 11:59 PM | 35 (2.6%) | 33 (3.5%) |
| Total | 1,347 (100.0%) | 957 (100.0%) |
Housing Occupancy in New Whiteland
Occupancy by Ownership in New Whiteland
Of the total 1,977 dwellings in New Whiteland, owner-occupied units account for 1,840 (93.1%), while renter-occupied units make up 137 (6.9%).
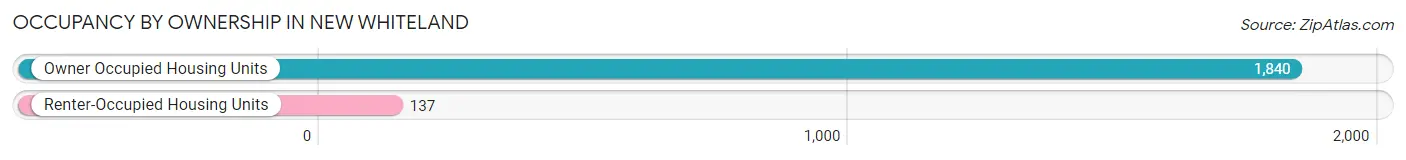
| Occupancy | # Housing Units | % Housing Units |
| Owner Occupied Housing Units | 1,840 | 93.1% |
| Renter-Occupied Housing Units | 137 | 6.9% |
| Total Occupied Housing Units | 1,977 | 100.0% |
Occupancy by Household Size in New Whiteland
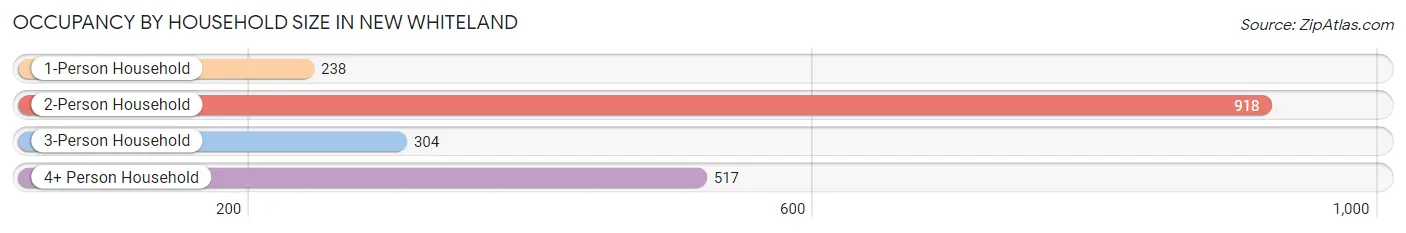
| Household Size | # Housing Units | % Housing Units |
| 1-Person Household | 238 | 12.0% |
| 2-Person Household | 918 | 46.4% |
| 3-Person Household | 304 | 15.4% |
| 4+ Person Household | 517 | 26.2% |
| Total Housing Units | 1,977 | 100.0% |
Occupancy by Ownership by Household Size in New Whiteland
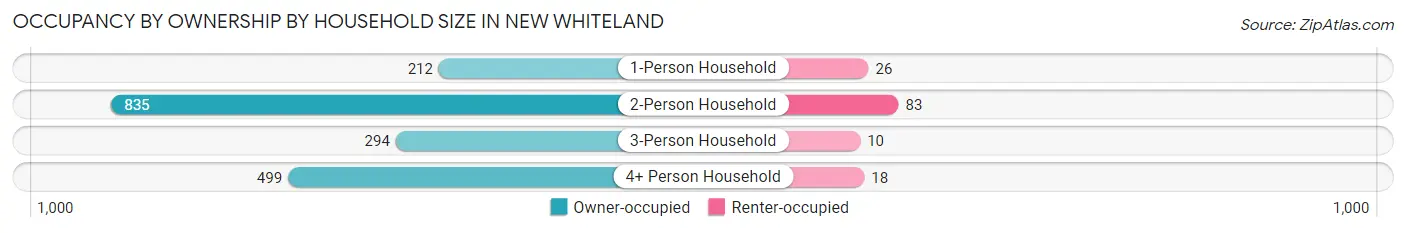
| Household Size | Owner-occupied | Renter-occupied |
| 1-Person Household | 212 (89.1%) | 26 (10.9%) |
| 2-Person Household | 835 (91.0%) | 83 (9.0%) |
| 3-Person Household | 294 (96.7%) | 10 (3.3%) |
| 4+ Person Household | 499 (96.5%) | 18 (3.5%) |
| Total Housing Units | 1,840 (93.1%) | 137 (6.9%) |
Occupancy by Educational Attainment in New Whiteland
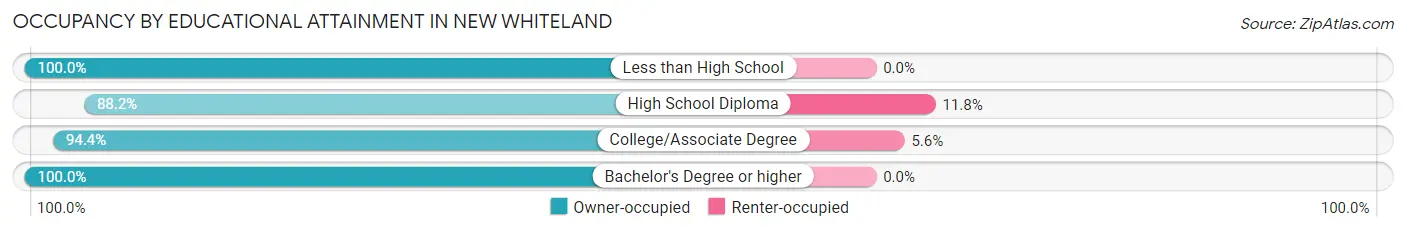
| Household Size | Owner-occupied | Renter-occupied |
| Less than High School | 93 (100.0%) | 0 (0.0%) |
| High School Diploma | 817 (88.2%) | 109 (11.8%) |
| College/Associate Degree | 471 (94.4%) | 28 (5.6%) |
| Bachelor's Degree or higher | 459 (100.0%) | 0 (0.0%) |
Occupancy by Age of Householder in New Whiteland
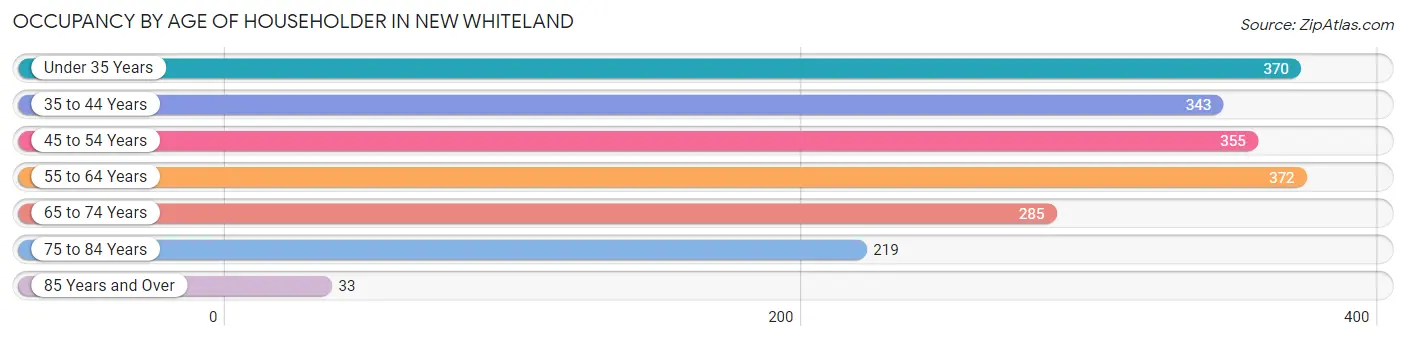
| Age Bracket | # Households | % Households |
| Under 35 Years | 370 | 18.7% |
| 35 to 44 Years | 343 | 17.3% |
| 45 to 54 Years | 355 | 18.0% |
| 55 to 64 Years | 372 | 18.8% |
| 65 to 74 Years | 285 | 14.4% |
| 75 to 84 Years | 219 | 11.1% |
| 85 Years and Over | 33 | 1.7% |
| Total | 1,977 | 100.0% |
Housing Finances in New Whiteland
Median Income by Occupancy in New Whiteland
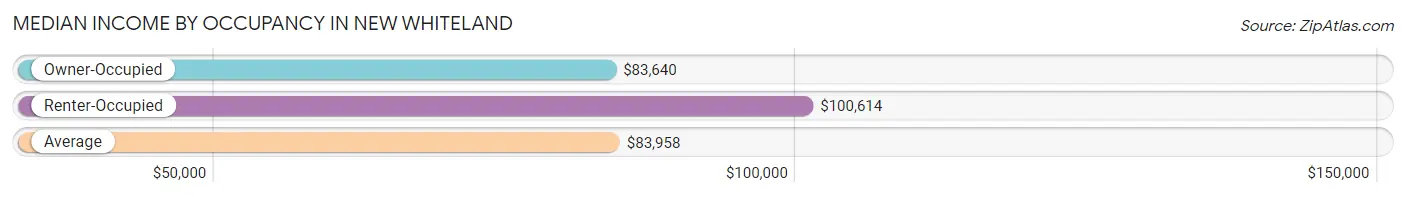
| Occupancy Type | # Households | Median Income |
| Owner-Occupied | 1,840 (93.1%) | $83,640 |
| Renter-Occupied | 137 (6.9%) | $100,614 |
| Average | 1,977 (100.0%) | $83,958 |
Occupancy by Householder Income Bracket in New Whiteland
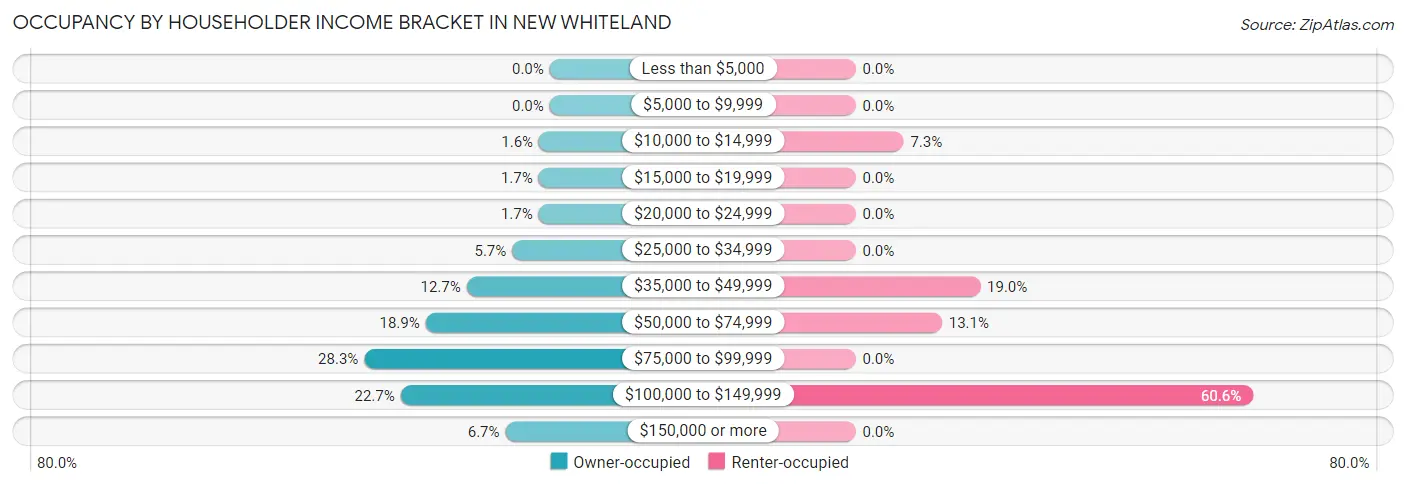
| Income Bracket | Owner-occupied | Renter-occupied |
| Less than $5,000 | 0 (0.0%) | 0 (0.0%) |
| $5,000 to $9,999 | 0 (0.0%) | 0 (0.0%) |
| $10,000 to $14,999 | 30 (1.6%) | 10 (7.3%) |
| $15,000 to $19,999 | 31 (1.7%) | 0 (0.0%) |
| $20,000 to $24,999 | 31 (1.7%) | 0 (0.0%) |
| $25,000 to $34,999 | 105 (5.7%) | 0 (0.0%) |
| $35,000 to $49,999 | 233 (12.7%) | 26 (19.0%) |
| $50,000 to $74,999 | 348 (18.9%) | 18 (13.1%) |
| $75,000 to $99,999 | 520 (28.3%) | 0 (0.0%) |
| $100,000 to $149,999 | 418 (22.7%) | 83 (60.6%) |
| $150,000 or more | 124 (6.7%) | 0 (0.0%) |
| Total | 1,840 (100.0%) | 137 (100.0%) |
Monthly Housing Cost Tiers in New Whiteland
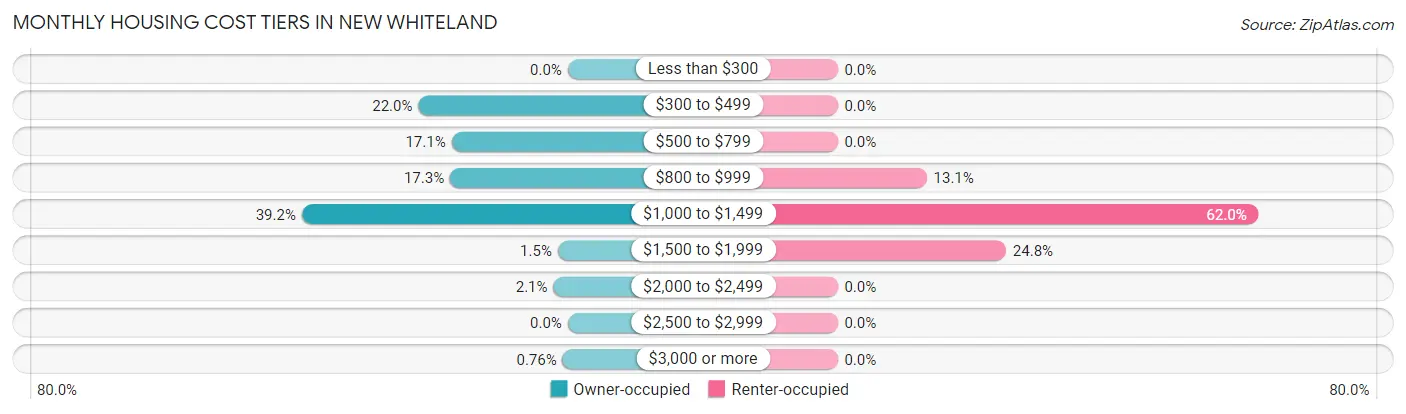
| Monthly Cost | Owner-occupied | Renter-occupied |
| Less than $300 | 0 (0.0%) | 0 (0.0%) |
| $300 to $499 | 405 (22.0%) | 0 (0.0%) |
| $500 to $799 | 315 (17.1%) | 0 (0.0%) |
| $800 to $999 | 319 (17.3%) | 18 (13.1%) |
| $1,000 to $1,499 | 721 (39.2%) | 85 (62.0%) |
| $1,500 to $1,999 | 27 (1.5%) | 34 (24.8%) |
| $2,000 to $2,499 | 39 (2.1%) | 0 (0.0%) |
| $2,500 to $2,999 | 0 (0.0%) | 0 (0.0%) |
| $3,000 or more | 14 (0.8%) | 0 (0.0%) |
| Total | 1,840 (100.0%) | 137 (100.0%) |
Physical Housing Characteristics in New Whiteland
Housing Structures in New Whiteland
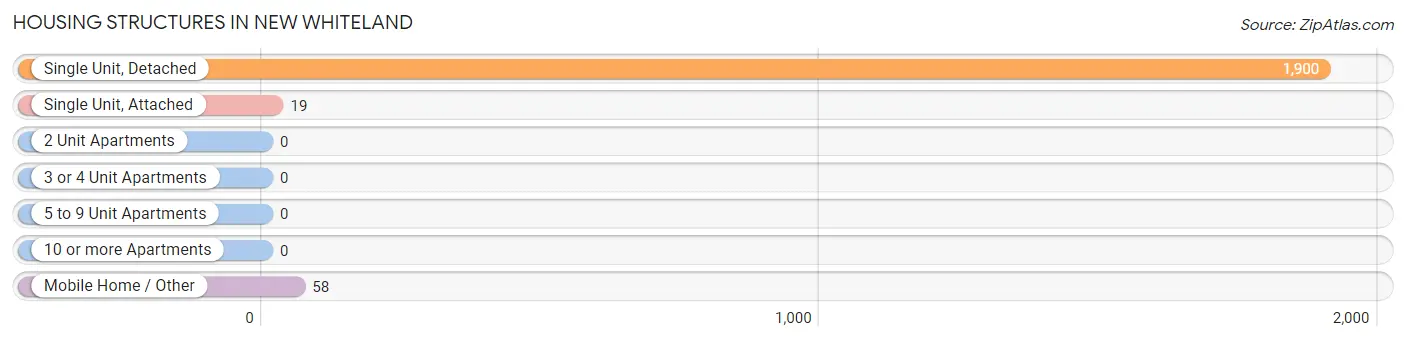
| Structure Type | # Housing Units | % Housing Units |
| Single Unit, Detached | 1,900 | 96.1% |
| Single Unit, Attached | 19 | 1.0% |
| 2 Unit Apartments | 0 | 0.0% |
| 3 or 4 Unit Apartments | 0 | 0.0% |
| 5 to 9 Unit Apartments | 0 | 0.0% |
| 10 or more Apartments | 0 | 0.0% |
| Mobile Home / Other | 58 | 2.9% |
| Total | 1,977 | 100.0% |
Housing Structures by Occupancy in New Whiteland
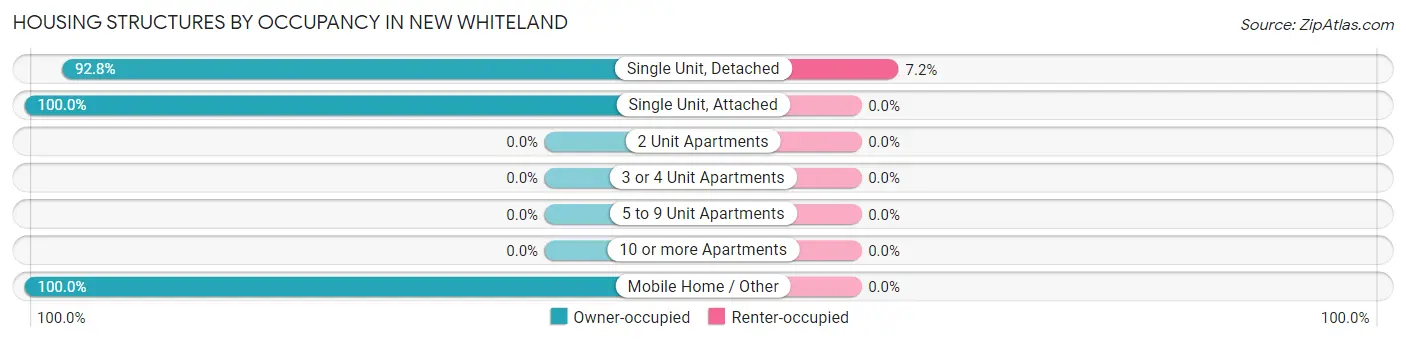
| Structure Type | Owner-occupied | Renter-occupied |
| Single Unit, Detached | 1,763 (92.8%) | 137 (7.2%) |
| Single Unit, Attached | 19 (100.0%) | 0 (0.0%) |
| 2 Unit Apartments | 0 (0.0%) | 0 (0.0%) |
| 3 or 4 Unit Apartments | 0 (0.0%) | 0 (0.0%) |
| 5 to 9 Unit Apartments | 0 (0.0%) | 0 (0.0%) |
| 10 or more Apartments | 0 (0.0%) | 0 (0.0%) |
| Mobile Home / Other | 58 (100.0%) | 0 (0.0%) |
| Total | 1,840 (93.1%) | 137 (6.9%) |
Housing Structures by Number of Rooms in New Whiteland
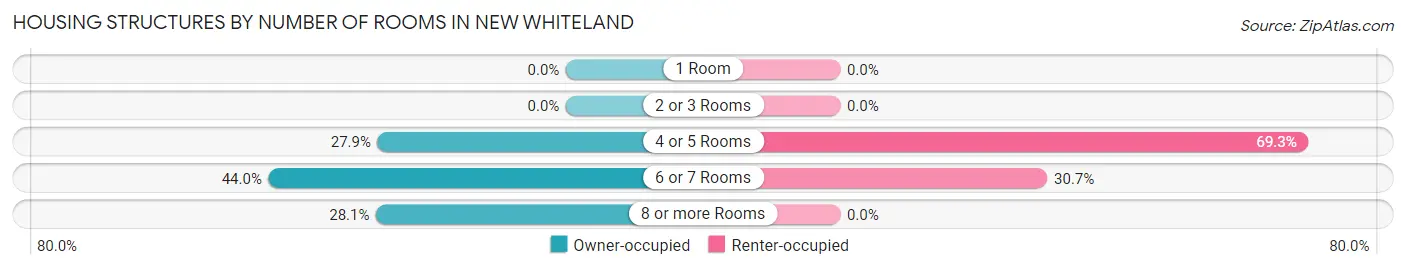
| Number of Rooms | Owner-occupied | Renter-occupied |
| 1 Room | 0 (0.0%) | 0 (0.0%) |
| 2 or 3 Rooms | 0 (0.0%) | 0 (0.0%) |
| 4 or 5 Rooms | 513 (27.9%) | 95 (69.3%) |
| 6 or 7 Rooms | 810 (44.0%) | 42 (30.7%) |
| 8 or more Rooms | 517 (28.1%) | 0 (0.0%) |
| Total | 1,840 (100.0%) | 137 (100.0%) |
Housing Structure by Heating Type in New Whiteland
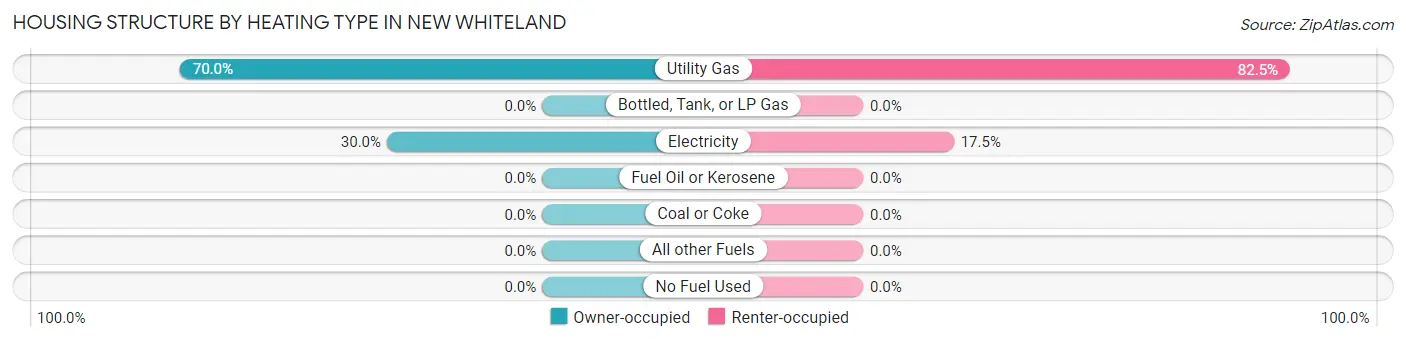
| Heating Type | Owner-occupied | Renter-occupied |
| Utility Gas | 1,288 (70.0%) | 113 (82.5%) |
| Bottled, Tank, or LP Gas | 0 (0.0%) | 0 (0.0%) |
| Electricity | 552 (30.0%) | 24 (17.5%) |
| Fuel Oil or Kerosene | 0 (0.0%) | 0 (0.0%) |
| Coal or Coke | 0 (0.0%) | 0 (0.0%) |
| All other Fuels | 0 (0.0%) | 0 (0.0%) |
| No Fuel Used | 0 (0.0%) | 0 (0.0%) |
| Total | 1,840 (100.0%) | 137 (100.0%) |
Household Vehicle Usage in New Whiteland
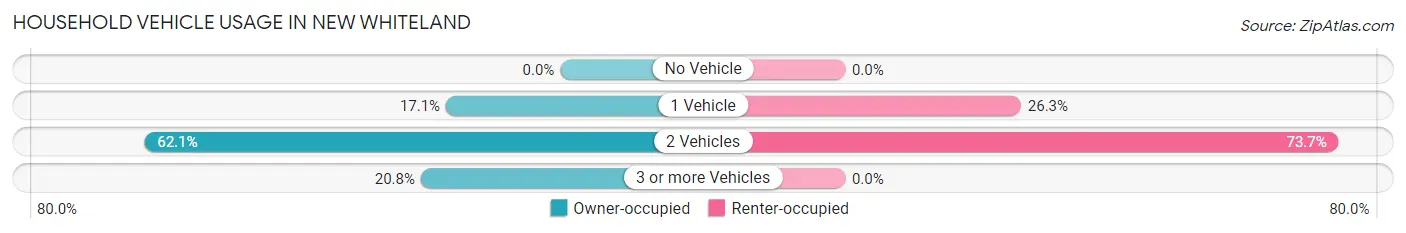
| Vehicles per Household | Owner-occupied | Renter-occupied |
| No Vehicle | 0 (0.0%) | 0 (0.0%) |
| 1 Vehicle | 314 (17.1%) | 36 (26.3%) |
| 2 Vehicles | 1,143 (62.1%) | 101 (73.7%) |
| 3 or more Vehicles | 383 (20.8%) | 0 (0.0%) |
| Total | 1,840 (100.0%) | 137 (100.0%) |
Real Estate & Mortgages in New Whiteland
Real Estate and Mortgage Overview in New Whiteland
| Characteristic | Without Mortgage | With Mortgage |
| Housing Units | 639 | 1,201 |
| Median Property Value | $176,300 | $167,900 |
| Median Household Income | $84,946 | $93 |
| Monthly Housing Costs | $476 | $0 |
| Real Estate Taxes | $1,492 | $0 |
Property Value by Mortgage Status in New Whiteland
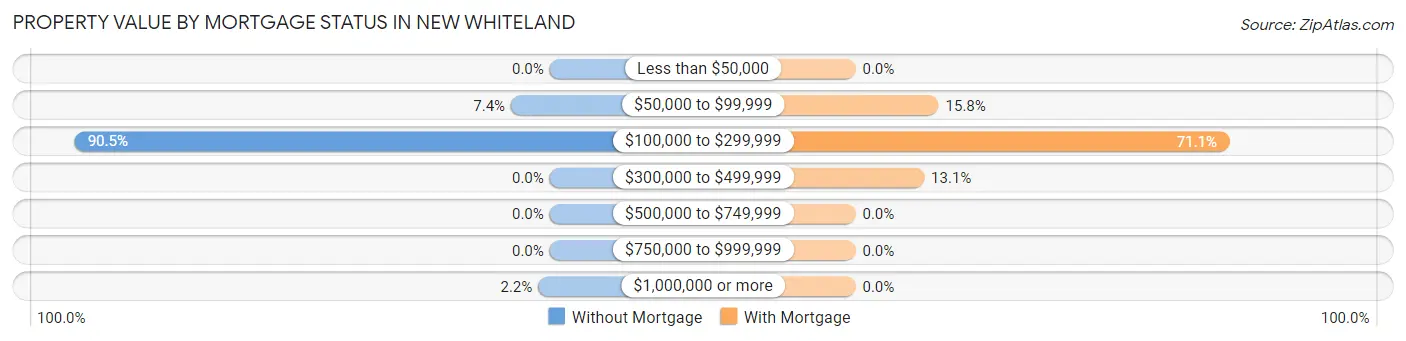
| Property Value | Without Mortgage | With Mortgage |
| Less than $50,000 | 0 (0.0%) | 0 (0.0%) |
| $50,000 to $99,999 | 47 (7.4%) | 190 (15.8%) |
| $100,000 to $299,999 | 578 (90.4%) | 854 (71.1%) |
| $300,000 to $499,999 | 0 (0.0%) | 157 (13.1%) |
| $500,000 to $749,999 | 0 (0.0%) | 0 (0.0%) |
| $750,000 to $999,999 | 0 (0.0%) | 0 (0.0%) |
| $1,000,000 or more | 14 (2.2%) | 0 (0.0%) |
| Total | 639 (100.0%) | 1,201 (100.0%) |
Household Income by Mortgage Status in New Whiteland
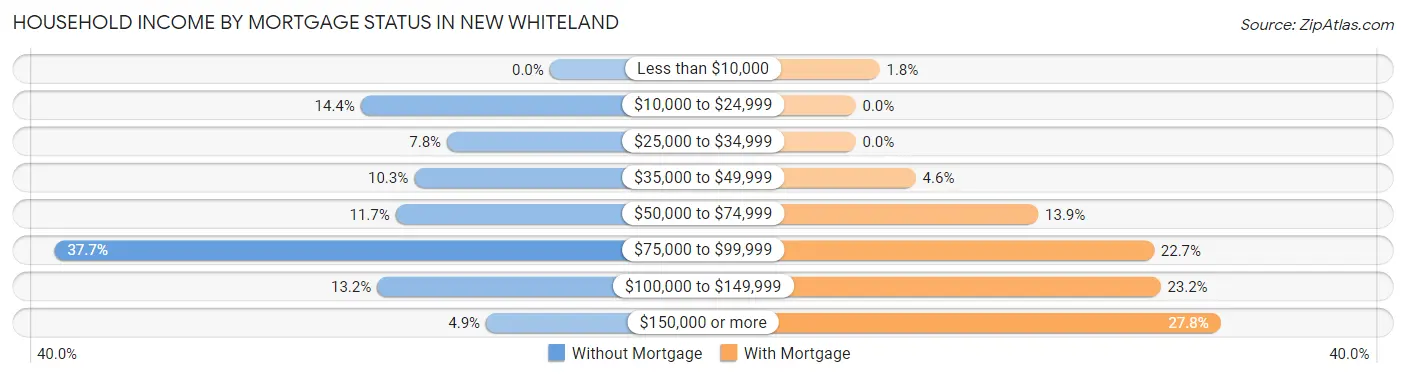
| Household Income | Without Mortgage | With Mortgage |
| Less than $10,000 | 0 (0.0%) | 22 (1.8%) |
| $10,000 to $24,999 | 92 (14.4%) | 0 (0.0%) |
| $25,000 to $34,999 | 50 (7.8%) | 0 (0.0%) |
| $35,000 to $49,999 | 66 (10.3%) | 55 (4.6%) |
| $50,000 to $74,999 | 75 (11.7%) | 167 (13.9%) |
| $75,000 to $99,999 | 241 (37.7%) | 273 (22.7%) |
| $100,000 to $149,999 | 84 (13.2%) | 279 (23.2%) |
| $150,000 or more | 31 (4.9%) | 334 (27.8%) |
| Total | 639 (100.0%) | 1,201 (100.0%) |
Property Value to Household Income Ratio in New Whiteland
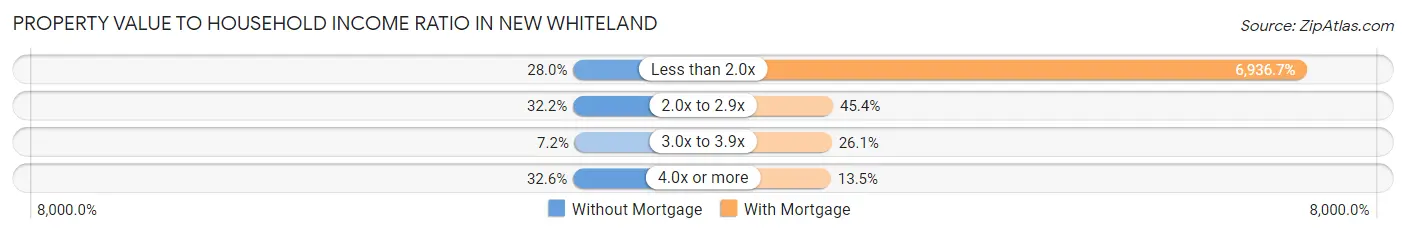
| Value-to-Income Ratio | Without Mortgage | With Mortgage |
| Less than 2.0x | 179 (28.0%) | 83,310 (6,936.7%) |
| 2.0x to 2.9x | 206 (32.2%) | 545 (45.4%) |
| 3.0x to 3.9x | 46 (7.2%) | 313 (26.1%) |
| 4.0x or more | 208 (32.6%) | 162 (13.5%) |
| Total | 639 (100.0%) | 1,201 (100.0%) |
Real Estate Taxes by Mortgage Status in New Whiteland
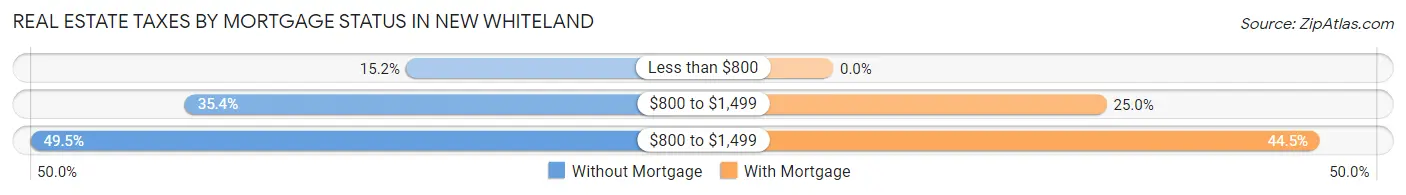
| Property Taxes | Without Mortgage | With Mortgage |
| Less than $800 | 97 (15.2%) | 0 (0.0%) |
| $800 to $1,499 | 226 (35.4%) | 300 (25.0%) |
| $800 to $1,499 | 316 (49.4%) | 534 (44.5%) |
| Total | 639 (100.0%) | 1,201 (100.0%) |
Health & Disability in New Whiteland
Health Insurance Coverage by Age in New Whiteland
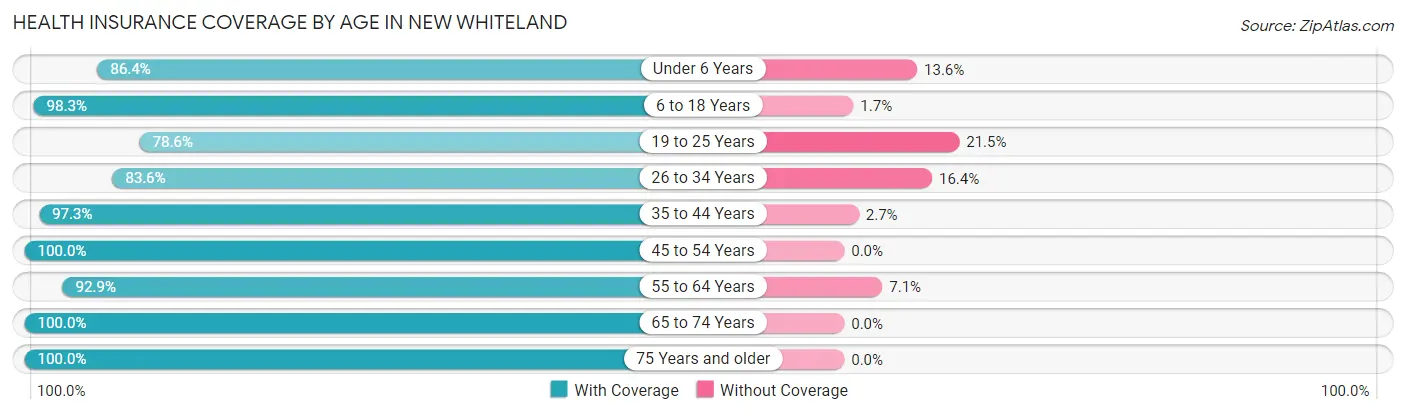
| Age Bracket | With Coverage | Without Coverage |
| Under 6 Years | 471 (86.4%) | 74 (13.6%) |
| 6 to 18 Years | 985 (98.3%) | 17 (1.7%) |
| 19 to 25 Years | 282 (78.5%) | 77 (21.4%) |
| 26 to 34 Years | 654 (83.6%) | 128 (16.4%) |
| 35 to 44 Years | 647 (97.3%) | 18 (2.7%) |
| 45 to 54 Years | 574 (100.0%) | 0 (0.0%) |
| 55 to 64 Years | 668 (92.9%) | 51 (7.1%) |
| 65 to 74 Years | 556 (100.0%) | 0 (0.0%) |
| 75 Years and older | 389 (100.0%) | 0 (0.0%) |
| Total | 5,226 (93.5%) | 365 (6.5%) |
Health Insurance Coverage by Citizenship Status in New Whiteland
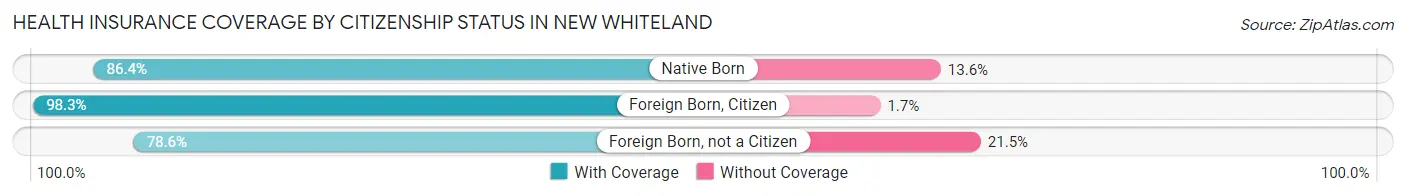
| Citizenship Status | With Coverage | Without Coverage |
| Native Born | 471 (86.4%) | 74 (13.6%) |
| Foreign Born, Citizen | 985 (98.3%) | 17 (1.7%) |
| Foreign Born, not a Citizen | 282 (78.5%) | 77 (21.4%) |
Health Insurance Coverage by Household Income in New Whiteland
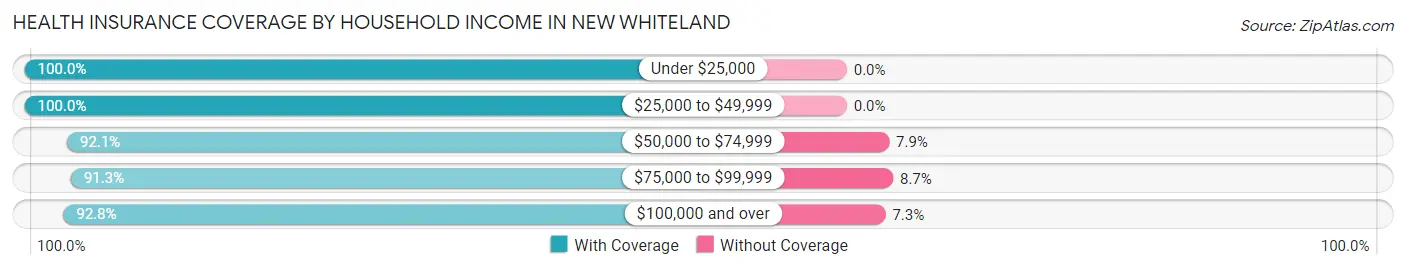
| Household Income | With Coverage | Without Coverage |
| Under $25,000 | 154 (100.0%) | 0 (0.0%) |
| $25,000 to $49,999 | 804 (100.0%) | 0 (0.0%) |
| $50,000 to $74,999 | 848 (92.1%) | 73 (7.9%) |
| $75,000 to $99,999 | 1,476 (91.3%) | 140 (8.7%) |
| $100,000 and over | 1,944 (92.7%) | 152 (7.2%) |
Public vs Private Health Insurance Coverage by Age in New Whiteland
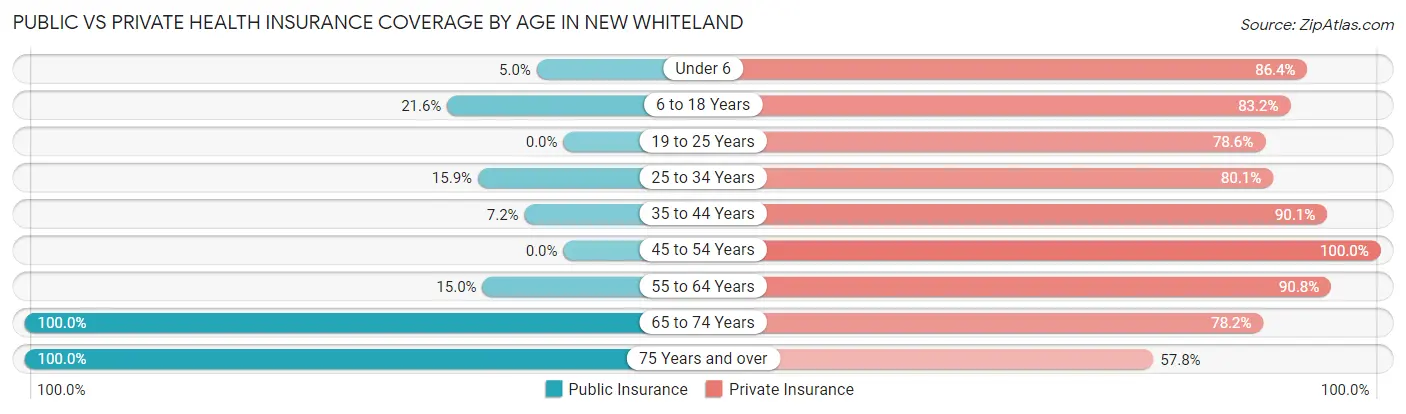
| Age Bracket | Public Insurance | Private Insurance |
| Under 6 | 27 (5.0%) | 471 (86.4%) |
| 6 to 18 Years | 216 (21.6%) | 834 (83.2%) |
| 19 to 25 Years | 0 (0.0%) | 282 (78.5%) |
| 25 to 34 Years | 124 (15.9%) | 626 (80.0%) |
| 35 to 44 Years | 48 (7.2%) | 599 (90.1%) |
| 45 to 54 Years | 0 (0.0%) | 574 (100.0%) |
| 55 to 64 Years | 108 (15.0%) | 653 (90.8%) |
| 65 to 74 Years | 556 (100.0%) | 435 (78.2%) |
| 75 Years and over | 389 (100.0%) | 225 (57.8%) |
| Total | 1,468 (26.3%) | 4,699 (84.1%) |
Disability Status by Sex by Age in New Whiteland
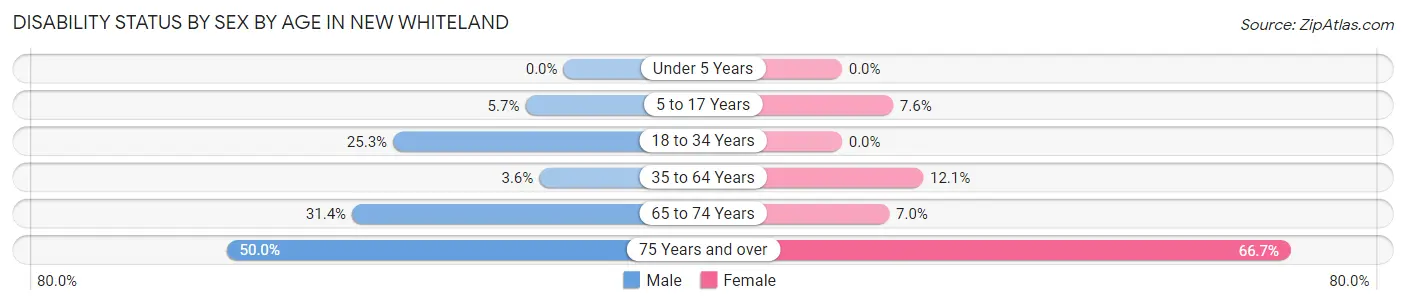
| Age Bracket | Male | Female |
| Under 5 Years | 0 (0.0%) | 0 (0.0%) |
| 5 to 17 Years | 36 (5.7%) | 33 (7.6%) |
| 18 to 34 Years | 184 (25.3%) | 0 (0.0%) |
| 35 to 64 Years | 29 (3.6%) | 139 (12.1%) |
| 65 to 74 Years | 103 (31.4%) | 16 (7.0%) |
| 75 Years and over | 70 (50.0%) | 166 (66.7%) |
Disability Class by Sex by Age in New Whiteland
Disability Class: Hearing Difficulty
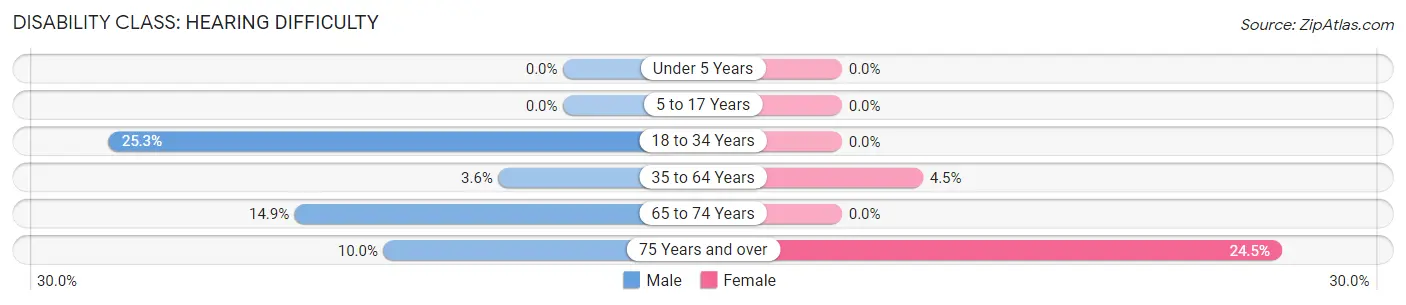
| Age Bracket | Male | Female |
| Under 5 Years | 0 (0.0%) | 0 (0.0%) |
| 5 to 17 Years | 0 (0.0%) | 0 (0.0%) |
| 18 to 34 Years | 184 (25.3%) | 0 (0.0%) |
| 35 to 64 Years | 29 (3.6%) | 52 (4.5%) |
| 65 to 74 Years | 49 (14.9%) | 0 (0.0%) |
| 75 Years and over | 14 (10.0%) | 61 (24.5%) |
Disability Class: Vision Difficulty
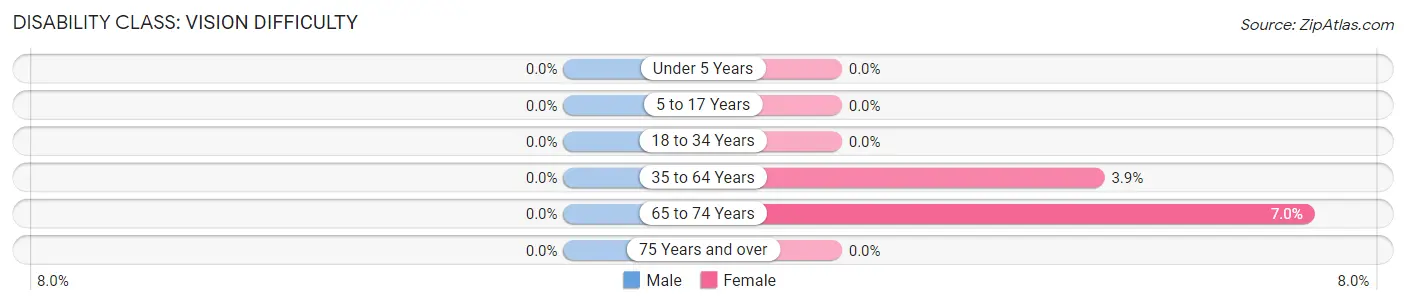
| Age Bracket | Male | Female |
| Under 5 Years | 0 (0.0%) | 0 (0.0%) |
| 5 to 17 Years | 0 (0.0%) | 0 (0.0%) |
| 18 to 34 Years | 0 (0.0%) | 0 (0.0%) |
| 35 to 64 Years | 0 (0.0%) | 45 (3.9%) |
| 65 to 74 Years | 0 (0.0%) | 16 (7.0%) |
| 75 Years and over | 0 (0.0%) | 0 (0.0%) |
Disability Class: Cognitive Difficulty
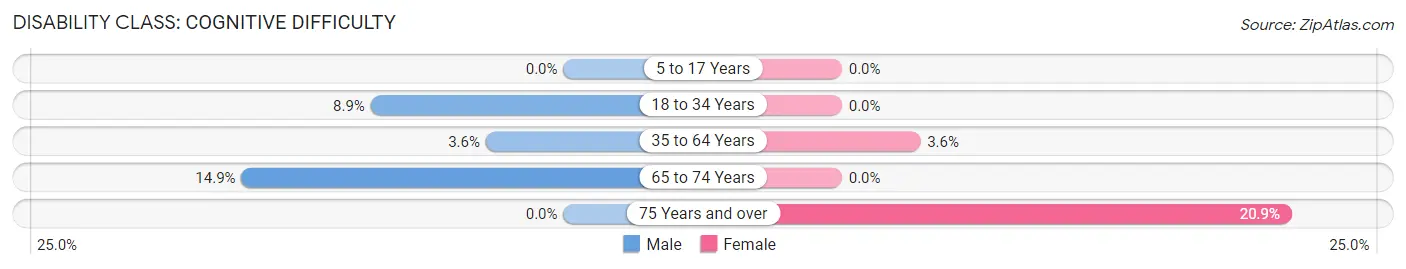
| Age Bracket | Male | Female |
| 5 to 17 Years | 0 (0.0%) | 0 (0.0%) |
| 18 to 34 Years | 65 (8.9%) | 0 (0.0%) |
| 35 to 64 Years | 29 (3.6%) | 42 (3.6%) |
| 65 to 74 Years | 49 (14.9%) | 0 (0.0%) |
| 75 Years and over | 0 (0.0%) | 52 (20.9%) |
Disability Class: Ambulatory Difficulty
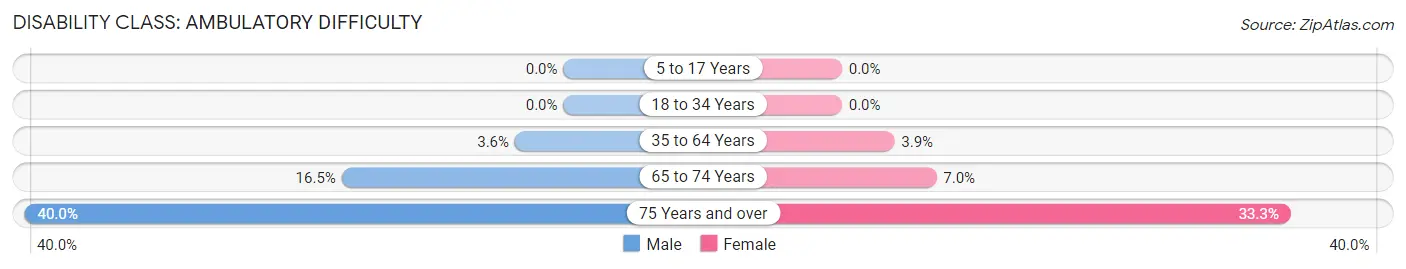
| Age Bracket | Male | Female |
| 5 to 17 Years | 0 (0.0%) | 0 (0.0%) |
| 18 to 34 Years | 0 (0.0%) | 0 (0.0%) |
| 35 to 64 Years | 29 (3.6%) | 45 (3.9%) |
| 65 to 74 Years | 54 (16.5%) | 16 (7.0%) |
| 75 Years and over | 56 (40.0%) | 83 (33.3%) |
Disability Class: Self-Care Difficulty
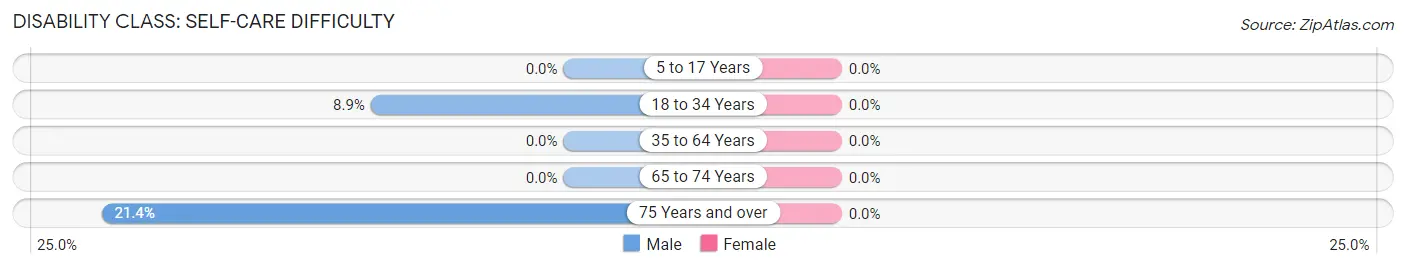
| Age Bracket | Male | Female |
| 5 to 17 Years | 0 (0.0%) | 0 (0.0%) |
| 18 to 34 Years | 65 (8.9%) | 0 (0.0%) |
| 35 to 64 Years | 0 (0.0%) | 0 (0.0%) |
| 65 to 74 Years | 0 (0.0%) | 0 (0.0%) |
| 75 Years and over | 30 (21.4%) | 0 (0.0%) |
Technology Access in New Whiteland
Computing Device Access in New Whiteland
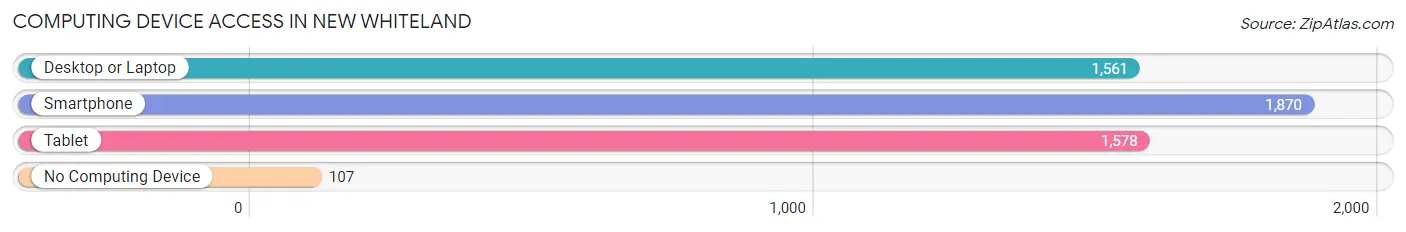
| Device Type | # Households | % Households |
| Desktop or Laptop | 1,561 | 79.0% |
| Smartphone | 1,870 | 94.6% |
| Tablet | 1,578 | 79.8% |
| No Computing Device | 107 | 5.4% |
| Total | 1,977 | 100.0% |
Internet Access in New Whiteland
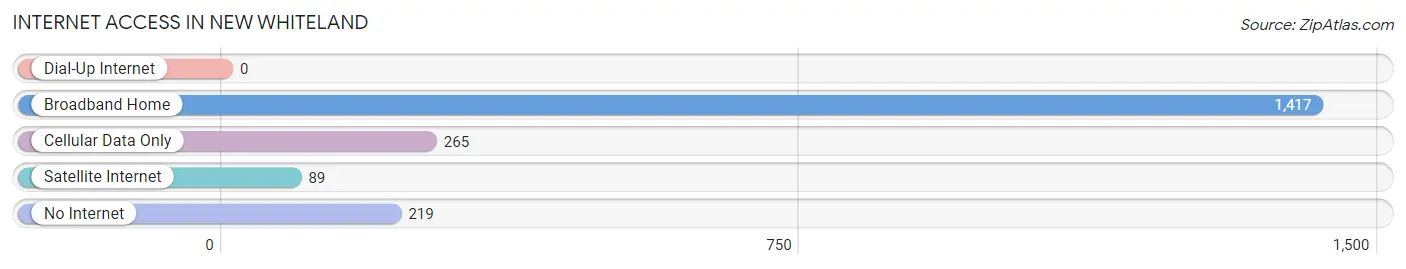
| Internet Type | # Households | % Households |
| Dial-Up Internet | 0 | 0.0% |
| Broadband Home | 1,417 | 71.7% |
| Cellular Data Only | 265 | 13.4% |
| Satellite Internet | 89 | 4.5% |
| No Internet | 219 | 11.1% |
| Total | 1,977 | 100.0% |
New Whiteland Summary
Whiteland, Indiana is a small town located in Johnson County, Indiana, about 20 miles south of Indianapolis. The town was founded in 1851 and has a population of approximately 5,000 people.
History
Whiteland was founded in 1851 by a group of settlers from Whiteland, Pennsylvania. The town was named after the Pennsylvania town, and the settlers brought with them the same name. The town was originally a farming community, and the settlers grew corn, wheat, and other crops. The town was also known for its brickyards, which produced bricks for the construction of homes and businesses in the area.
In the late 1800s, the town began to grow and develop. The railroad came to Whiteland in 1883, and the town became a stop on the line. This allowed for the transportation of goods and people to and from the town. The railroad also helped to bring new businesses to the area, including a flour mill, a sawmill, and a brickyard.
In the early 1900s, the town continued to grow and develop. The town was home to several churches, a bank, a post office, and a variety of stores. The town also had a movie theater, a library, and a hospital.
Geography
Whiteland is located in Johnson County, Indiana, about 20 miles south of Indianapolis. The town is situated on the banks of the White River, which flows through the town. The town is surrounded by rolling hills and farmland. The town is also located near the town of Franklin, which is about 10 miles to the east.
Economy
The economy of Whiteland is largely based on agriculture. The town is home to several farms, which produce corn, wheat, soybeans, and other crops. The town also has several businesses, including a grocery store, a hardware store, and a variety of restaurants.
Demographics
As of the 2010 census, the population of Whiteland was 5,000. The town is predominantly white, with about 95% of the population being white. The town also has a small Hispanic population, with about 2% of the population being Hispanic. The median household income in Whiteland is $45,000, and the median home value is $150,000.
Conclusion
Whiteland, Indiana is a small town located in Johnson County, Indiana, about 20 miles south of Indianapolis. The town was founded in 1851 and has a population of approximately 5,000 people. The town is largely based on agriculture, and the economy is supported by several businesses. The town is predominantly white, with about 95% of the population being white. The median household income in Whiteland is $45,000, and the median home value is $150,000.
Common Questions
What is Per Capita Income in New Whiteland?
Per Capita income in New Whiteland is $30,125.
What is the Median Family Income in New Whiteland?
Median Family Income in New Whiteland is $86,250.
What is the Median Household income in New Whiteland?
Median Household Income in New Whiteland is $83,958.
What is Income or Wage Gap in New Whiteland?
Income or Wage Gap in New Whiteland is 12.1%.
Women in New Whiteland earn 87.9 cents for every dollar earned by a man.
What is Inequality or Gini Index in New Whiteland?
Inequality or Gini Index in New Whiteland is 0.27.
What is the Total Population of New Whiteland?
Total Population of New Whiteland is 5,591.
What is the Total Male Population of New Whiteland?
Total Male Population of New Whiteland is 2,814.
What is the Total Female Population of New Whiteland?
Total Female Population of New Whiteland is 2,777.
What is the Ratio of Males per 100 Females in New Whiteland?
There are 101.33 Males per 100 Females in New Whiteland.
What is the Ratio of Females per 100 Males in New Whiteland?
There are 98.69 Females per 100 Males in New Whiteland.
What is the Median Population Age in New Whiteland?
Median Population Age in New Whiteland is 38.3 Years.
What is the Average Family Size in New Whiteland
Average Family Size in New Whiteland is 3.1 People.
What is the Average Household Size in New Whiteland
Average Household Size in New Whiteland is 2.8 People.
How Large is the Labor Force in New Whiteland?
There are 2,823 People in the Labor Forcein in New Whiteland.
What is the Percentage of People in the Labor Force in New Whiteland?
64.3% of People are in the Labor Force in New Whiteland.
What is the Unemployment Rate in New Whiteland?
Unemployment Rate in New Whiteland is 1.2%.