Zip Codes with the Highest Percentage of Population Employed in Life, Physical & Social Science in Indiana
RELATED REPORTS & OPTIONS
Life, Physical & Social Science
Indiana
Compare Zip Codes
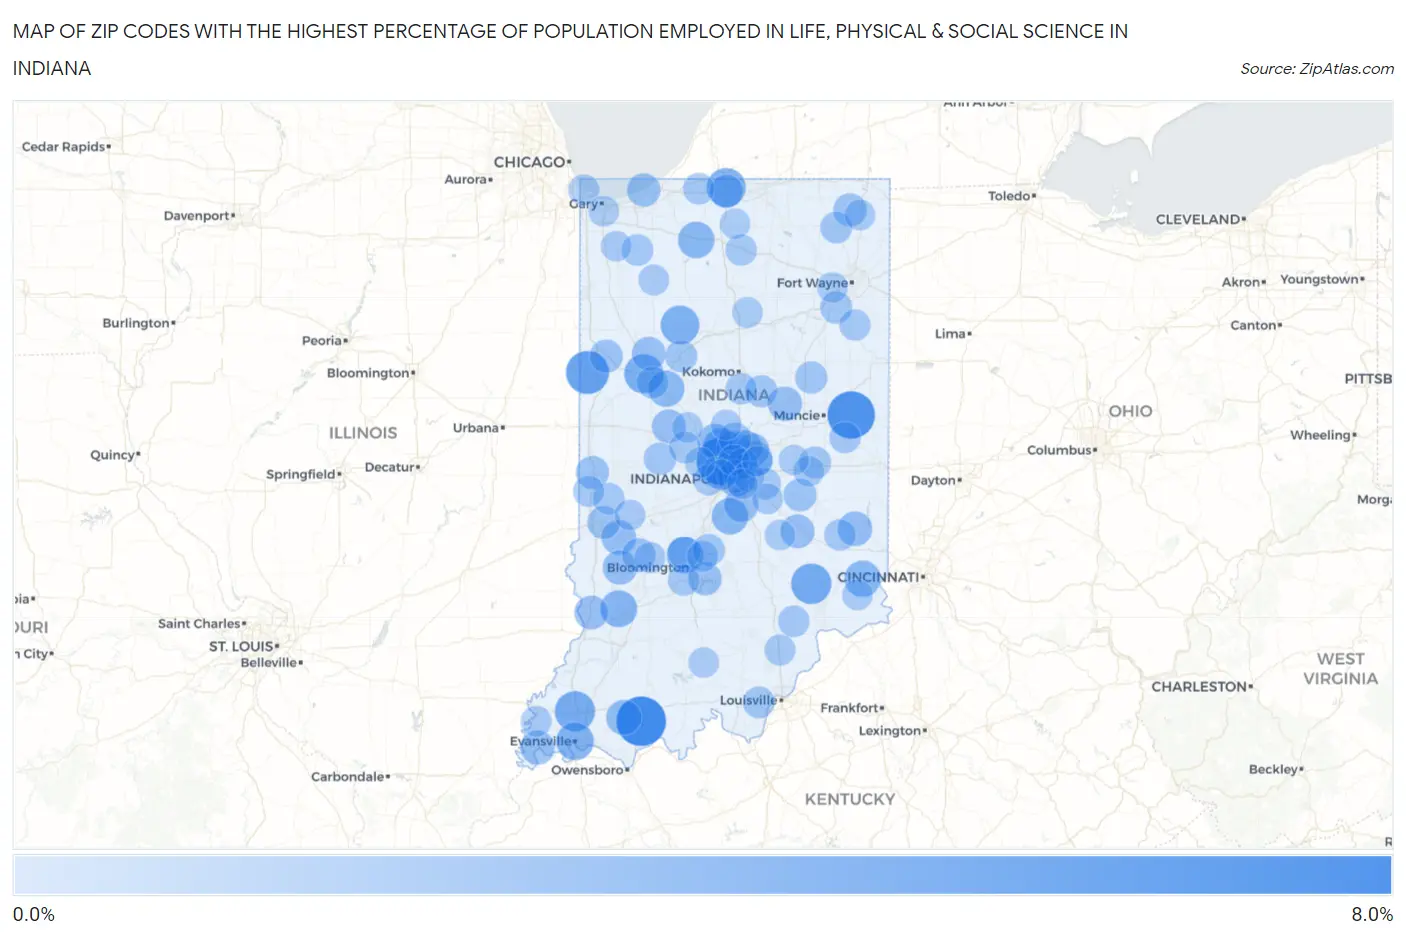
Map of Zip Codes with the Highest Percentage of Population Employed in Life, Physical & Social Science in Indiana
0.0%
8.0%
Zip Codes with the Highest Percentage of Population Employed in Life, Physical & Social Science in Indiana
| Zip Code | % Employed | vs State | vs National | |
| 1. | 47552 | 7.9% | 0.83%(+7.05)#1 | 1.1%(+6.79)#332 |
| 2. | 47340 | 7.1% | 0.83%(+6.32)#2 | 1.1%(+6.06)#394 |
| 3. | 46278 | 6.9% | 0.83%(+6.11)#3 | 1.1%(+5.85)#416 |
| 4. | 47917 | 5.6% | 0.83%(+4.81)#4 | 1.1%(+4.55)#602 |
| 5. | 47223 | 4.7% | 0.83%(+3.87)#5 | 1.1%(+3.61)#849 |
| 6. | 47639 | 4.7% | 0.83%(+3.83)#6 | 1.1%(+3.57)#862 |
| 7. | 47906 | 4.3% | 0.83%(+3.47)#7 | 1.1%(+3.21)#1,002 |
| 8. | 46556 | 4.2% | 0.83%(+3.41)#8 | 1.1%(+3.16)#1,026 |
| 9. | 47950 | 4.1% | 0.83%(+3.31)#9 | 1.1%(+3.05)#1,079 |
| 10. | 47708 | 3.8% | 0.83%(+3.00)#10 | 1.1%(+2.74)#1,248 |
| 11. | 46204 | 3.8% | 0.83%(+2.98)#11 | 1.1%(+2.72)#1,261 |
| 12. | 47578 | 3.5% | 0.83%(+2.69)#12 | 1.1%(+2.43)#1,411 |
| 13. | 47404 | 3.4% | 0.83%(+2.58)#13 | 1.1%(+2.32)#1,493 |
| 14. | 46531 | 3.4% | 0.83%(+2.57)#14 | 1.1%(+2.31)#1,501 |
| 15. | 46106 | 3.4% | 0.83%(+2.55)#15 | 1.1%(+2.29)#1,511 |
| 16. | 47941 | 3.3% | 0.83%(+2.51)#16 | 1.1%(+2.25)#1,541 |
| 17. | 47032 | 3.3% | 0.83%(+2.50)#17 | 1.1%(+2.24)#1,544 |
| 18. | 46077 | 3.3% | 0.83%(+2.46)#18 | 1.1%(+2.21)#1,583 |
| 19. | 46032 | 2.9% | 0.83%(+2.09)#19 | 1.1%(+1.83)#1,966 |
| 20. | 47637 | 2.9% | 0.83%(+2.08)#20 | 1.1%(+1.82)#1,983 |
| 21. | 46256 | 2.9% | 0.83%(+2.07)#21 | 1.1%(+1.81)#1,996 |
| 22. | 46075 | 2.9% | 0.83%(+2.05)#22 | 1.1%(+1.79)#2,012 |
| 23. | 47846 | 2.8% | 0.83%(+1.95)#23 | 1.1%(+1.69)#2,134 |
| 24. | 47030 | 2.8% | 0.83%(+1.94)#24 | 1.1%(+1.68)#2,149 |
| 25. | 47438 | 2.7% | 0.83%(+1.87)#25 | 1.1%(+1.61)#2,250 |
| 26. | 46033 | 2.7% | 0.83%(+1.83)#26 | 1.1%(+1.57)#2,292 |
| 27. | 47620 | 2.7% | 0.83%(+1.82)#27 | 1.1%(+1.56)#2,308 |
| 28. | 46063 | 2.6% | 0.83%(+1.82)#28 | 1.1%(+1.56)#2,318 |
| 29. | 46143 | 2.6% | 0.83%(+1.80)#29 | 1.1%(+1.54)#2,339 |
| 30. | 47923 | 2.5% | 0.83%(+1.70)#30 | 1.1%(+1.44)#2,506 |
| 31. | 47272 | 2.5% | 0.83%(+1.69)#31 | 1.1%(+1.43)#2,542 |
| 32. | 47940 | 2.5% | 0.83%(+1.68)#32 | 1.1%(+1.42)#2,559 |
| 33. | 47561 | 2.5% | 0.83%(+1.65)#33 | 1.1%(+1.39)#2,605 |
| 34. | 46038 | 2.5% | 0.83%(+1.64)#34 | 1.1%(+1.38)#2,622 |
| 35. | 46228 | 2.5% | 0.83%(+1.64)#35 | 1.1%(+1.38)#2,630 |
| 36. | 47427 | 2.4% | 0.83%(+1.60)#36 | 1.1%(+1.34)#2,689 |
| 37. | 46202 | 2.4% | 0.83%(+1.59)#37 | 1.1%(+1.33)#2,717 |
| 38. | 46617 | 2.4% | 0.83%(+1.56)#38 | 1.1%(+1.30)#2,784 |
| 39. | 46301 | 2.4% | 0.83%(+1.55)#39 | 1.1%(+1.29)#2,790 |
| 40. | 47401 | 2.3% | 0.83%(+1.50)#40 | 1.1%(+1.24)#2,875 |
| 41. | 46747 | 2.3% | 0.83%(+1.49)#41 | 1.1%(+1.23)#2,889 |
| 42. | 47944 | 2.3% | 0.83%(+1.49)#42 | 1.1%(+1.23)#2,900 |
| 43. | 47854 | 2.3% | 0.83%(+1.44)#43 | 1.1%(+1.18)#3,017 |
| 44. | 46104 | 2.2% | 0.83%(+1.37)#44 | 1.1%(+1.11)#3,180 |
| 45. | 47803 | 2.2% | 0.83%(+1.36)#45 | 1.1%(+1.10)#3,206 |
| 46. | 47954 | 2.0% | 0.83%(+1.21)#46 | 1.1%(+0.950)#3,565 |
| 47. | 46074 | 2.0% | 0.83%(+1.20)#47 | 1.1%(+0.945)#3,583 |
| 48. | 47429 | 2.0% | 0.83%(+1.19)#48 | 1.1%(+0.934)#3,613 |
| 49. | 46076 | 2.0% | 0.83%(+1.16)#49 | 1.1%(+0.902)#3,702 |
| 50. | 46989 | 2.0% | 0.83%(+1.16)#50 | 1.1%(+0.900)#3,712 |
| 51. | 47468 | 1.9% | 0.83%(+1.11)#51 | 1.1%(+0.855)#3,843 |
| 52. | 46799 | 1.9% | 0.83%(+1.10)#52 | 1.1%(+0.841)#3,879 |
| 53. | 47344 | 1.9% | 0.83%(+1.09)#53 | 1.1%(+0.832)#3,907 |
| 54. | 46923 | 1.9% | 0.83%(+1.07)#54 | 1.1%(+0.809)#3,975 |
| 55. | 47901 | 1.8% | 0.83%(+1.01)#55 | 1.1%(+0.749)#4,177 |
| 56. | 46755 | 1.8% | 0.83%(+0.988)#56 | 1.1%(+0.728)#4,260 |
| 57. | 47136 | 1.8% | 0.83%(+0.973)#57 | 1.1%(+0.713)#4,307 |
| 58. | 46147 | 1.8% | 0.83%(+0.964)#58 | 1.1%(+0.705)#4,340 |
| 59. | 46163 | 1.8% | 0.83%(+0.950)#59 | 1.1%(+0.690)#4,392 |
| 60. | 47874 | 1.8% | 0.83%(+0.949)#60 | 1.1%(+0.689)#4,397 |
| 61. | 46347 | 1.8% | 0.83%(+0.942)#61 | 1.1%(+0.683)#4,430 |
| 62. | 47403 | 1.7% | 0.83%(+0.916)#62 | 1.1%(+0.657)#4,517 |
| 63. | 47036 | 1.7% | 0.83%(+0.911)#63 | 1.1%(+0.651)#4,544 |
| 64. | 47230 | 1.7% | 0.83%(+0.897)#64 | 1.1%(+0.637)#4,602 |
| 65. | 46552 | 1.7% | 0.83%(+0.871)#65 | 1.1%(+0.612)#4,715 |
| 66. | 47354 | 1.7% | 0.83%(+0.849)#66 | 1.1%(+0.590)#4,819 |
| 67. | 46068 | 1.7% | 0.83%(+0.844)#67 | 1.1%(+0.584)#4,842 |
| 68. | 46731 | 1.7% | 0.83%(+0.828)#68 | 1.1%(+0.569)#4,898 |
| 69. | 46504 | 1.6% | 0.83%(+0.815)#69 | 1.1%(+0.555)#4,966 |
| 70. | 47408 | 1.6% | 0.83%(+0.801)#70 | 1.1%(+0.542)#5,023 |
| 71. | 47842 | 1.6% | 0.83%(+0.771)#71 | 1.1%(+0.511)#5,147 |
| 72. | 46234 | 1.6% | 0.83%(+0.729)#72 | 1.1%(+0.469)#5,333 |
| 73. | 46394 | 1.6% | 0.83%(+0.721)#73 | 1.1%(+0.461)#5,369 |
| 74. | 47177 | 1.5% | 0.83%(+0.711)#74 | 1.1%(+0.452)#5,423 |
| 75. | 47957 | 1.5% | 0.83%(+0.689)#75 | 1.1%(+0.430)#5,544 |
| 76. | 46926 | 1.5% | 0.83%(+0.680)#76 | 1.1%(+0.420)#5,600 |
| 77. | 46126 | 1.5% | 0.83%(+0.679)#77 | 1.1%(+0.420)#5,604 |
| 78. | 46123 | 1.5% | 0.83%(+0.669)#78 | 1.1%(+0.410)#5,655 |
| 79. | 46705 | 1.5% | 0.83%(+0.661)#79 | 1.1%(+0.402)#5,695 |
| 80. | 47431 | 1.5% | 0.83%(+0.659)#80 | 1.1%(+0.400)#5,705 |
| 81. | 46220 | 1.5% | 0.83%(+0.654)#81 | 1.1%(+0.395)#5,729 |
| 82. | 46071 | 1.5% | 0.83%(+0.651)#82 | 1.1%(+0.391)#5,751 |
| 83. | 47631 | 1.5% | 0.83%(+0.644)#83 | 1.1%(+0.384)#5,796 |
| 84. | 46814 | 1.5% | 0.83%(+0.643)#84 | 1.1%(+0.383)#5,807 |
| 85. | 46260 | 1.5% | 0.83%(+0.642)#85 | 1.1%(+0.382)#5,812 |
| 86. | 46148 | 1.5% | 0.83%(+0.629)#86 | 1.1%(+0.370)#5,867 |
| 87. | 46219 | 1.5% | 0.83%(+0.623)#87 | 1.1%(+0.364)#5,898 |
| 88. | 46214 | 1.5% | 0.83%(+0.621)#88 | 1.1%(+0.361)#5,910 |
| 89. | 46203 | 1.5% | 0.83%(+0.620)#89 | 1.1%(+0.361)#5,912 |
| 90. | 46341 | 1.4% | 0.83%(+0.610)#90 | 1.1%(+0.351)#5,953 |
| 91. | 46069 | 1.4% | 0.83%(+0.587)#91 | 1.1%(+0.328)#6,090 |
| 92. | 47857 | 1.4% | 0.83%(+0.587)#92 | 1.1%(+0.328)#6,092 |
| 93. | 46236 | 1.4% | 0.83%(+0.587)#93 | 1.1%(+0.327)#6,094 |
| 94. | 47018 | 1.4% | 0.83%(+0.582)#94 | 1.1%(+0.322)#6,118 |
| 95. | 46167 | 1.4% | 0.83%(+0.579)#95 | 1.1%(+0.319)#6,133 |
| 96. | 46409 | 1.4% | 0.83%(+0.571)#96 | 1.1%(+0.312)#6,174 |
| 97. | 47454 | 1.4% | 0.83%(+0.559)#97 | 1.1%(+0.299)#6,255 |
| 98. | 46506 | 1.4% | 0.83%(+0.548)#98 | 1.1%(+0.288)#6,312 |
| 99. | 47234 | 1.4% | 0.83%(+0.547)#99 | 1.1%(+0.288)#6,316 |
| 100. | 46186 | 1.3% | 0.83%(+0.515)#100 | 1.1%(+0.255)#6,492 |
Common Questions
What are the Top 10 Zip Codes with the Highest Percentage of Population Employed in Life, Physical & Social Science in Indiana?
Top 10 Zip Codes with the Highest Percentage of Population Employed in Life, Physical & Social Science in Indiana are:
What zip code has the Highest Percentage of Population Employed in Life, Physical & Social Science in Indiana?
47552 has the Highest Percentage of Population Employed in Life, Physical & Social Science in Indiana with 7.9%.
What is the Percentage of Population Employed in Life, Physical & Social Science in the State of Indiana?
Percentage of Population Employed in Life, Physical & Social Science in Indiana is 0.83%.
What is the Percentage of Population Employed in Life, Physical & Social Science in the United States?
Percentage of Population Employed in Life, Physical & Social Science in the United States is 1.1%.