Upland, IN Map & Demographics
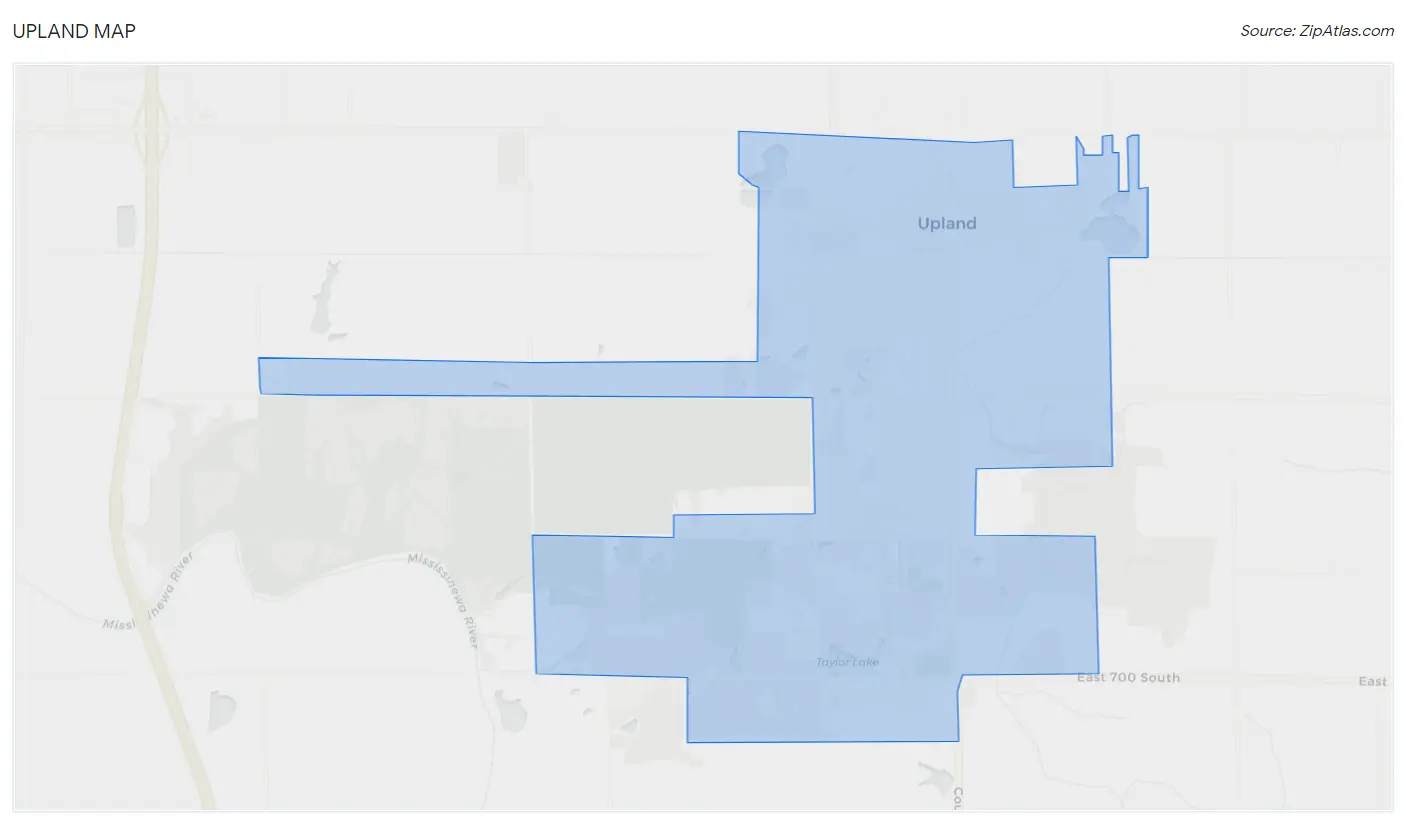
Upland Map
Upland Overview
$20,568
PER CAPITA INCOME
$76,193
AVG FAMILY INCOME
$67,813
AVG HOUSEHOLD INCOME
28.2%
WAGE / INCOME GAP [ % ]
71.8¢/ $1
WAGE / INCOME GAP [ $ ]
0.40
INEQUALITY / GINI INDEX
3,963
TOTAL POPULATION
1,853
MALE POPULATION
2,110
FEMALE POPULATION
87.82
MALES / 100 FEMALES
113.87
FEMALES / 100 MALES
21.7
MEDIAN AGE
3.3
AVG FAMILY SIZE
2.8
AVG HOUSEHOLD SIZE
1,941
LABOR FORCE [ PEOPLE ]
59.4%
PERCENT IN LABOR FORCE
2.5%
UNEMPLOYMENT RATE
Upland Zip Codes
Upland Area Codes
Income in Upland
Income Overview in Upland
Per Capita Income in Upland is $20,568, while median incomes of families and households are $76,193 and $67,813 respectively.
| Characteristic | Number | Measure |
| Per Capita Income | 3,963 | $20,568 |
| Median Family Income | 688 | $76,193 |
| Mean Family Income | 688 | $91,658 |
| Median Household Income | 918 | $67,813 |
| Mean Household Income | 918 | $80,080 |
| Income Deficit | 688 | $0 |
| Wage / Income Gap (%) | 3,963 | 28.21% |
| Wage / Income Gap ($) | 3,963 | 71.79¢ per $1 |
| Gini / Inequality Index | 3,963 | 0.40 |
Earnings by Sex in Upland
Average Earnings in Upland are $8,554, $10,337 for men and $7,421 for women, a difference of 28.2%.
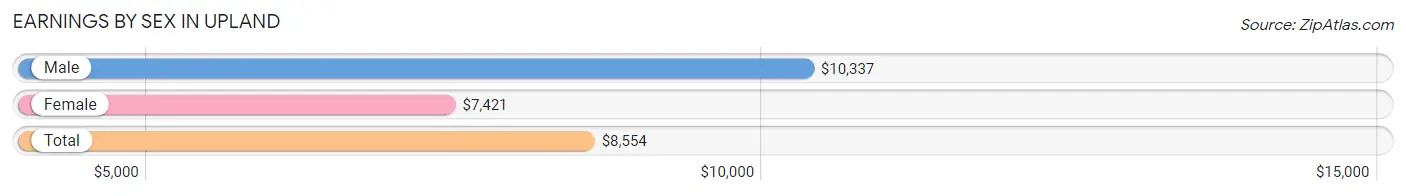
| Sex | Number | Average Earnings |
| Male | 1,290 (53.3%) | $10,337 |
| Female | 1,129 (46.7%) | $7,421 |
| Total | 2,419 (100.0%) | $8,554 |
Earnings by Sex by Income Bracket in Upland
The most common earnings brackets in Upland are $2,499 or less for men (286 | 22.2%) and $2,499 or less for women (211 | 18.7%).
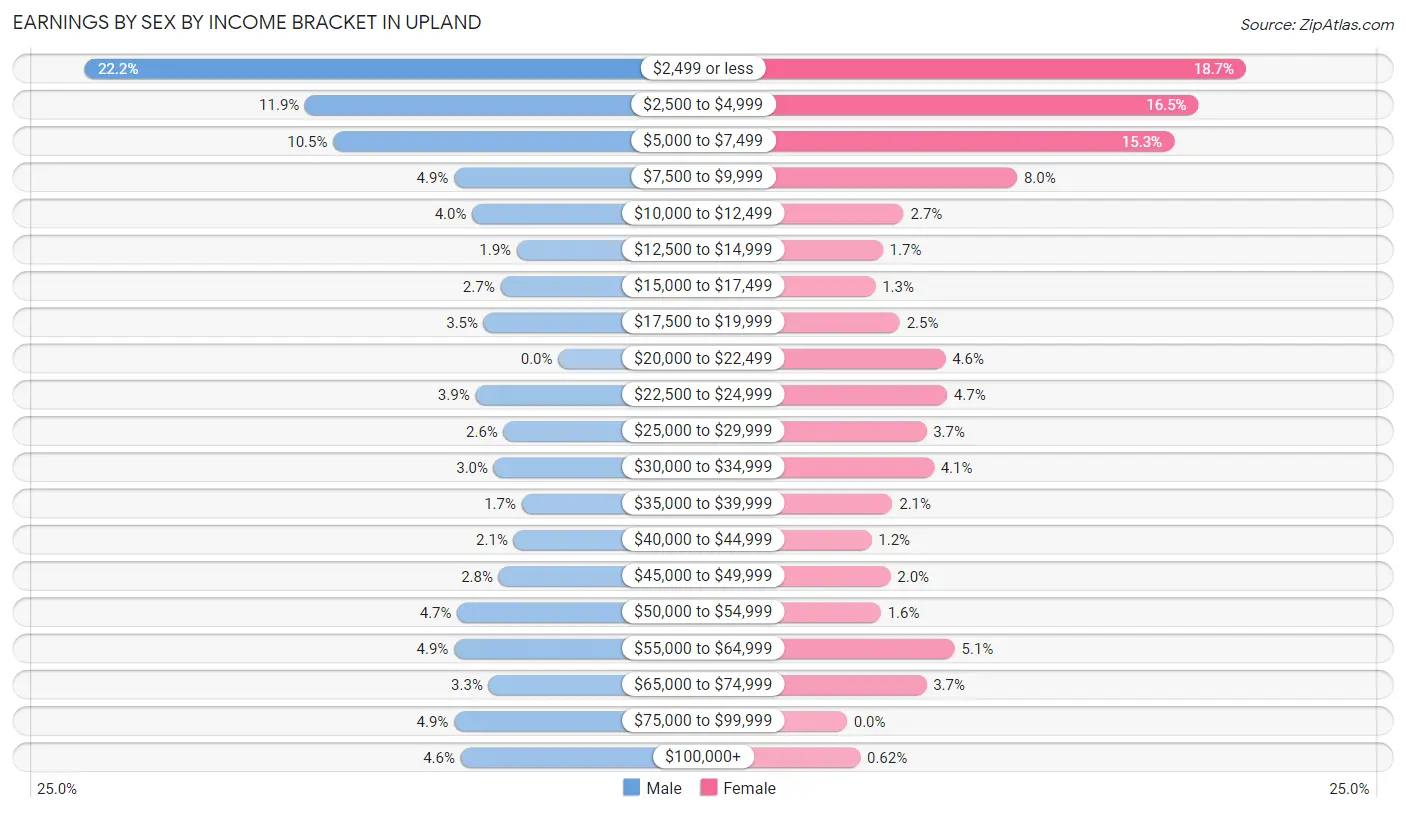
| Income | Male | Female |
| $2,499 or less | 286 (22.2%) | 211 (18.7%) |
| $2,500 to $4,999 | 153 (11.9%) | 186 (16.5%) |
| $5,000 to $7,499 | 136 (10.5%) | 173 (15.3%) |
| $7,500 to $9,999 | 63 (4.9%) | 90 (8.0%) |
| $10,000 to $12,499 | 52 (4.0%) | 30 (2.7%) |
| $12,500 to $14,999 | 25 (1.9%) | 19 (1.7%) |
| $15,000 to $17,499 | 35 (2.7%) | 15 (1.3%) |
| $17,500 to $19,999 | 45 (3.5%) | 28 (2.5%) |
| $20,000 to $22,499 | 0 (0.0%) | 52 (4.6%) |
| $22,500 to $24,999 | 50 (3.9%) | 53 (4.7%) |
| $25,000 to $29,999 | 33 (2.6%) | 42 (3.7%) |
| $30,000 to $34,999 | 39 (3.0%) | 46 (4.1%) |
| $35,000 to $39,999 | 22 (1.7%) | 24 (2.1%) |
| $40,000 to $44,999 | 27 (2.1%) | 13 (1.1%) |
| $45,000 to $49,999 | 36 (2.8%) | 23 (2.0%) |
| $50,000 to $54,999 | 61 (4.7%) | 18 (1.6%) |
| $55,000 to $64,999 | 63 (4.9%) | 57 (5.1%) |
| $65,000 to $74,999 | 42 (3.3%) | 42 (3.7%) |
| $75,000 to $99,999 | 63 (4.9%) | 0 (0.0%) |
| $100,000+ | 59 (4.6%) | 7 (0.6%) |
| Total | 1,290 (100.0%) | 1,129 (100.0%) |
Earnings by Sex by Educational Attainment in Upland
Average earnings in Upland are $50,164 for men and $26,500 for women, a difference of 47.2%. Men with an educational attainment of graduate degree enjoy the highest average annual earnings of $58,864, while those with high school diploma education earn the least with $32,639. Women with an educational attainment of graduate degree earn the most with the average annual earnings of $45,625, while those with high school diploma education have the smallest earnings of $18,750.
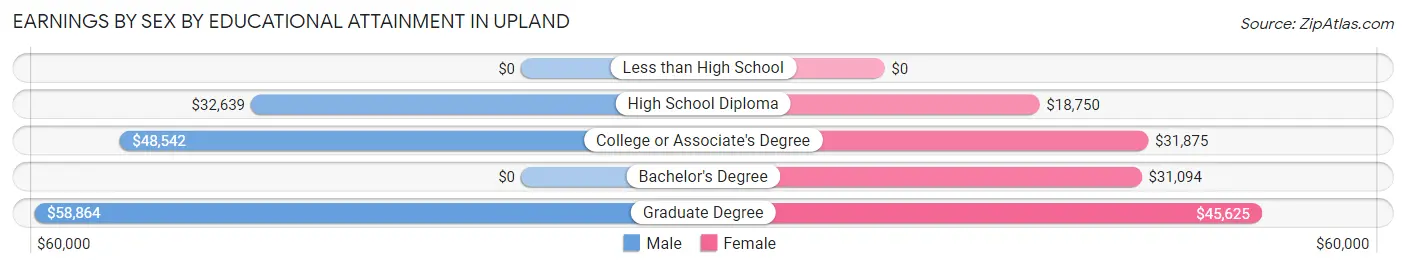
| Educational Attainment | Male Income | Female Income |
| Less than High School | - | - |
| High School Diploma | $32,639 | $18,750 |
| College or Associate's Degree | $48,542 | $31,875 |
| Bachelor's Degree | - | - |
| Graduate Degree | $58,864 | $45,625 |
| Total | $50,164 | $26,500 |
Family Income in Upland
Family Income Brackets in Upland
According to the Upland family income data, there are 177 families falling into the $100,000 to $149,999 income range, which is the most common income bracket and makes up 25.7% of all families. Conversely, the $200,000+ income bracket is the least frequent group with only 4 families (0.6%) belonging to this category.
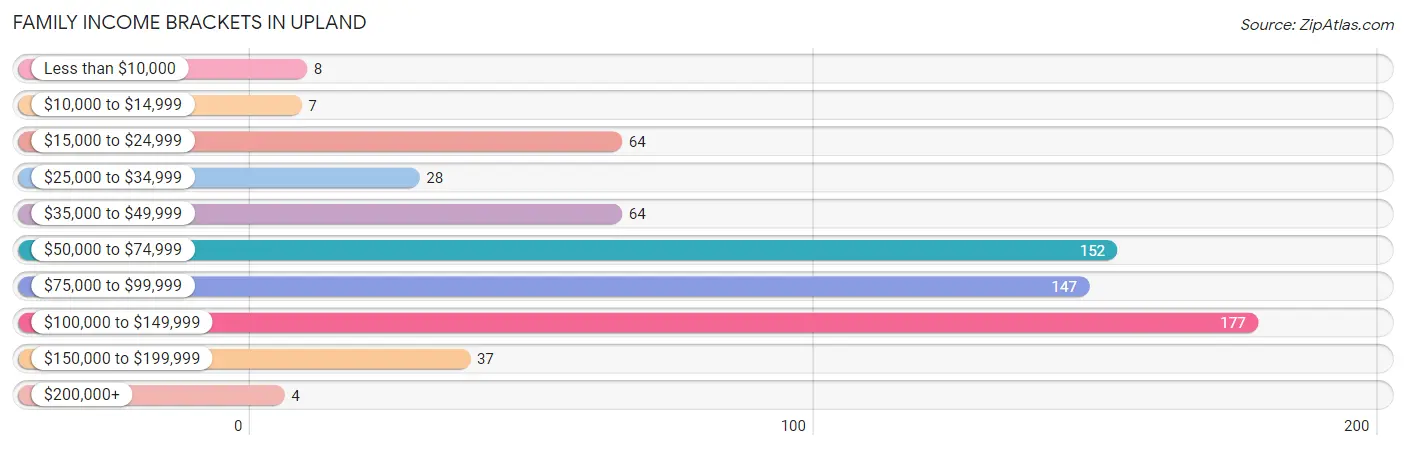
| Income Bracket | # Families | % Families |
| Less than $10,000 | 8 | 1.2% |
| $10,000 to $14,999 | 7 | 1.0% |
| $15,000 to $24,999 | 64 | 9.3% |
| $25,000 to $34,999 | 28 | 4.1% |
| $35,000 to $49,999 | 64 | 9.3% |
| $50,000 to $74,999 | 152 | 22.1% |
| $75,000 to $99,999 | 147 | 21.4% |
| $100,000 to $149,999 | 177 | 25.7% |
| $150,000 to $199,999 | 37 | 5.4% |
| $200,000+ | 4 | 0.6% |
Family Income by Famaliy Size in Upland
7+ person families (50 | 7.3%) account for the highest median family income in Upland with $141,429 per family, while 2-person families (351 | 51.0%) have the highest median income of $33,375 per family member.
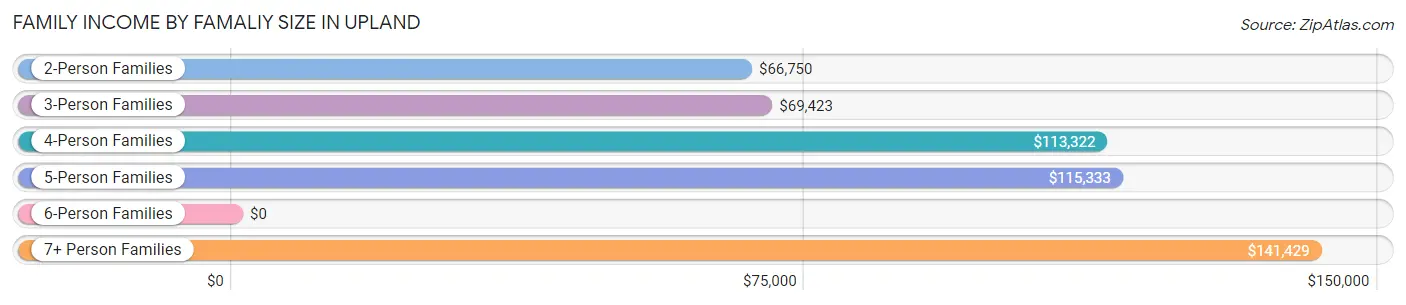
| Income Bracket | # Families | Median Income |
| 2-Person Families | 351 (51.0%) | $66,750 |
| 3-Person Families | 94 (13.7%) | $69,423 |
| 4-Person Families | 129 (18.8%) | $113,322 |
| 5-Person Families | 62 (9.0%) | $115,333 |
| 6-Person Families | 2 (0.3%) | $0 |
| 7+ Person Families | 50 (7.3%) | $141,429 |
| Total | 688 (100.0%) | $76,193 |
Family Income by Number of Earners in Upland
The median family income in Upland is $76,193, with families comprising 3+ earners (60) having the highest median family income of $136,000, while families with no earners (116) have the lowest median family income of $50,000, accounting for 8.7% and 16.9% of families, respectively.
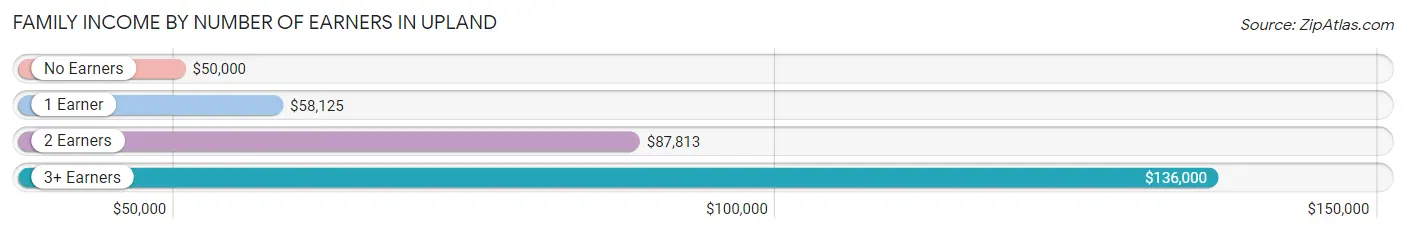
| Number of Earners | # Families | Median Income |
| No Earners | 116 (16.9%) | $50,000 |
| 1 Earner | 199 (28.9%) | $58,125 |
| 2 Earners | 313 (45.5%) | $87,813 |
| 3+ Earners | 60 (8.7%) | $136,000 |
| Total | 688 (100.0%) | $76,193 |
Household Income in Upland
Household Income Brackets in Upland
With 212 households falling in the category, the $50,000 to $74,999 income range is the most frequent in Upland, accounting for 23.1% of all households. In contrast, only 4 households (0.4%) fall into the $200,000+ income bracket, making it the least populous group.
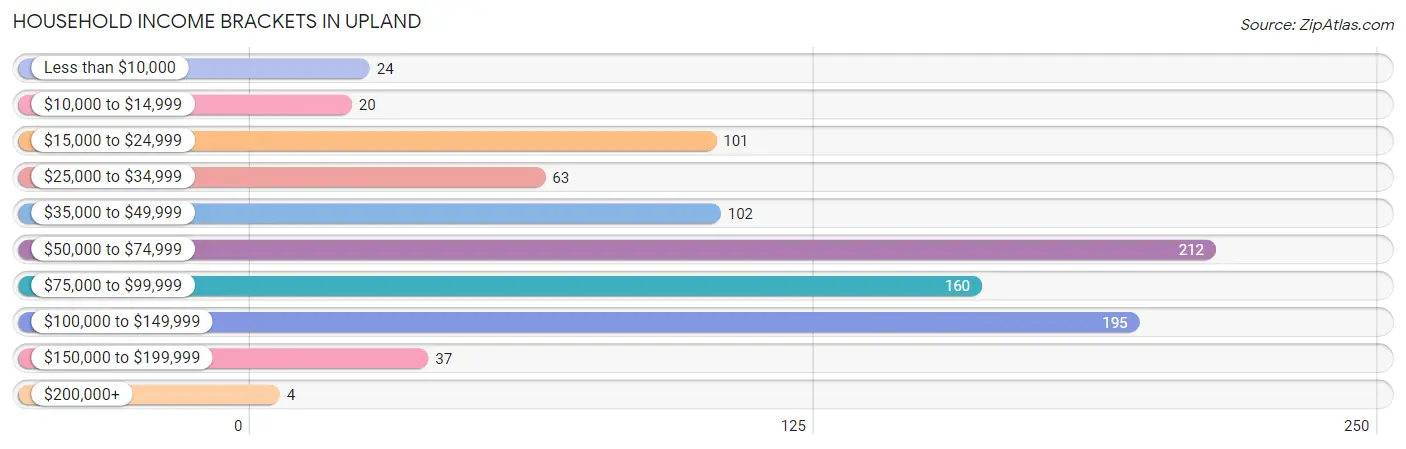
| Income Bracket | # Households | % Households |
| Less than $10,000 | 24 | 2.6% |
| $10,000 to $14,999 | 20 | 2.2% |
| $15,000 to $24,999 | 101 | 11.0% |
| $25,000 to $34,999 | 63 | 6.9% |
| $35,000 to $49,999 | 102 | 11.1% |
| $50,000 to $74,999 | 212 | 23.1% |
| $75,000 to $99,999 | 160 | 17.4% |
| $100,000 to $149,999 | 195 | 21.2% |
| $150,000 to $199,999 | 37 | 4.0% |
| $200,000+ | 4 | 0.4% |
Household Income by Householder Age in Upland
The median household income in Upland is $67,813, with the highest median household income of $91,339 found in the 25 to 44 years age bracket for the primary householder. A total of 241 households (26.3%) fall into this category. Meanwhile, the 65+ years age bracket for the primary householder has the lowest median household income of $42,083, with 310 households (33.8%) in this group.
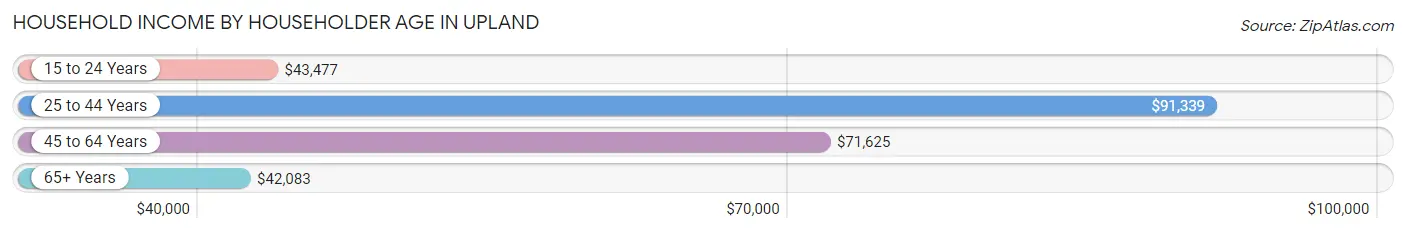
| Income Bracket | # Households | Median Income |
| 15 to 24 Years | 59 (6.4%) | $43,477 |
| 25 to 44 Years | 241 (26.3%) | $91,339 |
| 45 to 64 Years | 308 (33.6%) | $71,625 |
| 65+ Years | 310 (33.8%) | $42,083 |
| Total | 918 (100.0%) | $67,813 |
Poverty in Upland
Income Below Poverty by Sex and Age in Upland
With 10.3% poverty level for males and 7.3% for females among the residents of Upland, 5 year old males and under 5 year old females are the most vulnerable to poverty, with 13 males (100.0%) and 21 females (19.6%) in their respective age groups living below the poverty level.
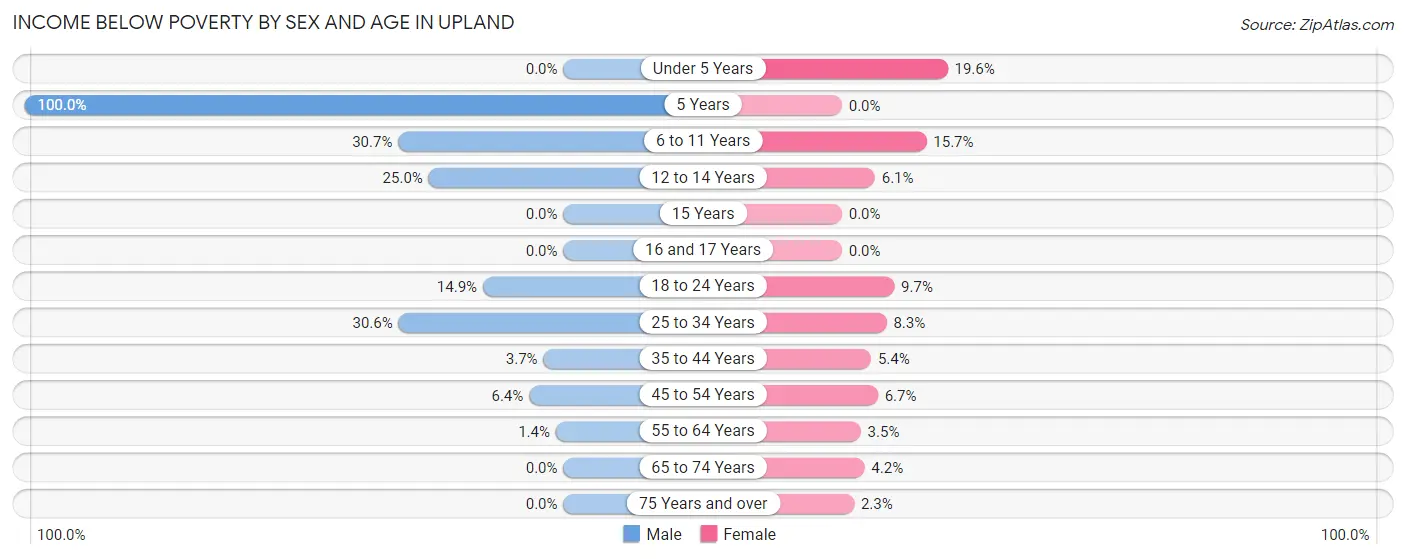
| Age Bracket | Male | Female |
| Under 5 Years | 0 (0.0%) | 21 (19.6%) |
| 5 Years | 13 (100.0%) | 0 (0.0%) |
| 6 to 11 Years | 19 (30.6%) | 27 (15.7%) |
| 12 to 14 Years | 25 (25.0%) | 6 (6.1%) |
| 15 Years | 0 (0.0%) | 0 (0.0%) |
| 16 and 17 Years | 0 (0.0%) | 0 (0.0%) |
| 18 to 24 Years | 20 (14.9%) | 7 (9.7%) |
| 25 to 34 Years | 26 (30.6%) | 15 (8.3%) |
| 35 to 44 Years | 6 (3.7%) | 6 (5.4%) |
| 45 to 54 Years | 12 (6.4%) | 8 (6.7%) |
| 55 to 64 Years | 1 (1.4%) | 7 (3.5%) |
| 65 to 74 Years | 0 (0.0%) | 5 (4.2%) |
| 75 Years and over | 0 (0.0%) | 3 (2.3%) |
| Total | 122 (10.3%) | 105 (7.3%) |
Income Above Poverty by Sex and Age in Upland
According to the poverty statistics in Upland, males aged under 5 years and females aged 5 years are the age groups that are most secure financially, with 100.0% of males and 100.0% of females in these age groups living above the poverty line.
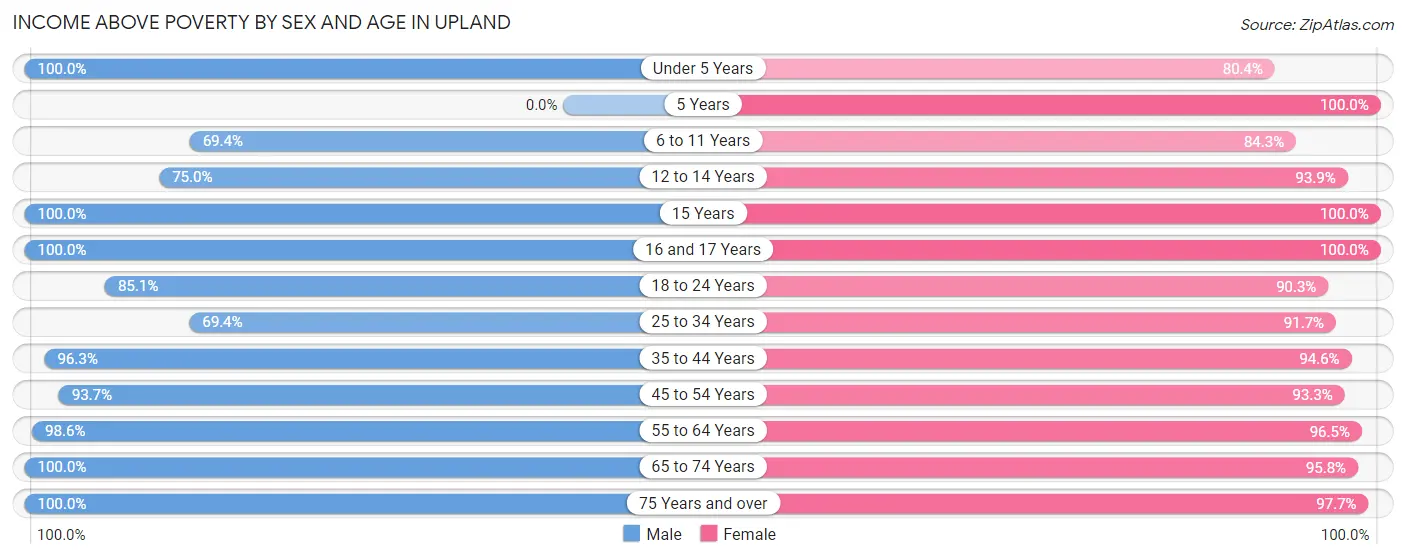
| Age Bracket | Male | Female |
| Under 5 Years | 22 (100.0%) | 86 (80.4%) |
| 5 Years | 0 (0.0%) | 9 (100.0%) |
| 6 to 11 Years | 43 (69.4%) | 145 (84.3%) |
| 12 to 14 Years | 75 (75.0%) | 92 (93.9%) |
| 15 Years | 71 (100.0%) | 41 (100.0%) |
| 16 and 17 Years | 62 (100.0%) | 65 (100.0%) |
| 18 to 24 Years | 114 (85.1%) | 65 (90.3%) |
| 25 to 34 Years | 59 (69.4%) | 166 (91.7%) |
| 35 to 44 Years | 156 (96.3%) | 105 (94.6%) |
| 45 to 54 Years | 177 (93.6%) | 112 (93.3%) |
| 55 to 64 Years | 70 (98.6%) | 193 (96.5%) |
| 65 to 74 Years | 116 (100.0%) | 114 (95.8%) |
| 75 Years and over | 97 (100.0%) | 130 (97.7%) |
| Total | 1,062 (89.7%) | 1,323 (92.6%) |
Income Below Poverty Among Married-Couple Families in Upland
The poverty statistics for married-couple families in Upland show that 3.7% or 19 of the total 508 families live below the poverty line. Families with 5 or more children have the highest poverty rate of 41.9%, comprising of 13 families. On the other hand, families with no children have the lowest poverty rate of 0.0%, which includes 0 families.
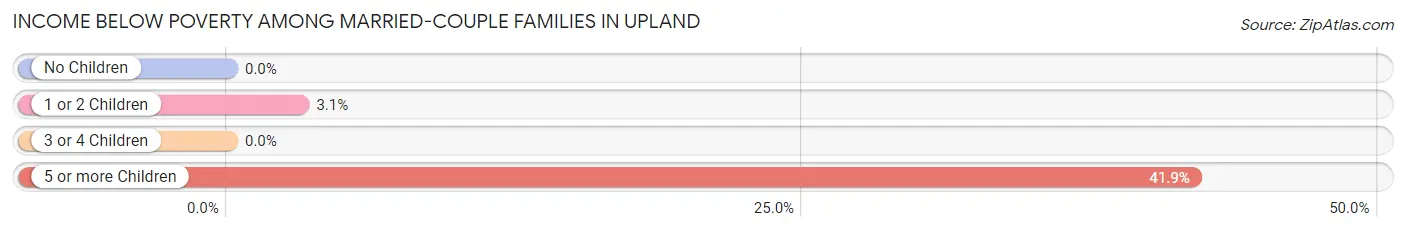
| Children | Above Poverty | Below Poverty |
| No Children | 241 (100.0%) | 0 (0.0%) |
| 1 or 2 Children | 187 (96.9%) | 6 (3.1%) |
| 3 or 4 Children | 43 (100.0%) | 0 (0.0%) |
| 5 or more Children | 18 (58.1%) | 13 (41.9%) |
| Total | 489 (96.3%) | 19 (3.7%) |
Income Below Poverty Among Single-Parent Households in Upland
According to the poverty data in Upland, 15.2% or 7 single-father households and 6.0% or 8 single-mother households are living below the poverty line. Among single-father households, those with no children have the highest poverty rate, with 7 households (15.2%) experiencing poverty. Likewise, among single-mother households, those with 1 or 2 children have the highest poverty rate, with 8 households (18.6%) falling below the poverty line.
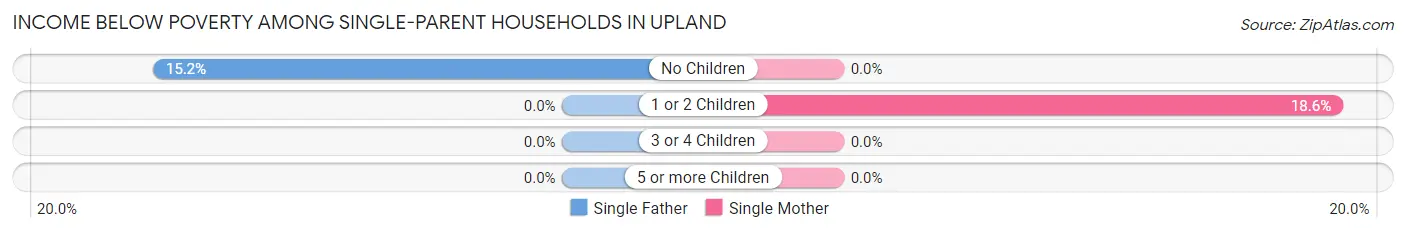
| Children | Single Father | Single Mother |
| No Children | 7 (15.2%) | 0 (0.0%) |
| 1 or 2 Children | 0 (0.0%) | 8 (18.6%) |
| 3 or 4 Children | 0 (0.0%) | 0 (0.0%) |
| 5 or more Children | 0 (0.0%) | 0 (0.0%) |
| Total | 7 (15.2%) | 8 (6.0%) |
Income Below Poverty Among Married-Couple vs Single-Parent Households in Upland
The poverty data for Upland shows that 19 of the married-couple family households (3.7%) and 15 of the single-parent households (8.3%) are living below the poverty level. Within the married-couple family households, those with 5 or more children have the highest poverty rate, with 13 households (41.9%) falling below the poverty line. Among the single-parent households, those with 1 or 2 children have the highest poverty rate, with 8 household (18.6%) living below poverty.
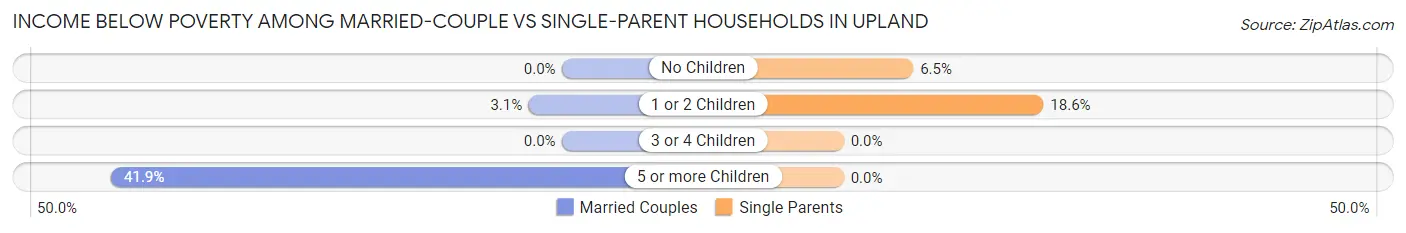
| Children | Married-Couple Families | Single-Parent Households |
| No Children | 0 (0.0%) | 7 (6.5%) |
| 1 or 2 Children | 6 (3.1%) | 8 (18.6%) |
| 3 or 4 Children | 0 (0.0%) | 0 (0.0%) |
| 5 or more Children | 13 (41.9%) | 0 (0.0%) |
| Total | 19 (3.7%) | 15 (8.3%) |
Race in Upland
The most populous races in Upland are White / Caucasian (3,366 | 84.9%), Two or more Races (261 | 6.6%), and Black / African American (156 | 3.9%).
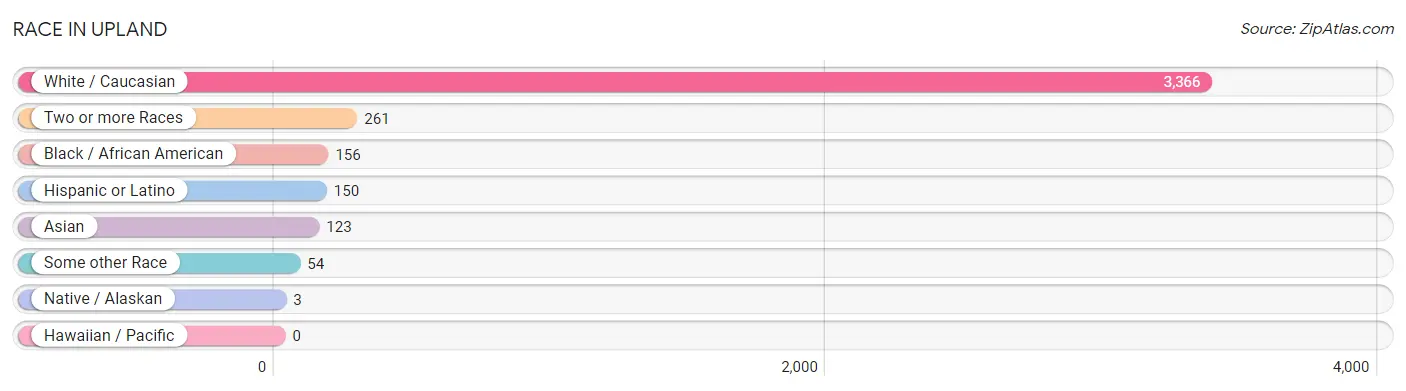
| Race | # Population | % Population |
| Asian | 123 | 3.1% |
| Black / African American | 156 | 3.9% |
| Hawaiian / Pacific | 0 | 0.0% |
| Hispanic or Latino | 150 | 3.8% |
| Native / Alaskan | 3 | 0.1% |
| White / Caucasian | 3,366 | 84.9% |
| Two or more Races | 261 | 6.6% |
| Some other Race | 54 | 1.4% |
| Total | 3,963 | 100.0% |
Ancestry in Upland
The most populous ancestries reported in Upland are German (860 | 21.7%), English (468 | 11.8%), American (290 | 7.3%), Irish (225 | 5.7%), and Scotch-Irish (221 | 5.6%), together accounting for 52.1% of all Upland residents.
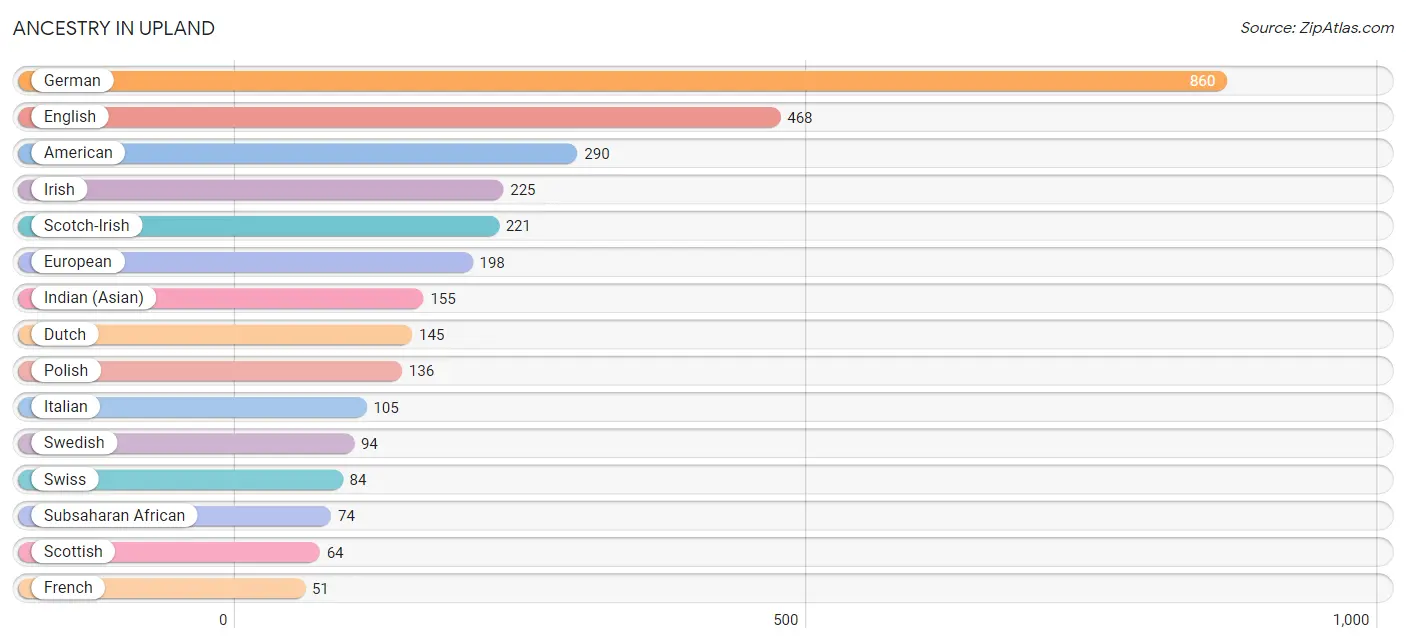
| Ancestry | # Population | % Population |
| African | 47 | 1.2% |
| American | 290 | 7.3% |
| Apache | 5 | 0.1% |
| Argentinean | 15 | 0.4% |
| Austrian | 5 | 0.1% |
| Bahamian | 16 | 0.4% |
| Belgian | 4 | 0.1% |
| Bhutanese | 14 | 0.4% |
| British | 12 | 0.3% |
| Burmese | 9 | 0.2% |
| Canadian | 14 | 0.4% |
| Central American | 28 | 0.7% |
| Cuban | 4 | 0.1% |
| Danish | 5 | 0.1% |
| Dutch | 145 | 3.7% |
| Ecuadorian | 21 | 0.5% |
| English | 468 | 11.8% |
| Ethiopian | 27 | 0.7% |
| European | 198 | 5.0% |
| French | 51 | 1.3% |
| French Canadian | 2 | 0.1% |
| German | 860 | 21.7% |
| Greek | 8 | 0.2% |
| Guatemalan | 28 | 0.7% |
| Hungarian | 13 | 0.3% |
| Indian (Asian) | 155 | 3.9% |
| Indonesian | 3 | 0.1% |
| Iranian | 8 | 0.2% |
| Irish | 225 | 5.7% |
| Italian | 105 | 2.6% |
| Korean | 11 | 0.3% |
| Mexican | 37 | 0.9% |
| Native Hawaiian | 11 | 0.3% |
| Navajo | 5 | 0.1% |
| Norwegian | 40 | 1.0% |
| Polish | 136 | 3.4% |
| Puerto Rican | 29 | 0.7% |
| Romanian | 11 | 0.3% |
| Russian | 7 | 0.2% |
| Scandinavian | 9 | 0.2% |
| Scotch-Irish | 221 | 5.6% |
| Scottish | 64 | 1.6% |
| Slovak | 5 | 0.1% |
| Slovene | 5 | 0.1% |
| South American | 36 | 0.9% |
| Spaniard | 5 | 0.1% |
| Spanish | 11 | 0.3% |
| Sri Lankan | 6 | 0.2% |
| Subsaharan African | 74 | 1.9% |
| Swedish | 94 | 2.4% |
| Swiss | 84 | 2.1% |
| Thai | 9 | 0.2% |
| Turkish | 8 | 0.2% |
| Ukrainian | 6 | 0.2% |
| Welsh | 25 | 0.6% | View All 55 Rows |
Immigrants in Upland
The most numerous immigrant groups reported in Upland came from Africa (81 | 2.0%), Asia (69 | 1.7%), Latin America (62 | 1.6%), Eastern Asia (54 | 1.4%), and Middle Africa (47 | 1.2%), together accounting for 7.9% of all Upland residents.
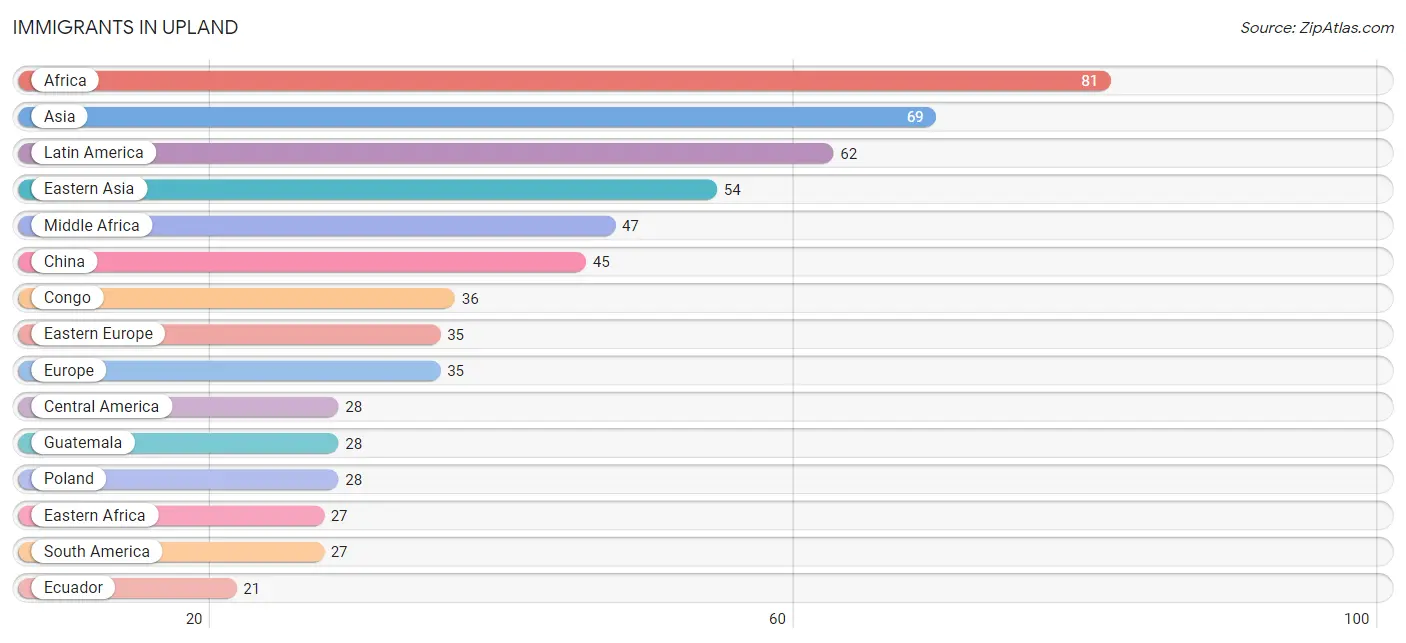
| Immigration Origin | # Population | % Population |
| Africa | 81 | 2.0% |
| Argentina | 6 | 0.2% |
| Asia | 69 | 1.7% |
| Bahamas | 7 | 0.2% |
| Caribbean | 7 | 0.2% |
| Central America | 28 | 0.7% |
| China | 45 | 1.1% |
| Congo | 36 | 0.9% |
| Eastern Africa | 27 | 0.7% |
| Eastern Asia | 54 | 1.4% |
| Eastern Europe | 35 | 0.9% |
| Ecuador | 21 | 0.5% |
| Eritrea | 11 | 0.3% |
| Ethiopia | 16 | 0.4% |
| Europe | 35 | 0.9% |
| Guatemala | 28 | 0.7% |
| Indonesia | 6 | 0.2% |
| Korea | 9 | 0.2% |
| Latin America | 62 | 1.6% |
| Malaysia | 6 | 0.2% |
| Middle Africa | 47 | 1.2% |
| Nigeria | 7 | 0.2% |
| Poland | 28 | 0.7% |
| Russia | 7 | 0.2% |
| South America | 27 | 0.7% |
| South Eastern Asia | 15 | 0.4% |
| Western Africa | 7 | 0.2% |
| Zaire | 11 | 0.3% | View All 28 Rows |
Sex and Age in Upland
Sex and Age in Upland
The most populous age groups in Upland are 15 to 19 Years (462 | 24.9%) for men and 20 to 24 Years (449 | 21.3%) for women.
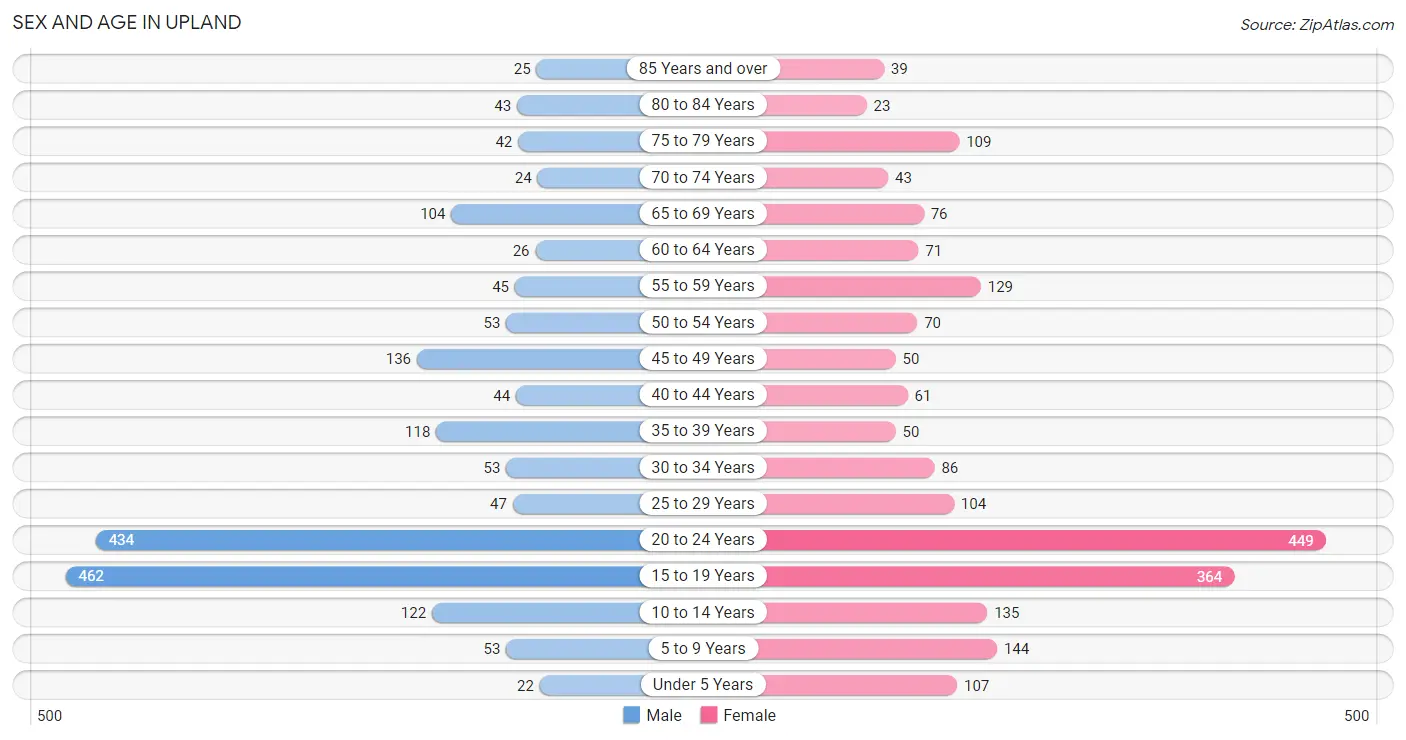
| Age Bracket | Male | Female |
| Under 5 Years | 22 (1.2%) | 107 (5.1%) |
| 5 to 9 Years | 53 (2.9%) | 144 (6.8%) |
| 10 to 14 Years | 122 (6.6%) | 135 (6.4%) |
| 15 to 19 Years | 462 (24.9%) | 364 (17.2%) |
| 20 to 24 Years | 434 (23.4%) | 449 (21.3%) |
| 25 to 29 Years | 47 (2.5%) | 104 (4.9%) |
| 30 to 34 Years | 53 (2.9%) | 86 (4.1%) |
| 35 to 39 Years | 118 (6.4%) | 50 (2.4%) |
| 40 to 44 Years | 44 (2.4%) | 61 (2.9%) |
| 45 to 49 Years | 136 (7.3%) | 50 (2.4%) |
| 50 to 54 Years | 53 (2.9%) | 70 (3.3%) |
| 55 to 59 Years | 45 (2.4%) | 129 (6.1%) |
| 60 to 64 Years | 26 (1.4%) | 71 (3.4%) |
| 65 to 69 Years | 104 (5.6%) | 76 (3.6%) |
| 70 to 74 Years | 24 (1.3%) | 43 (2.0%) |
| 75 to 79 Years | 42 (2.3%) | 109 (5.2%) |
| 80 to 84 Years | 43 (2.3%) | 23 (1.1%) |
| 85 Years and over | 25 (1.3%) | 39 (1.8%) |
| Total | 1,853 (100.0%) | 2,110 (100.0%) |
Families and Households in Upland
Median Family Size in Upland
The median family size in Upland is 3.30 persons per family, with married-couple families (508 | 73.8%) accounting for the largest median family size of 3.4 persons per family. On the other hand, single male/father families (46 | 6.7%) represent the smallest median family size with 1.89 persons per family.
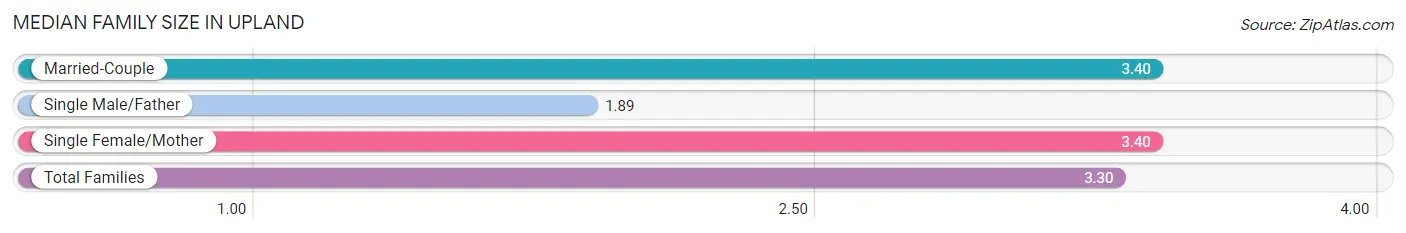
| Family Type | # Families | Family Size |
| Married-Couple | 508 (73.8%) | 3.40 |
| Single Male/Father | 46 (6.7%) | 1.89 |
| Single Female/Mother | 134 (19.5%) | 3.40 |
| Total Families | 688 (100.0%) | 3.30 |
Median Household Size in Upland
The median household size in Upland is 2.84 persons per household, with single female/mother households (134 | 14.6%) accounting for the largest median household size of 3.69 persons per household. non-family households (230 | 25.1%) represent the smallest median household size with 1.20 persons per household.
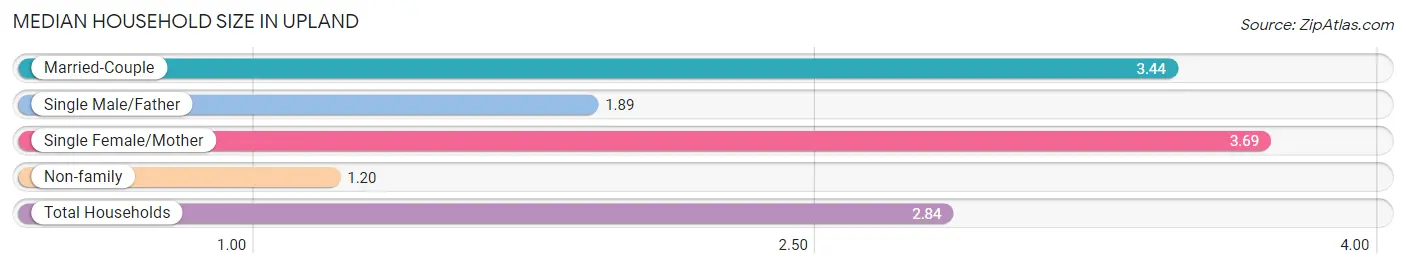
| Household Type | # Households | Household Size |
| Married-Couple | 508 (55.3%) | 3.44 |
| Single Male/Father | 46 (5.0%) | 1.89 |
| Single Female/Mother | 134 (14.6%) | 3.69 |
| Non-family | 230 (25.1%) | 1.20 |
| Total Households | 918 (100.0%) | 2.84 |
Household Size by Marriage Status in Upland
Out of a total of 918 households in Upland, 688 (75.0%) are family households, while 230 (25.1%) are nonfamily households. The most numerous type of family households are 2-person households, comprising 331, and the most common type of nonfamily households are 1-person households, comprising 180.
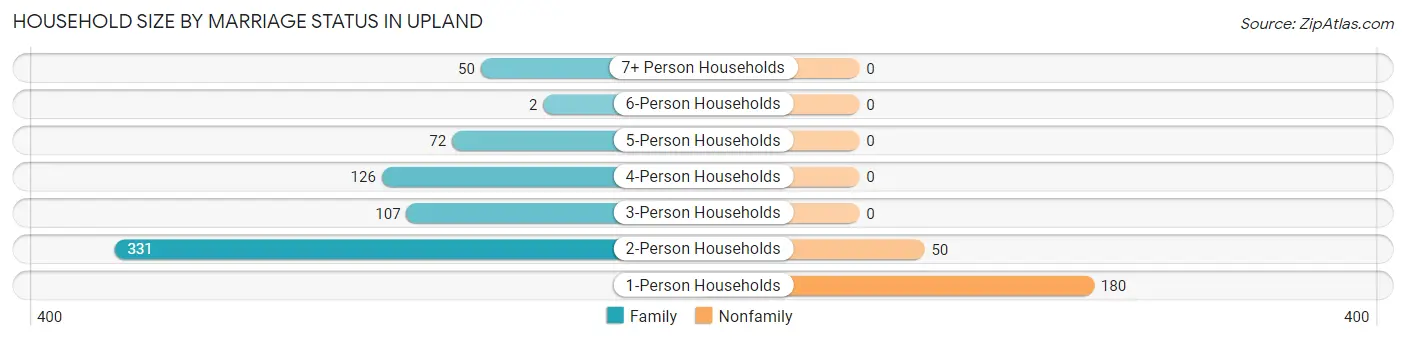
| Household Size | Family Households | Nonfamily Households |
| 1-Person Households | - | 180 (19.6%) |
| 2-Person Households | 331 (36.1%) | 50 (5.4%) |
| 3-Person Households | 107 (11.7%) | 0 (0.0%) |
| 4-Person Households | 126 (13.7%) | 0 (0.0%) |
| 5-Person Households | 72 (7.8%) | 0 (0.0%) |
| 6-Person Households | 2 (0.2%) | 0 (0.0%) |
| 7+ Person Households | 50 (5.4%) | 0 (0.0%) |
| Total | 688 (75.0%) | 230 (25.1%) |
Female Fertility in Upland
Fertility by Age in Upland
Average fertility rate in Upland is 25.0 births per 1,000 women. Women in the age bracket of 20 to 34 years have the highest fertility rate with 45.0 births per 1,000 women. Women in the age bracket of 20 to 34 years acount for 100.0% of all women with births.
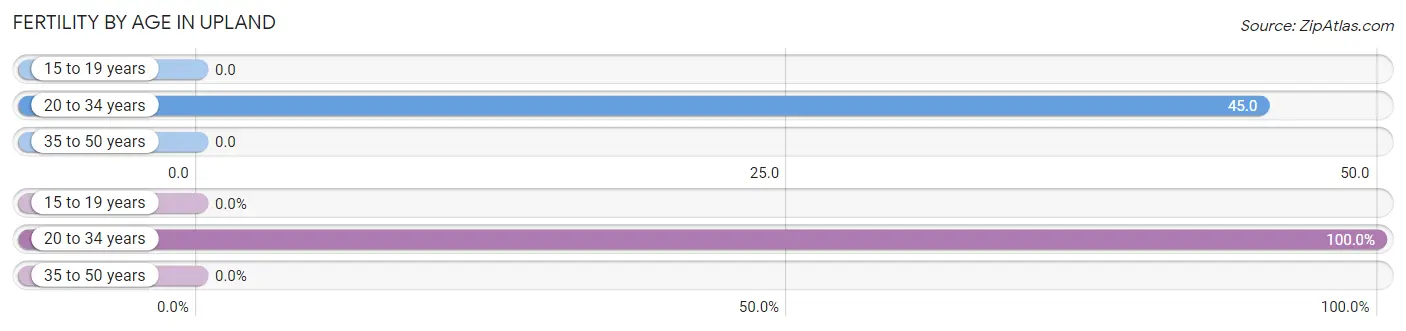
| Age Bracket | Women with Births | Births / 1,000 Women |
| 15 to 19 years | 0 (0.0%) | 0.0 |
| 20 to 34 years | 29 (100.0%) | 45.0 |
| 35 to 50 years | 0 (0.0%) | 0.0 |
| Total | 29 (100.0%) | 25.0 |
Fertility by Age by Marriage Status in Upland
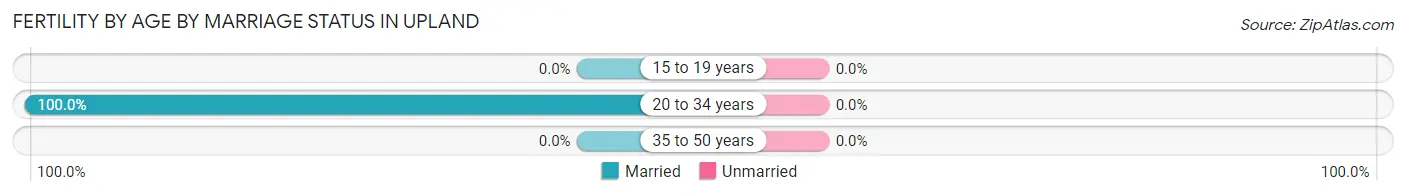
| Age Bracket | Married | Unmarried |
| 15 to 19 years | 0 (0.0%) | 0 (0.0%) |
| 20 to 34 years | 29 (100.0%) | 0 (0.0%) |
| 35 to 50 years | 0 (0.0%) | 0 (0.0%) |
| Total | 29 (100.0%) | 0 (0.0%) |
Fertility by Education in Upland
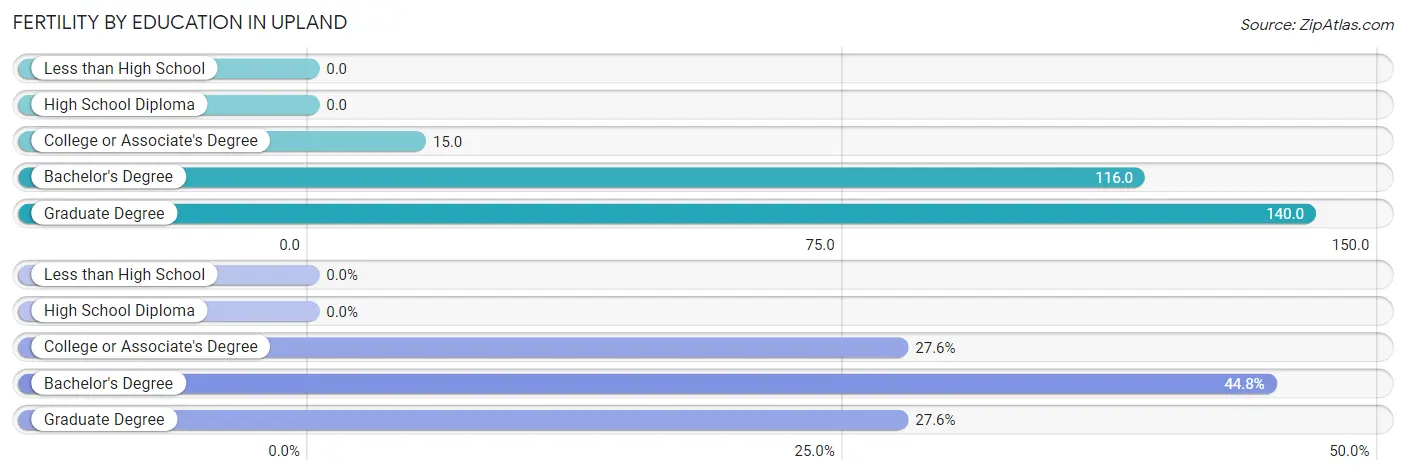
| Educational Attainment | Women with Births | Births / 1,000 Women |
| Less than High School | 0 (0.0%) | 0.0 |
| High School Diploma | 0 (0.0%) | 0.0 |
| College or Associate's Degree | 8 (27.6%) | 15.0 |
| Bachelor's Degree | 13 (44.8%) | 116.0 |
| Graduate Degree | 8 (27.6%) | 140.0 |
| Total | 29 (100.0%) | 25.0 |
Fertility by Education by Marriage Status in Upland
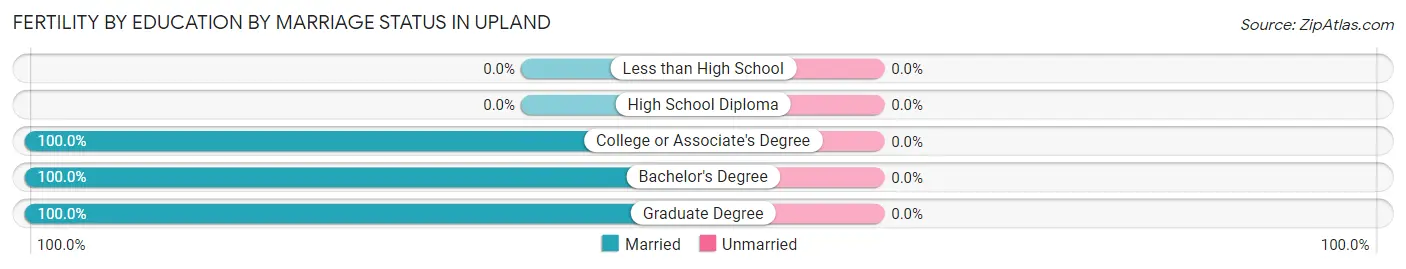
| Educational Attainment | Married | Unmarried |
| Less than High School | 0 (0.0%) | 0 (0.0%) |
| High School Diploma | 0 (0.0%) | 0 (0.0%) |
| College or Associate's Degree | 8 (100.0%) | 0 (0.0%) |
| Bachelor's Degree | 13 (100.0%) | 0 (0.0%) |
| Graduate Degree | 8 (100.0%) | 0 (0.0%) |
| Total | 29 (100.0%) | 0 (0.0%) |
Employment Characteristics in Upland
Employment by Class of Employer in Upland
Among the 1,750 employed individuals in Upland, private company employees (1,026 | 58.6%), not-for-profit organizations (535 | 30.6%), and local government employees (51 | 2.9%) make up the most common classes of employment.
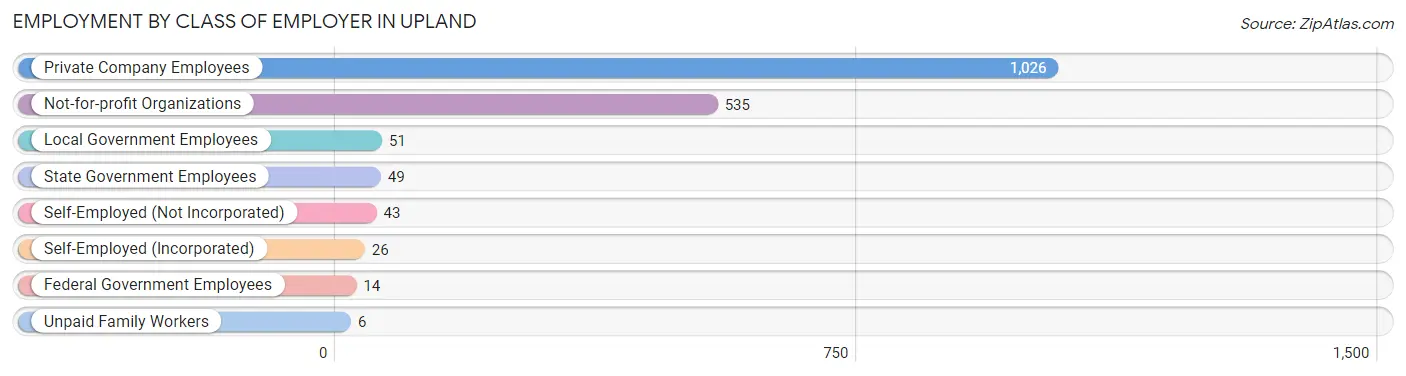
| Employer Class | # Employees | % Employees |
| Private Company Employees | 1,026 | 58.6% |
| Self-Employed (Incorporated) | 26 | 1.5% |
| Self-Employed (Not Incorporated) | 43 | 2.5% |
| Not-for-profit Organizations | 535 | 30.6% |
| Local Government Employees | 51 | 2.9% |
| State Government Employees | 49 | 2.8% |
| Federal Government Employees | 14 | 0.8% |
| Unpaid Family Workers | 6 | 0.3% |
| Total | 1,750 | 100.0% |
Employment Status by Age in Upland
According to the labor force statistics for Upland, out of the total population over 16 years of age (3,268), 59.4% or 1,941 individuals are in the labor force, with 2.5% or 49 of them unemployed. The age group with the highest labor force participation rate is 35 to 44 years, with 88.3% or 241 individuals in the labor force. Within the labor force, the 16 to 19 years age range has the highest percentage of unemployed individuals, with 4.7% or 16 of them being unemployed.
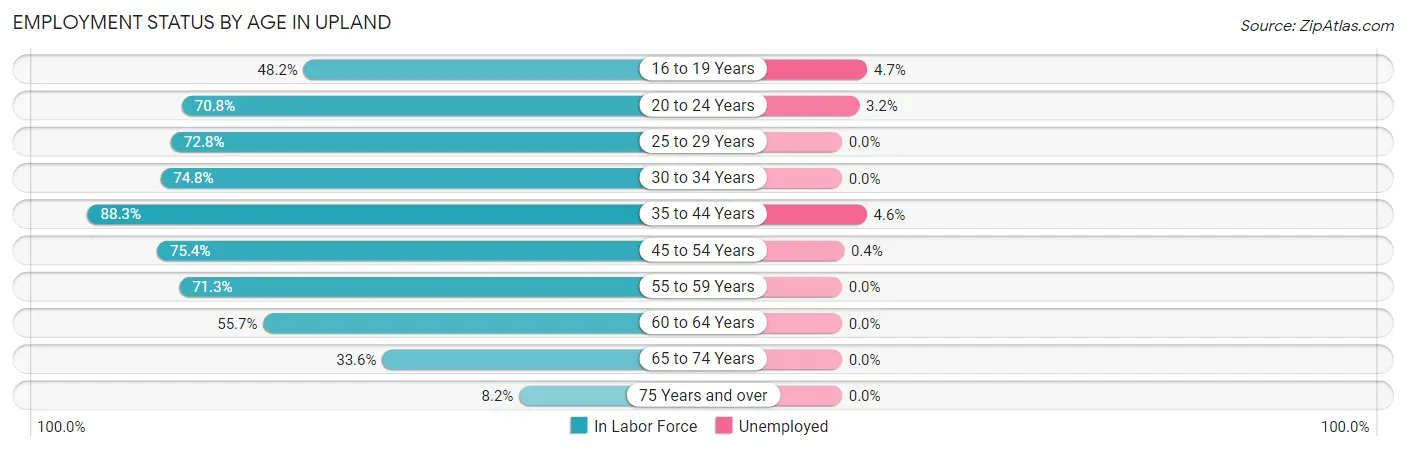
| Age Bracket | In Labor Force | Unemployed |
| 16 to 19 Years | 344 (48.2%) | 16 (4.7%) |
| 20 to 24 Years | 625 (70.8%) | 20 (3.2%) |
| 25 to 29 Years | 110 (72.8%) | 0 (0.0%) |
| 30 to 34 Years | 104 (74.8%) | 0 (0.0%) |
| 35 to 44 Years | 241 (88.3%) | 11 (4.6%) |
| 45 to 54 Years | 233 (75.4%) | 1 (0.4%) |
| 55 to 59 Years | 124 (71.3%) | 0 (0.0%) |
| 60 to 64 Years | 54 (55.7%) | 0 (0.0%) |
| 65 to 74 Years | 83 (33.6%) | 0 (0.0%) |
| 75 Years and over | 23 (8.2%) | 0 (0.0%) |
| Total | 1,941 (59.4%) | 49 (2.5%) |
Employment Status by Educational Attainment in Upland
According to labor force statistics for Upland, 75.8% of individuals (866) out of the total population between 25 and 64 years of age (1,143) are in the labor force, with 1.4% or 12 of them being unemployed. The group with the highest labor force participation rate are those with the educational attainment of bachelor's degree or higher, with 82.4% or 394 individuals in the labor force. Within the labor force, individuals with high school diploma education have the highest percentage of unemployment, with 4.8% or 11 of them being unemployed.
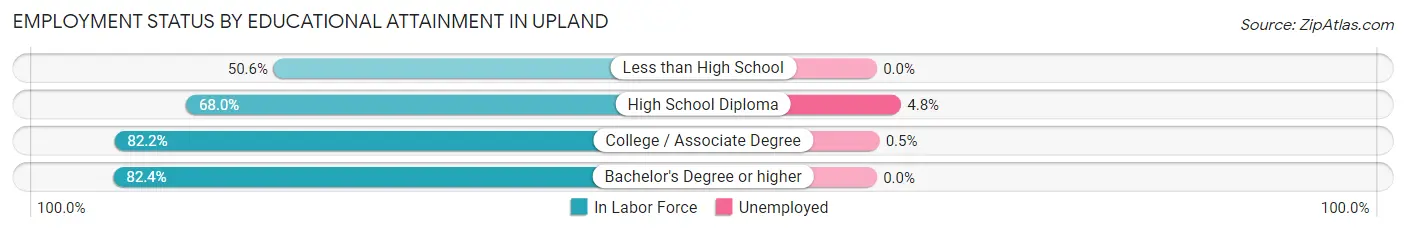
| Educational Attainment | In Labor Force | Unemployed |
| Less than High School | 43 (50.6%) | 0 (0.0%) |
| High School Diploma | 230 (68.0%) | 16 (4.8%) |
| College / Associate Degree | 199 (82.2%) | 1 (0.5%) |
| Bachelor's Degree or higher | 394 (82.4%) | 0 (0.0%) |
| Total | 866 (75.8%) | 16 (1.4%) |
Employment Occupations by Sex in Upland
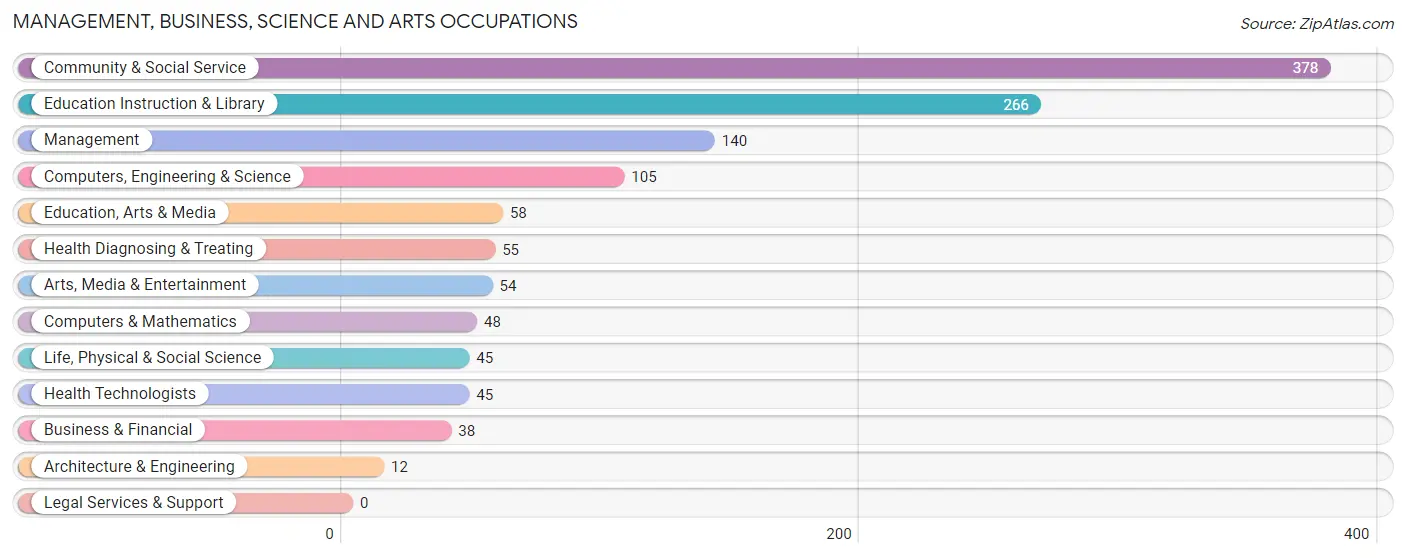
Management, Business, Science and Arts Occupations
The most common Management, Business, Science and Arts occupations in Upland are Community & Social Service (378 | 20.0%), Education Instruction & Library (266 | 14.1%), Management (140 | 7.4%), Computers, Engineering & Science (105 | 5.6%), and Education, Arts & Media (58 | 3.1%).
Management, Business, Science and Arts Occupations by Sex
Within the Management, Business, Science and Arts occupations in Upland, the most male-oriented occupations are Life, Physical & Social Science (100.0%), Computers, Engineering & Science (93.3%), and Computers & Mathematics (91.7%), while the most female-oriented occupations are Health Diagnosing & Treating (80.0%), Health Technologists (75.6%), and Business & Financial (57.9%).
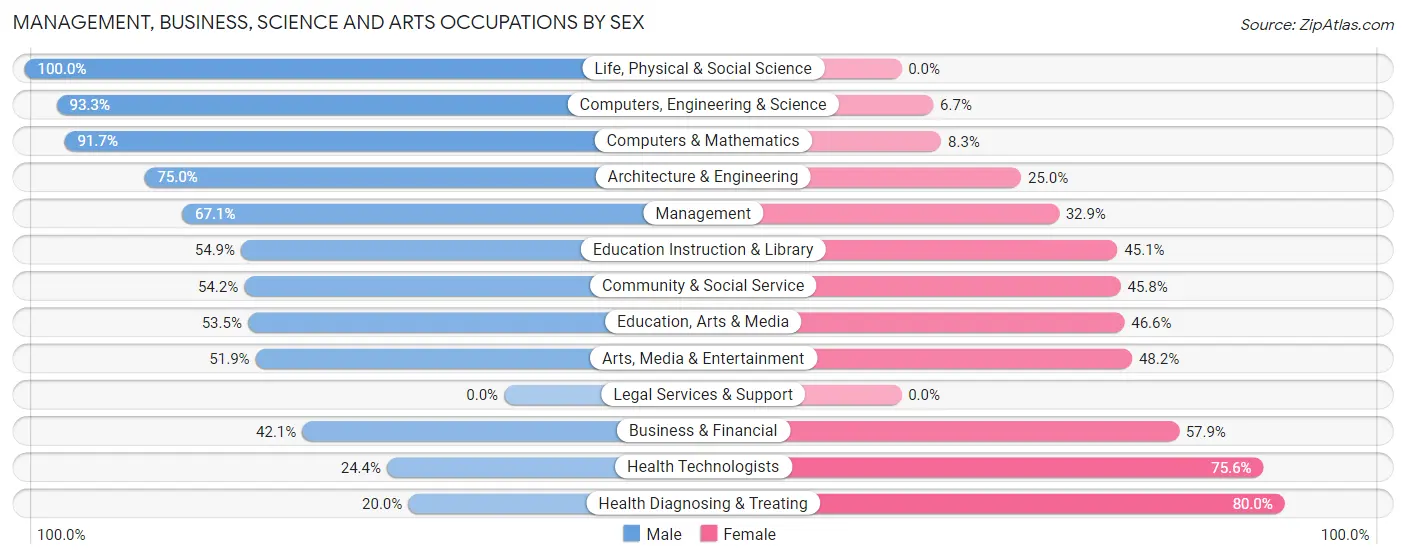
| Occupation | Male | Female |
| Management | 94 (67.1%) | 46 (32.9%) |
| Business & Financial | 16 (42.1%) | 22 (57.9%) |
| Computers, Engineering & Science | 98 (93.3%) | 7 (6.7%) |
| Computers & Mathematics | 44 (91.7%) | 4 (8.3%) |
| Architecture & Engineering | 9 (75.0%) | 3 (25.0%) |
| Life, Physical & Social Science | 45 (100.0%) | 0 (0.0%) |
| Community & Social Service | 205 (54.2%) | 173 (45.8%) |
| Education, Arts & Media | 31 (53.4%) | 27 (46.6%) |
| Legal Services & Support | 0 (0.0%) | 0 (0.0%) |
| Education Instruction & Library | 146 (54.9%) | 120 (45.1%) |
| Arts, Media & Entertainment | 28 (51.8%) | 26 (48.1%) |
| Health Diagnosing & Treating | 11 (20.0%) | 44 (80.0%) |
| Health Technologists | 11 (24.4%) | 34 (75.6%) |
| Total (Category) | 424 (59.2%) | 292 (40.8%) |
| Total (Overall) | 989 (52.2%) | 904 (47.7%) |
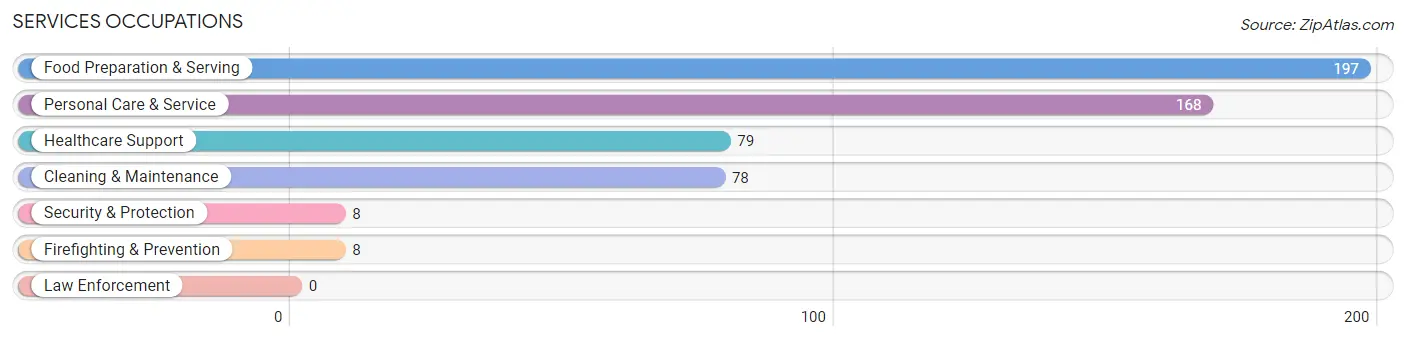
Services Occupations
The most common Services occupations in Upland are Food Preparation & Serving (197 | 10.4%), Personal Care & Service (168 | 8.9%), Healthcare Support (79 | 4.2%), Cleaning & Maintenance (78 | 4.1%), and Security & Protection (8 | 0.4%).
Services Occupations by Sex
Within the Services occupations in Upland, the most male-oriented occupations are Cleaning & Maintenance (47.4%), Food Preparation & Serving (33.0%), and Personal Care & Service (32.7%), while the most female-oriented occupations are Security & Protection (100.0%), Firefighting & Prevention (100.0%), and Healthcare Support (87.3%).
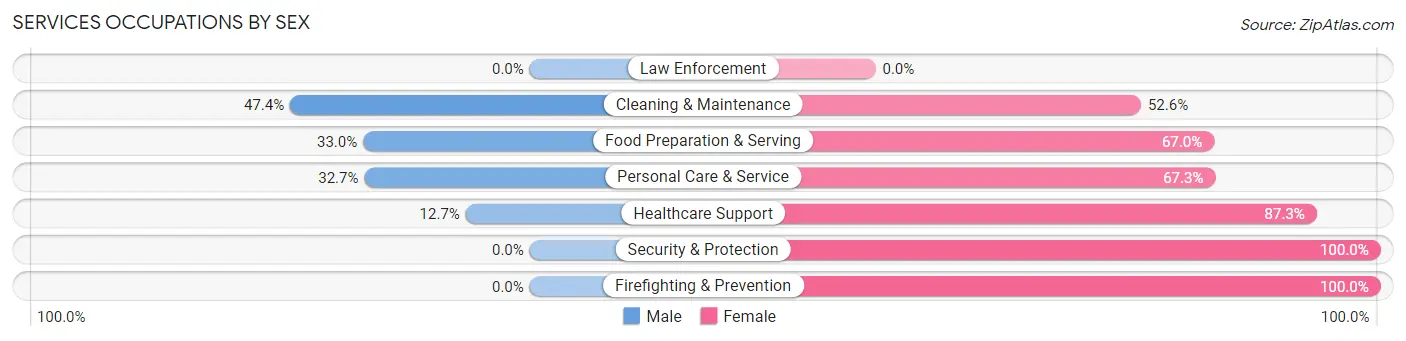
| Occupation | Male | Female |
| Healthcare Support | 10 (12.7%) | 69 (87.3%) |
| Security & Protection | 0 (0.0%) | 8 (100.0%) |
| Firefighting & Prevention | 0 (0.0%) | 8 (100.0%) |
| Law Enforcement | 0 (0.0%) | 0 (0.0%) |
| Food Preparation & Serving | 65 (33.0%) | 132 (67.0%) |
| Cleaning & Maintenance | 37 (47.4%) | 41 (52.6%) |
| Personal Care & Service | 55 (32.7%) | 113 (67.3%) |
| Total (Category) | 167 (31.5%) | 363 (68.5%) |
| Total (Overall) | 989 (52.2%) | 904 (47.7%) |
Sales and Office Occupations
The most common Sales and Office occupations in Upland are Office & Administration (190 | 10.0%), and Sales & Related (134 | 7.1%).
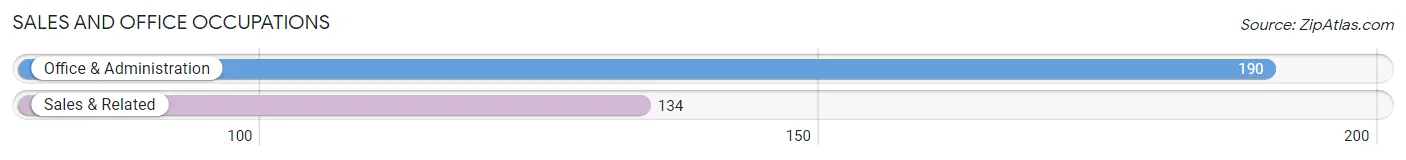
Sales and Office Occupations by Sex
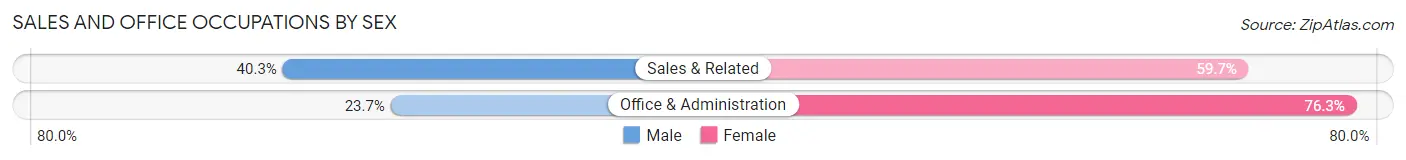
| Occupation | Male | Female |
| Sales & Related | 54 (40.3%) | 80 (59.7%) |
| Office & Administration | 45 (23.7%) | 145 (76.3%) |
| Total (Category) | 99 (30.6%) | 225 (69.4%) |
| Total (Overall) | 989 (52.2%) | 904 (47.7%) |
Natural Resources, Construction and Maintenance Occupations
The most common Natural Resources, Construction and Maintenance occupations in Upland are Construction & Extraction (63 | 3.3%), Installation, Maintenance & Repair (9 | 0.5%), and Farming, Fishing & Forestry (3 | 0.2%).
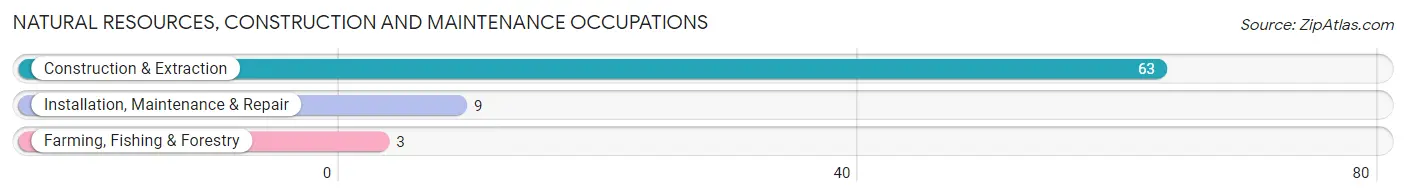
Natural Resources, Construction and Maintenance Occupations by Sex
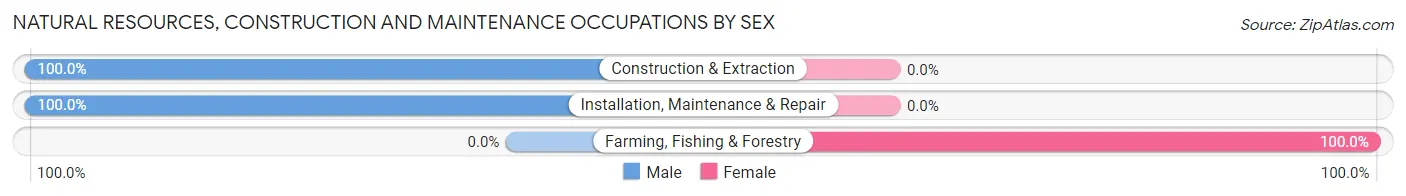
| Occupation | Male | Female |
| Farming, Fishing & Forestry | 0 (0.0%) | 3 (100.0%) |
| Construction & Extraction | 63 (100.0%) | 0 (0.0%) |
| Installation, Maintenance & Repair | 9 (100.0%) | 0 (0.0%) |
| Total (Category) | 72 (96.0%) | 3 (4.0%) |
| Total (Overall) | 989 (52.2%) | 904 (47.7%) |
Production, Transportation and Moving Occupations
The most common Production, Transportation and Moving occupations in Upland are Material Moving (160 | 8.5%), Transportation (63 | 3.3%), and Production (25 | 1.3%).
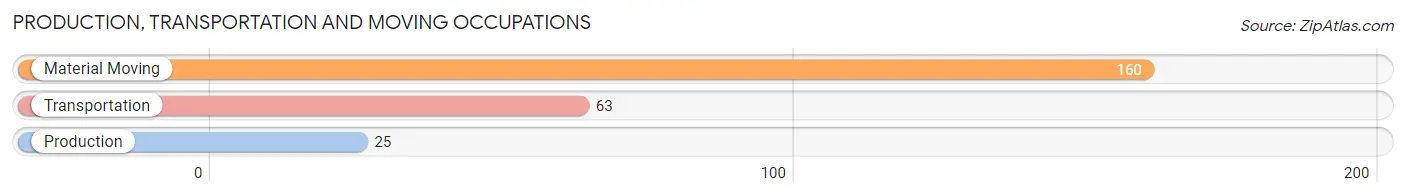
Production, Transportation and Moving Occupations by Sex
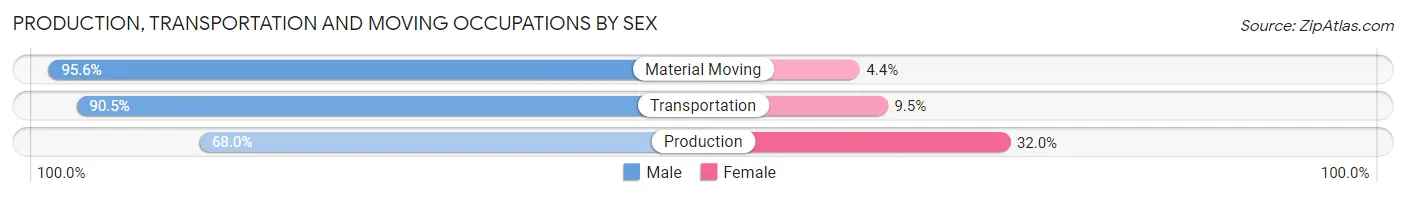
| Occupation | Male | Female |
| Production | 17 (68.0%) | 8 (32.0%) |
| Transportation | 57 (90.5%) | 6 (9.5%) |
| Material Moving | 153 (95.6%) | 7 (4.4%) |
| Total (Category) | 227 (91.5%) | 21 (8.5%) |
| Total (Overall) | 989 (52.2%) | 904 (47.7%) |
Employment Industries by Sex in Upland
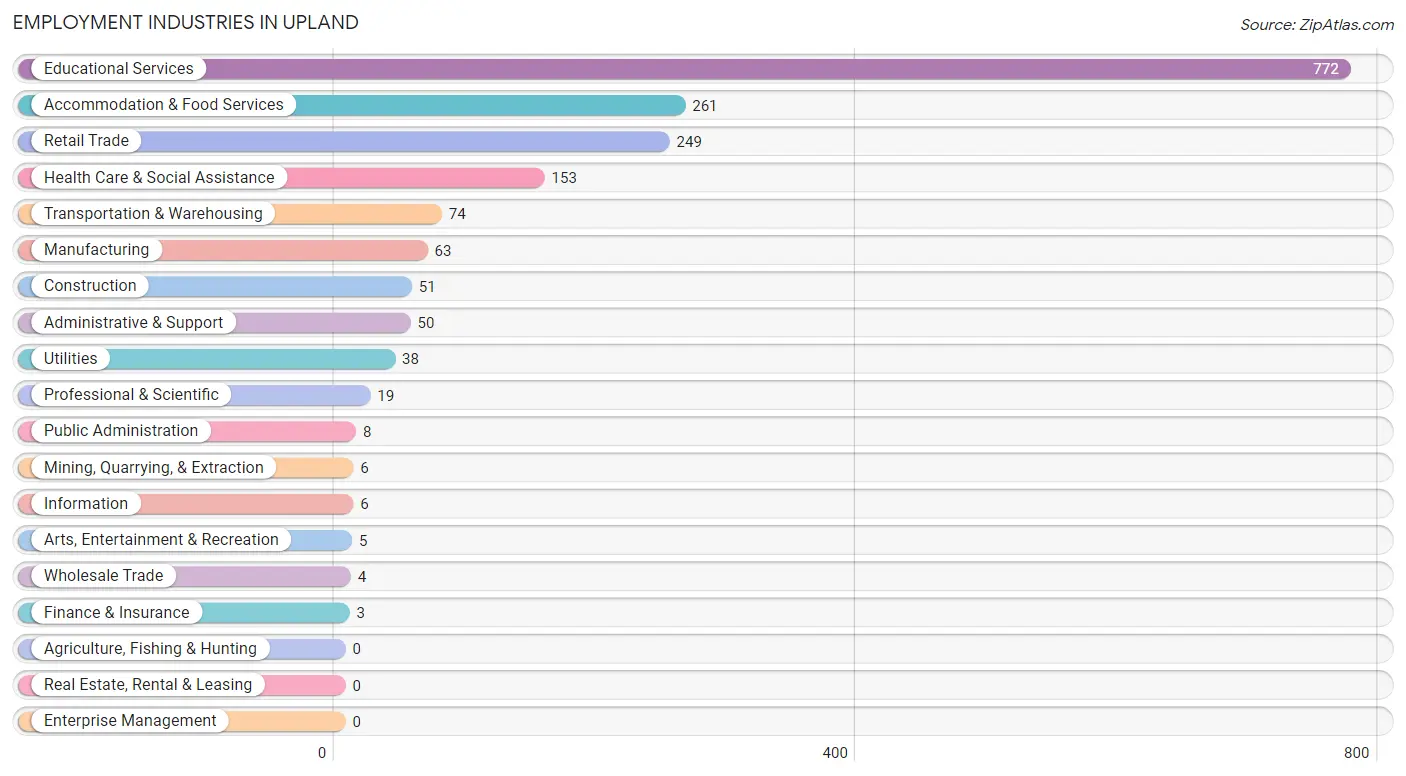
Employment Industries in Upland
The major employment industries in Upland include Educational Services (772 | 40.8%), Accommodation & Food Services (261 | 13.8%), Retail Trade (249 | 13.2%), Health Care & Social Assistance (153 | 8.1%), and Transportation & Warehousing (74 | 3.9%).
Employment Industries by Sex in Upland
The Upland industries that see more men than women are Mining, Quarrying, & Extraction (100.0%), Construction (100.0%), and Arts, Entertainment & Recreation (100.0%), whereas the industries that tend to have a higher number of women are Wholesale Trade (100.0%), Information (100.0%), and Finance & Insurance (100.0%).
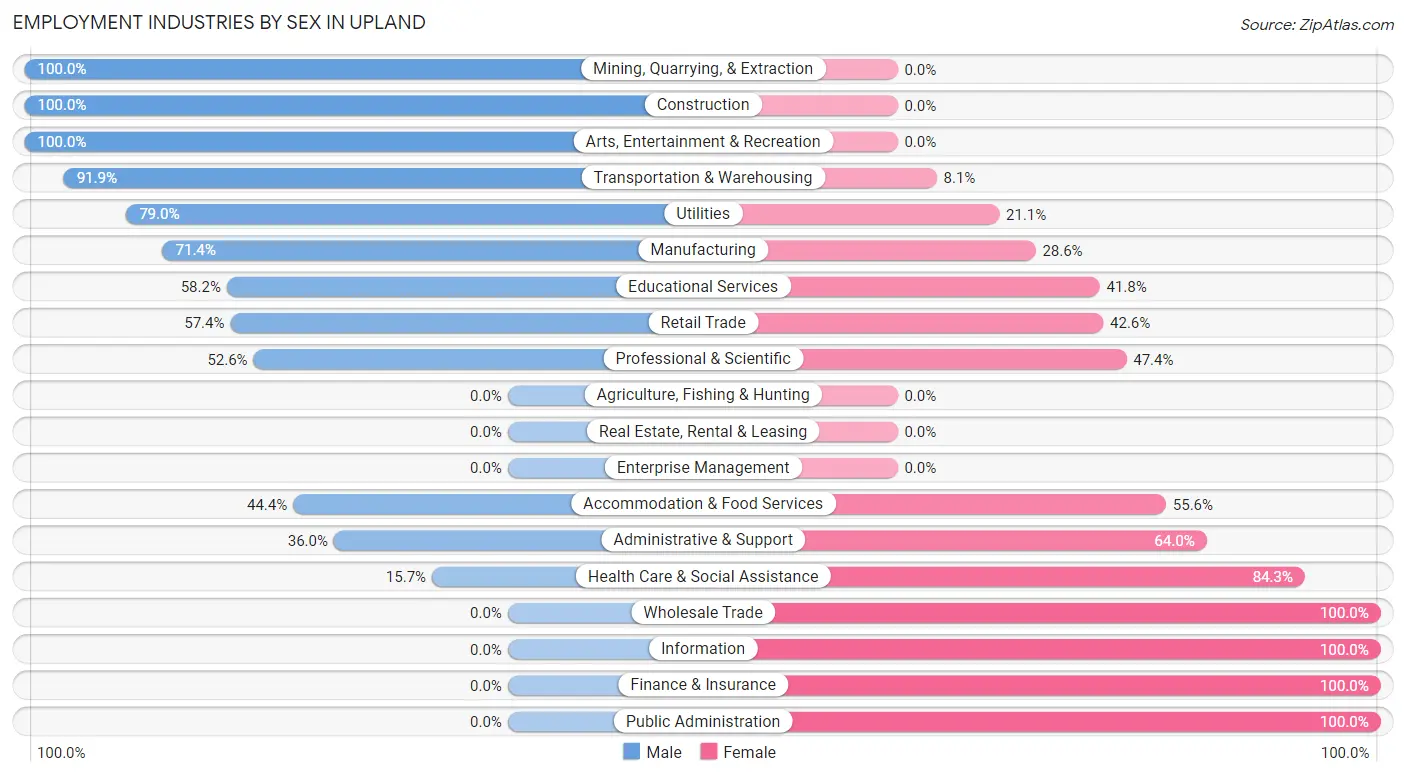
| Industry | Male | Female |
| Agriculture, Fishing & Hunting | 0 (0.0%) | 0 (0.0%) |
| Mining, Quarrying, & Extraction | 6 (100.0%) | 0 (0.0%) |
| Construction | 51 (100.0%) | 0 (0.0%) |
| Manufacturing | 45 (71.4%) | 18 (28.6%) |
| Wholesale Trade | 0 (0.0%) | 4 (100.0%) |
| Retail Trade | 143 (57.4%) | 106 (42.6%) |
| Transportation & Warehousing | 68 (91.9%) | 6 (8.1%) |
| Utilities | 30 (78.9%) | 8 (21.0%) |
| Information | 0 (0.0%) | 6 (100.0%) |
| Finance & Insurance | 0 (0.0%) | 3 (100.0%) |
| Real Estate, Rental & Leasing | 0 (0.0%) | 0 (0.0%) |
| Professional & Scientific | 10 (52.6%) | 9 (47.4%) |
| Enterprise Management | 0 (0.0%) | 0 (0.0%) |
| Administrative & Support | 18 (36.0%) | 32 (64.0%) |
| Educational Services | 449 (58.2%) | 323 (41.8%) |
| Health Care & Social Assistance | 24 (15.7%) | 129 (84.3%) |
| Arts, Entertainment & Recreation | 5 (100.0%) | 0 (0.0%) |
| Accommodation & Food Services | 116 (44.4%) | 145 (55.6%) |
| Public Administration | 0 (0.0%) | 8 (100.0%) |
| Total | 989 (52.2%) | 904 (47.7%) |
Education in Upland
School Enrollment in Upland
The most common levels of schooling among the 2,153 students in Upland are college / undergraduate (1,405 | 65.3%), high school (245 | 11.4%), and middle school (243 | 11.3%).
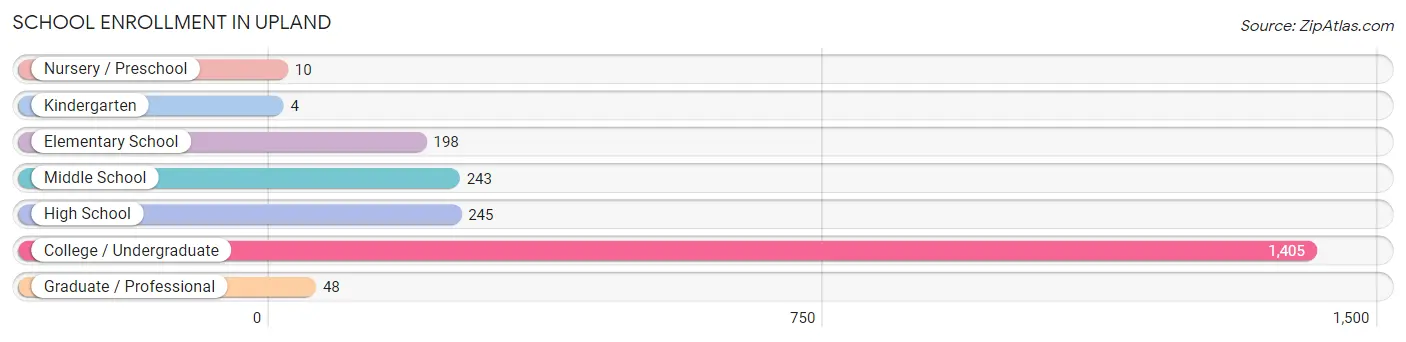
| School Level | # Students | % Students |
| Nursery / Preschool | 10 | 0.5% |
| Kindergarten | 4 | 0.2% |
| Elementary School | 198 | 9.2% |
| Middle School | 243 | 11.3% |
| High School | 245 | 11.4% |
| College / Undergraduate | 1,405 | 65.3% |
| Graduate / Professional | 48 | 2.2% |
| Total | 2,153 | 100.0% |
School Enrollment by Age by Funding Source in Upland
Out of a total of 2,153 students who are enrolled in schools in Upland, 1,417 (65.8%) attend a private institution, while the remaining 736 (34.2%) are enrolled in public schools. The age group of 3 to 4 year olds has the highest likelihood of being enrolled in private schools, with 10 (100.0% in the age bracket) enrolled. Conversely, the age group of 15 to 17 year olds has the lowest likelihood of being enrolled in a private school, with 212 (87.6% in the age bracket) attending a public institution.
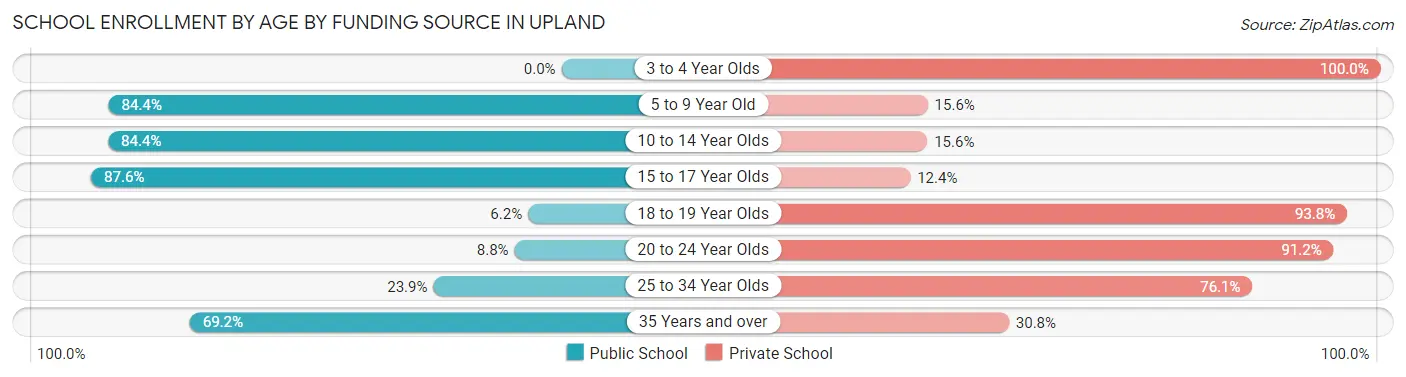
| Age Bracket | Public School | Private School |
| 3 to 4 Year Olds | 0 (0.0%) | 10 (100.0%) |
| 5 to 9 Year Old | 151 (84.4%) | 28 (15.6%) |
| 10 to 14 Year Olds | 217 (84.4%) | 40 (15.6%) |
| 15 to 17 Year Olds | 212 (87.6%) | 30 (12.4%) |
| 18 to 19 Year Olds | 32 (6.2%) | 481 (93.8%) |
| 20 to 24 Year Olds | 73 (8.8%) | 760 (91.2%) |
| 25 to 34 Year Olds | 16 (23.9%) | 51 (76.1%) |
| 35 Years and over | 36 (69.2%) | 16 (30.8%) |
| Total | 736 (34.2%) | 1,417 (65.8%) |
Educational Attainment by Field of Study in Upland
Education (142 | 20.4%), business (102 | 14.7%), liberal arts & history (97 | 14.0%), science & technology (79 | 11.4%), and literature & languages (54 | 7.8%) are the most common fields of study among 695 individuals in Upland who have obtained a bachelor's degree or higher.
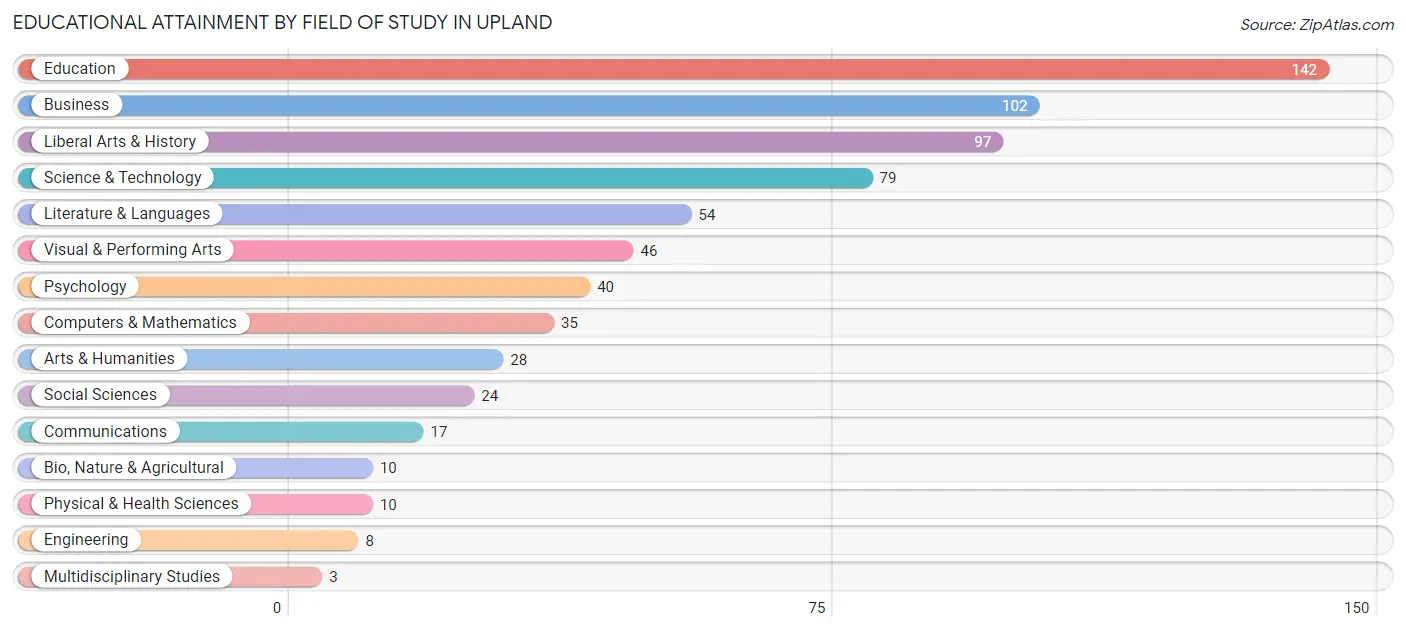
| Field of Study | # Graduates | % Graduates |
| Computers & Mathematics | 35 | 5.0% |
| Bio, Nature & Agricultural | 10 | 1.4% |
| Physical & Health Sciences | 10 | 1.4% |
| Psychology | 40 | 5.8% |
| Social Sciences | 24 | 3.5% |
| Engineering | 8 | 1.1% |
| Multidisciplinary Studies | 3 | 0.4% |
| Science & Technology | 79 | 11.4% |
| Business | 102 | 14.7% |
| Education | 142 | 20.4% |
| Literature & Languages | 54 | 7.8% |
| Liberal Arts & History | 97 | 14.0% |
| Visual & Performing Arts | 46 | 6.6% |
| Communications | 17 | 2.5% |
| Arts & Humanities | 28 | 4.0% |
| Total | 695 | 100.0% |
Transportation & Commute in Upland
Vehicle Availability by Sex in Upland
The most prevalent vehicle ownership categories in Upland are males with 2 vehicles (324, accounting for 54.3%) and females with 2 vehicles (179, making up 67.6%).
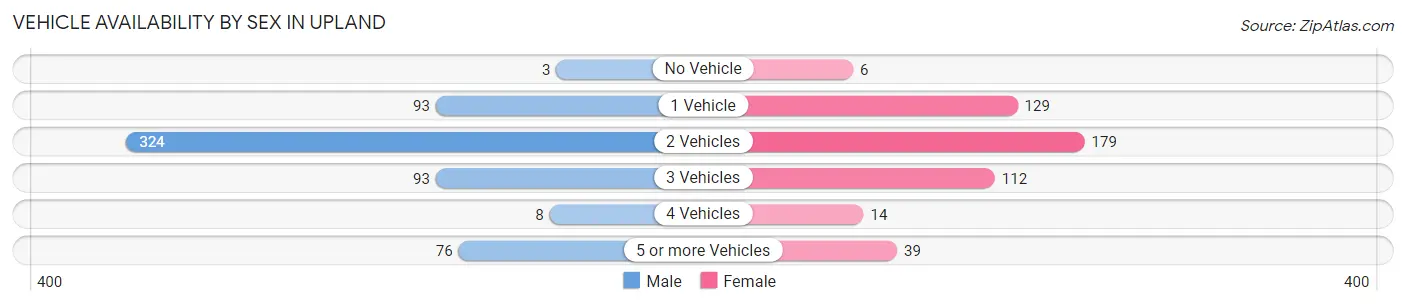
| Vehicles Available | Male | Female |
| No Vehicle | 3 (0.5%) | 6 (1.3%) |
| 1 Vehicle | 93 (15.6%) | 129 (26.9%) |
| 2 Vehicles | 324 (54.3%) | 179 (37.4%) |
| 3 Vehicles | 93 (15.6%) | 112 (23.4%) |
| 4 Vehicles | 8 (1.3%) | 14 (2.9%) |
| 5 or more Vehicles | 76 (12.7%) | 39 (8.1%) |
| Total | 597 (100.0%) | 479 (100.0%) |
Commute Time in Upland
The most frequently occuring commute durations in Upland are 5 to 9 minutes (534 commuters, 35.2%), less than 5 minutes (220 commuters, 14.5%), and 20 to 24 minutes (167 commuters, 11.0%).
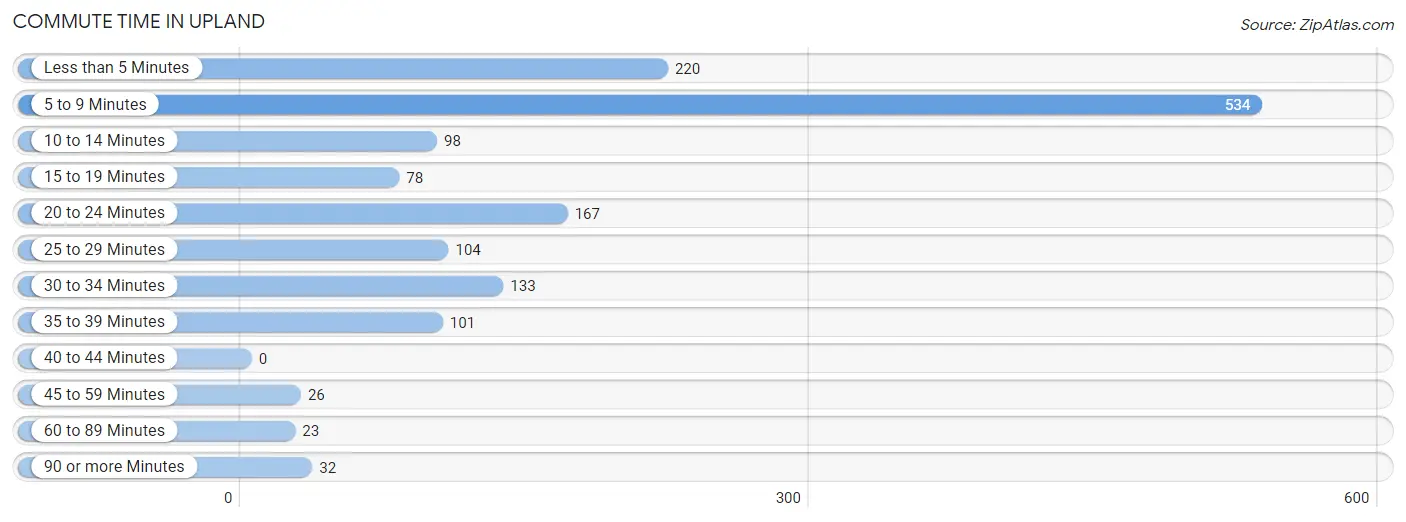
| Commute Time | # Commuters | % Commuters |
| Less than 5 Minutes | 220 | 14.5% |
| 5 to 9 Minutes | 534 | 35.2% |
| 10 to 14 Minutes | 98 | 6.5% |
| 15 to 19 Minutes | 78 | 5.1% |
| 20 to 24 Minutes | 167 | 11.0% |
| 25 to 29 Minutes | 104 | 6.9% |
| 30 to 34 Minutes | 133 | 8.8% |
| 35 to 39 Minutes | 101 | 6.7% |
| 40 to 44 Minutes | 0 | 0.0% |
| 45 to 59 Minutes | 26 | 1.7% |
| 60 to 89 Minutes | 23 | 1.5% |
| 90 or more Minutes | 32 | 2.1% |
Commute Time by Sex in Upland
The most common commute times in Upland are 5 to 9 minutes (258 commuters, 34.9%) for males and 5 to 9 minutes (276 commuters, 35.5%) for females.
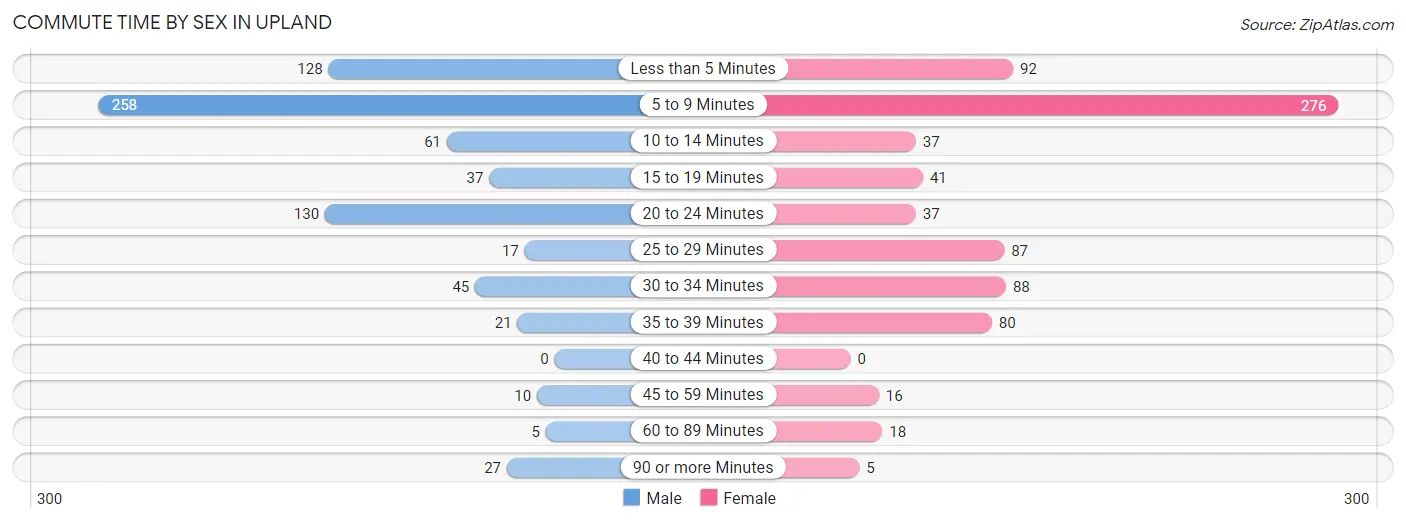
| Commute Time | Male | Female |
| Less than 5 Minutes | 128 (17.3%) | 92 (11.8%) |
| 5 to 9 Minutes | 258 (34.9%) | 276 (35.5%) |
| 10 to 14 Minutes | 61 (8.3%) | 37 (4.8%) |
| 15 to 19 Minutes | 37 (5.0%) | 41 (5.3%) |
| 20 to 24 Minutes | 130 (17.6%) | 37 (4.8%) |
| 25 to 29 Minutes | 17 (2.3%) | 87 (11.2%) |
| 30 to 34 Minutes | 45 (6.1%) | 88 (11.3%) |
| 35 to 39 Minutes | 21 (2.8%) | 80 (10.3%) |
| 40 to 44 Minutes | 0 (0.0%) | 0 (0.0%) |
| 45 to 59 Minutes | 10 (1.3%) | 16 (2.1%) |
| 60 to 89 Minutes | 5 (0.7%) | 18 (2.3%) |
| 90 or more Minutes | 27 (3.6%) | 5 (0.6%) |
Time of Departure to Work by Sex in Upland
The most frequent times of departure to work in Upland are 7:00 AM to 7:29 AM (123, 16.6%) for males and 12:00 PM to 3:59 PM (175, 22.5%) for females.
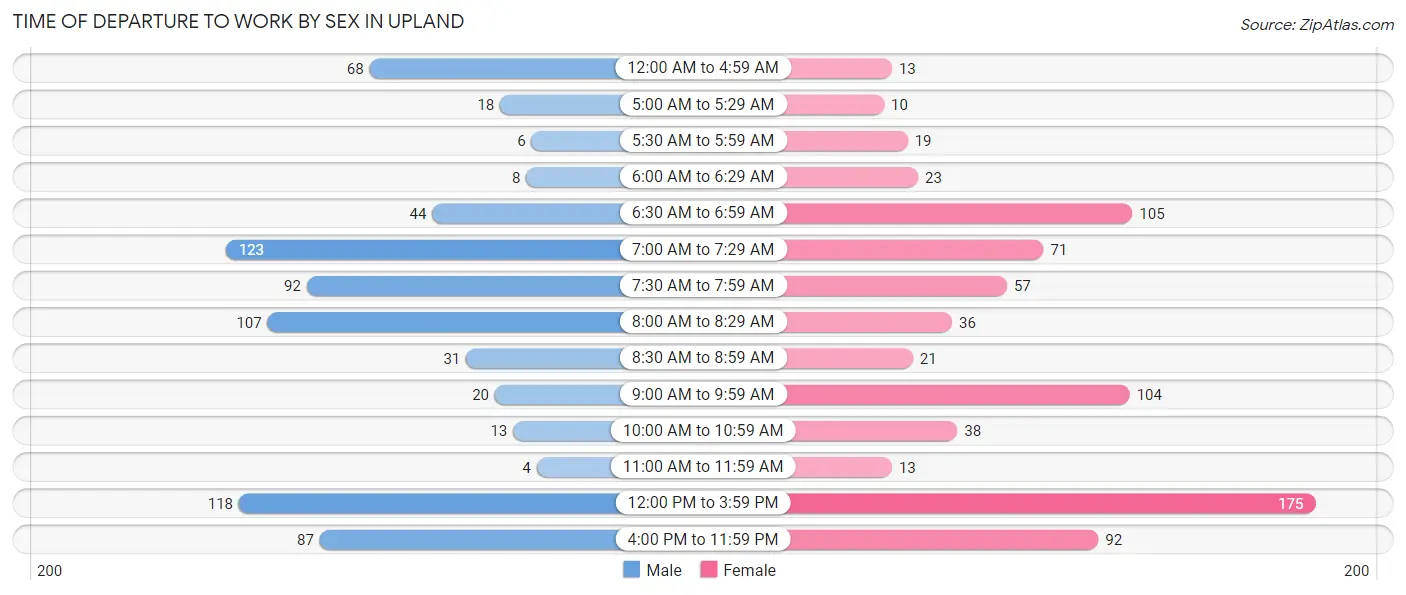
| Time of Departure | Male | Female |
| 12:00 AM to 4:59 AM | 68 (9.2%) | 13 (1.7%) |
| 5:00 AM to 5:29 AM | 18 (2.4%) | 10 (1.3%) |
| 5:30 AM to 5:59 AM | 6 (0.8%) | 19 (2.5%) |
| 6:00 AM to 6:29 AM | 8 (1.1%) | 23 (3.0%) |
| 6:30 AM to 6:59 AM | 44 (5.9%) | 105 (13.5%) |
| 7:00 AM to 7:29 AM | 123 (16.6%) | 71 (9.1%) |
| 7:30 AM to 7:59 AM | 92 (12.4%) | 57 (7.3%) |
| 8:00 AM to 8:29 AM | 107 (14.5%) | 36 (4.6%) |
| 8:30 AM to 8:59 AM | 31 (4.2%) | 21 (2.7%) |
| 9:00 AM to 9:59 AM | 20 (2.7%) | 104 (13.4%) |
| 10:00 AM to 10:59 AM | 13 (1.8%) | 38 (4.9%) |
| 11:00 AM to 11:59 AM | 4 (0.5%) | 13 (1.7%) |
| 12:00 PM to 3:59 PM | 118 (16.0%) | 175 (22.5%) |
| 4:00 PM to 11:59 PM | 87 (11.8%) | 92 (11.8%) |
| Total | 739 (100.0%) | 777 (100.0%) |
Housing Occupancy in Upland
Occupancy by Ownership in Upland
Of the total 918 dwellings in Upland, owner-occupied units account for 725 (79.0%), while renter-occupied units make up 193 (21.0%).
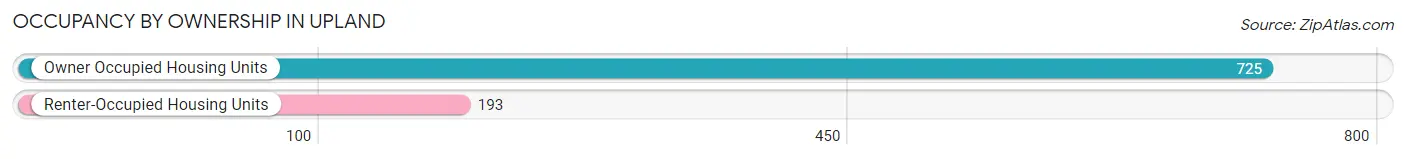
| Occupancy | # Housing Units | % Housing Units |
| Owner Occupied Housing Units | 725 | 79.0% |
| Renter-Occupied Housing Units | 193 | 21.0% |
| Total Occupied Housing Units | 918 | 100.0% |
Occupancy by Household Size in Upland
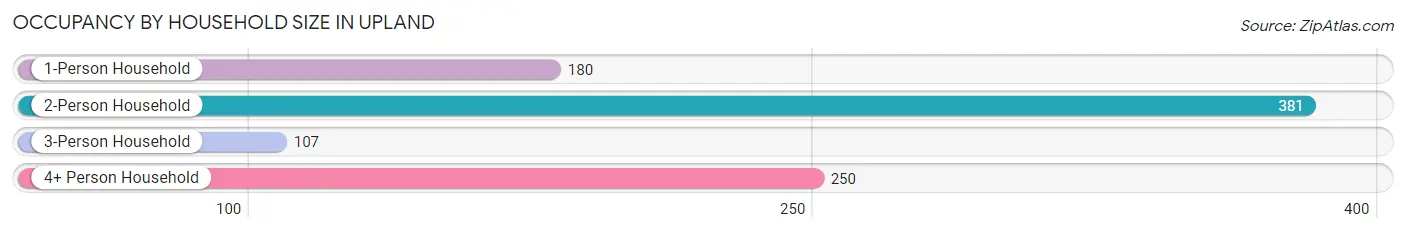
| Household Size | # Housing Units | % Housing Units |
| 1-Person Household | 180 | 19.6% |
| 2-Person Household | 381 | 41.5% |
| 3-Person Household | 107 | 11.7% |
| 4+ Person Household | 250 | 27.2% |
| Total Housing Units | 918 | 100.0% |
Occupancy by Ownership by Household Size in Upland
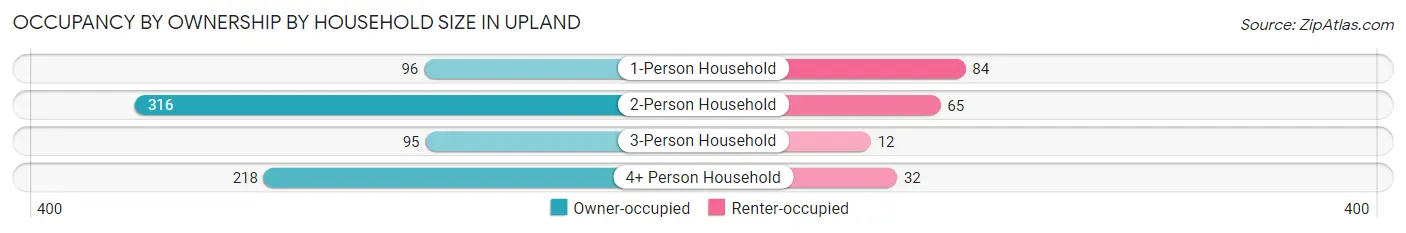
| Household Size | Owner-occupied | Renter-occupied |
| 1-Person Household | 96 (53.3%) | 84 (46.7%) |
| 2-Person Household | 316 (82.9%) | 65 (17.1%) |
| 3-Person Household | 95 (88.8%) | 12 (11.2%) |
| 4+ Person Household | 218 (87.2%) | 32 (12.8%) |
| Total Housing Units | 725 (79.0%) | 193 (21.0%) |
Occupancy by Educational Attainment in Upland
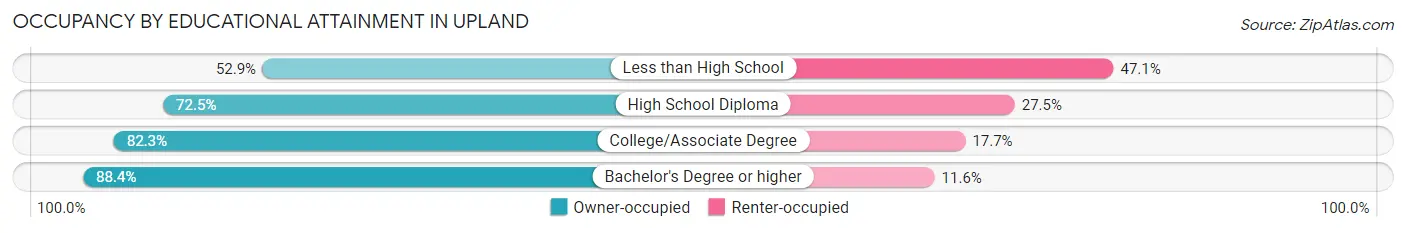
| Household Size | Owner-occupied | Renter-occupied |
| Less than High School | 36 (52.9%) | 32 (47.1%) |
| High School Diploma | 227 (72.5%) | 86 (27.5%) |
| College/Associate Degree | 172 (82.3%) | 37 (17.7%) |
| Bachelor's Degree or higher | 290 (88.4%) | 38 (11.6%) |
Occupancy by Age of Householder in Upland
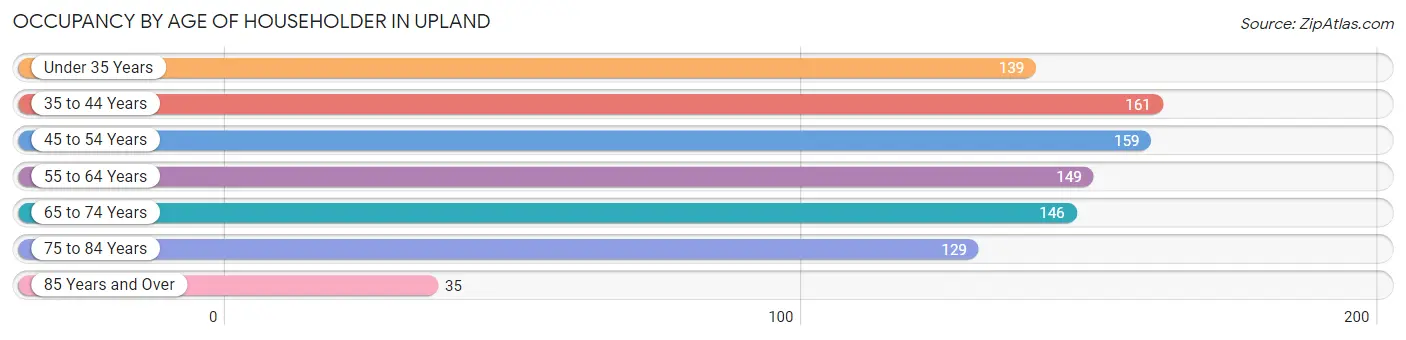
| Age Bracket | # Households | % Households |
| Under 35 Years | 139 | 15.1% |
| 35 to 44 Years | 161 | 17.5% |
| 45 to 54 Years | 159 | 17.3% |
| 55 to 64 Years | 149 | 16.2% |
| 65 to 74 Years | 146 | 15.9% |
| 75 to 84 Years | 129 | 14.1% |
| 85 Years and Over | 35 | 3.8% |
| Total | 918 | 100.0% |
Housing Finances in Upland
Median Income by Occupancy in Upland
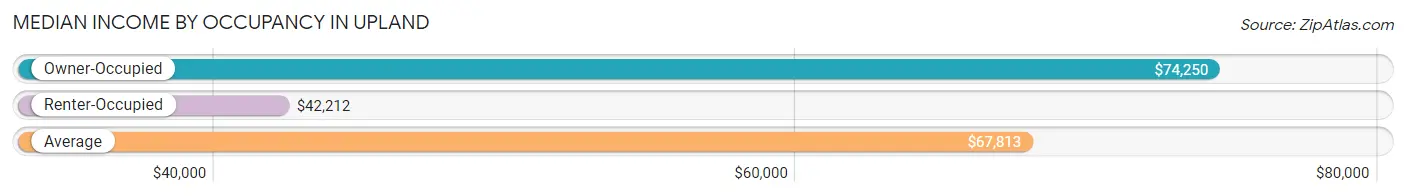
| Occupancy Type | # Households | Median Income |
| Owner-Occupied | 725 (79.0%) | $74,250 |
| Renter-Occupied | 193 (21.0%) | $42,212 |
| Average | 918 (100.0%) | $67,813 |
Occupancy by Householder Income Bracket in Upland
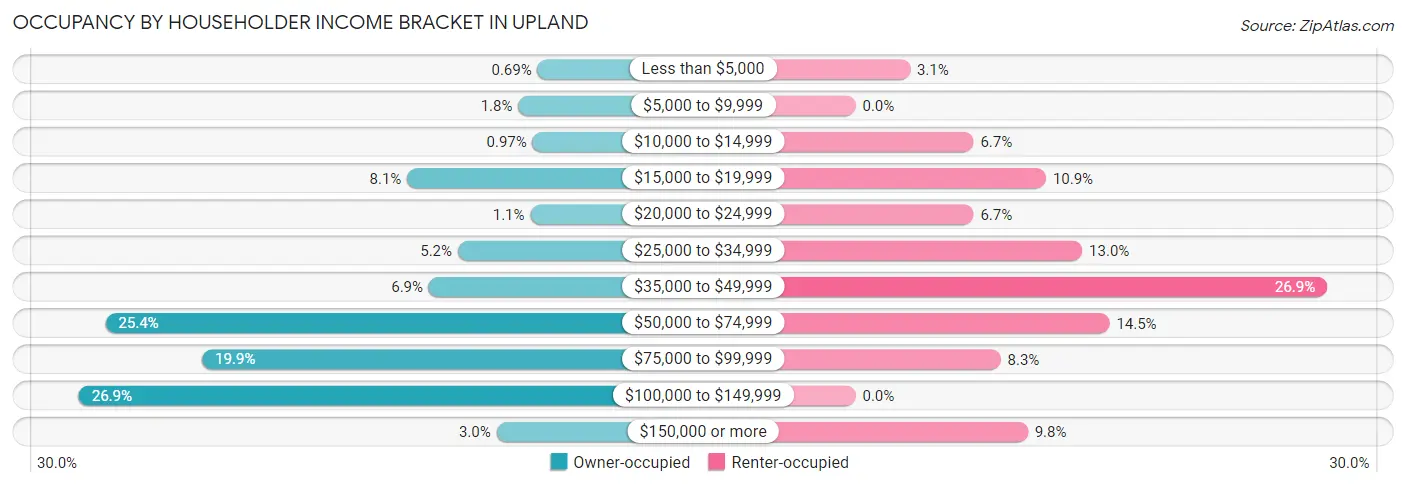
| Income Bracket | Owner-occupied | Renter-occupied |
| Less than $5,000 | 5 (0.7%) | 6 (3.1%) |
| $5,000 to $9,999 | 13 (1.8%) | 0 (0.0%) |
| $10,000 to $14,999 | 7 (1.0%) | 13 (6.7%) |
| $15,000 to $19,999 | 59 (8.1%) | 21 (10.9%) |
| $20,000 to $24,999 | 8 (1.1%) | 13 (6.7%) |
| $25,000 to $34,999 | 38 (5.2%) | 25 (13.0%) |
| $35,000 to $49,999 | 50 (6.9%) | 52 (26.9%) |
| $50,000 to $74,999 | 184 (25.4%) | 28 (14.5%) |
| $75,000 to $99,999 | 144 (19.9%) | 16 (8.3%) |
| $100,000 to $149,999 | 195 (26.9%) | 0 (0.0%) |
| $150,000 or more | 22 (3.0%) | 19 (9.8%) |
| Total | 725 (100.0%) | 193 (100.0%) |
Monthly Housing Cost Tiers in Upland
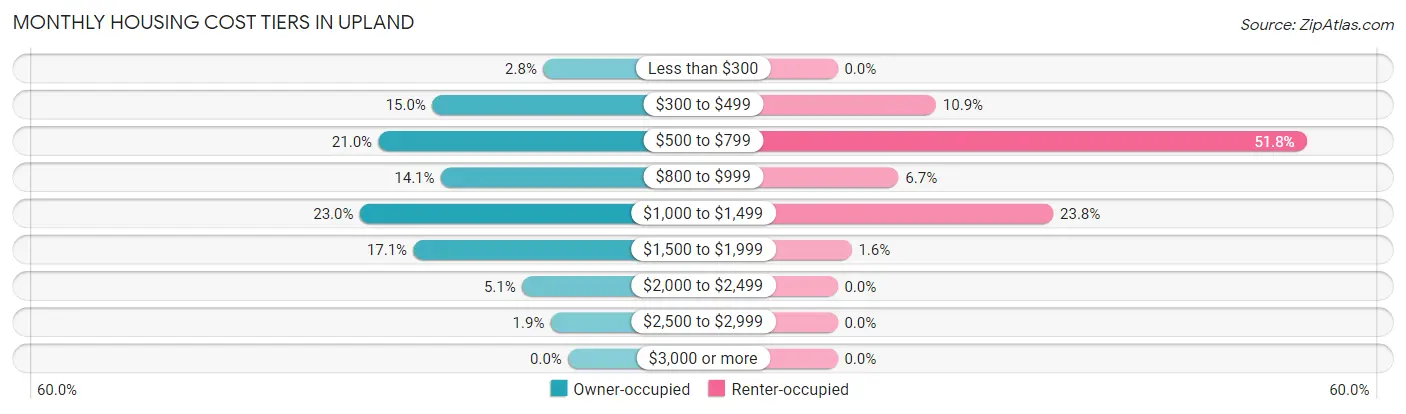
| Monthly Cost | Owner-occupied | Renter-occupied |
| Less than $300 | 20 (2.8%) | 0 (0.0%) |
| $300 to $499 | 109 (15.0%) | 21 (10.9%) |
| $500 to $799 | 152 (21.0%) | 100 (51.8%) |
| $800 to $999 | 102 (14.1%) | 13 (6.7%) |
| $1,000 to $1,499 | 167 (23.0%) | 46 (23.8%) |
| $1,500 to $1,999 | 124 (17.1%) | 3 (1.5%) |
| $2,000 to $2,499 | 37 (5.1%) | 0 (0.0%) |
| $2,500 to $2,999 | 14 (1.9%) | 0 (0.0%) |
| $3,000 or more | 0 (0.0%) | 0 (0.0%) |
| Total | 725 (100.0%) | 193 (100.0%) |
Physical Housing Characteristics in Upland
Housing Structures in Upland
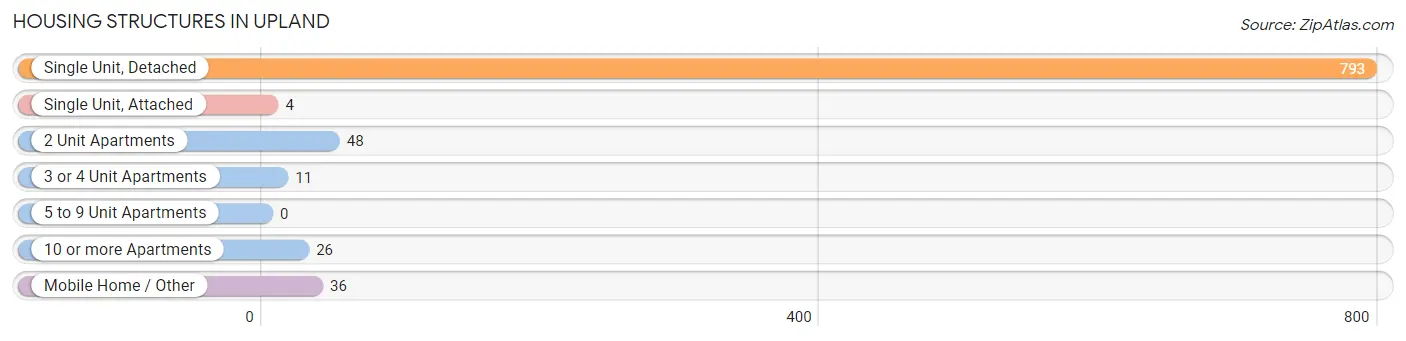
| Structure Type | # Housing Units | % Housing Units |
| Single Unit, Detached | 793 | 86.4% |
| Single Unit, Attached | 4 | 0.4% |
| 2 Unit Apartments | 48 | 5.2% |
| 3 or 4 Unit Apartments | 11 | 1.2% |
| 5 to 9 Unit Apartments | 0 | 0.0% |
| 10 or more Apartments | 26 | 2.8% |
| Mobile Home / Other | 36 | 3.9% |
| Total | 918 | 100.0% |
Housing Structures by Occupancy in Upland
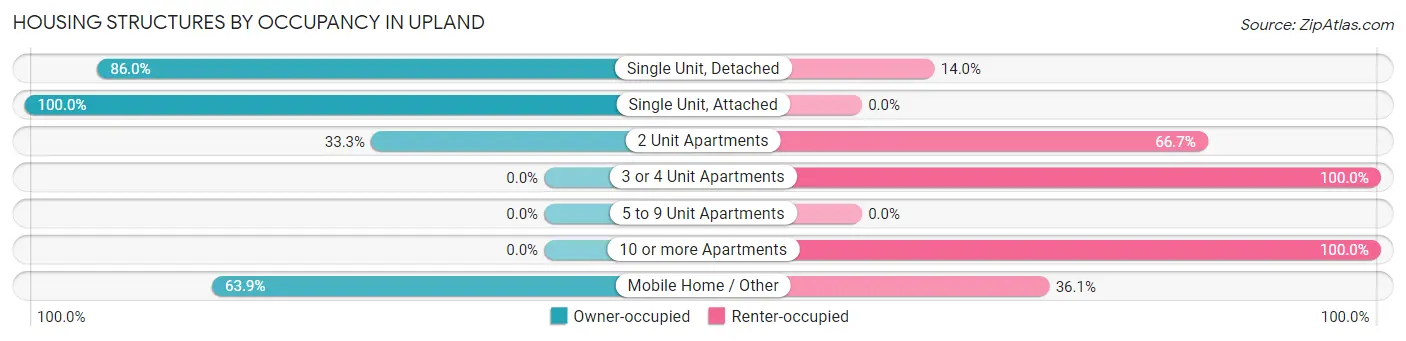
| Structure Type | Owner-occupied | Renter-occupied |
| Single Unit, Detached | 682 (86.0%) | 111 (14.0%) |
| Single Unit, Attached | 4 (100.0%) | 0 (0.0%) |
| 2 Unit Apartments | 16 (33.3%) | 32 (66.7%) |
| 3 or 4 Unit Apartments | 0 (0.0%) | 11 (100.0%) |
| 5 to 9 Unit Apartments | 0 (0.0%) | 0 (0.0%) |
| 10 or more Apartments | 0 (0.0%) | 26 (100.0%) |
| Mobile Home / Other | 23 (63.9%) | 13 (36.1%) |
| Total | 725 (79.0%) | 193 (21.0%) |
Housing Structures by Number of Rooms in Upland
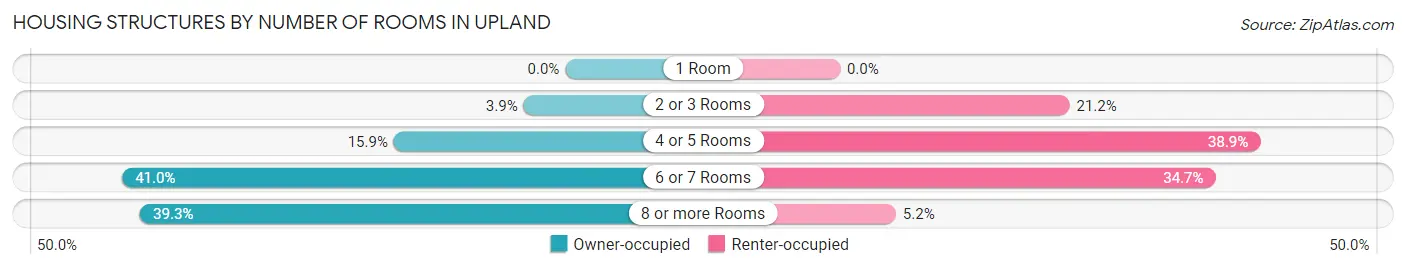
| Number of Rooms | Owner-occupied | Renter-occupied |
| 1 Room | 0 (0.0%) | 0 (0.0%) |
| 2 or 3 Rooms | 28 (3.9%) | 41 (21.2%) |
| 4 or 5 Rooms | 115 (15.9%) | 75 (38.9%) |
| 6 or 7 Rooms | 297 (41.0%) | 67 (34.7%) |
| 8 or more Rooms | 285 (39.3%) | 10 (5.2%) |
| Total | 725 (100.0%) | 193 (100.0%) |
Housing Structure by Heating Type in Upland
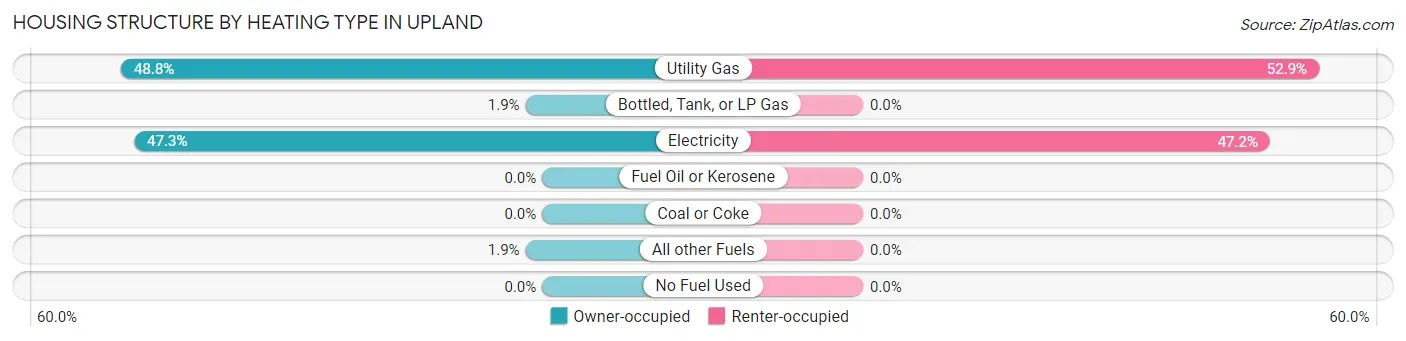
| Heating Type | Owner-occupied | Renter-occupied |
| Utility Gas | 354 (48.8%) | 102 (52.8%) |
| Bottled, Tank, or LP Gas | 14 (1.9%) | 0 (0.0%) |
| Electricity | 343 (47.3%) | 91 (47.1%) |
| Fuel Oil or Kerosene | 0 (0.0%) | 0 (0.0%) |
| Coal or Coke | 0 (0.0%) | 0 (0.0%) |
| All other Fuels | 14 (1.9%) | 0 (0.0%) |
| No Fuel Used | 0 (0.0%) | 0 (0.0%) |
| Total | 725 (100.0%) | 193 (100.0%) |
Household Vehicle Usage in Upland
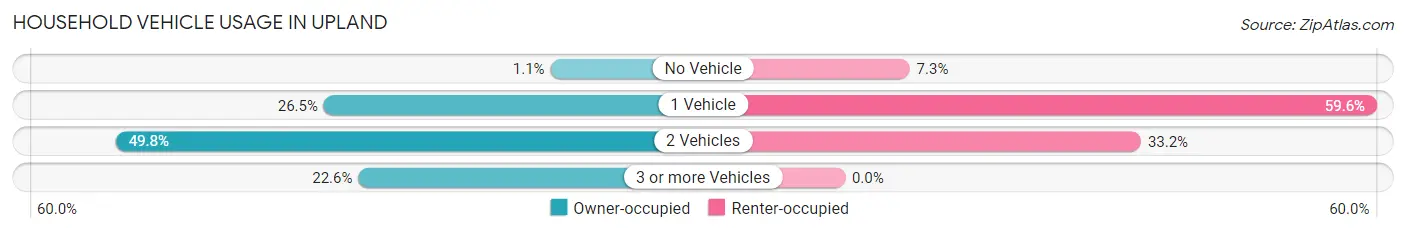
| Vehicles per Household | Owner-occupied | Renter-occupied |
| No Vehicle | 8 (1.1%) | 14 (7.2%) |
| 1 Vehicle | 192 (26.5%) | 115 (59.6%) |
| 2 Vehicles | 361 (49.8%) | 64 (33.2%) |
| 3 or more Vehicles | 164 (22.6%) | 0 (0.0%) |
| Total | 725 (100.0%) | 193 (100.0%) |
Real Estate & Mortgages in Upland
Real Estate and Mortgage Overview in Upland
| Characteristic | Without Mortgage | With Mortgage |
| Housing Units | 205 | 520 |
| Median Property Value | $152,200 | $171,800 |
| Median Household Income | $60,125 | $0 |
| Monthly Housing Costs | $478 | $0 |
| Real Estate Taxes | $1,099 | $48 |
Property Value by Mortgage Status in Upland
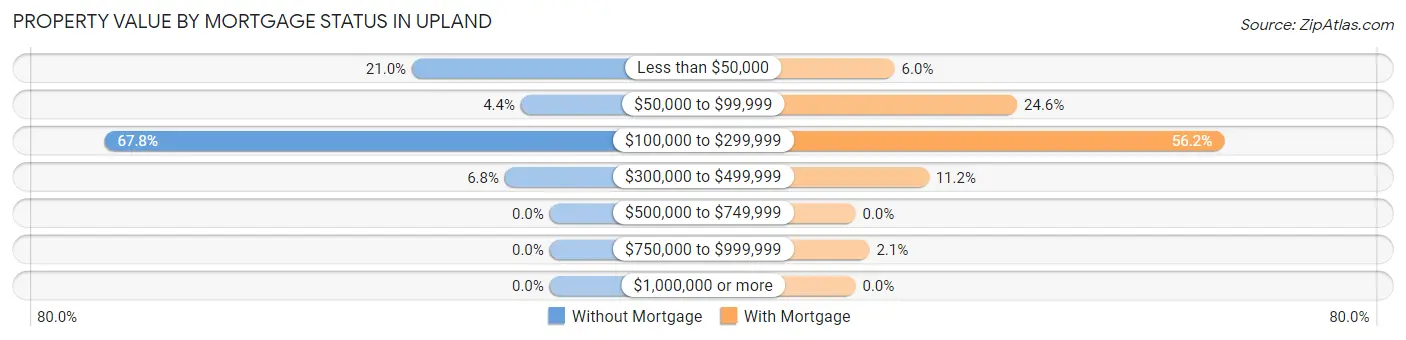
| Property Value | Without Mortgage | With Mortgage |
| Less than $50,000 | 43 (21.0%) | 31 (6.0%) |
| $50,000 to $99,999 | 9 (4.4%) | 128 (24.6%) |
| $100,000 to $299,999 | 139 (67.8%) | 292 (56.1%) |
| $300,000 to $499,999 | 14 (6.8%) | 58 (11.2%) |
| $500,000 to $749,999 | 0 (0.0%) | 0 (0.0%) |
| $750,000 to $999,999 | 0 (0.0%) | 11 (2.1%) |
| $1,000,000 or more | 0 (0.0%) | 0 (0.0%) |
| Total | 205 (100.0%) | 520 (100.0%) |
Household Income by Mortgage Status in Upland
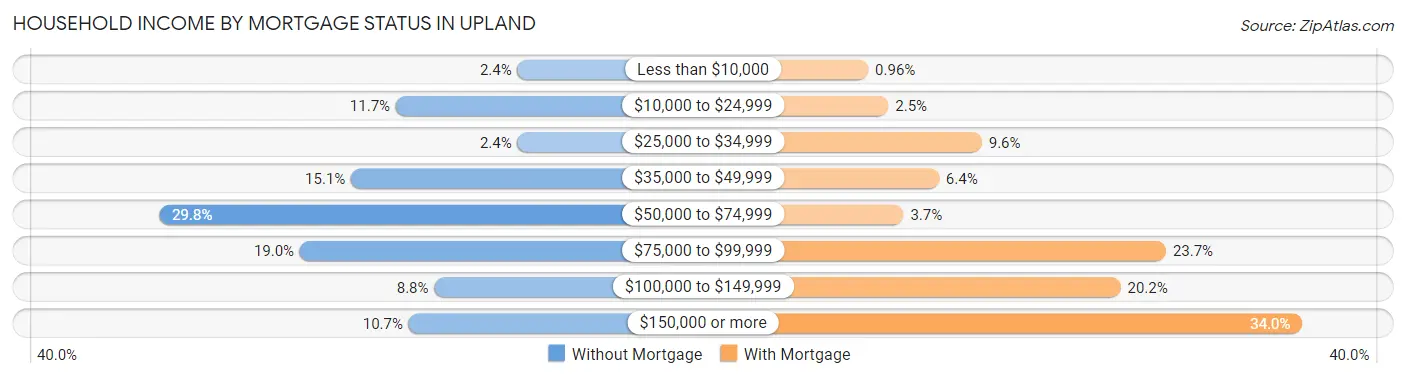
| Household Income | Without Mortgage | With Mortgage |
| Less than $10,000 | 5 (2.4%) | 5 (1.0%) |
| $10,000 to $24,999 | 24 (11.7%) | 13 (2.5%) |
| $25,000 to $34,999 | 5 (2.4%) | 50 (9.6%) |
| $35,000 to $49,999 | 31 (15.1%) | 33 (6.4%) |
| $50,000 to $74,999 | 61 (29.8%) | 19 (3.6%) |
| $75,000 to $99,999 | 39 (19.0%) | 123 (23.6%) |
| $100,000 to $149,999 | 18 (8.8%) | 105 (20.2%) |
| $150,000 or more | 22 (10.7%) | 177 (34.0%) |
| Total | 205 (100.0%) | 520 (100.0%) |
Property Value to Household Income Ratio in Upland
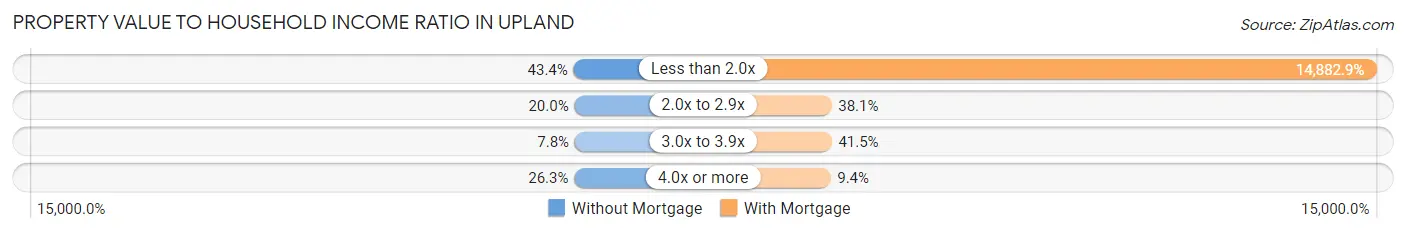
| Value-to-Income Ratio | Without Mortgage | With Mortgage |
| Less than 2.0x | 89 (43.4%) | 77,391 (14,882.9%) |
| 2.0x to 2.9x | 41 (20.0%) | 198 (38.1%) |
| 3.0x to 3.9x | 16 (7.8%) | 216 (41.5%) |
| 4.0x or more | 54 (26.3%) | 49 (9.4%) |
| Total | 205 (100.0%) | 520 (100.0%) |
Real Estate Taxes by Mortgage Status in Upland
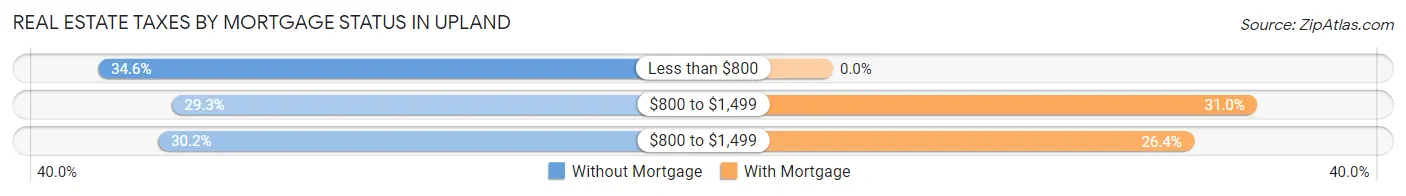
| Property Taxes | Without Mortgage | With Mortgage |
| Less than $800 | 71 (34.6%) | 0 (0.0%) |
| $800 to $1,499 | 60 (29.3%) | 161 (31.0%) |
| $800 to $1,499 | 62 (30.2%) | 137 (26.4%) |
| Total | 205 (100.0%) | 520 (100.0%) |
Health & Disability in Upland
Health Insurance Coverage by Age in Upland
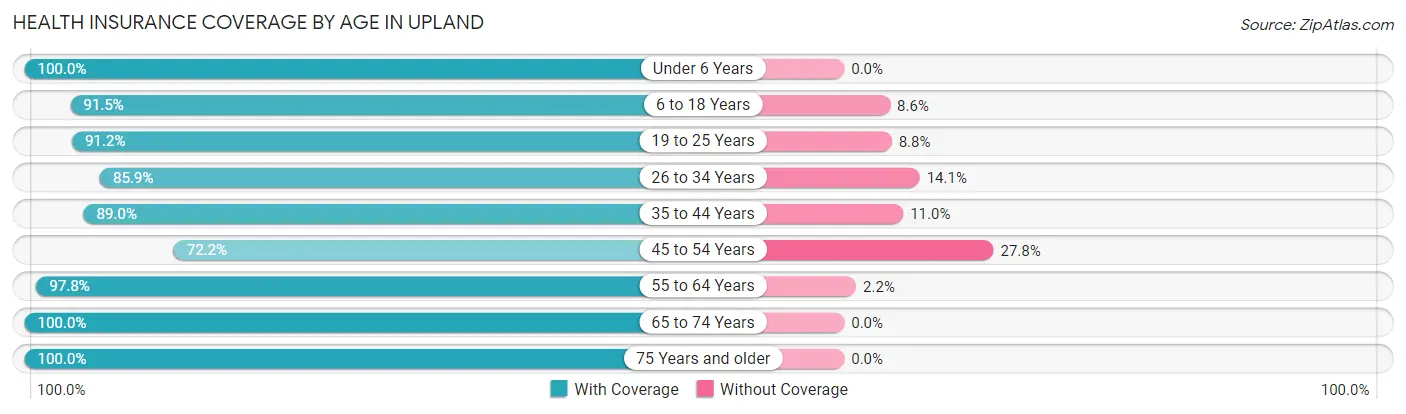
| Age Bracket | With Coverage | Without Coverage |
| Under 6 Years | 151 (100.0%) | 0 (0.0%) |
| 6 to 18 Years | 813 (91.4%) | 76 (8.6%) |
| 19 to 25 Years | 1,166 (91.2%) | 113 (8.8%) |
| 26 to 34 Years | 226 (85.9%) | 37 (14.1%) |
| 35 to 44 Years | 243 (89.0%) | 30 (11.0%) |
| 45 to 54 Years | 223 (72.2%) | 86 (27.8%) |
| 55 to 64 Years | 265 (97.8%) | 6 (2.2%) |
| 65 to 74 Years | 235 (100.0%) | 0 (0.0%) |
| 75 Years and older | 230 (100.0%) | 0 (0.0%) |
| Total | 3,552 (91.1%) | 348 (8.9%) |
Health Insurance Coverage by Citizenship Status in Upland
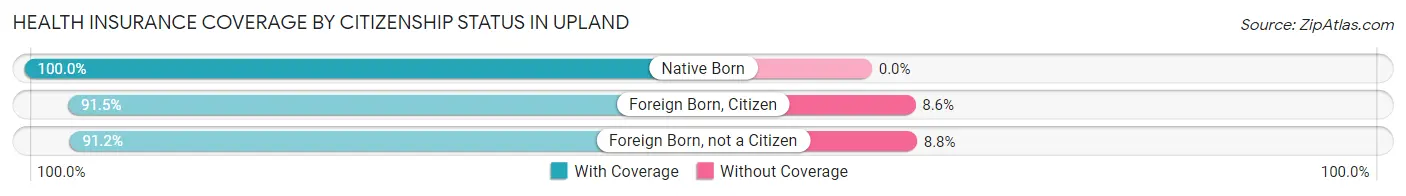
| Citizenship Status | With Coverage | Without Coverage |
| Native Born | 151 (100.0%) | 0 (0.0%) |
| Foreign Born, Citizen | 813 (91.4%) | 76 (8.6%) |
| Foreign Born, not a Citizen | 1,166 (91.2%) | 113 (8.8%) |
Health Insurance Coverage by Household Income in Upland
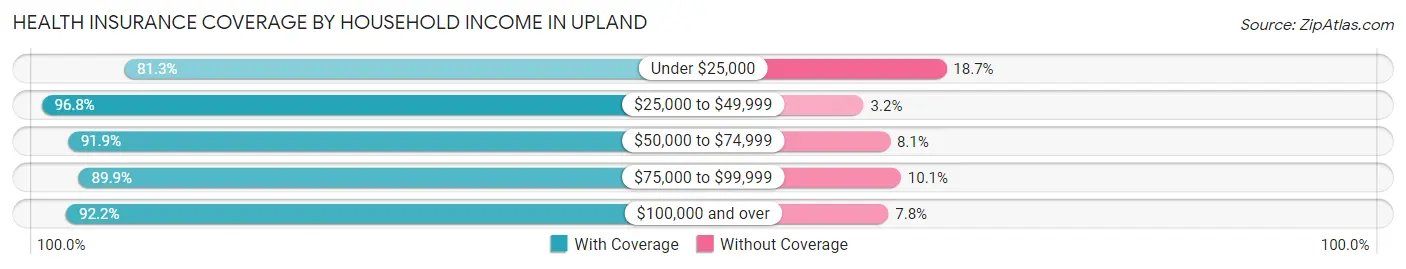
| Household Income | With Coverage | Without Coverage |
| Under $25,000 | 292 (81.3%) | 67 (18.7%) |
| $25,000 to $49,999 | 306 (96.8%) | 10 (3.2%) |
| $50,000 to $74,999 | 477 (91.9%) | 42 (8.1%) |
| $75,000 to $99,999 | 355 (89.9%) | 40 (10.1%) |
| $100,000 and over | 936 (92.2%) | 79 (7.8%) |
Public vs Private Health Insurance Coverage by Age in Upland
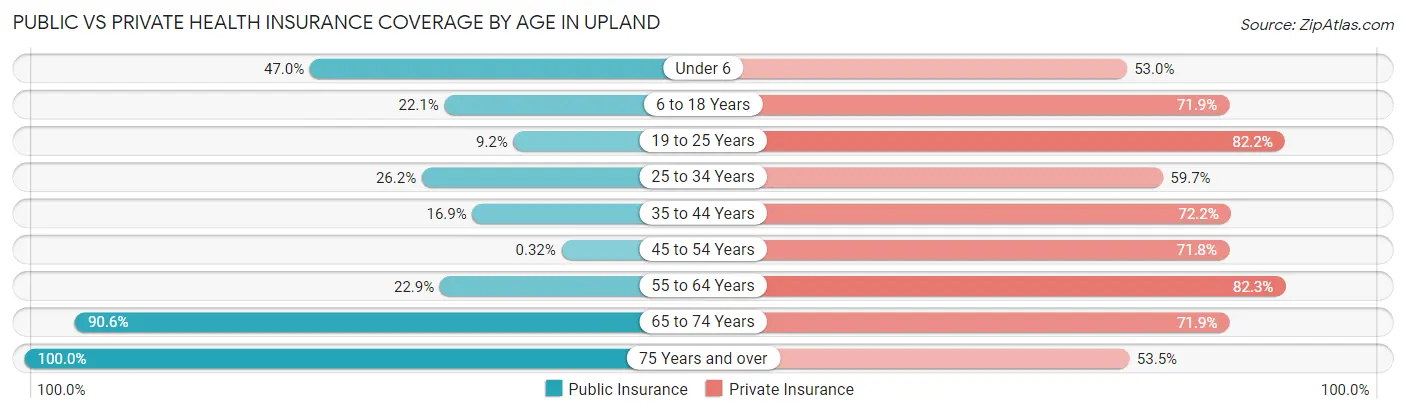
| Age Bracket | Public Insurance | Private Insurance |
| Under 6 | 71 (47.0%) | 80 (53.0%) |
| 6 to 18 Years | 196 (22.1%) | 639 (71.9%) |
| 19 to 25 Years | 118 (9.2%) | 1,051 (82.2%) |
| 25 to 34 Years | 69 (26.2%) | 157 (59.7%) |
| 35 to 44 Years | 46 (16.9%) | 197 (72.2%) |
| 45 to 54 Years | 1 (0.3%) | 222 (71.8%) |
| 55 to 64 Years | 62 (22.9%) | 223 (82.3%) |
| 65 to 74 Years | 213 (90.6%) | 169 (71.9%) |
| 75 Years and over | 230 (100.0%) | 123 (53.5%) |
| Total | 1,006 (25.8%) | 2,861 (73.4%) |
Disability Status by Sex by Age in Upland
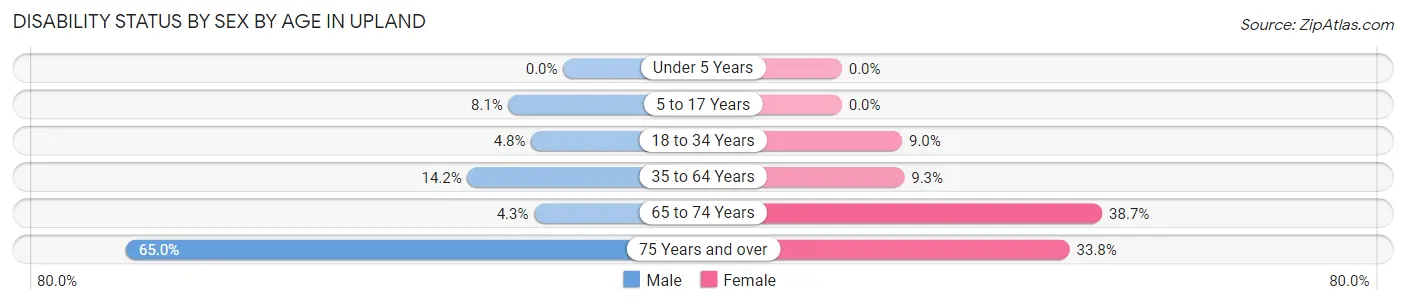
| Age Bracket | Male | Female |
| Under 5 Years | 0 (0.0%) | 0 (0.0%) |
| 5 to 17 Years | 25 (8.1%) | 0 (0.0%) |
| 18 to 34 Years | 41 (4.8%) | 80 (8.9%) |
| 35 to 64 Years | 60 (14.2%) | 40 (9.3%) |
| 65 to 74 Years | 5 (4.3%) | 46 (38.7%) |
| 75 Years and over | 63 (64.9%) | 45 (33.8%) |
Disability Class by Sex by Age in Upland
Disability Class: Hearing Difficulty
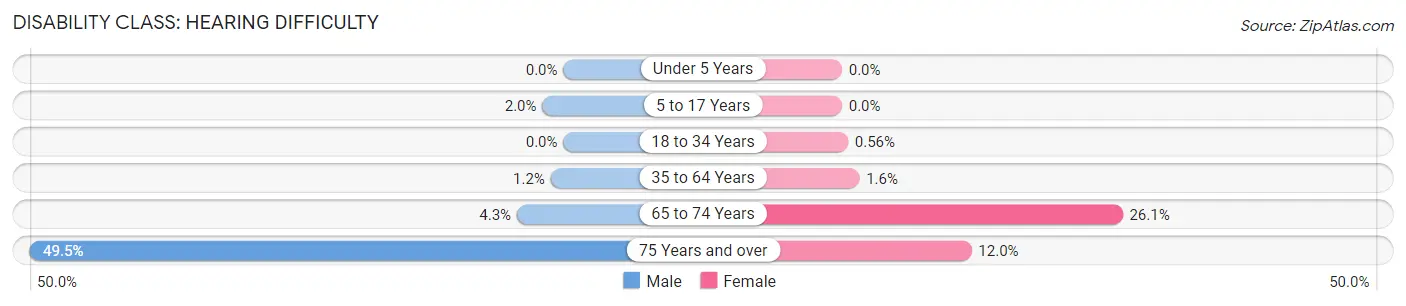
| Age Bracket | Male | Female |
| Under 5 Years | 0 (0.0%) | 0 (0.0%) |
| 5 to 17 Years | 6 (1.9%) | 0 (0.0%) |
| 18 to 34 Years | 0 (0.0%) | 5 (0.6%) |
| 35 to 64 Years | 5 (1.2%) | 7 (1.6%) |
| 65 to 74 Years | 5 (4.3%) | 31 (26.1%) |
| 75 Years and over | 48 (49.5%) | 16 (12.0%) |
Disability Class: Vision Difficulty
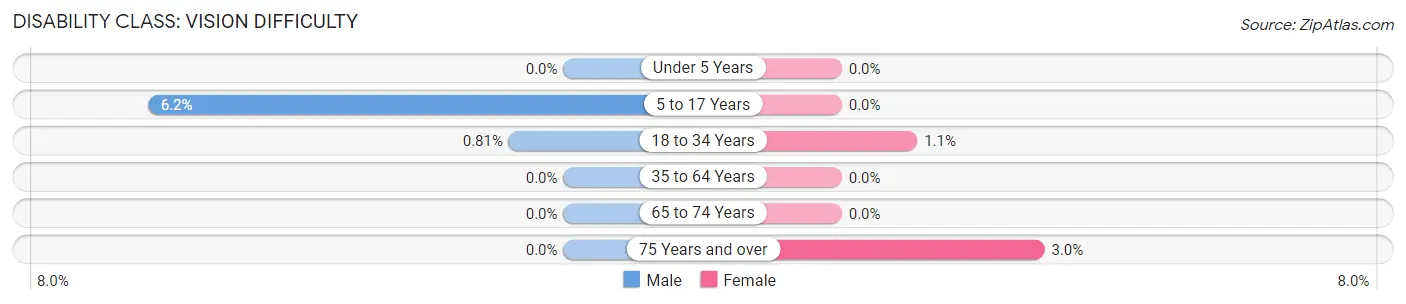
| Age Bracket | Male | Female |
| Under 5 Years | 0 (0.0%) | 0 (0.0%) |
| 5 to 17 Years | 19 (6.2%) | 0 (0.0%) |
| 18 to 34 Years | 7 (0.8%) | 10 (1.1%) |
| 35 to 64 Years | 0 (0.0%) | 0 (0.0%) |
| 65 to 74 Years | 0 (0.0%) | 0 (0.0%) |
| 75 Years and over | 0 (0.0%) | 4 (3.0%) |
Disability Class: Cognitive Difficulty
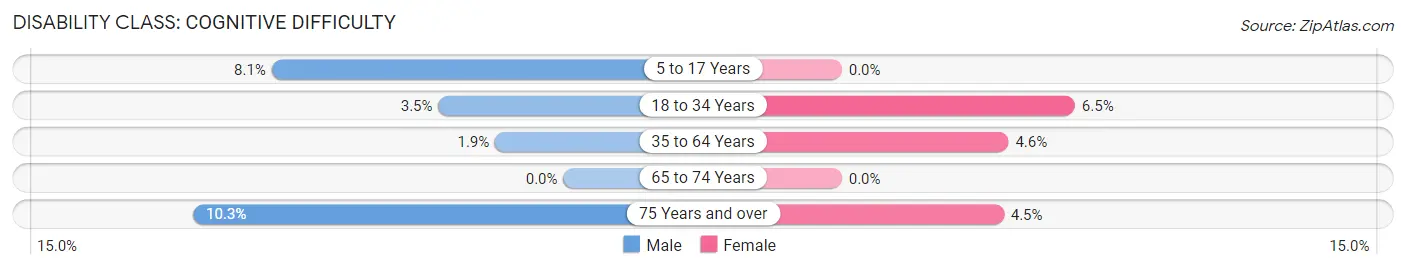
| Age Bracket | Male | Female |
| 5 to 17 Years | 25 (8.1%) | 0 (0.0%) |
| 18 to 34 Years | 30 (3.5%) | 58 (6.5%) |
| 35 to 64 Years | 8 (1.9%) | 20 (4.6%) |
| 65 to 74 Years | 0 (0.0%) | 0 (0.0%) |
| 75 Years and over | 10 (10.3%) | 6 (4.5%) |
Disability Class: Ambulatory Difficulty
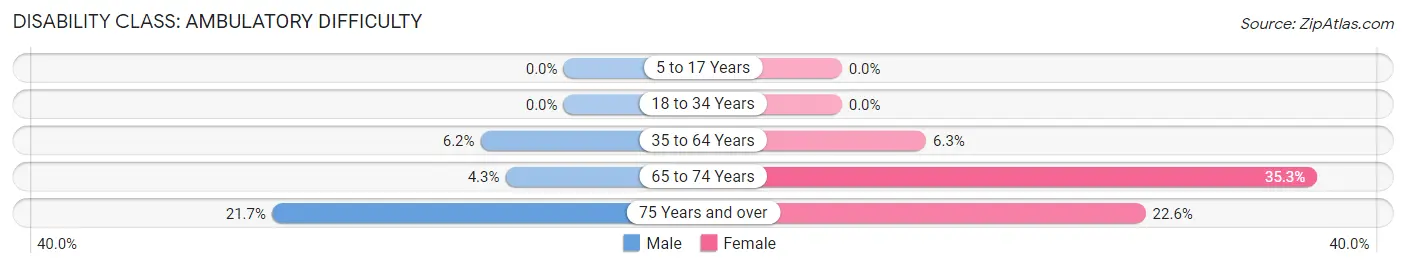
| Age Bracket | Male | Female |
| 5 to 17 Years | 0 (0.0%) | 0 (0.0%) |
| 18 to 34 Years | 0 (0.0%) | 0 (0.0%) |
| 35 to 64 Years | 26 (6.2%) | 27 (6.3%) |
| 65 to 74 Years | 5 (4.3%) | 42 (35.3%) |
| 75 Years and over | 21 (21.6%) | 30 (22.6%) |
Disability Class: Self-Care Difficulty
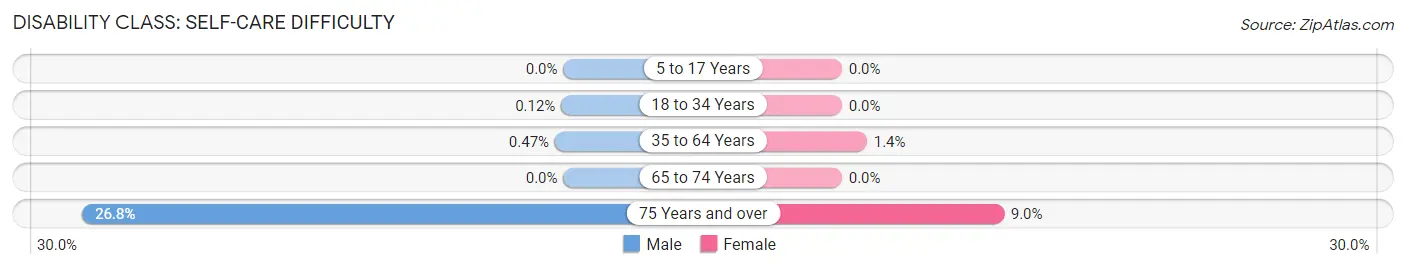
| Age Bracket | Male | Female |
| 5 to 17 Years | 0 (0.0%) | 0 (0.0%) |
| 18 to 34 Years | 1 (0.1%) | 0 (0.0%) |
| 35 to 64 Years | 2 (0.5%) | 6 (1.4%) |
| 65 to 74 Years | 0 (0.0%) | 0 (0.0%) |
| 75 Years and over | 26 (26.8%) | 12 (9.0%) |
Technology Access in Upland
Computing Device Access in Upland
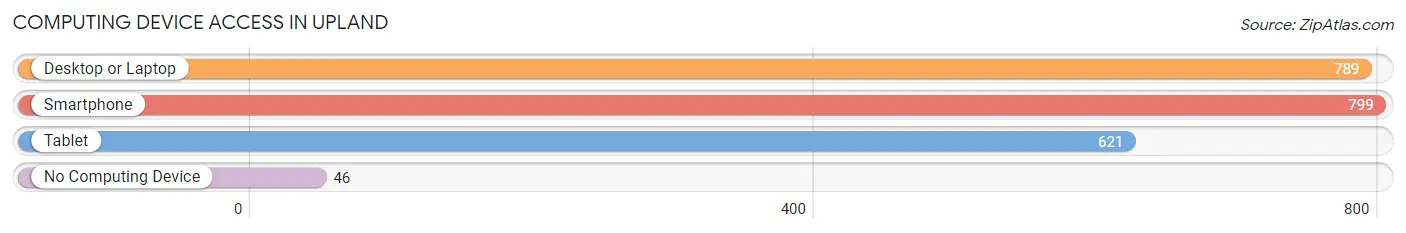
| Device Type | # Households | % Households |
| Desktop or Laptop | 789 | 86.0% |
| Smartphone | 799 | 87.0% |
| Tablet | 621 | 67.6% |
| No Computing Device | 46 | 5.0% |
| Total | 918 | 100.0% |
Internet Access in Upland
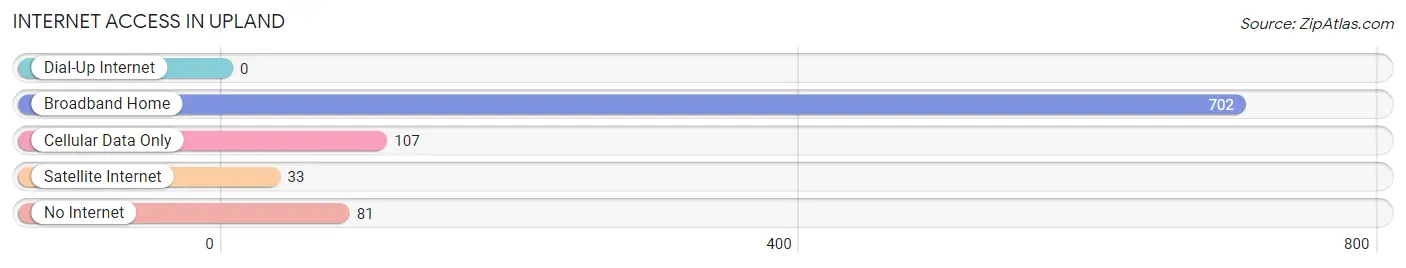
| Internet Type | # Households | % Households |
| Dial-Up Internet | 0 | 0.0% |
| Broadband Home | 702 | 76.5% |
| Cellular Data Only | 107 | 11.7% |
| Satellite Internet | 33 | 3.6% |
| No Internet | 81 | 8.8% |
| Total | 918 | 100.0% |
Upland Summary
Upland, Indiana is a small town located in Grant County, Indiana. It is situated in the east-central part of the state, about 25 miles northeast of Muncie. The town was founded in 1837 and has a population of approximately 2,500 people.
Geography
Upland is located in the east-central part of Grant County, Indiana. It is situated in the Tippecanoe River Valley, which is part of the Wabash River watershed. The town is located on the north side of the Tippecanoe River, and is bordered by the towns of Matthews, Sweetser, and Swayzee. The town is located at an elevation of 830 feet above sea level.
The town is located in a rural area, and is surrounded by farmland. The area is known for its rolling hills and wooded areas. The town is located in a temperate climate, with hot summers and cold winters.
History
Upland was founded in 1837 by a group of settlers from Ohio. The town was named after the nearby Upland Prairie, which was a popular hunting ground for the settlers. The town was originally a farming community, and the settlers grew corn, wheat, and other crops.
In the late 19th century, the town began to grow and develop. The railroad was built through the town in 1887, and the town became a stop on the line. This allowed the town to become a shipping center for the surrounding area.
In the early 20th century, the town began to diversify its economy. The town became a center for manufacturing, and several factories were built in the area. The town also became a center for education, and several schools were built in the area.
Economy
Upland is a small town with a population of approximately 2,500 people. The town is primarily a bedroom community, with most of its residents commuting to nearby cities for work. The town does have some local businesses, including a few restaurants, a grocery store, and a few small shops.
The town is also home to several manufacturing companies, including a plastics factory, a metal fabrication plant, and a printing company. The town is also home to a few small farms, which produce corn, soybeans, and other crops.
Demographics
As of the 2010 census, the population of Upland was 2,521. The town is predominantly white, with 92.3% of the population being white. The town also has a small Hispanic population, with 4.2% of the population being Hispanic. The town also has a small African American population, with 1.3% of the population being African American.
The median household income in Upland is $41,944, and the median home value is $90,400. The town has a poverty rate of 16.3%, which is higher than the national average.
Conclusion
Upland, Indiana is a small town located in Grant County, Indiana. It is situated in the east-central part of the state, about 25 miles northeast of Muncie. The town was founded in 1837 and has a population of approximately 2,500 people. The town is primarily a bedroom community, with most of its residents commuting to nearby cities for work. The town also has some local businesses, including a few restaurants, a grocery store, and a few small shops. The town is also home to several manufacturing companies, including a plastics factory, a metal fabrication plant, and a printing company. The town is predominantly white, with 92.3% of the population being white. The median household income in Upland is $41,944, and the median home value is $90,400.
Common Questions
What is Per Capita Income in Upland?
Per Capita income in Upland is $20,568.
What is the Median Family Income in Upland?
Median Family Income in Upland is $76,193.
What is the Median Household income in Upland?
Median Household Income in Upland is $67,813.
What is Income or Wage Gap in Upland?
Income or Wage Gap in Upland is 28.2%.
Women in Upland earn 71.8 cents for every dollar earned by a man.
What is Inequality or Gini Index in Upland?
Inequality or Gini Index in Upland is 0.40.
What is the Total Population of Upland?
Total Population of Upland is 3,963.
What is the Total Male Population of Upland?
Total Male Population of Upland is 1,853.
What is the Total Female Population of Upland?
Total Female Population of Upland is 2,110.
What is the Ratio of Males per 100 Females in Upland?
There are 87.82 Males per 100 Females in Upland.
What is the Ratio of Females per 100 Males in Upland?
There are 113.87 Females per 100 Males in Upland.
What is the Median Population Age in Upland?
Median Population Age in Upland is 21.7 Years.
What is the Average Family Size in Upland
Average Family Size in Upland is 3.3 People.
What is the Average Household Size in Upland
Average Household Size in Upland is 2.8 People.
How Large is the Labor Force in Upland?
There are 1,941 People in the Labor Forcein in Upland.
What is the Percentage of People in the Labor Force in Upland?
59.4% of People are in the Labor Force in Upland.
What is the Unemployment Rate in Upland?
Unemployment Rate in Upland is 2.5%.