Zionsville, IN Map & Demographics
Zionsville Map
Zionsville Overview
$74,443
PER CAPITA INCOME
$174,048
AVG FAMILY INCOME
$152,788
AVG HOUSEHOLD INCOME
38.0%
WAGE / INCOME GAP [ % ]
62.0¢/ $1
WAGE / INCOME GAP [ $ ]
0.46
INEQUALITY / GINI INDEX
30,832
TOTAL POPULATION
15,672
MALE POPULATION
15,160
FEMALE POPULATION
103.38
MALES / 100 FEMALES
96.73
FEMALES / 100 MALES
41.8
MEDIAN AGE
3.0
AVG FAMILY SIZE
2.7
AVG HOUSEHOLD SIZE
15,797
LABOR FORCE [ PEOPLE ]
67.0%
PERCENT IN LABOR FORCE
4.0%
UNEMPLOYMENT RATE
Zionsville Zip Codes
Zionsville Area Codes
Income in Zionsville
Income Overview in Zionsville
Per Capita Income in Zionsville is $74,443, while median incomes of families and households are $174,048 and $152,788 respectively.
| Characteristic | Number | Measure |
| Per Capita Income | 30,832 | $74,443 |
| Median Family Income | 9,301 | $174,048 |
| Mean Family Income | 9,301 | $222,510 |
| Median Household Income | 11,271 | $152,788 |
| Mean Household Income | 11,271 | $204,191 |
| Income Deficit | 9,301 | $0 |
| Wage / Income Gap (%) | 30,832 | 38.01% |
| Wage / Income Gap ($) | 30,832 | 61.99¢ per $1 |
| Gini / Inequality Index | 30,832 | 0.46 |
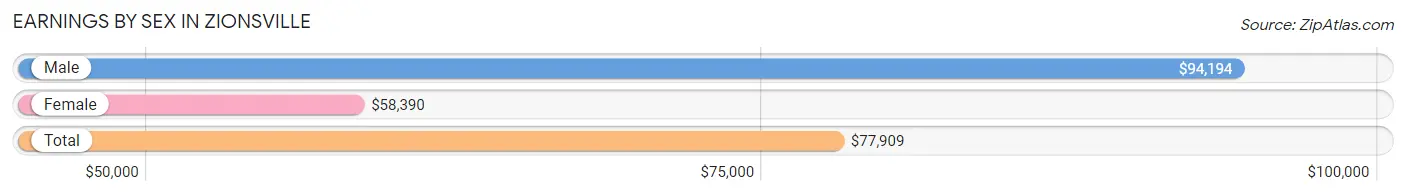
Earnings by Sex in Zionsville
Average Earnings in Zionsville are $77,909, $94,194 for men and $58,390 for women, a difference of 38.0%.
| Sex | Number | Average Earnings |
| Male | 9,173 (55.3%) | $94,194 |
| Female | 7,409 (44.7%) | $58,390 |
| Total | 16,582 (100.0%) | $77,909 |
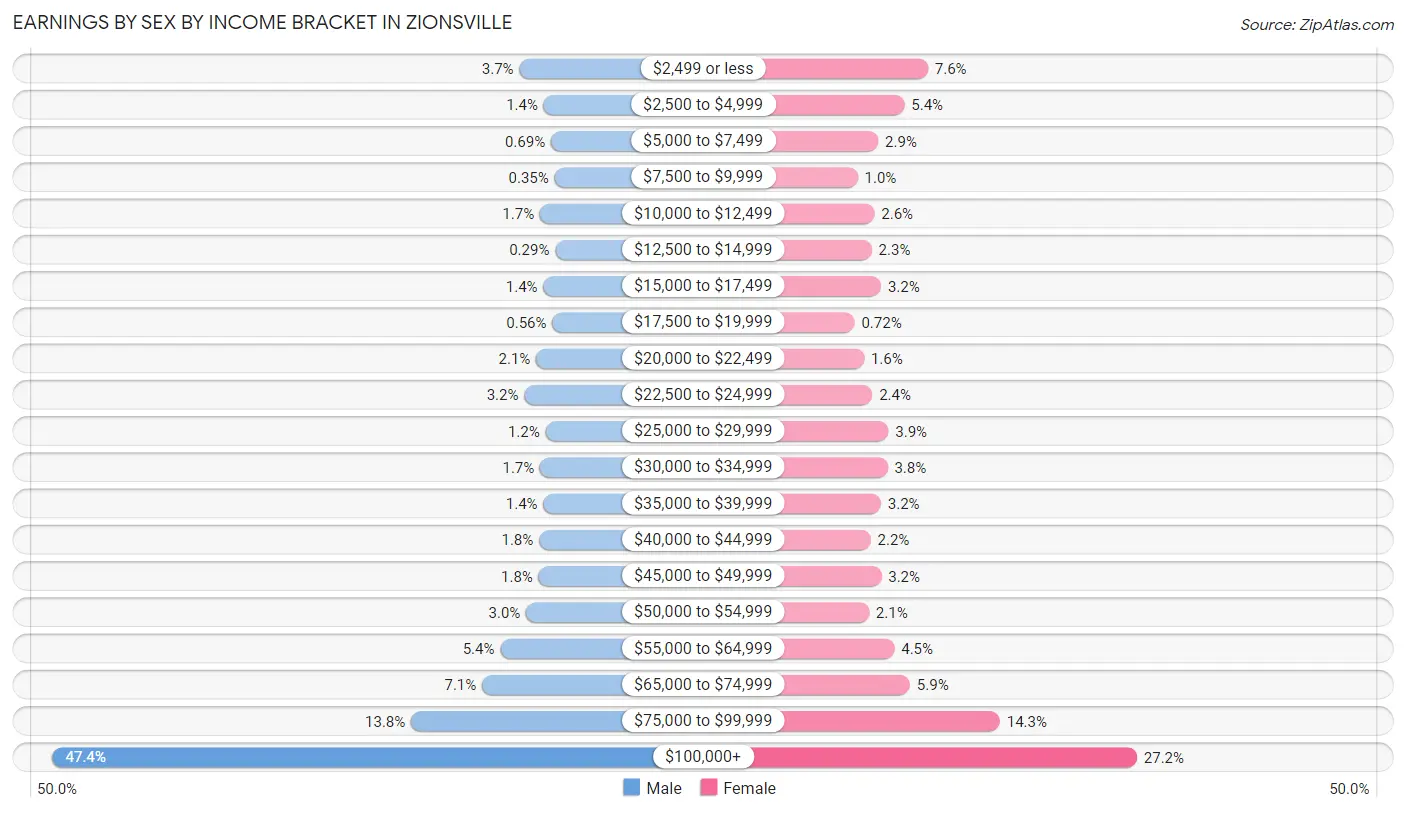
Earnings by Sex by Income Bracket in Zionsville
The most common earnings brackets in Zionsville are $100,000+ for men (4,346 | 47.4%) and $100,000+ for women (2,013 | 27.2%).
| Income | Male | Female |
| $2,499 or less | 335 (3.6%) | 562 (7.6%) |
| $2,500 to $4,999 | 125 (1.4%) | 399 (5.4%) |
| $5,000 to $7,499 | 63 (0.7%) | 218 (2.9%) |
| $7,500 to $9,999 | 32 (0.4%) | 75 (1.0%) |
| $10,000 to $12,499 | 158 (1.7%) | 191 (2.6%) |
| $12,500 to $14,999 | 27 (0.3%) | 173 (2.3%) |
| $15,000 to $17,499 | 128 (1.4%) | 237 (3.2%) |
| $17,500 to $19,999 | 51 (0.6%) | 53 (0.7%) |
| $20,000 to $22,499 | 191 (2.1%) | 119 (1.6%) |
| $22,500 to $24,999 | 293 (3.2%) | 176 (2.4%) |
| $25,000 to $29,999 | 110 (1.2%) | 288 (3.9%) |
| $30,000 to $34,999 | 157 (1.7%) | 282 (3.8%) |
| $35,000 to $39,999 | 128 (1.4%) | 236 (3.2%) |
| $40,000 to $44,999 | 165 (1.8%) | 165 (2.2%) |
| $45,000 to $49,999 | 169 (1.8%) | 239 (3.2%) |
| $50,000 to $54,999 | 276 (3.0%) | 153 (2.1%) |
| $55,000 to $64,999 | 499 (5.4%) | 330 (4.4%) |
| $65,000 to $74,999 | 655 (7.1%) | 438 (5.9%) |
| $75,000 to $99,999 | 1,265 (13.8%) | 1,062 (14.3%) |
| $100,000+ | 4,346 (47.4%) | 2,013 (27.2%) |
| Total | 9,173 (100.0%) | 7,409 (100.0%) |
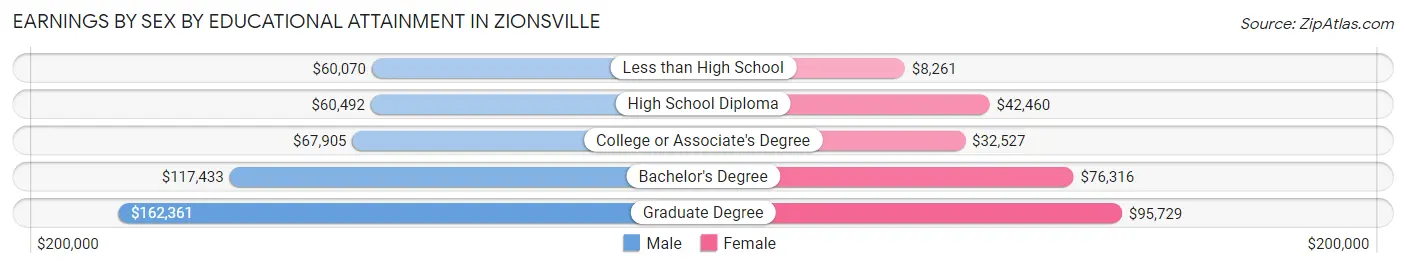
Earnings by Sex by Educational Attainment in Zionsville
Average earnings in Zionsville are $107,062 for men and $70,126 for women, a difference of 34.5%. Men with an educational attainment of graduate degree enjoy the highest average annual earnings of $162,361, while those with less than high school education earn the least with $60,070. Women with an educational attainment of graduate degree earn the most with the average annual earnings of $95,729, while those with less than high school education have the smallest earnings of $8,261.
| Educational Attainment | Male Income | Female Income |
| Less than High School | $60,070 | $8,261 |
| High School Diploma | $60,492 | $42,460 |
| College or Associate's Degree | $67,905 | $32,527 |
| Bachelor's Degree | $117,433 | $76,316 |
| Graduate Degree | $162,361 | $95,729 |
| Total | $107,062 | $70,126 |
Family Income in Zionsville
Family Income Brackets in Zionsville
According to the Zionsville family income data, there are 3,813 families falling into the $200,000+ income range, which is the most common income bracket and makes up 41.0% of all families. Conversely, the $10,000 to $14,999 income bracket is the least frequent group with only 121 families (1.3%) belonging to this category.
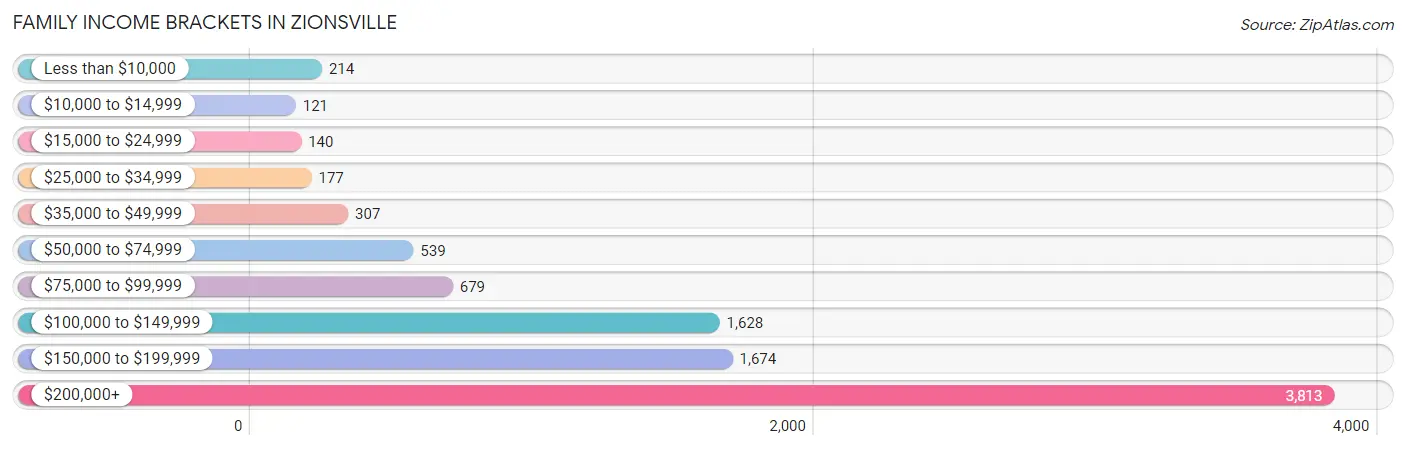
| Income Bracket | # Families | % Families |
| Less than $10,000 | 214 | 2.3% |
| $10,000 to $14,999 | 121 | 1.3% |
| $15,000 to $24,999 | 140 | 1.5% |
| $25,000 to $34,999 | 177 | 1.9% |
| $35,000 to $49,999 | 307 | 3.3% |
| $50,000 to $74,999 | 539 | 5.8% |
| $75,000 to $99,999 | 679 | 7.3% |
| $100,000 to $149,999 | 1,628 | 17.5% |
| $150,000 to $199,999 | 1,674 | 18.0% |
| $200,000+ | 3,813 | 41.0% |
Family Income by Famaliy Size in Zionsville
5-person families (1,065 | 11.5%) account for the highest median family income in Zionsville with $237,891 per family, while 2-person families (4,160 | 44.7%) have the highest median income of $64,375 per family member.
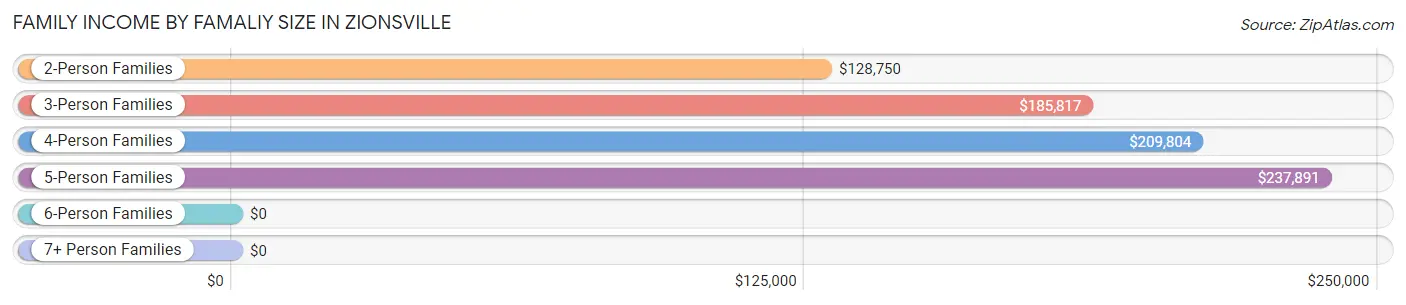
| Income Bracket | # Families | Median Income |
| 2-Person Families | 4,160 (44.7%) | $128,750 |
| 3-Person Families | 1,996 (21.5%) | $185,817 |
| 4-Person Families | 1,895 (20.4%) | $209,804 |
| 5-Person Families | 1,065 (11.5%) | $237,891 |
| 6-Person Families | 155 (1.7%) | $0 |
| 7+ Person Families | 30 (0.3%) | $0 |
| Total | 9,301 (100.0%) | $174,048 |
Family Income by Number of Earners in Zionsville
The median family income in Zionsville is $174,048, with families comprising 3+ earners (787) having the highest median family income of $241,985, while families with no earners (1,144) have the lowest median family income of $73,929, accounting for 8.5% and 12.3% of families, respectively.
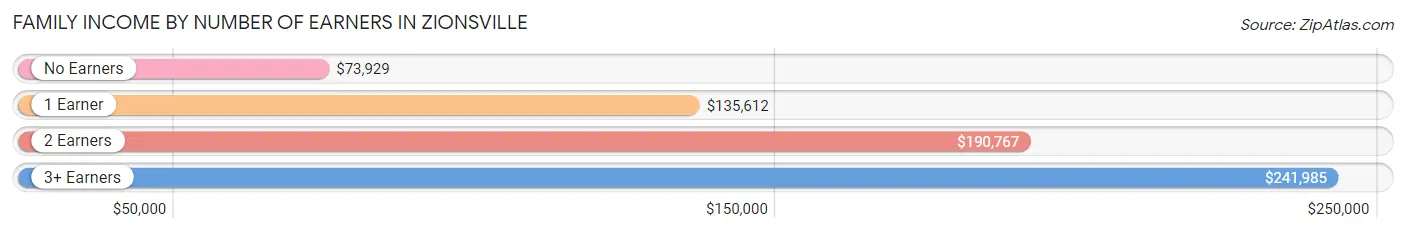
| Number of Earners | # Families | Median Income |
| No Earners | 1,144 (12.3%) | $73,929 |
| 1 Earner | 2,655 (28.5%) | $135,612 |
| 2 Earners | 4,715 (50.7%) | $190,767 |
| 3+ Earners | 787 (8.5%) | $241,985 |
| Total | 9,301 (100.0%) | $174,048 |
Household Income in Zionsville
Household Income Brackets in Zionsville
With 4,035 households falling in the category, the $200,000+ income range is the most frequent in Zionsville, accounting for 35.8% of all households. In contrast, only 147 households (1.3%) fall into the $10,000 to $14,999 income bracket, making it the least populous group.
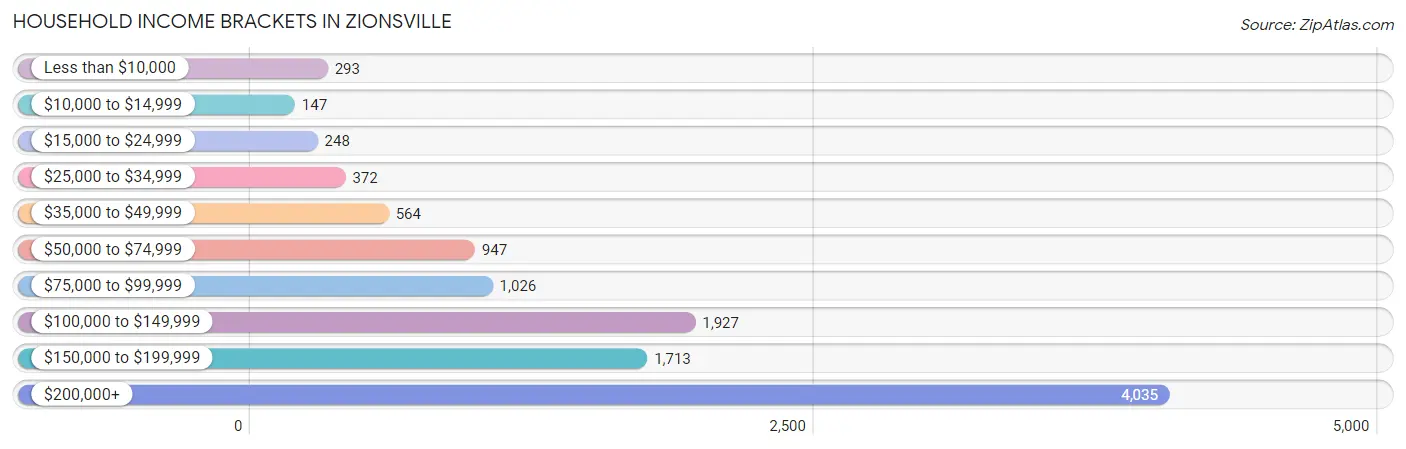
| Income Bracket | # Households | % Households |
| Less than $10,000 | 293 | 2.6% |
| $10,000 to $14,999 | 147 | 1.3% |
| $15,000 to $24,999 | 248 | 2.2% |
| $25,000 to $34,999 | 372 | 3.3% |
| $35,000 to $49,999 | 564 | 5.0% |
| $50,000 to $74,999 | 947 | 8.4% |
| $75,000 to $99,999 | 1,026 | 9.1% |
| $100,000 to $149,999 | 1,927 | 17.1% |
| $150,000 to $199,999 | 1,713 | 15.2% |
| $200,000+ | 4,035 | 35.8% |
Household Income by Householder Age in Zionsville
The median household income in Zionsville is $152,788, with the highest median household income of $184,014 found in the 45 to 64 years age bracket for the primary householder. A total of 4,923 households (43.7%) fall into this category. Meanwhile, the 15 to 24 years age bracket for the primary householder has the lowest median household income of $51,250, with 256 households (2.3%) in this group.
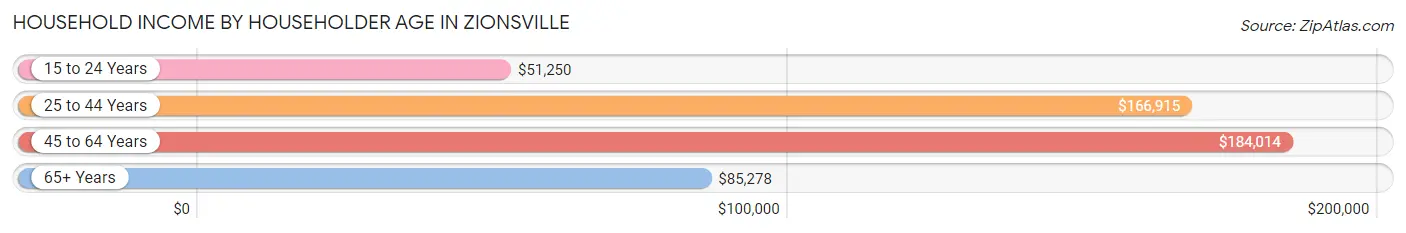
| Income Bracket | # Households | Median Income |
| 15 to 24 Years | 256 (2.3%) | $51,250 |
| 25 to 44 Years | 3,394 (30.1%) | $166,915 |
| 45 to 64 Years | 4,923 (43.7%) | $184,014 |
| 65+ Years | 2,698 (23.9%) | $85,278 |
| Total | 11,271 (100.0%) | $152,788 |
Poverty in Zionsville
Income Below Poverty by Sex and Age in Zionsville
With 4.5% poverty level for males and 3.9% for females among the residents of Zionsville, 18 to 24 year old males and 65 to 74 year old females are the most vulnerable to poverty, with 182 males (18.7%) and 140 females (10.3%) in their respective age groups living below the poverty level.
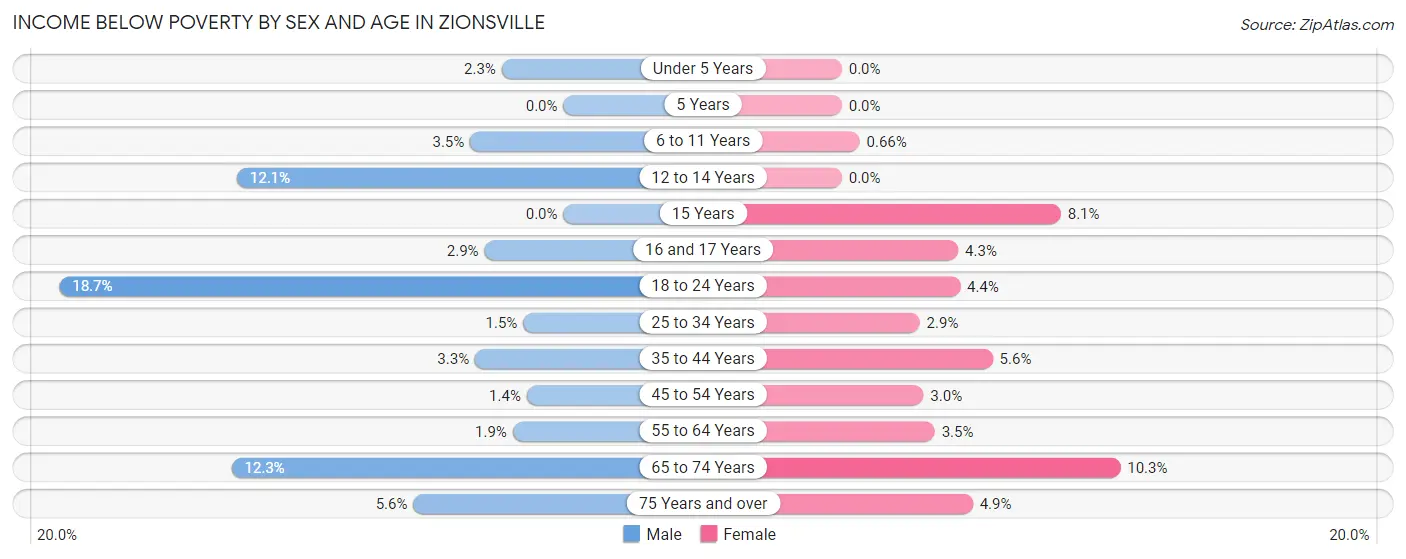
| Age Bracket | Male | Female |
| Under 5 Years | 25 (2.3%) | 0 (0.0%) |
| 5 Years | 0 (0.0%) | 0 (0.0%) |
| 6 to 11 Years | 57 (3.5%) | 9 (0.7%) |
| 12 to 14 Years | 67 (12.1%) | 0 (0.0%) |
| 15 Years | 0 (0.0%) | 23 (8.1%) |
| 16 and 17 Years | 11 (2.9%) | 22 (4.3%) |
| 18 to 24 Years | 182 (18.7%) | 31 (4.4%) |
| 25 to 34 Years | 18 (1.5%) | 36 (2.9%) |
| 35 to 44 Years | 74 (3.3%) | 129 (5.6%) |
| 45 to 54 Years | 37 (1.4%) | 77 (3.0%) |
| 55 to 64 Years | 39 (1.9%) | 71 (3.5%) |
| 65 to 74 Years | 148 (12.3%) | 140 (10.3%) |
| 75 Years and over | 45 (5.6%) | 55 (4.9%) |
| Total | 703 (4.5%) | 593 (3.9%) |
Income Above Poverty by Sex and Age in Zionsville
According to the poverty statistics in Zionsville, males aged 5 years and females aged under 5 years are the age groups that are most secure financially, with 100.0% of males and 100.0% of females in these age groups living above the poverty line.
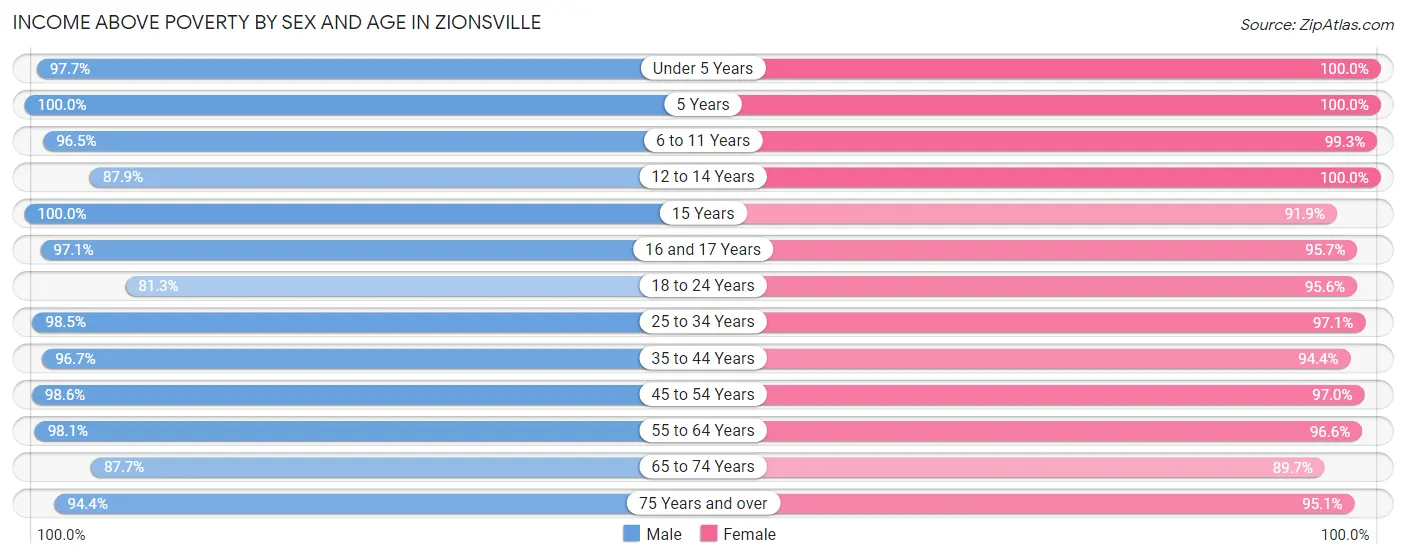
| Age Bracket | Male | Female |
| Under 5 Years | 1,065 (97.7%) | 728 (100.0%) |
| 5 Years | 350 (100.0%) | 301 (100.0%) |
| 6 to 11 Years | 1,589 (96.5%) | 1,346 (99.3%) |
| 12 to 14 Years | 486 (87.9%) | 575 (100.0%) |
| 15 Years | 298 (100.0%) | 260 (91.9%) |
| 16 and 17 Years | 364 (97.1%) | 487 (95.7%) |
| 18 to 24 Years | 791 (81.3%) | 675 (95.6%) |
| 25 to 34 Years | 1,193 (98.5%) | 1,211 (97.1%) |
| 35 to 44 Years | 2,183 (96.7%) | 2,173 (94.4%) |
| 45 to 54 Years | 2,679 (98.6%) | 2,467 (97.0%) |
| 55 to 64 Years | 2,040 (98.1%) | 1,984 (96.6%) |
| 65 to 74 Years | 1,053 (87.7%) | 1,214 (89.7%) |
| 75 Years and over | 763 (94.4%) | 1,076 (95.1%) |
| Total | 14,854 (95.5%) | 14,497 (96.1%) |
Income Below Poverty Among Married-Couple Families in Zionsville
The poverty statistics for married-couple families in Zionsville show that 2.9% or 245 of the total 8,425 families live below the poverty line. Families with no children have the highest poverty rate of 4.4%, comprising of 196 families. On the other hand, families with 5 or more children have the lowest poverty rate of 0.0%, which includes 0 families.
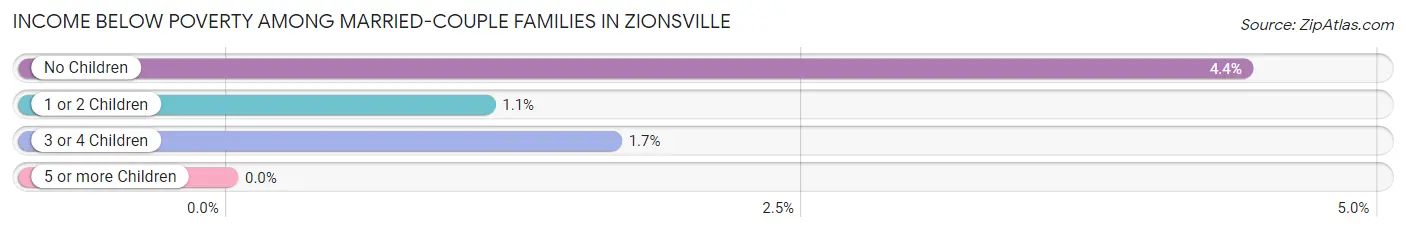
| Children | Above Poverty | Below Poverty |
| No Children | 4,239 (95.6%) | 196 (4.4%) |
| 1 or 2 Children | 3,085 (98.9%) | 35 (1.1%) |
| 3 or 4 Children | 826 (98.3%) | 14 (1.7%) |
| 5 or more Children | 30 (100.0%) | 0 (0.0%) |
| Total | 8,180 (97.1%) | 245 (2.9%) |
Income Below Poverty Among Single-Parent Households in Zionsville
According to the poverty data in Zionsville, 23.5% or 51 single-father households and 23.8% or 157 single-mother households are living below the poverty line. Among single-father households, those with no children have the highest poverty rate, with 51 households (50.0%) experiencing poverty. Likewise, among single-mother households, those with 1 or 2 children have the highest poverty rate, with 145 households (35.4%) falling below the poverty line.
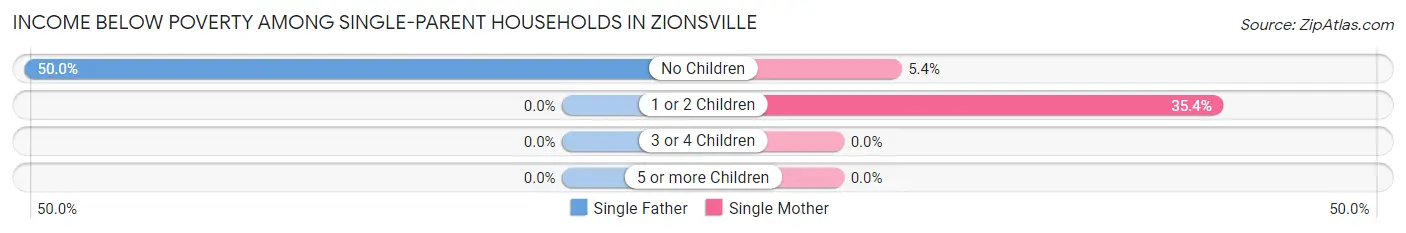
| Children | Single Father | Single Mother |
| No Children | 51 (50.0%) | 12 (5.4%) |
| 1 or 2 Children | 0 (0.0%) | 145 (35.4%) |
| 3 or 4 Children | 0 (0.0%) | 0 (0.0%) |
| 5 or more Children | 0 (0.0%) | 0 (0.0%) |
| Total | 51 (23.5%) | 157 (23.8%) |
Income Below Poverty Among Married-Couple vs Single-Parent Households in Zionsville
The poverty data for Zionsville shows that 245 of the married-couple family households (2.9%) and 208 of the single-parent households (23.7%) are living below the poverty level. Within the married-couple family households, those with no children have the highest poverty rate, with 196 households (4.4%) falling below the poverty line. Among the single-parent households, those with 1 or 2 children have the highest poverty rate, with 145 household (30.7%) living below poverty.
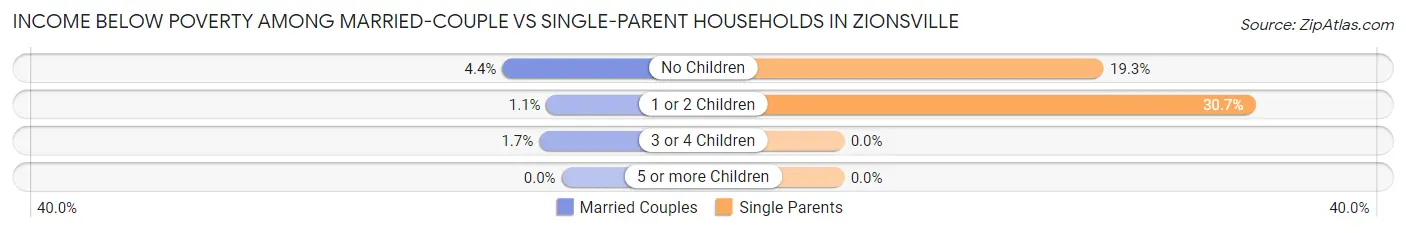
| Children | Married-Couple Families | Single-Parent Households |
| No Children | 196 (4.4%) | 63 (19.3%) |
| 1 or 2 Children | 35 (1.1%) | 145 (30.7%) |
| 3 or 4 Children | 14 (1.7%) | 0 (0.0%) |
| 5 or more Children | 0 (0.0%) | 0 (0.0%) |
| Total | 245 (2.9%) | 208 (23.7%) |
Race in Zionsville
The most populous races in Zionsville are White / Caucasian (27,310 | 88.6%), Asian (1,483 | 4.8%), and Hispanic or Latino (858 | 2.8%).
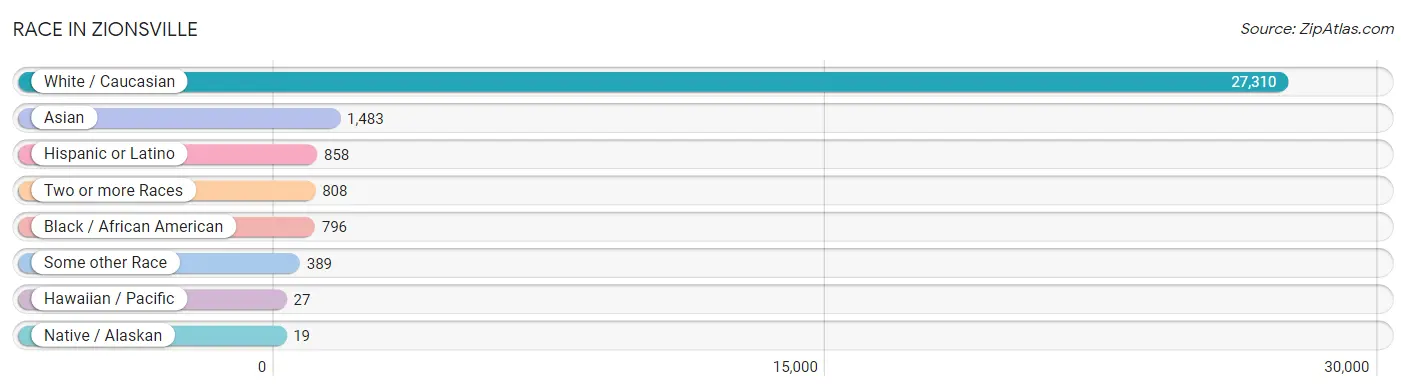
| Race | # Population | % Population |
| Asian | 1,483 | 4.8% |
| Black / African American | 796 | 2.6% |
| Hawaiian / Pacific | 27 | 0.1% |
| Hispanic or Latino | 858 | 2.8% |
| Native / Alaskan | 19 | 0.1% |
| White / Caucasian | 27,310 | 88.6% |
| Two or more Races | 808 | 2.6% |
| Some other Race | 389 | 1.3% |
| Total | 30,832 | 100.0% |
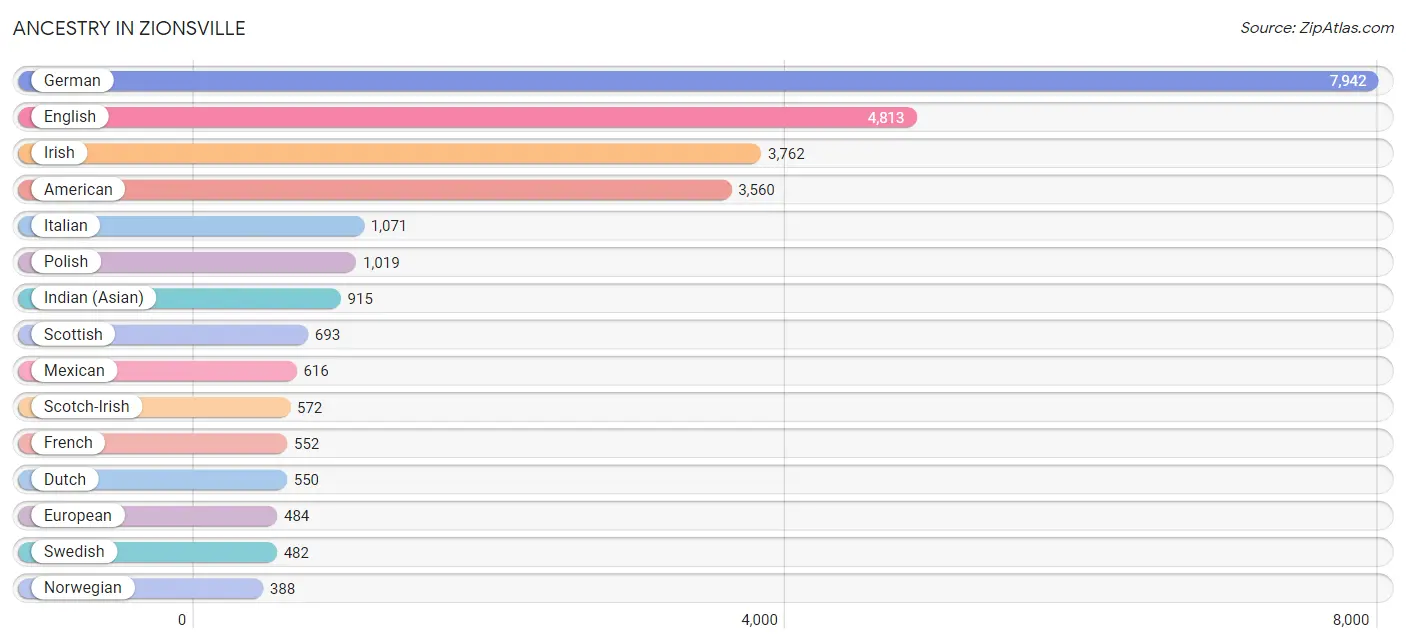
Ancestry in Zionsville
The most populous ancestries reported in Zionsville are German (7,942 | 25.8%), English (4,813 | 15.6%), Irish (3,762 | 12.2%), American (3,560 | 11.6%), and Italian (1,071 | 3.5%), together accounting for 68.6% of all Zionsville residents.
| Ancestry | # Population | % Population |
| Albanian | 69 | 0.2% |
| American | 3,560 | 11.6% |
| Arab | 61 | 0.2% |
| Argentinean | 16 | 0.1% |
| Austrian | 34 | 0.1% |
| Barbadian | 13 | 0.0% |
| Belgian | 95 | 0.3% |
| Bhutanese | 131 | 0.4% |
| Brazilian | 69 | 0.2% |
| British | 211 | 0.7% |
| Burmese | 65 | 0.2% |
| Canadian | 112 | 0.4% |
| Celtic | 40 | 0.1% |
| Central American | 132 | 0.4% |
| Costa Rican | 16 | 0.1% |
| Cuban | 27 | 0.1% |
| Czech | 162 | 0.5% |
| Czechoslovakian | 27 | 0.1% |
| Danish | 17 | 0.1% |
| Dutch | 550 | 1.8% |
| Eastern European | 38 | 0.1% |
| English | 4,813 | 15.6% |
| European | 484 | 1.6% |
| Finnish | 118 | 0.4% |
| French | 552 | 1.8% |
| French Canadian | 107 | 0.4% |
| German | 7,942 | 25.8% |
| Greek | 292 | 0.9% |
| Guatemalan | 35 | 0.1% |
| Hungarian | 109 | 0.4% |
| Icelander | 31 | 0.1% |
| Indian (Asian) | 915 | 3.0% |
| Indonesian | 42 | 0.1% |
| Iranian | 10 | 0.0% |
| Irish | 3,762 | 12.2% |
| Italian | 1,071 | 3.5% |
| Korean | 57 | 0.2% |
| Latvian | 29 | 0.1% |
| Lebanese | 61 | 0.2% |
| Lithuanian | 14 | 0.1% |
| Macedonian | 8 | 0.0% |
| Mexican | 616 | 2.0% |
| Native Hawaiian | 27 | 0.1% |
| Nicaraguan | 81 | 0.3% |
| Nigerian | 59 | 0.2% |
| Northern European | 24 | 0.1% |
| Norwegian | 388 | 1.3% |
| Polish | 1,019 | 3.3% |
| Portuguese | 43 | 0.1% |
| Puerto Rican | 9 | 0.0% |
| Romanian | 61 | 0.2% |
| Russian | 100 | 0.3% |
| Scandinavian | 225 | 0.7% |
| Scotch-Irish | 572 | 1.9% |
| Scottish | 693 | 2.2% |
| Serbian | 16 | 0.1% |
| Slavic | 141 | 0.5% |
| Slovak | 47 | 0.2% |
| Slovene | 66 | 0.2% |
| South American | 32 | 0.1% |
| Spaniard | 26 | 0.1% |
| Spanish | 10 | 0.0% |
| Sri Lankan | 61 | 0.2% |
| Subsaharan African | 89 | 0.3% |
| Swedish | 482 | 1.6% |
| Swiss | 110 | 0.4% |
| Thai | 350 | 1.1% |
| Ukrainian | 62 | 0.2% |
| Venezuelan | 16 | 0.1% |
| Welsh | 137 | 0.4% |
| Zimbabwean | 23 | 0.1% | View All 71 Rows |
Immigrants in Zionsville
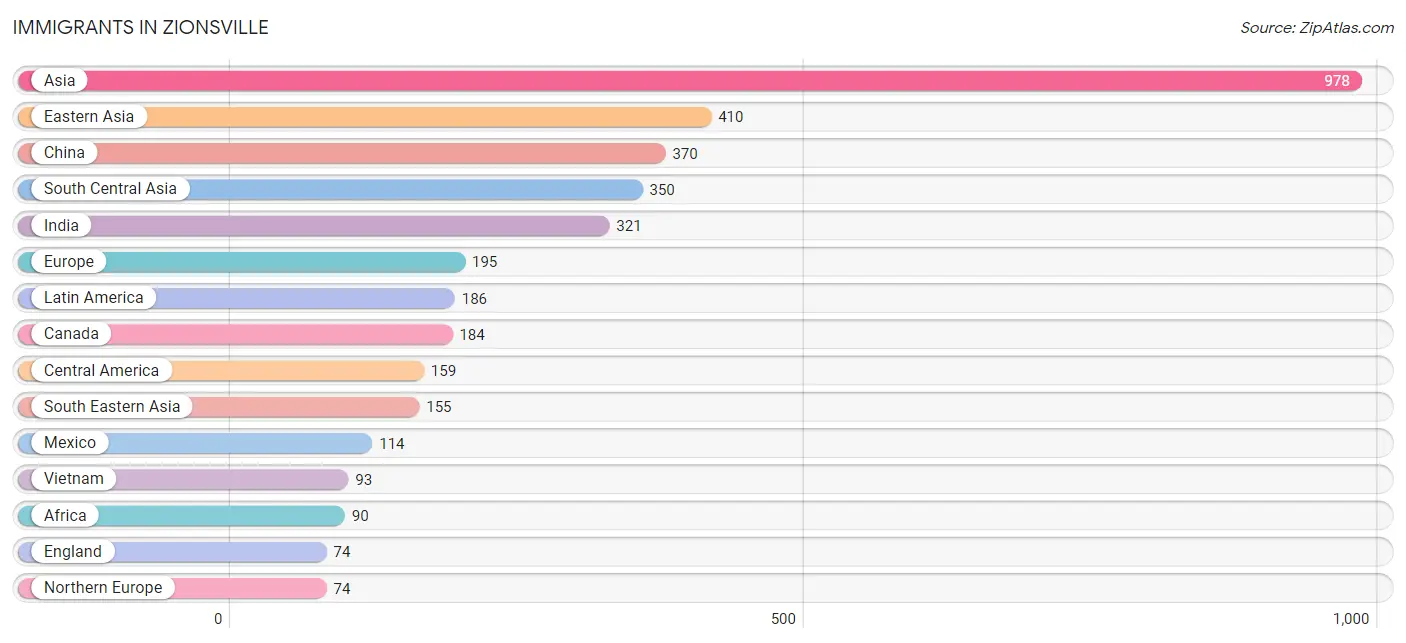
The most numerous immigrant groups reported in Zionsville came from Asia (978 | 3.2%), Eastern Asia (410 | 1.3%), China (370 | 1.2%), South Central Asia (350 | 1.1%), and India (321 | 1.0%), together accounting for 7.9% of all Zionsville residents.
| Immigration Origin | # Population | % Population |
| Africa | 90 | 0.3% |
| Argentina | 16 | 0.1% |
| Asia | 978 | 3.2% |
| Canada | 184 | 0.6% |
| Central America | 159 | 0.5% |
| China | 370 | 1.2% |
| Costa Rica | 5 | 0.0% |
| Eastern Africa | 38 | 0.1% |
| Eastern Asia | 410 | 1.3% |
| Eastern Europe | 54 | 0.2% |
| England | 74 | 0.2% |
| Europe | 195 | 0.6% |
| France | 24 | 0.1% |
| Germany | 43 | 0.1% |
| India | 321 | 1.0% |
| Indonesia | 20 | 0.1% |
| Iran | 10 | 0.0% |
| Korea | 40 | 0.1% |
| Latin America | 186 | 0.6% |
| Mexico | 114 | 0.4% |
| Nicaragua | 40 | 0.1% |
| Nigeria | 15 | 0.1% |
| Northern Europe | 74 | 0.2% |
| Oceania | 59 | 0.2% |
| Pakistan | 19 | 0.1% |
| Poland | 21 | 0.1% |
| Russia | 24 | 0.1% |
| Saudi Arabia | 63 | 0.2% |
| South Africa | 37 | 0.1% |
| South America | 27 | 0.1% |
| South Central Asia | 350 | 1.1% |
| South Eastern Asia | 155 | 0.5% |
| Ukraine | 9 | 0.0% |
| Venezuela | 11 | 0.0% |
| Vietnam | 93 | 0.3% |
| Western Africa | 15 | 0.1% |
| Western Asia | 63 | 0.2% |
| Western Europe | 67 | 0.2% |
| Zimbabwe | 38 | 0.1% | View All 39 Rows |
Sex and Age in Zionsville
Sex and Age in Zionsville
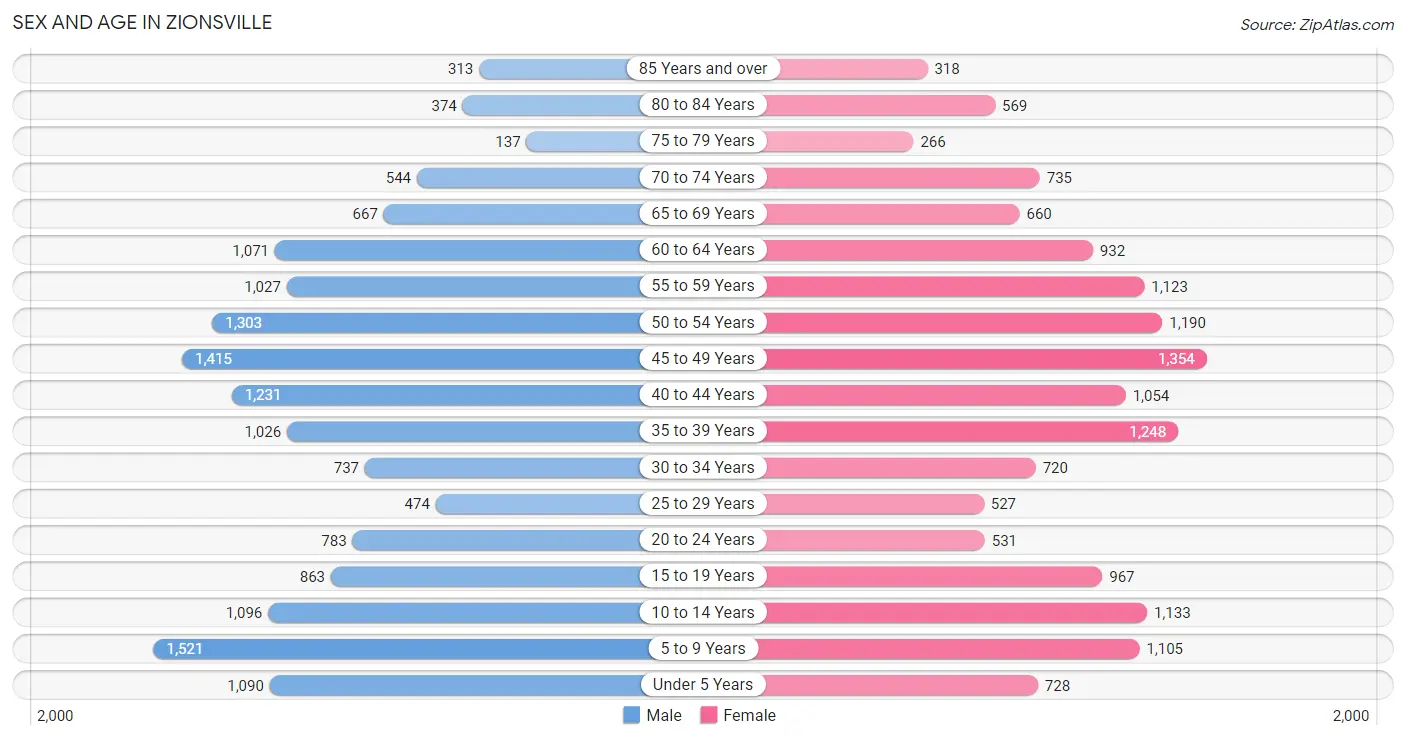
The most populous age groups in Zionsville are 5 to 9 Years (1,521 | 9.7%) for men and 45 to 49 Years (1,354 | 8.9%) for women.
| Age Bracket | Male | Female |
| Under 5 Years | 1,090 (7.0%) | 728 (4.8%) |
| 5 to 9 Years | 1,521 (9.7%) | 1,105 (7.3%) |
| 10 to 14 Years | 1,096 (7.0%) | 1,133 (7.5%) |
| 15 to 19 Years | 863 (5.5%) | 967 (6.4%) |
| 20 to 24 Years | 783 (5.0%) | 531 (3.5%) |
| 25 to 29 Years | 474 (3.0%) | 527 (3.5%) |
| 30 to 34 Years | 737 (4.7%) | 720 (4.8%) |
| 35 to 39 Years | 1,026 (6.6%) | 1,248 (8.2%) |
| 40 to 44 Years | 1,231 (7.9%) | 1,054 (7.0%) |
| 45 to 49 Years | 1,415 (9.0%) | 1,354 (8.9%) |
| 50 to 54 Years | 1,303 (8.3%) | 1,190 (7.9%) |
| 55 to 59 Years | 1,027 (6.6%) | 1,123 (7.4%) |
| 60 to 64 Years | 1,071 (6.8%) | 932 (6.1%) |
| 65 to 69 Years | 667 (4.3%) | 660 (4.3%) |
| 70 to 74 Years | 544 (3.5%) | 735 (4.9%) |
| 75 to 79 Years | 137 (0.9%) | 266 (1.8%) |
| 80 to 84 Years | 374 (2.4%) | 569 (3.7%) |
| 85 Years and over | 313 (2.0%) | 318 (2.1%) |
| Total | 15,672 (100.0%) | 15,160 (100.0%) |
Families and Households in Zionsville
Median Family Size in Zionsville
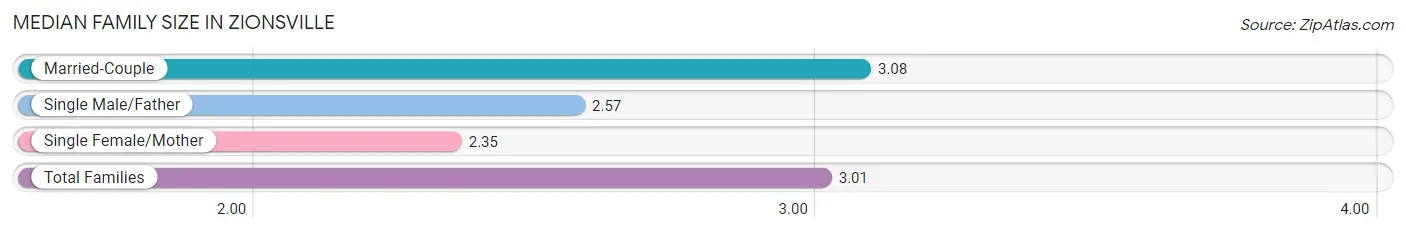
The median family size in Zionsville is 3.01 persons per family, with married-couple families (8,425 | 90.6%) accounting for the largest median family size of 3.08 persons per family. On the other hand, single female/mother families (659 | 7.1%) represent the smallest median family size with 2.35 persons per family.
| Family Type | # Families | Family Size |
| Married-Couple | 8,425 (90.6%) | 3.08 |
| Single Male/Father | 217 (2.3%) | 2.57 |
| Single Female/Mother | 659 (7.1%) | 2.35 |
| Total Families | 9,301 (100.0%) | 3.01 |
Median Household Size in Zionsville
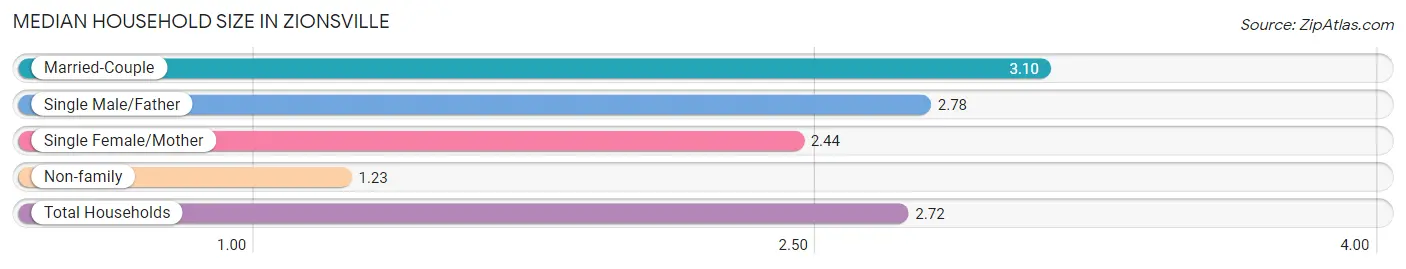
The median household size in Zionsville is 2.72 persons per household, with married-couple households (8,425 | 74.8%) accounting for the largest median household size of 3.1 persons per household. non-family households (1,970 | 17.5%) represent the smallest median household size with 1.23 persons per household.
| Household Type | # Households | Household Size |
| Married-Couple | 8,425 (74.8%) | 3.10 |
| Single Male/Father | 217 (1.9%) | 2.78 |
| Single Female/Mother | 659 (5.9%) | 2.44 |
| Non-family | 1,970 (17.5%) | 1.23 |
| Total Households | 11,271 (100.0%) | 2.72 |
Household Size by Marriage Status in Zionsville
Out of a total of 11,271 households in Zionsville, 9,301 (82.5%) are family households, while 1,970 (17.5%) are nonfamily households. The most numerous type of family households are 2-person households, comprising 4,115, and the most common type of nonfamily households are 1-person households, comprising 1,602.
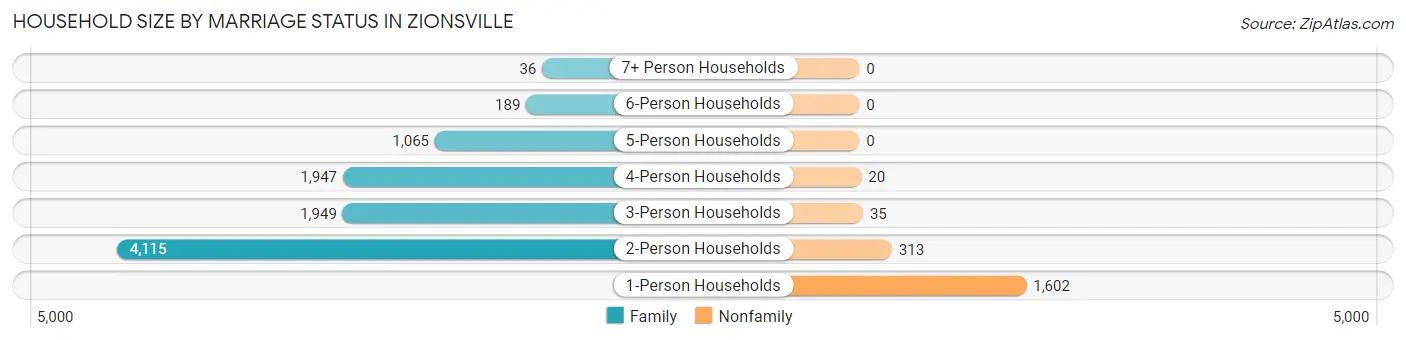
| Household Size | Family Households | Nonfamily Households |
| 1-Person Households | - | 1,602 (14.2%) |
| 2-Person Households | 4,115 (36.5%) | 313 (2.8%) |
| 3-Person Households | 1,949 (17.3%) | 35 (0.3%) |
| 4-Person Households | 1,947 (17.3%) | 20 (0.2%) |
| 5-Person Households | 1,065 (9.5%) | 0 (0.0%) |
| 6-Person Households | 189 (1.7%) | 0 (0.0%) |
| 7+ Person Households | 36 (0.3%) | 0 (0.0%) |
| Total | 9,301 (82.5%) | 1,970 (17.5%) |
Female Fertility in Zionsville
Fertility by Age in Zionsville
Average fertility rate in Zionsville is 47.0 births per 1,000 women. Women in the age bracket of 20 to 34 years have the highest fertility rate with 97.0 births per 1,000 women. Women in the age bracket of 20 to 34 years acount for 55.8% of all women with births.
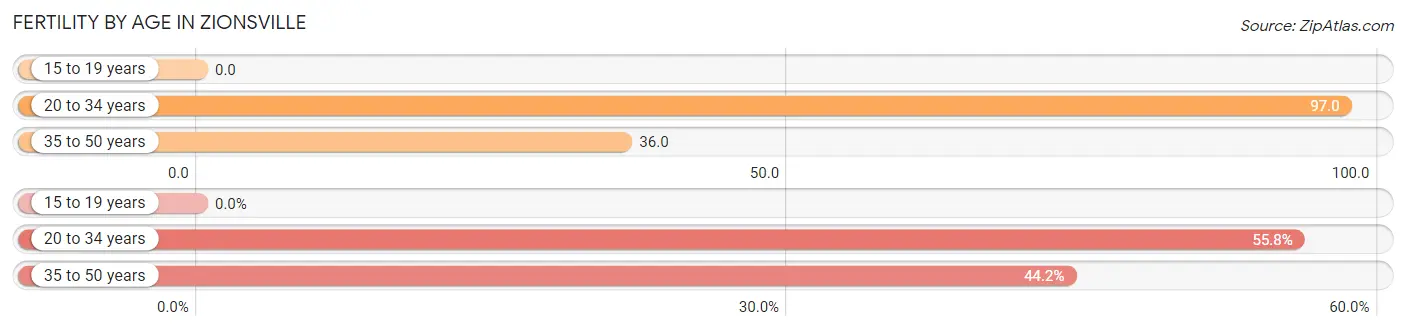
| Age Bracket | Women with Births | Births / 1,000 Women |
| 15 to 19 years | 0 (0.0%) | 0.0 |
| 20 to 34 years | 173 (55.8%) | 97.0 |
| 35 to 50 years | 137 (44.2%) | 36.0 |
| Total | 310 (100.0%) | 47.0 |
Fertility by Age by Marriage Status in Zionsville
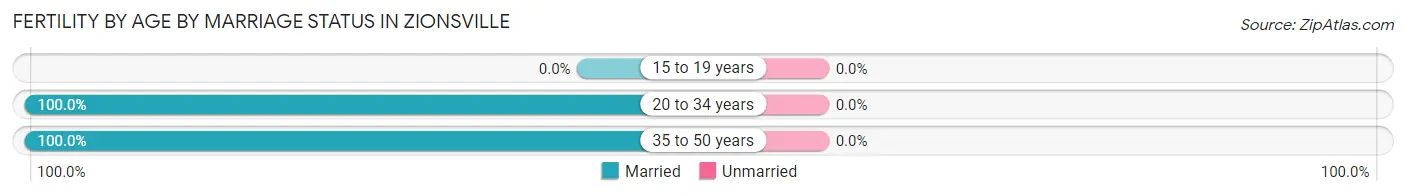
| Age Bracket | Married | Unmarried |
| 15 to 19 years | 0 (0.0%) | 0 (0.0%) |
| 20 to 34 years | 173 (100.0%) | 0 (0.0%) |
| 35 to 50 years | 137 (100.0%) | 0 (0.0%) |
| Total | 310 (100.0%) | 0 (0.0%) |
Fertility by Education in Zionsville
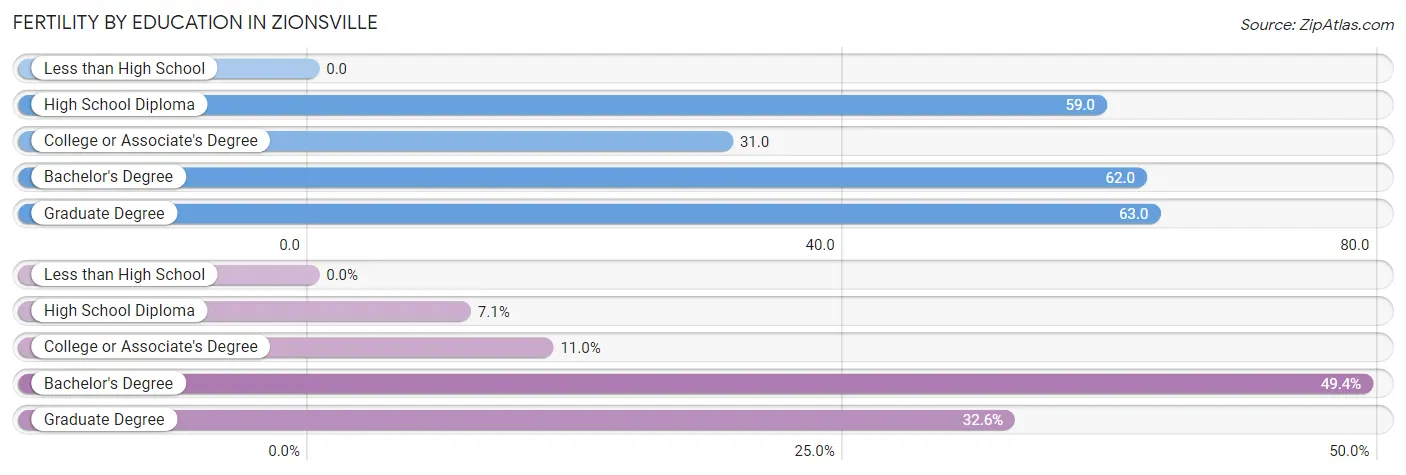
| Educational Attainment | Women with Births | Births / 1,000 Women |
| Less than High School | 0 (0.0%) | 0.0 |
| High School Diploma | 22 (7.1%) | 59.0 |
| College or Associate's Degree | 34 (11.0%) | 31.0 |
| Bachelor's Degree | 153 (49.3%) | 62.0 |
| Graduate Degree | 101 (32.6%) | 63.0 |
| Total | 310 (100.0%) | 47.0 |
Fertility by Education by Marriage Status in Zionsville
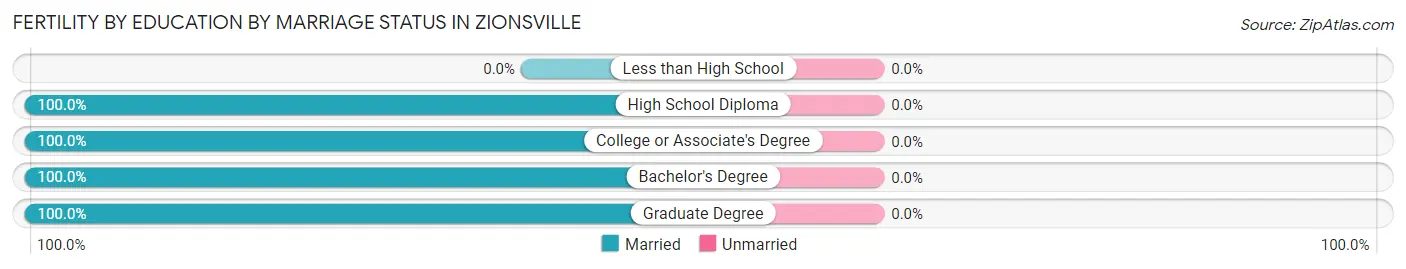
| Educational Attainment | Married | Unmarried |
| Less than High School | 0 (0.0%) | 0 (0.0%) |
| High School Diploma | 22 (100.0%) | 0 (0.0%) |
| College or Associate's Degree | 34 (100.0%) | 0 (0.0%) |
| Bachelor's Degree | 153 (100.0%) | 0 (0.0%) |
| Graduate Degree | 101 (100.0%) | 0 (0.0%) |
| Total | 310 (100.0%) | 0 (0.0%) |
Employment Characteristics in Zionsville
Employment by Class of Employer in Zionsville
Among the 15,016 employed individuals in Zionsville, private company employees (9,852 | 65.6%), not-for-profit organizations (1,945 | 13.0%), and self-employed (incorporated) (848 | 5.7%) make up the most common classes of employment.
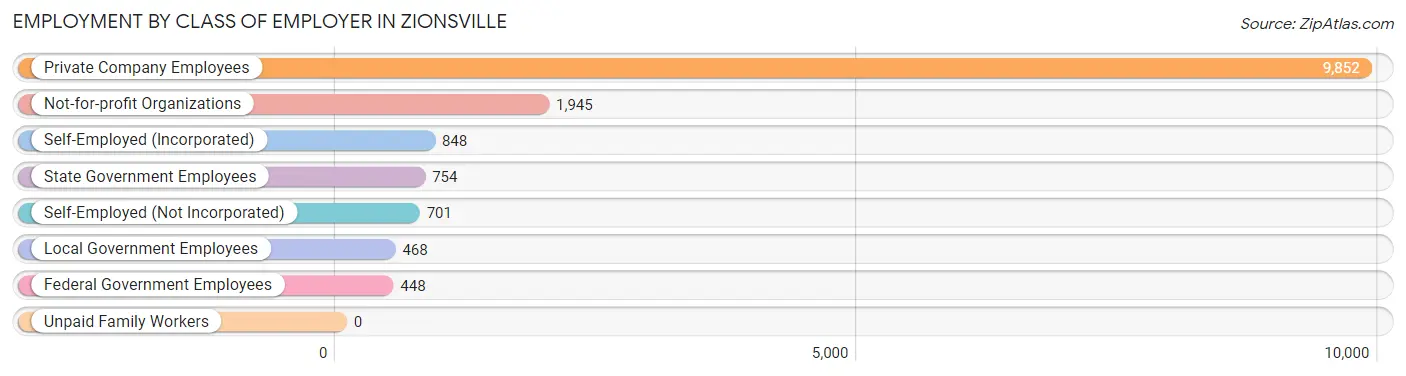
| Employer Class | # Employees | % Employees |
| Private Company Employees | 9,852 | 65.6% |
| Self-Employed (Incorporated) | 848 | 5.7% |
| Self-Employed (Not Incorporated) | 701 | 4.7% |
| Not-for-profit Organizations | 1,945 | 13.0% |
| Local Government Employees | 468 | 3.1% |
| State Government Employees | 754 | 5.0% |
| Federal Government Employees | 448 | 3.0% |
| Unpaid Family Workers | 0 | 0.0% |
| Total | 15,016 | 100.0% |
Employment Status by Age in Zionsville
According to the labor force statistics for Zionsville, out of the total population over 16 years of age (23,578), 67.0% or 15,797 individuals are in the labor force, with 4.0% or 632 of them unemployed. The age group with the highest labor force participation rate is 30 to 34 years, with 93.7% or 1,365 individuals in the labor force. Within the labor force, the 20 to 24 years age range has the highest percentage of unemployed individuals, with 11.8% or 128 of them being unemployed.
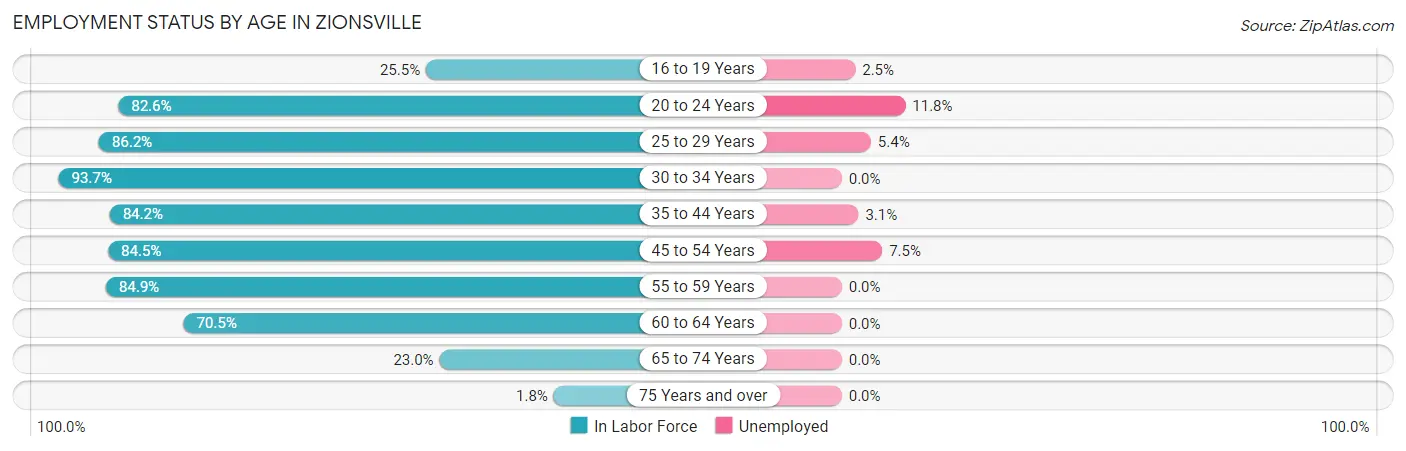
| Age Bracket | In Labor Force | Unemployed |
| 16 to 19 Years | 318 (25.5%) | 8 (2.5%) |
| 20 to 24 Years | 1,085 (82.6%) | 128 (11.8%) |
| 25 to 29 Years | 863 (86.2%) | 47 (5.4%) |
| 30 to 34 Years | 1,365 (93.7%) | 0 (0.0%) |
| 35 to 44 Years | 3,839 (84.2%) | 119 (3.1%) |
| 45 to 54 Years | 4,446 (84.5%) | 333 (7.5%) |
| 55 to 59 Years | 1,825 (84.9%) | 0 (0.0%) |
| 60 to 64 Years | 1,412 (70.5%) | 0 (0.0%) |
| 65 to 74 Years | 599 (23.0%) | 0 (0.0%) |
| 75 Years and over | 36 (1.8%) | 0 (0.0%) |
| Total | 15,797 (67.0%) | 632 (4.0%) |
Employment Status by Educational Attainment in Zionsville
According to labor force statistics for Zionsville, 83.7% of individuals (13,754) out of the total population between 25 and 64 years of age (16,432) are in the labor force, with 3.6% or 495 of them being unemployed. The group with the highest labor force participation rate are those with the educational attainment of bachelor's degree or higher, with 87.4% or 10,461 individuals in the labor force. Within the labor force, individuals with less than high school education have the highest percentage of unemployment, with 13.9% or 23 of them being unemployed.
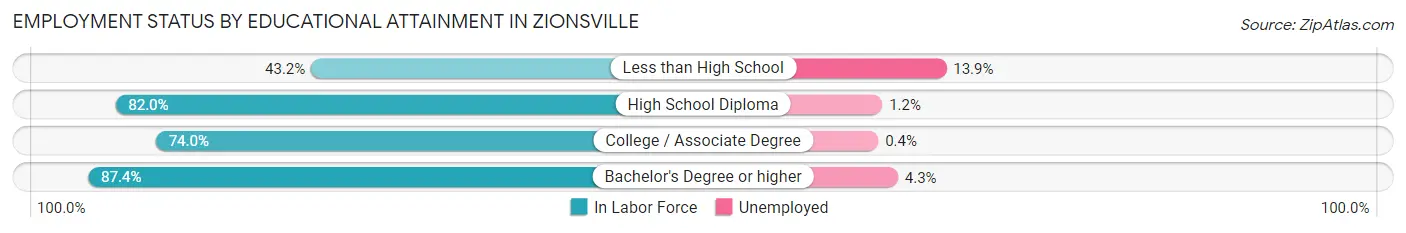
| Educational Attainment | In Labor Force | Unemployed |
| Less than High School | 166 (43.2%) | 53 (13.9%) |
| High School Diploma | 1,138 (82.0%) | 17 (1.2%) |
| College / Associate Degree | 1,991 (74.0%) | 11 (0.4%) |
| Bachelor's Degree or higher | 10,461 (87.4%) | 515 (4.3%) |
| Total | 13,754 (83.7%) | 592 (3.6%) |
Employment Occupations by Sex in Zionsville
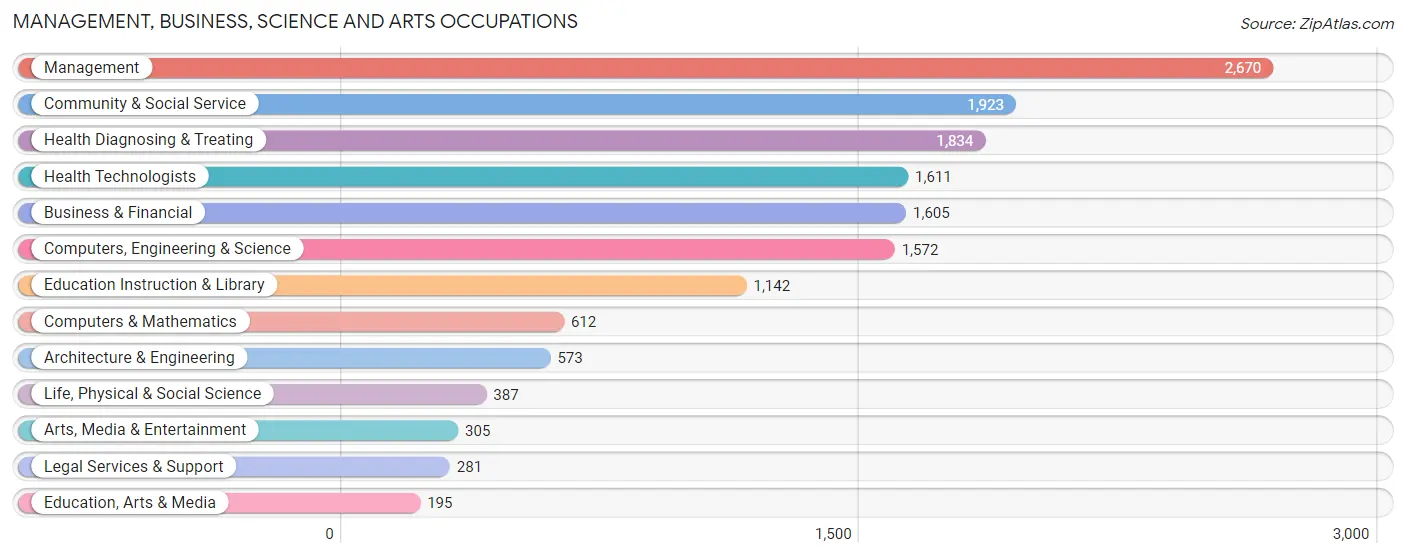
Management, Business, Science and Arts Occupations
The most common Management, Business, Science and Arts occupations in Zionsville are Management (2,670 | 17.7%), Community & Social Service (1,923 | 12.7%), Health Diagnosing & Treating (1,834 | 12.1%), Health Technologists (1,611 | 10.7%), and Business & Financial (1,605 | 10.6%).
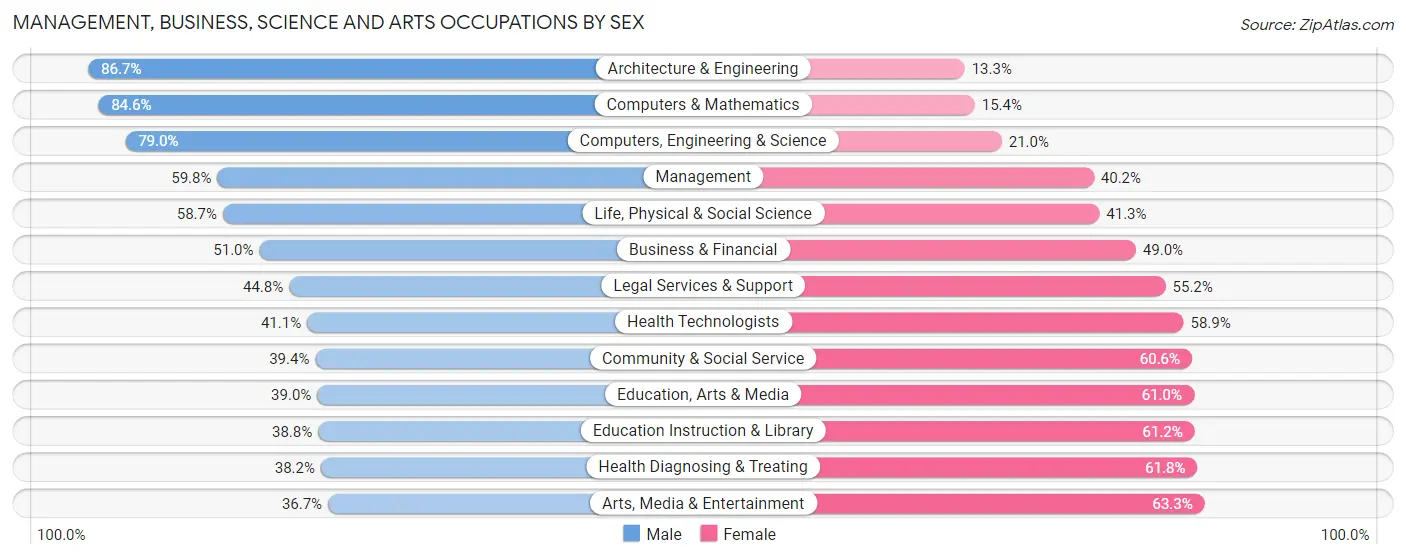
Management, Business, Science and Arts Occupations by Sex
Within the Management, Business, Science and Arts occupations in Zionsville, the most male-oriented occupations are Architecture & Engineering (86.7%), Computers & Mathematics (84.6%), and Computers, Engineering & Science (79.0%), while the most female-oriented occupations are Arts, Media & Entertainment (63.3%), Health Diagnosing & Treating (61.8%), and Education Instruction & Library (61.2%).
| Occupation | Male | Female |
| Management | 1,597 (59.8%) | 1,073 (40.2%) |
| Business & Financial | 819 (51.0%) | 786 (49.0%) |
| Computers, Engineering & Science | 1,242 (79.0%) | 330 (21.0%) |
| Computers & Mathematics | 518 (84.6%) | 94 (15.4%) |
| Architecture & Engineering | 497 (86.7%) | 76 (13.3%) |
| Life, Physical & Social Science | 227 (58.7%) | 160 (41.3%) |
| Community & Social Service | 757 (39.4%) | 1,166 (60.6%) |
| Education, Arts & Media | 76 (39.0%) | 119 (61.0%) |
| Legal Services & Support | 126 (44.8%) | 155 (55.2%) |
| Education Instruction & Library | 443 (38.8%) | 699 (61.2%) |
| Arts, Media & Entertainment | 112 (36.7%) | 193 (63.3%) |
| Health Diagnosing & Treating | 701 (38.2%) | 1,133 (61.8%) |
| Health Technologists | 662 (41.1%) | 949 (58.9%) |
| Total (Category) | 5,116 (53.3%) | 4,488 (46.7%) |
| Total (Overall) | 8,444 (55.9%) | 6,647 (44.1%) |
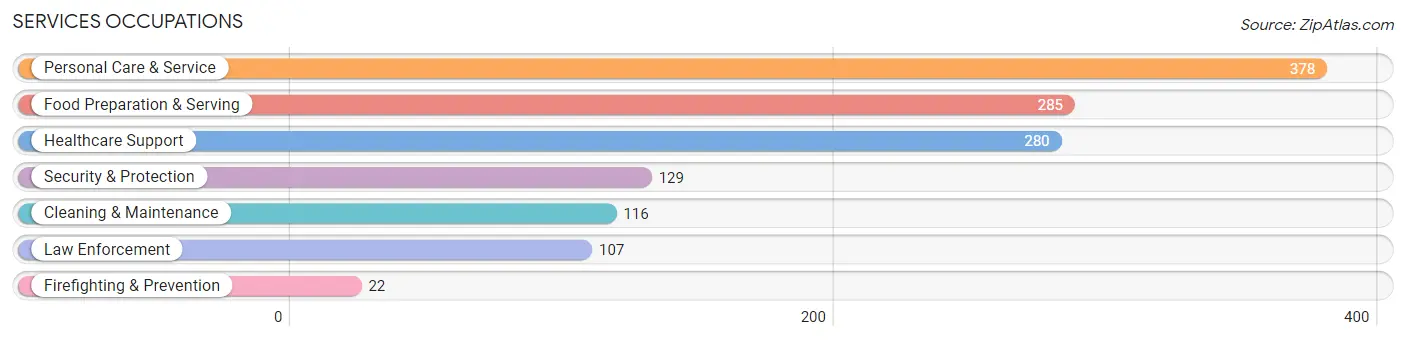
Services Occupations
The most common Services occupations in Zionsville are Personal Care & Service (378 | 2.5%), Food Preparation & Serving (285 | 1.9%), Healthcare Support (280 | 1.9%), Security & Protection (129 | 0.9%), and Cleaning & Maintenance (116 | 0.8%).
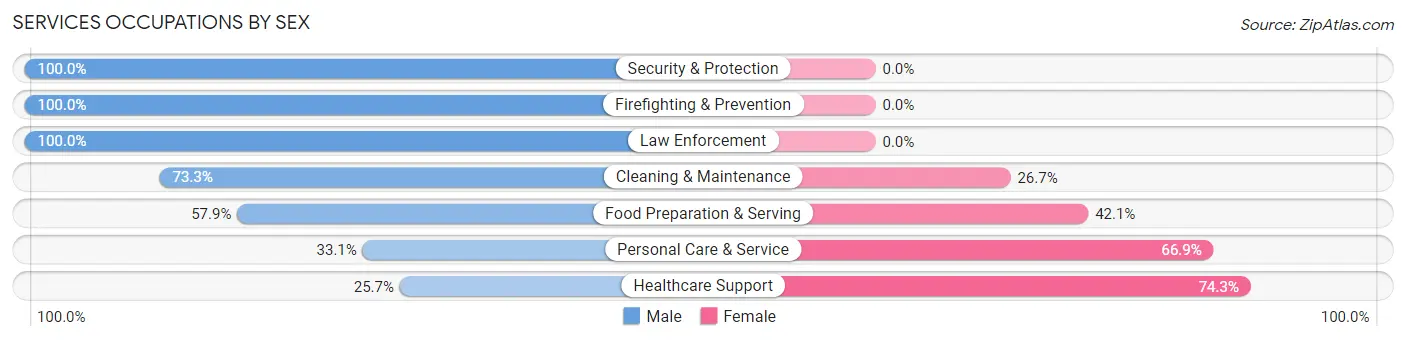
Services Occupations by Sex
Within the Services occupations in Zionsville, the most male-oriented occupations are Security & Protection (100.0%), Firefighting & Prevention (100.0%), and Law Enforcement (100.0%), while the most female-oriented occupations are Healthcare Support (74.3%), Personal Care & Service (66.9%), and Food Preparation & Serving (42.1%).
| Occupation | Male | Female |
| Healthcare Support | 72 (25.7%) | 208 (74.3%) |
| Security & Protection | 129 (100.0%) | 0 (0.0%) |
| Firefighting & Prevention | 22 (100.0%) | 0 (0.0%) |
| Law Enforcement | 107 (100.0%) | 0 (0.0%) |
| Food Preparation & Serving | 165 (57.9%) | 120 (42.1%) |
| Cleaning & Maintenance | 85 (73.3%) | 31 (26.7%) |
| Personal Care & Service | 125 (33.1%) | 253 (66.9%) |
| Total (Category) | 576 (48.5%) | 612 (51.5%) |
| Total (Overall) | 8,444 (55.9%) | 6,647 (44.1%) |
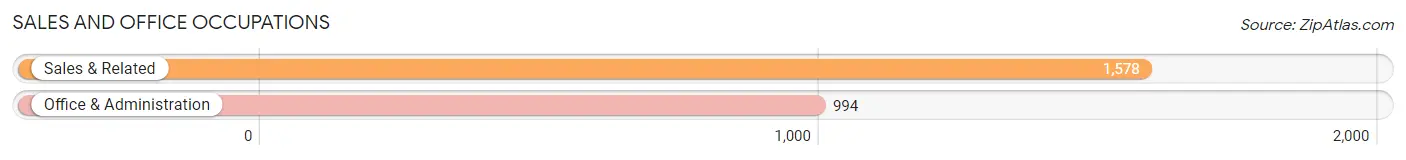
Sales and Office Occupations
The most common Sales and Office occupations in Zionsville are Sales & Related (1,578 | 10.5%), and Office & Administration (994 | 6.6%).
Sales and Office Occupations by Sex
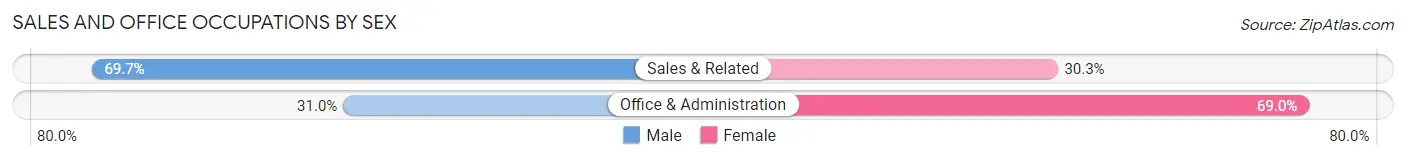
| Occupation | Male | Female |
| Sales & Related | 1,100 (69.7%) | 478 (30.3%) |
| Office & Administration | 308 (31.0%) | 686 (69.0%) |
| Total (Category) | 1,408 (54.7%) | 1,164 (45.3%) |
| Total (Overall) | 8,444 (55.9%) | 6,647 (44.1%) |
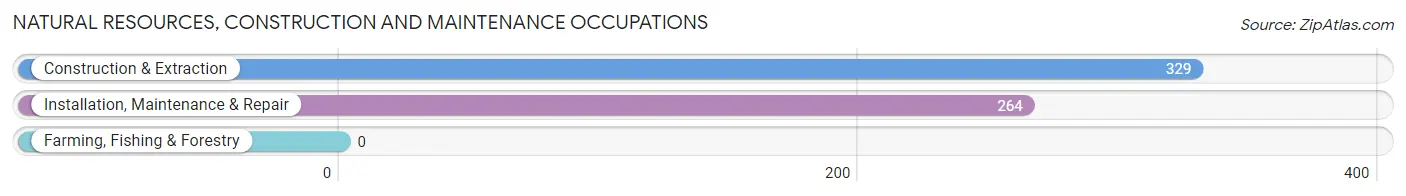
Natural Resources, Construction and Maintenance Occupations
The most common Natural Resources, Construction and Maintenance occupations in Zionsville are Construction & Extraction (329 | 2.2%), and Installation, Maintenance & Repair (264 | 1.8%).
Natural Resources, Construction and Maintenance Occupations by Sex
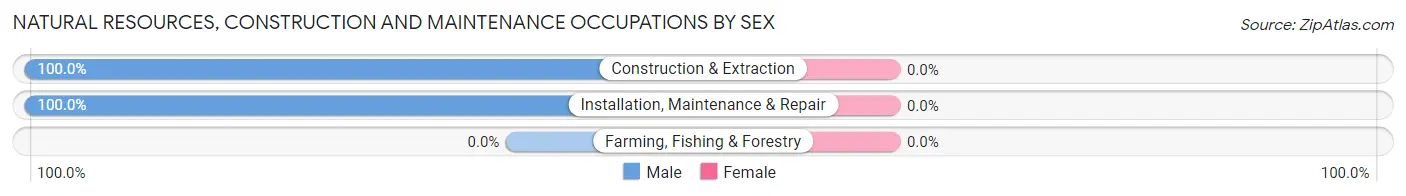
| Occupation | Male | Female |
| Farming, Fishing & Forestry | 0 (0.0%) | 0 (0.0%) |
| Construction & Extraction | 329 (100.0%) | 0 (0.0%) |
| Installation, Maintenance & Repair | 264 (100.0%) | 0 (0.0%) |
| Total (Category) | 593 (100.0%) | 0 (0.0%) |
| Total (Overall) | 8,444 (55.9%) | 6,647 (44.1%) |
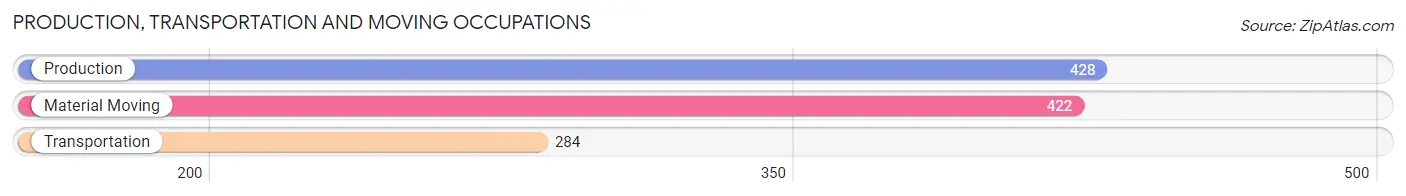
Production, Transportation and Moving Occupations
The most common Production, Transportation and Moving occupations in Zionsville are Production (428 | 2.8%), Material Moving (422 | 2.8%), and Transportation (284 | 1.9%).
Production, Transportation and Moving Occupations by Sex
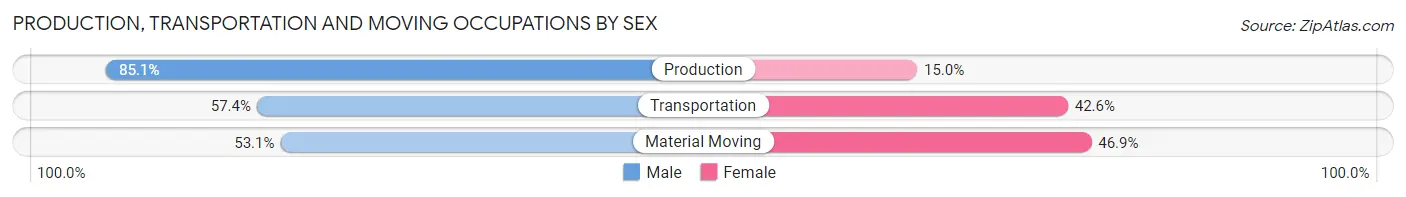
| Occupation | Male | Female |
| Production | 364 (85.1%) | 64 (14.9%) |
| Transportation | 163 (57.4%) | 121 (42.6%) |
| Material Moving | 224 (53.1%) | 198 (46.9%) |
| Total (Category) | 751 (66.2%) | 383 (33.8%) |
| Total (Overall) | 8,444 (55.9%) | 6,647 (44.1%) |
Employment Industries by Sex in Zionsville
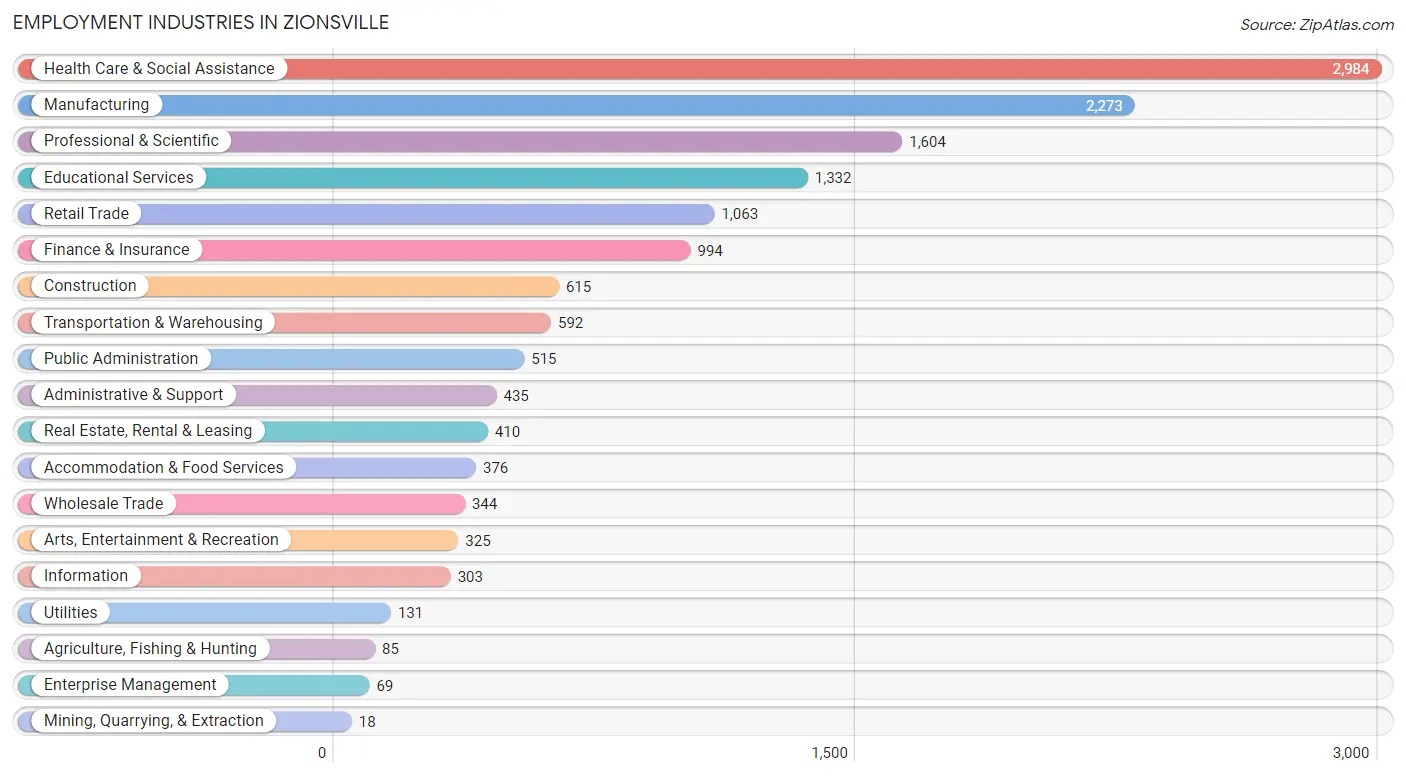
Employment Industries in Zionsville
The major employment industries in Zionsville include Health Care & Social Assistance (2,984 | 19.8%), Manufacturing (2,273 | 15.1%), Professional & Scientific (1,604 | 10.6%), Educational Services (1,332 | 8.8%), and Retail Trade (1,063 | 7.0%).
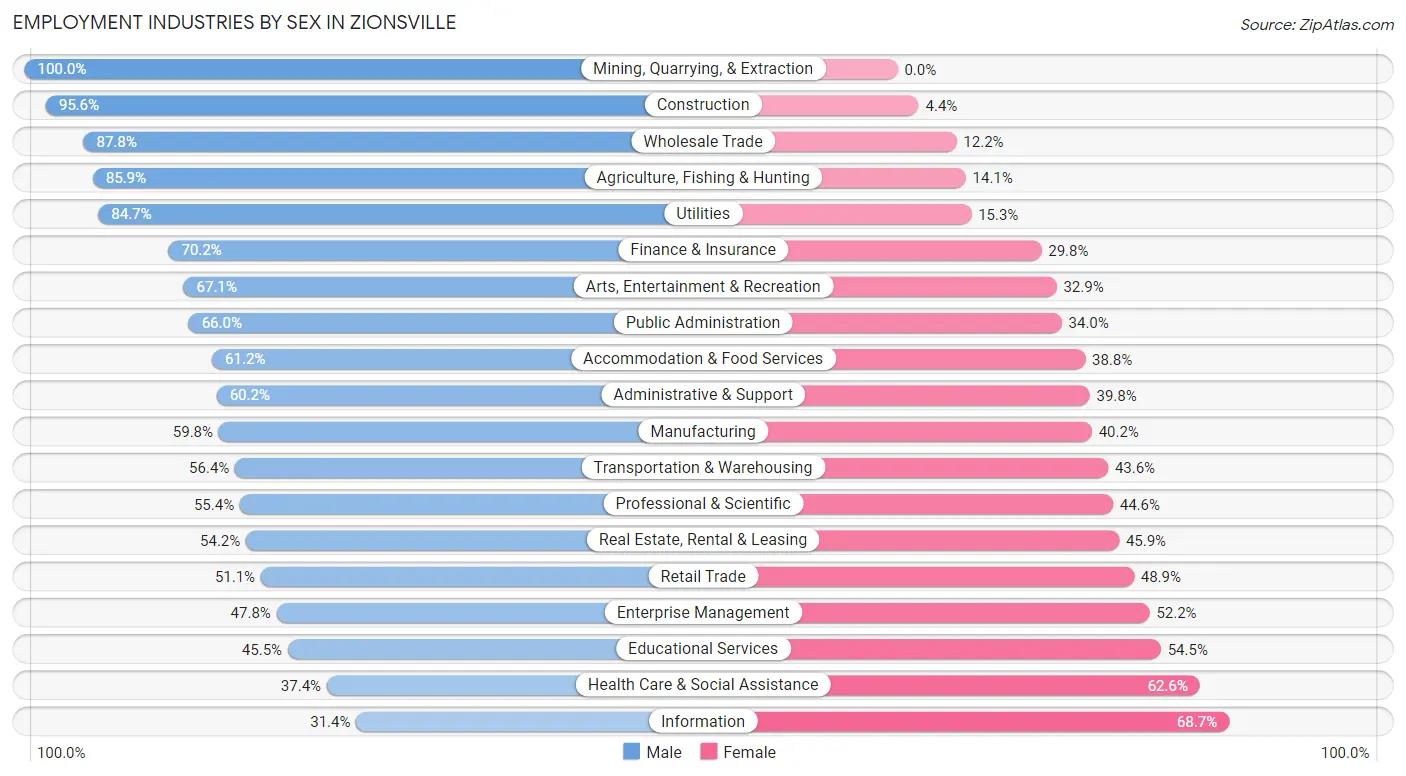
Employment Industries by Sex in Zionsville
The Zionsville industries that see more men than women are Mining, Quarrying, & Extraction (100.0%), Construction (95.6%), and Wholesale Trade (87.8%), whereas the industries that tend to have a higher number of women are Information (68.6%), Health Care & Social Assistance (62.6%), and Educational Services (54.5%).
| Industry | Male | Female |
| Agriculture, Fishing & Hunting | 73 (85.9%) | 12 (14.1%) |
| Mining, Quarrying, & Extraction | 18 (100.0%) | 0 (0.0%) |
| Construction | 588 (95.6%) | 27 (4.4%) |
| Manufacturing | 1,359 (59.8%) | 914 (40.2%) |
| Wholesale Trade | 302 (87.8%) | 42 (12.2%) |
| Retail Trade | 543 (51.1%) | 520 (48.9%) |
| Transportation & Warehousing | 334 (56.4%) | 258 (43.6%) |
| Utilities | 111 (84.7%) | 20 (15.3%) |
| Information | 95 (31.4%) | 208 (68.6%) |
| Finance & Insurance | 698 (70.2%) | 296 (29.8%) |
| Real Estate, Rental & Leasing | 222 (54.1%) | 188 (45.9%) |
| Professional & Scientific | 889 (55.4%) | 715 (44.6%) |
| Enterprise Management | 33 (47.8%) | 36 (52.2%) |
| Administrative & Support | 262 (60.2%) | 173 (39.8%) |
| Educational Services | 606 (45.5%) | 726 (54.5%) |
| Health Care & Social Assistance | 1,117 (37.4%) | 1,867 (62.6%) |
| Arts, Entertainment & Recreation | 218 (67.1%) | 107 (32.9%) |
| Accommodation & Food Services | 230 (61.2%) | 146 (38.8%) |
| Public Administration | 340 (66.0%) | 175 (34.0%) |
| Total | 8,444 (55.9%) | 6,647 (44.1%) |
Education in Zionsville
School Enrollment in Zionsville
The most common levels of schooling among the 7,883 students in Zionsville are elementary school (1,801 | 22.9%), high school (1,781 | 22.6%), and middle school (1,774 | 22.5%).
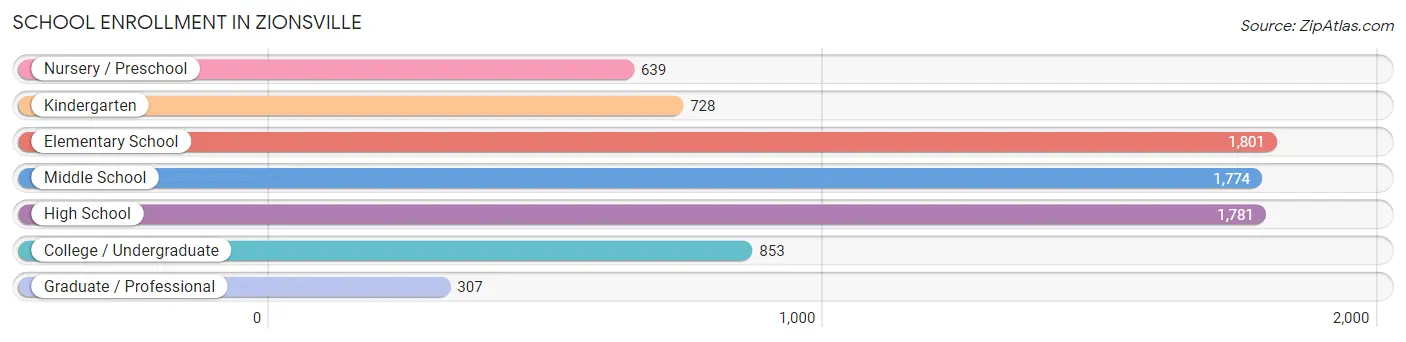
| School Level | # Students | % Students |
| Nursery / Preschool | 639 | 8.1% |
| Kindergarten | 728 | 9.2% |
| Elementary School | 1,801 | 22.9% |
| Middle School | 1,774 | 22.5% |
| High School | 1,781 | 22.6% |
| College / Undergraduate | 853 | 10.8% |
| Graduate / Professional | 307 | 3.9% |
| Total | 7,883 | 100.0% |
School Enrollment by Age by Funding Source in Zionsville
Out of a total of 7,883 students who are enrolled in schools in Zionsville, 1,009 (12.8%) attend a private institution, while the remaining 6,874 (87.2%) are enrolled in public schools. The age group of 18 to 19 year olds has the highest likelihood of being enrolled in private schools, with 139 (38.1% in the age bracket) enrolled. Conversely, the age group of 10 to 14 year olds has the lowest likelihood of being enrolled in a private school, with 2,061 (93.8% in the age bracket) attending a public institution.
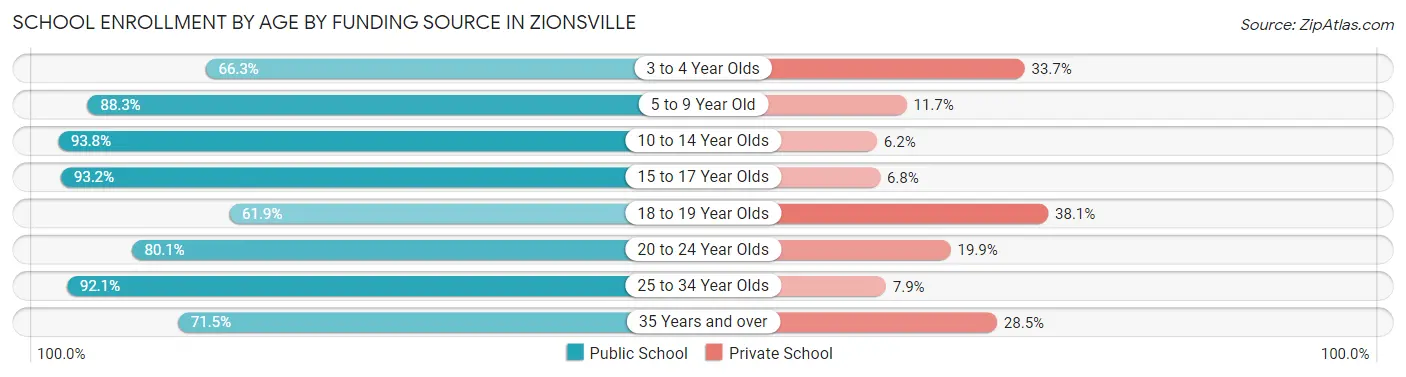
| Age Bracket | Public School | Private School |
| 3 to 4 Year Olds | 246 (66.3%) | 125 (33.7%) |
| 5 to 9 Year Old | 2,210 (88.3%) | 293 (11.7%) |
| 10 to 14 Year Olds | 2,061 (93.8%) | 136 (6.2%) |
| 15 to 17 Year Olds | 1,366 (93.2%) | 99 (6.8%) |
| 18 to 19 Year Olds | 226 (61.9%) | 139 (38.1%) |
| 20 to 24 Year Olds | 346 (80.1%) | 86 (19.9%) |
| 25 to 34 Year Olds | 129 (92.1%) | 11 (7.9%) |
| 35 Years and over | 293 (71.5%) | 117 (28.5%) |
| Total | 6,874 (87.2%) | 1,009 (12.8%) |
Educational Attainment by Field of Study in Zionsville
Business (3,660 | 23.7%), science & technology (2,505 | 16.2%), bio, nature & agricultural (1,649 | 10.7%), education (1,528 | 9.9%), and engineering (1,425 | 9.2%) are the most common fields of study among 15,460 individuals in Zionsville who have obtained a bachelor's degree or higher.
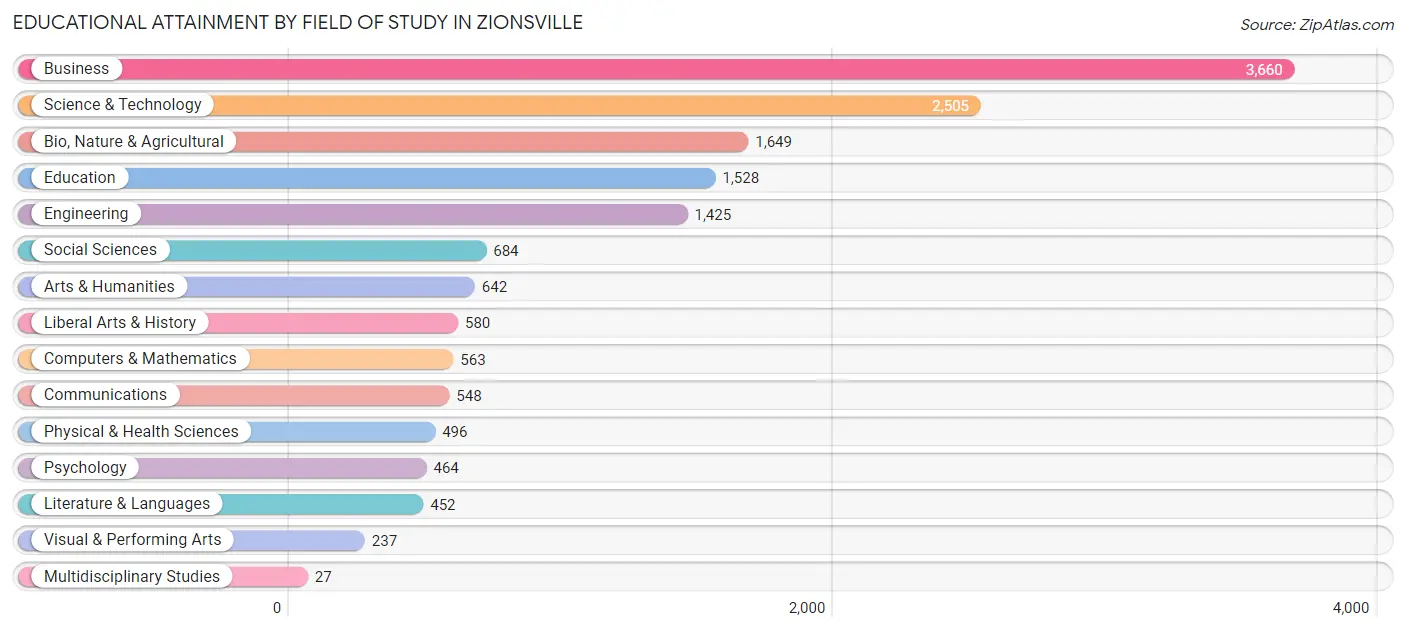
| Field of Study | # Graduates | % Graduates |
| Computers & Mathematics | 563 | 3.6% |
| Bio, Nature & Agricultural | 1,649 | 10.7% |
| Physical & Health Sciences | 496 | 3.2% |
| Psychology | 464 | 3.0% |
| Social Sciences | 684 | 4.4% |
| Engineering | 1,425 | 9.2% |
| Multidisciplinary Studies | 27 | 0.2% |
| Science & Technology | 2,505 | 16.2% |
| Business | 3,660 | 23.7% |
| Education | 1,528 | 9.9% |
| Literature & Languages | 452 | 2.9% |
| Liberal Arts & History | 580 | 3.7% |
| Visual & Performing Arts | 237 | 1.5% |
| Communications | 548 | 3.5% |
| Arts & Humanities | 642 | 4.2% |
| Total | 15,460 | 100.0% |
Transportation & Commute in Zionsville
Vehicle Availability by Sex in Zionsville
The most prevalent vehicle ownership categories in Zionsville are males with 2 vehicles (4,174, accounting for 49.3%) and females with 2 vehicles (3,091, making up 63.8%).
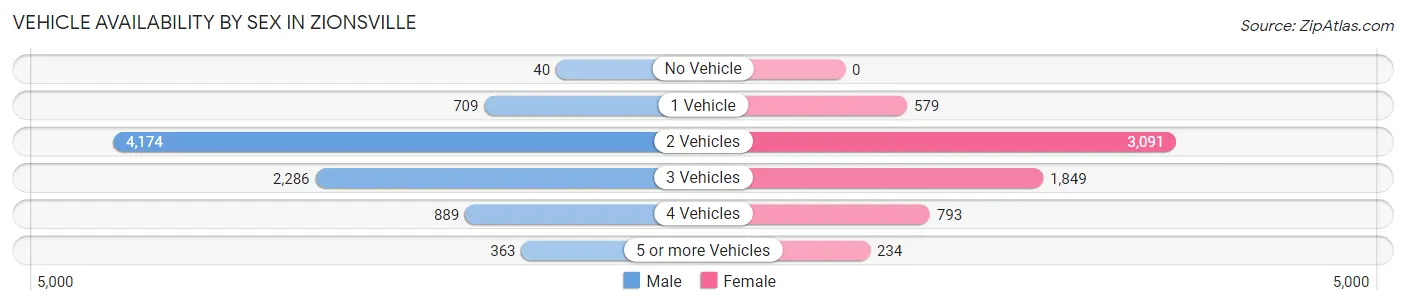
| Vehicles Available | Male | Female |
| No Vehicle | 40 (0.5%) | 0 (0.0%) |
| 1 Vehicle | 709 (8.4%) | 579 (8.8%) |
| 2 Vehicles | 4,174 (49.3%) | 3,091 (47.2%) |
| 3 Vehicles | 2,286 (27.0%) | 1,849 (28.2%) |
| 4 Vehicles | 889 (10.5%) | 793 (12.1%) |
| 5 or more Vehicles | 363 (4.3%) | 234 (3.6%) |
| Total | 8,461 (100.0%) | 6,546 (100.0%) |
Commute Time in Zionsville
The most frequently occuring commute durations in Zionsville are 30 to 34 minutes (2,018 commuters, 17.7%), 20 to 24 minutes (1,809 commuters, 15.8%), and 15 to 19 minutes (1,520 commuters, 13.3%).
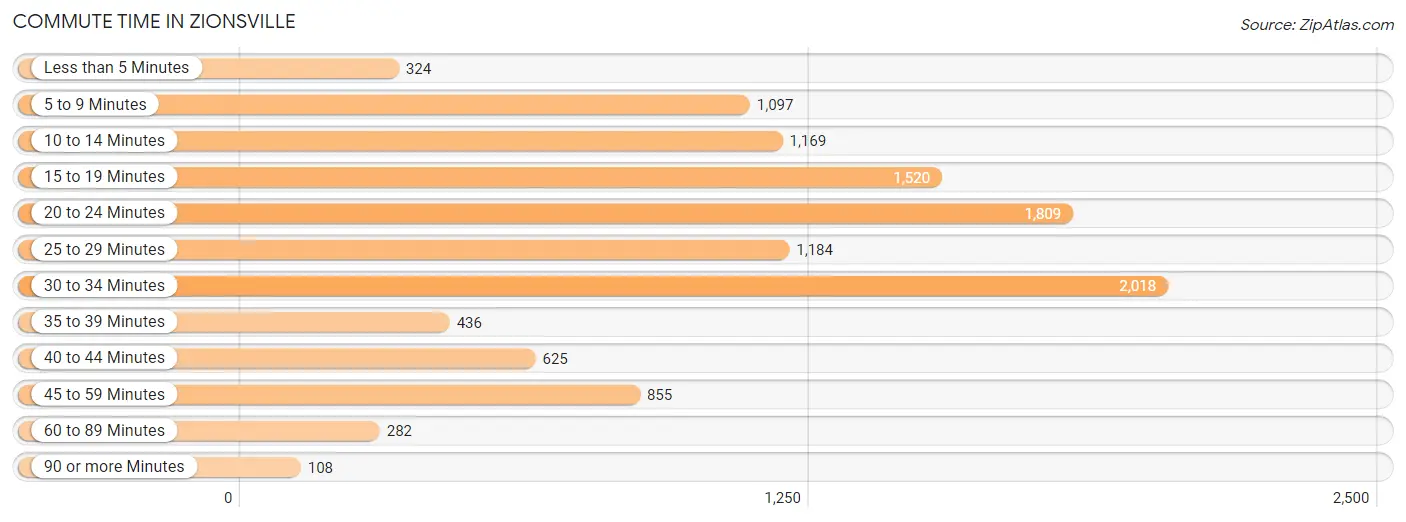
| Commute Time | # Commuters | % Commuters |
| Less than 5 Minutes | 324 | 2.8% |
| 5 to 9 Minutes | 1,097 | 9.6% |
| 10 to 14 Minutes | 1,169 | 10.2% |
| 15 to 19 Minutes | 1,520 | 13.3% |
| 20 to 24 Minutes | 1,809 | 15.8% |
| 25 to 29 Minutes | 1,184 | 10.4% |
| 30 to 34 Minutes | 2,018 | 17.7% |
| 35 to 39 Minutes | 436 | 3.8% |
| 40 to 44 Minutes | 625 | 5.5% |
| 45 to 59 Minutes | 855 | 7.5% |
| 60 to 89 Minutes | 282 | 2.5% |
| 90 or more Minutes | 108 | 0.9% |
Commute Time by Sex in Zionsville
The most common commute times in Zionsville are 30 to 34 minutes (1,299 commuters, 19.4%) for males and 15 to 19 minutes (846 commuters, 17.8%) for females.
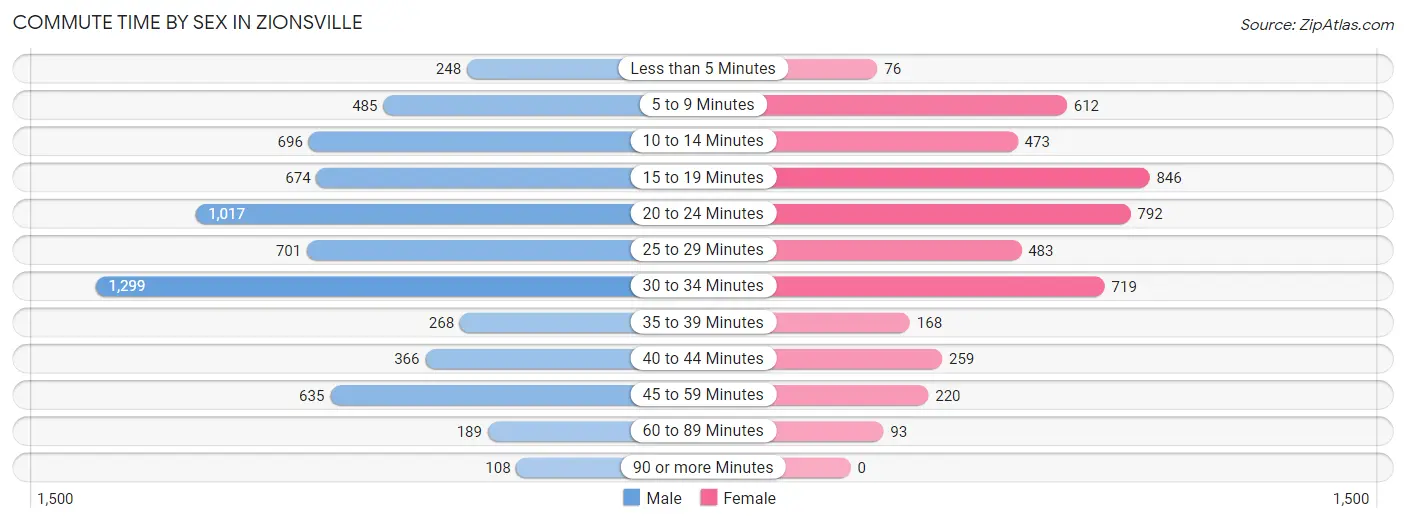
| Commute Time | Male | Female |
| Less than 5 Minutes | 248 (3.7%) | 76 (1.6%) |
| 5 to 9 Minutes | 485 (7.2%) | 612 (12.9%) |
| 10 to 14 Minutes | 696 (10.4%) | 473 (10.0%) |
| 15 to 19 Minutes | 674 (10.1%) | 846 (17.8%) |
| 20 to 24 Minutes | 1,017 (15.2%) | 792 (16.7%) |
| 25 to 29 Minutes | 701 (10.5%) | 483 (10.2%) |
| 30 to 34 Minutes | 1,299 (19.4%) | 719 (15.2%) |
| 35 to 39 Minutes | 268 (4.0%) | 168 (3.5%) |
| 40 to 44 Minutes | 366 (5.5%) | 259 (5.5%) |
| 45 to 59 Minutes | 635 (9.5%) | 220 (4.6%) |
| 60 to 89 Minutes | 189 (2.8%) | 93 (2.0%) |
| 90 or more Minutes | 108 (1.6%) | 0 (0.0%) |
Time of Departure to Work by Sex in Zionsville
The most frequent times of departure to work in Zionsville are 7:00 AM to 7:29 AM (1,450, 21.7%) for males and 7:30 AM to 7:59 AM (802, 16.9%) for females.
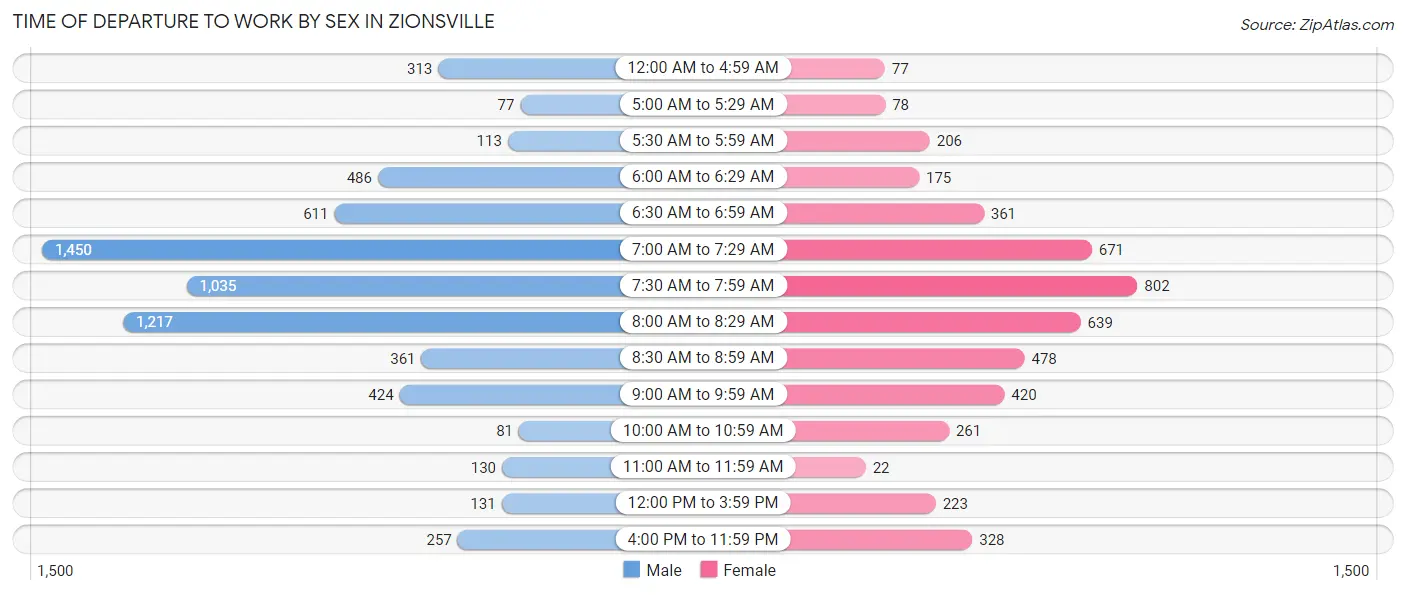
| Time of Departure | Male | Female |
| 12:00 AM to 4:59 AM | 313 (4.7%) | 77 (1.6%) |
| 5:00 AM to 5:29 AM | 77 (1.1%) | 78 (1.7%) |
| 5:30 AM to 5:59 AM | 113 (1.7%) | 206 (4.3%) |
| 6:00 AM to 6:29 AM | 486 (7.3%) | 175 (3.7%) |
| 6:30 AM to 6:59 AM | 611 (9.1%) | 361 (7.6%) |
| 7:00 AM to 7:29 AM | 1,450 (21.7%) | 671 (14.1%) |
| 7:30 AM to 7:59 AM | 1,035 (15.5%) | 802 (16.9%) |
| 8:00 AM to 8:29 AM | 1,217 (18.2%) | 639 (13.5%) |
| 8:30 AM to 8:59 AM | 361 (5.4%) | 478 (10.1%) |
| 9:00 AM to 9:59 AM | 424 (6.3%) | 420 (8.9%) |
| 10:00 AM to 10:59 AM | 81 (1.2%) | 261 (5.5%) |
| 11:00 AM to 11:59 AM | 130 (1.9%) | 22 (0.5%) |
| 12:00 PM to 3:59 PM | 131 (2.0%) | 223 (4.7%) |
| 4:00 PM to 11:59 PM | 257 (3.8%) | 328 (6.9%) |
| Total | 6,686 (100.0%) | 4,741 (100.0%) |
Housing Occupancy in Zionsville
Occupancy by Ownership in Zionsville
Of the total 11,271 dwellings in Zionsville, owner-occupied units account for 9,578 (85.0%), while renter-occupied units make up 1,693 (15.0%).
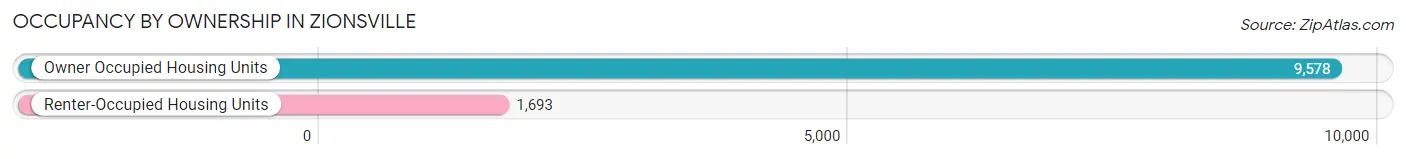
| Occupancy | # Housing Units | % Housing Units |
| Owner Occupied Housing Units | 9,578 | 85.0% |
| Renter-Occupied Housing Units | 1,693 | 15.0% |
| Total Occupied Housing Units | 11,271 | 100.0% |
Occupancy by Household Size in Zionsville
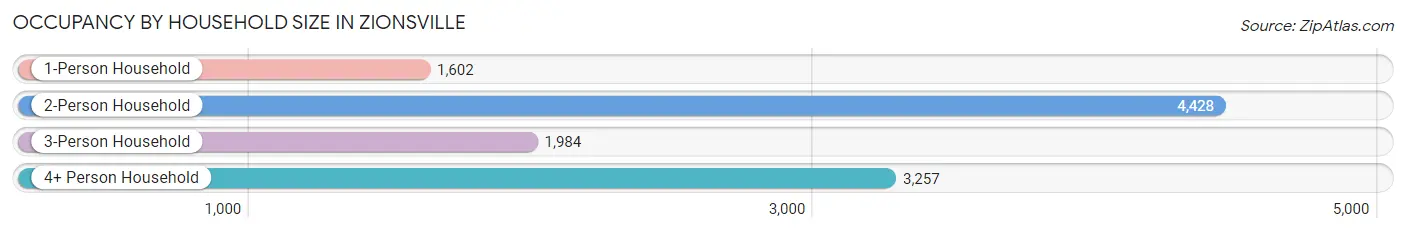
| Household Size | # Housing Units | % Housing Units |
| 1-Person Household | 1,602 | 14.2% |
| 2-Person Household | 4,428 | 39.3% |
| 3-Person Household | 1,984 | 17.6% |
| 4+ Person Household | 3,257 | 28.9% |
| Total Housing Units | 11,271 | 100.0% |
Occupancy by Ownership by Household Size in Zionsville
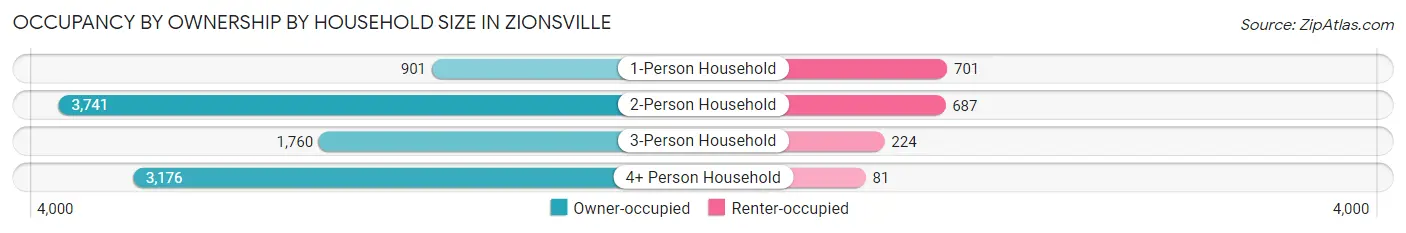
| Household Size | Owner-occupied | Renter-occupied |
| 1-Person Household | 901 (56.2%) | 701 (43.8%) |
| 2-Person Household | 3,741 (84.5%) | 687 (15.5%) |
| 3-Person Household | 1,760 (88.7%) | 224 (11.3%) |
| 4+ Person Household | 3,176 (97.5%) | 81 (2.5%) |
| Total Housing Units | 9,578 (85.0%) | 1,693 (15.0%) |
Occupancy by Educational Attainment in Zionsville
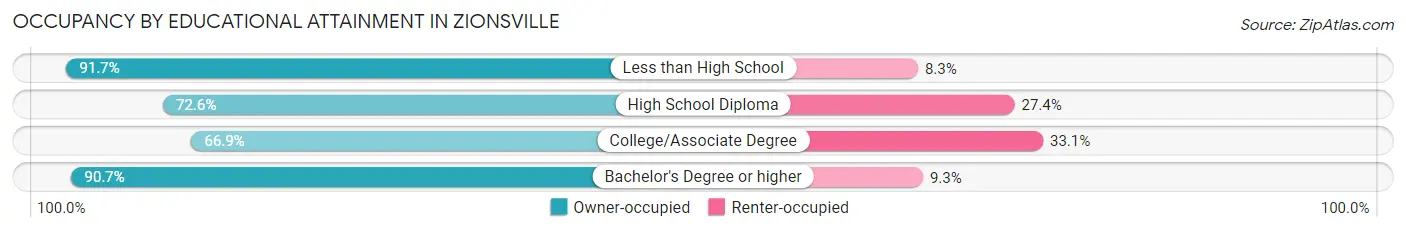
| Household Size | Owner-occupied | Renter-occupied |
| Less than High School | 177 (91.7%) | 16 (8.3%) |
| High School Diploma | 722 (72.6%) | 273 (27.4%) |
| College/Associate Degree | 1,317 (66.9%) | 651 (33.1%) |
| Bachelor's Degree or higher | 7,362 (90.7%) | 753 (9.3%) |
Occupancy by Age of Householder in Zionsville
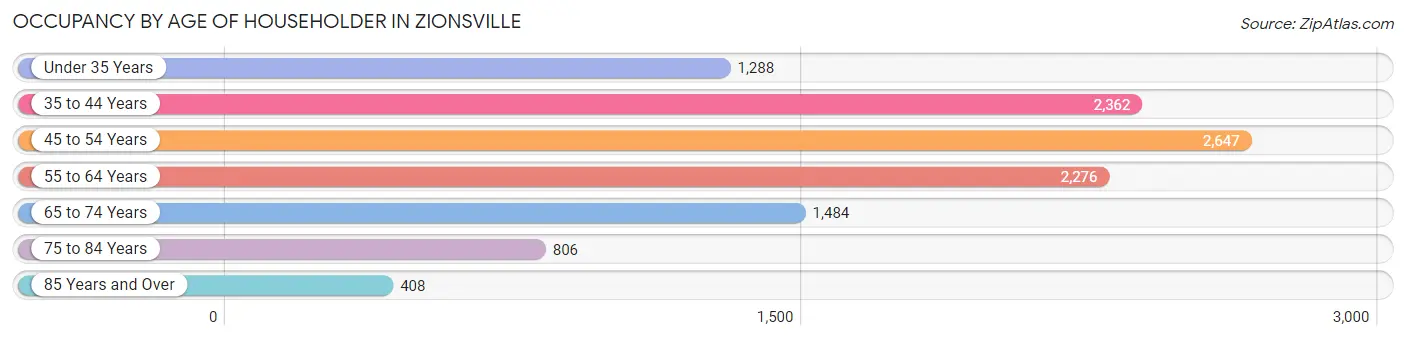
| Age Bracket | # Households | % Households |
| Under 35 Years | 1,288 | 11.4% |
| 35 to 44 Years | 2,362 | 21.0% |
| 45 to 54 Years | 2,647 | 23.5% |
| 55 to 64 Years | 2,276 | 20.2% |
| 65 to 74 Years | 1,484 | 13.2% |
| 75 to 84 Years | 806 | 7.1% |
| 85 Years and Over | 408 | 3.6% |
| Total | 11,271 | 100.0% |
Housing Finances in Zionsville
Median Income by Occupancy in Zionsville
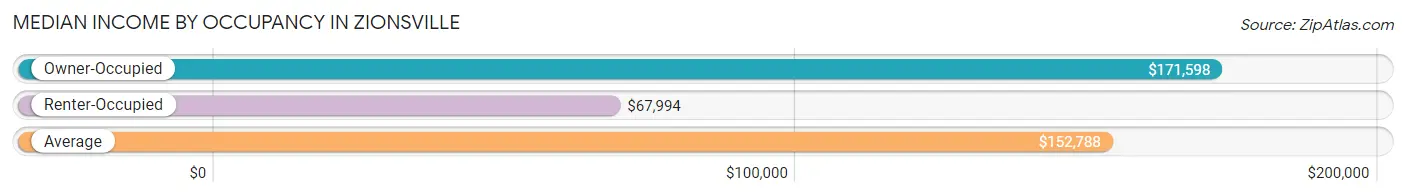
| Occupancy Type | # Households | Median Income |
| Owner-Occupied | 9,578 (85.0%) | $171,598 |
| Renter-Occupied | 1,693 (15.0%) | $67,994 |
| Average | 11,271 (100.0%) | $152,788 |
Occupancy by Householder Income Bracket in Zionsville
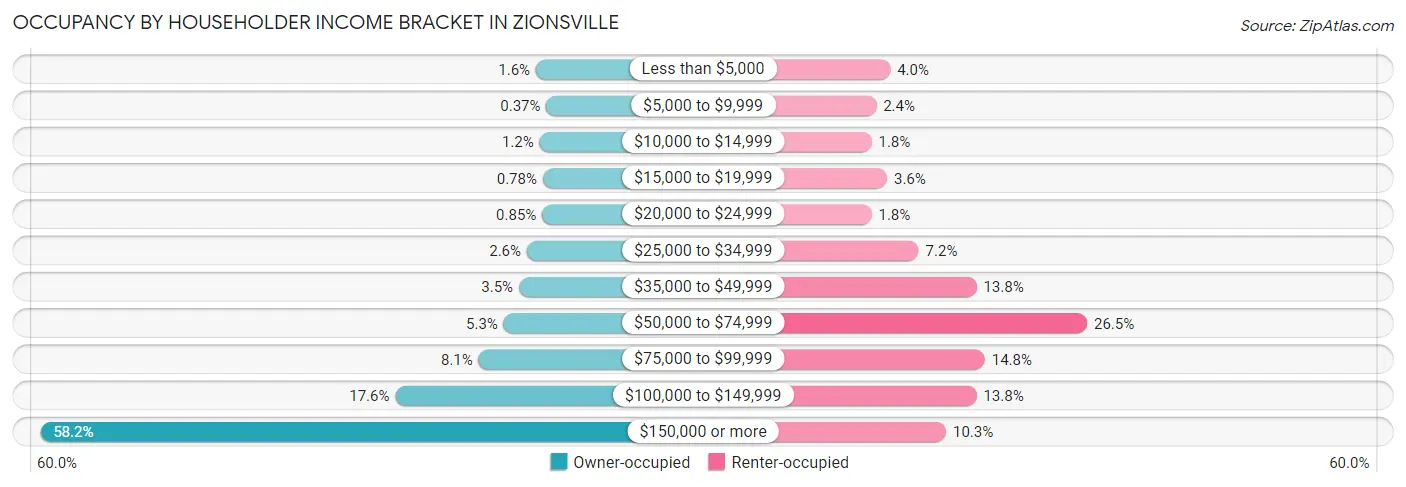
| Income Bracket | Owner-occupied | Renter-occupied |
| Less than $5,000 | 149 (1.6%) | 67 (4.0%) |
| $5,000 to $9,999 | 35 (0.4%) | 40 (2.4%) |
| $10,000 to $14,999 | 110 (1.1%) | 31 (1.8%) |
| $15,000 to $19,999 | 75 (0.8%) | 61 (3.6%) |
| $20,000 to $24,999 | 81 (0.9%) | 31 (1.8%) |
| $25,000 to $34,999 | 249 (2.6%) | 122 (7.2%) |
| $35,000 to $49,999 | 335 (3.5%) | 234 (13.8%) |
| $50,000 to $74,999 | 503 (5.2%) | 448 (26.5%) |
| $75,000 to $99,999 | 777 (8.1%) | 250 (14.8%) |
| $100,000 to $149,999 | 1,689 (17.6%) | 234 (13.8%) |
| $150,000 or more | 5,575 (58.2%) | 175 (10.3%) |
| Total | 9,578 (100.0%) | 1,693 (100.0%) |
Monthly Housing Cost Tiers in Zionsville
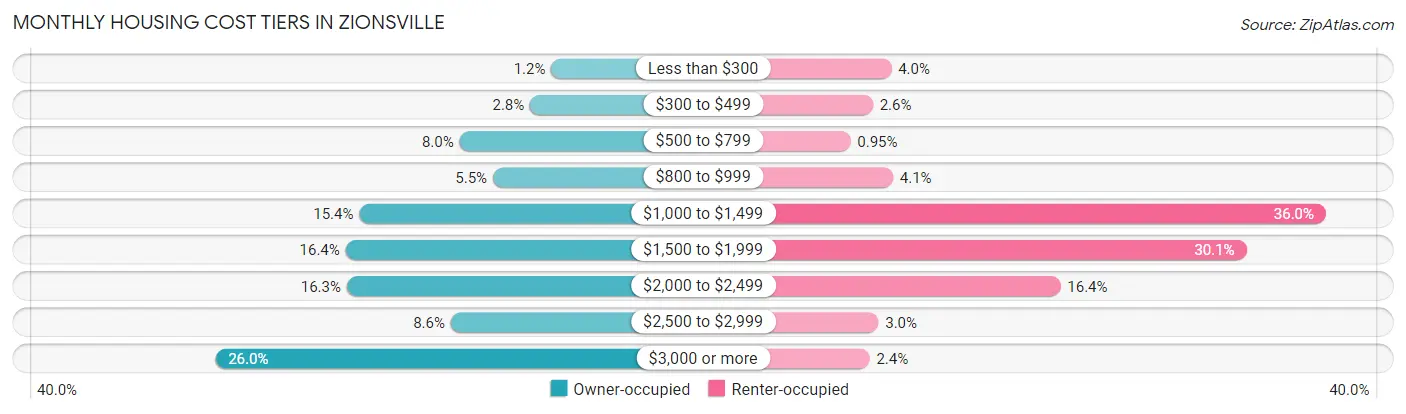
| Monthly Cost | Owner-occupied | Renter-occupied |
| Less than $300 | 116 (1.2%) | 67 (4.0%) |
| $300 to $499 | 265 (2.8%) | 44 (2.6%) |
| $500 to $799 | 763 (8.0%) | 16 (0.9%) |
| $800 to $999 | 528 (5.5%) | 69 (4.1%) |
| $1,000 to $1,499 | 1,470 (15.3%) | 609 (36.0%) |
| $1,500 to $1,999 | 1,567 (16.4%) | 510 (30.1%) |
| $2,000 to $2,499 | 1,558 (16.3%) | 278 (16.4%) |
| $2,500 to $2,999 | 825 (8.6%) | 51 (3.0%) |
| $3,000 or more | 2,486 (26.0%) | 40 (2.4%) |
| Total | 9,578 (100.0%) | 1,693 (100.0%) |
Physical Housing Characteristics in Zionsville
Housing Structures in Zionsville
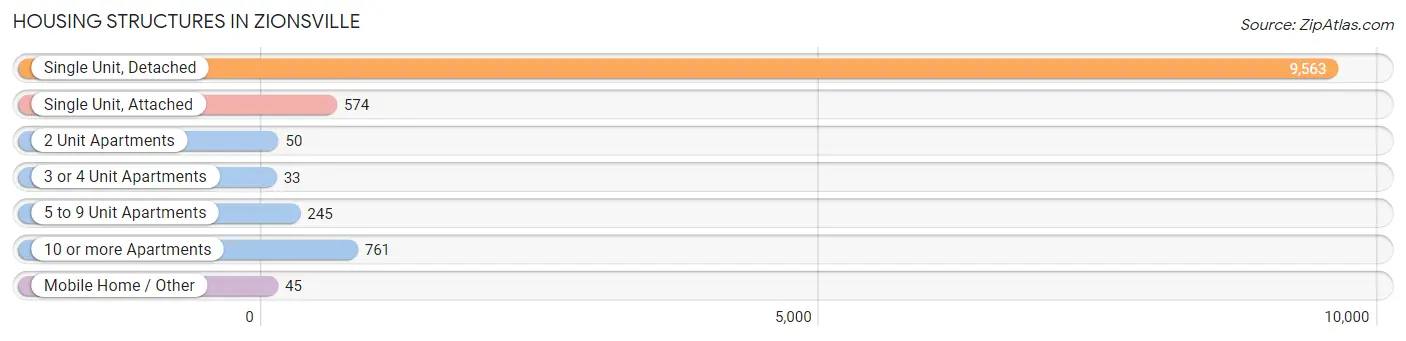
| Structure Type | # Housing Units | % Housing Units |
| Single Unit, Detached | 9,563 | 84.9% |
| Single Unit, Attached | 574 | 5.1% |
| 2 Unit Apartments | 50 | 0.4% |
| 3 or 4 Unit Apartments | 33 | 0.3% |
| 5 to 9 Unit Apartments | 245 | 2.2% |
| 10 or more Apartments | 761 | 6.8% |
| Mobile Home / Other | 45 | 0.4% |
| Total | 11,271 | 100.0% |
Housing Structures by Occupancy in Zionsville
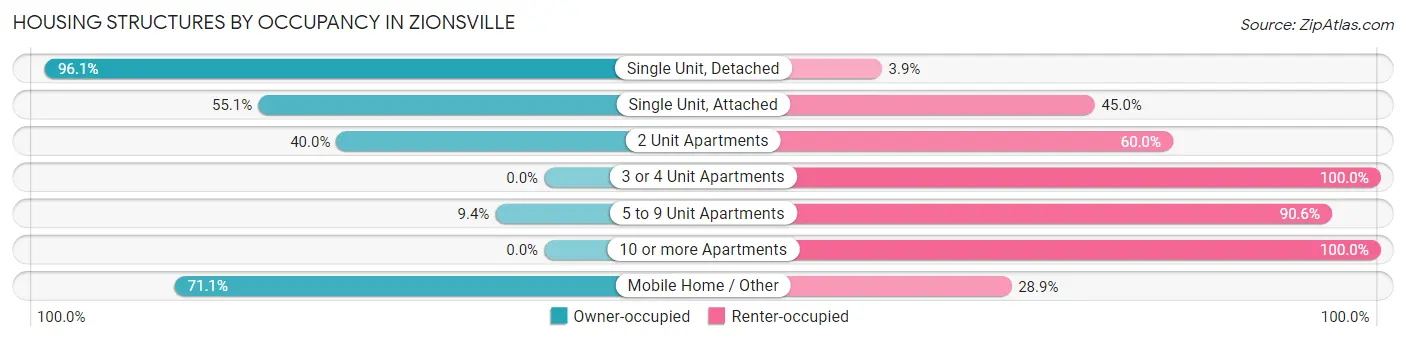
| Structure Type | Owner-occupied | Renter-occupied |
| Single Unit, Detached | 9,187 (96.1%) | 376 (3.9%) |
| Single Unit, Attached | 316 (55.0%) | 258 (45.0%) |
| 2 Unit Apartments | 20 (40.0%) | 30 (60.0%) |
| 3 or 4 Unit Apartments | 0 (0.0%) | 33 (100.0%) |
| 5 to 9 Unit Apartments | 23 (9.4%) | 222 (90.6%) |
| 10 or more Apartments | 0 (0.0%) | 761 (100.0%) |
| Mobile Home / Other | 32 (71.1%) | 13 (28.9%) |
| Total | 9,578 (85.0%) | 1,693 (15.0%) |
Housing Structures by Number of Rooms in Zionsville
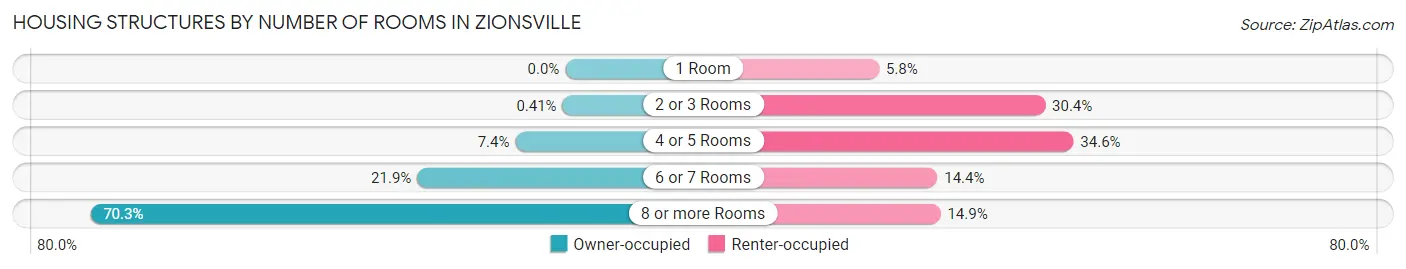
| Number of Rooms | Owner-occupied | Renter-occupied |
| 1 Room | 0 (0.0%) | 98 (5.8%) |
| 2 or 3 Rooms | 39 (0.4%) | 514 (30.4%) |
| 4 or 5 Rooms | 708 (7.4%) | 585 (34.5%) |
| 6 or 7 Rooms | 2,099 (21.9%) | 244 (14.4%) |
| 8 or more Rooms | 6,732 (70.3%) | 252 (14.9%) |
| Total | 9,578 (100.0%) | 1,693 (100.0%) |
Housing Structure by Heating Type in Zionsville
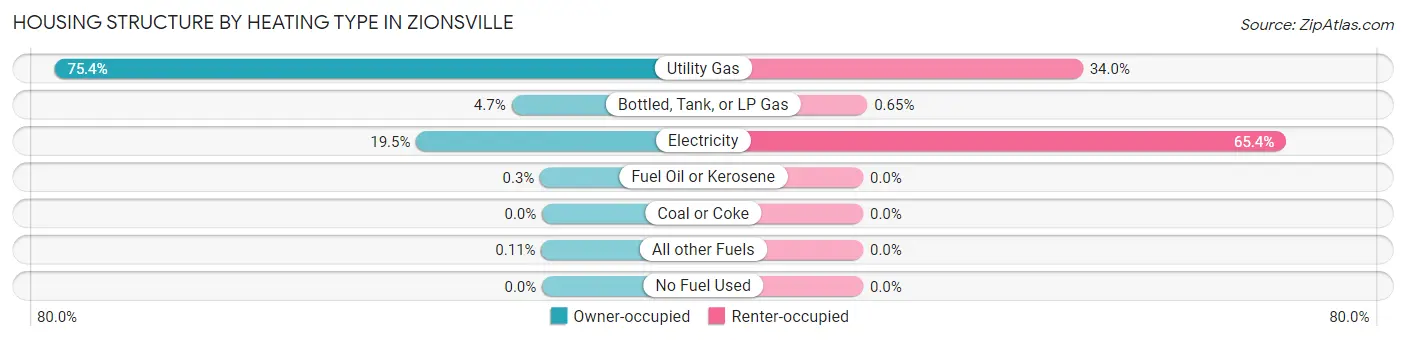
| Heating Type | Owner-occupied | Renter-occupied |
| Utility Gas | 7,222 (75.4%) | 575 (34.0%) |
| Bottled, Tank, or LP Gas | 453 (4.7%) | 11 (0.6%) |
| Electricity | 1,863 (19.5%) | 1,107 (65.4%) |
| Fuel Oil or Kerosene | 29 (0.3%) | 0 (0.0%) |
| Coal or Coke | 0 (0.0%) | 0 (0.0%) |
| All other Fuels | 11 (0.1%) | 0 (0.0%) |
| No Fuel Used | 0 (0.0%) | 0 (0.0%) |
| Total | 9,578 (100.0%) | 1,693 (100.0%) |
Household Vehicle Usage in Zionsville
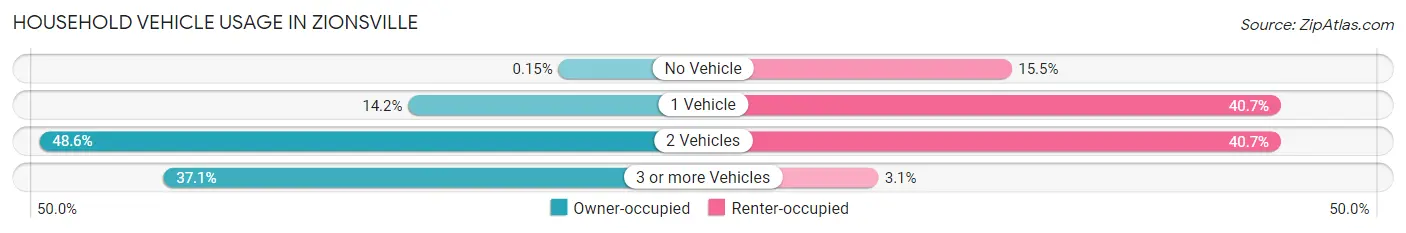
| Vehicles per Household | Owner-occupied | Renter-occupied |
| No Vehicle | 14 (0.2%) | 263 (15.5%) |
| 1 Vehicle | 1,358 (14.2%) | 689 (40.7%) |
| 2 Vehicles | 4,657 (48.6%) | 689 (40.7%) |
| 3 or more Vehicles | 3,549 (37.0%) | 52 (3.1%) |
| Total | 9,578 (100.0%) | 1,693 (100.0%) |
Real Estate & Mortgages in Zionsville
Real Estate and Mortgage Overview in Zionsville
| Characteristic | Without Mortgage | With Mortgage |
| Housing Units | 2,447 | 7,131 |
| Median Property Value | $511,200 | $489,600 |
| Median Household Income | $121,890 | $4,485 |
| Monthly Housing Costs | $869 | $2,449 |
| Real Estate Taxes | $4,772 | $16 |
Property Value by Mortgage Status in Zionsville
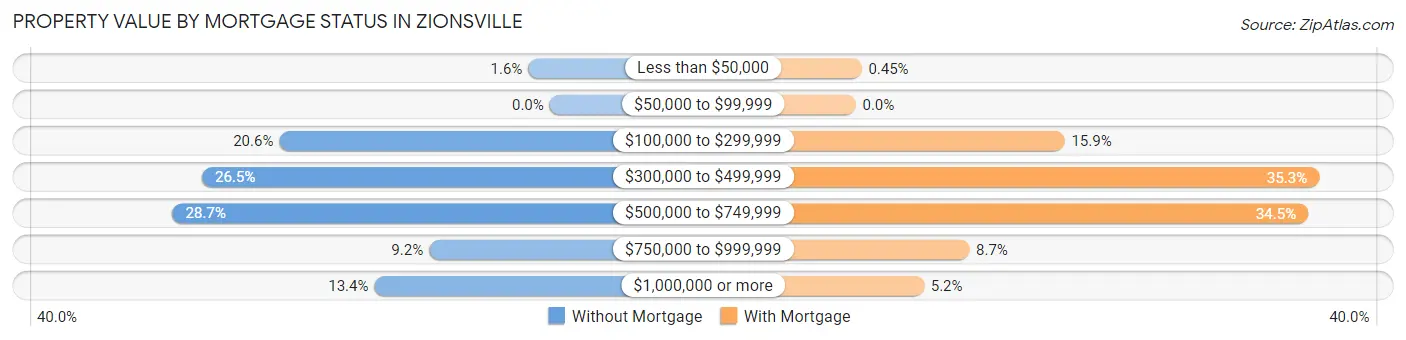
| Property Value | Without Mortgage | With Mortgage |
| Less than $50,000 | 40 (1.6%) | 32 (0.4%) |
| $50,000 to $99,999 | 0 (0.0%) | 0 (0.0%) |
| $100,000 to $299,999 | 504 (20.6%) | 1,135 (15.9%) |
| $300,000 to $499,999 | 648 (26.5%) | 2,518 (35.3%) |
| $500,000 to $749,999 | 703 (28.7%) | 2,458 (34.5%) |
| $750,000 to $999,999 | 225 (9.2%) | 617 (8.6%) |
| $1,000,000 or more | 327 (13.4%) | 371 (5.2%) |
| Total | 2,447 (100.0%) | 7,131 (100.0%) |
Household Income by Mortgage Status in Zionsville
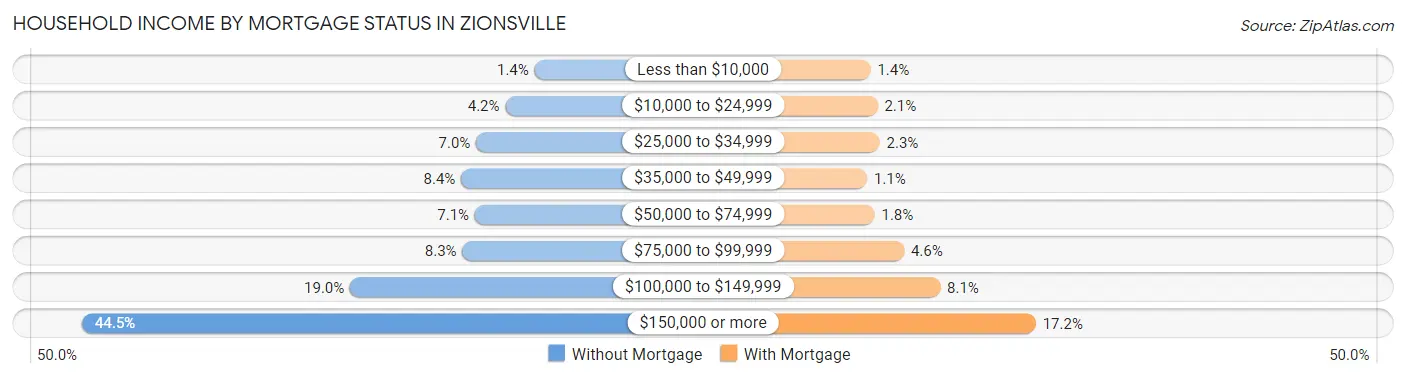
| Household Income | Without Mortgage | With Mortgage |
| Less than $10,000 | 35 (1.4%) | 101 (1.4%) |
| $10,000 to $24,999 | 103 (4.2%) | 149 (2.1%) |
| $25,000 to $34,999 | 171 (7.0%) | 163 (2.3%) |
| $35,000 to $49,999 | 206 (8.4%) | 78 (1.1%) |
| $50,000 to $74,999 | 174 (7.1%) | 129 (1.8%) |
| $75,000 to $99,999 | 203 (8.3%) | 329 (4.6%) |
| $100,000 to $149,999 | 465 (19.0%) | 574 (8.1%) |
| $150,000 or more | 1,090 (44.5%) | 1,224 (17.2%) |
| Total | 2,447 (100.0%) | 7,131 (100.0%) |
Property Value to Household Income Ratio in Zionsville
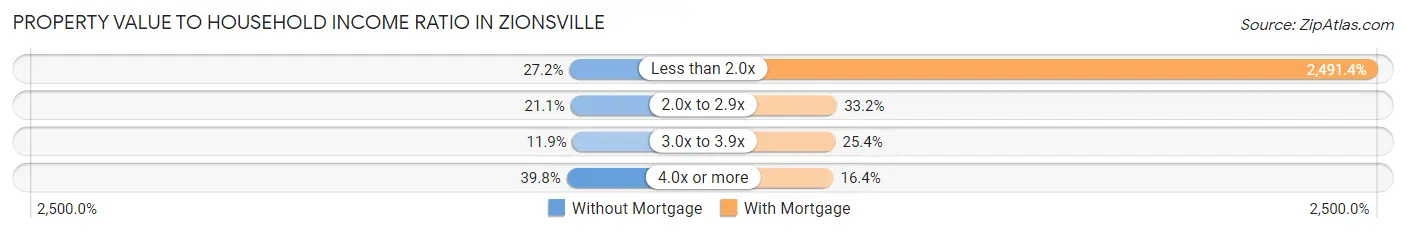
| Value-to-Income Ratio | Without Mortgage | With Mortgage |
| Less than 2.0x | 665 (27.2%) | 177,662 (2,491.4%) |
| 2.0x to 2.9x | 516 (21.1%) | 2,367 (33.2%) |
| 3.0x to 3.9x | 292 (11.9%) | 1,809 (25.4%) |
| 4.0x or more | 974 (39.8%) | 1,170 (16.4%) |
| Total | 2,447 (100.0%) | 7,131 (100.0%) |
Real Estate Taxes by Mortgage Status in Zionsville
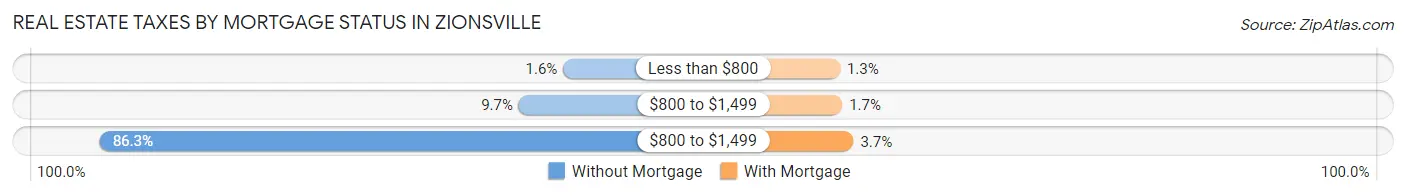
| Property Taxes | Without Mortgage | With Mortgage |
| Less than $800 | 40 (1.6%) | 90 (1.3%) |
| $800 to $1,499 | 238 (9.7%) | 120 (1.7%) |
| $800 to $1,499 | 2,111 (86.3%) | 266 (3.7%) |
| Total | 2,447 (100.0%) | 7,131 (100.0%) |
Health & Disability in Zionsville
Health Insurance Coverage by Age in Zionsville
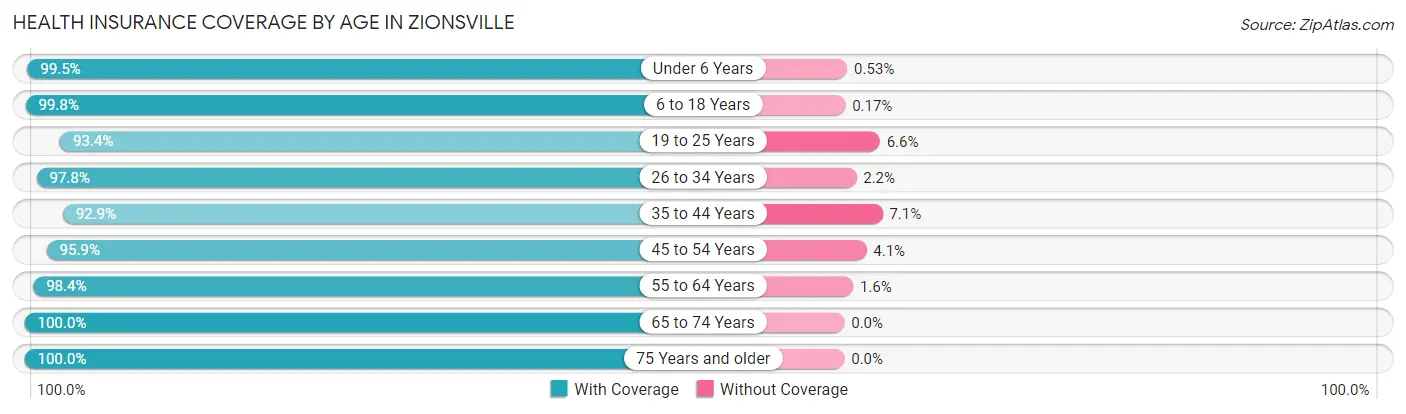
| Age Bracket | With Coverage | Without Coverage |
| Under 6 Years | 2,456 (99.5%) | 13 (0.5%) |
| 6 to 18 Years | 5,917 (99.8%) | 10 (0.2%) |
| 19 to 25 Years | 1,444 (93.4%) | 102 (6.6%) |
| 26 to 34 Years | 2,281 (97.8%) | 52 (2.2%) |
| 35 to 44 Years | 4,175 (92.9%) | 320 (7.1%) |
| 45 to 54 Years | 5,044 (95.9%) | 216 (4.1%) |
| 55 to 64 Years | 4,067 (98.4%) | 67 (1.6%) |
| 65 to 74 Years | 2,555 (100.0%) | 0 (0.0%) |
| 75 Years and older | 1,939 (100.0%) | 0 (0.0%) |
| Total | 29,878 (97.5%) | 780 (2.5%) |
Health Insurance Coverage by Citizenship Status in Zionsville
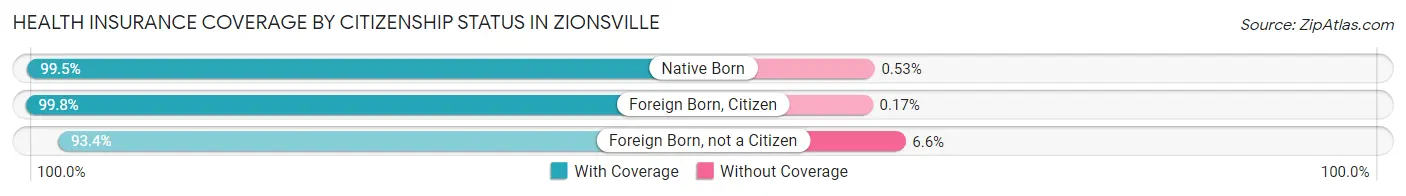
| Citizenship Status | With Coverage | Without Coverage |
| Native Born | 2,456 (99.5%) | 13 (0.5%) |
| Foreign Born, Citizen | 5,917 (99.8%) | 10 (0.2%) |
| Foreign Born, not a Citizen | 1,444 (93.4%) | 102 (6.6%) |
Health Insurance Coverage by Household Income in Zionsville
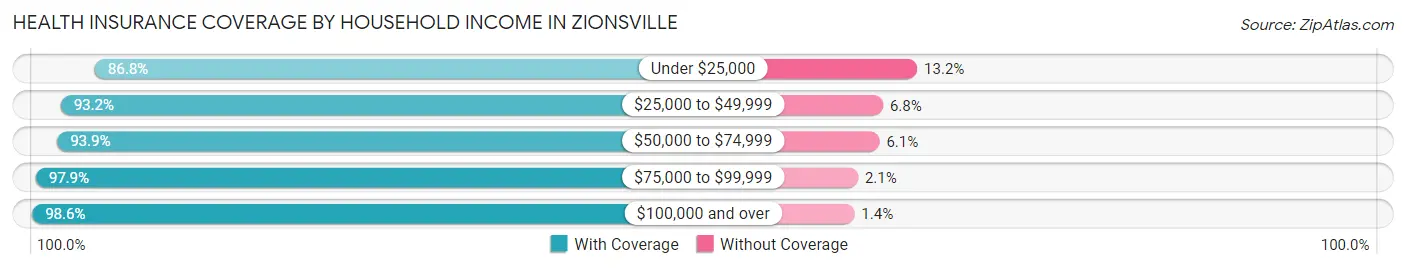
| Household Income | With Coverage | Without Coverage |
| Under $25,000 | 1,074 (86.8%) | 163 (13.2%) |
| $25,000 to $49,999 | 1,626 (93.2%) | 118 (6.8%) |
| $50,000 to $74,999 | 1,780 (93.9%) | 116 (6.1%) |
| $75,000 to $99,999 | 2,236 (97.9%) | 48 (2.1%) |
| $100,000 and over | 23,153 (98.6%) | 335 (1.4%) |
Public vs Private Health Insurance Coverage by Age in Zionsville
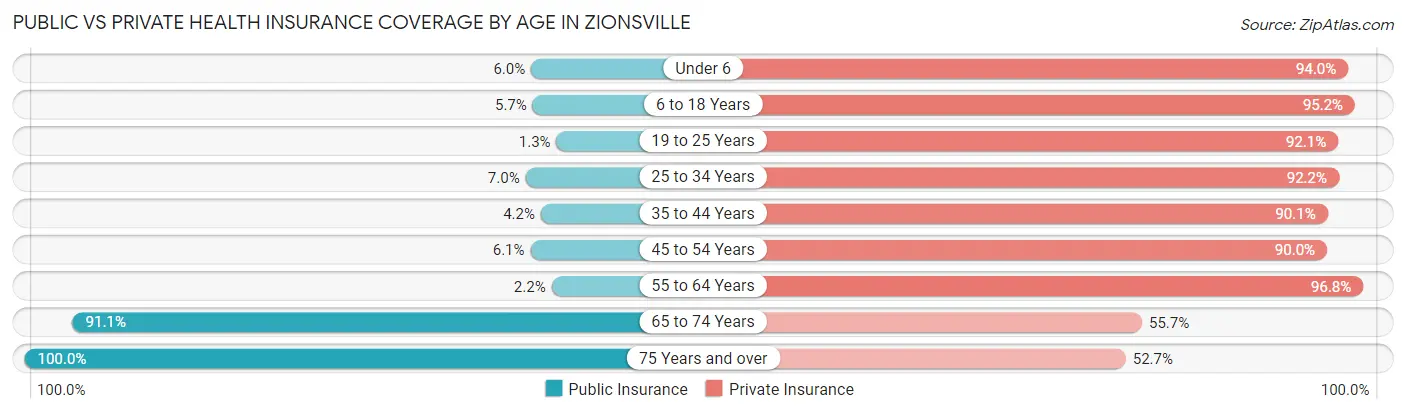
| Age Bracket | Public Insurance | Private Insurance |
| Under 6 | 148 (6.0%) | 2,320 (94.0%) |
| 6 to 18 Years | 338 (5.7%) | 5,645 (95.2%) |
| 19 to 25 Years | 20 (1.3%) | 1,424 (92.1%) |
| 25 to 34 Years | 164 (7.0%) | 2,152 (92.2%) |
| 35 to 44 Years | 188 (4.2%) | 4,052 (90.1%) |
| 45 to 54 Years | 322 (6.1%) | 4,736 (90.0%) |
| 55 to 64 Years | 91 (2.2%) | 4,000 (96.8%) |
| 65 to 74 Years | 2,327 (91.1%) | 1,424 (55.7%) |
| 75 Years and over | 1,939 (100.0%) | 1,022 (52.7%) |
| Total | 5,537 (18.1%) | 26,775 (87.3%) |
Disability Status by Sex by Age in Zionsville
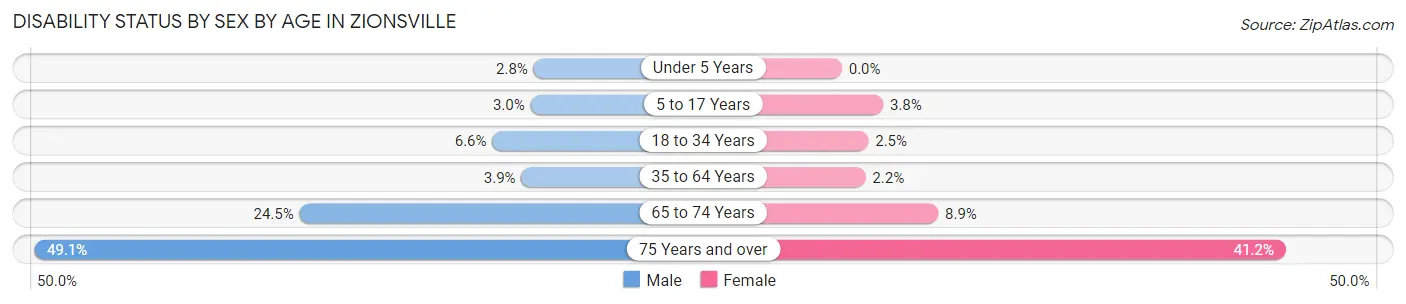
| Age Bracket | Male | Female |
| Under 5 Years | 30 (2.8%) | 0 (0.0%) |
| 5 to 17 Years | 100 (3.0%) | 116 (3.8%) |
| 18 to 34 Years | 144 (6.6%) | 48 (2.5%) |
| 35 to 64 Years | 272 (3.9%) | 151 (2.2%) |
| 65 to 74 Years | 294 (24.5%) | 121 (8.9%) |
| 75 Years and over | 397 (49.1%) | 466 (41.2%) |
Disability Class by Sex by Age in Zionsville
Disability Class: Hearing Difficulty
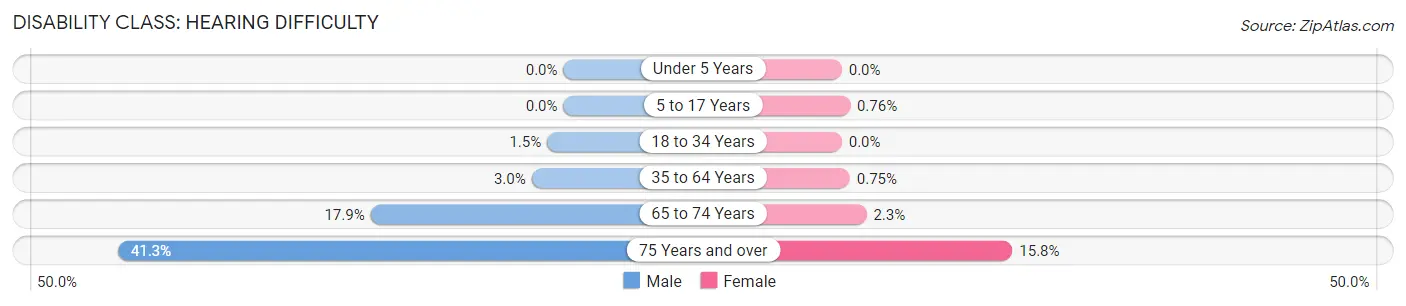
| Age Bracket | Male | Female |
| Under 5 Years | 0 (0.0%) | 0 (0.0%) |
| 5 to 17 Years | 0 (0.0%) | 23 (0.8%) |
| 18 to 34 Years | 33 (1.5%) | 0 (0.0%) |
| 35 to 64 Years | 206 (2.9%) | 52 (0.7%) |
| 65 to 74 Years | 215 (17.9%) | 31 (2.3%) |
| 75 Years and over | 334 (41.3%) | 179 (15.8%) |
Disability Class: Vision Difficulty
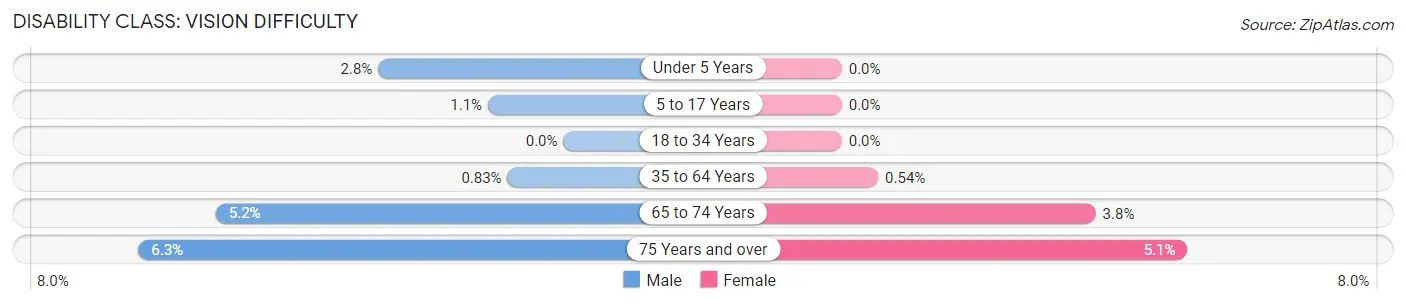
| Age Bracket | Male | Female |
| Under 5 Years | 30 (2.8%) | 0 (0.0%) |
| 5 to 17 Years | 37 (1.1%) | 0 (0.0%) |
| 18 to 34 Years | 0 (0.0%) | 0 (0.0%) |
| 35 to 64 Years | 58 (0.8%) | 37 (0.5%) |
| 65 to 74 Years | 62 (5.2%) | 51 (3.8%) |
| 75 Years and over | 51 (6.3%) | 58 (5.1%) |
Disability Class: Cognitive Difficulty
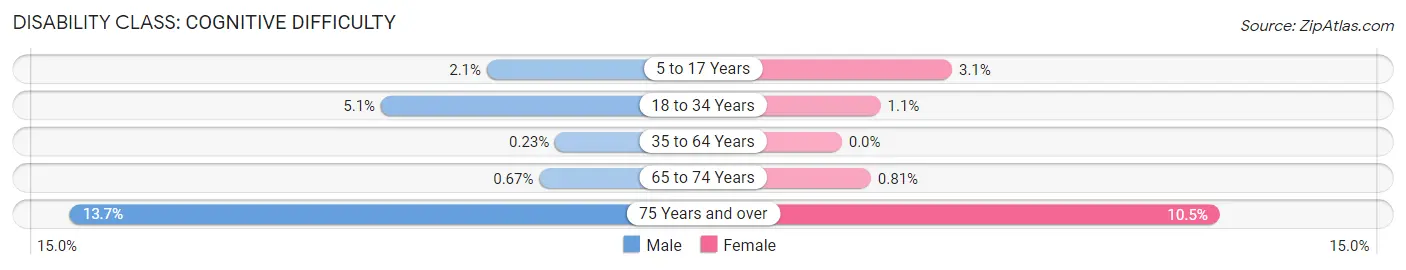
| Age Bracket | Male | Female |
| 5 to 17 Years | 70 (2.1%) | 93 (3.1%) |
| 18 to 34 Years | 111 (5.1%) | 21 (1.1%) |
| 35 to 64 Years | 16 (0.2%) | 0 (0.0%) |
| 65 to 74 Years | 8 (0.7%) | 11 (0.8%) |
| 75 Years and over | 111 (13.7%) | 119 (10.5%) |
Disability Class: Ambulatory Difficulty
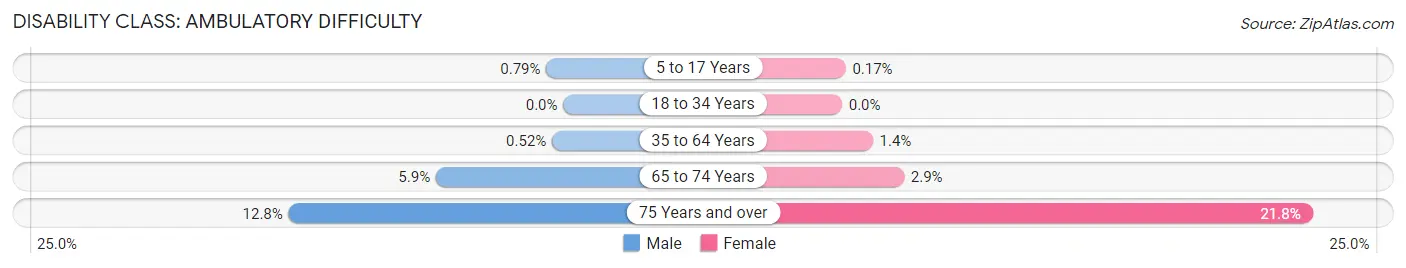
| Age Bracket | Male | Female |
| 5 to 17 Years | 26 (0.8%) | 5 (0.2%) |
| 18 to 34 Years | 0 (0.0%) | 0 (0.0%) |
| 35 to 64 Years | 36 (0.5%) | 99 (1.4%) |
| 65 to 74 Years | 71 (5.9%) | 39 (2.9%) |
| 75 Years and over | 103 (12.8%) | 247 (21.8%) |
Disability Class: Self-Care Difficulty
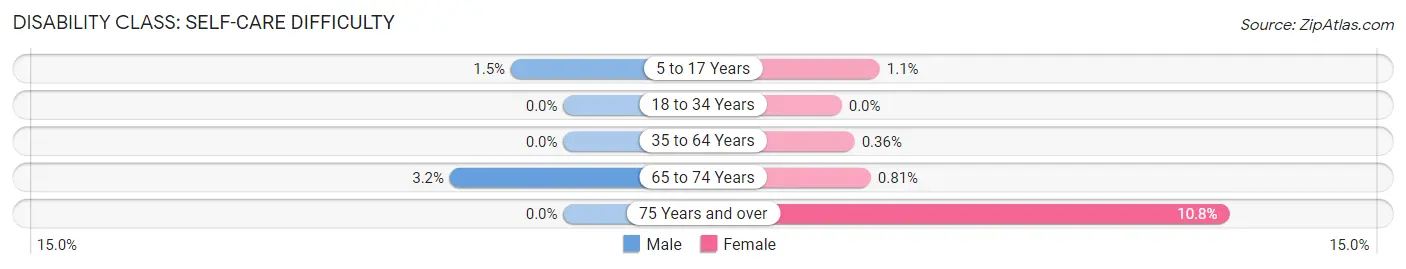
| Age Bracket | Male | Female |
| 5 to 17 Years | 48 (1.5%) | 32 (1.1%) |
| 18 to 34 Years | 0 (0.0%) | 0 (0.0%) |
| 35 to 64 Years | 0 (0.0%) | 25 (0.4%) |
| 65 to 74 Years | 38 (3.2%) | 11 (0.8%) |
| 75 Years and over | 0 (0.0%) | 122 (10.8%) |
Technology Access in Zionsville
Computing Device Access in Zionsville
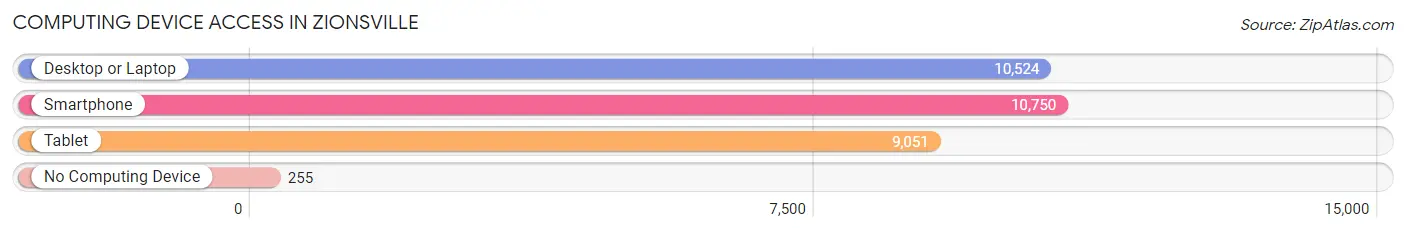
| Device Type | # Households | % Households |
| Desktop or Laptop | 10,524 | 93.4% |
| Smartphone | 10,750 | 95.4% |
| Tablet | 9,051 | 80.3% |
| No Computing Device | 255 | 2.3% |
| Total | 11,271 | 100.0% |
Internet Access in Zionsville
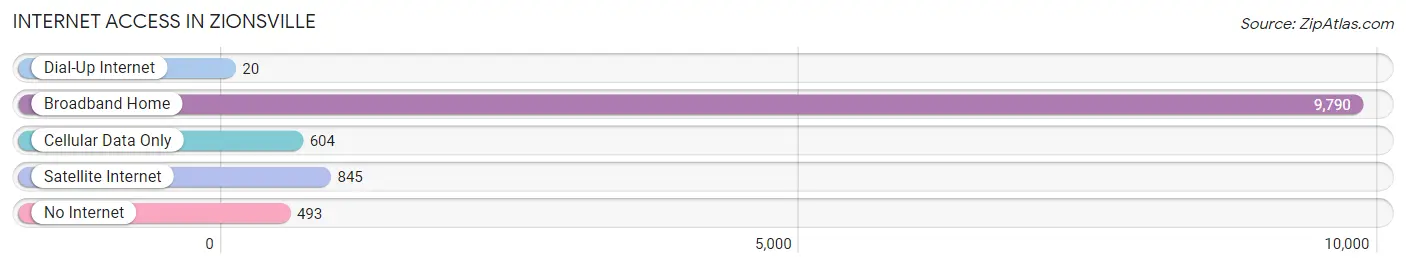
| Internet Type | # Households | % Households |
| Dial-Up Internet | 20 | 0.2% |
| Broadband Home | 9,790 | 86.9% |
| Cellular Data Only | 604 | 5.4% |
| Satellite Internet | 845 | 7.5% |
| No Internet | 493 | 4.4% |
| Total | 11,271 | 100.0% |
Zionsville Summary
Zionsville, Indiana is a small town located in Boone County, Indiana, about 20 miles northwest of Indianapolis. It is a part of the Indianapolis metropolitan area and is known for its quaint downtown area, historic buildings, and small-town charm. The population of Zionsville was estimated to be 14,160 in 2019.
History
Zionsville was founded in 1852 by William Zion, a Quaker from North Carolina. He purchased the land from the government and named it after himself. The town was originally a farming community, but it soon developed into a small industrial center. The first railroad line was built in 1871, connecting Zionsville to Indianapolis. This allowed the town to become a popular destination for tourists and travelers.
In the late 19th century, Zionsville began to attract wealthy families from Indianapolis. These families built large homes and estates in the area, which helped to shape the town's character. The town was incorporated in 1872 and has remained a small, close-knit community ever since.
Geography
Zionsville is located in Boone County, Indiana, about 20 miles northwest of Indianapolis. It is situated in the White River Valley, which is part of the Central Lowland region of the United States. The town is surrounded by rolling hills and farmland, and is home to several parks and nature preserves.
The climate in Zionsville is humid continental, with hot summers and cold winters. The average annual temperature is around 50 degrees Fahrenheit, and the average annual precipitation is around 40 inches.
Economy
Zionsville's economy is largely based on tourism and retail. The town is home to several small businesses, including restaurants, shops, and galleries. The downtown area is a popular destination for visitors, and the town hosts several festivals and events throughout the year.
The town is also home to several large employers, including the Zionsville Community School Corporation, the Zionsville Chamber of Commerce, and the Zionsville Public Library. The town is also home to several technology companies, including ExactTarget, Appirio, and Angie's List.
Demographics
As of 2019, the population of Zionsville was estimated to be 14,160. The racial makeup of the town is predominantly white (90.2%), with small percentages of African American (3.2%), Asian (2.3%), and Hispanic (2.2%) residents. The median household income in Zionsville is $90,845, and the median home value is $310,000.
Zionsville is a small, close-knit community with a strong sense of community and pride. The town is known for its historic buildings, quaint downtown area, and small-town charm. It is a popular destination for visitors and tourists, and is home to several large employers.
Common Questions
What is Per Capita Income in Zionsville?
Per Capita income in Zionsville is $74,443.
What is the Median Family Income in Zionsville?
Median Family Income in Zionsville is $174,048.
What is the Median Household income in Zionsville?
Median Household Income in Zionsville is $152,788.
What is Income or Wage Gap in Zionsville?
Income or Wage Gap in Zionsville is 38.0%.
Women in Zionsville earn 62.0 cents for every dollar earned by a man.
What is Inequality or Gini Index in Zionsville?
Inequality or Gini Index in Zionsville is 0.46.
What is the Total Population of Zionsville?
Total Population of Zionsville is 30,832.
What is the Total Male Population of Zionsville?
Total Male Population of Zionsville is 15,672.
What is the Total Female Population of Zionsville?
Total Female Population of Zionsville is 15,160.
What is the Ratio of Males per 100 Females in Zionsville?
There are 103.38 Males per 100 Females in Zionsville.
What is the Ratio of Females per 100 Males in Zionsville?
There are 96.73 Females per 100 Males in Zionsville.
What is the Median Population Age in Zionsville?
Median Population Age in Zionsville is 41.8 Years.
What is the Average Family Size in Zionsville
Average Family Size in Zionsville is 3.0 People.
What is the Average Household Size in Zionsville
Average Household Size in Zionsville is 2.7 People.
How Large is the Labor Force in Zionsville?
There are 15,797 People in the Labor Forcein in Zionsville.
What is the Percentage of People in the Labor Force in Zionsville?
67.0% of People are in the Labor Force in Zionsville.
What is the Unemployment Rate in Zionsville?
Unemployment Rate in Zionsville is 4.0%.