New Palestine, IN Map & Demographics
New Palestine Map
New Palestine Overview
$49,748
PER CAPITA INCOME
$112,596
AVG FAMILY INCOME
$86,082
AVG HOUSEHOLD INCOME
39.9%
WAGE / INCOME GAP [ % ]
60.1¢/ $1
WAGE / INCOME GAP [ $ ]
0.42
INEQUALITY / GINI INDEX
2,831
TOTAL POPULATION
1,407
MALE POPULATION
1,424
FEMALE POPULATION
98.81
MALES / 100 FEMALES
101.21
FEMALES / 100 MALES
44.4
MEDIAN AGE
2.8
AVG FAMILY SIZE
2.4
AVG HOUSEHOLD SIZE
1,580
LABOR FORCE [ PEOPLE ]
68.1%
PERCENT IN LABOR FORCE
5.0%
UNEMPLOYMENT RATE
New Palestine Zip Codes
New Palestine Area Codes
Income in New Palestine
Income Overview in New Palestine
Per Capita Income in New Palestine is $49,748, while median incomes of families and households are $112,596 and $86,082 respectively.
| Characteristic | Number | Measure |
| Per Capita Income | 2,831 | $49,748 |
| Median Family Income | 857 | $112,596 |
| Mean Family Income | 857 | $139,756 |
| Median Household Income | 1,199 | $86,082 |
| Mean Household Income | 1,199 | $116,684 |
| Income Deficit | 857 | $0 |
| Wage / Income Gap (%) | 2,831 | 39.90% |
| Wage / Income Gap ($) | 2,831 | 60.10¢ per $1 |
| Gini / Inequality Index | 2,831 | 0.42 |
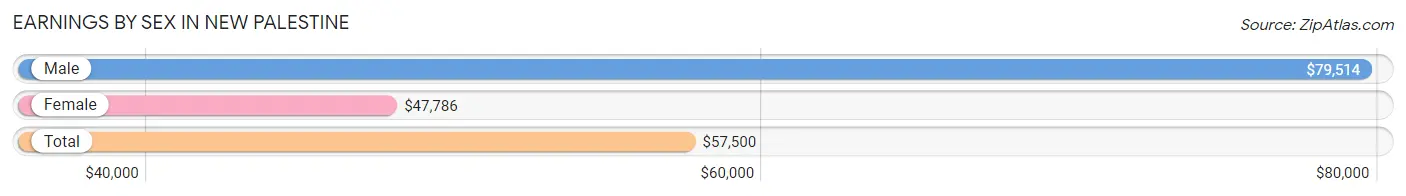
Earnings by Sex in New Palestine
Average Earnings in New Palestine are $57,500, $79,514 for men and $47,786 for women, a difference of 39.9%.
| Sex | Number | Average Earnings |
| Male | 728 (45.8%) | $79,514 |
| Female | 860 (54.2%) | $47,786 |
| Total | 1,588 (100.0%) | $57,500 |
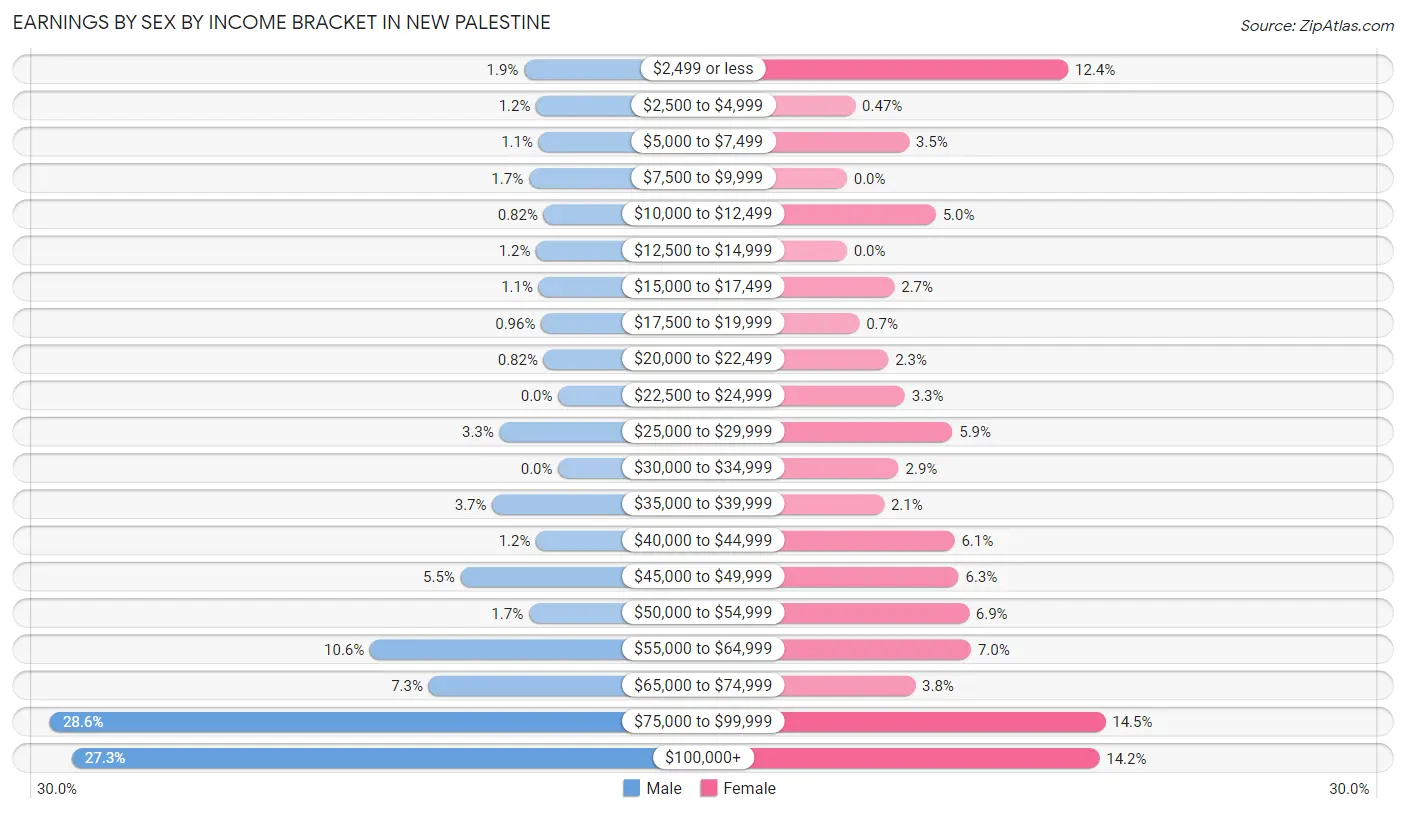
Earnings by Sex by Income Bracket in New Palestine
The most common earnings brackets in New Palestine are $75,000 to $99,999 for men (208 | 28.6%) and $75,000 to $99,999 for women (125 | 14.5%).
| Income | Male | Female |
| $2,499 or less | 14 (1.9%) | 107 (12.4%) |
| $2,500 to $4,999 | 9 (1.2%) | 4 (0.5%) |
| $5,000 to $7,499 | 8 (1.1%) | 30 (3.5%) |
| $7,500 to $9,999 | 12 (1.7%) | 0 (0.0%) |
| $10,000 to $12,499 | 6 (0.8%) | 43 (5.0%) |
| $12,500 to $14,999 | 9 (1.2%) | 0 (0.0%) |
| $15,000 to $17,499 | 8 (1.1%) | 23 (2.7%) |
| $17,500 to $19,999 | 7 (1.0%) | 6 (0.7%) |
| $20,000 to $22,499 | 6 (0.8%) | 20 (2.3%) |
| $22,500 to $24,999 | 0 (0.0%) | 28 (3.3%) |
| $25,000 to $29,999 | 24 (3.3%) | 51 (5.9%) |
| $30,000 to $34,999 | 0 (0.0%) | 25 (2.9%) |
| $35,000 to $39,999 | 27 (3.7%) | 18 (2.1%) |
| $40,000 to $44,999 | 9 (1.2%) | 52 (6.0%) |
| $45,000 to $49,999 | 40 (5.5%) | 54 (6.3%) |
| $50,000 to $54,999 | 12 (1.7%) | 59 (6.9%) |
| $55,000 to $64,999 | 77 (10.6%) | 60 (7.0%) |
| $65,000 to $74,999 | 53 (7.3%) | 33 (3.8%) |
| $75,000 to $99,999 | 208 (28.6%) | 125 (14.5%) |
| $100,000+ | 199 (27.3%) | 122 (14.2%) |
| Total | 728 (100.0%) | 860 (100.0%) |
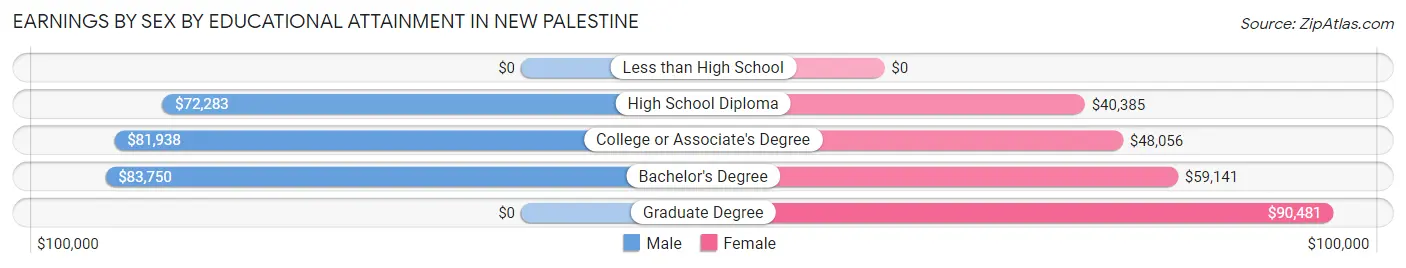
Earnings by Sex by Educational Attainment in New Palestine
Average earnings in New Palestine are $80,740 for men and $50,755 for women, a difference of 37.1%. Men with an educational attainment of bachelor's degree enjoy the highest average annual earnings of $83,750, while those with high school diploma education earn the least with $72,283. Women with an educational attainment of graduate degree earn the most with the average annual earnings of $90,481, while those with high school diploma education have the smallest earnings of $40,385.
| Educational Attainment | Male Income | Female Income |
| Less than High School | - | - |
| High School Diploma | $72,283 | $40,385 |
| College or Associate's Degree | $81,938 | $48,056 |
| Bachelor's Degree | $83,750 | $59,141 |
| Graduate Degree | - | - |
| Total | $80,740 | $50,755 |
Family Income in New Palestine
Family Income Brackets in New Palestine
According to the New Palestine family income data, there are 191 families falling into the $100,000 to $149,999 income range, which is the most common income bracket and makes up 22.3% of all families. Conversely, the less than $10,000 income bracket is the least frequent group with only 5 families (0.6%) belonging to this category.
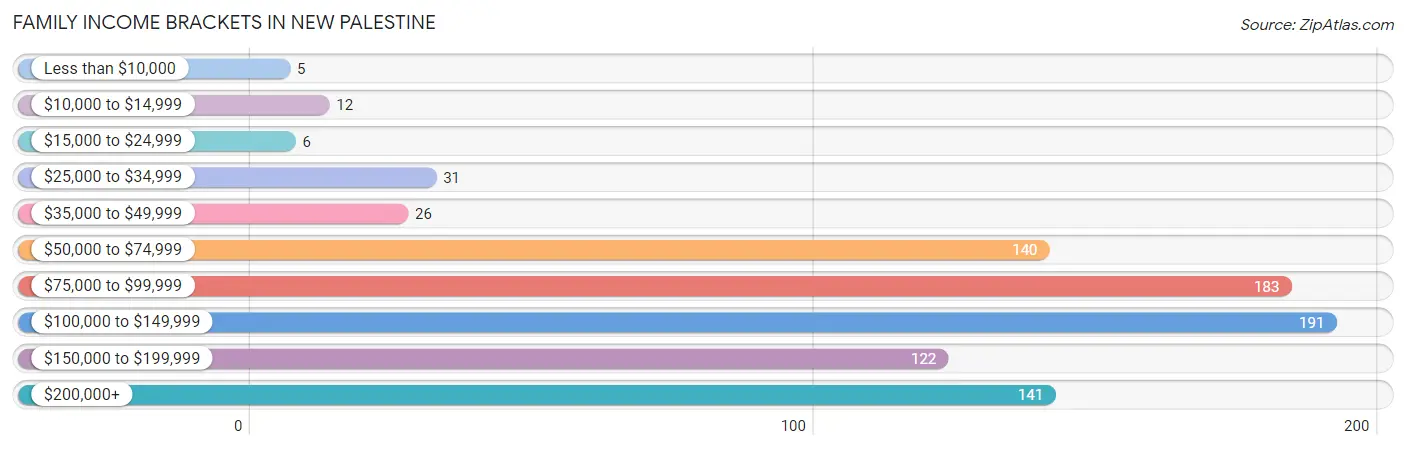
| Income Bracket | # Families | % Families |
| Less than $10,000 | 5 | 0.6% |
| $10,000 to $14,999 | 12 | 1.4% |
| $15,000 to $24,999 | 6 | 0.7% |
| $25,000 to $34,999 | 31 | 3.6% |
| $35,000 to $49,999 | 26 | 3.0% |
| $50,000 to $74,999 | 140 | 16.3% |
| $75,000 to $99,999 | 183 | 21.4% |
| $100,000 to $149,999 | 191 | 22.3% |
| $150,000 to $199,999 | 122 | 14.2% |
| $200,000+ | 141 | 16.5% |
Family Income by Famaliy Size in New Palestine
5-person families (14 | 1.6%) account for the highest median family income in New Palestine with $250,001 per family, while 5-person families (14 | 1.6%) have the highest median income of $50,000 per family member.
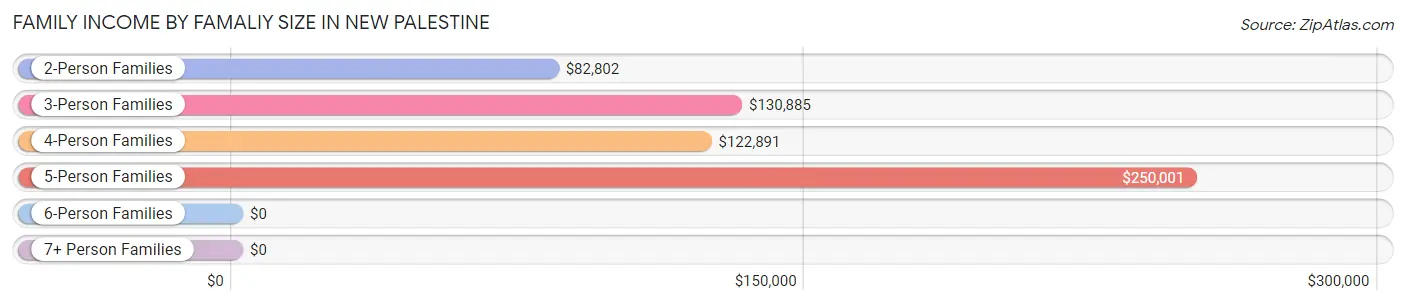
| Income Bracket | # Families | Median Income |
| 2-Person Families | 403 (47.0%) | $82,802 |
| 3-Person Families | 235 (27.4%) | $130,885 |
| 4-Person Families | 205 (23.9%) | $122,891 |
| 5-Person Families | 14 (1.6%) | $250,001 |
| 6-Person Families | 0 (0.0%) | $0 |
| 7+ Person Families | 0 (0.0%) | $0 |
| Total | 857 (100.0%) | $112,596 |
Family Income by Number of Earners in New Palestine
The median family income in New Palestine is $112,596, with families comprising 3+ earners (97) having the highest median family income of $168,438, while families with no earners (108) have the lowest median family income of $66,583, accounting for 11.3% and 12.6% of families, respectively.
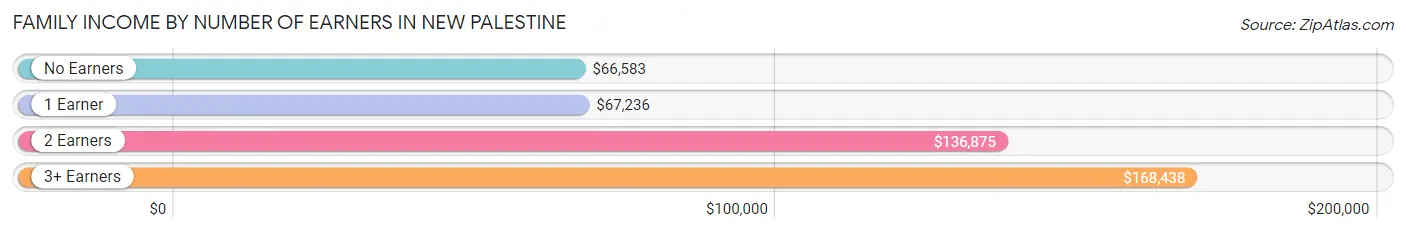
| Number of Earners | # Families | Median Income |
| No Earners | 108 (12.6%) | $66,583 |
| 1 Earner | 231 (27.0%) | $67,236 |
| 2 Earners | 421 (49.1%) | $136,875 |
| 3+ Earners | 97 (11.3%) | $168,438 |
| Total | 857 (100.0%) | $112,596 |
Household Income in New Palestine
Household Income Brackets in New Palestine
With 245 households falling in the category, the $75,000 to $99,999 income range is the most frequent in New Palestine, accounting for 20.4% of all households. In contrast, only 28 households (2.3%) fall into the less than $10,000 income bracket, making it the least populous group.
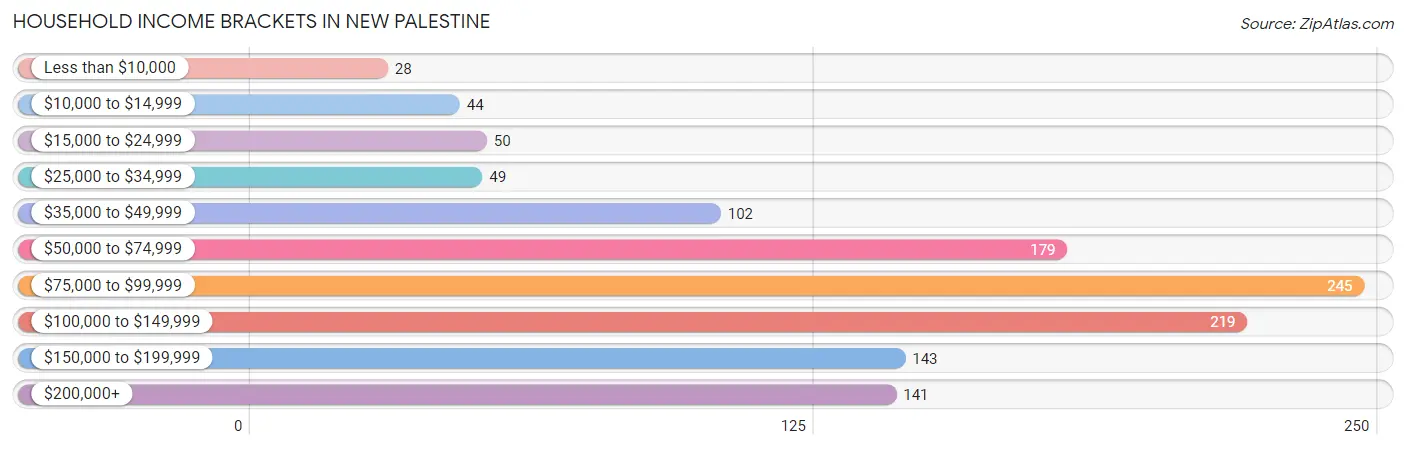
| Income Bracket | # Households | % Households |
| Less than $10,000 | 28 | 2.3% |
| $10,000 to $14,999 | 44 | 3.7% |
| $15,000 to $24,999 | 50 | 4.2% |
| $25,000 to $34,999 | 49 | 4.1% |
| $35,000 to $49,999 | 102 | 8.5% |
| $50,000 to $74,999 | 179 | 14.9% |
| $75,000 to $99,999 | 245 | 20.4% |
| $100,000 to $149,999 | 219 | 18.3% |
| $150,000 to $199,999 | 143 | 11.9% |
| $200,000+ | 141 | 11.8% |
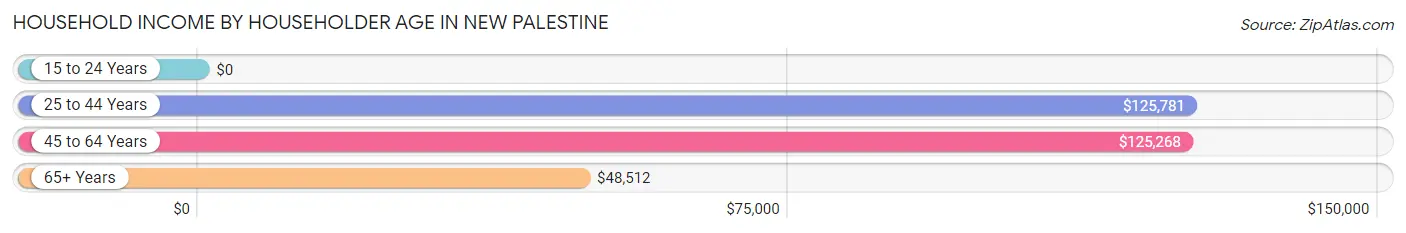
Household Income by Householder Age in New Palestine
The median household income in New Palestine is $86,082, with the highest median household income of $125,781 found in the 25 to 44 years age bracket for the primary householder. A total of 327 households (27.3%) fall into this category.
| Income Bracket | # Households | Median Income |
| 15 to 24 Years | 0 (0.0%) | $0 |
| 25 to 44 Years | 327 (27.3%) | $125,781 |
| 45 to 64 Years | 459 (38.3%) | $125,268 |
| 65+ Years | 413 (34.4%) | $48,512 |
| Total | 1,199 (100.0%) | $86,082 |
Poverty in New Palestine
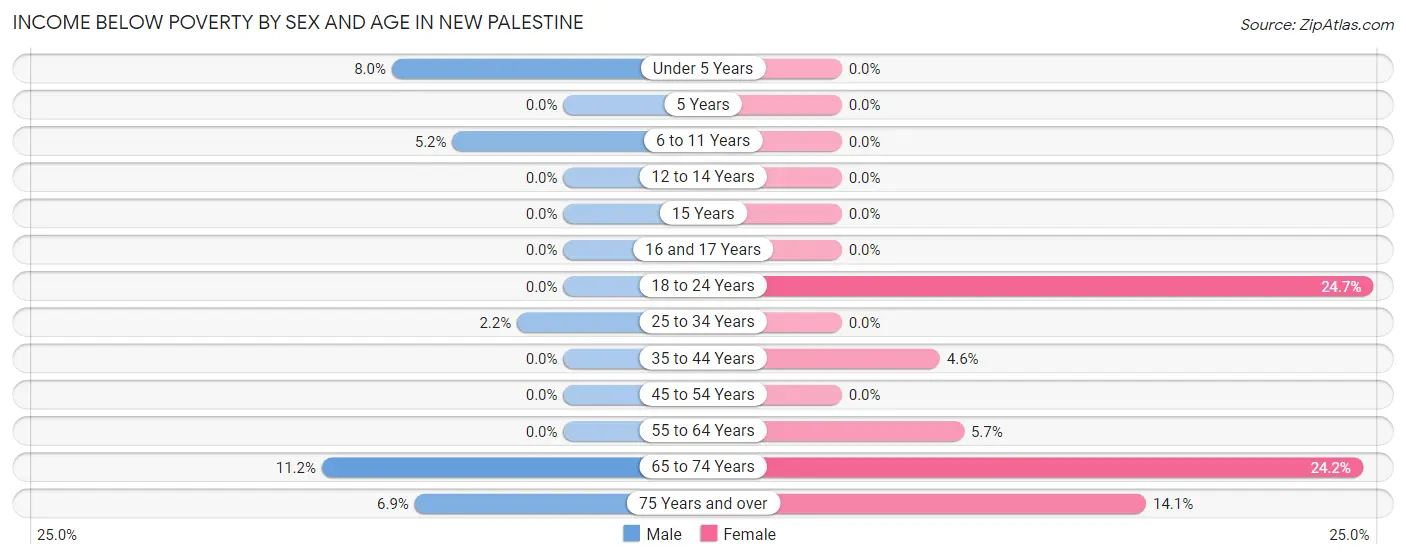
Income Below Poverty by Sex and Age in New Palestine
With 2.6% poverty level for males and 7.5% for females among the residents of New Palestine, 65 to 74 year old males and 18 to 24 year old females are the most vulnerable to poverty, with 12 males (11.2%) and 18 females (24.7%) in their respective age groups living below the poverty level.
| Age Bracket | Male | Female |
| Under 5 Years | 9 (8.0%) | 0 (0.0%) |
| 5 Years | 0 (0.0%) | 0 (0.0%) |
| 6 to 11 Years | 5 (5.1%) | 0 (0.0%) |
| 12 to 14 Years | 0 (0.0%) | 0 (0.0%) |
| 15 Years | 0 (0.0%) | 0 (0.0%) |
| 16 and 17 Years | 0 (0.0%) | 0 (0.0%) |
| 18 to 24 Years | 0 (0.0%) | 18 (24.7%) |
| 25 to 34 Years | 5 (2.1%) | 0 (0.0%) |
| 35 to 44 Years | 0 (0.0%) | 8 (4.5%) |
| 45 to 54 Years | 0 (0.0%) | 0 (0.0%) |
| 55 to 64 Years | 0 (0.0%) | 14 (5.7%) |
| 65 to 74 Years | 12 (11.2%) | 29 (24.2%) |
| 75 Years and over | 6 (6.9%) | 36 (14.1%) |
| Total | 37 (2.6%) | 105 (7.5%) |
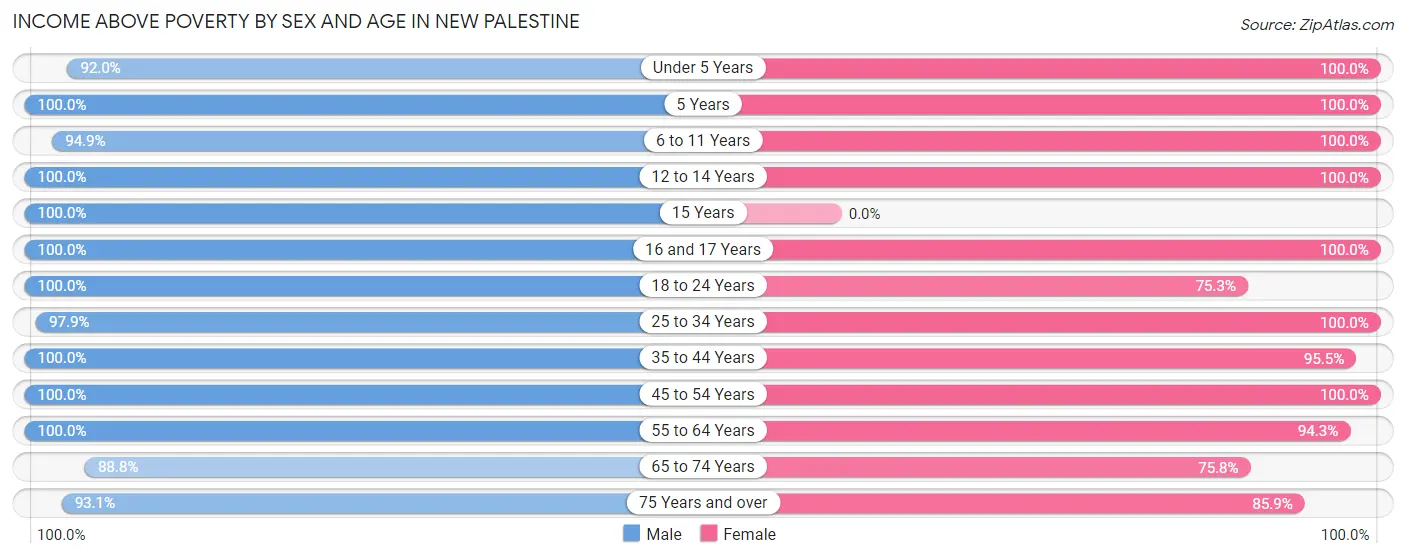
Income Above Poverty by Sex and Age in New Palestine
According to the poverty statistics in New Palestine, males aged 5 years and females aged under 5 years are the age groups that are most secure financially, with 100.0% of males and 100.0% of females in these age groups living above the poverty line.
| Age Bracket | Male | Female |
| Under 5 Years | 104 (92.0%) | 45 (100.0%) |
| 5 Years | 23 (100.0%) | 13 (100.0%) |
| 6 to 11 Years | 92 (94.9%) | 55 (100.0%) |
| 12 to 14 Years | 115 (100.0%) | 38 (100.0%) |
| 15 Years | 12 (100.0%) | 0 (0.0%) |
| 16 and 17 Years | 33 (100.0%) | 33 (100.0%) |
| 18 to 24 Years | 60 (100.0%) | 55 (75.3%) |
| 25 to 34 Years | 228 (97.9%) | 160 (100.0%) |
| 35 to 44 Years | 164 (100.0%) | 168 (95.5%) |
| 45 to 54 Years | 160 (100.0%) | 190 (100.0%) |
| 55 to 64 Years | 203 (100.0%) | 233 (94.3%) |
| 65 to 74 Years | 95 (88.8%) | 91 (75.8%) |
| 75 Years and over | 81 (93.1%) | 219 (85.9%) |
| Total | 1,370 (97.4%) | 1,300 (92.5%) |
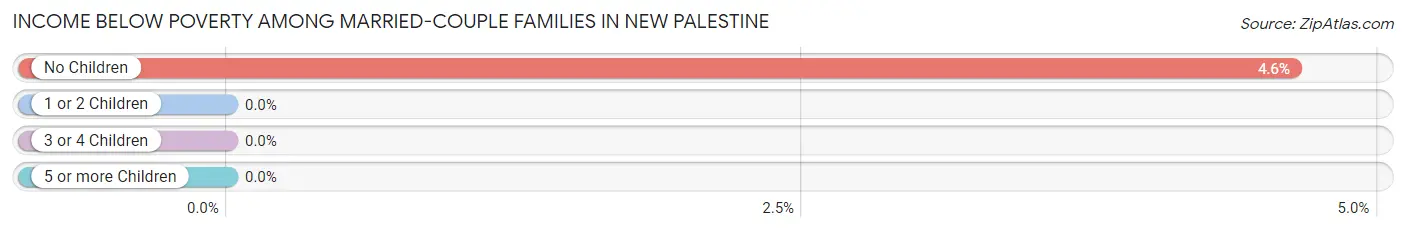
Income Below Poverty Among Married-Couple Families in New Palestine
The poverty statistics for married-couple families in New Palestine show that 2.5% or 18 of the total 715 families live below the poverty line. Families with no children have the highest poverty rate of 4.6%, comprising of 18 families. On the other hand, families with 1 or 2 children have the lowest poverty rate of 0.0%, which includes 0 families.
| Children | Above Poverty | Below Poverty |
| No Children | 371 (95.4%) | 18 (4.6%) |
| 1 or 2 Children | 320 (100.0%) | 0 (0.0%) |
| 3 or 4 Children | 6 (100.0%) | 0 (0.0%) |
| 5 or more Children | 0 (0.0%) | 0 (0.0%) |
| Total | 697 (97.5%) | 18 (2.5%) |
Income Below Poverty Among Single-Parent Households in New Palestine
According to the poverty data in New Palestine, 13.2% or 5 single-father households and 4.8% or 5 single-mother households are living below the poverty line. Among single-father households, those with 3 or 4 children have the highest poverty rate, with 5 households (41.7%) experiencing poverty. Likewise, among single-mother households, those with no children have the highest poverty rate, with 5 households (6.8%) falling below the poverty line.
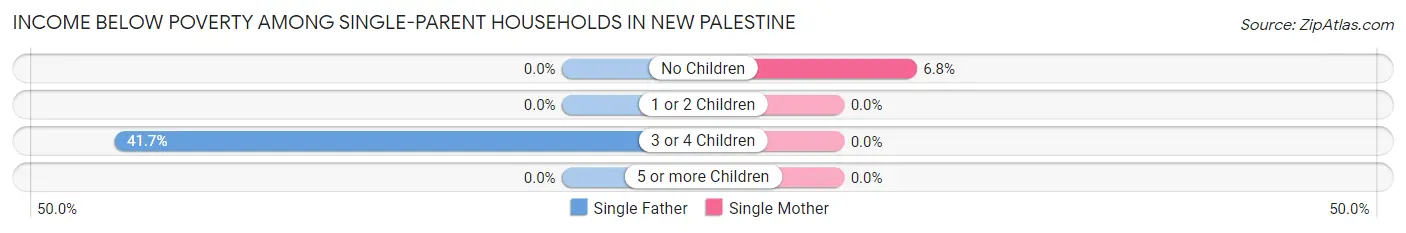
| Children | Single Father | Single Mother |
| No Children | 0 (0.0%) | 5 (6.8%) |
| 1 or 2 Children | 0 (0.0%) | 0 (0.0%) |
| 3 or 4 Children | 5 (41.7%) | 0 (0.0%) |
| 5 or more Children | 0 (0.0%) | 0 (0.0%) |
| Total | 5 (13.2%) | 5 (4.8%) |
Income Below Poverty Among Married-Couple vs Single-Parent Households in New Palestine
The poverty data for New Palestine shows that 18 of the married-couple family households (2.5%) and 10 of the single-parent households (7.0%) are living below the poverty level. Within the married-couple family households, those with no children have the highest poverty rate, with 18 households (4.6%) falling below the poverty line. Among the single-parent households, those with 3 or 4 children have the highest poverty rate, with 5 household (33.3%) living below poverty.
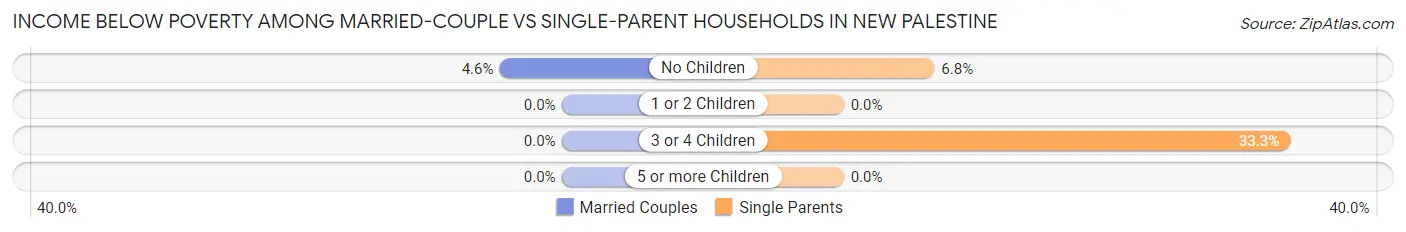
| Children | Married-Couple Families | Single-Parent Households |
| No Children | 18 (4.6%) | 5 (6.8%) |
| 1 or 2 Children | 0 (0.0%) | 0 (0.0%) |
| 3 or 4 Children | 0 (0.0%) | 5 (33.3%) |
| 5 or more Children | 0 (0.0%) | 0 (0.0%) |
| Total | 18 (2.5%) | 10 (7.0%) |
Race in New Palestine
The most populous races in New Palestine are White / Caucasian (2,783 | 98.3%), Two or more Races (41 | 1.5%), and Asian (7 | 0.3%).
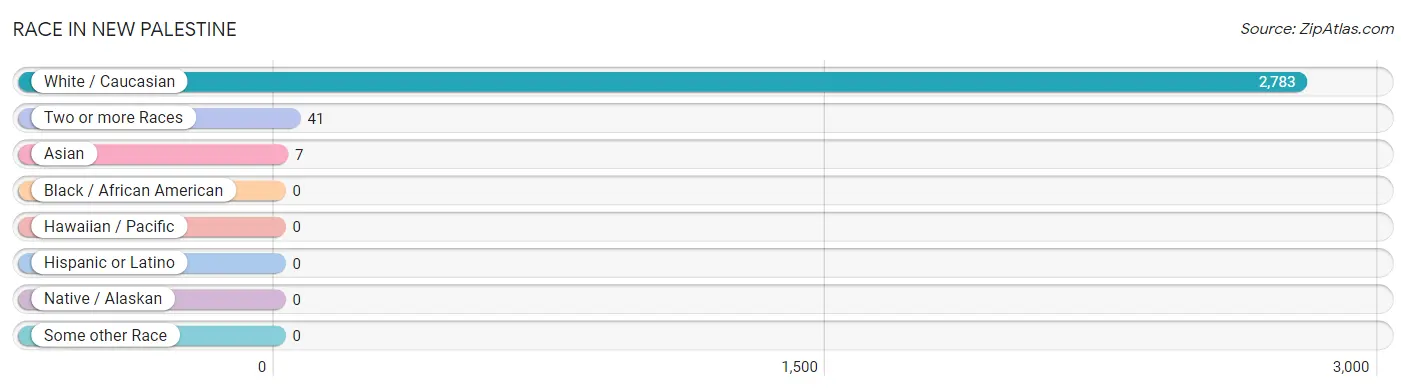
| Race | # Population | % Population |
| Asian | 7 | 0.3% |
| Black / African American | 0 | 0.0% |
| Hawaiian / Pacific | 0 | 0.0% |
| Hispanic or Latino | 0 | 0.0% |
| Native / Alaskan | 0 | 0.0% |
| White / Caucasian | 2,783 | 98.3% |
| Two or more Races | 41 | 1.5% |
| Some other Race | 0 | 0.0% |
| Total | 2,831 | 100.0% |
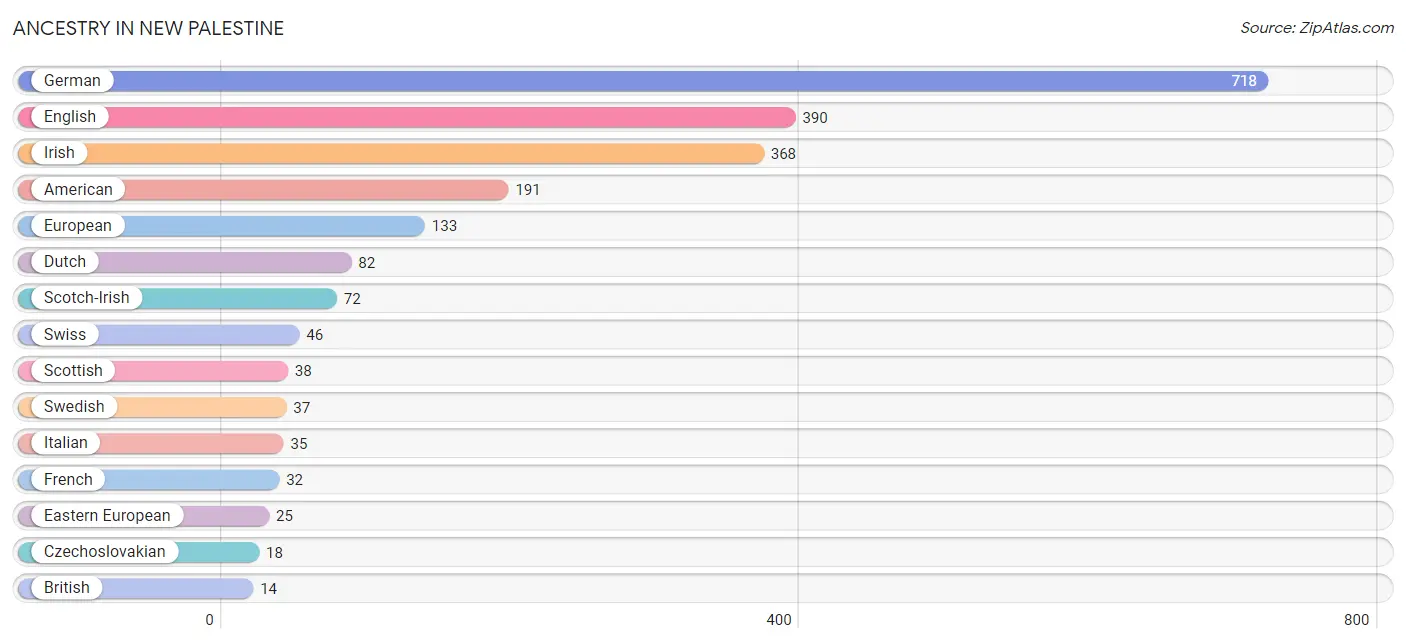
Ancestry in New Palestine
The most populous ancestries reported in New Palestine are German (718 | 25.4%), English (390 | 13.8%), Irish (368 | 13.0%), American (191 | 6.8%), and European (133 | 4.7%), together accounting for 63.6% of all New Palestine residents.
| Ancestry | # Population | % Population |
| American | 191 | 6.8% |
| Belgian | 7 | 0.3% |
| Bhutanese | 4 | 0.1% |
| British | 14 | 0.5% |
| Celtic | 5 | 0.2% |
| Czech | 7 | 0.3% |
| Czechoslovakian | 18 | 0.6% |
| Danish | 9 | 0.3% |
| Dutch | 82 | 2.9% |
| Eastern European | 25 | 0.9% |
| English | 390 | 13.8% |
| European | 133 | 4.7% |
| French | 32 | 1.1% |
| French Canadian | 6 | 0.2% |
| German | 718 | 25.4% |
| Irish | 368 | 13.0% |
| Italian | 35 | 1.2% |
| Laotian | 3 | 0.1% |
| Norwegian | 13 | 0.5% |
| Polish | 10 | 0.4% |
| Russian | 5 | 0.2% |
| Scandinavian | 12 | 0.4% |
| Scotch-Irish | 72 | 2.5% |
| Scottish | 38 | 1.3% |
| Swedish | 37 | 1.3% |
| Swiss | 46 | 1.6% |
| Welsh | 11 | 0.4% | View All 27 Rows |
Immigrants in New Palestine
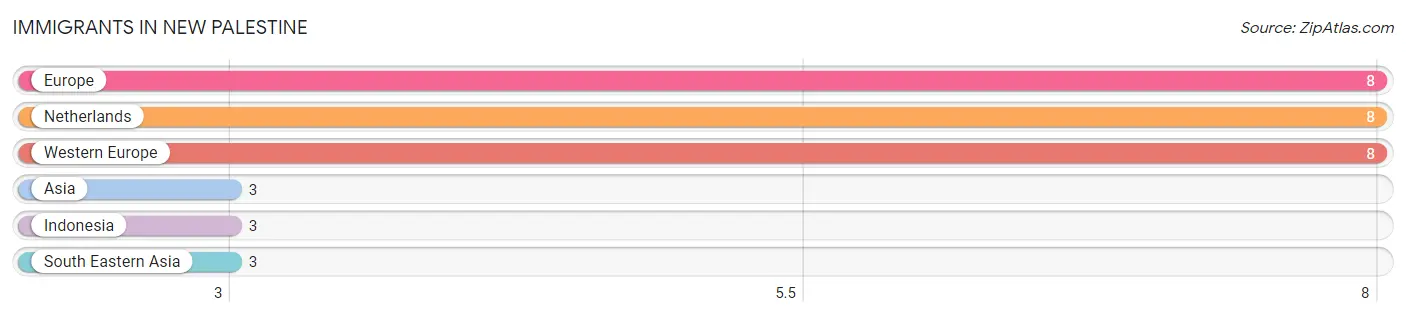
The most numerous immigrant groups reported in New Palestine came from Europe (8 | 0.3%), Netherlands (8 | 0.3%), Western Europe (8 | 0.3%), Asia (3 | 0.1%), and Indonesia (3 | 0.1%), together accounting for 1.1% of all New Palestine residents.
| Immigration Origin | # Population | % Population |
| Asia | 3 | 0.1% |
| Europe | 8 | 0.3% |
| Indonesia | 3 | 0.1% |
| Netherlands | 8 | 0.3% |
| South Eastern Asia | 3 | 0.1% |
| Western Europe | 8 | 0.3% | View All 6 Rows |
Sex and Age in New Palestine
Sex and Age in New Palestine
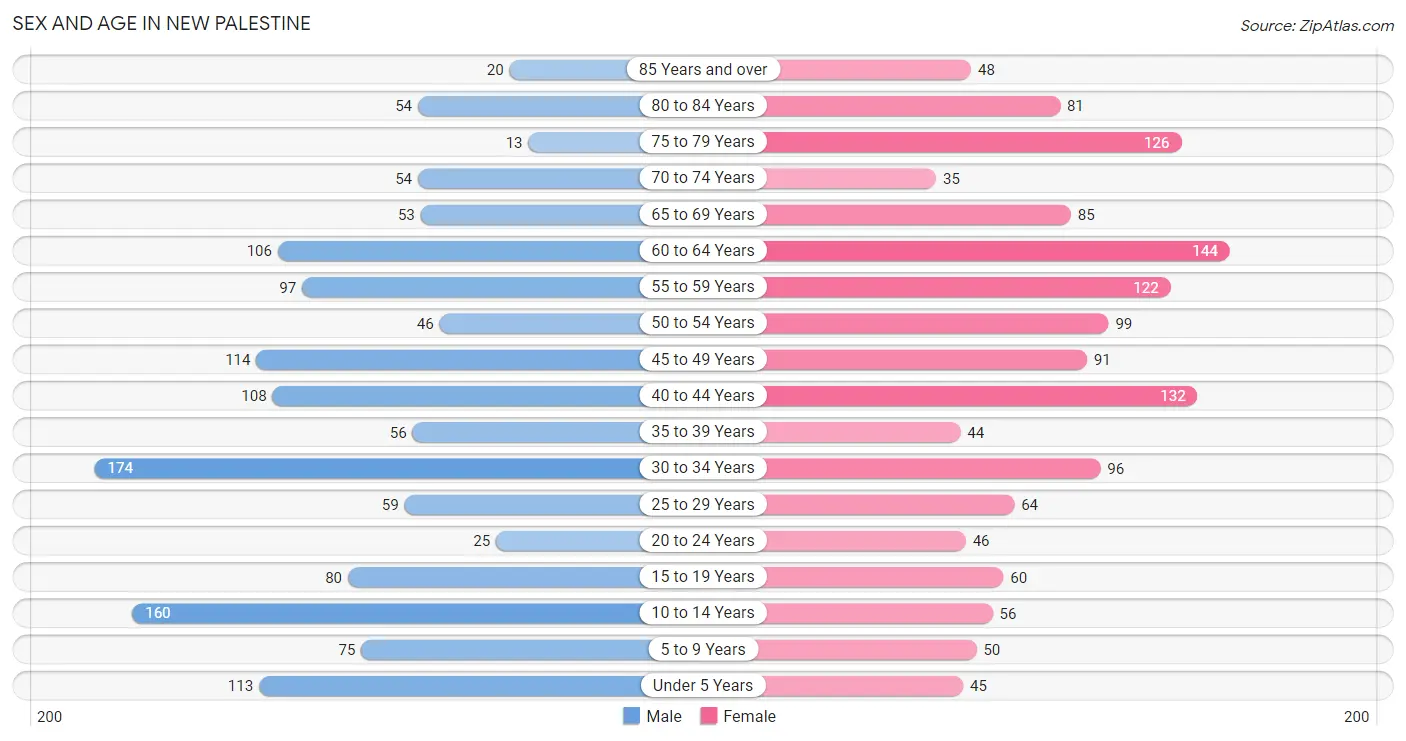
The most populous age groups in New Palestine are 30 to 34 Years (174 | 12.4%) for men and 60 to 64 Years (144 | 10.1%) for women.
| Age Bracket | Male | Female |
| Under 5 Years | 113 (8.0%) | 45 (3.2%) |
| 5 to 9 Years | 75 (5.3%) | 50 (3.5%) |
| 10 to 14 Years | 160 (11.4%) | 56 (3.9%) |
| 15 to 19 Years | 80 (5.7%) | 60 (4.2%) |
| 20 to 24 Years | 25 (1.8%) | 46 (3.2%) |
| 25 to 29 Years | 59 (4.2%) | 64 (4.5%) |
| 30 to 34 Years | 174 (12.4%) | 96 (6.7%) |
| 35 to 39 Years | 56 (4.0%) | 44 (3.1%) |
| 40 to 44 Years | 108 (7.7%) | 132 (9.3%) |
| 45 to 49 Years | 114 (8.1%) | 91 (6.4%) |
| 50 to 54 Years | 46 (3.3%) | 99 (7.0%) |
| 55 to 59 Years | 97 (6.9%) | 122 (8.6%) |
| 60 to 64 Years | 106 (7.5%) | 144 (10.1%) |
| 65 to 69 Years | 53 (3.8%) | 85 (6.0%) |
| 70 to 74 Years | 54 (3.8%) | 35 (2.5%) |
| 75 to 79 Years | 13 (0.9%) | 126 (8.8%) |
| 80 to 84 Years | 54 (3.8%) | 81 (5.7%) |
| 85 Years and over | 20 (1.4%) | 48 (3.4%) |
| Total | 1,407 (100.0%) | 1,424 (100.0%) |
Families and Households in New Palestine
Median Family Size in New Palestine
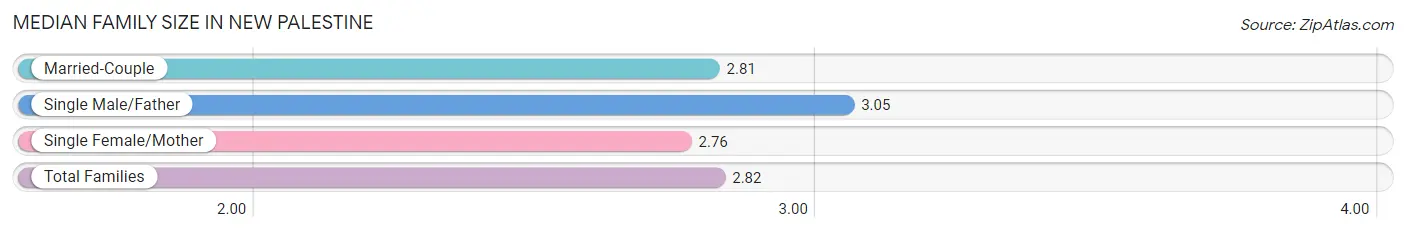
The median family size in New Palestine is 2.82 persons per family, with single male/father families (38 | 4.4%) accounting for the largest median family size of 3.05 persons per family. On the other hand, single female/mother families (104 | 12.1%) represent the smallest median family size with 2.76 persons per family.
| Family Type | # Families | Family Size |
| Married-Couple | 715 (83.4%) | 2.81 |
| Single Male/Father | 38 (4.4%) | 3.05 |
| Single Female/Mother | 104 (12.1%) | 2.76 |
| Total Families | 857 (100.0%) | 2.82 |
Median Household Size in New Palestine
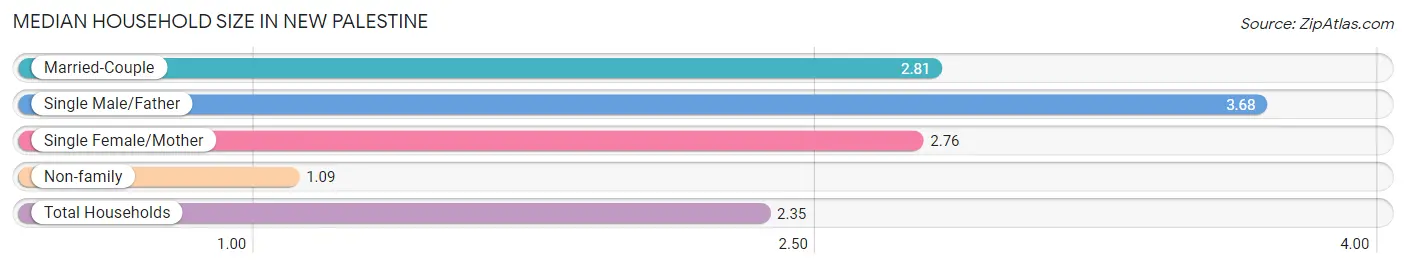
The median household size in New Palestine is 2.35 persons per household, with single male/father households (38 | 3.2%) accounting for the largest median household size of 3.68 persons per household. non-family households (342 | 28.5%) represent the smallest median household size with 1.09 persons per household.
| Household Type | # Households | Household Size |
| Married-Couple | 715 (59.6%) | 2.81 |
| Single Male/Father | 38 (3.2%) | 3.68 |
| Single Female/Mother | 104 (8.7%) | 2.76 |
| Non-family | 342 (28.5%) | 1.09 |
| Total Households | 1,199 (100.0%) | 2.35 |
Household Size by Marriage Status in New Palestine
Out of a total of 1,199 households in New Palestine, 857 (71.5%) are family households, while 342 (28.5%) are nonfamily households. The most numerous type of family households are 2-person households, comprising 403, and the most common type of nonfamily households are 1-person households, comprising 313.
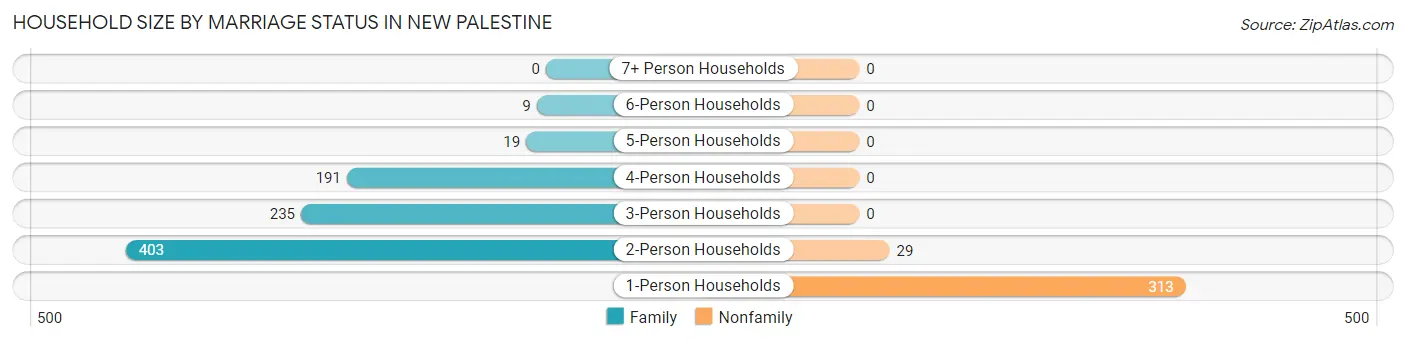
| Household Size | Family Households | Nonfamily Households |
| 1-Person Households | - | 313 (26.1%) |
| 2-Person Households | 403 (33.6%) | 29 (2.4%) |
| 3-Person Households | 235 (19.6%) | 0 (0.0%) |
| 4-Person Households | 191 (15.9%) | 0 (0.0%) |
| 5-Person Households | 19 (1.6%) | 0 (0.0%) |
| 6-Person Households | 9 (0.7%) | 0 (0.0%) |
| 7+ Person Households | 0 (0.0%) | 0 (0.0%) |
| Total | 857 (71.5%) | 342 (28.5%) |
Female Fertility in New Palestine
Fertility by Age in New Palestine
Average fertility rate in New Palestine is 87.0 births per 1,000 women. Women in the age bracket of 20 to 34 years have the highest fertility rate with 175.0 births per 1,000 women. Women in the age bracket of 20 to 34 years acount for 76.6% of all women with births.
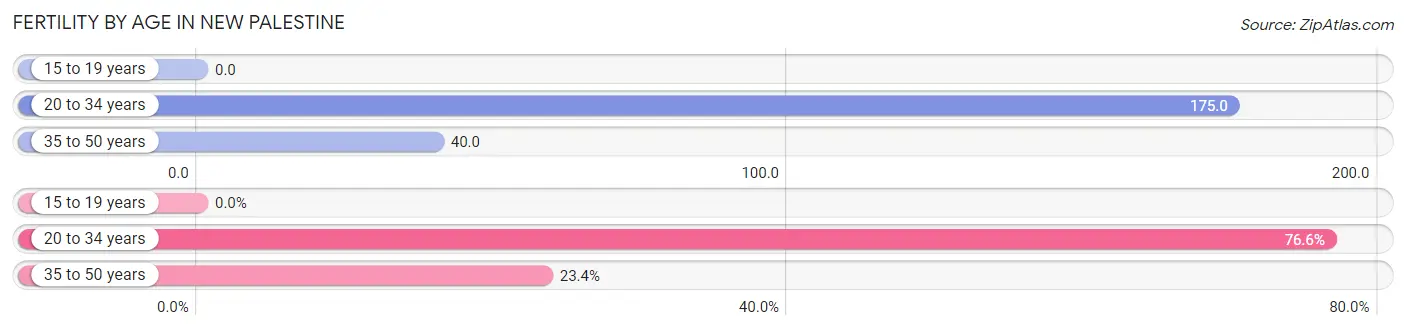
| Age Bracket | Women with Births | Births / 1,000 Women |
| 15 to 19 years | 0 (0.0%) | 0.0 |
| 20 to 34 years | 36 (76.6%) | 175.0 |
| 35 to 50 years | 11 (23.4%) | 40.0 |
| Total | 47 (100.0%) | 87.0 |
Fertility by Age by Marriage Status in New Palestine
83.0% of women with births (47) in New Palestine are married. The highest percentage of unmarried women with births falls into 20 to 34 years age bracket with 22.2% of them unmarried at the time of birth, while the lowest percentage of unmarried women with births belong to 35 to 50 years age bracket with 0.0% of them unmarried.
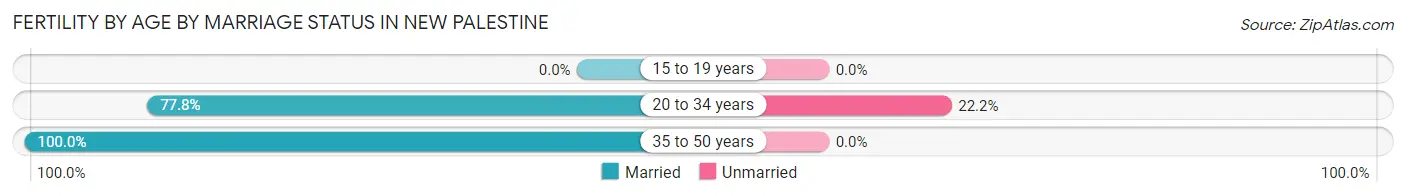
| Age Bracket | Married | Unmarried |
| 15 to 19 years | 0 (0.0%) | 0 (0.0%) |
| 20 to 34 years | 28 (77.8%) | 8 (22.2%) |
| 35 to 50 years | 11 (100.0%) | 0 (0.0%) |
| Total | 39 (83.0%) | 8 (17.0%) |
Fertility by Education in New Palestine
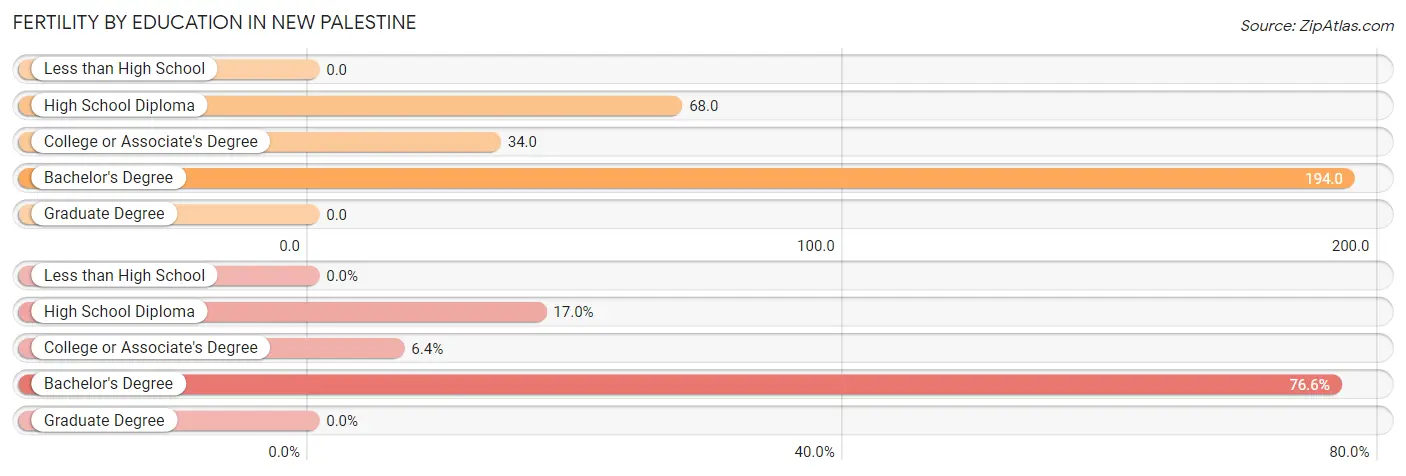
| Educational Attainment | Women with Births | Births / 1,000 Women |
| Less than High School | 0 (0.0%) | 0.0 |
| High School Diploma | 8 (17.0%) | 68.0 |
| College or Associate's Degree | 3 (6.4%) | 34.0 |
| Bachelor's Degree | 36 (76.6%) | 194.0 |
| Graduate Degree | 0 (0.0%) | 0.0 |
| Total | 47 (100.0%) | 87.0 |
Fertility by Education by Marriage Status in New Palestine
17.0% of women with births in New Palestine are unmarried. Women with the educational attainment of college or associate's degree are most likely to be married with 100.0% of them married at childbirth, while women with the educational attainment of high school diploma are least likely to be married with 100.0% of them unmarried at childbirth.
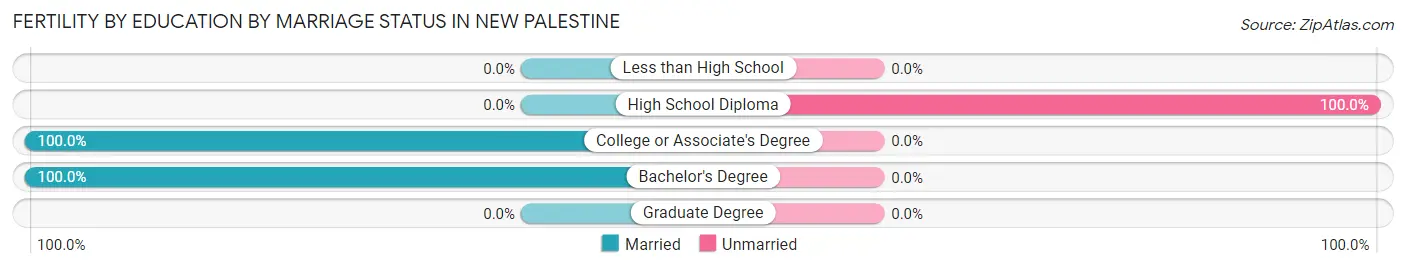
| Educational Attainment | Married | Unmarried |
| Less than High School | 0 (0.0%) | 0 (0.0%) |
| High School Diploma | 0 (0.0%) | 8 (100.0%) |
| College or Associate's Degree | 3 (100.0%) | 0 (0.0%) |
| Bachelor's Degree | 36 (100.0%) | 0 (0.0%) |
| Graduate Degree | 0 (0.0%) | 0 (0.0%) |
| Total | 39 (83.0%) | 8 (17.0%) |
Employment Characteristics in New Palestine
Employment by Class of Employer in New Palestine
Among the 1,502 employed individuals in New Palestine, private company employees (870 | 57.9%), not-for-profit organizations (205 | 13.7%), and local government employees (121 | 8.1%) make up the most common classes of employment.
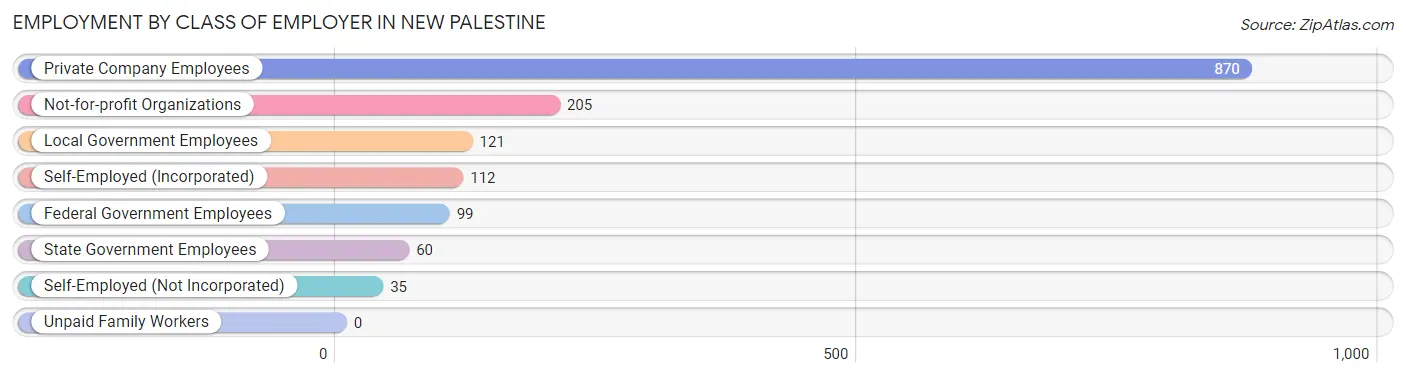
| Employer Class | # Employees | % Employees |
| Private Company Employees | 870 | 57.9% |
| Self-Employed (Incorporated) | 112 | 7.5% |
| Self-Employed (Not Incorporated) | 35 | 2.3% |
| Not-for-profit Organizations | 205 | 13.7% |
| Local Government Employees | 121 | 8.1% |
| State Government Employees | 60 | 4.0% |
| Federal Government Employees | 99 | 6.6% |
| Unpaid Family Workers | 0 | 0.0% |
| Total | 1,502 | 100.0% |
Employment Status by Age in New Palestine
According to the labor force statistics for New Palestine, out of the total population over 16 years of age (2,320), 68.1% or 1,580 individuals are in the labor force, with 5.0% or 79 of them unemployed. The age group with the highest labor force participation rate is 25 to 29 years, with 100.0% or 123 individuals in the labor force. Within the labor force, the 30 to 34 years age range has the highest percentage of unemployed individuals, with 25.2% or 68 of them being unemployed.
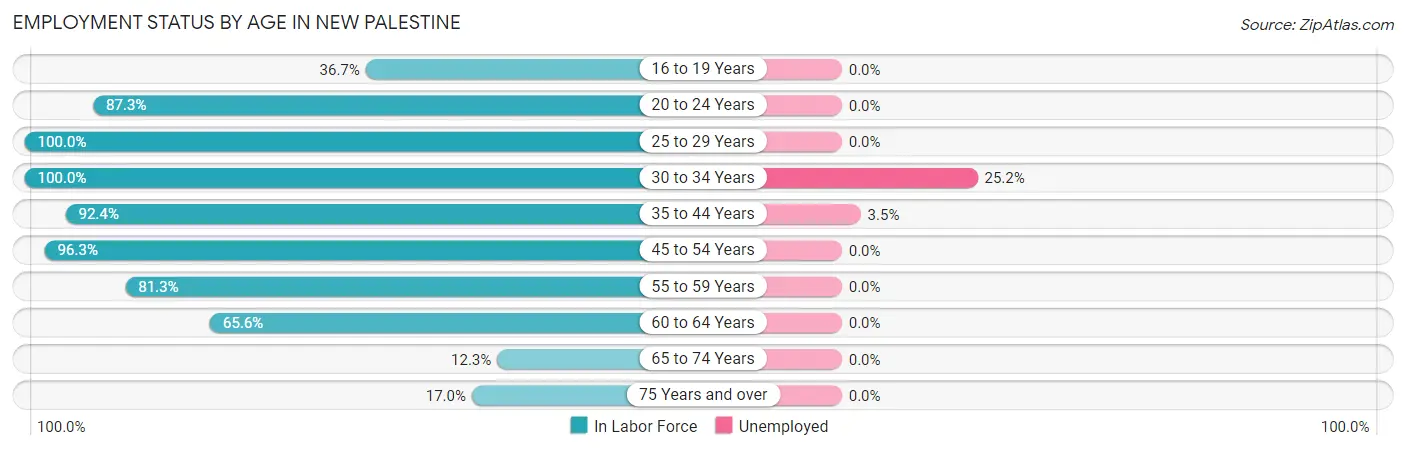
| Age Bracket | In Labor Force | Unemployed |
| 16 to 19 Years | 47 (36.7%) | 0 (0.0%) |
| 20 to 24 Years | 62 (87.3%) | 0 (0.0%) |
| 25 to 29 Years | 123 (100.0%) | 0 (0.0%) |
| 30 to 34 Years | 270 (100.0%) | 68 (25.2%) |
| 35 to 44 Years | 314 (92.4%) | 11 (3.5%) |
| 45 to 54 Years | 337 (96.3%) | 0 (0.0%) |
| 55 to 59 Years | 178 (81.3%) | 0 (0.0%) |
| 60 to 64 Years | 164 (65.6%) | 0 (0.0%) |
| 65 to 74 Years | 28 (12.3%) | 0 (0.0%) |
| 75 Years and over | 58 (17.0%) | 0 (0.0%) |
| Total | 1,580 (68.1%) | 79 (5.0%) |
Employment Status by Educational Attainment in New Palestine
According to labor force statistics for New Palestine, 89.3% of individuals (1,386) out of the total population between 25 and 64 years of age (1,552) are in the labor force, with 5.7% or 79 of them being unemployed. The group with the highest labor force participation rate are those with the educational attainment of bachelor's degree or higher, with 95.6% or 655 individuals in the labor force. Within the labor force, individuals with high school diploma education have the highest percentage of unemployment, with 16.9% or 68 of them being unemployed.
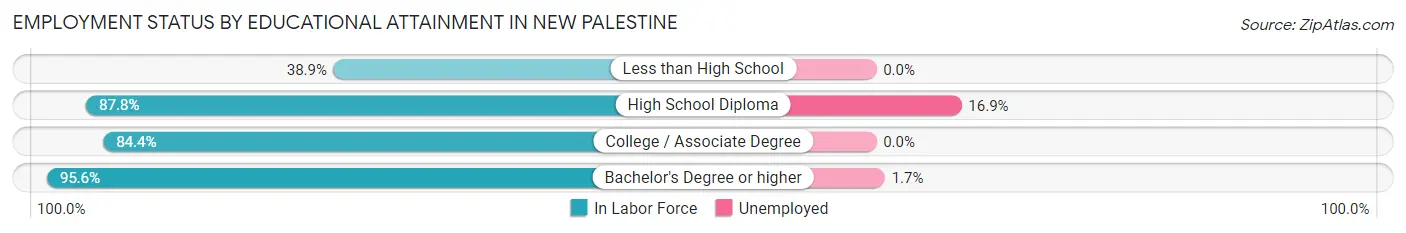
| Educational Attainment | In Labor Force | Unemployed |
| Less than High School | 14 (38.9%) | 0 (0.0%) |
| High School Diploma | 403 (87.8%) | 78 (16.9%) |
| College / Associate Degree | 314 (84.4%) | 0 (0.0%) |
| Bachelor's Degree or higher | 655 (95.6%) | 12 (1.7%) |
| Total | 1,386 (89.3%) | 88 (5.7%) |
Employment Occupations by Sex in New Palestine
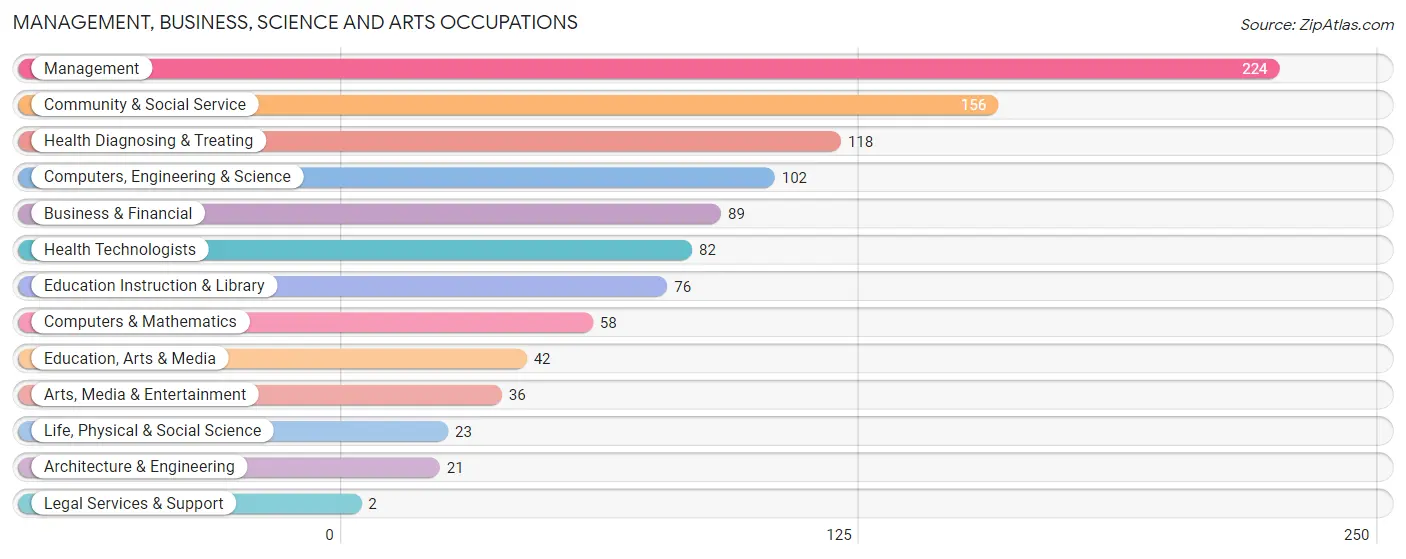
Management, Business, Science and Arts Occupations
The most common Management, Business, Science and Arts occupations in New Palestine are Management (224 | 14.9%), Community & Social Service (156 | 10.4%), Health Diagnosing & Treating (118 | 7.9%), Computers, Engineering & Science (102 | 6.8%), and Business & Financial (89 | 5.9%).
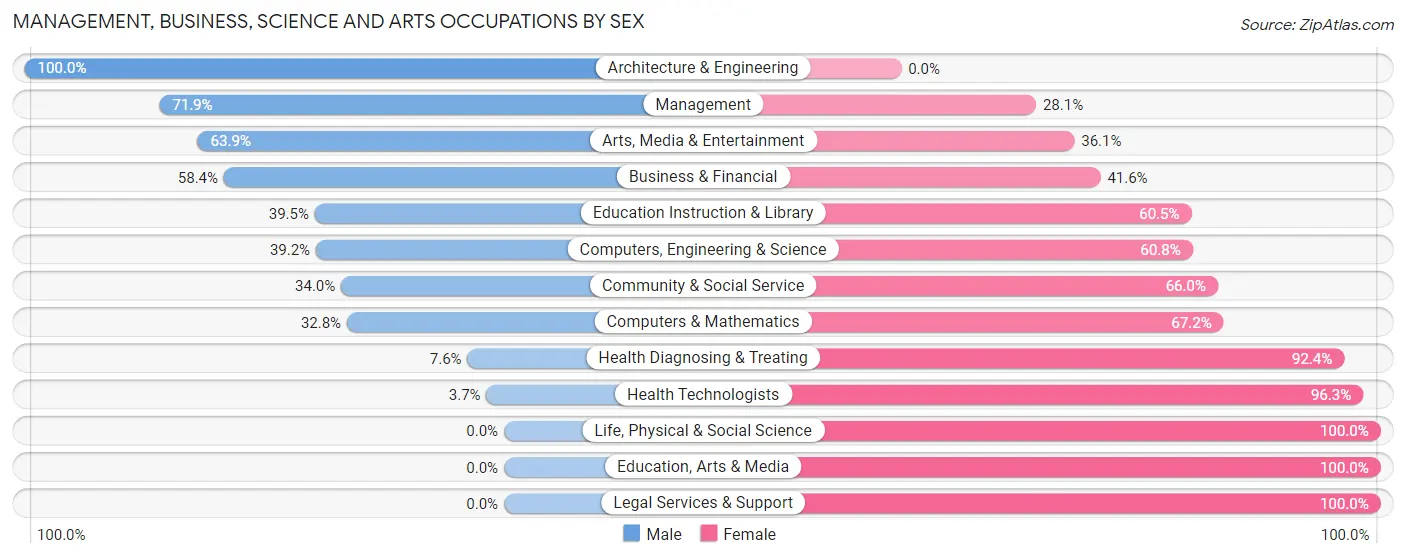
Management, Business, Science and Arts Occupations by Sex
Within the Management, Business, Science and Arts occupations in New Palestine, the most male-oriented occupations are Architecture & Engineering (100.0%), Management (71.9%), and Arts, Media & Entertainment (63.9%), while the most female-oriented occupations are Life, Physical & Social Science (100.0%), Education, Arts & Media (100.0%), and Legal Services & Support (100.0%).
| Occupation | Male | Female |
| Management | 161 (71.9%) | 63 (28.1%) |
| Business & Financial | 52 (58.4%) | 37 (41.6%) |
| Computers, Engineering & Science | 40 (39.2%) | 62 (60.8%) |
| Computers & Mathematics | 19 (32.8%) | 39 (67.2%) |
| Architecture & Engineering | 21 (100.0%) | 0 (0.0%) |
| Life, Physical & Social Science | 0 (0.0%) | 23 (100.0%) |
| Community & Social Service | 53 (34.0%) | 103 (66.0%) |
| Education, Arts & Media | 0 (0.0%) | 42 (100.0%) |
| Legal Services & Support | 0 (0.0%) | 2 (100.0%) |
| Education Instruction & Library | 30 (39.5%) | 46 (60.5%) |
| Arts, Media & Entertainment | 23 (63.9%) | 13 (36.1%) |
| Health Diagnosing & Treating | 9 (7.6%) | 109 (92.4%) |
| Health Technologists | 3 (3.7%) | 79 (96.3%) |
| Total (Category) | 315 (45.7%) | 374 (54.3%) |
| Total (Overall) | 684 (45.5%) | 818 (54.5%) |
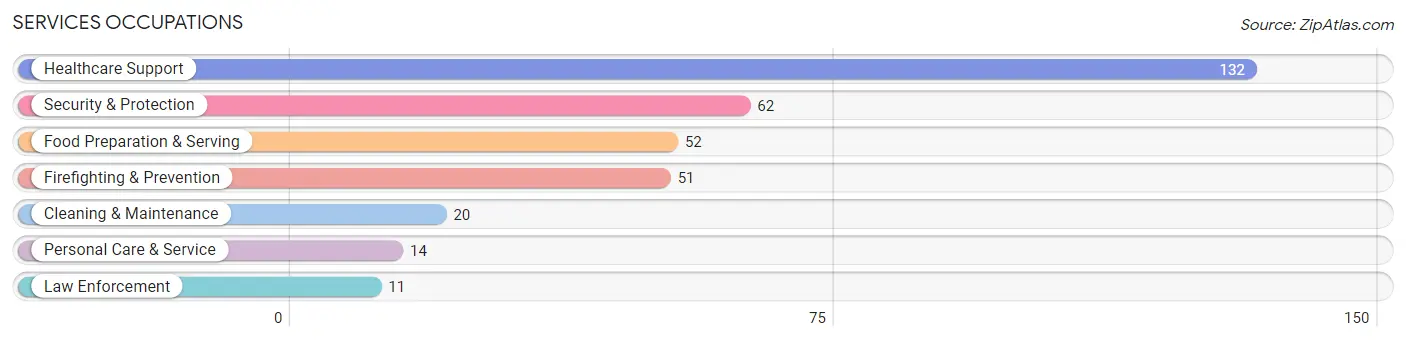
Services Occupations
The most common Services occupations in New Palestine are Healthcare Support (132 | 8.8%), Security & Protection (62 | 4.1%), Food Preparation & Serving (52 | 3.5%), Firefighting & Prevention (51 | 3.4%), and Cleaning & Maintenance (20 | 1.3%).
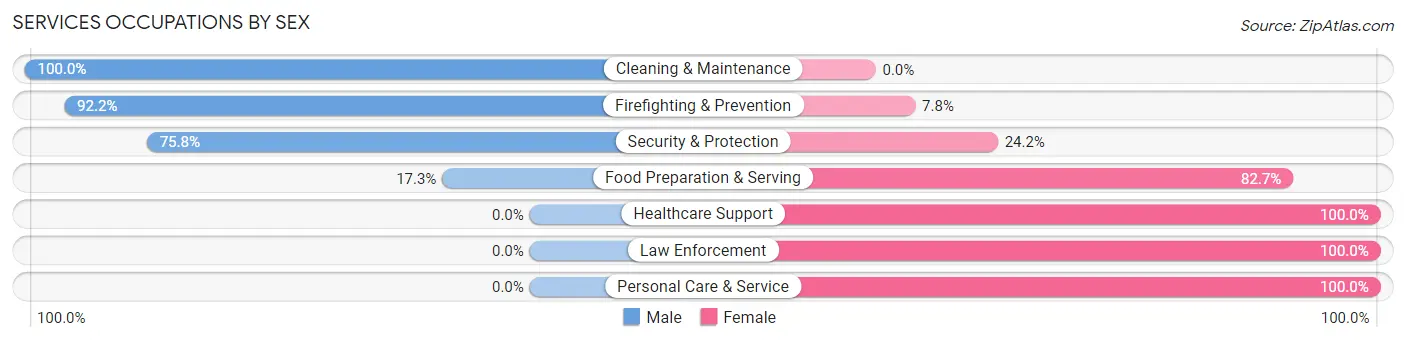
Services Occupations by Sex
Within the Services occupations in New Palestine, the most male-oriented occupations are Cleaning & Maintenance (100.0%), Firefighting & Prevention (92.2%), and Security & Protection (75.8%), while the most female-oriented occupations are Healthcare Support (100.0%), Law Enforcement (100.0%), and Personal Care & Service (100.0%).
| Occupation | Male | Female |
| Healthcare Support | 0 (0.0%) | 132 (100.0%) |
| Security & Protection | 47 (75.8%) | 15 (24.2%) |
| Firefighting & Prevention | 47 (92.2%) | 4 (7.8%) |
| Law Enforcement | 0 (0.0%) | 11 (100.0%) |
| Food Preparation & Serving | 9 (17.3%) | 43 (82.7%) |
| Cleaning & Maintenance | 20 (100.0%) | 0 (0.0%) |
| Personal Care & Service | 0 (0.0%) | 14 (100.0%) |
| Total (Category) | 76 (27.1%) | 204 (72.9%) |
| Total (Overall) | 684 (45.5%) | 818 (54.5%) |
Sales and Office Occupations
The most common Sales and Office occupations in New Palestine are Office & Administration (221 | 14.7%), and Sales & Related (115 | 7.7%).

Sales and Office Occupations by Sex

| Occupation | Male | Female |
| Sales & Related | 87 (75.6%) | 28 (24.3%) |
| Office & Administration | 43 (19.5%) | 178 (80.5%) |
| Total (Category) | 130 (38.7%) | 206 (61.3%) |
| Total (Overall) | 684 (45.5%) | 818 (54.5%) |
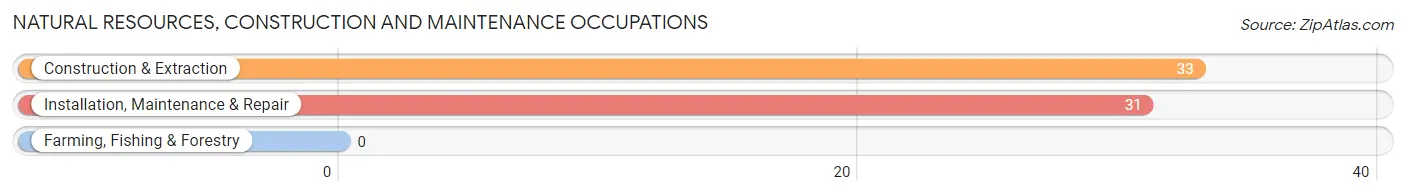
Natural Resources, Construction and Maintenance Occupations
The most common Natural Resources, Construction and Maintenance occupations in New Palestine are Construction & Extraction (33 | 2.2%), and Installation, Maintenance & Repair (31 | 2.1%).
Natural Resources, Construction and Maintenance Occupations by Sex
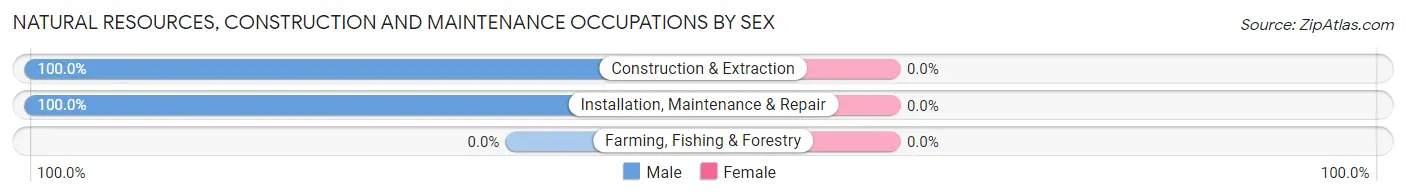
| Occupation | Male | Female |
| Farming, Fishing & Forestry | 0 (0.0%) | 0 (0.0%) |
| Construction & Extraction | 33 (100.0%) | 0 (0.0%) |
| Installation, Maintenance & Repair | 31 (100.0%) | 0 (0.0%) |
| Total (Category) | 64 (100.0%) | 0 (0.0%) |
| Total (Overall) | 684 (45.5%) | 818 (54.5%) |
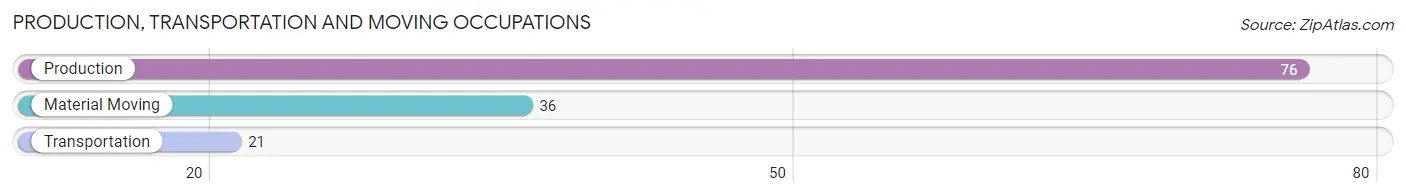
Production, Transportation and Moving Occupations
The most common Production, Transportation and Moving occupations in New Palestine are Production (76 | 5.1%), Material Moving (36 | 2.4%), and Transportation (21 | 1.4%).
Production, Transportation and Moving Occupations by Sex
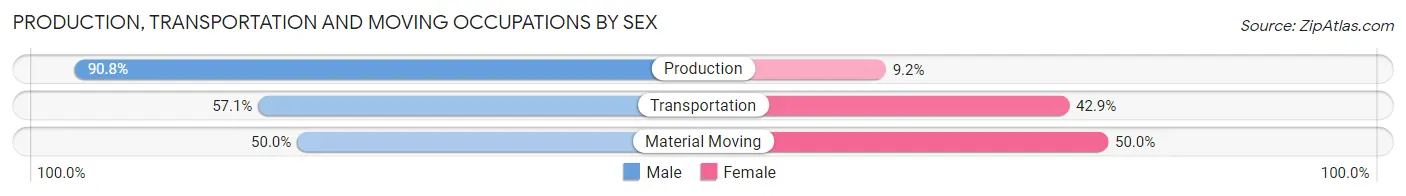
| Occupation | Male | Female |
| Production | 69 (90.8%) | 7 (9.2%) |
| Transportation | 12 (57.1%) | 9 (42.9%) |
| Material Moving | 18 (50.0%) | 18 (50.0%) |
| Total (Category) | 99 (74.4%) | 34 (25.6%) |
| Total (Overall) | 684 (45.5%) | 818 (54.5%) |
Employment Industries by Sex in New Palestine
Employment Industries in New Palestine
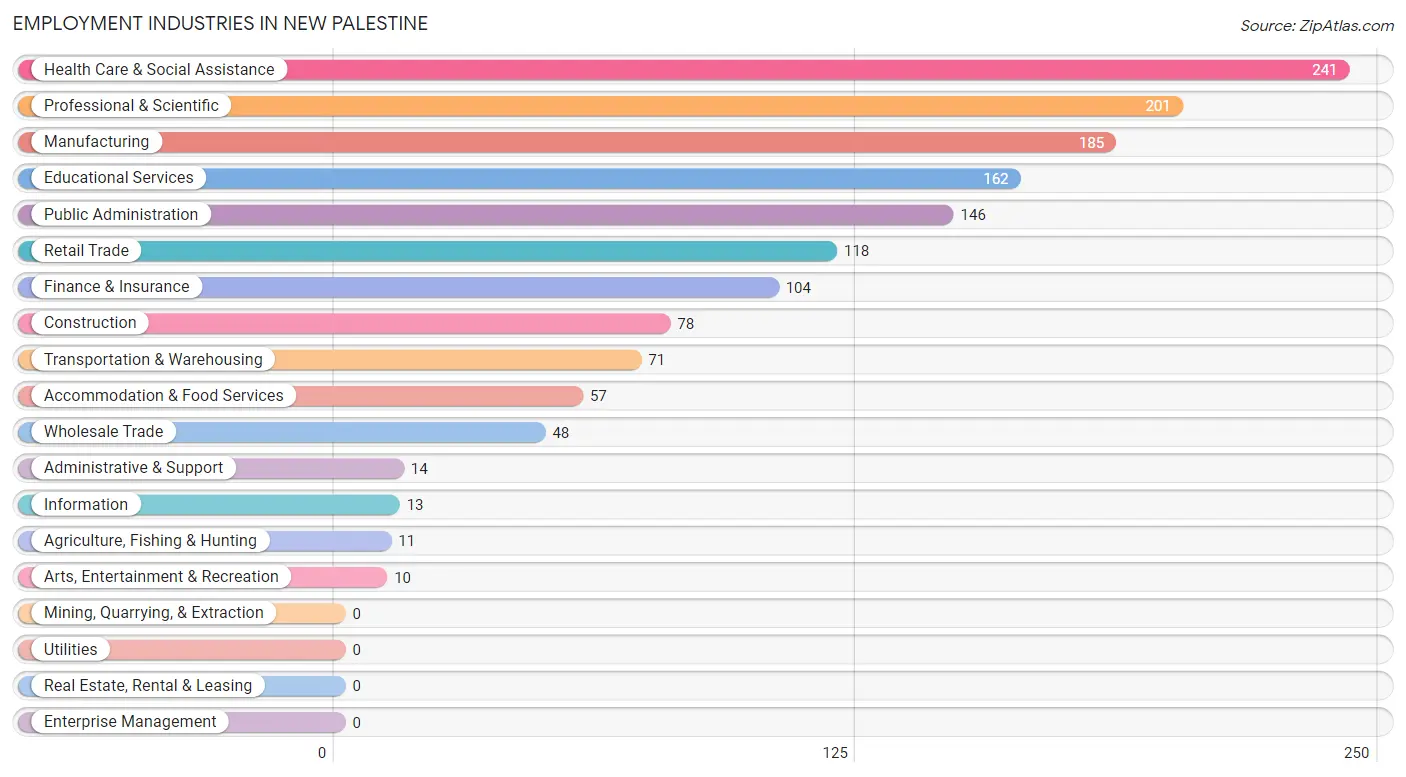
The major employment industries in New Palestine include Health Care & Social Assistance (241 | 16.1%), Professional & Scientific (201 | 13.4%), Manufacturing (185 | 12.3%), Educational Services (162 | 10.8%), and Public Administration (146 | 9.7%).
Employment Industries by Sex in New Palestine
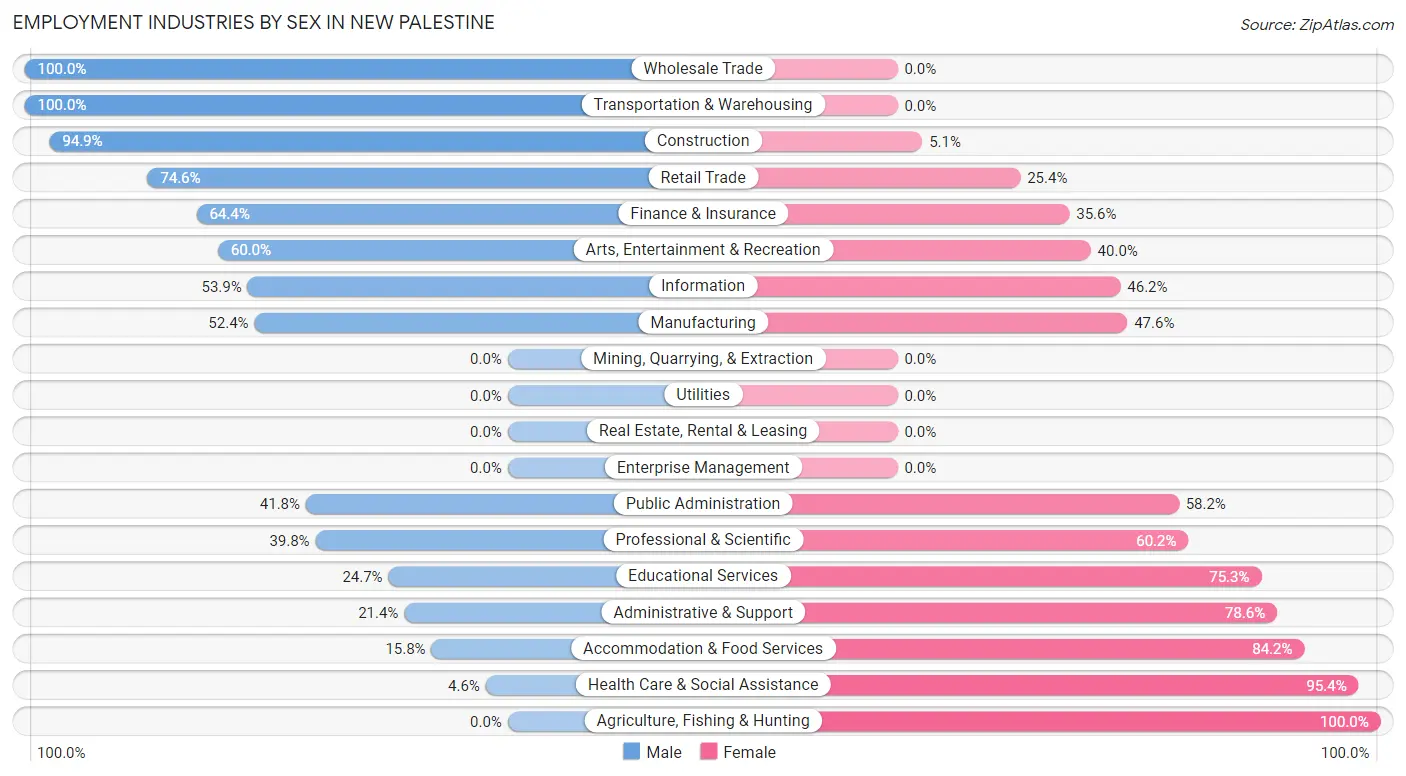
The New Palestine industries that see more men than women are Wholesale Trade (100.0%), Transportation & Warehousing (100.0%), and Construction (94.9%), whereas the industries that tend to have a higher number of women are Agriculture, Fishing & Hunting (100.0%), Health Care & Social Assistance (95.4%), and Accommodation & Food Services (84.2%).
| Industry | Male | Female |
| Agriculture, Fishing & Hunting | 0 (0.0%) | 11 (100.0%) |
| Mining, Quarrying, & Extraction | 0 (0.0%) | 0 (0.0%) |
| Construction | 74 (94.9%) | 4 (5.1%) |
| Manufacturing | 97 (52.4%) | 88 (47.6%) |
| Wholesale Trade | 48 (100.0%) | 0 (0.0%) |
| Retail Trade | 88 (74.6%) | 30 (25.4%) |
| Transportation & Warehousing | 71 (100.0%) | 0 (0.0%) |
| Utilities | 0 (0.0%) | 0 (0.0%) |
| Information | 7 (53.8%) | 6 (46.2%) |
| Finance & Insurance | 67 (64.4%) | 37 (35.6%) |
| Real Estate, Rental & Leasing | 0 (0.0%) | 0 (0.0%) |
| Professional & Scientific | 80 (39.8%) | 121 (60.2%) |
| Enterprise Management | 0 (0.0%) | 0 (0.0%) |
| Administrative & Support | 3 (21.4%) | 11 (78.6%) |
| Educational Services | 40 (24.7%) | 122 (75.3%) |
| Health Care & Social Assistance | 11 (4.6%) | 230 (95.4%) |
| Arts, Entertainment & Recreation | 6 (60.0%) | 4 (40.0%) |
| Accommodation & Food Services | 9 (15.8%) | 48 (84.2%) |
| Public Administration | 61 (41.8%) | 85 (58.2%) |
| Total | 684 (45.5%) | 818 (54.5%) |
Education in New Palestine
School Enrollment in New Palestine
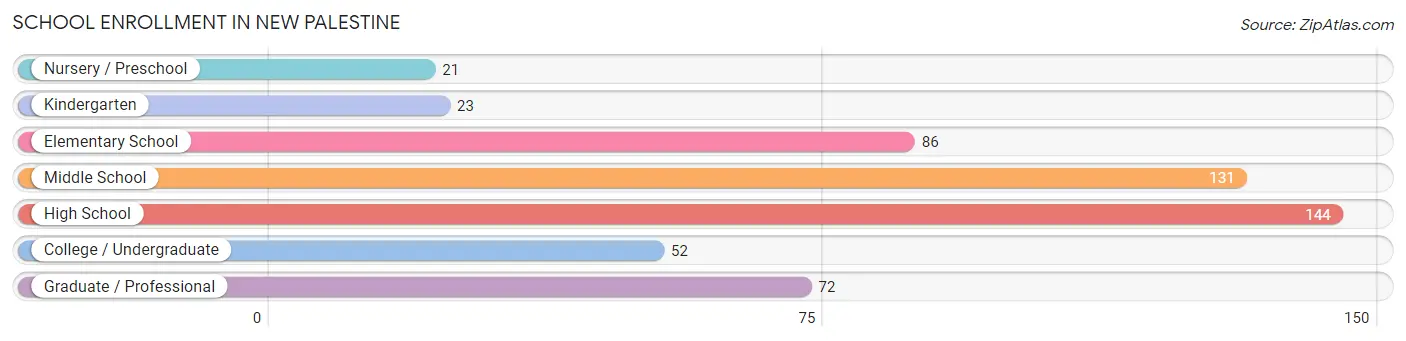
The most common levels of schooling among the 529 students in New Palestine are high school (144 | 27.2%), middle school (131 | 24.8%), and elementary school (86 | 16.3%).
| School Level | # Students | % Students |
| Nursery / Preschool | 21 | 4.0% |
| Kindergarten | 23 | 4.3% |
| Elementary School | 86 | 16.3% |
| Middle School | 131 | 24.8% |
| High School | 144 | 27.2% |
| College / Undergraduate | 52 | 9.8% |
| Graduate / Professional | 72 | 13.6% |
| Total | 529 | 100.0% |
School Enrollment by Age by Funding Source in New Palestine
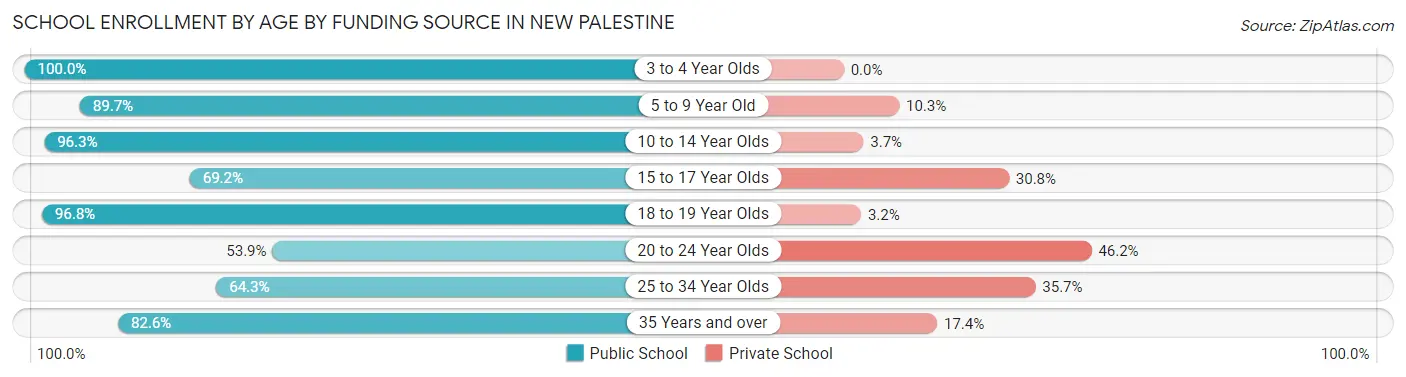
Out of a total of 529 students who are enrolled in schools in New Palestine, 76 (14.4%) attend a private institution, while the remaining 453 (85.6%) are enrolled in public schools. The age group of 20 to 24 year olds has the highest likelihood of being enrolled in private schools, with 6 (46.2% in the age bracket) enrolled. Conversely, the age group of 3 to 4 year olds has the lowest likelihood of being enrolled in a private school, with 13 (100.0% in the age bracket) attending a public institution.
| Age Bracket | Public School | Private School |
| 3 to 4 Year Olds | 13 (100.0%) | 0 (0.0%) |
| 5 to 9 Year Old | 87 (89.7%) | 10 (10.3%) |
| 10 to 14 Year Olds | 158 (96.3%) | 6 (3.7%) |
| 15 to 17 Year Olds | 54 (69.2%) | 24 (30.8%) |
| 18 to 19 Year Olds | 60 (96.8%) | 2 (3.2%) |
| 20 to 24 Year Olds | 7 (53.8%) | 6 (46.2%) |
| 25 to 34 Year Olds | 36 (64.3%) | 20 (35.7%) |
| 35 Years and over | 38 (82.6%) | 8 (17.4%) |
| Total | 453 (85.6%) | 76 (14.4%) |
Educational Attainment by Field of Study in New Palestine
Business (209 | 22.2%), education (125 | 13.3%), social sciences (122 | 12.9%), science & technology (106 | 11.2%), and arts & humanities (91 | 9.7%) are the most common fields of study among 943 individuals in New Palestine who have obtained a bachelor's degree or higher.
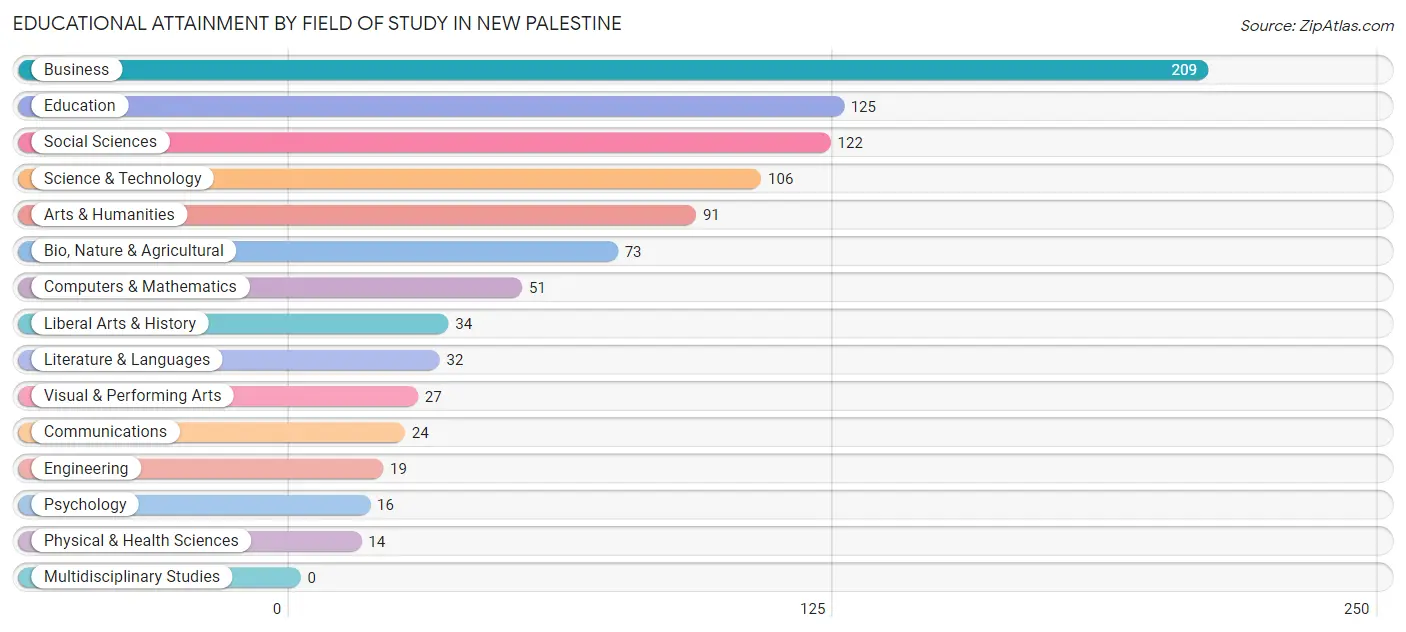
| Field of Study | # Graduates | % Graduates |
| Computers & Mathematics | 51 | 5.4% |
| Bio, Nature & Agricultural | 73 | 7.7% |
| Physical & Health Sciences | 14 | 1.5% |
| Psychology | 16 | 1.7% |
| Social Sciences | 122 | 12.9% |
| Engineering | 19 | 2.0% |
| Multidisciplinary Studies | 0 | 0.0% |
| Science & Technology | 106 | 11.2% |
| Business | 209 | 22.2% |
| Education | 125 | 13.3% |
| Literature & Languages | 32 | 3.4% |
| Liberal Arts & History | 34 | 3.6% |
| Visual & Performing Arts | 27 | 2.9% |
| Communications | 24 | 2.5% |
| Arts & Humanities | 91 | 9.7% |
| Total | 943 | 100.0% |
Transportation & Commute in New Palestine
Vehicle Availability by Sex in New Palestine
The most prevalent vehicle ownership categories in New Palestine are males with 2 vehicles (356, accounting for 52.0%) and females with 2 vehicles (447, making up 43.5%).
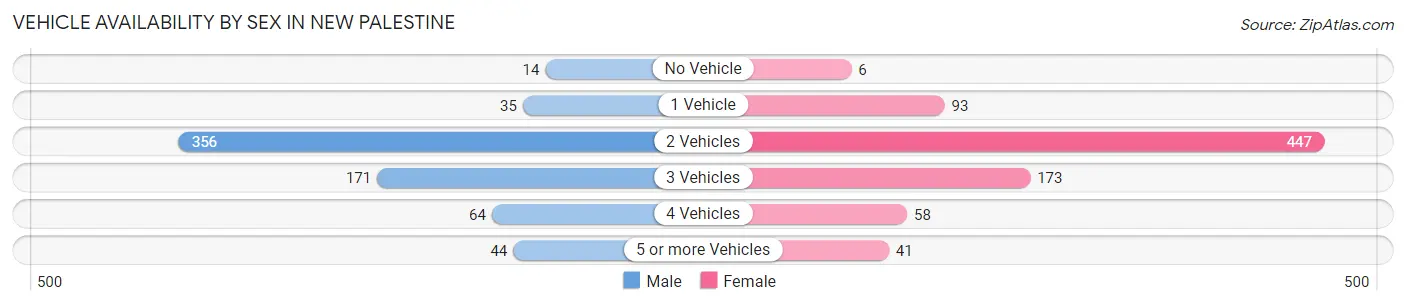
| Vehicles Available | Male | Female |
| No Vehicle | 14 (2.1%) | 6 (0.7%) |
| 1 Vehicle | 35 (5.1%) | 93 (11.4%) |
| 2 Vehicles | 356 (52.0%) | 447 (54.6%) |
| 3 Vehicles | 171 (25.0%) | 173 (21.1%) |
| 4 Vehicles | 64 (9.4%) | 58 (7.1%) |
| 5 or more Vehicles | 44 (6.4%) | 41 (5.0%) |
| Total | 684 (100.0%) | 818 (100.0%) |
Commute Time in New Palestine
The most frequently occuring commute durations in New Palestine are 30 to 34 minutes (408 commuters, 29.3%), 45 to 59 minutes (157 commuters, 11.3%), and 20 to 24 minutes (145 commuters, 10.4%).
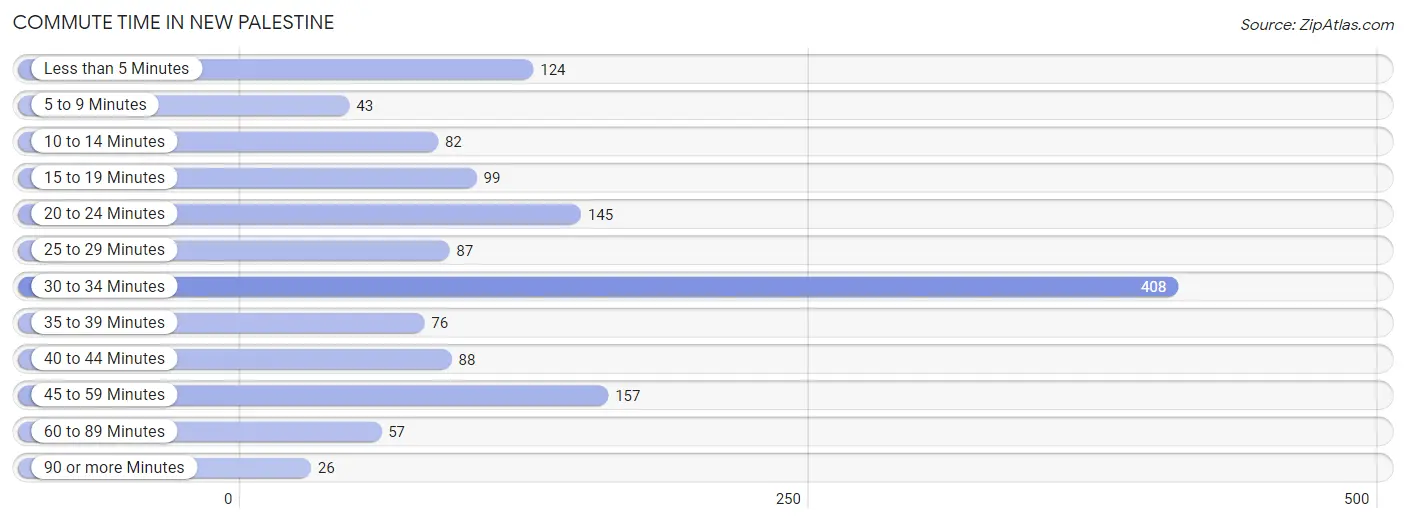
| Commute Time | # Commuters | % Commuters |
| Less than 5 Minutes | 124 | 8.9% |
| 5 to 9 Minutes | 43 | 3.1% |
| 10 to 14 Minutes | 82 | 5.9% |
| 15 to 19 Minutes | 99 | 7.1% |
| 20 to 24 Minutes | 145 | 10.4% |
| 25 to 29 Minutes | 87 | 6.2% |
| 30 to 34 Minutes | 408 | 29.3% |
| 35 to 39 Minutes | 76 | 5.5% |
| 40 to 44 Minutes | 88 | 6.3% |
| 45 to 59 Minutes | 157 | 11.3% |
| 60 to 89 Minutes | 57 | 4.1% |
| 90 or more Minutes | 26 | 1.9% |
Commute Time by Sex in New Palestine
The most common commute times in New Palestine are 30 to 34 minutes (165 commuters, 26.2%) for males and 30 to 34 minutes (243 commuters, 31.9%) for females.
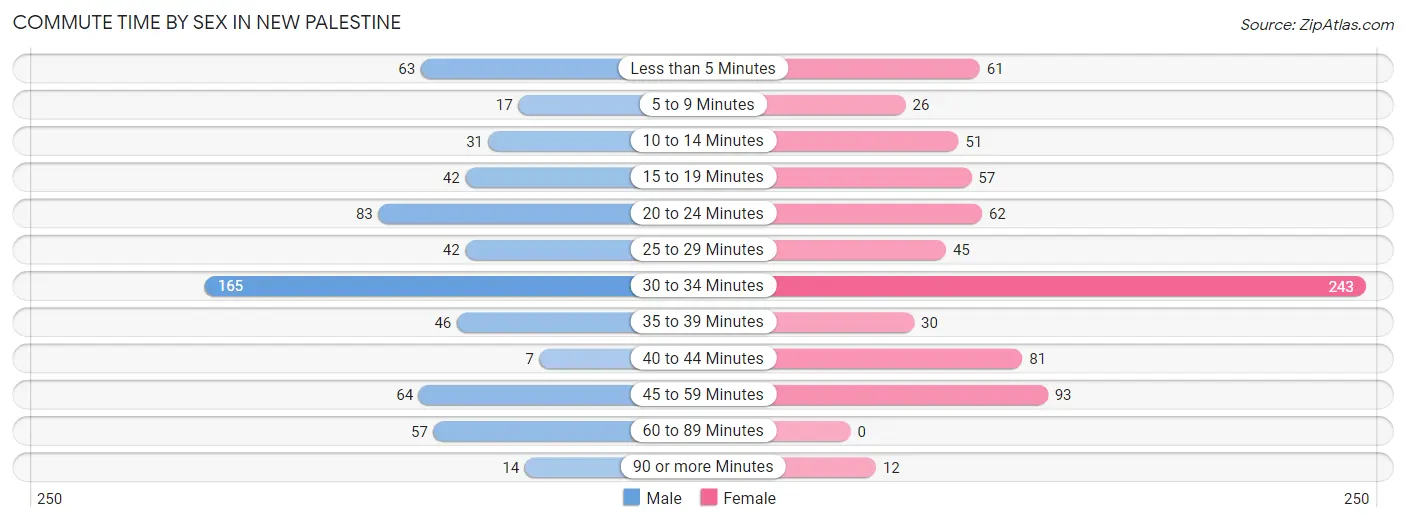
| Commute Time | Male | Female |
| Less than 5 Minutes | 63 (10.0%) | 61 (8.0%) |
| 5 to 9 Minutes | 17 (2.7%) | 26 (3.4%) |
| 10 to 14 Minutes | 31 (4.9%) | 51 (6.7%) |
| 15 to 19 Minutes | 42 (6.7%) | 57 (7.5%) |
| 20 to 24 Minutes | 83 (13.2%) | 62 (8.2%) |
| 25 to 29 Minutes | 42 (6.7%) | 45 (5.9%) |
| 30 to 34 Minutes | 165 (26.2%) | 243 (31.9%) |
| 35 to 39 Minutes | 46 (7.3%) | 30 (3.9%) |
| 40 to 44 Minutes | 7 (1.1%) | 81 (10.6%) |
| 45 to 59 Minutes | 64 (10.1%) | 93 (12.2%) |
| 60 to 89 Minutes | 57 (9.0%) | 0 (0.0%) |
| 90 or more Minutes | 14 (2.2%) | 12 (1.6%) |
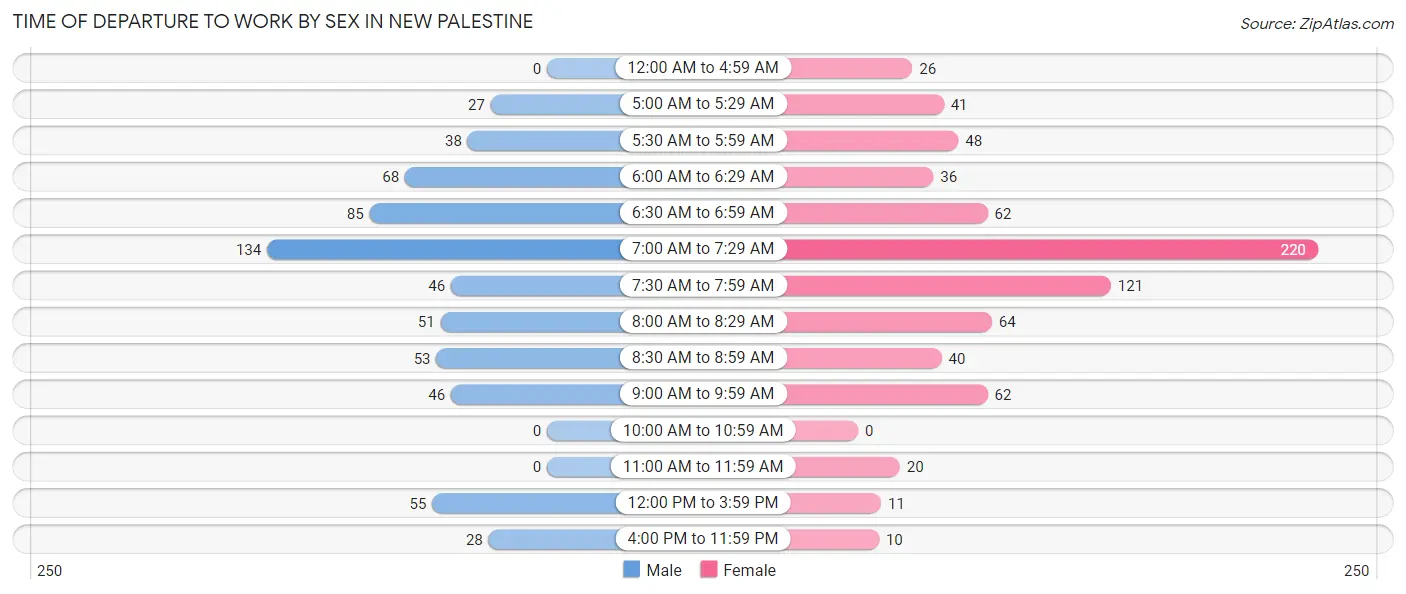
Time of Departure to Work by Sex in New Palestine
The most frequent times of departure to work in New Palestine are 7:00 AM to 7:29 AM (134, 21.2%) for males and 7:00 AM to 7:29 AM (220, 28.9%) for females.
| Time of Departure | Male | Female |
| 12:00 AM to 4:59 AM | 0 (0.0%) | 26 (3.4%) |
| 5:00 AM to 5:29 AM | 27 (4.3%) | 41 (5.4%) |
| 5:30 AM to 5:59 AM | 38 (6.0%) | 48 (6.3%) |
| 6:00 AM to 6:29 AM | 68 (10.8%) | 36 (4.7%) |
| 6:30 AM to 6:59 AM | 85 (13.5%) | 62 (8.2%) |
| 7:00 AM to 7:29 AM | 134 (21.2%) | 220 (28.9%) |
| 7:30 AM to 7:59 AM | 46 (7.3%) | 121 (15.9%) |
| 8:00 AM to 8:29 AM | 51 (8.1%) | 64 (8.4%) |
| 8:30 AM to 8:59 AM | 53 (8.4%) | 40 (5.3%) |
| 9:00 AM to 9:59 AM | 46 (7.3%) | 62 (8.2%) |
| 10:00 AM to 10:59 AM | 0 (0.0%) | 0 (0.0%) |
| 11:00 AM to 11:59 AM | 0 (0.0%) | 20 (2.6%) |
| 12:00 PM to 3:59 PM | 55 (8.7%) | 11 (1.5%) |
| 4:00 PM to 11:59 PM | 28 (4.4%) | 10 (1.3%) |
| Total | 631 (100.0%) | 761 (100.0%) |
Housing Occupancy in New Palestine
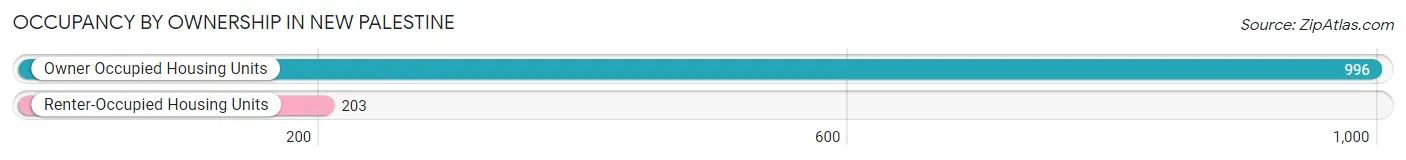
Occupancy by Ownership in New Palestine
Of the total 1,199 dwellings in New Palestine, owner-occupied units account for 996 (83.1%), while renter-occupied units make up 203 (16.9%).
| Occupancy | # Housing Units | % Housing Units |
| Owner Occupied Housing Units | 996 | 83.1% |
| Renter-Occupied Housing Units | 203 | 16.9% |
| Total Occupied Housing Units | 1,199 | 100.0% |
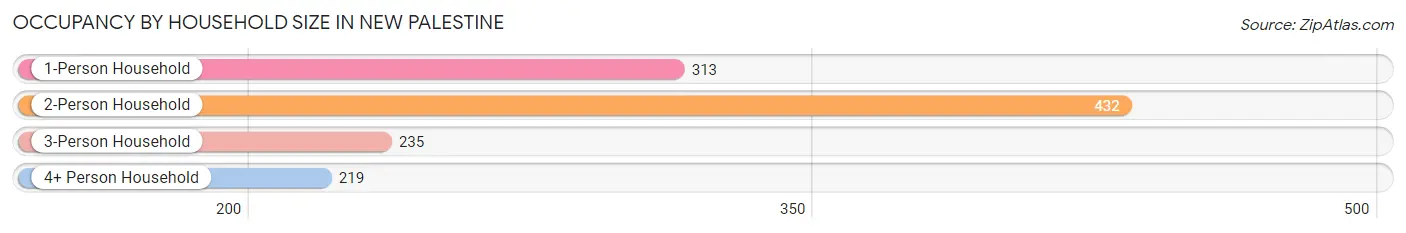
Occupancy by Household Size in New Palestine
| Household Size | # Housing Units | % Housing Units |
| 1-Person Household | 313 | 26.1% |
| 2-Person Household | 432 | 36.0% |
| 3-Person Household | 235 | 19.6% |
| 4+ Person Household | 219 | 18.3% |
| Total Housing Units | 1,199 | 100.0% |
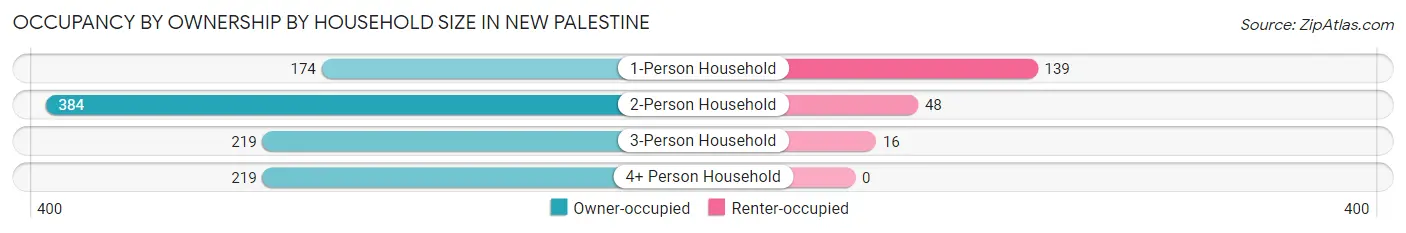
Occupancy by Ownership by Household Size in New Palestine
| Household Size | Owner-occupied | Renter-occupied |
| 1-Person Household | 174 (55.6%) | 139 (44.4%) |
| 2-Person Household | 384 (88.9%) | 48 (11.1%) |
| 3-Person Household | 219 (93.2%) | 16 (6.8%) |
| 4+ Person Household | 219 (100.0%) | 0 (0.0%) |
| Total Housing Units | 996 (83.1%) | 203 (16.9%) |
Occupancy by Educational Attainment in New Palestine
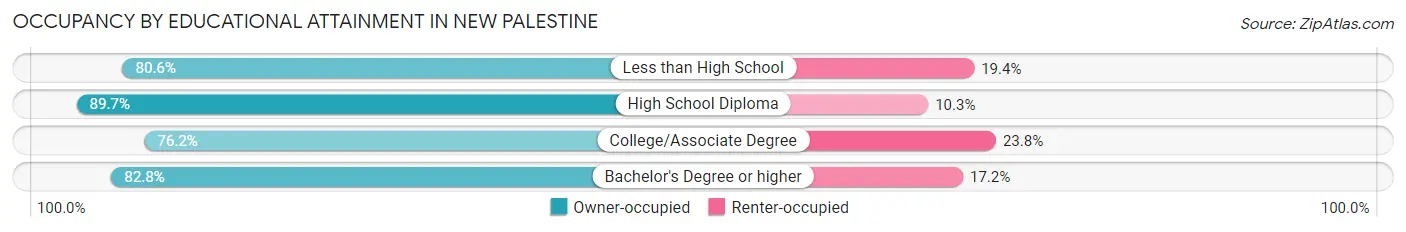
| Household Size | Owner-occupied | Renter-occupied |
| Less than High School | 29 (80.6%) | 7 (19.4%) |
| High School Diploma | 313 (89.7%) | 36 (10.3%) |
| College/Associate Degree | 231 (76.2%) | 72 (23.8%) |
| Bachelor's Degree or higher | 423 (82.8%) | 88 (17.2%) |
Occupancy by Age of Householder in New Palestine
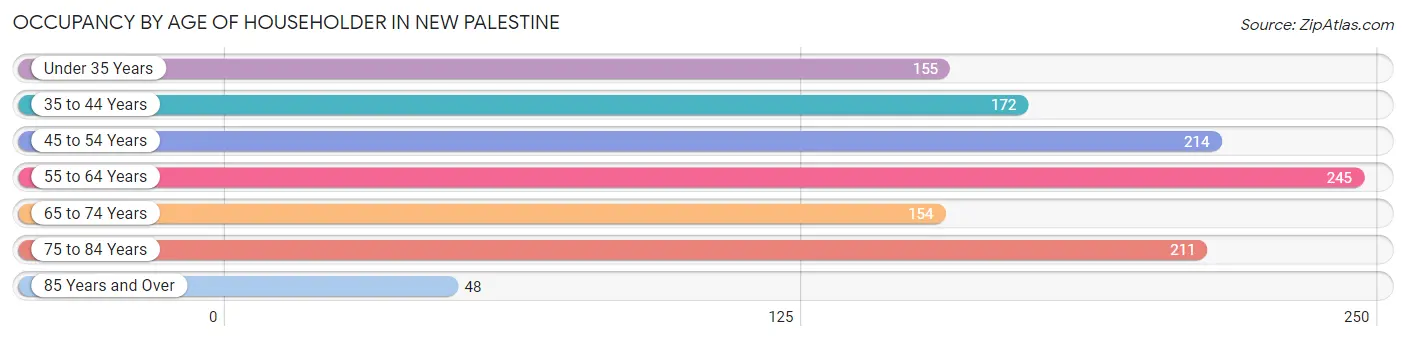
| Age Bracket | # Households | % Households |
| Under 35 Years | 155 | 12.9% |
| 35 to 44 Years | 172 | 14.3% |
| 45 to 54 Years | 214 | 17.8% |
| 55 to 64 Years | 245 | 20.4% |
| 65 to 74 Years | 154 | 12.8% |
| 75 to 84 Years | 211 | 17.6% |
| 85 Years and Over | 48 | 4.0% |
| Total | 1,199 | 100.0% |
Housing Finances in New Palestine
Median Income by Occupancy in New Palestine
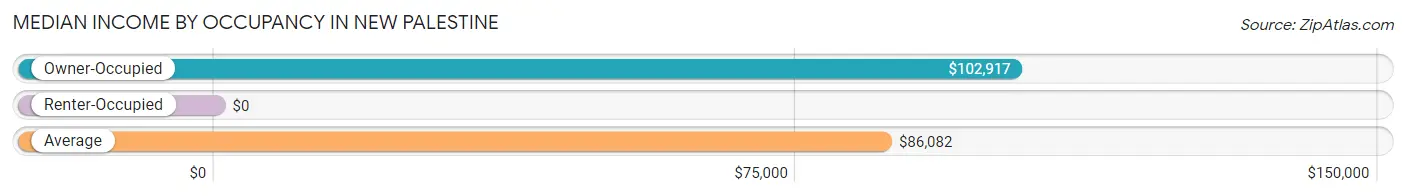
| Occupancy Type | # Households | Median Income |
| Owner-Occupied | 996 (83.1%) | $102,917 |
| Renter-Occupied | 203 (16.9%) | $0 |
| Average | 1,199 (100.0%) | $86,082 |
Occupancy by Householder Income Bracket in New Palestine
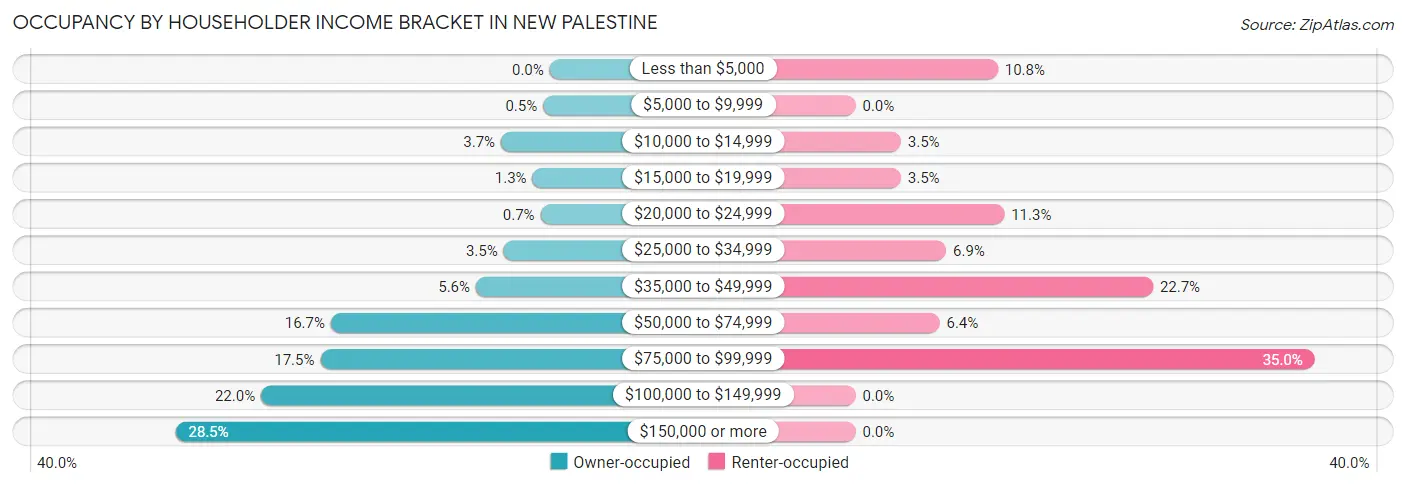
| Income Bracket | Owner-occupied | Renter-occupied |
| Less than $5,000 | 0 (0.0%) | 22 (10.8%) |
| $5,000 to $9,999 | 5 (0.5%) | 0 (0.0%) |
| $10,000 to $14,999 | 37 (3.7%) | 7 (3.5%) |
| $15,000 to $19,999 | 13 (1.3%) | 7 (3.5%) |
| $20,000 to $24,999 | 7 (0.7%) | 23 (11.3%) |
| $25,000 to $34,999 | 35 (3.5%) | 14 (6.9%) |
| $35,000 to $49,999 | 56 (5.6%) | 46 (22.7%) |
| $50,000 to $74,999 | 166 (16.7%) | 13 (6.4%) |
| $75,000 to $99,999 | 174 (17.5%) | 71 (35.0%) |
| $100,000 to $149,999 | 219 (22.0%) | 0 (0.0%) |
| $150,000 or more | 284 (28.5%) | 0 (0.0%) |
| Total | 996 (100.0%) | 203 (100.0%) |
Monthly Housing Cost Tiers in New Palestine
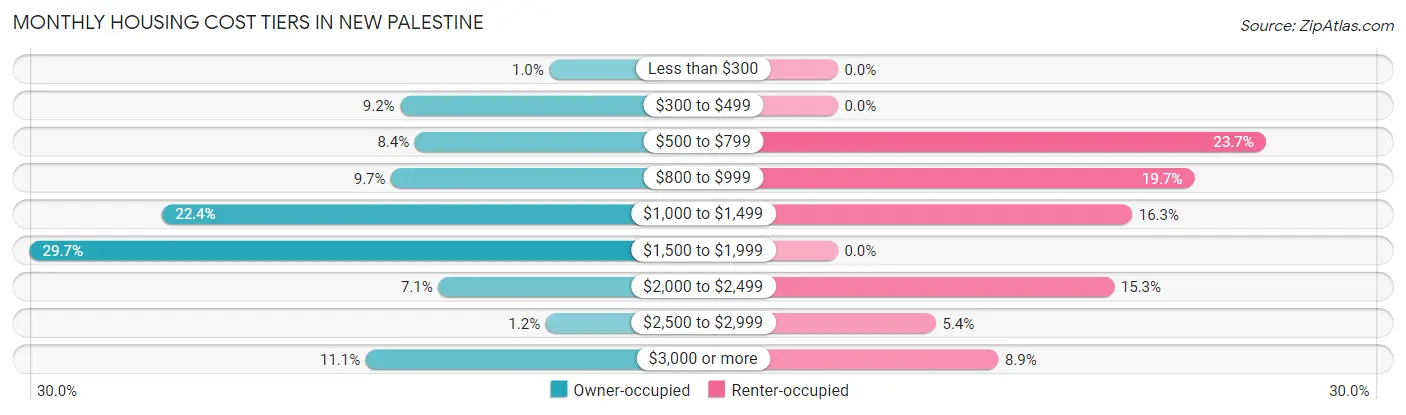
| Monthly Cost | Owner-occupied | Renter-occupied |
| Less than $300 | 10 (1.0%) | 0 (0.0%) |
| $300 to $499 | 92 (9.2%) | 0 (0.0%) |
| $500 to $799 | 84 (8.4%) | 48 (23.6%) |
| $800 to $999 | 97 (9.7%) | 40 (19.7%) |
| $1,000 to $1,499 | 223 (22.4%) | 33 (16.3%) |
| $1,500 to $1,999 | 296 (29.7%) | 0 (0.0%) |
| $2,000 to $2,499 | 71 (7.1%) | 31 (15.3%) |
| $2,500 to $2,999 | 12 (1.2%) | 11 (5.4%) |
| $3,000 or more | 111 (11.1%) | 18 (8.9%) |
| Total | 996 (100.0%) | 203 (100.0%) |
Physical Housing Characteristics in New Palestine
Housing Structures in New Palestine
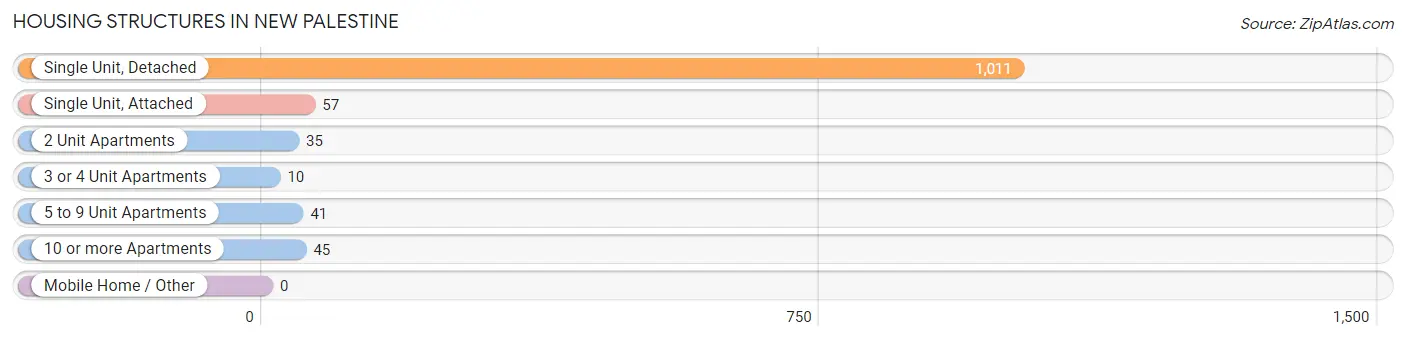
| Structure Type | # Housing Units | % Housing Units |
| Single Unit, Detached | 1,011 | 84.3% |
| Single Unit, Attached | 57 | 4.8% |
| 2 Unit Apartments | 35 | 2.9% |
| 3 or 4 Unit Apartments | 10 | 0.8% |
| 5 to 9 Unit Apartments | 41 | 3.4% |
| 10 or more Apartments | 45 | 3.7% |
| Mobile Home / Other | 0 | 0.0% |
| Total | 1,199 | 100.0% |
Housing Structures by Occupancy in New Palestine
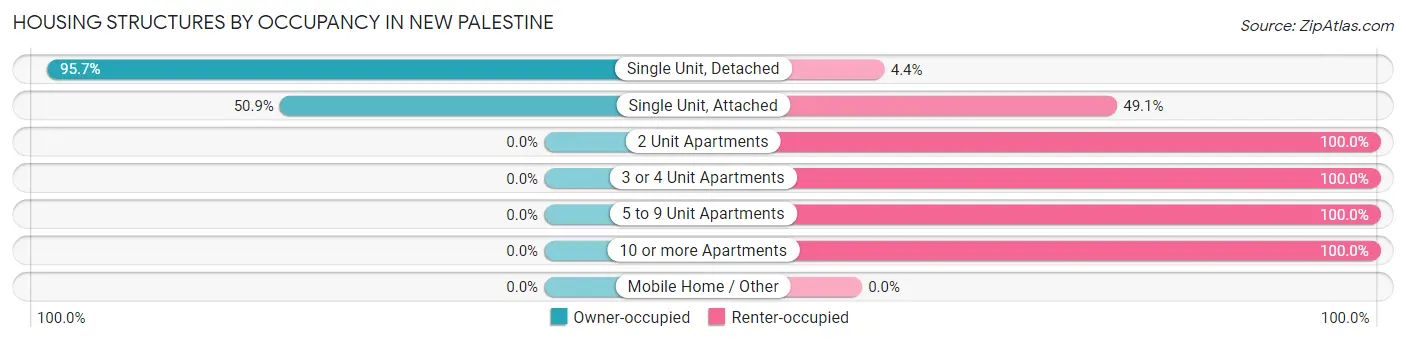
| Structure Type | Owner-occupied | Renter-occupied |
| Single Unit, Detached | 967 (95.7%) | 44 (4.3%) |
| Single Unit, Attached | 29 (50.9%) | 28 (49.1%) |
| 2 Unit Apartments | 0 (0.0%) | 35 (100.0%) |
| 3 or 4 Unit Apartments | 0 (0.0%) | 10 (100.0%) |
| 5 to 9 Unit Apartments | 0 (0.0%) | 41 (100.0%) |
| 10 or more Apartments | 0 (0.0%) | 45 (100.0%) |
| Mobile Home / Other | 0 (0.0%) | 0 (0.0%) |
| Total | 996 (83.1%) | 203 (16.9%) |
Housing Structures by Number of Rooms in New Palestine
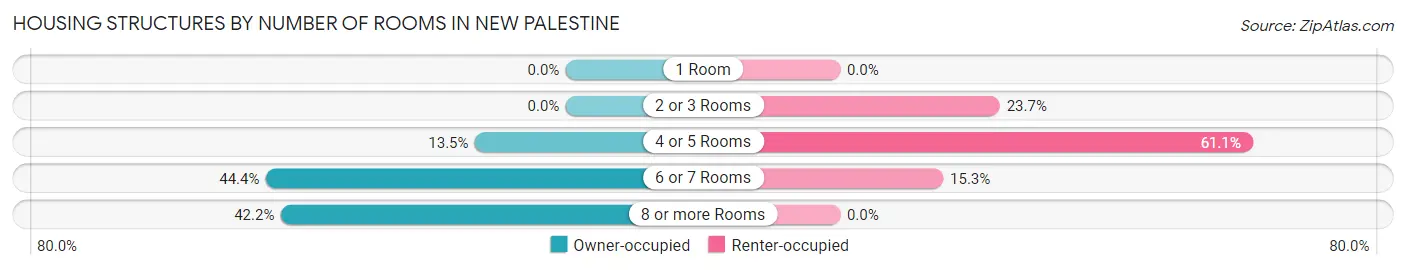
| Number of Rooms | Owner-occupied | Renter-occupied |
| 1 Room | 0 (0.0%) | 0 (0.0%) |
| 2 or 3 Rooms | 0 (0.0%) | 48 (23.6%) |
| 4 or 5 Rooms | 134 (13.5%) | 124 (61.1%) |
| 6 or 7 Rooms | 442 (44.4%) | 31 (15.3%) |
| 8 or more Rooms | 420 (42.2%) | 0 (0.0%) |
| Total | 996 (100.0%) | 203 (100.0%) |
Housing Structure by Heating Type in New Palestine
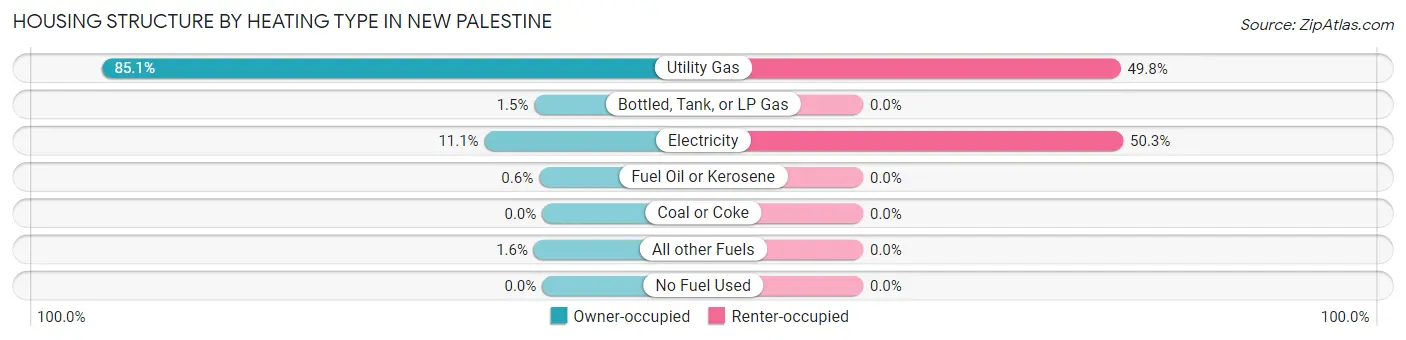
| Heating Type | Owner-occupied | Renter-occupied |
| Utility Gas | 848 (85.1%) | 101 (49.7%) |
| Bottled, Tank, or LP Gas | 15 (1.5%) | 0 (0.0%) |
| Electricity | 111 (11.1%) | 102 (50.2%) |
| Fuel Oil or Kerosene | 6 (0.6%) | 0 (0.0%) |
| Coal or Coke | 0 (0.0%) | 0 (0.0%) |
| All other Fuels | 16 (1.6%) | 0 (0.0%) |
| No Fuel Used | 0 (0.0%) | 0 (0.0%) |
| Total | 996 (100.0%) | 203 (100.0%) |
Household Vehicle Usage in New Palestine
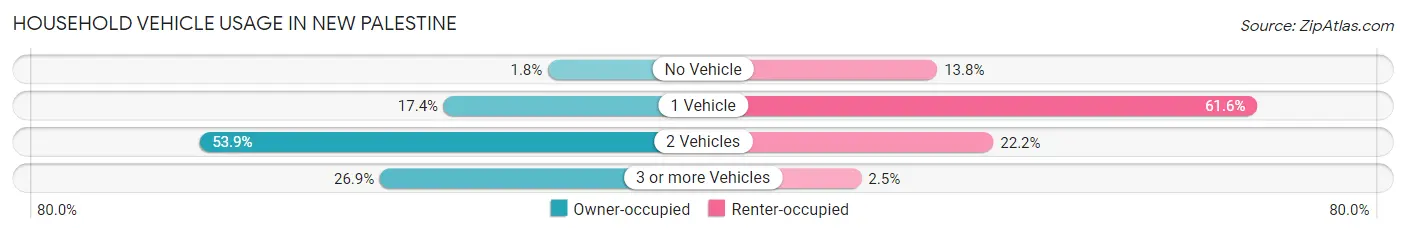
| Vehicles per Household | Owner-occupied | Renter-occupied |
| No Vehicle | 18 (1.8%) | 28 (13.8%) |
| 1 Vehicle | 173 (17.4%) | 125 (61.6%) |
| 2 Vehicles | 537 (53.9%) | 45 (22.2%) |
| 3 or more Vehicles | 268 (26.9%) | 5 (2.5%) |
| Total | 996 (100.0%) | 203 (100.0%) |
Real Estate & Mortgages in New Palestine
Real Estate and Mortgage Overview in New Palestine
| Characteristic | Without Mortgage | With Mortgage |
| Housing Units | 235 | 761 |
| Median Property Value | $260,100 | $275,500 |
| Median Household Income | $69,063 | $245 |
| Monthly Housing Costs | $548 | $111 |
| Real Estate Taxes | $2,413 | $37 |
Property Value by Mortgage Status in New Palestine
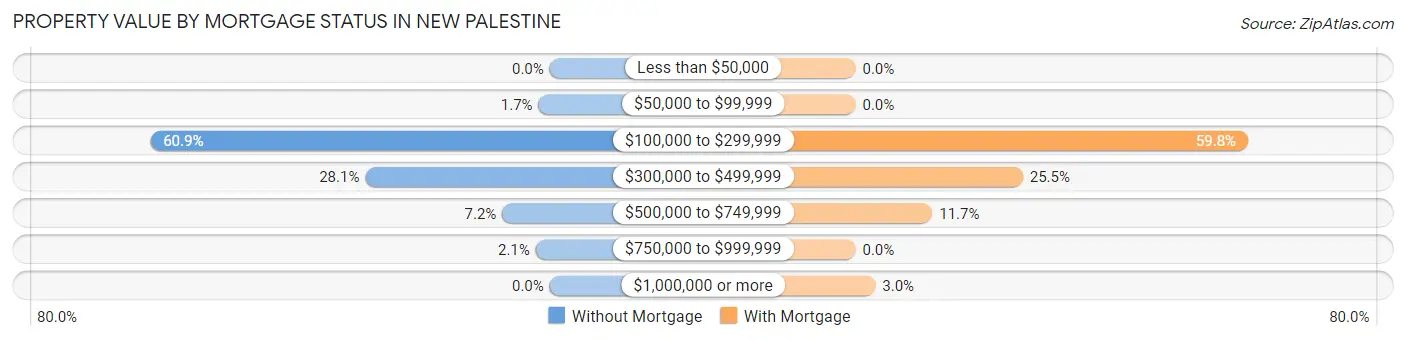
| Property Value | Without Mortgage | With Mortgage |
| Less than $50,000 | 0 (0.0%) | 0 (0.0%) |
| $50,000 to $99,999 | 4 (1.7%) | 0 (0.0%) |
| $100,000 to $299,999 | 143 (60.9%) | 455 (59.8%) |
| $300,000 to $499,999 | 66 (28.1%) | 194 (25.5%) |
| $500,000 to $749,999 | 17 (7.2%) | 89 (11.7%) |
| $750,000 to $999,999 | 5 (2.1%) | 0 (0.0%) |
| $1,000,000 or more | 0 (0.0%) | 23 (3.0%) |
| Total | 235 (100.0%) | 761 (100.0%) |
Household Income by Mortgage Status in New Palestine
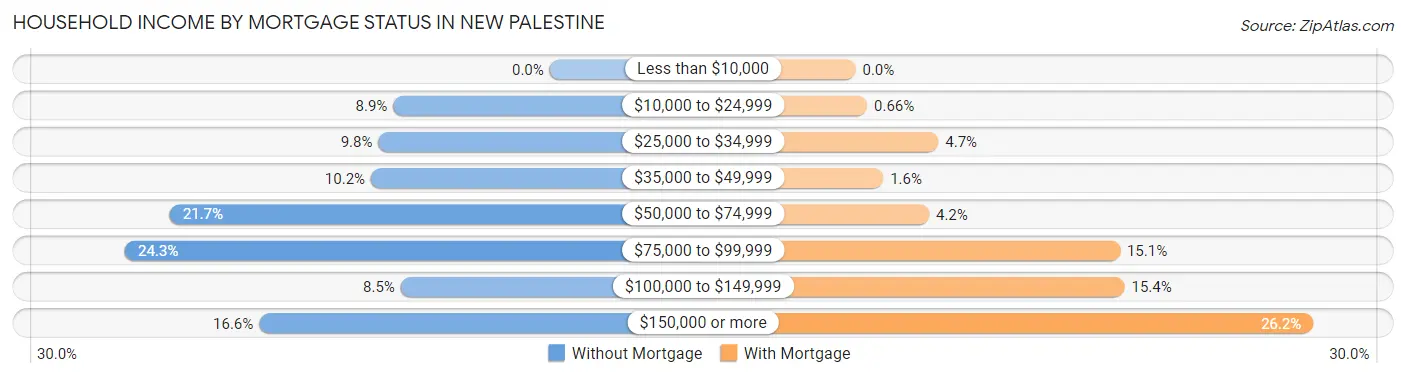
| Household Income | Without Mortgage | With Mortgage |
| Less than $10,000 | 0 (0.0%) | 0 (0.0%) |
| $10,000 to $24,999 | 21 (8.9%) | 5 (0.7%) |
| $25,000 to $34,999 | 23 (9.8%) | 36 (4.7%) |
| $35,000 to $49,999 | 24 (10.2%) | 12 (1.6%) |
| $50,000 to $74,999 | 51 (21.7%) | 32 (4.2%) |
| $75,000 to $99,999 | 57 (24.3%) | 115 (15.1%) |
| $100,000 to $149,999 | 20 (8.5%) | 117 (15.4%) |
| $150,000 or more | 39 (16.6%) | 199 (26.2%) |
| Total | 235 (100.0%) | 761 (100.0%) |
Property Value to Household Income Ratio in New Palestine
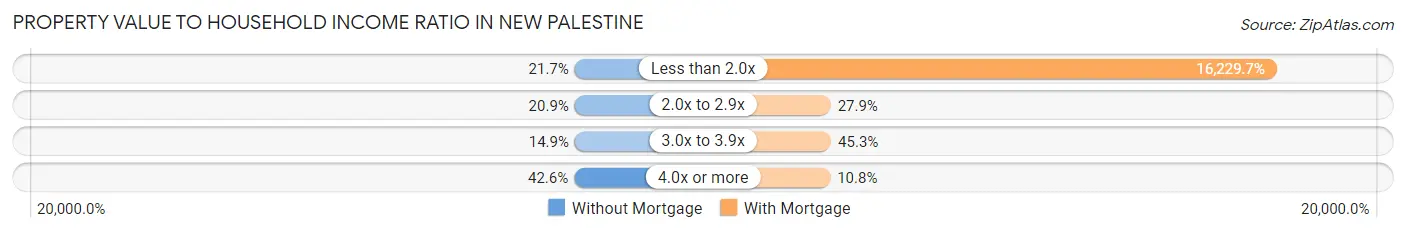
| Value-to-Income Ratio | Without Mortgage | With Mortgage |
| Less than 2.0x | 51 (21.7%) | 123,508 (16,229.7%) |
| 2.0x to 2.9x | 49 (20.8%) | 212 (27.9%) |
| 3.0x to 3.9x | 35 (14.9%) | 345 (45.3%) |
| 4.0x or more | 100 (42.5%) | 82 (10.8%) |
| Total | 235 (100.0%) | 761 (100.0%) |
Real Estate Taxes by Mortgage Status in New Palestine
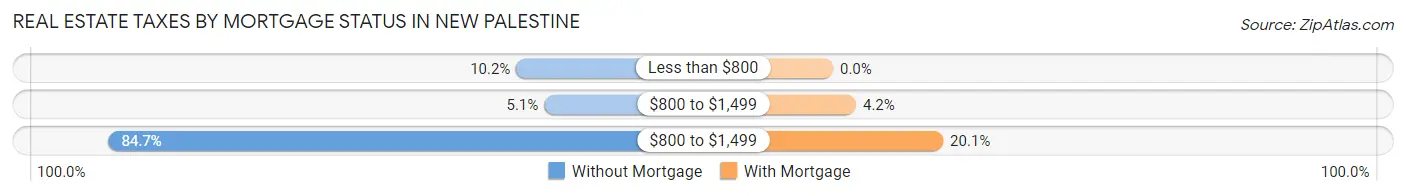
| Property Taxes | Without Mortgage | With Mortgage |
| Less than $800 | 24 (10.2%) | 0 (0.0%) |
| $800 to $1,499 | 12 (5.1%) | 32 (4.2%) |
| $800 to $1,499 | 199 (84.7%) | 153 (20.1%) |
| Total | 235 (100.0%) | 761 (100.0%) |
Health & Disability in New Palestine
Health Insurance Coverage by Age in New Palestine
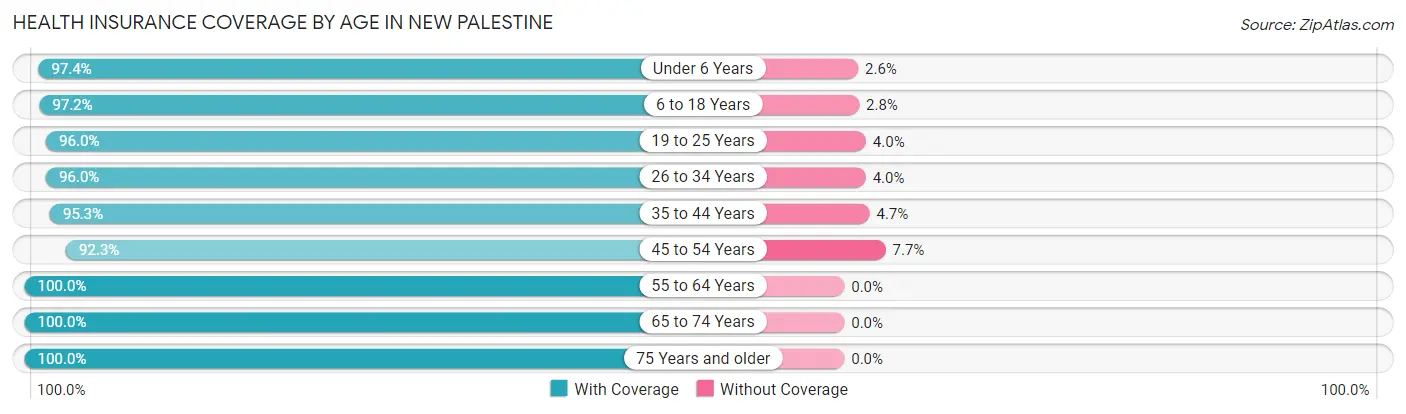
| Age Bracket | With Coverage | Without Coverage |
| Under 6 Years | 189 (97.4%) | 5 (2.6%) |
| 6 to 18 Years | 422 (97.2%) | 12 (2.8%) |
| 19 to 25 Years | 119 (96.0%) | 5 (4.0%) |
| 26 to 34 Years | 337 (96.0%) | 14 (4.0%) |
| 35 to 44 Years | 324 (95.3%) | 16 (4.7%) |
| 45 to 54 Years | 323 (92.3%) | 27 (7.7%) |
| 55 to 64 Years | 450 (100.0%) | 0 (0.0%) |
| 65 to 74 Years | 227 (100.0%) | 0 (0.0%) |
| 75 Years and older | 342 (100.0%) | 0 (0.0%) |
| Total | 2,733 (97.2%) | 79 (2.8%) |
Health Insurance Coverage by Citizenship Status in New Palestine
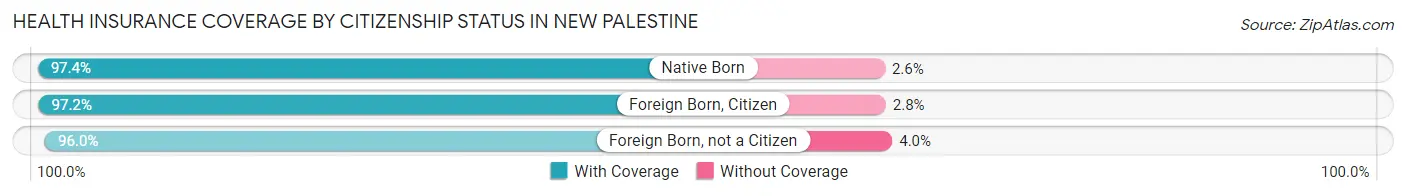
| Citizenship Status | With Coverage | Without Coverage |
| Native Born | 189 (97.4%) | 5 (2.6%) |
| Foreign Born, Citizen | 422 (97.2%) | 12 (2.8%) |
| Foreign Born, not a Citizen | 119 (96.0%) | 5 (4.0%) |
Health Insurance Coverage by Household Income in New Palestine
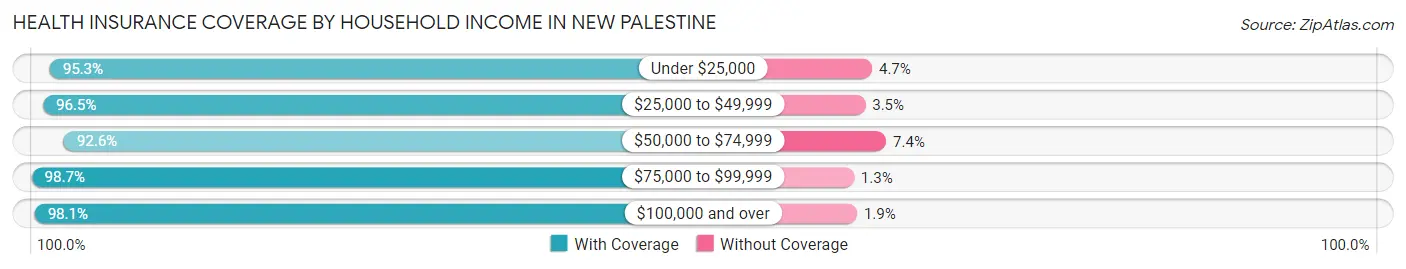
| Household Income | With Coverage | Without Coverage |
| Under $25,000 | 141 (95.3%) | 7 (4.7%) |
| $25,000 to $49,999 | 251 (96.5%) | 9 (3.5%) |
| $50,000 to $74,999 | 352 (92.6%) | 28 (7.4%) |
| $75,000 to $99,999 | 592 (98.7%) | 8 (1.3%) |
| $100,000 and over | 1,397 (98.1%) | 27 (1.9%) |
Public vs Private Health Insurance Coverage by Age in New Palestine
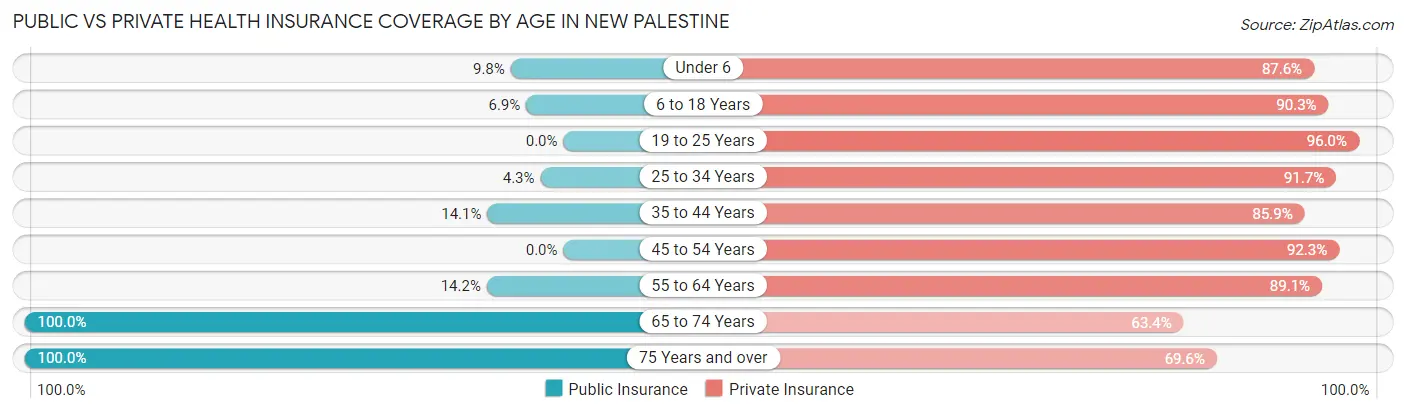
| Age Bracket | Public Insurance | Private Insurance |
| Under 6 | 19 (9.8%) | 170 (87.6%) |
| 6 to 18 Years | 30 (6.9%) | 392 (90.3%) |
| 19 to 25 Years | 0 (0.0%) | 119 (96.0%) |
| 25 to 34 Years | 15 (4.3%) | 322 (91.7%) |
| 35 to 44 Years | 48 (14.1%) | 292 (85.9%) |
| 45 to 54 Years | 0 (0.0%) | 323 (92.3%) |
| 55 to 64 Years | 64 (14.2%) | 401 (89.1%) |
| 65 to 74 Years | 227 (100.0%) | 144 (63.4%) |
| 75 Years and over | 342 (100.0%) | 238 (69.6%) |
| Total | 745 (26.5%) | 2,401 (85.4%) |
Disability Status by Sex by Age in New Palestine
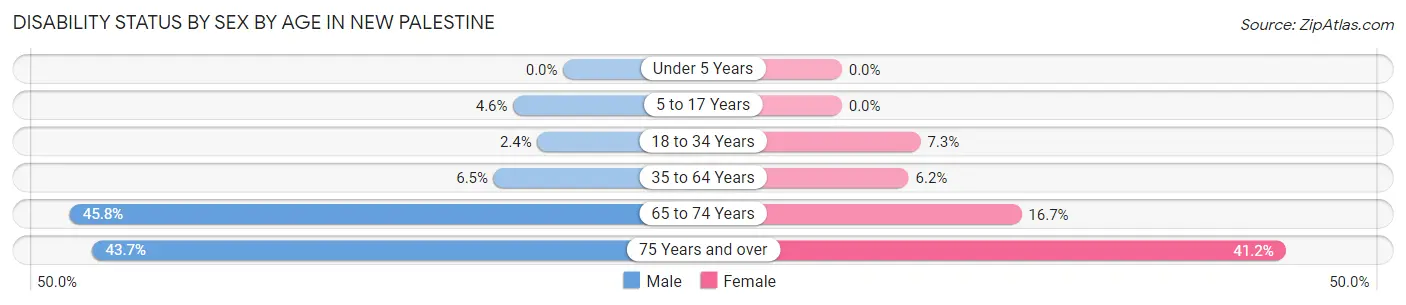
| Age Bracket | Male | Female |
| Under 5 Years | 0 (0.0%) | 0 (0.0%) |
| 5 to 17 Years | 13 (4.6%) | 0 (0.0%) |
| 18 to 34 Years | 7 (2.4%) | 17 (7.3%) |
| 35 to 64 Years | 34 (6.5%) | 38 (6.2%) |
| 65 to 74 Years | 49 (45.8%) | 20 (16.7%) |
| 75 Years and over | 38 (43.7%) | 105 (41.2%) |
Disability Class by Sex by Age in New Palestine
Disability Class: Hearing Difficulty
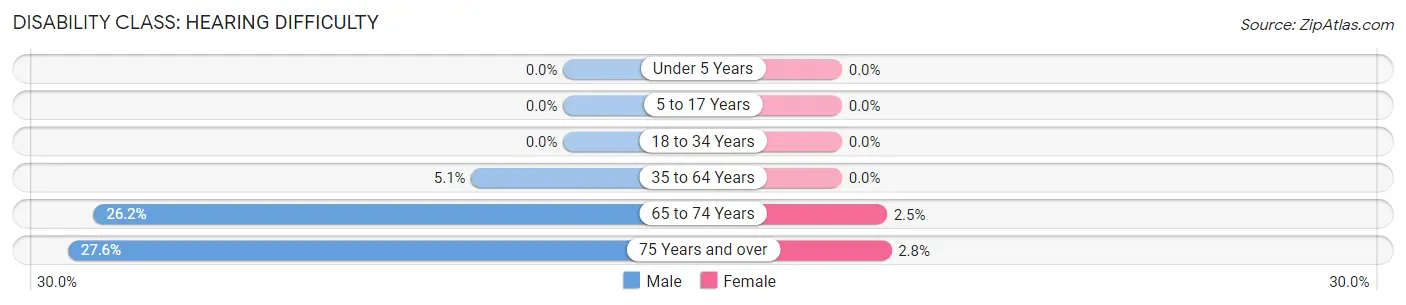
| Age Bracket | Male | Female |
| Under 5 Years | 0 (0.0%) | 0 (0.0%) |
| 5 to 17 Years | 0 (0.0%) | 0 (0.0%) |
| 18 to 34 Years | 0 (0.0%) | 0 (0.0%) |
| 35 to 64 Years | 27 (5.1%) | 0 (0.0%) |
| 65 to 74 Years | 28 (26.2%) | 3 (2.5%) |
| 75 Years and over | 24 (27.6%) | 7 (2.8%) |
Disability Class: Vision Difficulty
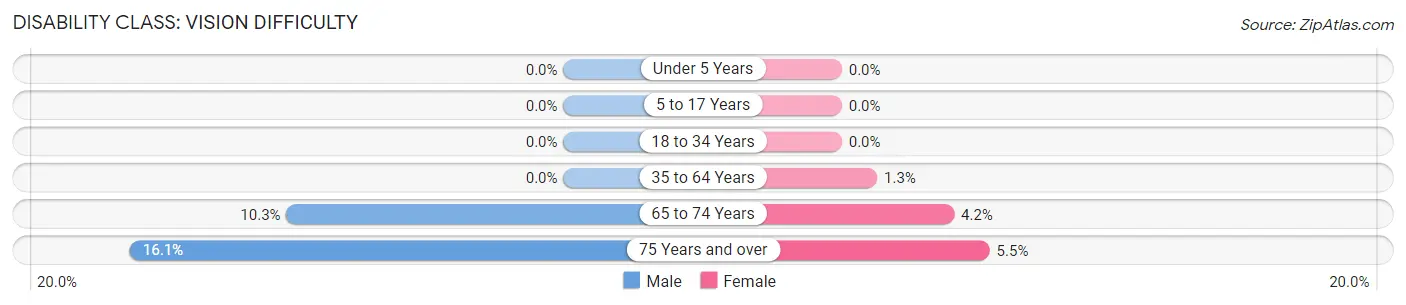
| Age Bracket | Male | Female |
| Under 5 Years | 0 (0.0%) | 0 (0.0%) |
| 5 to 17 Years | 0 (0.0%) | 0 (0.0%) |
| 18 to 34 Years | 0 (0.0%) | 0 (0.0%) |
| 35 to 64 Years | 0 (0.0%) | 8 (1.3%) |
| 65 to 74 Years | 11 (10.3%) | 5 (4.2%) |
| 75 Years and over | 14 (16.1%) | 14 (5.5%) |
Disability Class: Cognitive Difficulty
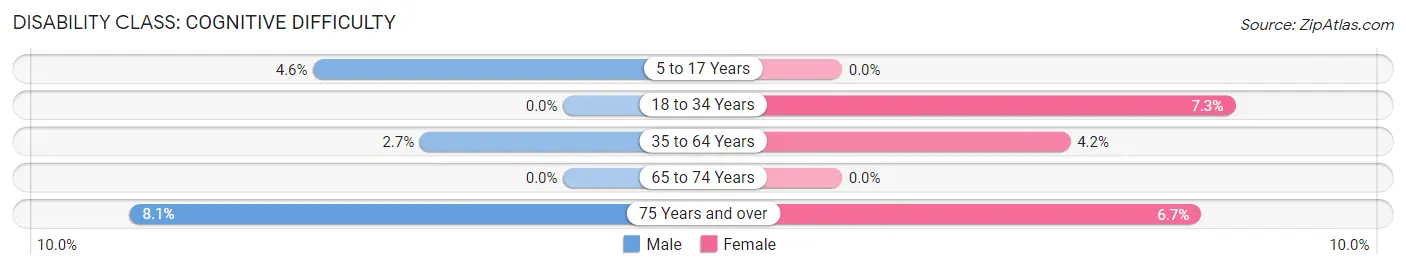
| Age Bracket | Male | Female |
| 5 to 17 Years | 13 (4.6%) | 0 (0.0%) |
| 18 to 34 Years | 0 (0.0%) | 17 (7.3%) |
| 35 to 64 Years | 14 (2.7%) | 26 (4.2%) |
| 65 to 74 Years | 0 (0.0%) | 0 (0.0%) |
| 75 Years and over | 7 (8.1%) | 17 (6.7%) |
Disability Class: Ambulatory Difficulty
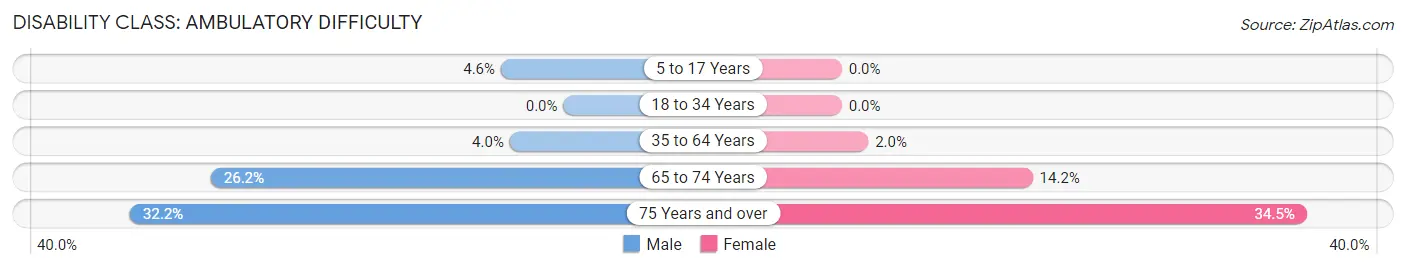
| Age Bracket | Male | Female |
| 5 to 17 Years | 13 (4.6%) | 0 (0.0%) |
| 18 to 34 Years | 0 (0.0%) | 0 (0.0%) |
| 35 to 64 Years | 21 (4.0%) | 12 (2.0%) |
| 65 to 74 Years | 28 (26.2%) | 17 (14.2%) |
| 75 Years and over | 28 (32.2%) | 88 (34.5%) |
Disability Class: Self-Care Difficulty
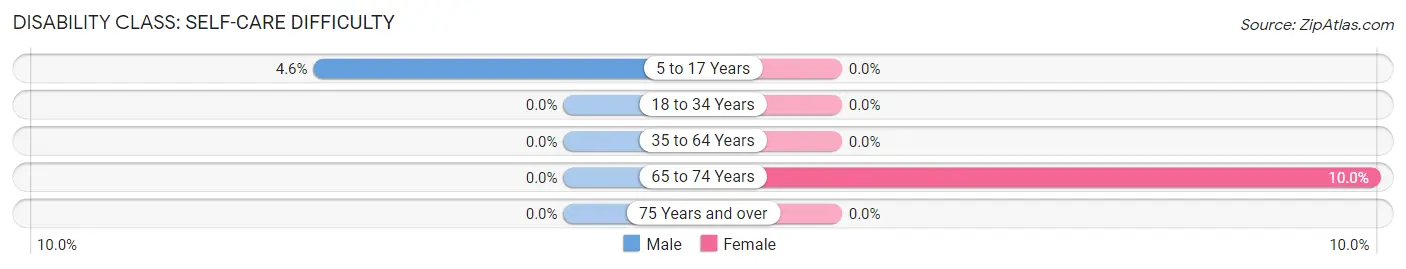
| Age Bracket | Male | Female |
| 5 to 17 Years | 13 (4.6%) | 0 (0.0%) |
| 18 to 34 Years | 0 (0.0%) | 0 (0.0%) |
| 35 to 64 Years | 0 (0.0%) | 0 (0.0%) |
| 65 to 74 Years | 0 (0.0%) | 12 (10.0%) |
| 75 Years and over | 0 (0.0%) | 0 (0.0%) |
Technology Access in New Palestine
Computing Device Access in New Palestine
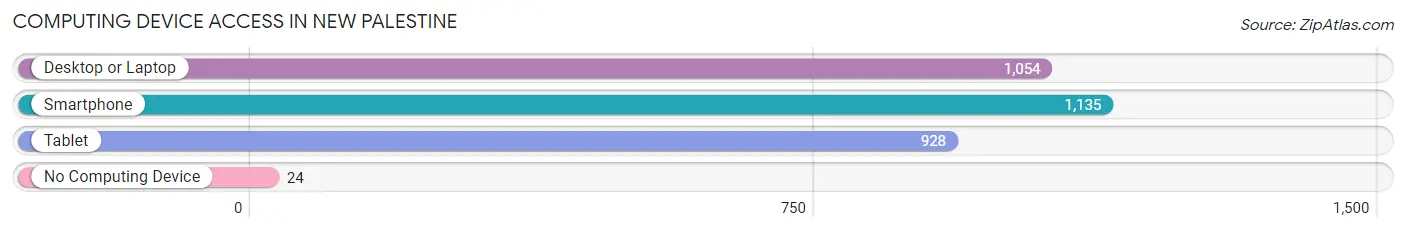
| Device Type | # Households | % Households |
| Desktop or Laptop | 1,054 | 87.9% |
| Smartphone | 1,135 | 94.7% |
| Tablet | 928 | 77.4% |
| No Computing Device | 24 | 2.0% |
| Total | 1,199 | 100.0% |
Internet Access in New Palestine
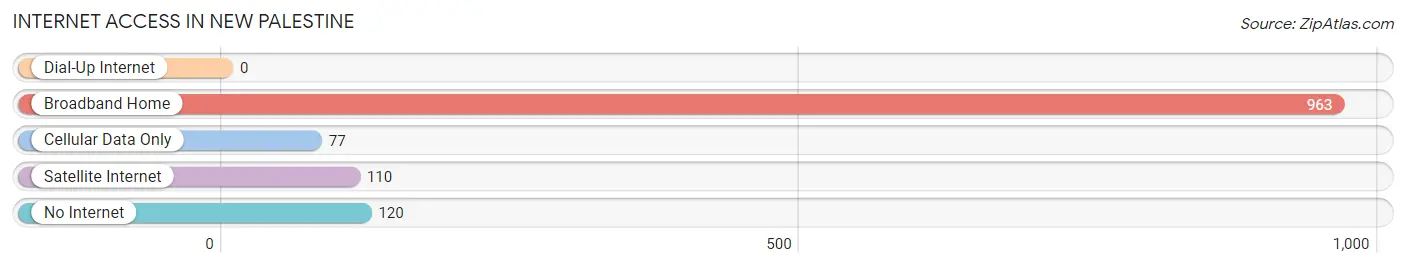
| Internet Type | # Households | % Households |
| Dial-Up Internet | 0 | 0.0% |
| Broadband Home | 963 | 80.3% |
| Cellular Data Only | 77 | 6.4% |
| Satellite Internet | 110 | 9.2% |
| No Internet | 120 | 10.0% |
| Total | 1,199 | 100.0% |
New Palestine Summary
New Palestine, Indiana is a small town located in the eastern part of Hancock County, Indiana. It is situated approximately 20 miles east of Indianapolis and is part of the Indianapolis metropolitan area. The town has a population of approximately 2,500 people and is known for its rural charm and small-town atmosphere.
History
New Palestine was founded in 1834 by a group of settlers from Pennsylvania. The town was named after the biblical land of Palestine, which was the home of the ancient Israelites. The settlers were attracted to the area due to its fertile soil and abundant natural resources. The town was officially incorporated in 1837 and quickly grew to become a thriving agricultural community.
In the late 19th century, the town began to experience a period of growth and development. The railroad arrived in 1883, connecting New Palestine to Indianapolis and other nearby towns. This allowed for the transportation of goods and services, which helped to spur economic growth. The town also experienced a population boom, as many people moved to the area to take advantage of the new opportunities.
Geography
New Palestine is located in the eastern part of Hancock County, Indiana. It is situated approximately 20 miles east of Indianapolis and is part of the Indianapolis metropolitan area. The town is located in the flat, fertile plains of central Indiana. The town is surrounded by farmland and is home to several small lakes and ponds.
The climate in New Palestine is typical of the Midwest, with hot summers and cold winters. The average temperature in the summer is around 80 degrees Fahrenheit, while the average temperature in the winter is around 30 degrees Fahrenheit. The town receives an average of 40 inches of precipitation per year.
Economy
The economy of New Palestine is largely based on agriculture. The town is home to several large farms, which produce a variety of crops, including corn, soybeans, and wheat. The town also has several small businesses, including restaurants, retail stores, and service providers.
The town is also home to several manufacturing companies, which produce a variety of products, including furniture, automotive parts, and medical supplies. The town is also home to several small technology companies, which provide software and web development services.
Demographics
As of the 2010 census, the population of New Palestine was 2,500 people. The town is predominantly white, with approximately 95% of the population identifying as Caucasian. The town also has a small Hispanic population, with approximately 3% of the population identifying as Hispanic or Latino.
The median household income in New Palestine is approximately $50,000 per year. The town has a low unemployment rate, with only 4.5% of the population unemployed. The town also has a low poverty rate, with only 8.5% of the population living below the poverty line.
Conclusion
New Palestine, Indiana is a small town located in the eastern part of Hancock County, Indiana. It is situated approximately 20 miles east of Indianapolis and is part of the Indianapolis metropolitan area. The town has a population of approximately 2,500 people and is known for its rural charm and small-town atmosphere. The economy of New Palestine is largely based on agriculture, with several large farms producing a variety of crops. The town also has several small businesses, manufacturing companies, and technology companies. The population of New Palestine is predominantly white, with a small Hispanic population. The median household income in New Palestine is approximately $50,000 per year, and the town has a low unemployment and poverty rate.
Common Questions
What is Per Capita Income in New Palestine?
Per Capita income in New Palestine is $49,748.
What is the Median Family Income in New Palestine?
Median Family Income in New Palestine is $112,596.
What is the Median Household income in New Palestine?
Median Household Income in New Palestine is $86,082.
What is Income or Wage Gap in New Palestine?
Income or Wage Gap in New Palestine is 39.9%.
Women in New Palestine earn 60.1 cents for every dollar earned by a man.
What is Inequality or Gini Index in New Palestine?
Inequality or Gini Index in New Palestine is 0.42.
What is the Total Population of New Palestine?
Total Population of New Palestine is 2,831.
What is the Total Male Population of New Palestine?
Total Male Population of New Palestine is 1,407.
What is the Total Female Population of New Palestine?
Total Female Population of New Palestine is 1,424.
What is the Ratio of Males per 100 Females in New Palestine?
There are 98.81 Males per 100 Females in New Palestine.
What is the Ratio of Females per 100 Males in New Palestine?
There are 101.21 Females per 100 Males in New Palestine.
What is the Median Population Age in New Palestine?
Median Population Age in New Palestine is 44.4 Years.
What is the Average Family Size in New Palestine
Average Family Size in New Palestine is 2.8 People.
What is the Average Household Size in New Palestine
Average Household Size in New Palestine is 2.4 People.
How Large is the Labor Force in New Palestine?
There are 1,580 People in the Labor Forcein in New Palestine.
What is the Percentage of People in the Labor Force in New Palestine?
68.1% of People are in the Labor Force in New Palestine.
What is the Unemployment Rate in New Palestine?
Unemployment Rate in New Palestine is 5.0%.