Beverly Shores, IN Map & Demographics
Beverly Shores Map
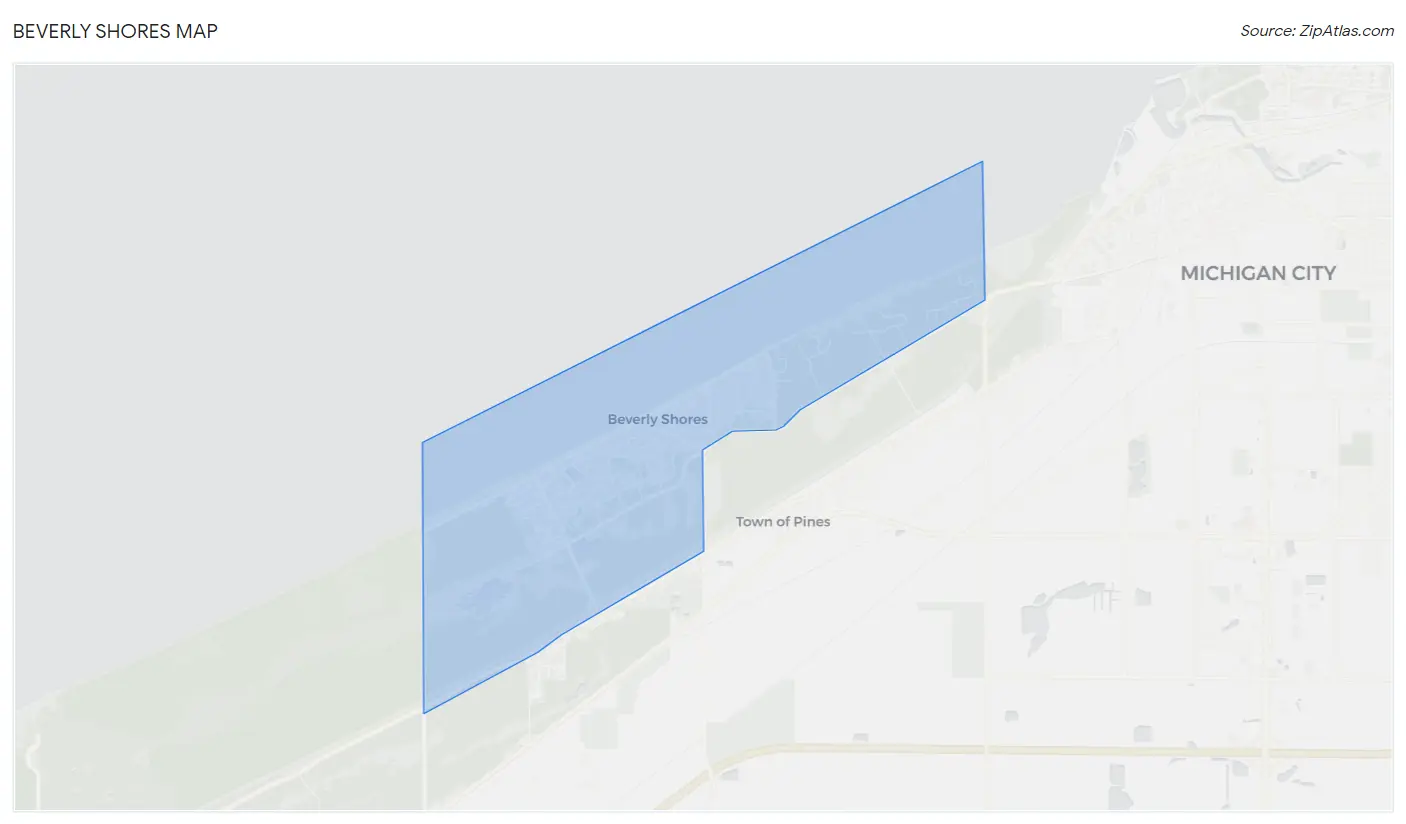
Beverly Shores Overview
$79,084
PER CAPITA INCOME
$118,586
AVG FAMILY INCOME
$116,071
AVG HOUSEHOLD INCOME
28.1%
WAGE / INCOME GAP [ % ]
71.9¢/ $1
WAGE / INCOME GAP [ $ ]
0.44
INEQUALITY / GINI INDEX
578
TOTAL POPULATION
274
MALE POPULATION
304
FEMALE POPULATION
90.13
MALES / 100 FEMALES
110.95
FEMALES / 100 MALES
65.0
MEDIAN AGE
2.3
AVG FAMILY SIZE
2.0
AVG HOUSEHOLD SIZE
172
LABOR FORCE [ PEOPLE ]
32.5%
PERCENT IN LABOR FORCE
2.3%
UNEMPLOYMENT RATE
Beverly Shores Zip Codes
Beverly Shores Area Codes
Income in Beverly Shores
Income Overview in Beverly Shores
Per Capita Income in Beverly Shores is $79,084, while median incomes of families and households are $118,586 and $116,071 respectively.
| Characteristic | Number | Measure |
| Per Capita Income | 578 | $79,084 |
| Median Family Income | 213 | $118,586 |
| Mean Family Income | 213 | $177,557 |
| Median Household Income | 294 | $116,071 |
| Mean Household Income | 294 | $156,230 |
| Income Deficit | 213 | $0 |
| Wage / Income Gap (%) | 578 | 28.09% |
| Wage / Income Gap ($) | 578 | 71.91¢ per $1 |
| Gini / Inequality Index | 578 | 0.44 |
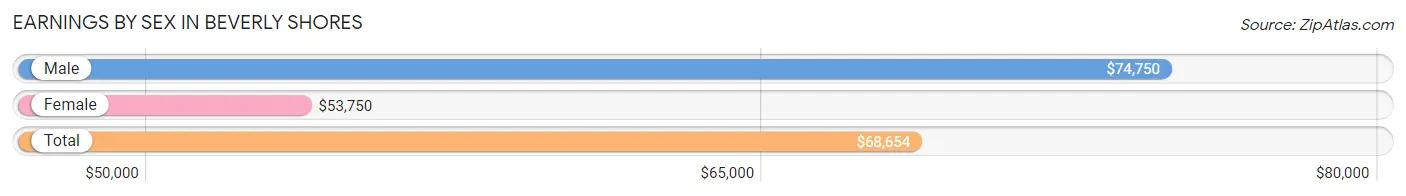
Earnings by Sex in Beverly Shores
Average Earnings in Beverly Shores are $68,654, $74,750 for men and $53,750 for women, a difference of 28.1%.
| Sex | Number | Average Earnings |
| Male | 95 (53.4%) | $74,750 |
| Female | 83 (46.6%) | $53,750 |
| Total | 178 (100.0%) | $68,654 |
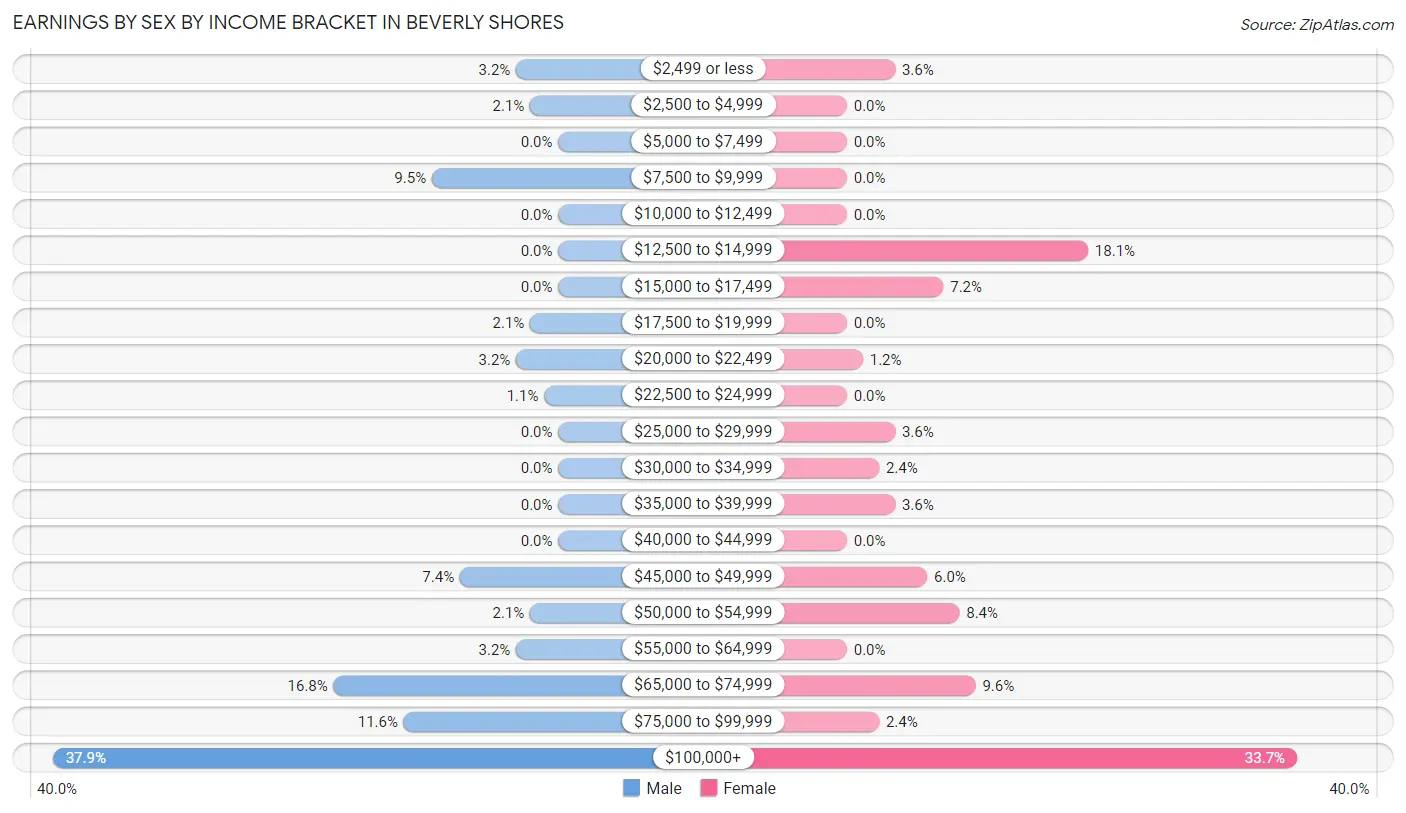
Earnings by Sex by Income Bracket in Beverly Shores
The most common earnings brackets in Beverly Shores are $100,000+ for men (36 | 37.9%) and $100,000+ for women (28 | 33.7%).
| Income | Male | Female |
| $2,499 or less | 3 (3.2%) | 3 (3.6%) |
| $2,500 to $4,999 | 2 (2.1%) | 0 (0.0%) |
| $5,000 to $7,499 | 0 (0.0%) | 0 (0.0%) |
| $7,500 to $9,999 | 9 (9.5%) | 0 (0.0%) |
| $10,000 to $12,499 | 0 (0.0%) | 0 (0.0%) |
| $12,500 to $14,999 | 0 (0.0%) | 15 (18.1%) |
| $15,000 to $17,499 | 0 (0.0%) | 6 (7.2%) |
| $17,500 to $19,999 | 2 (2.1%) | 0 (0.0%) |
| $20,000 to $22,499 | 3 (3.2%) | 1 (1.2%) |
| $22,500 to $24,999 | 1 (1.1%) | 0 (0.0%) |
| $25,000 to $29,999 | 0 (0.0%) | 3 (3.6%) |
| $30,000 to $34,999 | 0 (0.0%) | 2 (2.4%) |
| $35,000 to $39,999 | 0 (0.0%) | 3 (3.6%) |
| $40,000 to $44,999 | 0 (0.0%) | 0 (0.0%) |
| $45,000 to $49,999 | 7 (7.4%) | 5 (6.0%) |
| $50,000 to $54,999 | 2 (2.1%) | 7 (8.4%) |
| $55,000 to $64,999 | 3 (3.2%) | 0 (0.0%) |
| $65,000 to $74,999 | 16 (16.8%) | 8 (9.6%) |
| $75,000 to $99,999 | 11 (11.6%) | 2 (2.4%) |
| $100,000+ | 36 (37.9%) | 28 (33.7%) |
| Total | 95 (100.0%) | 83 (100.0%) |
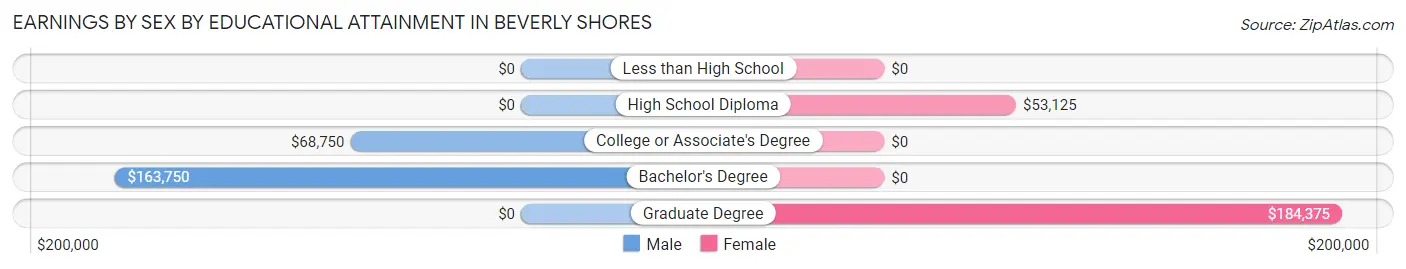
Earnings by Sex by Educational Attainment in Beverly Shores
Average earnings in Beverly Shores are $74,750 for men and $53,750 for women, a difference of 28.1%. Men with an educational attainment of bachelor's degree enjoy the highest average annual earnings of $163,750, while those with college or associate's degree education earn the least with $68,750. Women with an educational attainment of graduate degree earn the most with the average annual earnings of $184,375, while those with high school diploma education have the smallest earnings of $53,125.
| Educational Attainment | Male Income | Female Income |
| Less than High School | - | - |
| High School Diploma | - | - |
| College or Associate's Degree | $68,750 | $0 |
| Bachelor's Degree | $163,750 | $0 |
| Graduate Degree | - | - |
| Total | $74,750 | $53,750 |
Family Income in Beverly Shores
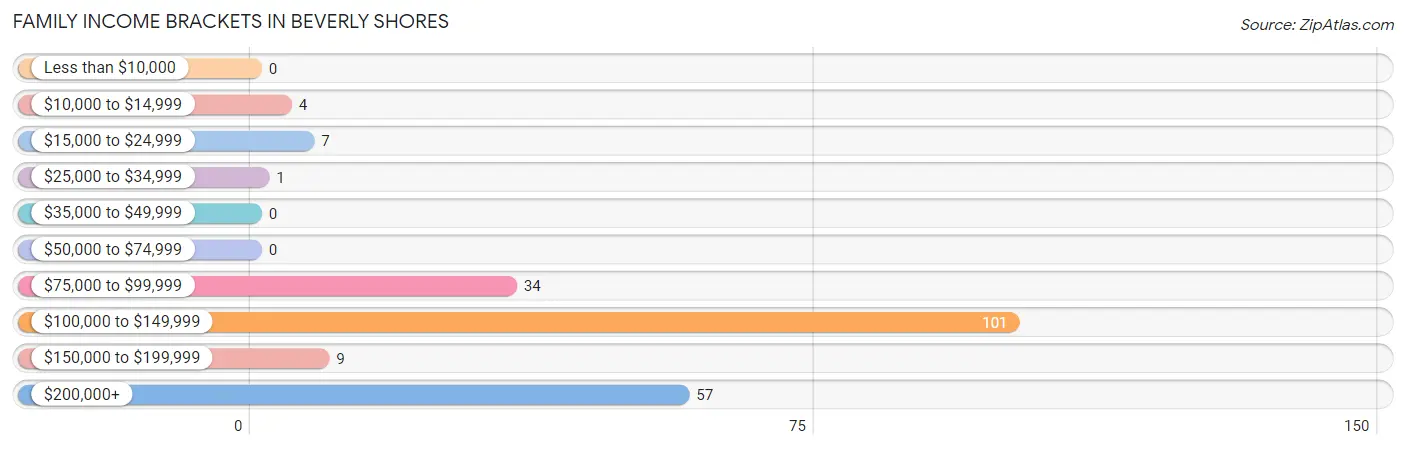
Family Income Brackets in Beverly Shores
According to the Beverly Shores family income data, there are 101 families falling into the $100,000 to $149,999 income range, which is the most common income bracket and makes up 47.4% of all families.
| Income Bracket | # Families | % Families |
| Less than $10,000 | 0 | 0.0% |
| $10,000 to $14,999 | 4 | 1.9% |
| $15,000 to $24,999 | 7 | 3.3% |
| $25,000 to $34,999 | 1 | 0.5% |
| $35,000 to $49,999 | 0 | 0.0% |
| $50,000 to $74,999 | 0 | 0.0% |
| $75,000 to $99,999 | 34 | 16.0% |
| $100,000 to $149,999 | 101 | 47.4% |
| $150,000 to $199,999 | 9 | 4.2% |
| $200,000+ | 57 | 26.8% |
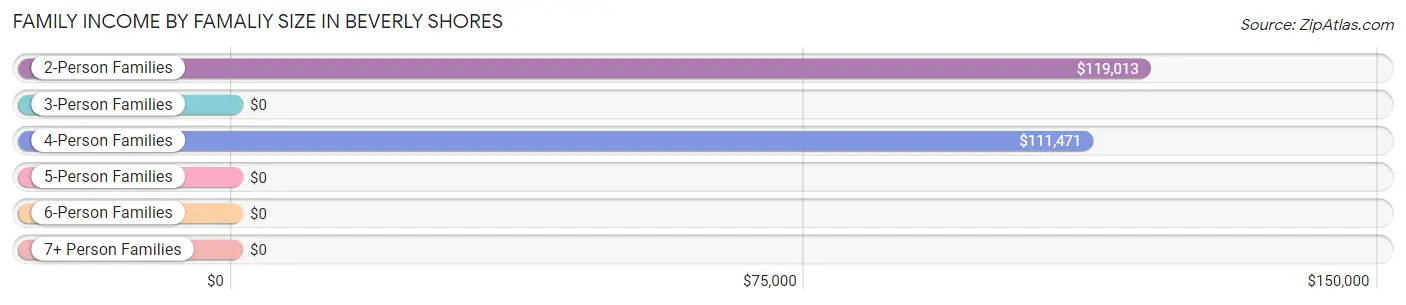
Family Income by Famaliy Size in Beverly Shores
2-person families (176 | 82.6%) account for the highest median family income in Beverly Shores with $119,013 per family, while 2-person families (176 | 82.6%) have the highest median income of $59,506 per family member.
| Income Bracket | # Families | Median Income |
| 2-Person Families | 176 (82.6%) | $119,013 |
| 3-Person Families | 11 (5.2%) | $0 |
| 4-Person Families | 26 (12.2%) | $111,471 |
| 5-Person Families | 0 (0.0%) | $0 |
| 6-Person Families | 0 (0.0%) | $0 |
| 7+ Person Families | 0 (0.0%) | $0 |
| Total | 213 (100.0%) | $118,586 |
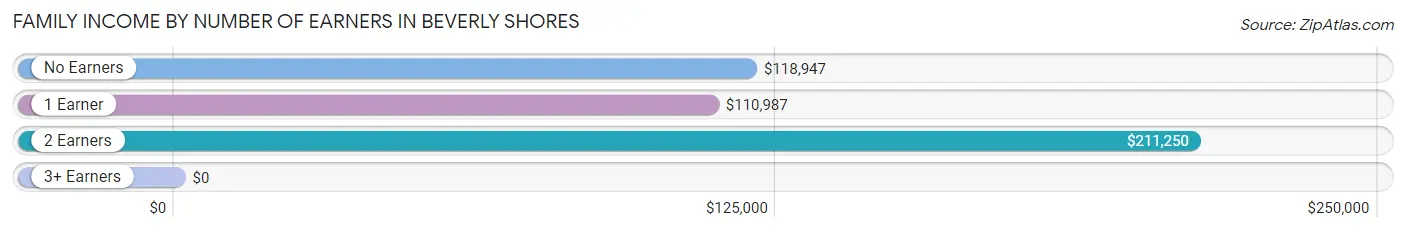
Family Income by Number of Earners in Beverly Shores
| Number of Earners | # Families | Median Income |
| No Earners | 102 (47.9%) | $118,947 |
| 1 Earner | 85 (39.9%) | $110,987 |
| 2 Earners | 26 (12.2%) | $211,250 |
| 3+ Earners | 0 (0.0%) | $0 |
| Total | 213 (100.0%) | $118,586 |
Household Income in Beverly Shores
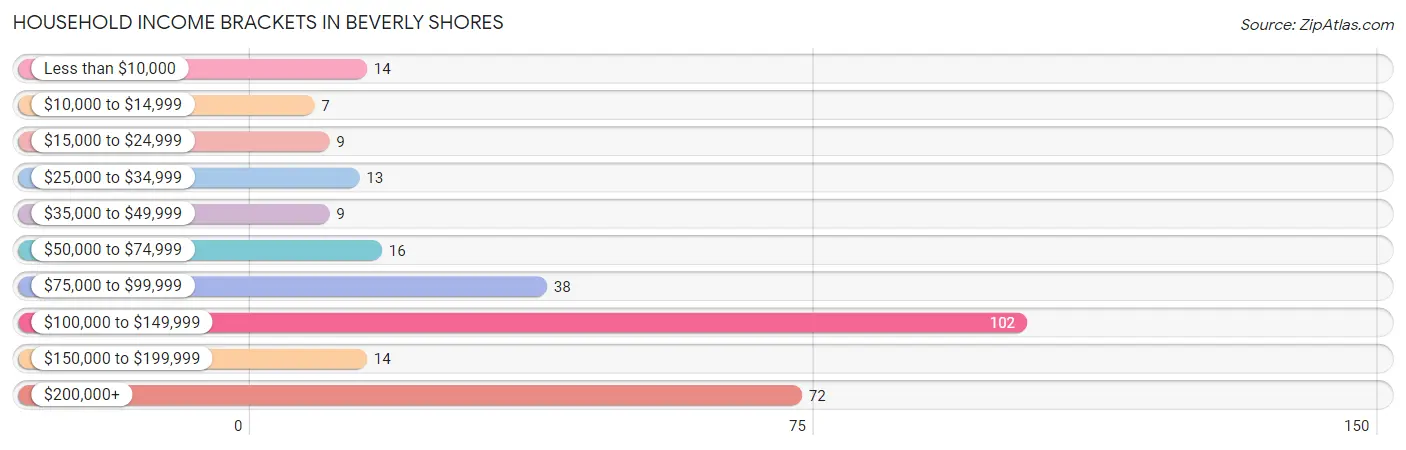
Household Income Brackets in Beverly Shores
With 102 households falling in the category, the $100,000 to $149,999 income range is the most frequent in Beverly Shores, accounting for 34.7% of all households. In contrast, only 7 households (2.4%) fall into the $10,000 to $14,999 income bracket, making it the least populous group.
| Income Bracket | # Households | % Households |
| Less than $10,000 | 14 | 4.8% |
| $10,000 to $14,999 | 7 | 2.4% |
| $15,000 to $24,999 | 9 | 3.1% |
| $25,000 to $34,999 | 13 | 4.4% |
| $35,000 to $49,999 | 9 | 3.1% |
| $50,000 to $74,999 | 16 | 5.4% |
| $75,000 to $99,999 | 38 | 12.9% |
| $100,000 to $149,999 | 102 | 34.7% |
| $150,000 to $199,999 | 14 | 4.8% |
| $200,000+ | 72 | 24.5% |
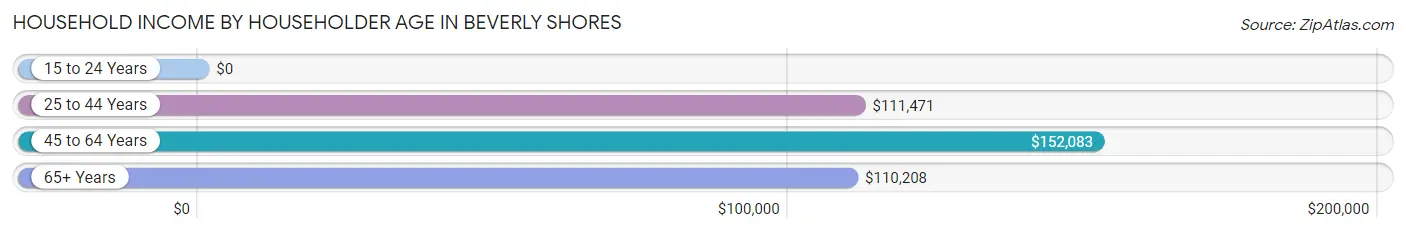
Household Income by Householder Age in Beverly Shores
The median household income in Beverly Shores is $116,071, with the highest median household income of $152,083 found in the 45 to 64 years age bracket for the primary householder. A total of 103 households (35.0%) fall into this category.
| Income Bracket | # Households | Median Income |
| 15 to 24 Years | 0 (0.0%) | $0 |
| 25 to 44 Years | 24 (8.2%) | $111,471 |
| 45 to 64 Years | 103 (35.0%) | $152,083 |
| 65+ Years | 167 (56.8%) | $110,208 |
| Total | 294 (100.0%) | $116,071 |
Poverty in Beverly Shores
Income Below Poverty by Sex and Age in Beverly Shores
With 3.6% poverty level for males and 8.9% for females among the residents of Beverly Shores, 35 to 44 year old males and 55 to 64 year old females are the most vulnerable to poverty, with 2 males (12.5%) and 18 females (22.2%) in their respective age groups living below the poverty level.
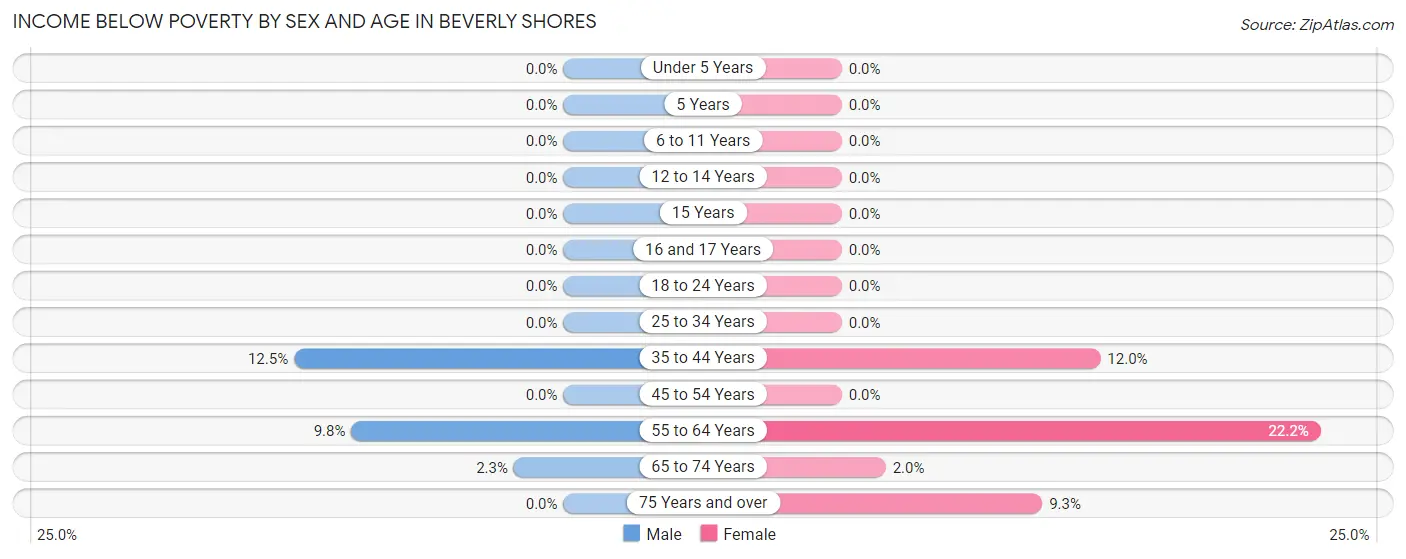
| Age Bracket | Male | Female |
| Under 5 Years | 0 (0.0%) | 0 (0.0%) |
| 5 Years | 0 (0.0%) | 0 (0.0%) |
| 6 to 11 Years | 0 (0.0%) | 0 (0.0%) |
| 12 to 14 Years | 0 (0.0%) | 0 (0.0%) |
| 15 Years | 0 (0.0%) | 0 (0.0%) |
| 16 and 17 Years | 0 (0.0%) | 0 (0.0%) |
| 18 to 24 Years | 0 (0.0%) | 0 (0.0%) |
| 25 to 34 Years | 0 (0.0%) | 0 (0.0%) |
| 35 to 44 Years | 2 (12.5%) | 3 (12.0%) |
| 45 to 54 Years | 0 (0.0%) | 0 (0.0%) |
| 55 to 64 Years | 6 (9.8%) | 18 (22.2%) |
| 65 to 74 Years | 2 (2.3%) | 2 (2.0%) |
| 75 Years and over | 0 (0.0%) | 4 (9.3%) |
| Total | 10 (3.6%) | 27 (8.9%) |
Income Above Poverty by Sex and Age in Beverly Shores
According to the poverty statistics in Beverly Shores, males aged under 5 years and females aged under 5 years are the age groups that are most secure financially, with 100.0% of males and 100.0% of females in these age groups living above the poverty line.
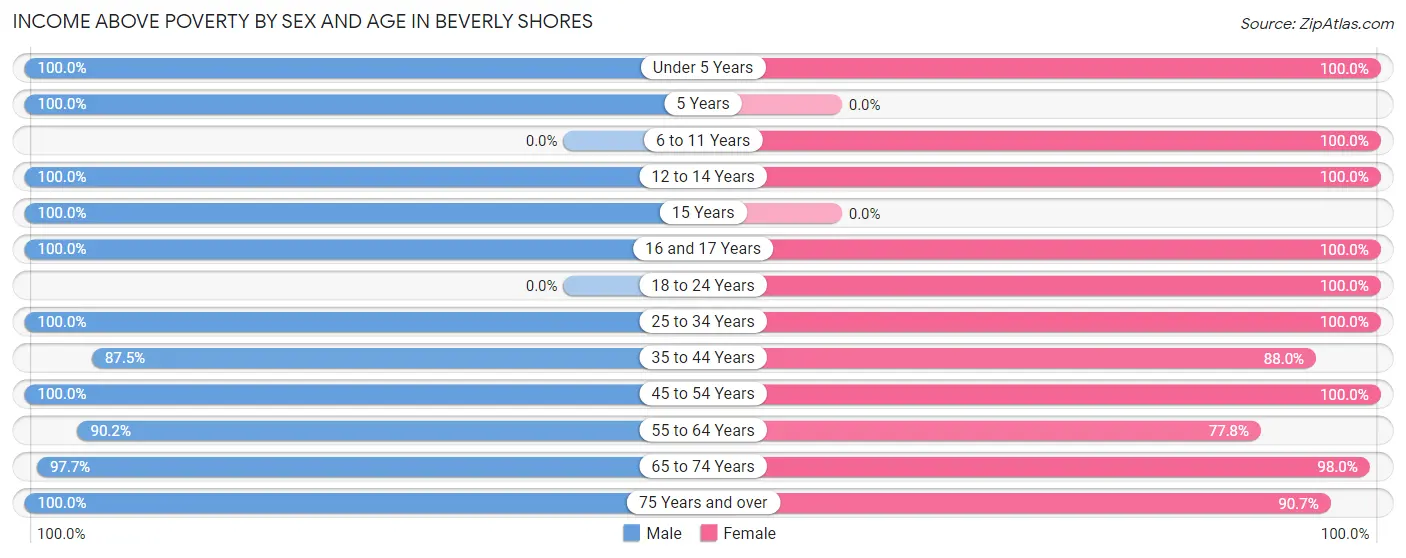
| Age Bracket | Male | Female |
| Under 5 Years | 5 (100.0%) | 2 (100.0%) |
| 5 Years | 14 (100.0%) | 0 (0.0%) |
| 6 to 11 Years | 0 (0.0%) | 15 (100.0%) |
| 12 to 14 Years | 3 (100.0%) | 2 (100.0%) |
| 15 Years | 8 (100.0%) | 0 (0.0%) |
| 16 and 17 Years | 3 (100.0%) | 4 (100.0%) |
| 18 to 24 Years | 0 (0.0%) | 2 (100.0%) |
| 25 to 34 Years | 2 (100.0%) | 3 (100.0%) |
| 35 to 44 Years | 14 (87.5%) | 22 (88.0%) |
| 45 to 54 Years | 15 (100.0%) | 29 (100.0%) |
| 55 to 64 Years | 55 (90.2%) | 63 (77.8%) |
| 65 to 74 Years | 85 (97.7%) | 96 (98.0%) |
| 75 Years and over | 60 (100.0%) | 39 (90.7%) |
| Total | 264 (96.4%) | 277 (91.1%) |
Income Below Poverty Among Married-Couple Families in Beverly Shores
The poverty statistics for married-couple families in Beverly Shores show that 1.9% or 4 of the total 205 families live below the poverty line. Families with no children have the highest poverty rate of 2.4%, comprising of 4 families. On the other hand, families with 1 or 2 children have the lowest poverty rate of 0.0%, which includes 0 families.
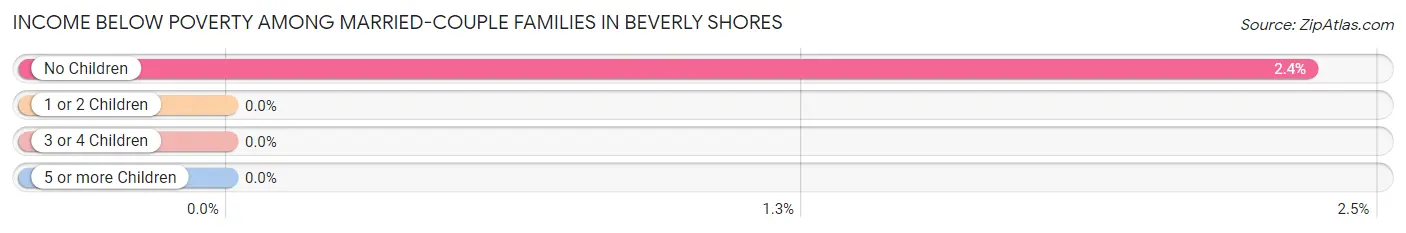
| Children | Above Poverty | Below Poverty |
| No Children | 166 (97.7%) | 4 (2.4%) |
| 1 or 2 Children | 35 (100.0%) | 0 (0.0%) |
| 3 or 4 Children | 0 (0.0%) | 0 (0.0%) |
| 5 or more Children | 0 (0.0%) | 0 (0.0%) |
| Total | 201 (98.1%) | 4 (1.9%) |
Income Below Poverty Among Single-Parent Households in Beverly Shores
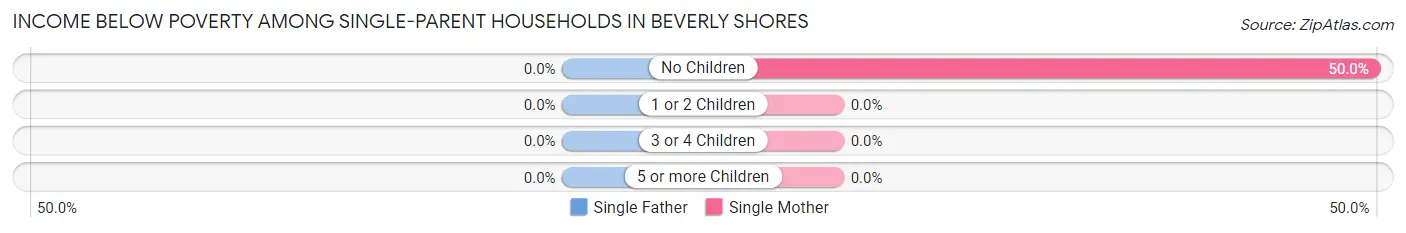
| Children | Single Father | Single Mother |
| No Children | 0 (0.0%) | 4 (50.0%) |
| 1 or 2 Children | 0 (0.0%) | 0 (0.0%) |
| 3 or 4 Children | 0 (0.0%) | 0 (0.0%) |
| 5 or more Children | 0 (0.0%) | 0 (0.0%) |
| Total | 0 (0.0%) | 4 (50.0%) |
Income Below Poverty Among Married-Couple vs Single-Parent Households in Beverly Shores
The poverty data for Beverly Shores shows that 4 of the married-couple family households (1.9%) and 4 of the single-parent households (50.0%) are living below the poverty level. Within the married-couple family households, those with no children have the highest poverty rate, with 4 households (2.4%) falling below the poverty line. Among the single-parent households, those with no children have the highest poverty rate, with 4 household (50.0%) living below poverty.
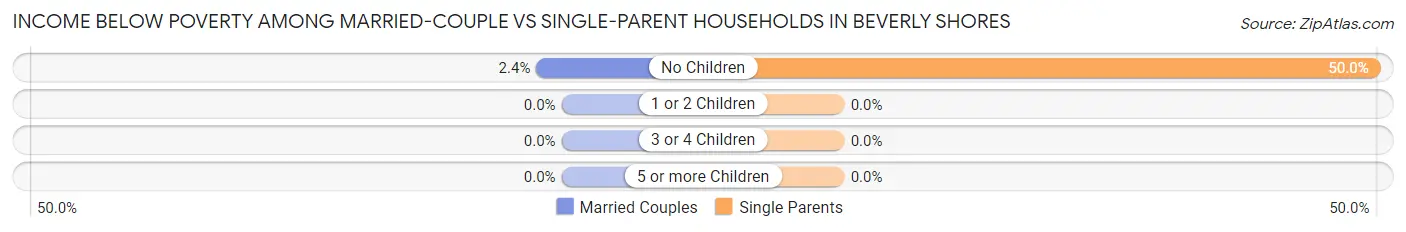
| Children | Married-Couple Families | Single-Parent Households |
| No Children | 4 (2.4%) | 4 (50.0%) |
| 1 or 2 Children | 0 (0.0%) | 0 (0.0%) |
| 3 or 4 Children | 0 (0.0%) | 0 (0.0%) |
| 5 or more Children | 0 (0.0%) | 0 (0.0%) |
| Total | 4 (1.9%) | 4 (50.0%) |
Race in Beverly Shores
The most populous races in Beverly Shores are White / Caucasian (562 | 97.2%), Two or more Races (11 | 1.9%), and Hispanic or Latino (7 | 1.2%).
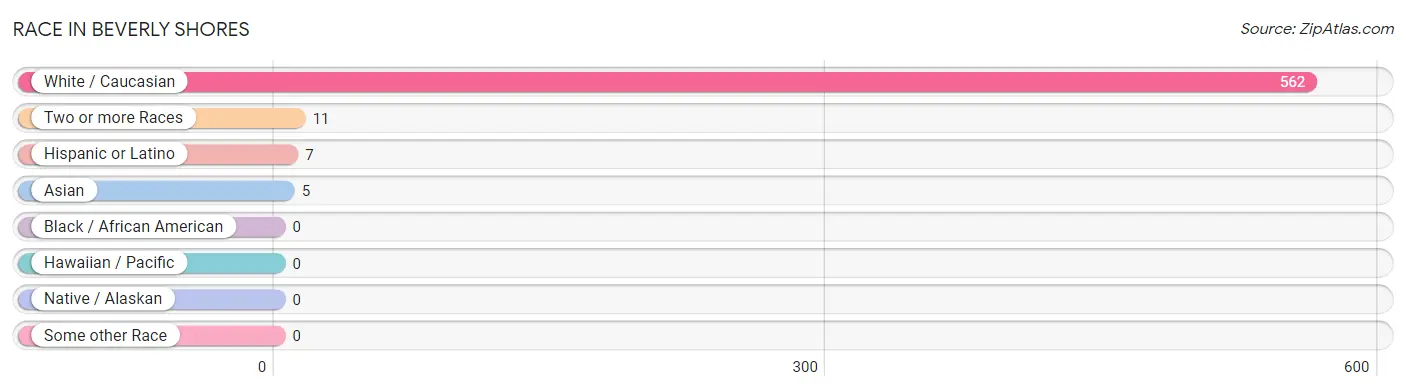
| Race | # Population | % Population |
| Asian | 5 | 0.9% |
| Black / African American | 0 | 0.0% |
| Hawaiian / Pacific | 0 | 0.0% |
| Hispanic or Latino | 7 | 1.2% |
| Native / Alaskan | 0 | 0.0% |
| White / Caucasian | 562 | 97.2% |
| Two or more Races | 11 | 1.9% |
| Some other Race | 0 | 0.0% |
| Total | 578 | 100.0% |
Ancestry in Beverly Shores
The most populous ancestries reported in Beverly Shores are German (147 | 25.4%), Irish (117 | 20.2%), English (87 | 15.0%), Polish (81 | 14.0%), and Dutch (59 | 10.2%), together accounting for 84.9% of all Beverly Shores residents.
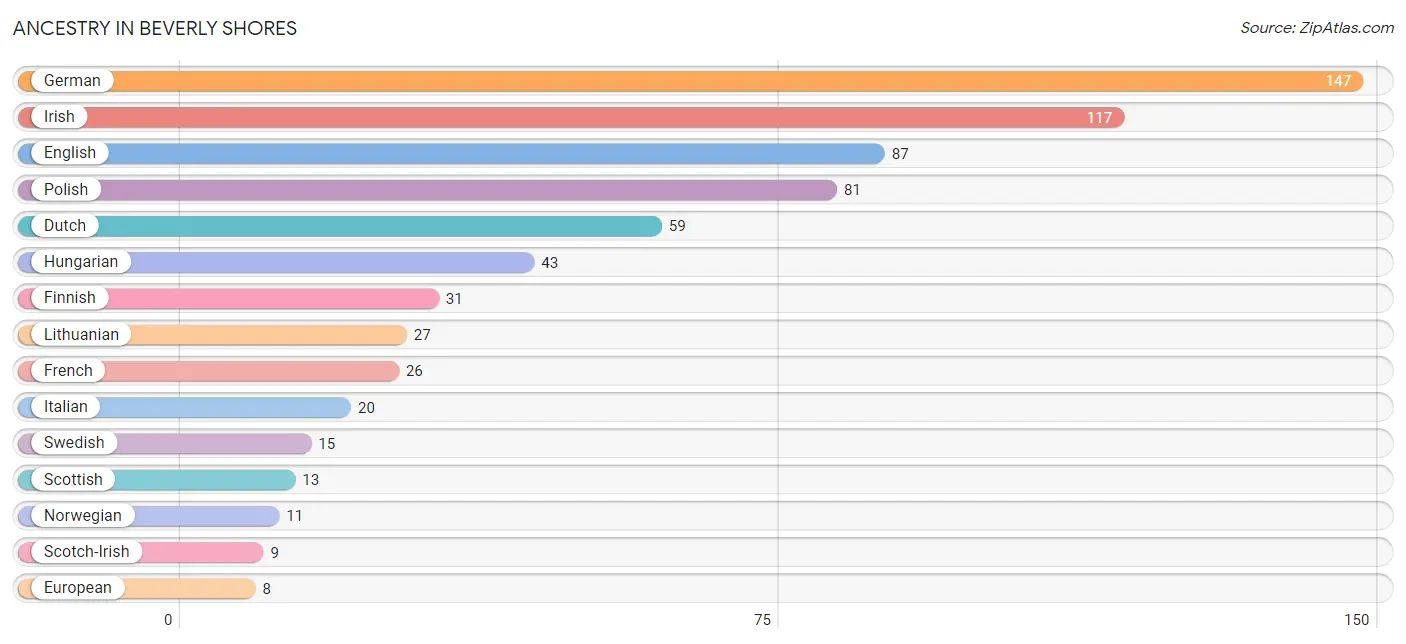
| Ancestry | # Population | % Population |
| Austrian | 2 | 0.4% |
| Bhutanese | 5 | 0.9% |
| British | 4 | 0.7% |
| Cherokee | 3 | 0.5% |
| Croatian | 4 | 0.7% |
| Czech | 2 | 0.4% |
| Dutch | 59 | 10.2% |
| Eastern European | 2 | 0.4% |
| English | 87 | 15.0% |
| European | 8 | 1.4% |
| Finnish | 31 | 5.4% |
| French | 26 | 4.5% |
| French Canadian | 2 | 0.4% |
| German | 147 | 25.4% |
| Hungarian | 43 | 7.4% |
| Irish | 117 | 20.2% |
| Italian | 20 | 3.5% |
| Latvian | 3 | 0.5% |
| Lithuanian | 27 | 4.7% |
| Mexican | 4 | 0.7% |
| Norwegian | 11 | 1.9% |
| Osage | 2 | 0.4% |
| Polish | 81 | 14.0% |
| Puerto Rican | 3 | 0.5% |
| Romanian | 2 | 0.4% |
| Russian | 6 | 1.0% |
| Scandinavian | 1 | 0.2% |
| Scotch-Irish | 9 | 1.6% |
| Scottish | 13 | 2.2% |
| Slovak | 2 | 0.4% |
| Swedish | 15 | 2.6% |
| Swiss | 2 | 0.4% |
| Welsh | 3 | 0.5% | View All 33 Rows |
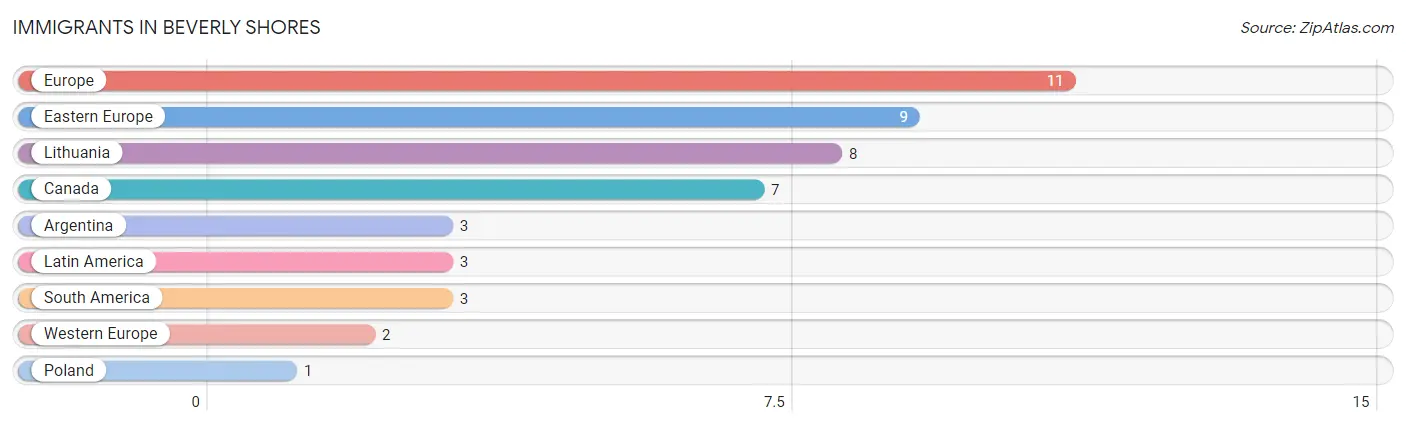
Immigrants in Beverly Shores
The most numerous immigrant groups reported in Beverly Shores came from Europe (11 | 1.9%), Eastern Europe (9 | 1.6%), Lithuania (8 | 1.4%), Canada (7 | 1.2%), and Argentina (3 | 0.5%), together accounting for 6.6% of all Beverly Shores residents.
| Immigration Origin | # Population | % Population |
| Argentina | 3 | 0.5% |
| Canada | 7 | 1.2% |
| Eastern Europe | 9 | 1.6% |
| Europe | 11 | 1.9% |
| Latin America | 3 | 0.5% |
| Lithuania | 8 | 1.4% |
| Poland | 1 | 0.2% |
| South America | 3 | 0.5% |
| Western Europe | 2 | 0.4% | View All 9 Rows |
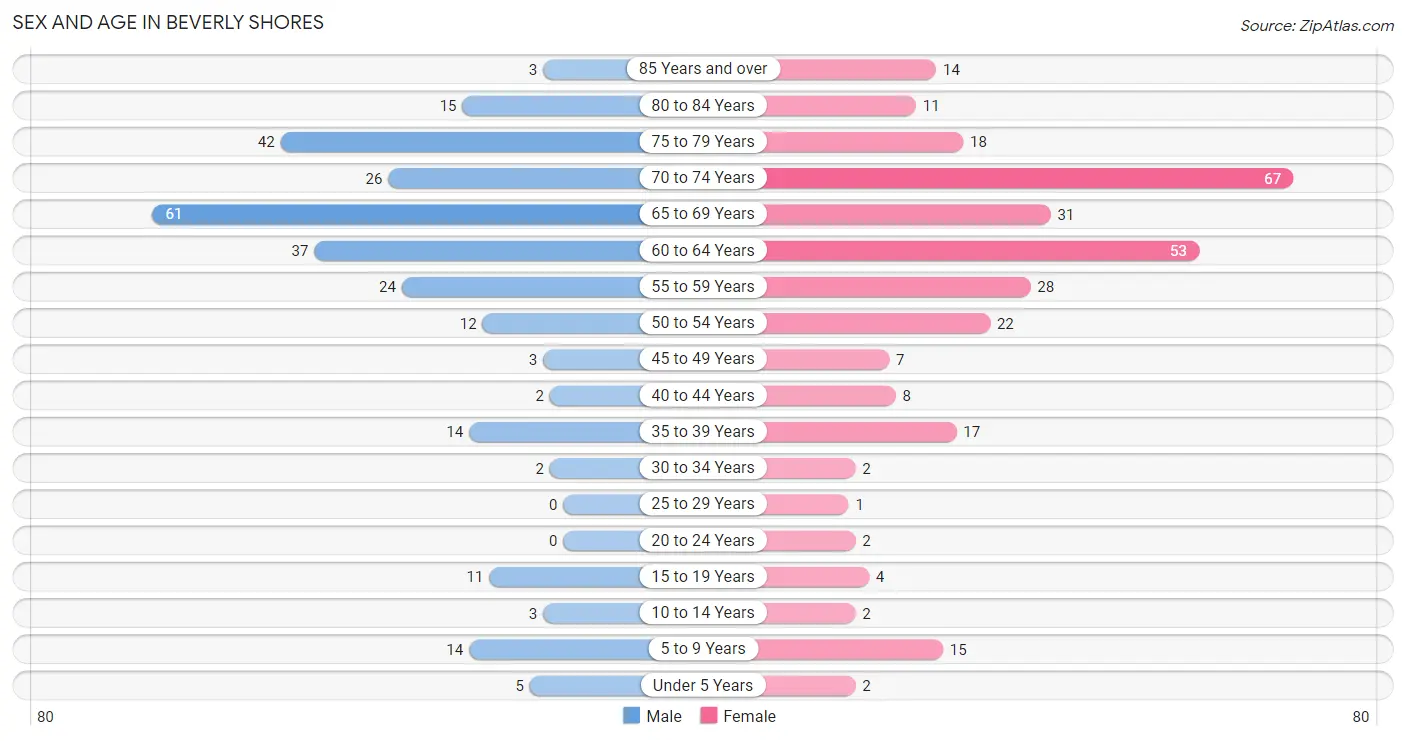
Sex and Age in Beverly Shores
Sex and Age in Beverly Shores
The most populous age groups in Beverly Shores are 65 to 69 Years (61 | 22.3%) for men and 70 to 74 Years (67 | 22.0%) for women.
| Age Bracket | Male | Female |
| Under 5 Years | 5 (1.8%) | 2 (0.7%) |
| 5 to 9 Years | 14 (5.1%) | 15 (4.9%) |
| 10 to 14 Years | 3 (1.1%) | 2 (0.7%) |
| 15 to 19 Years | 11 (4.0%) | 4 (1.3%) |
| 20 to 24 Years | 0 (0.0%) | 2 (0.7%) |
| 25 to 29 Years | 0 (0.0%) | 1 (0.3%) |
| 30 to 34 Years | 2 (0.7%) | 2 (0.7%) |
| 35 to 39 Years | 14 (5.1%) | 17 (5.6%) |
| 40 to 44 Years | 2 (0.7%) | 8 (2.6%) |
| 45 to 49 Years | 3 (1.1%) | 7 (2.3%) |
| 50 to 54 Years | 12 (4.4%) | 22 (7.2%) |
| 55 to 59 Years | 24 (8.8%) | 28 (9.2%) |
| 60 to 64 Years | 37 (13.5%) | 53 (17.4%) |
| 65 to 69 Years | 61 (22.3%) | 31 (10.2%) |
| 70 to 74 Years | 26 (9.5%) | 67 (22.0%) |
| 75 to 79 Years | 42 (15.3%) | 18 (5.9%) |
| 80 to 84 Years | 15 (5.5%) | 11 (3.6%) |
| 85 Years and over | 3 (1.1%) | 14 (4.6%) |
| Total | 274 (100.0%) | 304 (100.0%) |
Families and Households in Beverly Shores
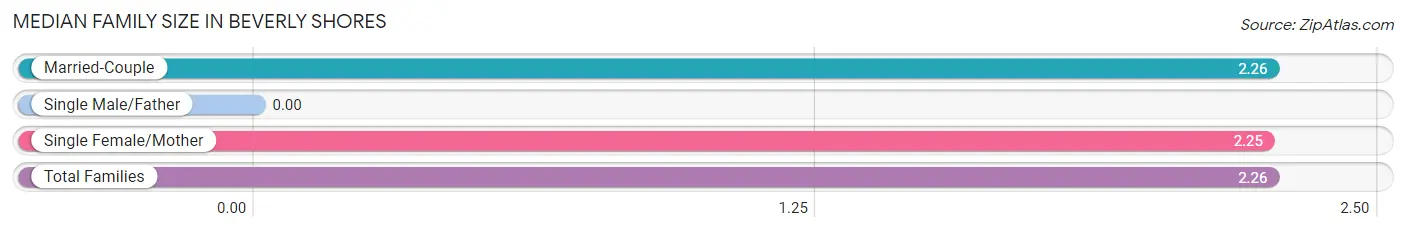
Median Family Size in Beverly Shores
| Family Type | # Families | Family Size |
| Married-Couple | 205 (96.2%) | 2.26 |
| Single Male/Father | 0 (0.0%) | - |
| Single Female/Mother | 8 (3.8%) | 2.25 |
| Total Families | 213 (100.0%) | 2.26 |
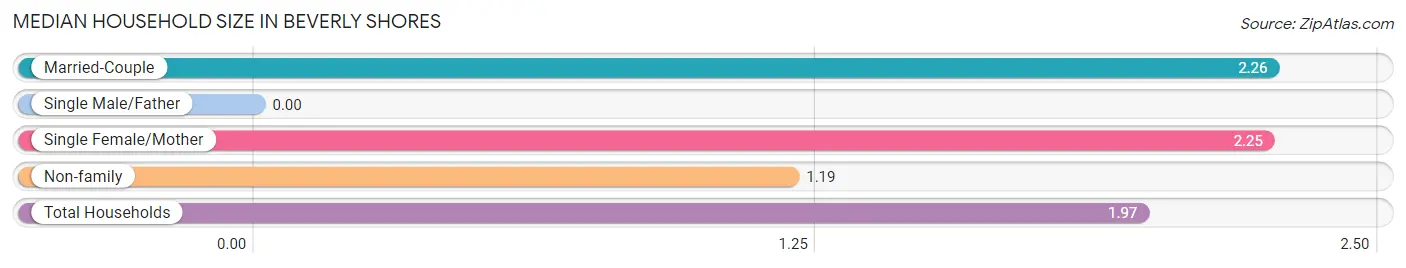
Median Household Size in Beverly Shores
| Household Type | # Households | Household Size |
| Married-Couple | 205 (69.7%) | 2.26 |
| Single Male/Father | 0 (0.0%) | - |
| Single Female/Mother | 8 (2.7%) | 2.25 |
| Non-family | 81 (27.6%) | 1.19 |
| Total Households | 294 (100.0%) | 1.97 |
Household Size by Marriage Status in Beverly Shores
Out of a total of 294 households in Beverly Shores, 213 (72.5%) are family households, while 81 (27.6%) are nonfamily households. The most numerous type of family households are 2-person households, comprising 176, and the most common type of nonfamily households are 1-person households, comprising 68.
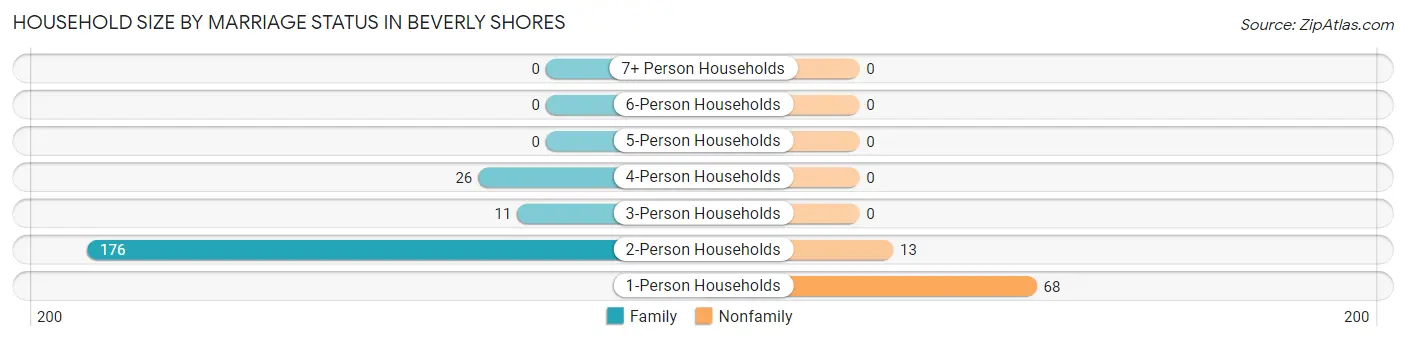
| Household Size | Family Households | Nonfamily Households |
| 1-Person Households | - | 68 (23.1%) |
| 2-Person Households | 176 (59.9%) | 13 (4.4%) |
| 3-Person Households | 11 (3.7%) | 0 (0.0%) |
| 4-Person Households | 26 (8.8%) | 0 (0.0%) |
| 5-Person Households | 0 (0.0%) | 0 (0.0%) |
| 6-Person Households | 0 (0.0%) | 0 (0.0%) |
| 7+ Person Households | 0 (0.0%) | 0 (0.0%) |
| Total | 213 (72.5%) | 81 (27.6%) |
Female Fertility in Beverly Shores
Fertility by Age in Beverly Shores
Average fertility rate in Beverly Shores is 73.0 births per 1,000 women. Women in the age bracket of 35 to 50 years have the highest fertility rate with 94.0 births per 1,000 women. Women in the age bracket of 35 to 50 years acount for 100.0% of all women with births.
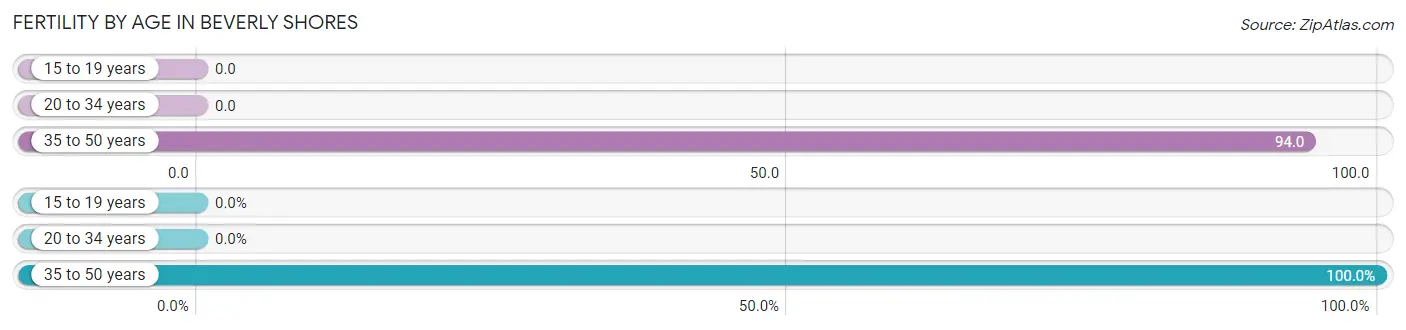
| Age Bracket | Women with Births | Births / 1,000 Women |
| 15 to 19 years | 0 (0.0%) | 0.0 |
| 20 to 34 years | 0 (0.0%) | 0.0 |
| 35 to 50 years | 3 (100.0%) | 94.0 |
| Total | 3 (100.0%) | 73.0 |
Fertility by Age by Marriage Status in Beverly Shores
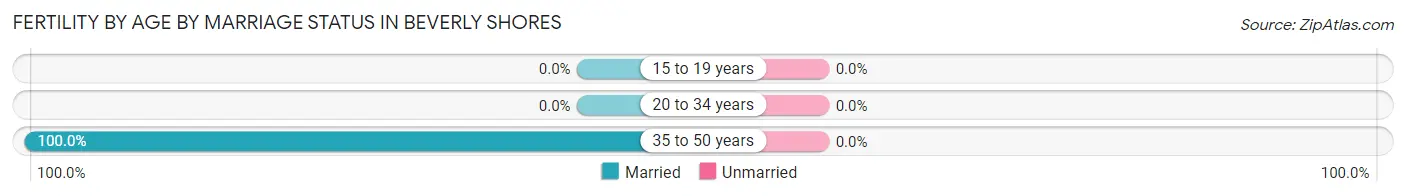
| Age Bracket | Married | Unmarried |
| 15 to 19 years | 0 (0.0%) | 0 (0.0%) |
| 20 to 34 years | 0 (0.0%) | 0 (0.0%) |
| 35 to 50 years | 3 (100.0%) | 0 (0.0%) |
| Total | 3 (100.0%) | 0 (0.0%) |
Fertility by Education in Beverly Shores
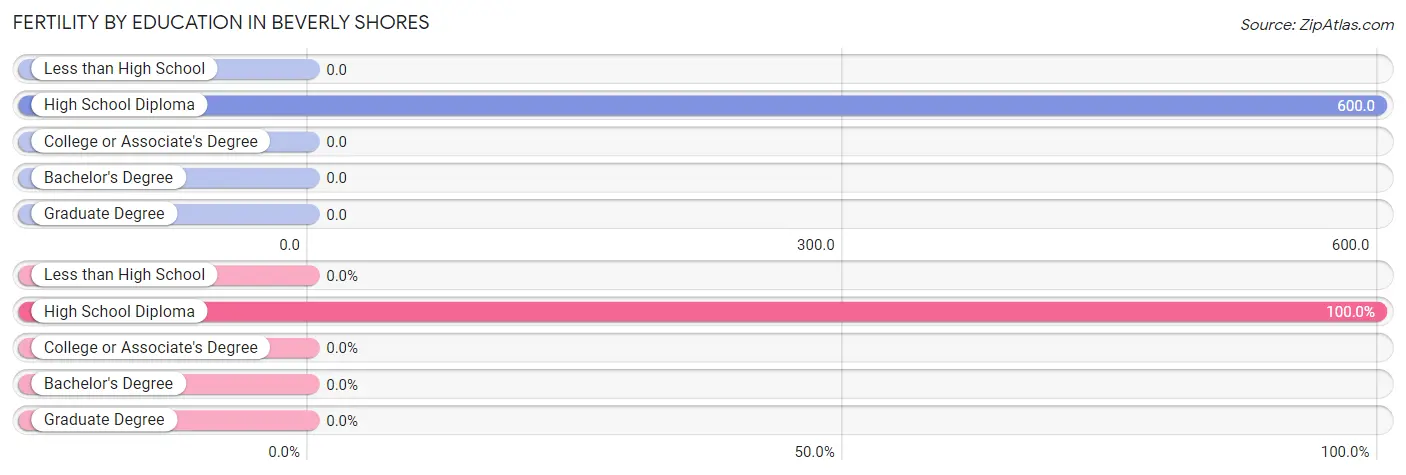
| Educational Attainment | Women with Births | Births / 1,000 Women |
| Less than High School | 0 (0.0%) | 0.0 |
| High School Diploma | 3 (100.0%) | 600.0 |
| College or Associate's Degree | 0 (0.0%) | 0.0 |
| Bachelor's Degree | 0 (0.0%) | 0.0 |
| Graduate Degree | 0 (0.0%) | 0.0 |
| Total | 3 (100.0%) | 73.0 |
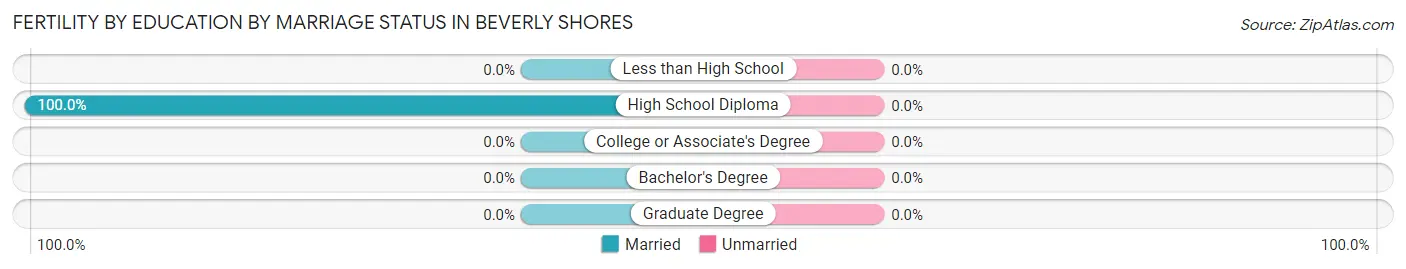
Fertility by Education by Marriage Status in Beverly Shores
| Educational Attainment | Married | Unmarried |
| Less than High School | 0 (0.0%) | 0 (0.0%) |
| High School Diploma | 3 (100.0%) | 0 (0.0%) |
| College or Associate's Degree | 0 (0.0%) | 0 (0.0%) |
| Bachelor's Degree | 0 (0.0%) | 0 (0.0%) |
| Graduate Degree | 0 (0.0%) | 0 (0.0%) |
| Total | 3 (100.0%) | 0 (0.0%) |
Employment Characteristics in Beverly Shores
Employment by Class of Employer in Beverly Shores
Among the 159 employed individuals in Beverly Shores, private company employees (98 | 61.6%), self-employed (incorporated) (27 | 17.0%), and not-for-profit organizations (14 | 8.8%) make up the most common classes of employment.
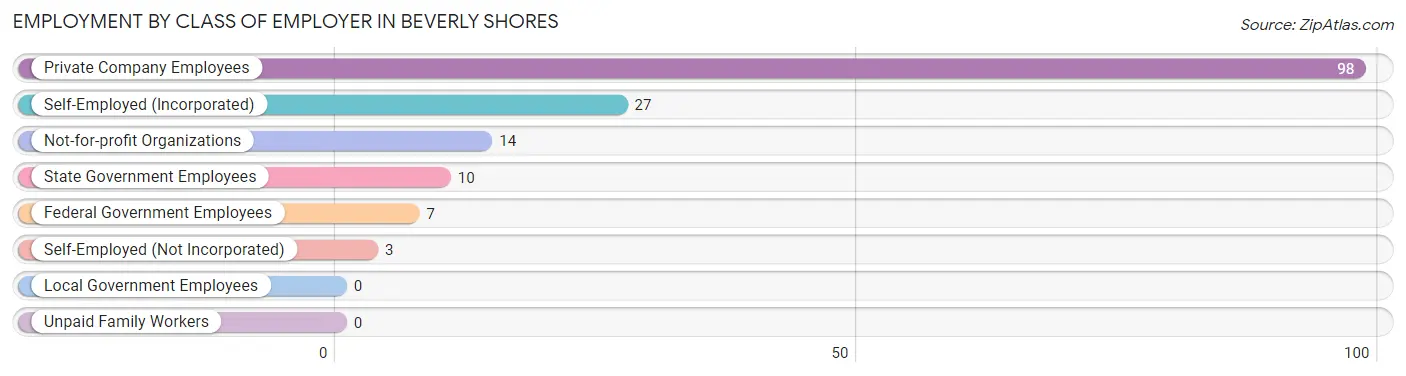
| Employer Class | # Employees | % Employees |
| Private Company Employees | 98 | 61.6% |
| Self-Employed (Incorporated) | 27 | 17.0% |
| Self-Employed (Not Incorporated) | 3 | 1.9% |
| Not-for-profit Organizations | 14 | 8.8% |
| Local Government Employees | 0 | 0.0% |
| State Government Employees | 10 | 6.3% |
| Federal Government Employees | 7 | 4.4% |
| Unpaid Family Workers | 0 | 0.0% |
| Total | 159 | 100.0% |
Employment Status by Age in Beverly Shores
According to the labor force statistics for Beverly Shores, out of the total population over 16 years of age (529), 32.5% or 172 individuals are in the labor force, with 2.3% or 4 of them unemployed. The age group with the highest labor force participation rate is 45 to 54 years, with 77.3% or 34 individuals in the labor force. Within the labor force, the 60 to 64 years age range has the highest percentage of unemployed individuals, with 8.5% or 4 of them being unemployed.
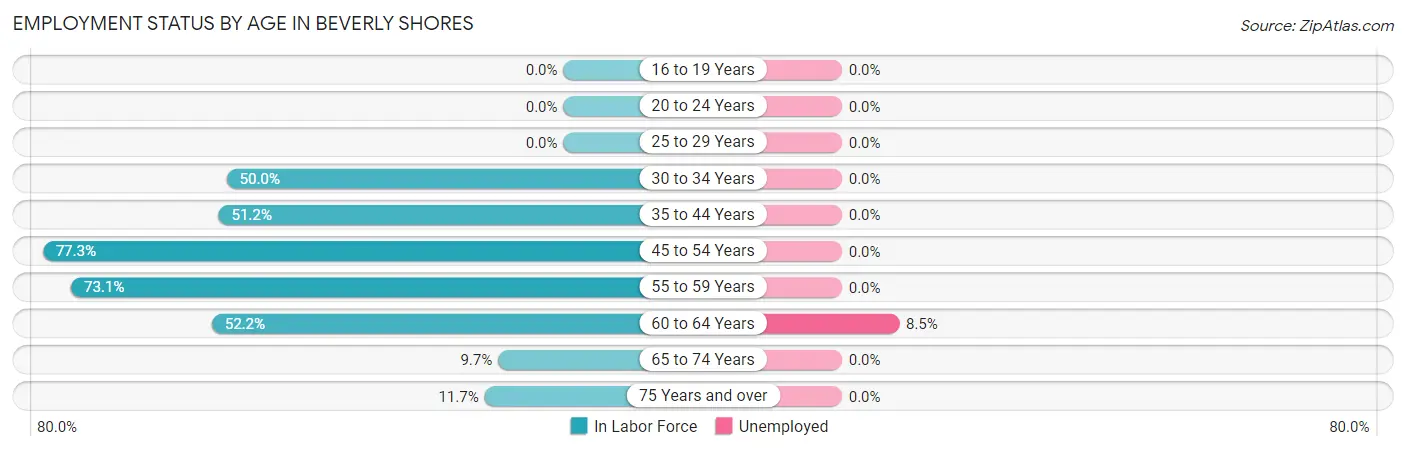
| Age Bracket | In Labor Force | Unemployed |
| 16 to 19 Years | 0 (0.0%) | 0 (0.0%) |
| 20 to 24 Years | 0 (0.0%) | 0 (0.0%) |
| 25 to 29 Years | 0 (0.0%) | 0 (0.0%) |
| 30 to 34 Years | 2 (50.0%) | 0 (0.0%) |
| 35 to 44 Years | 21 (51.2%) | 0 (0.0%) |
| 45 to 54 Years | 34 (77.3%) | 0 (0.0%) |
| 55 to 59 Years | 38 (73.1%) | 0 (0.0%) |
| 60 to 64 Years | 47 (52.2%) | 4 (8.5%) |
| 65 to 74 Years | 18 (9.7%) | 0 (0.0%) |
| 75 Years and over | 12 (11.7%) | 0 (0.0%) |
| Total | 172 (32.5%) | 4 (2.3%) |
Employment Status by Educational Attainment in Beverly Shores
According to labor force statistics for Beverly Shores, 61.2% of individuals (142) out of the total population between 25 and 64 years of age (232) are in the labor force, with 2.8% or 4 of them being unemployed. The group with the highest labor force participation rate are those with the educational attainment of college / associate degree, with 83.7% or 36 individuals in the labor force. Within the labor force, individuals with high school diploma education have the highest percentage of unemployment, with 23.5% or 4 of them being unemployed.
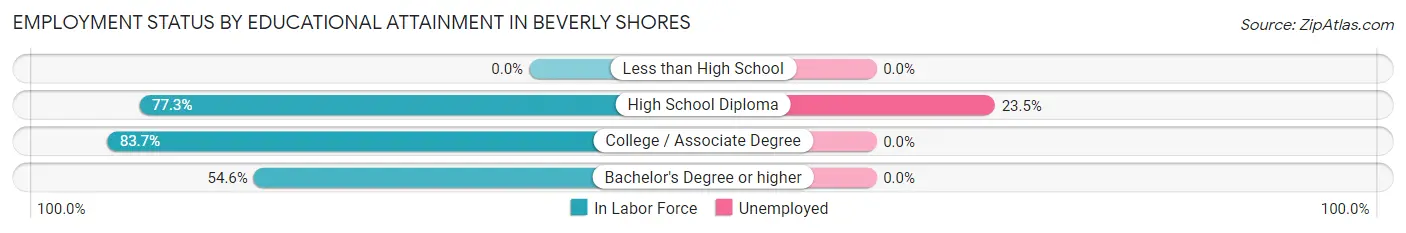
| Educational Attainment | In Labor Force | Unemployed |
| Less than High School | 0 (0.0%) | 0 (0.0%) |
| High School Diploma | 17 (77.3%) | 5 (23.5%) |
| College / Associate Degree | 36 (83.7%) | 0 (0.0%) |
| Bachelor's Degree or higher | 89 (54.6%) | 0 (0.0%) |
| Total | 142 (61.2%) | 6 (2.8%) |
Employment Occupations by Sex in Beverly Shores
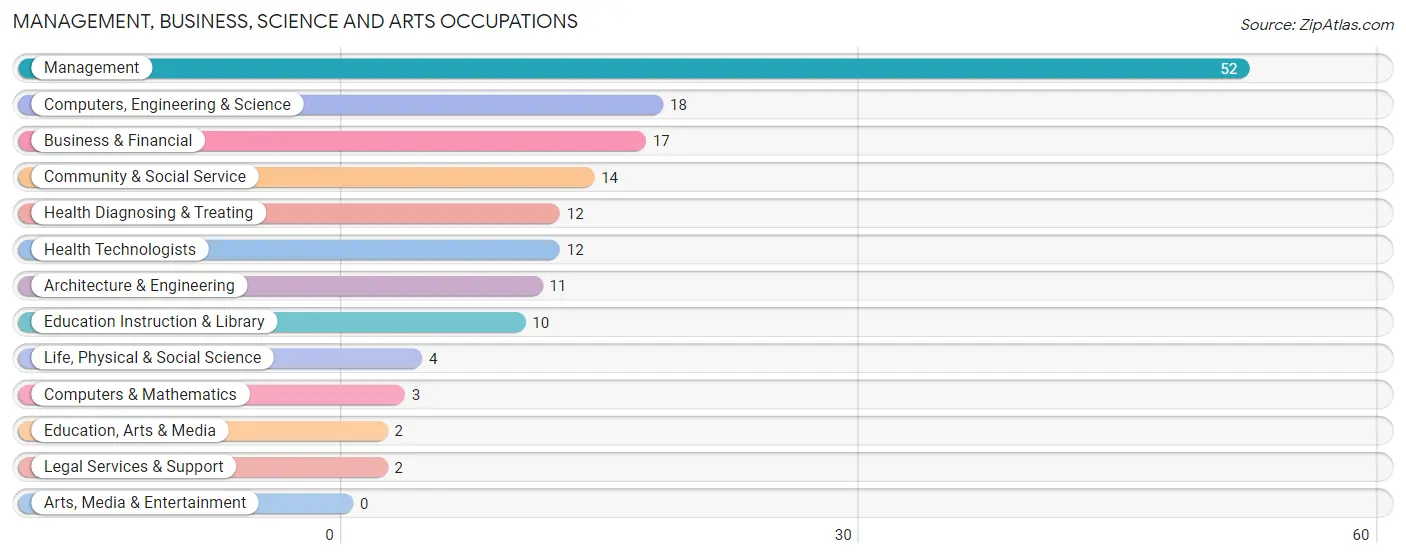
Management, Business, Science and Arts Occupations
The most common Management, Business, Science and Arts occupations in Beverly Shores are Management (52 | 30.9%), Computers, Engineering & Science (18 | 10.7%), Business & Financial (17 | 10.1%), Community & Social Service (14 | 8.3%), and Health Diagnosing & Treating (12 | 7.1%).
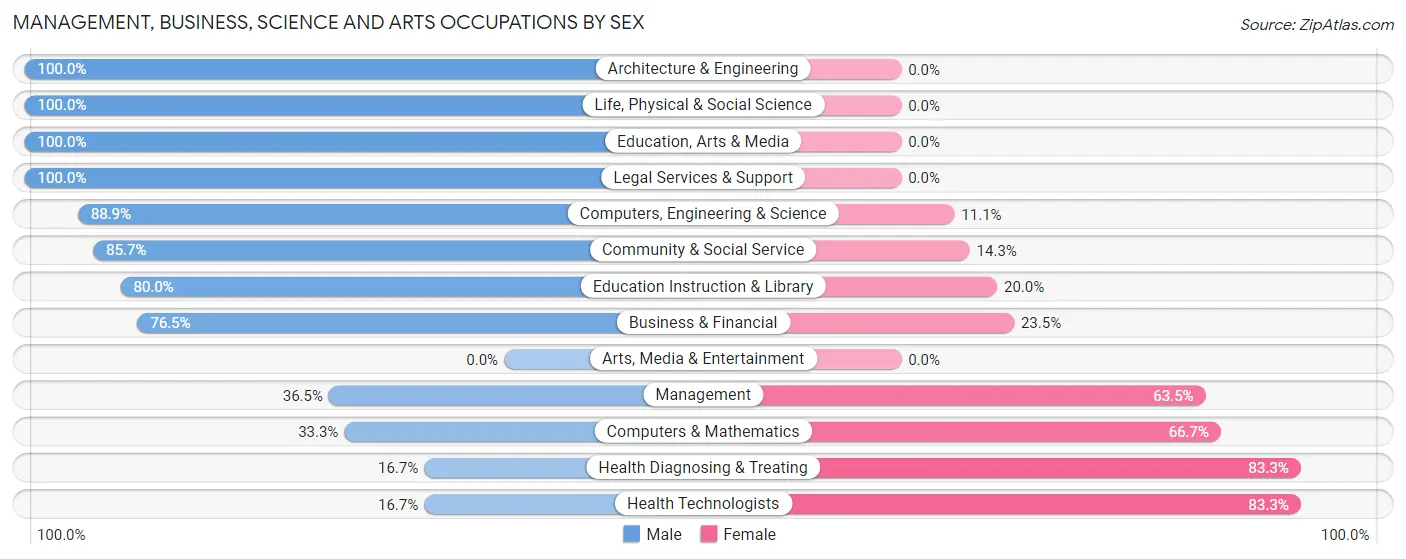
Management, Business, Science and Arts Occupations by Sex
Within the Management, Business, Science and Arts occupations in Beverly Shores, the most male-oriented occupations are Architecture & Engineering (100.0%), Life, Physical & Social Science (100.0%), and Education, Arts & Media (100.0%), while the most female-oriented occupations are Health Diagnosing & Treating (83.3%), Health Technologists (83.3%), and Computers & Mathematics (66.7%).
| Occupation | Male | Female |
| Management | 19 (36.5%) | 33 (63.5%) |
| Business & Financial | 13 (76.5%) | 4 (23.5%) |
| Computers, Engineering & Science | 16 (88.9%) | 2 (11.1%) |
| Computers & Mathematics | 1 (33.3%) | 2 (66.7%) |
| Architecture & Engineering | 11 (100.0%) | 0 (0.0%) |
| Life, Physical & Social Science | 4 (100.0%) | 0 (0.0%) |
| Community & Social Service | 12 (85.7%) | 2 (14.3%) |
| Education, Arts & Media | 2 (100.0%) | 0 (0.0%) |
| Legal Services & Support | 2 (100.0%) | 0 (0.0%) |
| Education Instruction & Library | 8 (80.0%) | 2 (20.0%) |
| Arts, Media & Entertainment | 0 (0.0%) | 0 (0.0%) |
| Health Diagnosing & Treating | 2 (16.7%) | 10 (83.3%) |
| Health Technologists | 2 (16.7%) | 10 (83.3%) |
| Total (Category) | 62 (54.9%) | 51 (45.1%) |
| Total (Overall) | 90 (53.6%) | 78 (46.4%) |
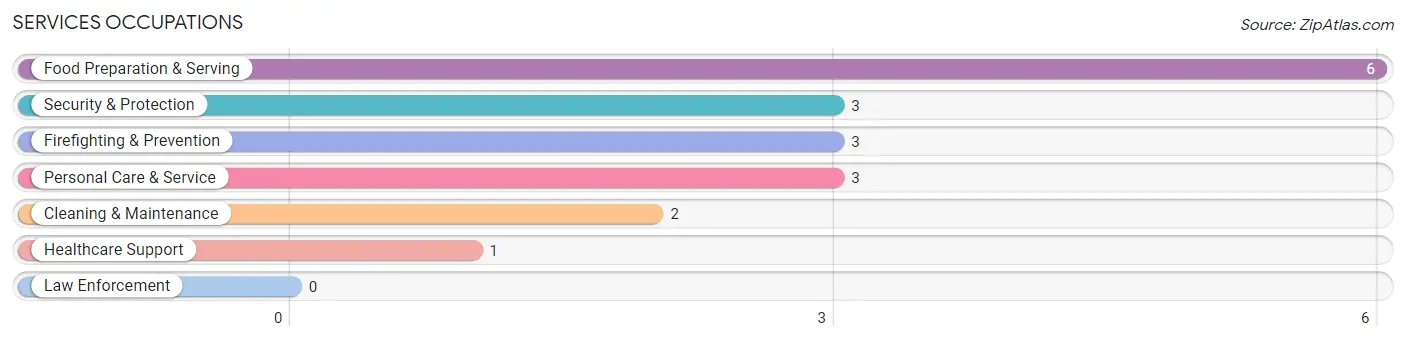
Services Occupations
The most common Services occupations in Beverly Shores are Food Preparation & Serving (6 | 3.6%), Security & Protection (3 | 1.8%), Firefighting & Prevention (3 | 1.8%), Personal Care & Service (3 | 1.8%), and Cleaning & Maintenance (2 | 1.2%).
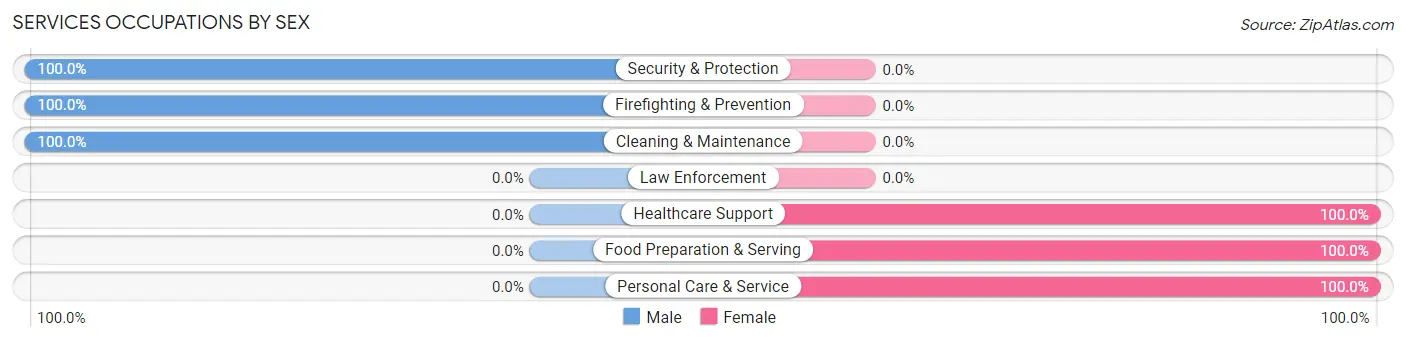
Services Occupations by Sex
Within the Services occupations in Beverly Shores, the most male-oriented occupations are Security & Protection (100.0%), Firefighting & Prevention (100.0%), and Cleaning & Maintenance (100.0%), while the most female-oriented occupations are Healthcare Support (100.0%), Food Preparation & Serving (100.0%), and Personal Care & Service (100.0%).
| Occupation | Male | Female |
| Healthcare Support | 0 (0.0%) | 1 (100.0%) |
| Security & Protection | 3 (100.0%) | 0 (0.0%) |
| Firefighting & Prevention | 3 (100.0%) | 0 (0.0%) |
| Law Enforcement | 0 (0.0%) | 0 (0.0%) |
| Food Preparation & Serving | 0 (0.0%) | 6 (100.0%) |
| Cleaning & Maintenance | 2 (100.0%) | 0 (0.0%) |
| Personal Care & Service | 0 (0.0%) | 3 (100.0%) |
| Total (Category) | 5 (33.3%) | 10 (66.7%) |
| Total (Overall) | 90 (53.6%) | 78 (46.4%) |
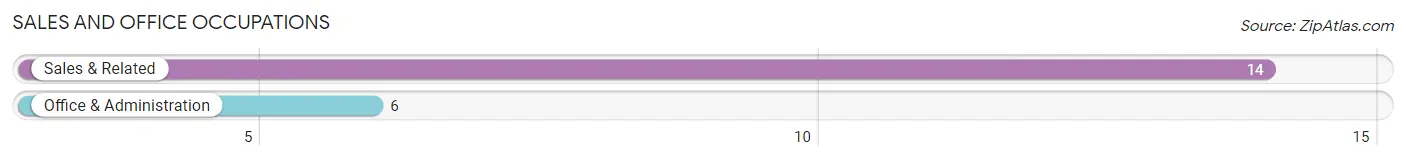
Sales and Office Occupations
The most common Sales and Office occupations in Beverly Shores are Sales & Related (14 | 8.3%), and Office & Administration (6 | 3.6%).
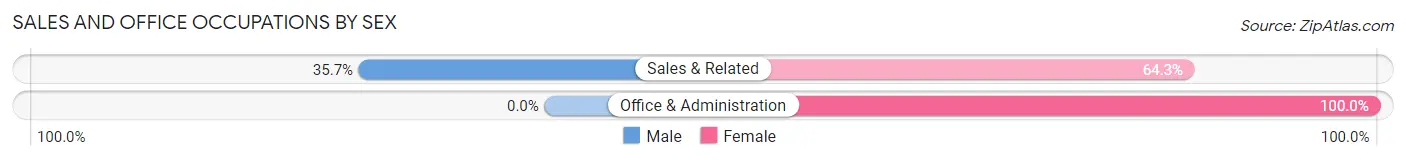
Sales and Office Occupations by Sex
| Occupation | Male | Female |
| Sales & Related | 5 (35.7%) | 9 (64.3%) |
| Office & Administration | 0 (0.0%) | 6 (100.0%) |
| Total (Category) | 5 (25.0%) | 15 (75.0%) |
| Total (Overall) | 90 (53.6%) | 78 (46.4%) |
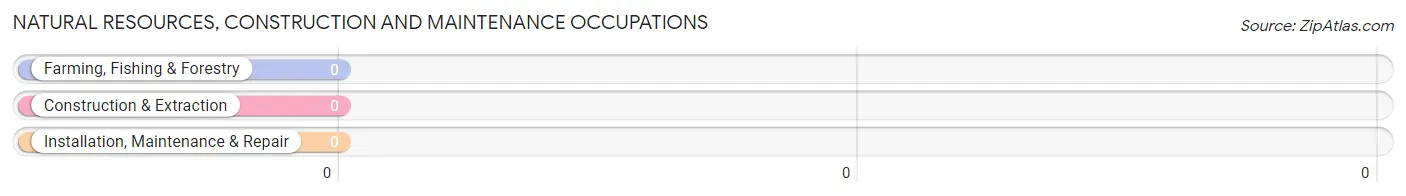
Natural Resources, Construction and Maintenance Occupations
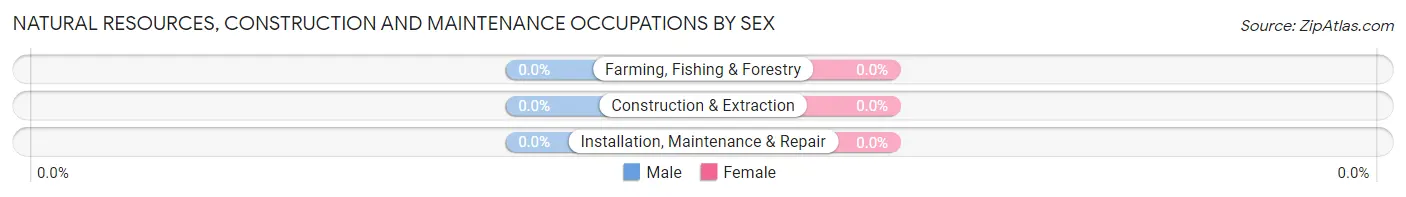
Natural Resources, Construction and Maintenance Occupations by Sex
| Occupation | Male | Female |
| Farming, Fishing & Forestry | 0 (0.0%) | 0 (0.0%) |
| Construction & Extraction | 0 (0.0%) | 0 (0.0%) |
| Installation, Maintenance & Repair | 0 (0.0%) | 0 (0.0%) |
| Total (Category) | 0 (0.0%) | 0 (0.0%) |
| Total (Overall) | 90 (53.6%) | 78 (46.4%) |
Production, Transportation and Moving Occupations
The most common Production, Transportation and Moving occupations in Beverly Shores are Transportation (15 | 8.9%), and Production (5 | 3.0%).
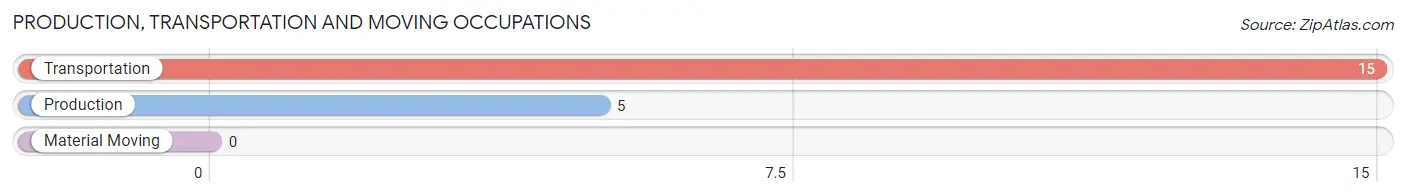
Production, Transportation and Moving Occupations by Sex
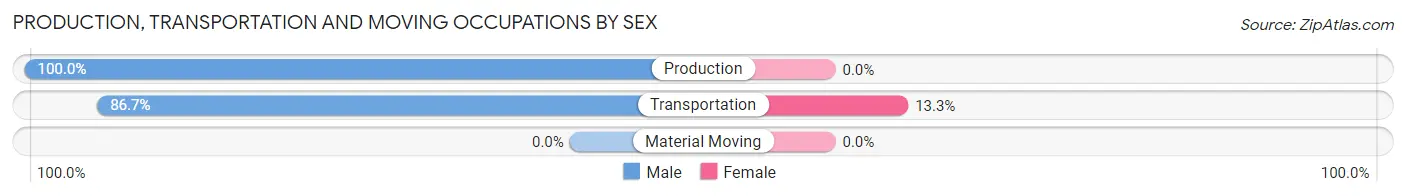
| Occupation | Male | Female |
| Production | 5 (100.0%) | 0 (0.0%) |
| Transportation | 13 (86.7%) | 2 (13.3%) |
| Material Moving | 0 (0.0%) | 0 (0.0%) |
| Total (Category) | 18 (90.0%) | 2 (10.0%) |
| Total (Overall) | 90 (53.6%) | 78 (46.4%) |
Employment Industries by Sex in Beverly Shores
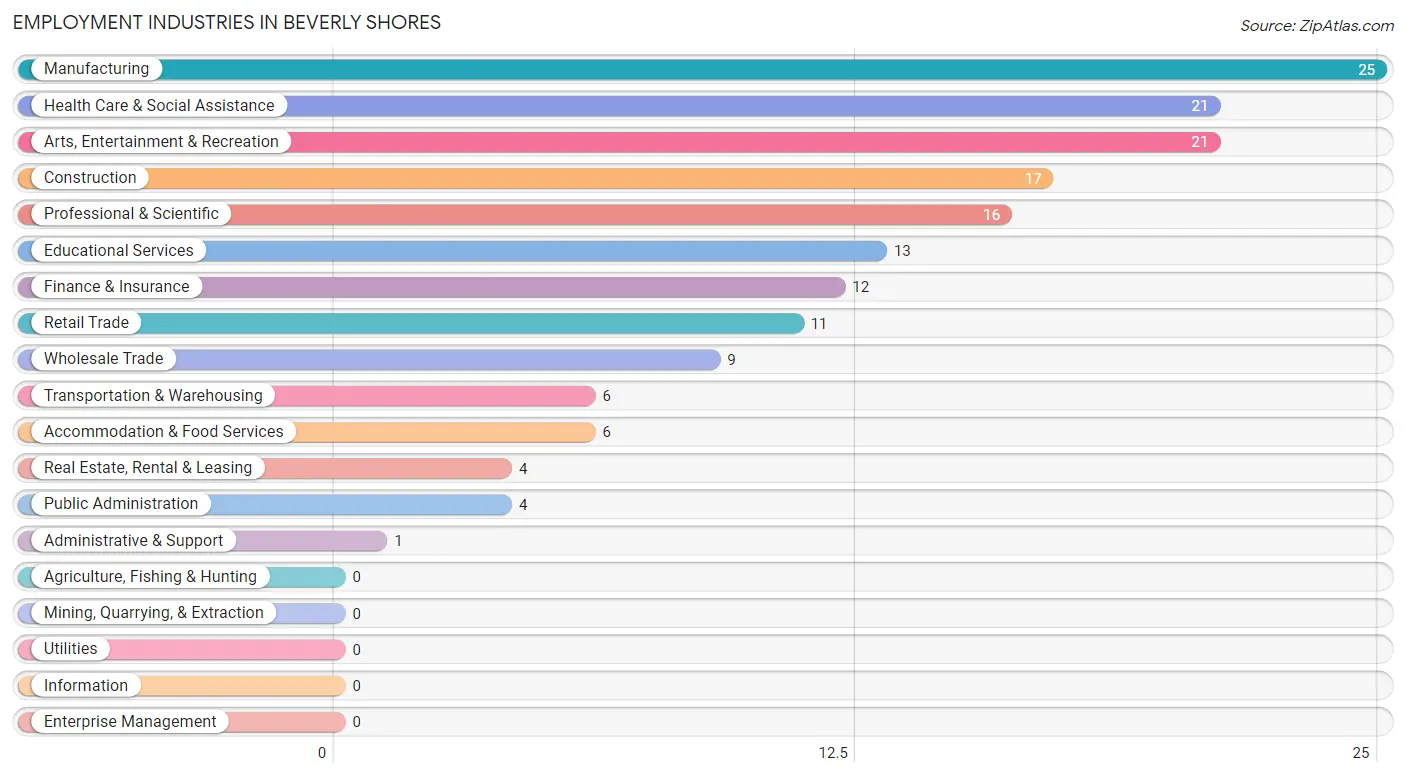
Employment Industries in Beverly Shores
The major employment industries in Beverly Shores include Manufacturing (25 | 14.9%), Health Care & Social Assistance (21 | 12.5%), Arts, Entertainment & Recreation (21 | 12.5%), Construction (17 | 10.1%), and Professional & Scientific (16 | 9.5%).
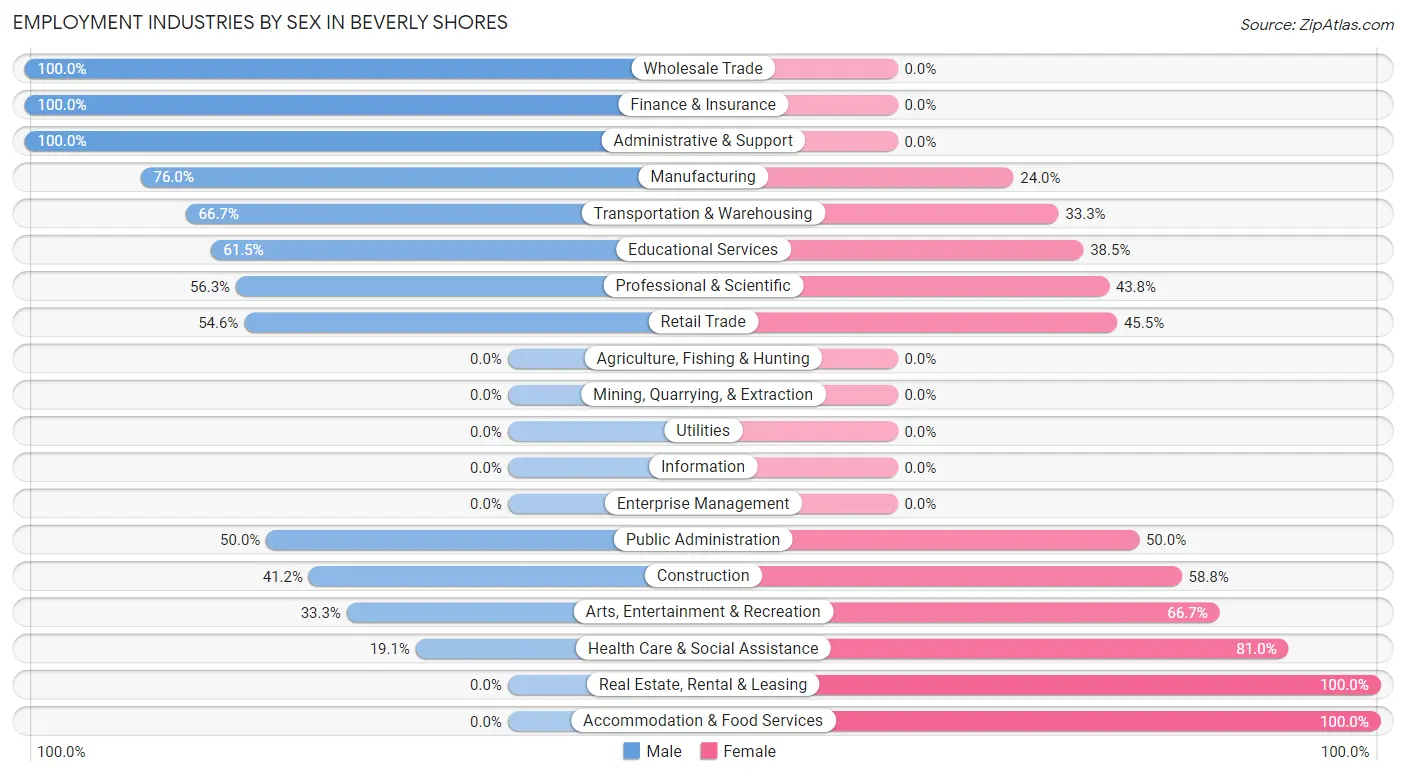
Employment Industries by Sex in Beverly Shores
The Beverly Shores industries that see more men than women are Wholesale Trade (100.0%), Finance & Insurance (100.0%), and Administrative & Support (100.0%), whereas the industries that tend to have a higher number of women are Real Estate, Rental & Leasing (100.0%), Accommodation & Food Services (100.0%), and Health Care & Social Assistance (80.9%).
| Industry | Male | Female |
| Agriculture, Fishing & Hunting | 0 (0.0%) | 0 (0.0%) |
| Mining, Quarrying, & Extraction | 0 (0.0%) | 0 (0.0%) |
| Construction | 7 (41.2%) | 10 (58.8%) |
| Manufacturing | 19 (76.0%) | 6 (24.0%) |
| Wholesale Trade | 9 (100.0%) | 0 (0.0%) |
| Retail Trade | 6 (54.5%) | 5 (45.5%) |
| Transportation & Warehousing | 4 (66.7%) | 2 (33.3%) |
| Utilities | 0 (0.0%) | 0 (0.0%) |
| Information | 0 (0.0%) | 0 (0.0%) |
| Finance & Insurance | 12 (100.0%) | 0 (0.0%) |
| Real Estate, Rental & Leasing | 0 (0.0%) | 4 (100.0%) |
| Professional & Scientific | 9 (56.2%) | 7 (43.8%) |
| Enterprise Management | 0 (0.0%) | 0 (0.0%) |
| Administrative & Support | 1 (100.0%) | 0 (0.0%) |
| Educational Services | 8 (61.5%) | 5 (38.5%) |
| Health Care & Social Assistance | 4 (19.1%) | 17 (80.9%) |
| Arts, Entertainment & Recreation | 7 (33.3%) | 14 (66.7%) |
| Accommodation & Food Services | 0 (0.0%) | 6 (100.0%) |
| Public Administration | 2 (50.0%) | 2 (50.0%) |
| Total | 90 (53.6%) | 78 (46.4%) |
Education in Beverly Shores
School Enrollment in Beverly Shores
The most common levels of schooling among the 43 students in Beverly Shores are elementary school (15 | 34.9%), high school (15 | 34.9%), and middle school (5 | 11.6%).
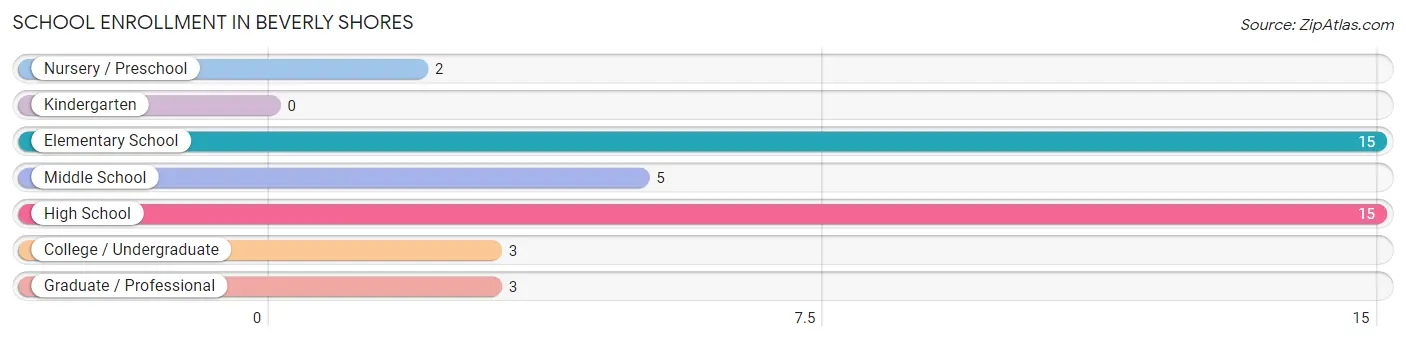
| School Level | # Students | % Students |
| Nursery / Preschool | 2 | 4.6% |
| Kindergarten | 0 | 0.0% |
| Elementary School | 15 | 34.9% |
| Middle School | 5 | 11.6% |
| High School | 15 | 34.9% |
| College / Undergraduate | 3 | 7.0% |
| Graduate / Professional | 3 | 7.0% |
| Total | 43 | 100.0% |
School Enrollment by Age by Funding Source in Beverly Shores
Out of a total of 43 students who are enrolled in schools in Beverly Shores, 13 (30.2%) attend a private institution, while the remaining 30 (69.8%) are enrolled in public schools. The age group of 3 to 4 year olds has the highest likelihood of being enrolled in private schools, with 2 (100.0% in the age bracket) enrolled. Conversely, the age group of 5 to 9 year old has the lowest likelihood of being enrolled in a private school, with 15 (100.0% in the age bracket) attending a public institution.
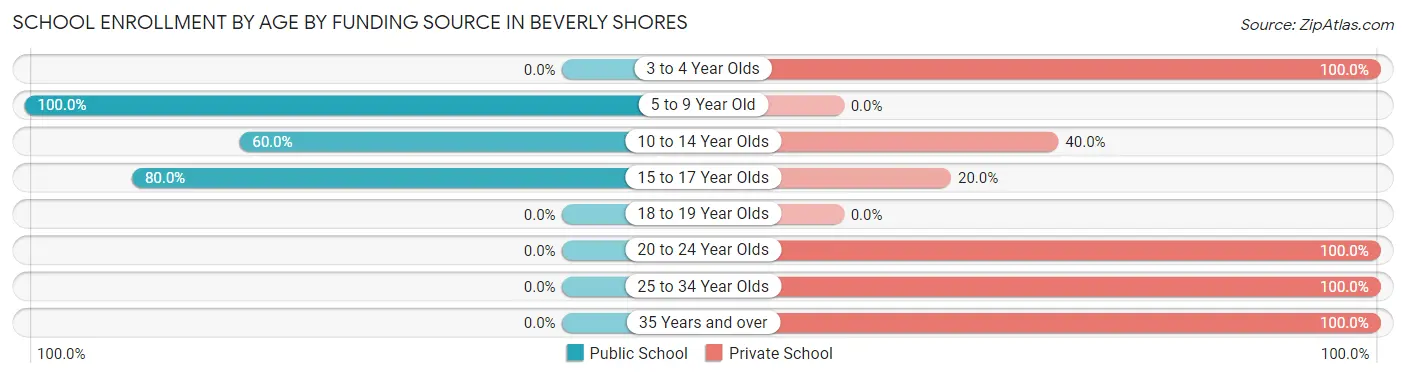
| Age Bracket | Public School | Private School |
| 3 to 4 Year Olds | 0 (0.0%) | 2 (100.0%) |
| 5 to 9 Year Old | 15 (100.0%) | 0 (0.0%) |
| 10 to 14 Year Olds | 3 (60.0%) | 2 (40.0%) |
| 15 to 17 Year Olds | 12 (80.0%) | 3 (20.0%) |
| 18 to 19 Year Olds | 0 (0.0%) | 0 (0.0%) |
| 20 to 24 Year Olds | 0 (0.0%) | 2 (100.0%) |
| 25 to 34 Year Olds | 0 (0.0%) | 1 (100.0%) |
| 35 Years and over | 0 (0.0%) | 3 (100.0%) |
| Total | 30 (69.8%) | 13 (30.2%) |
Educational Attainment by Field of Study in Beverly Shores
Business (120 | 27.2%), engineering (62 | 14.1%), arts & humanities (41 | 9.3%), education (40 | 9.1%), and liberal arts & history (37 | 8.4%) are the most common fields of study among 441 individuals in Beverly Shores who have obtained a bachelor's degree or higher.
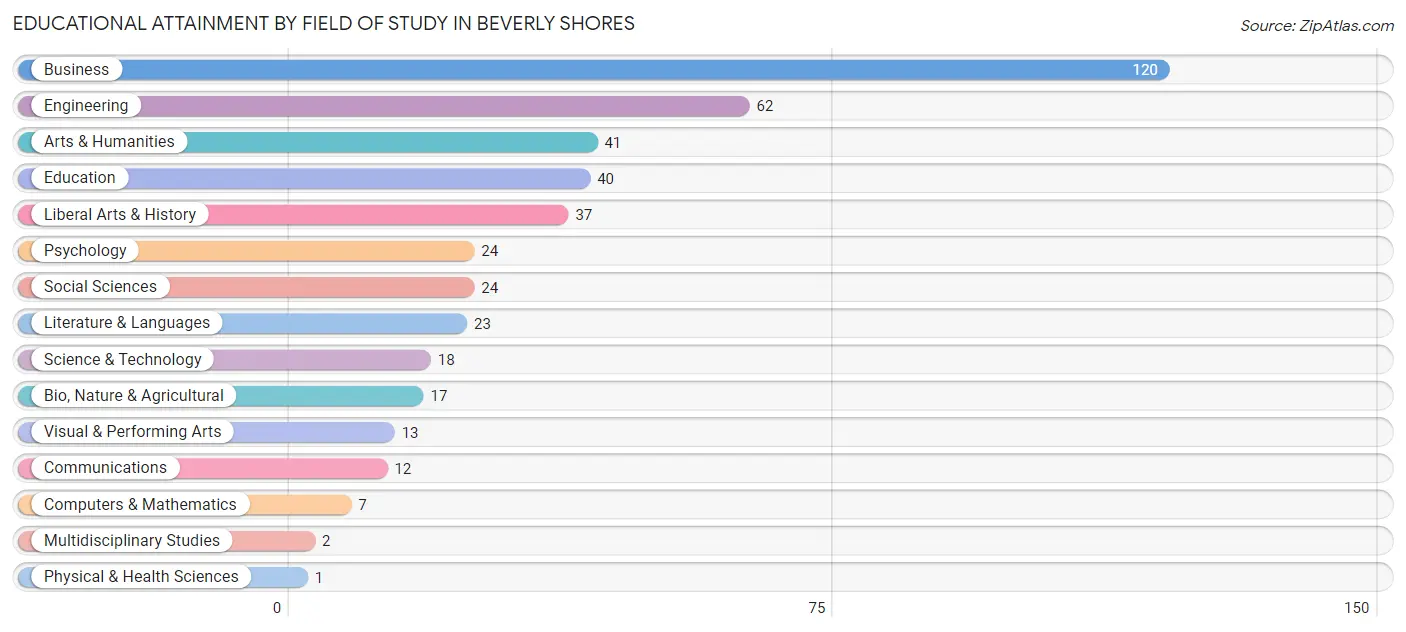
| Field of Study | # Graduates | % Graduates |
| Computers & Mathematics | 7 | 1.6% |
| Bio, Nature & Agricultural | 17 | 3.8% |
| Physical & Health Sciences | 1 | 0.2% |
| Psychology | 24 | 5.4% |
| Social Sciences | 24 | 5.4% |
| Engineering | 62 | 14.1% |
| Multidisciplinary Studies | 2 | 0.4% |
| Science & Technology | 18 | 4.1% |
| Business | 120 | 27.2% |
| Education | 40 | 9.1% |
| Literature & Languages | 23 | 5.2% |
| Liberal Arts & History | 37 | 8.4% |
| Visual & Performing Arts | 13 | 2.9% |
| Communications | 12 | 2.7% |
| Arts & Humanities | 41 | 9.3% |
| Total | 441 | 100.0% |
Transportation & Commute in Beverly Shores
Vehicle Availability by Sex in Beverly Shores
The most prevalent vehicle ownership categories in Beverly Shores are males with 2 vehicles (47, accounting for 58.0%) and females with 2 vehicles (40, making up 60.3%).
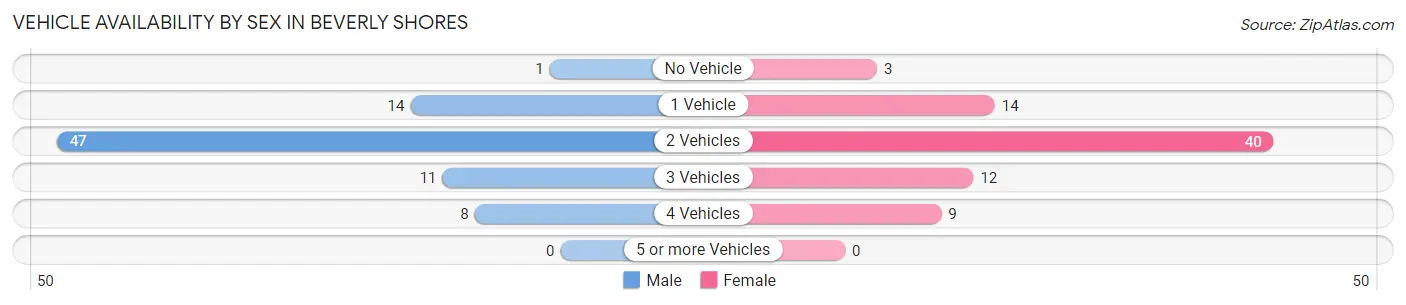
| Vehicles Available | Male | Female |
| No Vehicle | 1 (1.2%) | 3 (3.8%) |
| 1 Vehicle | 14 (17.3%) | 14 (17.9%) |
| 2 Vehicles | 47 (58.0%) | 40 (51.3%) |
| 3 Vehicles | 11 (13.6%) | 12 (15.4%) |
| 4 Vehicles | 8 (9.9%) | 9 (11.5%) |
| 5 or more Vehicles | 0 (0.0%) | 0 (0.0%) |
| Total | 81 (100.0%) | 78 (100.0%) |
Commute Time in Beverly Shores
The most frequently occuring commute durations in Beverly Shores are 30 to 34 minutes (41 commuters, 33.3%), 60 to 89 minutes (24 commuters, 19.5%), and 10 to 14 minutes (17 commuters, 13.8%).
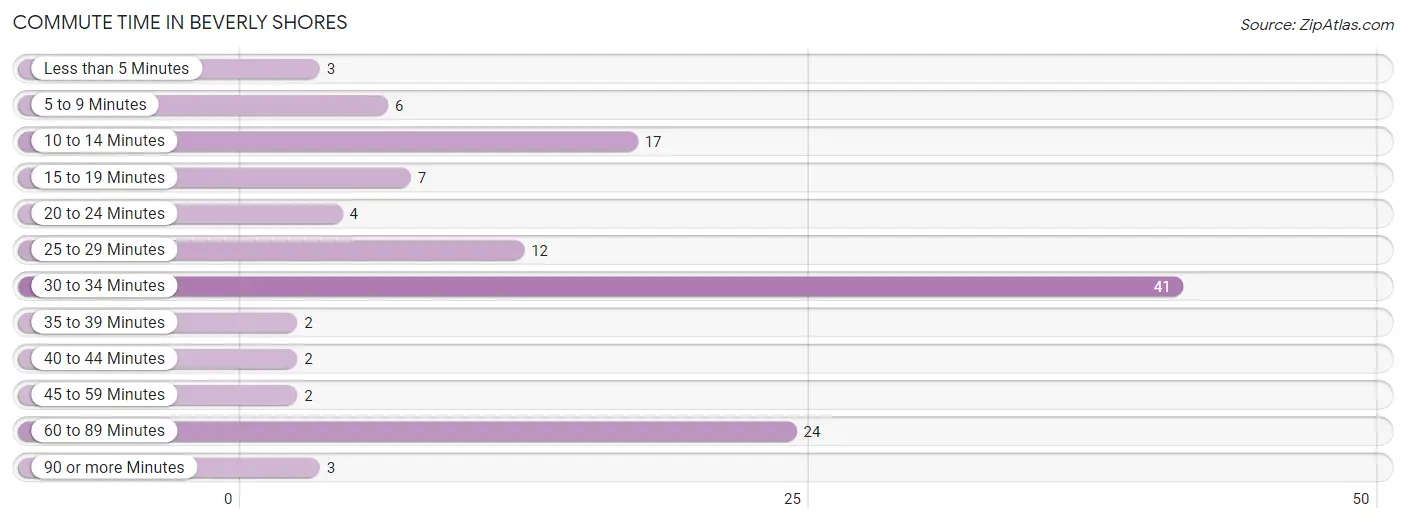
| Commute Time | # Commuters | % Commuters |
| Less than 5 Minutes | 3 | 2.4% |
| 5 to 9 Minutes | 6 | 4.9% |
| 10 to 14 Minutes | 17 | 13.8% |
| 15 to 19 Minutes | 7 | 5.7% |
| 20 to 24 Minutes | 4 | 3.3% |
| 25 to 29 Minutes | 12 | 9.8% |
| 30 to 34 Minutes | 41 | 33.3% |
| 35 to 39 Minutes | 2 | 1.6% |
| 40 to 44 Minutes | 2 | 1.6% |
| 45 to 59 Minutes | 2 | 1.6% |
| 60 to 89 Minutes | 24 | 19.5% |
| 90 or more Minutes | 3 | 2.4% |
Commute Time by Sex in Beverly Shores
The most common commute times in Beverly Shores are 30 to 34 minutes (20 commuters, 31.8%) for males and 30 to 34 minutes (21 commuters, 35.0%) for females.
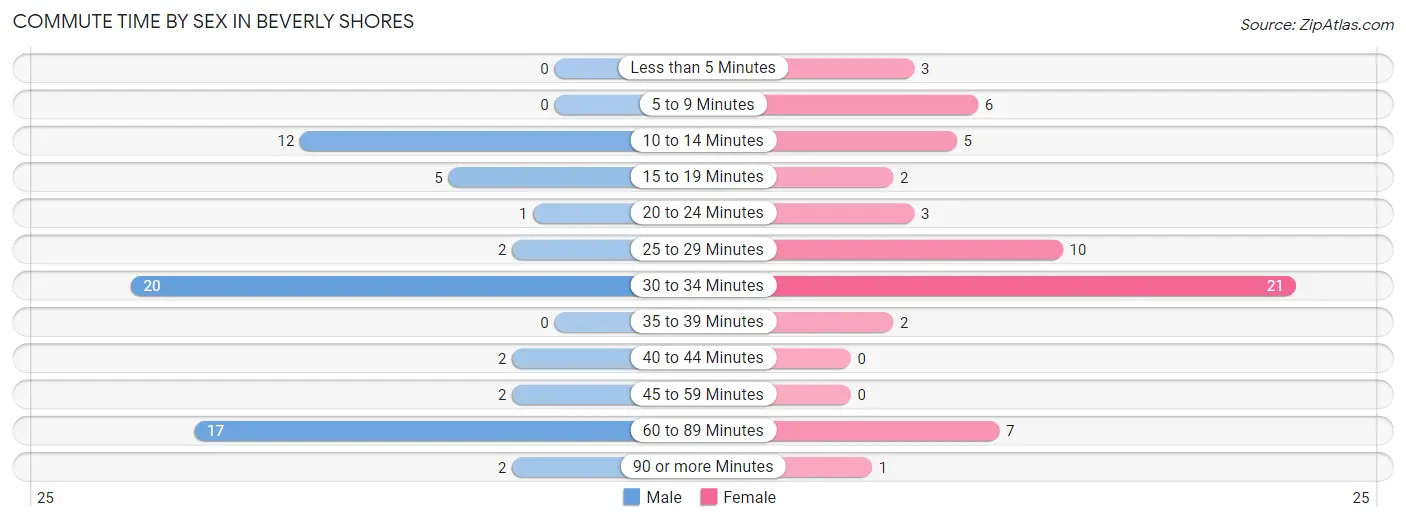
| Commute Time | Male | Female |
| Less than 5 Minutes | 0 (0.0%) | 3 (5.0%) |
| 5 to 9 Minutes | 0 (0.0%) | 6 (10.0%) |
| 10 to 14 Minutes | 12 (19.1%) | 5 (8.3%) |
| 15 to 19 Minutes | 5 (7.9%) | 2 (3.3%) |
| 20 to 24 Minutes | 1 (1.6%) | 3 (5.0%) |
| 25 to 29 Minutes | 2 (3.2%) | 10 (16.7%) |
| 30 to 34 Minutes | 20 (31.8%) | 21 (35.0%) |
| 35 to 39 Minutes | 0 (0.0%) | 2 (3.3%) |
| 40 to 44 Minutes | 2 (3.2%) | 0 (0.0%) |
| 45 to 59 Minutes | 2 (3.2%) | 0 (0.0%) |
| 60 to 89 Minutes | 17 (27.0%) | 7 (11.7%) |
| 90 or more Minutes | 2 (3.2%) | 1 (1.7%) |
Time of Departure to Work by Sex in Beverly Shores
The most frequent times of departure to work in Beverly Shores are 6:30 AM to 6:59 AM (17, 27.0%) for males and 7:00 AM to 7:29 AM (15, 25.0%) for females.
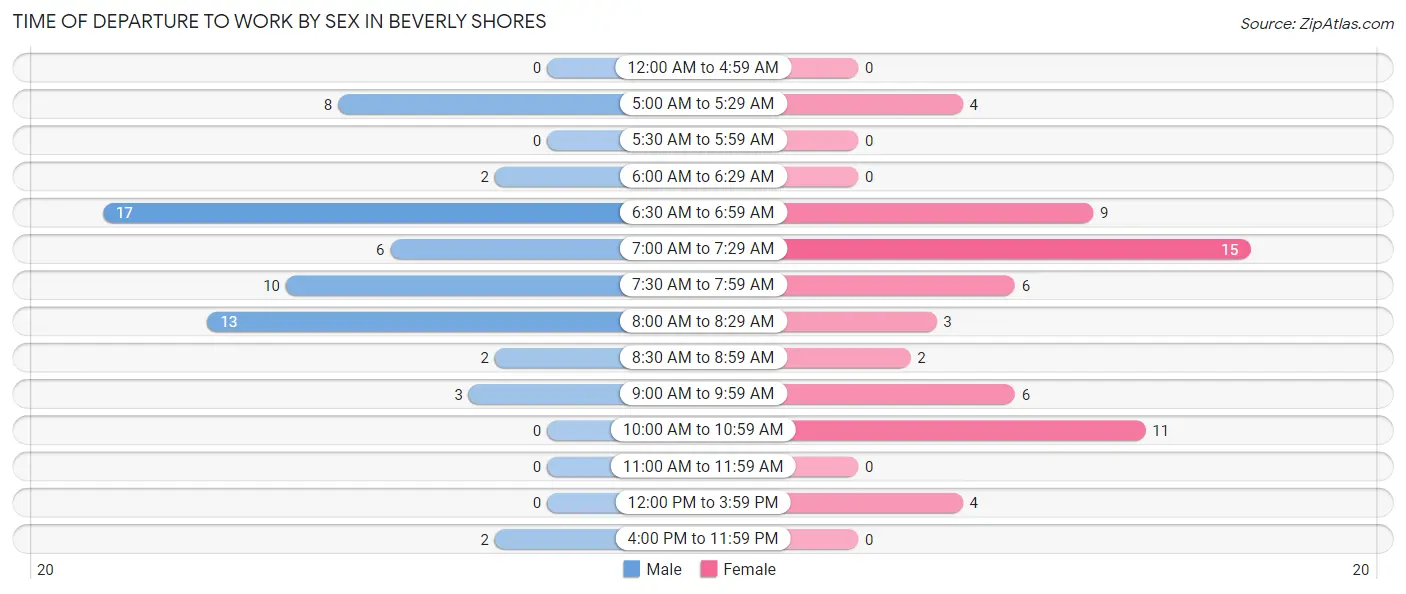
| Time of Departure | Male | Female |
| 12:00 AM to 4:59 AM | 0 (0.0%) | 0 (0.0%) |
| 5:00 AM to 5:29 AM | 8 (12.7%) | 4 (6.7%) |
| 5:30 AM to 5:59 AM | 0 (0.0%) | 0 (0.0%) |
| 6:00 AM to 6:29 AM | 2 (3.2%) | 0 (0.0%) |
| 6:30 AM to 6:59 AM | 17 (27.0%) | 9 (15.0%) |
| 7:00 AM to 7:29 AM | 6 (9.5%) | 15 (25.0%) |
| 7:30 AM to 7:59 AM | 10 (15.9%) | 6 (10.0%) |
| 8:00 AM to 8:29 AM | 13 (20.6%) | 3 (5.0%) |
| 8:30 AM to 8:59 AM | 2 (3.2%) | 2 (3.3%) |
| 9:00 AM to 9:59 AM | 3 (4.8%) | 6 (10.0%) |
| 10:00 AM to 10:59 AM | 0 (0.0%) | 11 (18.3%) |
| 11:00 AM to 11:59 AM | 0 (0.0%) | 0 (0.0%) |
| 12:00 PM to 3:59 PM | 0 (0.0%) | 4 (6.7%) |
| 4:00 PM to 11:59 PM | 2 (3.2%) | 0 (0.0%) |
| Total | 63 (100.0%) | 60 (100.0%) |
Housing Occupancy in Beverly Shores
Occupancy by Ownership in Beverly Shores
Of the total 294 dwellings in Beverly Shores, owner-occupied units account for 284 (96.6%), while renter-occupied units make up 10 (3.4%).
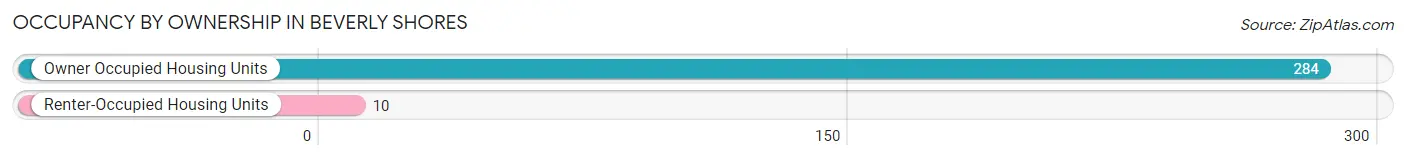
| Occupancy | # Housing Units | % Housing Units |
| Owner Occupied Housing Units | 284 | 96.6% |
| Renter-Occupied Housing Units | 10 | 3.4% |
| Total Occupied Housing Units | 294 | 100.0% |
Occupancy by Household Size in Beverly Shores
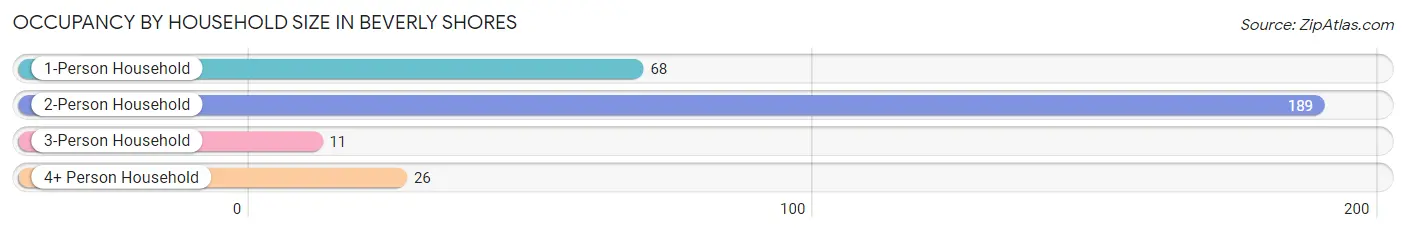
| Household Size | # Housing Units | % Housing Units |
| 1-Person Household | 68 | 23.1% |
| 2-Person Household | 189 | 64.3% |
| 3-Person Household | 11 | 3.7% |
| 4+ Person Household | 26 | 8.8% |
| Total Housing Units | 294 | 100.0% |
Occupancy by Ownership by Household Size in Beverly Shores
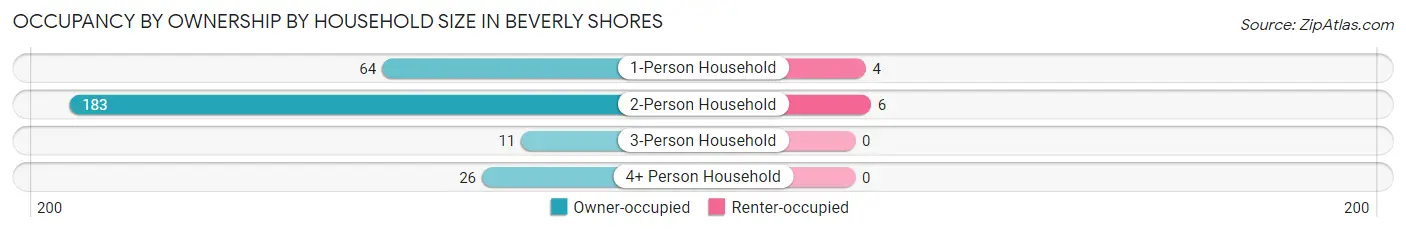
| Household Size | Owner-occupied | Renter-occupied |
| 1-Person Household | 64 (94.1%) | 4 (5.9%) |
| 2-Person Household | 183 (96.8%) | 6 (3.2%) |
| 3-Person Household | 11 (100.0%) | 0 (0.0%) |
| 4+ Person Household | 26 (100.0%) | 0 (0.0%) |
| Total Housing Units | 284 (96.6%) | 10 (3.4%) |
Occupancy by Educational Attainment in Beverly Shores
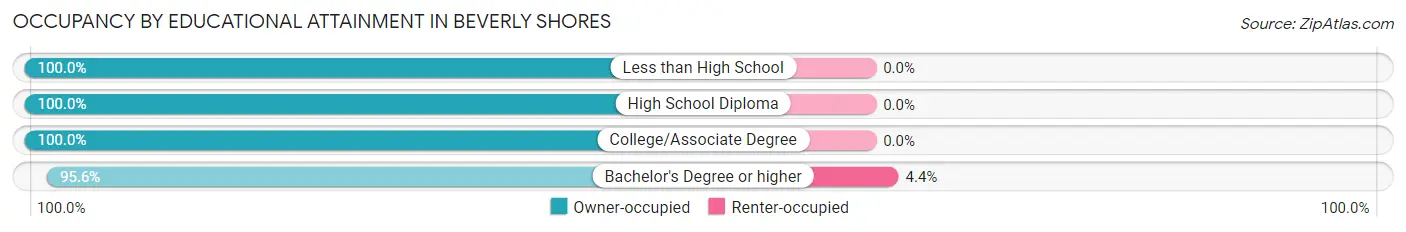
| Household Size | Owner-occupied | Renter-occupied |
| Less than High School | 2 (100.0%) | 0 (0.0%) |
| High School Diploma | 33 (100.0%) | 0 (0.0%) |
| College/Associate Degree | 34 (100.0%) | 0 (0.0%) |
| Bachelor's Degree or higher | 215 (95.6%) | 10 (4.4%) |
Occupancy by Age of Householder in Beverly Shores
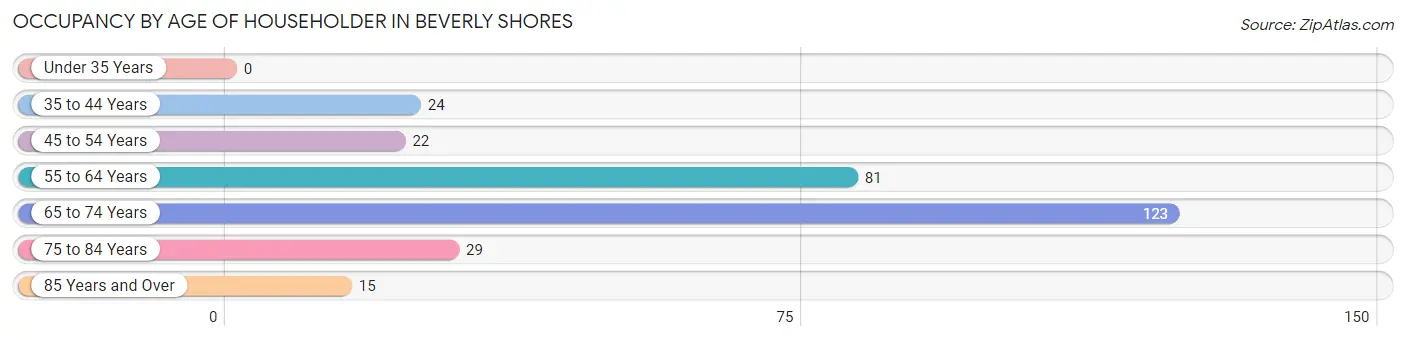
| Age Bracket | # Households | % Households |
| Under 35 Years | 0 | 0.0% |
| 35 to 44 Years | 24 | 8.2% |
| 45 to 54 Years | 22 | 7.5% |
| 55 to 64 Years | 81 | 27.6% |
| 65 to 74 Years | 123 | 41.8% |
| 75 to 84 Years | 29 | 9.9% |
| 85 Years and Over | 15 | 5.1% |
| Total | 294 | 100.0% |
Housing Finances in Beverly Shores
Median Income by Occupancy in Beverly Shores
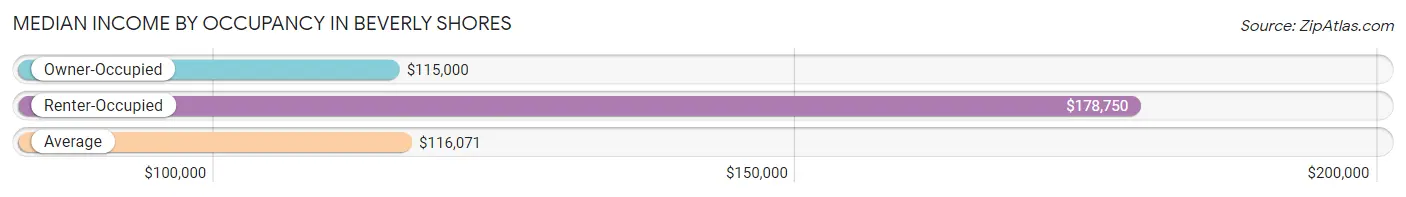
| Occupancy Type | # Households | Median Income |
| Owner-Occupied | 284 (96.6%) | $115,000 |
| Renter-Occupied | 10 (3.4%) | $178,750 |
| Average | 294 (100.0%) | $116,071 |
Occupancy by Householder Income Bracket in Beverly Shores
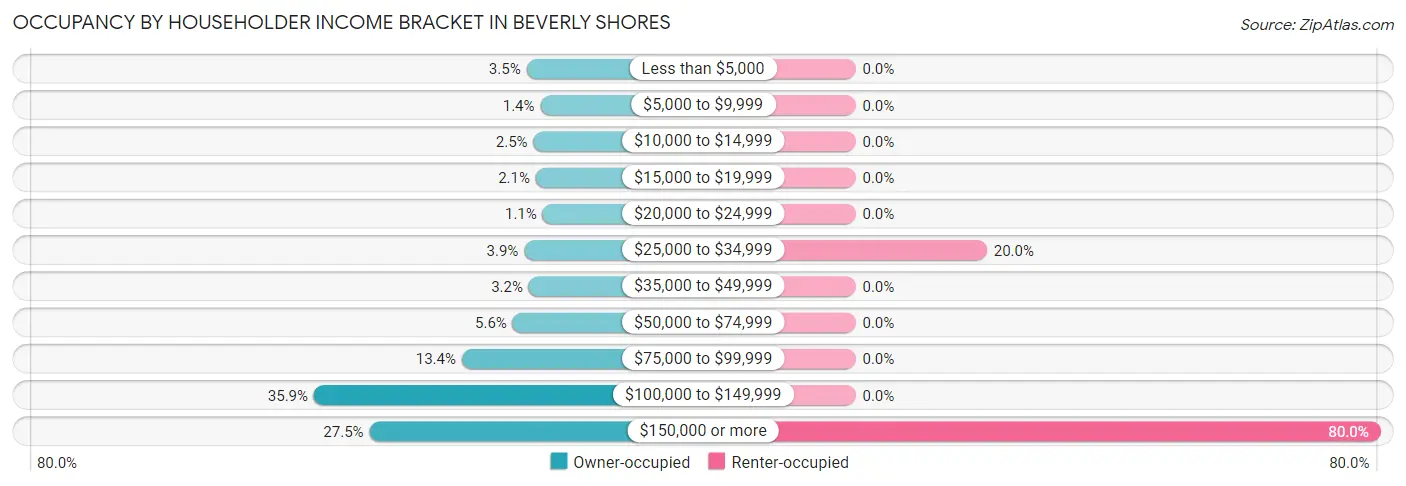
| Income Bracket | Owner-occupied | Renter-occupied |
| Less than $5,000 | 10 (3.5%) | 0 (0.0%) |
| $5,000 to $9,999 | 4 (1.4%) | 0 (0.0%) |
| $10,000 to $14,999 | 7 (2.5%) | 0 (0.0%) |
| $15,000 to $19,999 | 6 (2.1%) | 0 (0.0%) |
| $20,000 to $24,999 | 3 (1.1%) | 0 (0.0%) |
| $25,000 to $34,999 | 11 (3.9%) | 2 (20.0%) |
| $35,000 to $49,999 | 9 (3.2%) | 0 (0.0%) |
| $50,000 to $74,999 | 16 (5.6%) | 0 (0.0%) |
| $75,000 to $99,999 | 38 (13.4%) | 0 (0.0%) |
| $100,000 to $149,999 | 102 (35.9%) | 0 (0.0%) |
| $150,000 or more | 78 (27.5%) | 8 (80.0%) |
| Total | 284 (100.0%) | 10 (100.0%) |
Monthly Housing Cost Tiers in Beverly Shores
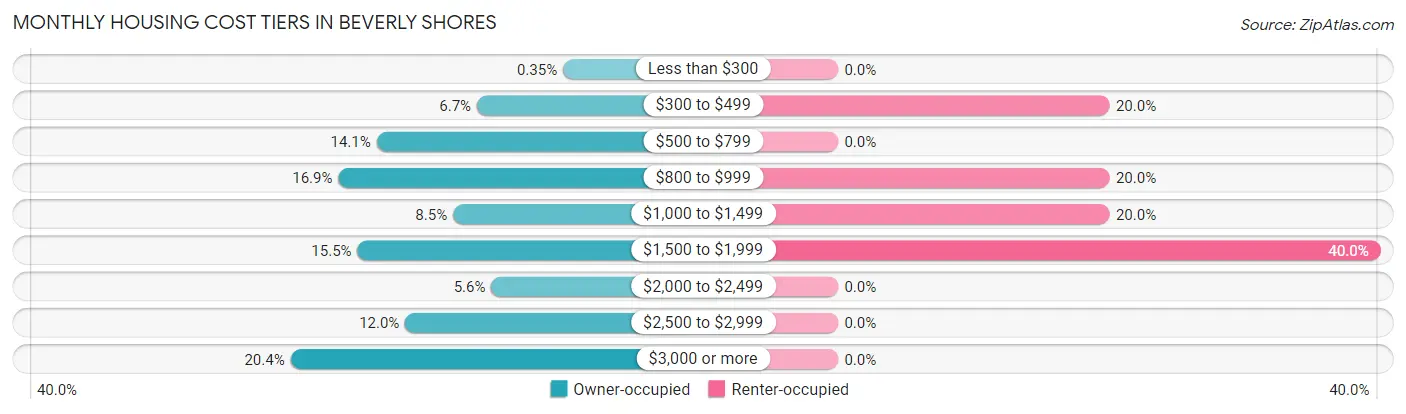
| Monthly Cost | Owner-occupied | Renter-occupied |
| Less than $300 | 1 (0.4%) | 0 (0.0%) |
| $300 to $499 | 19 (6.7%) | 2 (20.0%) |
| $500 to $799 | 40 (14.1%) | 0 (0.0%) |
| $800 to $999 | 48 (16.9%) | 2 (20.0%) |
| $1,000 to $1,499 | 24 (8.5%) | 2 (20.0%) |
| $1,500 to $1,999 | 44 (15.5%) | 4 (40.0%) |
| $2,000 to $2,499 | 16 (5.6%) | 0 (0.0%) |
| $2,500 to $2,999 | 34 (12.0%) | 0 (0.0%) |
| $3,000 or more | 58 (20.4%) | 0 (0.0%) |
| Total | 284 (100.0%) | 10 (100.0%) |
Physical Housing Characteristics in Beverly Shores
Housing Structures in Beverly Shores
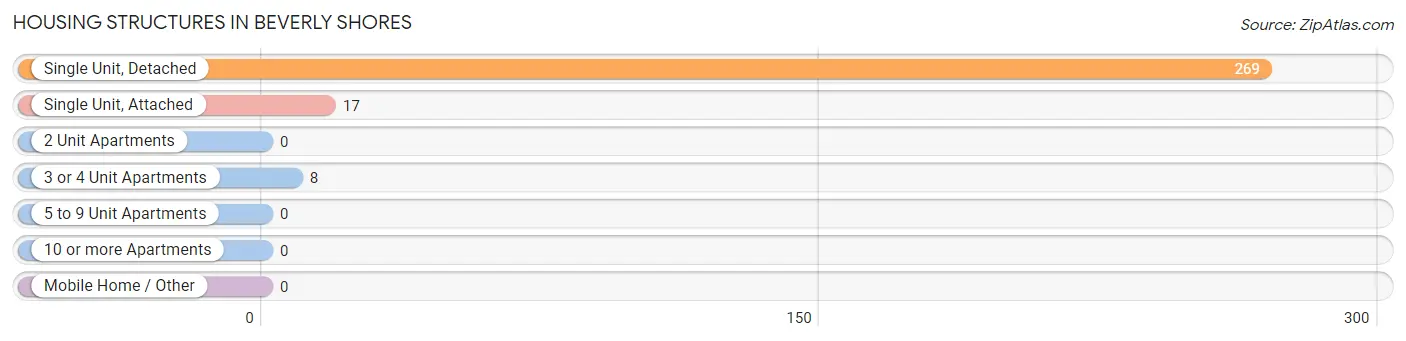
| Structure Type | # Housing Units | % Housing Units |
| Single Unit, Detached | 269 | 91.5% |
| Single Unit, Attached | 17 | 5.8% |
| 2 Unit Apartments | 0 | 0.0% |
| 3 or 4 Unit Apartments | 8 | 2.7% |
| 5 to 9 Unit Apartments | 0 | 0.0% |
| 10 or more Apartments | 0 | 0.0% |
| Mobile Home / Other | 0 | 0.0% |
| Total | 294 | 100.0% |
Housing Structures by Occupancy in Beverly Shores
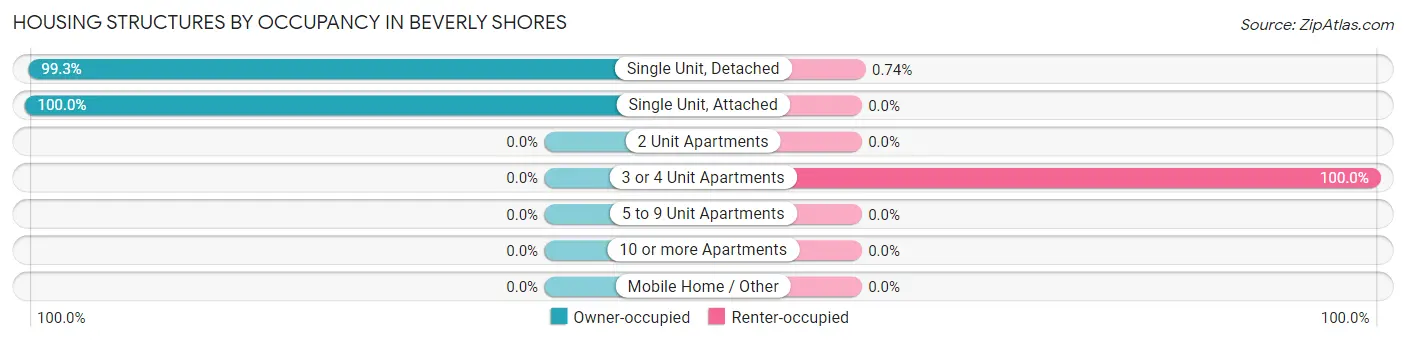
| Structure Type | Owner-occupied | Renter-occupied |
| Single Unit, Detached | 267 (99.3%) | 2 (0.7%) |
| Single Unit, Attached | 17 (100.0%) | 0 (0.0%) |
| 2 Unit Apartments | 0 (0.0%) | 0 (0.0%) |
| 3 or 4 Unit Apartments | 0 (0.0%) | 8 (100.0%) |
| 5 to 9 Unit Apartments | 0 (0.0%) | 0 (0.0%) |
| 10 or more Apartments | 0 (0.0%) | 0 (0.0%) |
| Mobile Home / Other | 0 (0.0%) | 0 (0.0%) |
| Total | 284 (96.6%) | 10 (3.4%) |
Housing Structures by Number of Rooms in Beverly Shores
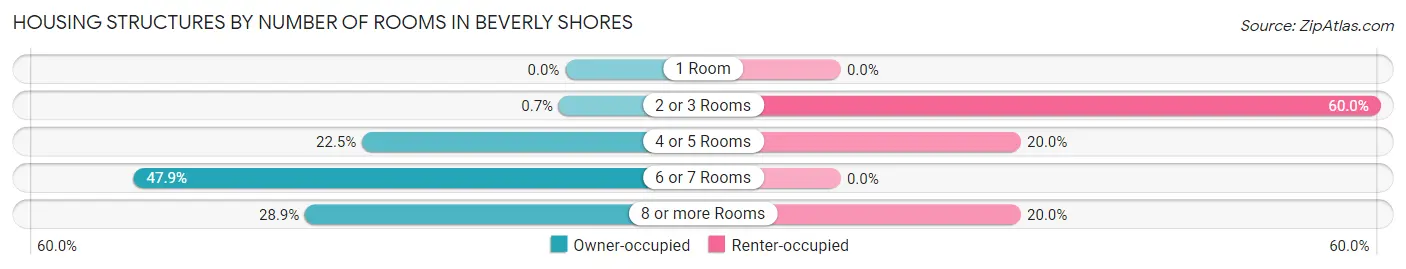
| Number of Rooms | Owner-occupied | Renter-occupied |
| 1 Room | 0 (0.0%) | 0 (0.0%) |
| 2 or 3 Rooms | 2 (0.7%) | 6 (60.0%) |
| 4 or 5 Rooms | 64 (22.5%) | 2 (20.0%) |
| 6 or 7 Rooms | 136 (47.9%) | 0 (0.0%) |
| 8 or more Rooms | 82 (28.9%) | 2 (20.0%) |
| Total | 284 (100.0%) | 10 (100.0%) |
Housing Structure by Heating Type in Beverly Shores
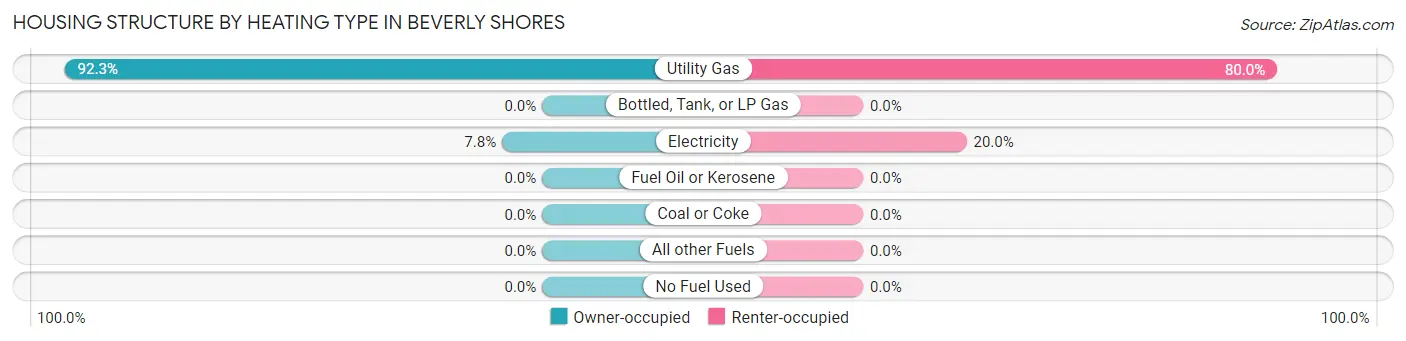
| Heating Type | Owner-occupied | Renter-occupied |
| Utility Gas | 262 (92.2%) | 8 (80.0%) |
| Bottled, Tank, or LP Gas | 0 (0.0%) | 0 (0.0%) |
| Electricity | 22 (7.7%) | 2 (20.0%) |
| Fuel Oil or Kerosene | 0 (0.0%) | 0 (0.0%) |
| Coal or Coke | 0 (0.0%) | 0 (0.0%) |
| All other Fuels | 0 (0.0%) | 0 (0.0%) |
| No Fuel Used | 0 (0.0%) | 0 (0.0%) |
| Total | 284 (100.0%) | 10 (100.0%) |
Household Vehicle Usage in Beverly Shores
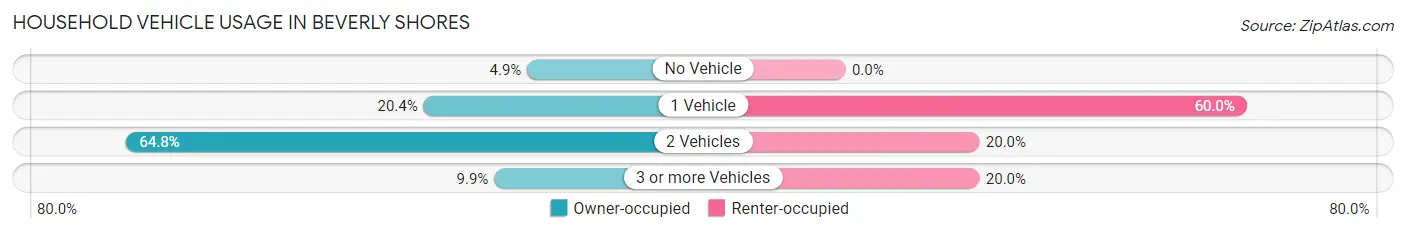
| Vehicles per Household | Owner-occupied | Renter-occupied |
| No Vehicle | 14 (4.9%) | 0 (0.0%) |
| 1 Vehicle | 58 (20.4%) | 6 (60.0%) |
| 2 Vehicles | 184 (64.8%) | 2 (20.0%) |
| 3 or more Vehicles | 28 (9.9%) | 2 (20.0%) |
| Total | 284 (100.0%) | 10 (100.0%) |
Real Estate & Mortgages in Beverly Shores
Real Estate and Mortgage Overview in Beverly Shores
| Characteristic | Without Mortgage | With Mortgage |
| Housing Units | 139 | 145 |
| Median Property Value | $531,300 | $492,700 |
| Median Household Income | $103,750 | $36 |
| Monthly Housing Costs | $829 | $58 |
| Real Estate Taxes | $5,313 | $0 |
Property Value by Mortgage Status in Beverly Shores
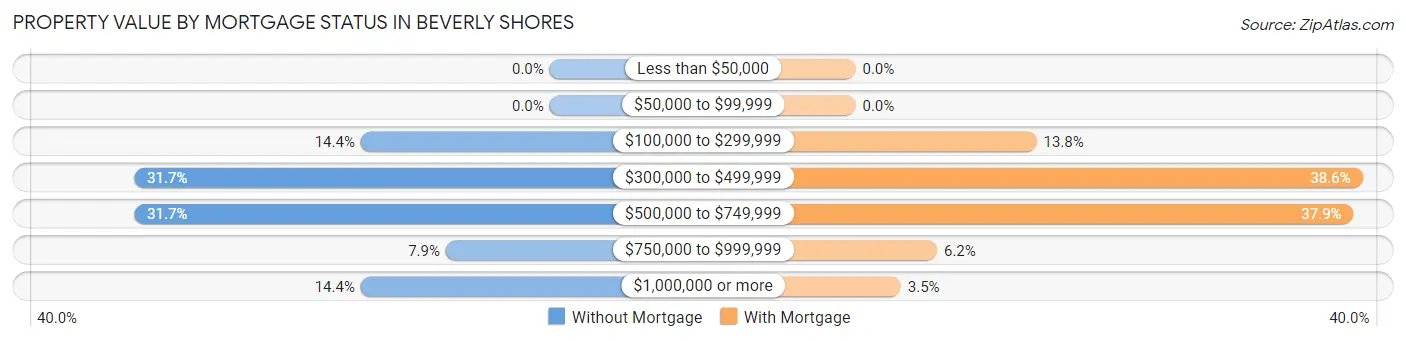
| Property Value | Without Mortgage | With Mortgage |
| Less than $50,000 | 0 (0.0%) | 0 (0.0%) |
| $50,000 to $99,999 | 0 (0.0%) | 0 (0.0%) |
| $100,000 to $299,999 | 20 (14.4%) | 20 (13.8%) |
| $300,000 to $499,999 | 44 (31.7%) | 56 (38.6%) |
| $500,000 to $749,999 | 44 (31.7%) | 55 (37.9%) |
| $750,000 to $999,999 | 11 (7.9%) | 9 (6.2%) |
| $1,000,000 or more | 20 (14.4%) | 5 (3.5%) |
| Total | 139 (100.0%) | 145 (100.0%) |
Household Income by Mortgage Status in Beverly Shores
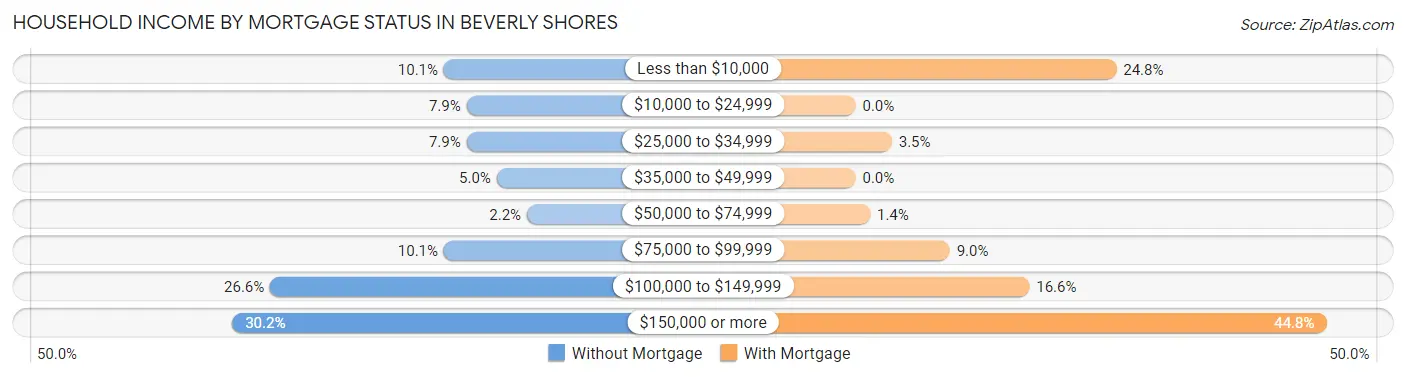
| Household Income | Without Mortgage | With Mortgage |
| Less than $10,000 | 14 (10.1%) | 36 (24.8%) |
| $10,000 to $24,999 | 11 (7.9%) | 0 (0.0%) |
| $25,000 to $34,999 | 11 (7.9%) | 5 (3.5%) |
| $35,000 to $49,999 | 7 (5.0%) | 0 (0.0%) |
| $50,000 to $74,999 | 3 (2.2%) | 2 (1.4%) |
| $75,000 to $99,999 | 14 (10.1%) | 13 (9.0%) |
| $100,000 to $149,999 | 37 (26.6%) | 24 (16.6%) |
| $150,000 or more | 42 (30.2%) | 65 (44.8%) |
| Total | 139 (100.0%) | 145 (100.0%) |
Property Value to Household Income Ratio in Beverly Shores
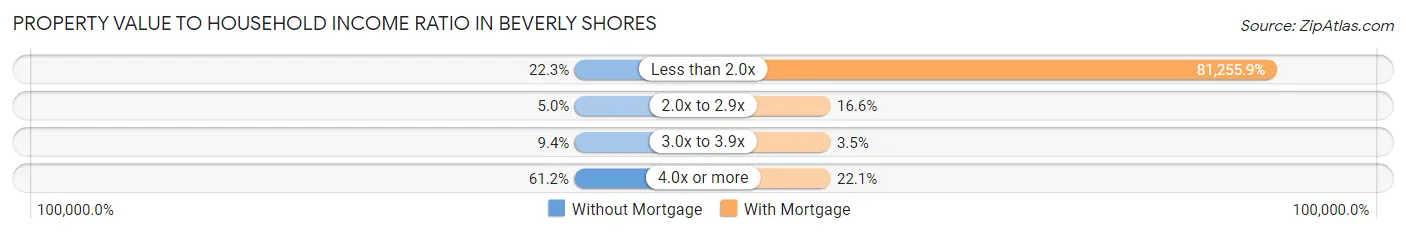
| Value-to-Income Ratio | Without Mortgage | With Mortgage |
| Less than 2.0x | 31 (22.3%) | 117,821 (81,255.9%) |
| 2.0x to 2.9x | 7 (5.0%) | 24 (16.6%) |
| 3.0x to 3.9x | 13 (9.3%) | 5 (3.5%) |
| 4.0x or more | 85 (61.2%) | 32 (22.1%) |
| Total | 139 (100.0%) | 145 (100.0%) |
Real Estate Taxes by Mortgage Status in Beverly Shores
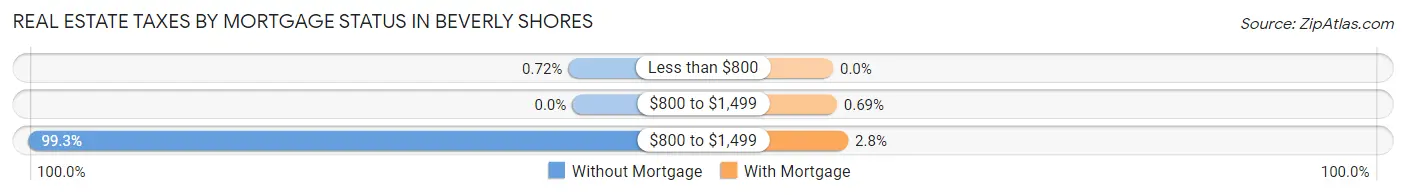
| Property Taxes | Without Mortgage | With Mortgage |
| Less than $800 | 1 (0.7%) | 0 (0.0%) |
| $800 to $1,499 | 0 (0.0%) | 1 (0.7%) |
| $800 to $1,499 | 138 (99.3%) | 4 (2.8%) |
| Total | 139 (100.0%) | 145 (100.0%) |
Health & Disability in Beverly Shores
Health Insurance Coverage by Age in Beverly Shores
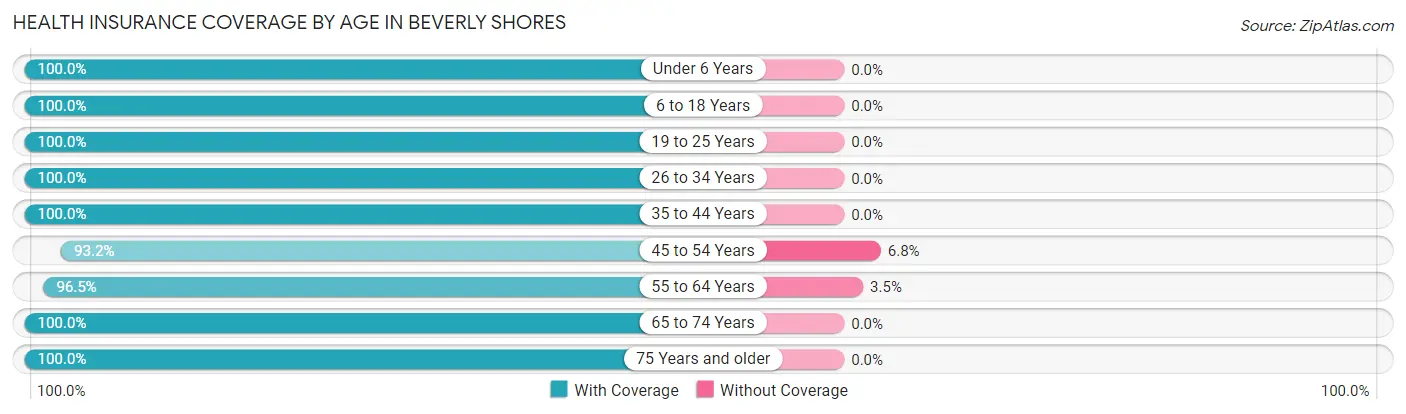
| Age Bracket | With Coverage | Without Coverage |
| Under 6 Years | 21 (100.0%) | 0 (0.0%) |
| 6 to 18 Years | 35 (100.0%) | 0 (0.0%) |
| 19 to 25 Years | 2 (100.0%) | 0 (0.0%) |
| 26 to 34 Years | 5 (100.0%) | 0 (0.0%) |
| 35 to 44 Years | 41 (100.0%) | 0 (0.0%) |
| 45 to 54 Years | 41 (93.2%) | 3 (6.8%) |
| 55 to 64 Years | 137 (96.5%) | 5 (3.5%) |
| 65 to 74 Years | 185 (100.0%) | 0 (0.0%) |
| 75 Years and older | 103 (100.0%) | 0 (0.0%) |
| Total | 570 (98.6%) | 8 (1.4%) |
Health Insurance Coverage by Citizenship Status in Beverly Shores
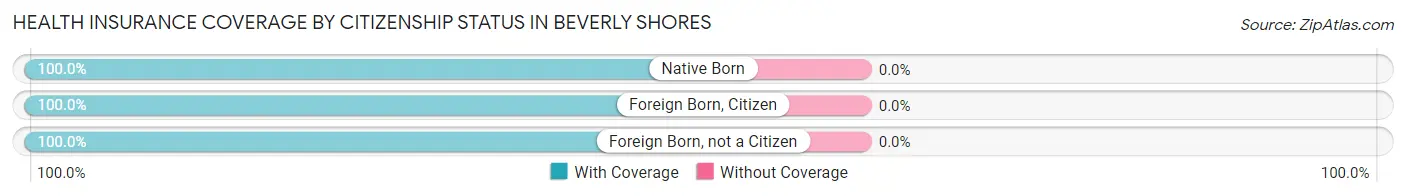
| Citizenship Status | With Coverage | Without Coverage |
| Native Born | 21 (100.0%) | 0 (0.0%) |
| Foreign Born, Citizen | 35 (100.0%) | 0 (0.0%) |
| Foreign Born, not a Citizen | 2 (100.0%) | 0 (0.0%) |
Health Insurance Coverage by Household Income in Beverly Shores
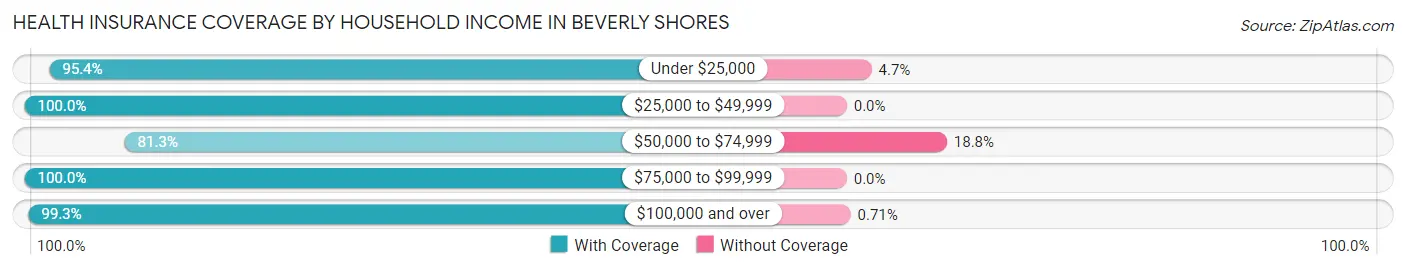
| Household Income | With Coverage | Without Coverage |
| Under $25,000 | 41 (95.4%) | 2 (4.6%) |
| $25,000 to $49,999 | 24 (100.0%) | 0 (0.0%) |
| $50,000 to $74,999 | 13 (81.2%) | 3 (18.8%) |
| $75,000 to $99,999 | 72 (100.0%) | 0 (0.0%) |
| $100,000 and over | 420 (99.3%) | 3 (0.7%) |
Public vs Private Health Insurance Coverage by Age in Beverly Shores
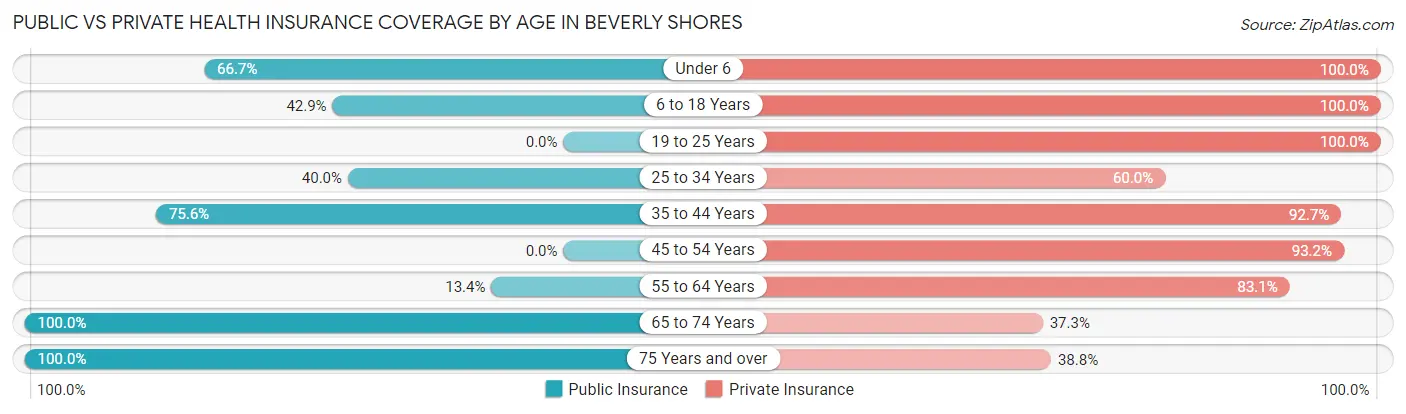
| Age Bracket | Public Insurance | Private Insurance |
| Under 6 | 14 (66.7%) | 21 (100.0%) |
| 6 to 18 Years | 15 (42.9%) | 35 (100.0%) |
| 19 to 25 Years | 0 (0.0%) | 2 (100.0%) |
| 25 to 34 Years | 2 (40.0%) | 3 (60.0%) |
| 35 to 44 Years | 31 (75.6%) | 38 (92.7%) |
| 45 to 54 Years | 0 (0.0%) | 41 (93.2%) |
| 55 to 64 Years | 19 (13.4%) | 118 (83.1%) |
| 65 to 74 Years | 185 (100.0%) | 69 (37.3%) |
| 75 Years and over | 103 (100.0%) | 40 (38.8%) |
| Total | 369 (63.8%) | 367 (63.5%) |
Disability Status by Sex by Age in Beverly Shores
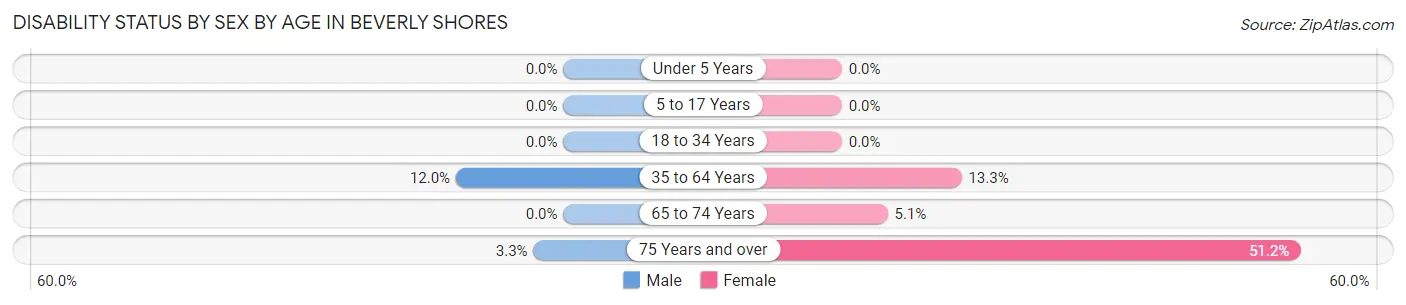
| Age Bracket | Male | Female |
| Under 5 Years | 0 (0.0%) | 0 (0.0%) |
| 5 to 17 Years | 0 (0.0%) | 0 (0.0%) |
| 18 to 34 Years | 0 (0.0%) | 0 (0.0%) |
| 35 to 64 Years | 11 (12.0%) | 18 (13.3%) |
| 65 to 74 Years | 0 (0.0%) | 5 (5.1%) |
| 75 Years and over | 2 (3.3%) | 22 (51.2%) |
Disability Class by Sex by Age in Beverly Shores
Disability Class: Hearing Difficulty
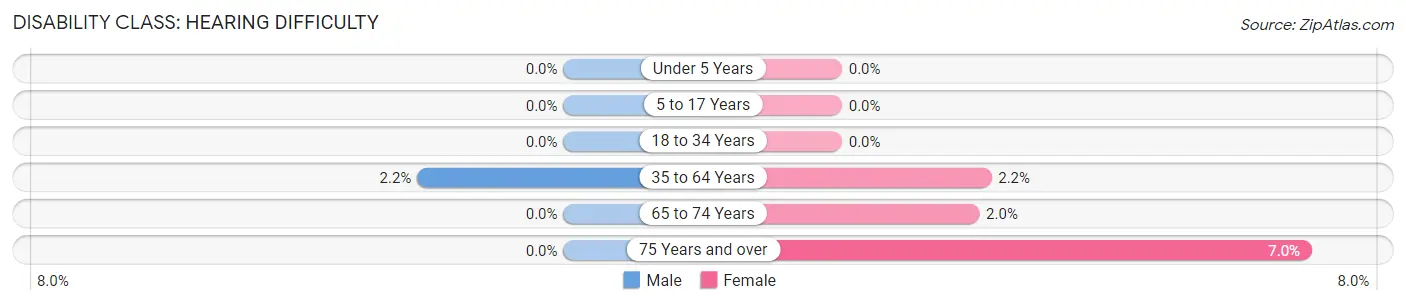
| Age Bracket | Male | Female |
| Under 5 Years | 0 (0.0%) | 0 (0.0%) |
| 5 to 17 Years | 0 (0.0%) | 0 (0.0%) |
| 18 to 34 Years | 0 (0.0%) | 0 (0.0%) |
| 35 to 64 Years | 2 (2.2%) | 3 (2.2%) |
| 65 to 74 Years | 0 (0.0%) | 2 (2.0%) |
| 75 Years and over | 0 (0.0%) | 3 (7.0%) |
Disability Class: Vision Difficulty
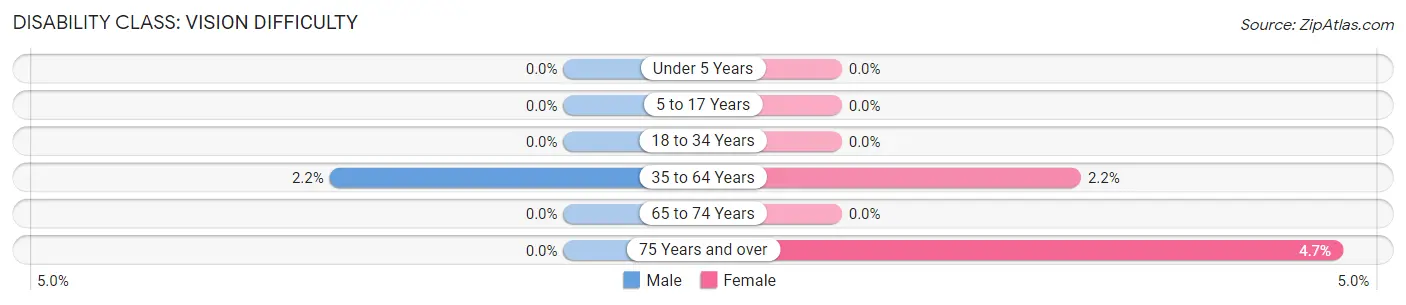
| Age Bracket | Male | Female |
| Under 5 Years | 0 (0.0%) | 0 (0.0%) |
| 5 to 17 Years | 0 (0.0%) | 0 (0.0%) |
| 18 to 34 Years | 0 (0.0%) | 0 (0.0%) |
| 35 to 64 Years | 2 (2.2%) | 3 (2.2%) |
| 65 to 74 Years | 0 (0.0%) | 0 (0.0%) |
| 75 Years and over | 0 (0.0%) | 2 (4.6%) |
Disability Class: Cognitive Difficulty
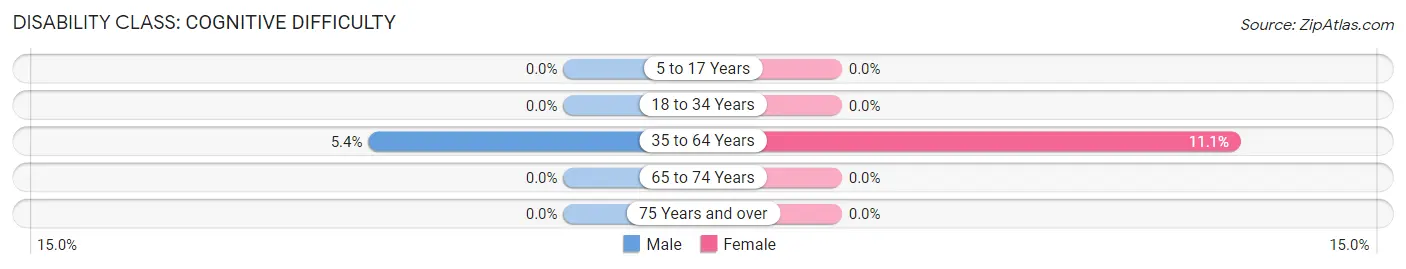
| Age Bracket | Male | Female |
| 5 to 17 Years | 0 (0.0%) | 0 (0.0%) |
| 18 to 34 Years | 0 (0.0%) | 0 (0.0%) |
| 35 to 64 Years | 5 (5.4%) | 15 (11.1%) |
| 65 to 74 Years | 0 (0.0%) | 0 (0.0%) |
| 75 Years and over | 0 (0.0%) | 0 (0.0%) |
Disability Class: Ambulatory Difficulty
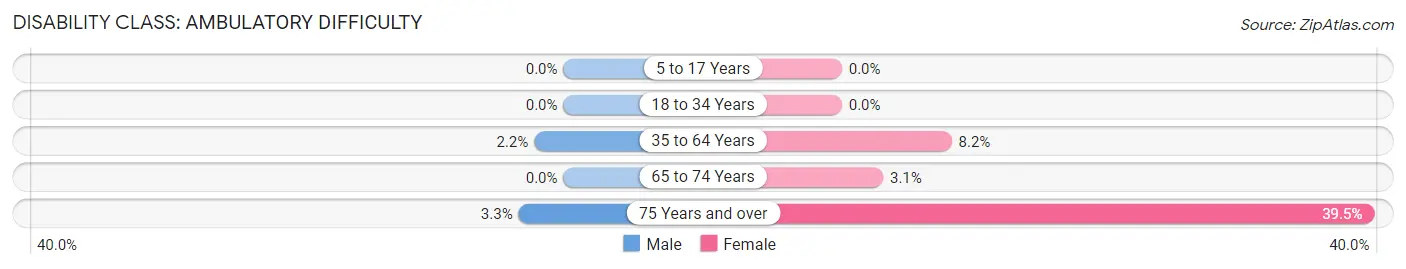
| Age Bracket | Male | Female |
| 5 to 17 Years | 0 (0.0%) | 0 (0.0%) |
| 18 to 34 Years | 0 (0.0%) | 0 (0.0%) |
| 35 to 64 Years | 2 (2.2%) | 11 (8.2%) |
| 65 to 74 Years | 0 (0.0%) | 3 (3.1%) |
| 75 Years and over | 2 (3.3%) | 17 (39.5%) |
Disability Class: Self-Care Difficulty
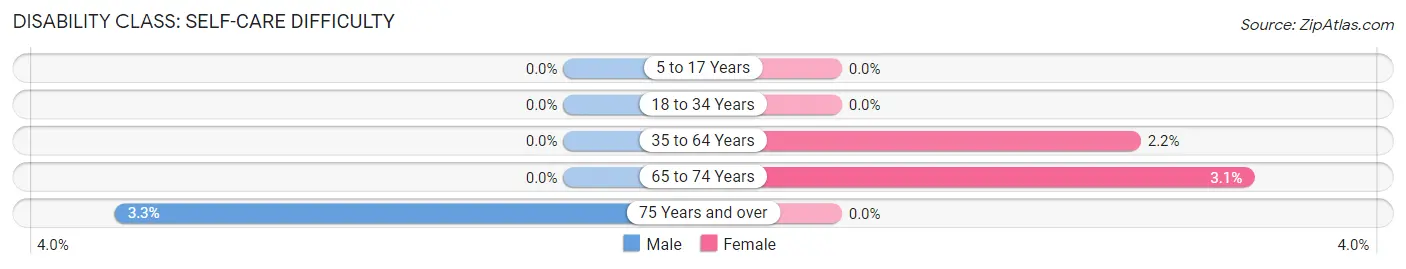
| Age Bracket | Male | Female |
| 5 to 17 Years | 0 (0.0%) | 0 (0.0%) |
| 18 to 34 Years | 0 (0.0%) | 0 (0.0%) |
| 35 to 64 Years | 0 (0.0%) | 3 (2.2%) |
| 65 to 74 Years | 0 (0.0%) | 3 (3.1%) |
| 75 Years and over | 2 (3.3%) | 0 (0.0%) |
Technology Access in Beverly Shores
Computing Device Access in Beverly Shores
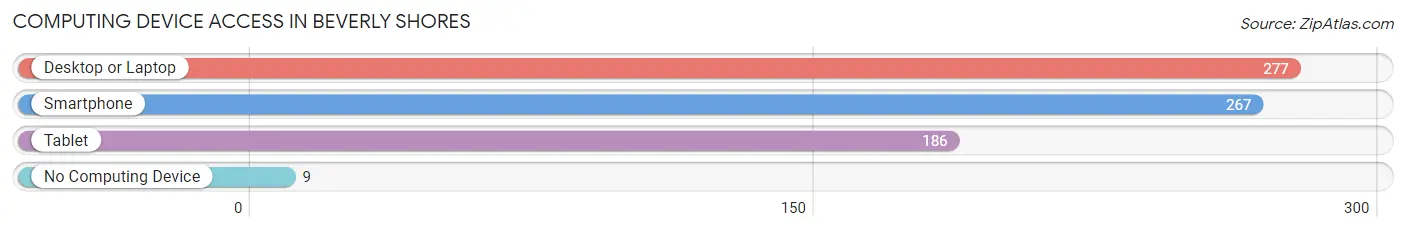
| Device Type | # Households | % Households |
| Desktop or Laptop | 277 | 94.2% |
| Smartphone | 267 | 90.8% |
| Tablet | 186 | 63.3% |
| No Computing Device | 9 | 3.1% |
| Total | 294 | 100.0% |
Internet Access in Beverly Shores
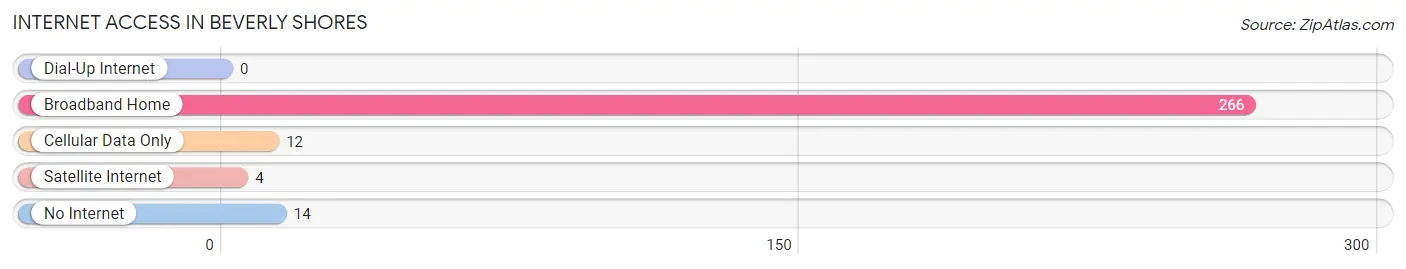
| Internet Type | # Households | % Households |
| Dial-Up Internet | 0 | 0.0% |
| Broadband Home | 266 | 90.5% |
| Cellular Data Only | 12 | 4.1% |
| Satellite Internet | 4 | 1.4% |
| No Internet | 14 | 4.8% |
| Total | 294 | 100.0% |
Beverly Shores Summary
Beverly Shores is a small town located in Porter County, Indiana, United States. It is situated on the southern shore of Lake Michigan, approximately 40 miles east of Chicago. The town was founded in 1925 and has a population of approximately 1,000 people.
History
Beverly Shores was founded in 1925 by a group of Chicago businessmen who wanted to create a resort community on the shores of Lake Michigan. The town was named after the wife of one of the founders, Beverly. The town was designed to be a summer resort, with a boardwalk, beach, and a variety of shops and restaurants.
In the 1930s, the town began to attract more permanent residents, and by the 1940s, it had become a popular vacation spot for Chicagoans. The town was incorporated in 1945 and has remained a popular destination for tourists and vacationers ever since.
Geography
Beverly Shores is located in Porter County, Indiana, on the southern shore of Lake Michigan. The town is situated on a narrow strip of land between the lake and the Indiana Dunes National Lakeshore. The town is bordered by the towns of Porter and Chesterton to the north, and the towns of Burns Harbor and Portage to the south.
The town has a total area of 1.2 square miles, all of which is land. The town is located at an elevation of 645 feet above sea level.
Economy
The economy of Beverly Shores is largely based on tourism. The town is a popular destination for vacationers and tourists, and it is home to a variety of shops, restaurants, and other businesses that cater to visitors. The town also has a number of bed and breakfasts, as well as a few small hotels.
The town is also home to a number of small businesses, including a marina, a boat repair shop, and a few small retail stores. The town also has a few small manufacturing businesses, including a furniture maker and a metal fabrication shop.
Demographics
As of the 2010 census, the population of Beverly Shores was 1,039. The racial makeup of the town was 97.2% White, 0.7% African American, 0.3% Native American, 0.3% Asian, 0.1% Pacific Islander, 0.3% from other races, and 1.2% from two or more races. Hispanic or Latino of any race were 1.7% of the population.
The median income for a household in the town was $50,000, and the median income for a family was $60,000. The per capita income for the town was $25,000. About 8.3% of families and 10.2% of the population were below the poverty line, including 14.3% of those under age 18 and 5.3% of those age 65 or over.
Common Questions
What is Per Capita Income in Beverly Shores?
Per Capita income in Beverly Shores is $79,084.
What is the Median Family Income in Beverly Shores?
Median Family Income in Beverly Shores is $118,586.
What is the Median Household income in Beverly Shores?
Median Household Income in Beverly Shores is $116,071.
What is Income or Wage Gap in Beverly Shores?
Income or Wage Gap in Beverly Shores is 28.1%.
Women in Beverly Shores earn 71.9 cents for every dollar earned by a man.
What is Inequality or Gini Index in Beverly Shores?
Inequality or Gini Index in Beverly Shores is 0.44.
What is the Total Population of Beverly Shores?
Total Population of Beverly Shores is 578.
What is the Total Male Population of Beverly Shores?
Total Male Population of Beverly Shores is 274.
What is the Total Female Population of Beverly Shores?
Total Female Population of Beverly Shores is 304.
What is the Ratio of Males per 100 Females in Beverly Shores?
There are 90.13 Males per 100 Females in Beverly Shores.
What is the Ratio of Females per 100 Males in Beverly Shores?
There are 110.95 Females per 100 Males in Beverly Shores.
What is the Median Population Age in Beverly Shores?
Median Population Age in Beverly Shores is 65.0 Years.
What is the Average Family Size in Beverly Shores
Average Family Size in Beverly Shores is 2.3 People.
What is the Average Household Size in Beverly Shores
Average Household Size in Beverly Shores is 2.0 People.
How Large is the Labor Force in Beverly Shores?
There are 172 People in the Labor Forcein in Beverly Shores.
What is the Percentage of People in the Labor Force in Beverly Shores?
32.5% of People are in the Labor Force in Beverly Shores.
What is the Unemployment Rate in Beverly Shores?
Unemployment Rate in Beverly Shores is 2.3%.