Fish Lake, IN Map & Demographics
Fish Lake Map
Fish Lake Overview
$33,499
PER CAPITA INCOME
$76,174
AVG FAMILY INCOME
$66,554
AVG HOUSEHOLD INCOME
0.36
INEQUALITY / GINI INDEX
782
TOTAL POPULATION
427
MALE POPULATION
355
FEMALE POPULATION
120.28
MALES / 100 FEMALES
83.14
FEMALES / 100 MALES
36.0
MEDIAN AGE
3.1
AVG FAMILY SIZE
2.7
AVG HOUSEHOLD SIZE
492
LABOR FORCE [ PEOPLE ]
74.4%
PERCENT IN LABOR FORCE
5.3%
UNEMPLOYMENT RATE
Income in Fish Lake
Income Overview in Fish Lake
Per Capita Income in Fish Lake is $33,499, while median incomes of families and households are $76,174 and $66,554 respectively.
| Characteristic | Number | Measure |
| Per Capita Income | 782 | $33,499 |
| Median Family Income | 235 | $76,174 |
| Mean Family Income | 235 | $94,207 |
| Median Household Income | 294 | $66,554 |
| Mean Household Income | 294 | $81,670 |
| Income Deficit | 235 | $0 |
| Wage / Income Gap (%) | 782 | 0.00% |
| Wage / Income Gap ($) | 782 | 100.00¢ per $1 |
| Gini / Inequality Index | 782 | 0.36 |
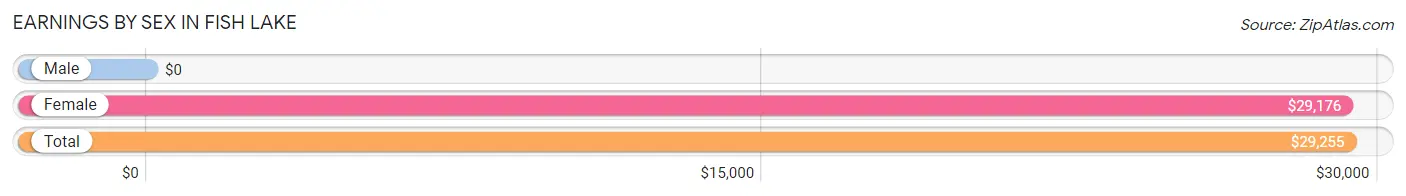
Earnings by Sex in Fish Lake
| Sex | Number | Average Earnings |
| Male | 261 (51.6%) | $0 |
| Female | 245 (48.4%) | $29,176 |
| Total | 506 (100.0%) | $29,255 |
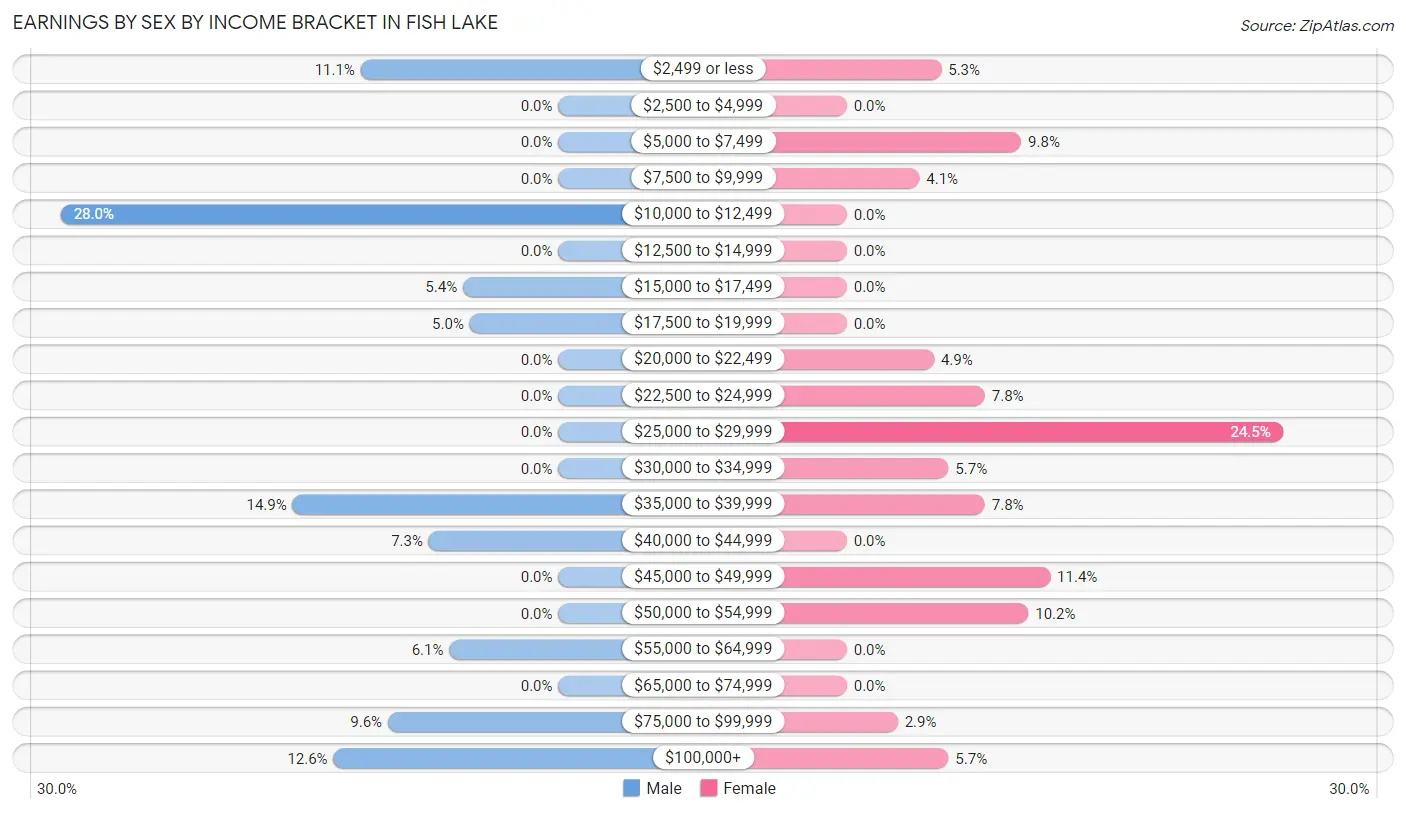
Earnings by Sex by Income Bracket in Fish Lake
The most common earnings brackets in Fish Lake are $10,000 to $12,499 for men (73 | 28.0%) and $25,000 to $29,999 for women (60 | 24.5%).
| Income | Male | Female |
| $2,499 or less | 29 (11.1%) | 13 (5.3%) |
| $2,500 to $4,999 | 0 (0.0%) | 0 (0.0%) |
| $5,000 to $7,499 | 0 (0.0%) | 24 (9.8%) |
| $7,500 to $9,999 | 0 (0.0%) | 10 (4.1%) |
| $10,000 to $12,499 | 73 (28.0%) | 0 (0.0%) |
| $12,500 to $14,999 | 0 (0.0%) | 0 (0.0%) |
| $15,000 to $17,499 | 14 (5.4%) | 0 (0.0%) |
| $17,500 to $19,999 | 13 (5.0%) | 0 (0.0%) |
| $20,000 to $22,499 | 0 (0.0%) | 12 (4.9%) |
| $22,500 to $24,999 | 0 (0.0%) | 19 (7.8%) |
| $25,000 to $29,999 | 0 (0.0%) | 60 (24.5%) |
| $30,000 to $34,999 | 0 (0.0%) | 14 (5.7%) |
| $35,000 to $39,999 | 39 (14.9%) | 19 (7.8%) |
| $40,000 to $44,999 | 19 (7.3%) | 0 (0.0%) |
| $45,000 to $49,999 | 0 (0.0%) | 28 (11.4%) |
| $50,000 to $54,999 | 0 (0.0%) | 25 (10.2%) |
| $55,000 to $64,999 | 16 (6.1%) | 0 (0.0%) |
| $65,000 to $74,999 | 0 (0.0%) | 0 (0.0%) |
| $75,000 to $99,999 | 25 (9.6%) | 7 (2.9%) |
| $100,000+ | 33 (12.6%) | 14 (5.7%) |
| Total | 261 (100.0%) | 245 (100.0%) |
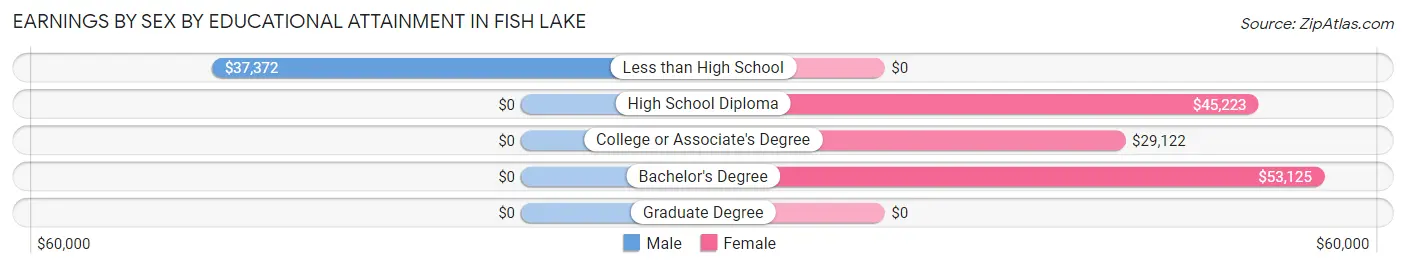
Earnings by Sex by Educational Attainment in Fish Lake
Average earnings in Fish Lake are $36,442 for men and $29,734 for women, a difference of 18.4%. Men with an educational attainment of less than high school enjoy the highest average annual earnings of $37,372, while those with less than high school education earn the least with $37,372. Women with an educational attainment of bachelor's degree earn the most with the average annual earnings of $53,125, while those with college or associate's degree education have the smallest earnings of $29,122.
| Educational Attainment | Male Income | Female Income |
| Less than High School | $37,372 | $0 |
| High School Diploma | - | - |
| College or Associate's Degree | - | - |
| Bachelor's Degree | - | - |
| Graduate Degree | - | - |
| Total | $36,442 | $29,734 |
Family Income in Fish Lake
Family Income Brackets in Fish Lake
According to the Fish Lake family income data, there are 77 families falling into the $75,000 to $99,999 income range, which is the most common income bracket and makes up 32.8% of all families.
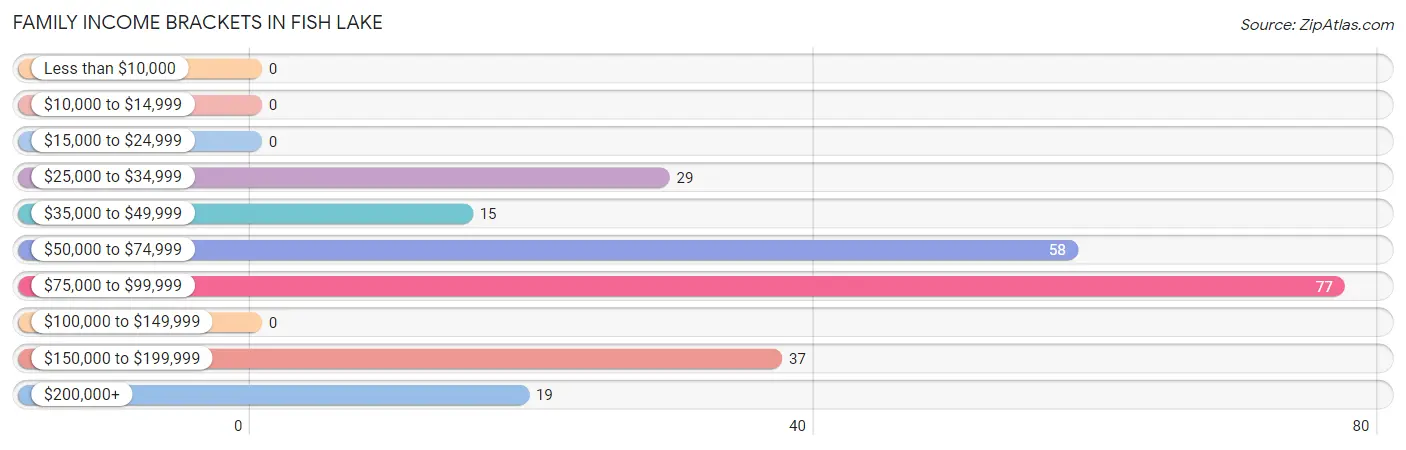
| Income Bracket | # Families | % Families |
| Less than $10,000 | 0 | 0.0% |
| $10,000 to $14,999 | 0 | 0.0% |
| $15,000 to $24,999 | 0 | 0.0% |
| $25,000 to $34,999 | 29 | 12.3% |
| $35,000 to $49,999 | 15 | 6.4% |
| $50,000 to $74,999 | 58 | 24.7% |
| $75,000 to $99,999 | 77 | 32.8% |
| $100,000 to $149,999 | 0 | 0.0% |
| $150,000 to $199,999 | 37 | 15.7% |
| $200,000+ | 19 | 8.1% |
Family Income by Famaliy Size in Fish Lake
2-person families (97 | 41.3%) account for the highest median family income in Fish Lake with $85,078 per family, while 2-person families (97 | 41.3%) have the highest median income of $42,539 per family member.
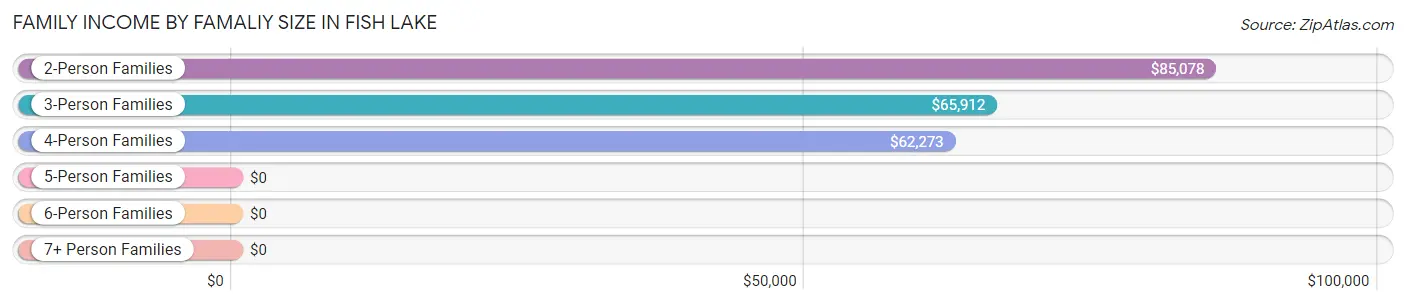
| Income Bracket | # Families | Median Income |
| 2-Person Families | 97 (41.3%) | $85,078 |
| 3-Person Families | 67 (28.5%) | $65,912 |
| 4-Person Families | 58 (24.7%) | $62,273 |
| 5-Person Families | 13 (5.5%) | $0 |
| 6-Person Families | 0 (0.0%) | $0 |
| 7+ Person Families | 0 (0.0%) | $0 |
| Total | 235 (100.0%) | $76,174 |
Family Income by Number of Earners in Fish Lake
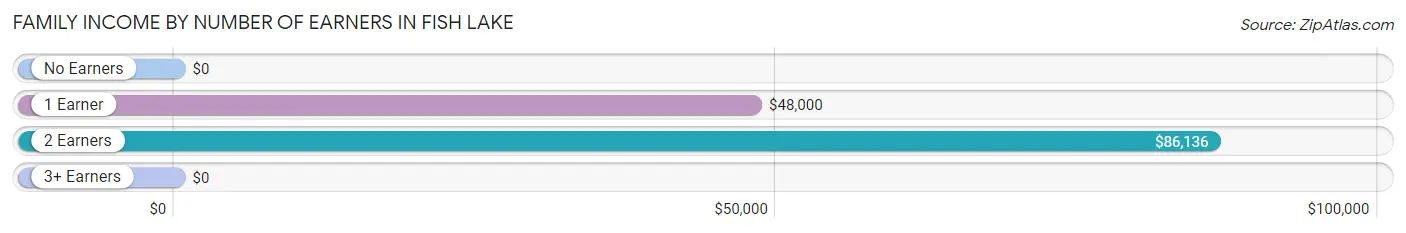
| Number of Earners | # Families | Median Income |
| No Earners | 33 (14.0%) | $0 |
| 1 Earner | 44 (18.7%) | $48,000 |
| 2 Earners | 114 (48.5%) | $86,136 |
| 3+ Earners | 44 (18.7%) | $0 |
| Total | 235 (100.0%) | $76,174 |
Household Income in Fish Lake
Household Income Brackets in Fish Lake
With 77 households falling in the category, the $75,000 to $99,999 income range is the most frequent in Fish Lake, accounting for 26.2% of all households.
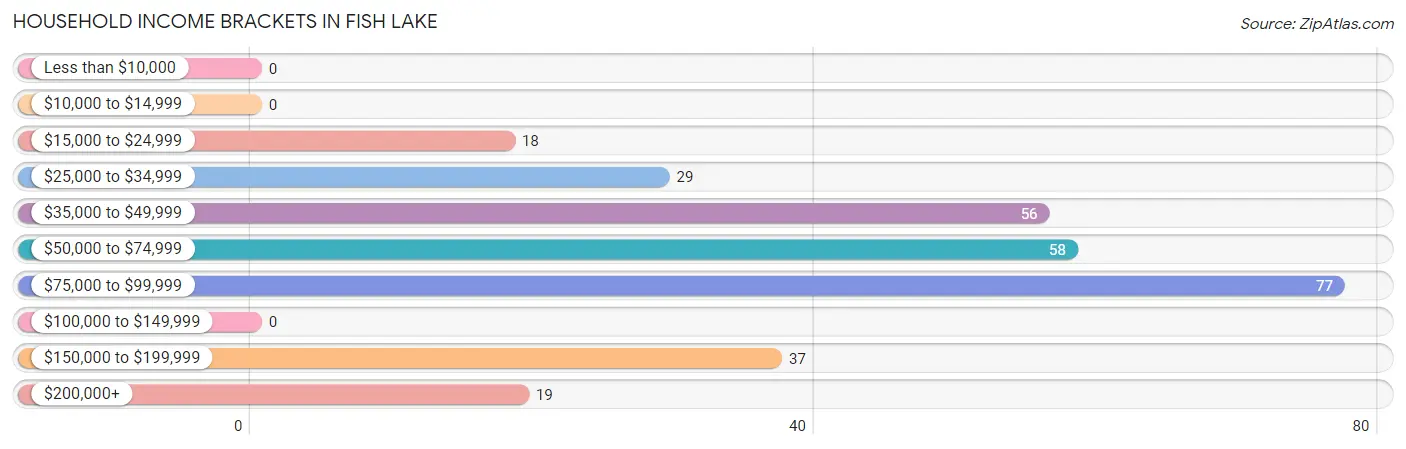
| Income Bracket | # Households | % Households |
| Less than $10,000 | 0 | 0.0% |
| $10,000 to $14,999 | 0 | 0.0% |
| $15,000 to $24,999 | 18 | 6.1% |
| $25,000 to $34,999 | 29 | 9.9% |
| $35,000 to $49,999 | 56 | 19.0% |
| $50,000 to $74,999 | 58 | 19.7% |
| $75,000 to $99,999 | 77 | 26.2% |
| $100,000 to $149,999 | 0 | 0.0% |
| $150,000 to $199,999 | 37 | 12.6% |
| $200,000+ | 19 | 6.5% |
Household Income by Householder Age in Fish Lake
The median household income in Fish Lake is $66,554, with the highest median household income of $66,655 found in the 25 to 44 years age bracket for the primary householder. A total of 107 households (36.4%) fall into this category.
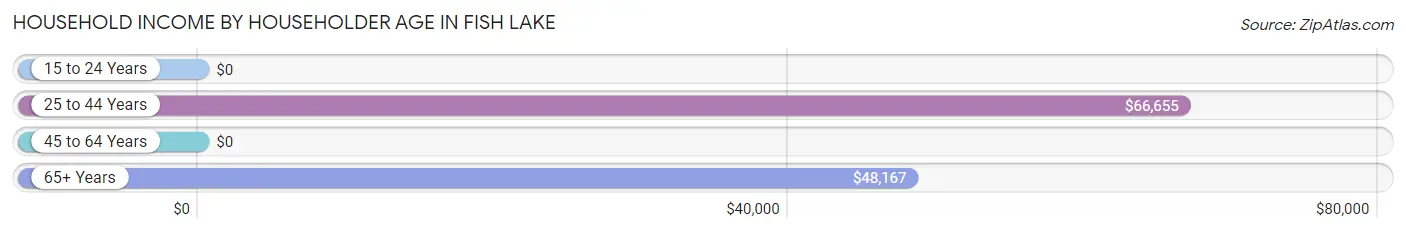
| Income Bracket | # Households | Median Income |
| 15 to 24 Years | 0 (0.0%) | $0 |
| 25 to 44 Years | 107 (36.4%) | $66,655 |
| 45 to 64 Years | 99 (33.7%) | $0 |
| 65+ Years | 88 (29.9%) | $48,167 |
| Total | 294 (100.0%) | $66,554 |
Poverty in Fish Lake
Income Below Poverty by Sex and Age in Fish Lake
With 8.0% poverty level for males and 8.5% for females among the residents of Fish Lake, 6 to 11 year old males and 6 to 11 year old females are the most vulnerable to poverty, with 15 males (24.6%) and 16 females (40.0%) in their respective age groups living below the poverty level.
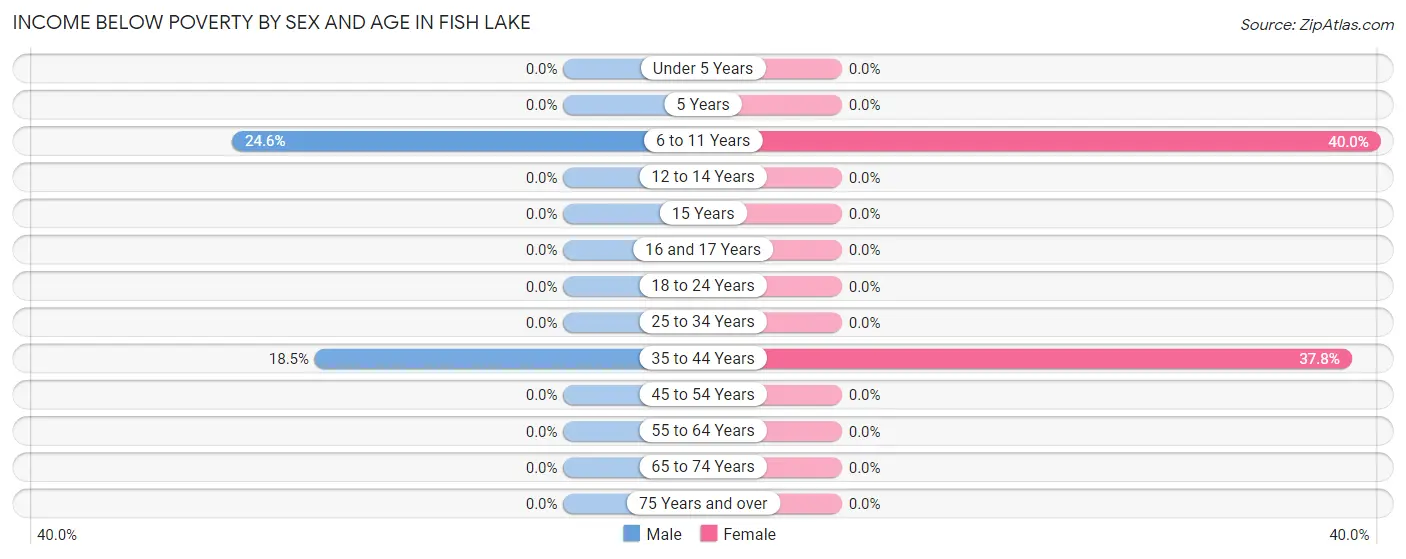
| Age Bracket | Male | Female |
| Under 5 Years | 0 (0.0%) | 0 (0.0%) |
| 5 Years | 0 (0.0%) | 0 (0.0%) |
| 6 to 11 Years | 15 (24.6%) | 16 (40.0%) |
| 12 to 14 Years | 0 (0.0%) | 0 (0.0%) |
| 15 Years | 0 (0.0%) | 0 (0.0%) |
| 16 and 17 Years | 0 (0.0%) | 0 (0.0%) |
| 18 to 24 Years | 0 (0.0%) | 0 (0.0%) |
| 25 to 34 Years | 0 (0.0%) | 0 (0.0%) |
| 35 to 44 Years | 19 (18.4%) | 14 (37.8%) |
| 45 to 54 Years | 0 (0.0%) | 0 (0.0%) |
| 55 to 64 Years | 0 (0.0%) | 0 (0.0%) |
| 65 to 74 Years | 0 (0.0%) | 0 (0.0%) |
| 75 Years and over | 0 (0.0%) | 0 (0.0%) |
| Total | 34 (8.0%) | 30 (8.5%) |
Income Above Poverty by Sex and Age in Fish Lake
According to the poverty statistics in Fish Lake, males aged 12 to 14 years and females aged 18 to 24 years are the age groups that are most secure financially, with 100.0% of males and 100.0% of females in these age groups living above the poverty line.
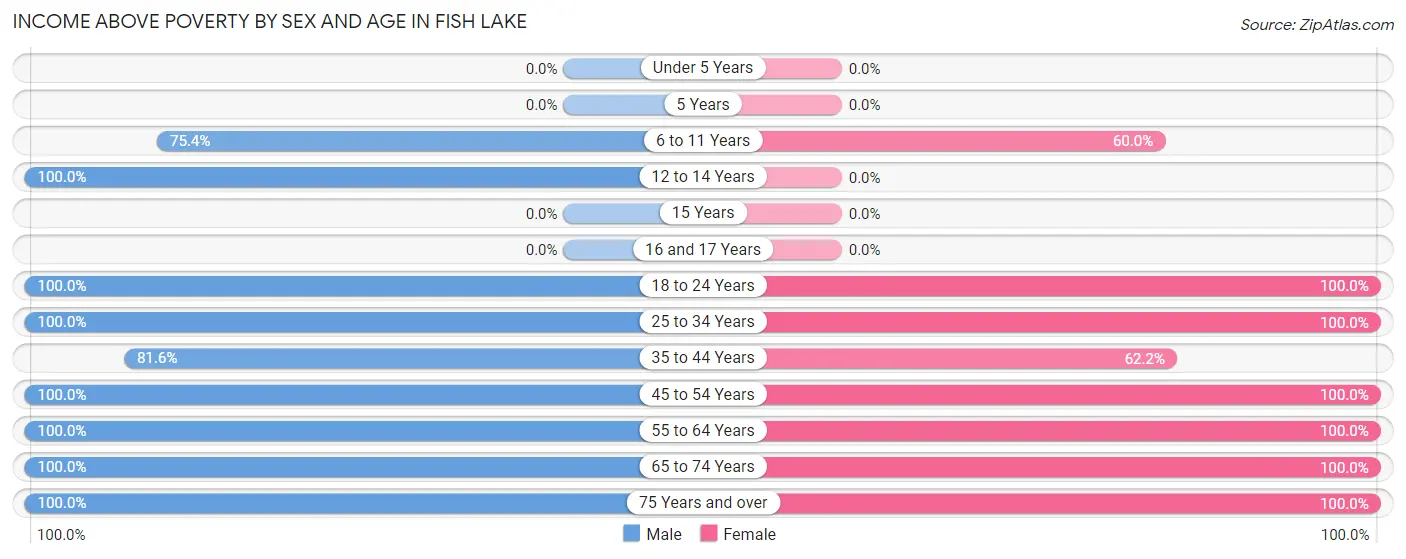
| Age Bracket | Male | Female |
| Under 5 Years | 0 (0.0%) | 0 (0.0%) |
| 5 Years | 0 (0.0%) | 0 (0.0%) |
| 6 to 11 Years | 46 (75.4%) | 24 (60.0%) |
| 12 to 14 Years | 20 (100.0%) | 0 (0.0%) |
| 15 Years | 0 (0.0%) | 0 (0.0%) |
| 16 and 17 Years | 0 (0.0%) | 0 (0.0%) |
| 18 to 24 Years | 42 (100.0%) | 49 (100.0%) |
| 25 to 34 Years | 25 (100.0%) | 73 (100.0%) |
| 35 to 44 Years | 84 (81.6%) | 23 (62.2%) |
| 45 to 54 Years | 25 (100.0%) | 43 (100.0%) |
| 55 to 64 Years | 44 (100.0%) | 43 (100.0%) |
| 65 to 74 Years | 89 (100.0%) | 48 (100.0%) |
| 75 Years and over | 18 (100.0%) | 22 (100.0%) |
| Total | 393 (92.0%) | 325 (91.5%) |
Income Below Poverty Among Married-Couple Families in Fish Lake
The poverty statistics for married-couple families in Fish Lake show that 9.6% or 19 of the total 198 families live below the poverty line. Families with 1 or 2 children have the highest poverty rate of 22.6%, comprising of 19 families. On the other hand, families with no children have the lowest poverty rate of 0.0%, which includes 0 families.
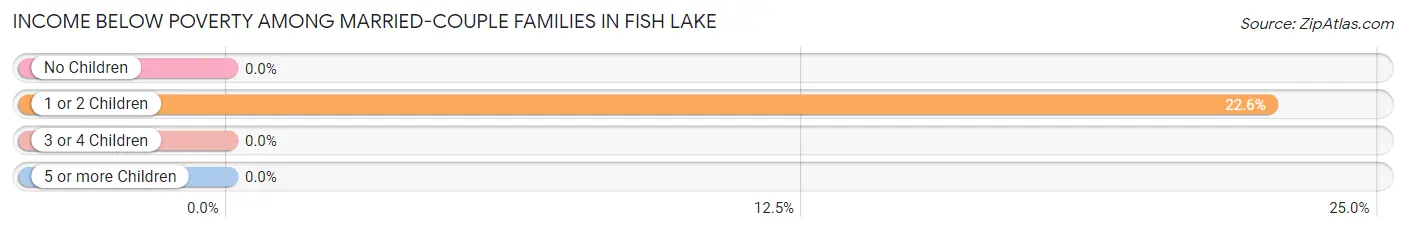
| Children | Above Poverty | Below Poverty |
| No Children | 114 (100.0%) | 0 (0.0%) |
| 1 or 2 Children | 65 (77.4%) | 19 (22.6%) |
| 3 or 4 Children | 0 (0.0%) | 0 (0.0%) |
| 5 or more Children | 0 (0.0%) | 0 (0.0%) |
| Total | 179 (90.4%) | 19 (9.6%) |
Income Below Poverty Among Single-Parent Households in Fish Lake
| Children | Single Father | Single Mother |
| No Children | 0 (0.0%) | 0 (0.0%) |
| 1 or 2 Children | 0 (0.0%) | 0 (0.0%) |
| 3 or 4 Children | 0 (0.0%) | 0 (0.0%) |
| 5 or more Children | 0 (0.0%) | 0 (0.0%) |
| Total | 0 (0.0%) | 0 (0.0%) |
Income Below Poverty Among Married-Couple vs Single-Parent Households in Fish Lake
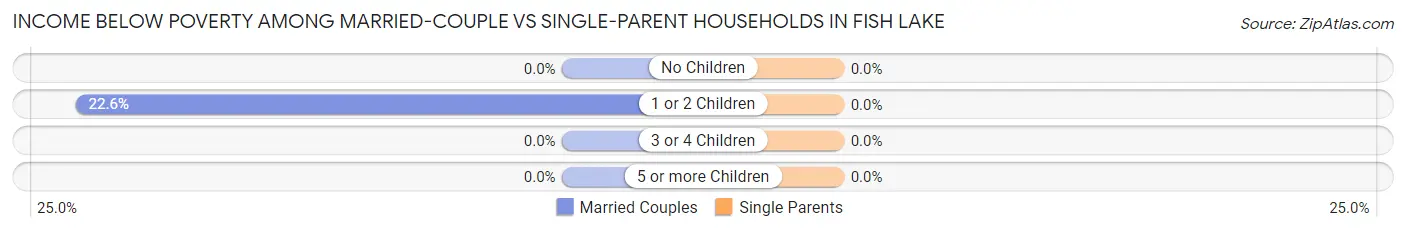
| Children | Married-Couple Families | Single-Parent Households |
| No Children | 0 (0.0%) | 0 (0.0%) |
| 1 or 2 Children | 19 (22.6%) | 0 (0.0%) |
| 3 or 4 Children | 0 (0.0%) | 0 (0.0%) |
| 5 or more Children | 0 (0.0%) | 0 (0.0%) |
| Total | 19 (9.6%) | 0 (0.0%) |
Race in Fish Lake
The most populous races in Fish Lake are White / Caucasian (682 | 87.2%), Hispanic or Latino (271 | 34.6%), and Two or more Races (86 | 11.0%).
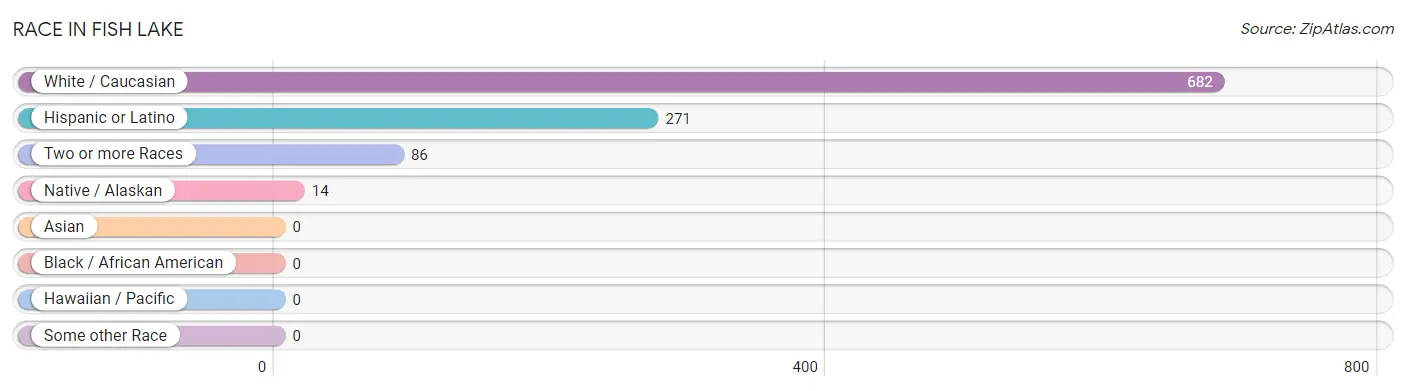
| Race | # Population | % Population |
| Asian | 0 | 0.0% |
| Black / African American | 0 | 0.0% |
| Hawaiian / Pacific | 0 | 0.0% |
| Hispanic or Latino | 271 | 34.6% |
| Native / Alaskan | 14 | 1.8% |
| White / Caucasian | 682 | 87.2% |
| Two or more Races | 86 | 11.0% |
| Some other Race | 0 | 0.0% |
| Total | 782 | 100.0% |
Ancestry in Fish Lake
The most populous ancestries reported in Fish Lake are Mexican (271 | 34.6%), German (110 | 14.1%), Irish (106 | 13.6%), American (82 | 10.5%), and Polish (62 | 7.9%), together accounting for 80.7% of all Fish Lake residents.
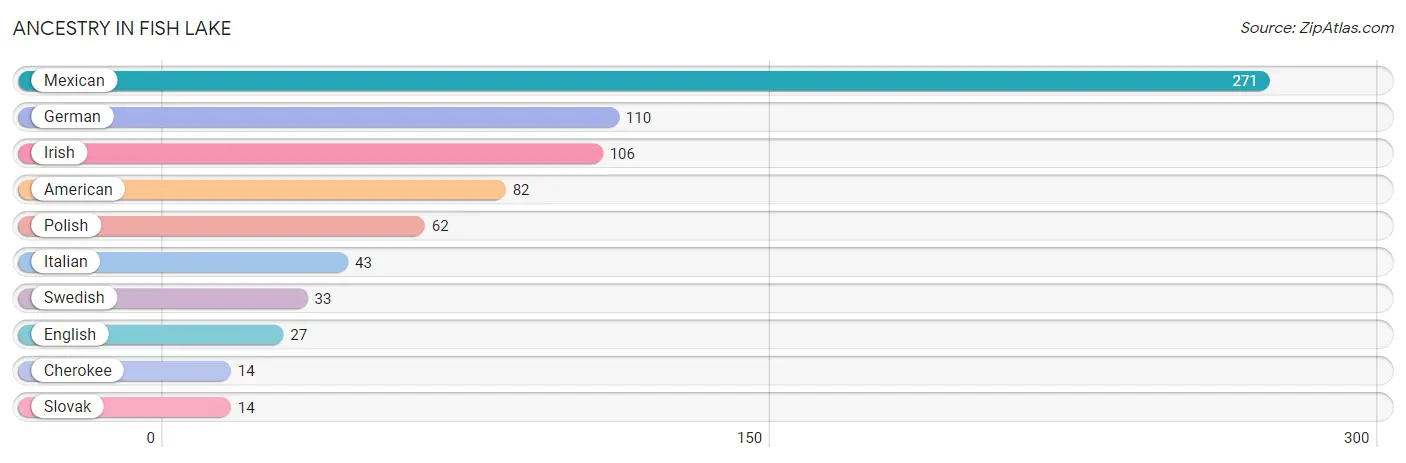
| Ancestry | # Population | % Population |
| American | 82 | 10.5% |
| Cherokee | 14 | 1.8% |
| English | 27 | 3.5% |
| German | 110 | 14.1% |
| Irish | 106 | 13.6% |
| Italian | 43 | 5.5% |
| Mexican | 271 | 34.6% |
| Polish | 62 | 7.9% |
| Slovak | 14 | 1.8% |
| Swedish | 33 | 4.2% | View All 10 Rows |
Immigrants in Fish Lake
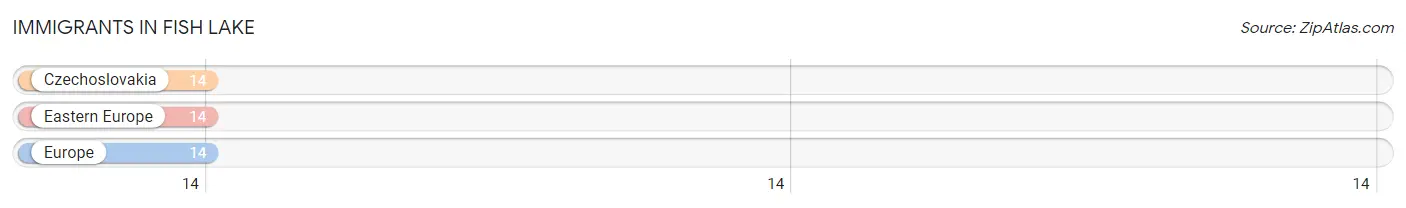
The most numerous immigrant groups reported in Fish Lake came from Czechoslovakia (14 | 1.8%), Eastern Europe (14 | 1.8%), and Europe (14 | 1.8%), together accounting for 5.4% of all Fish Lake residents.
| Immigration Origin | # Population | % Population |
| Czechoslovakia | 14 | 1.8% |
| Eastern Europe | 14 | 1.8% |
| Europe | 14 | 1.8% | View All 3 Rows |
Sex and Age in Fish Lake
Sex and Age in Fish Lake
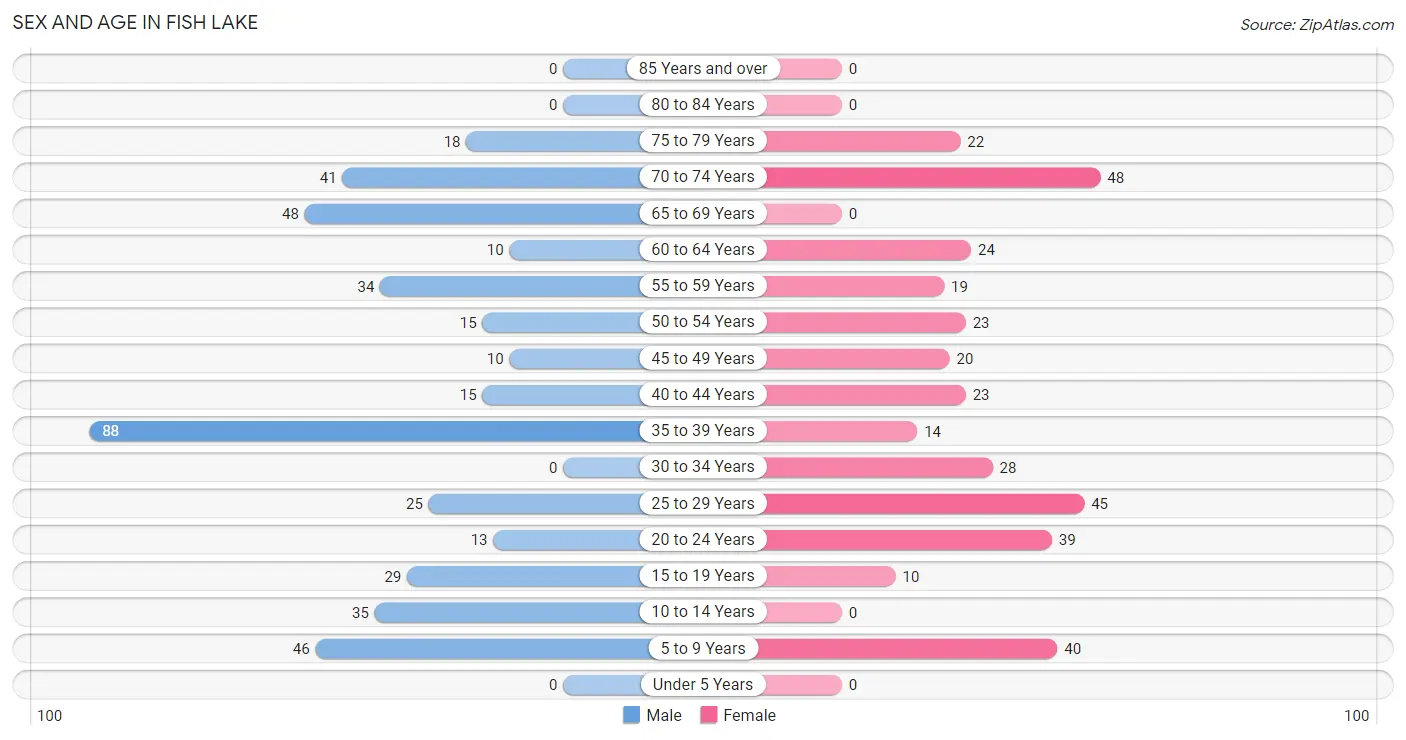
The most populous age groups in Fish Lake are 35 to 39 Years (88 | 20.6%) for men and 70 to 74 Years (48 | 13.5%) for women.
| Age Bracket | Male | Female |
| Under 5 Years | 0 (0.0%) | 0 (0.0%) |
| 5 to 9 Years | 46 (10.8%) | 40 (11.3%) |
| 10 to 14 Years | 35 (8.2%) | 0 (0.0%) |
| 15 to 19 Years | 29 (6.8%) | 10 (2.8%) |
| 20 to 24 Years | 13 (3.0%) | 39 (11.0%) |
| 25 to 29 Years | 25 (5.9%) | 45 (12.7%) |
| 30 to 34 Years | 0 (0.0%) | 28 (7.9%) |
| 35 to 39 Years | 88 (20.6%) | 14 (3.9%) |
| 40 to 44 Years | 15 (3.5%) | 23 (6.5%) |
| 45 to 49 Years | 10 (2.3%) | 20 (5.6%) |
| 50 to 54 Years | 15 (3.5%) | 23 (6.5%) |
| 55 to 59 Years | 34 (8.0%) | 19 (5.3%) |
| 60 to 64 Years | 10 (2.3%) | 24 (6.8%) |
| 65 to 69 Years | 48 (11.2%) | 0 (0.0%) |
| 70 to 74 Years | 41 (9.6%) | 48 (13.5%) |
| 75 to 79 Years | 18 (4.2%) | 22 (6.2%) |
| 80 to 84 Years | 0 (0.0%) | 0 (0.0%) |
| 85 Years and over | 0 (0.0%) | 0 (0.0%) |
| Total | 427 (100.0%) | 355 (100.0%) |
Families and Households in Fish Lake
Median Family Size in Fish Lake
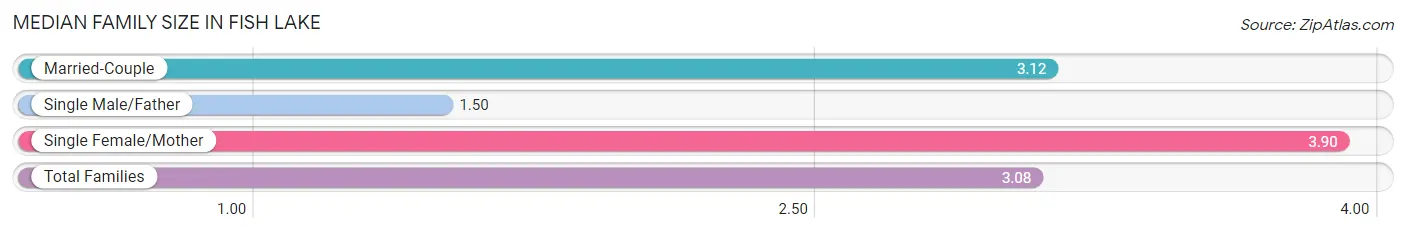
The median family size in Fish Lake is 3.08 persons per family, with single female/mother families (21 | 8.9%) accounting for the largest median family size of 3.9 persons per family. On the other hand, single male/father families (16 | 6.8%) represent the smallest median family size with 1.50 persons per family.
| Family Type | # Families | Family Size |
| Married-Couple | 198 (84.3%) | 3.12 |
| Single Male/Father | 16 (6.8%) | 1.50 |
| Single Female/Mother | 21 (8.9%) | 3.90 |
| Total Families | 235 (100.0%) | 3.08 |
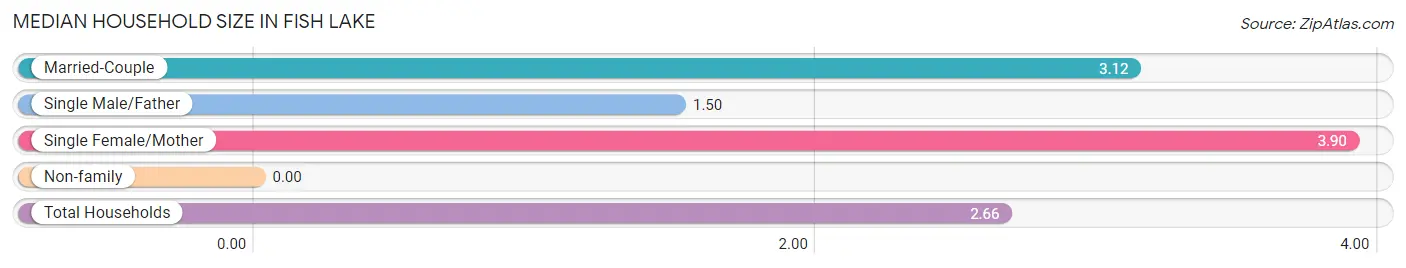
Median Household Size in Fish Lake
| Household Type | # Households | Household Size |
| Married-Couple | 198 (67.3%) | 3.12 |
| Single Male/Father | 16 (5.4%) | 1.50 |
| Single Female/Mother | 21 (7.1%) | 3.90 |
| Non-family | 59 (20.1%) | - |
| Total Households | 294 (100.0%) | 2.66 |
Household Size by Marriage Status in Fish Lake
Out of a total of 294 households in Fish Lake, 235 (79.9%) are family households, while 59 (20.1%) are nonfamily households. The most numerous type of family households are 2-person households, comprising 97, and the most common type of nonfamily households are 1-person households, comprising 59.
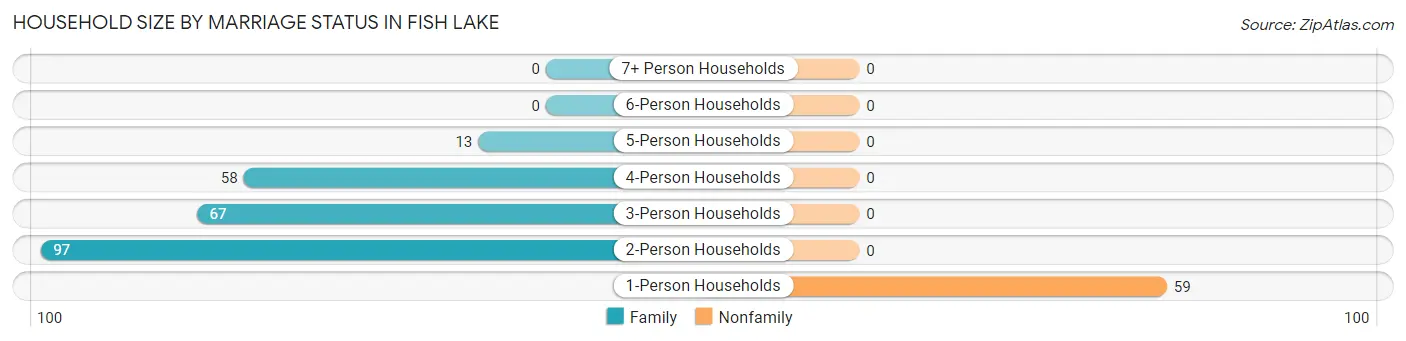
| Household Size | Family Households | Nonfamily Households |
| 1-Person Households | - | 59 (20.1%) |
| 2-Person Households | 97 (33.0%) | 0 (0.0%) |
| 3-Person Households | 67 (22.8%) | 0 (0.0%) |
| 4-Person Households | 58 (19.7%) | 0 (0.0%) |
| 5-Person Households | 13 (4.4%) | 0 (0.0%) |
| 6-Person Households | 0 (0.0%) | 0 (0.0%) |
| 7+ Person Households | 0 (0.0%) | 0 (0.0%) |
| Total | 235 (79.9%) | 59 (20.1%) |
Female Fertility in Fish Lake
Fertility by Age in Fish Lake
| Age Bracket | Women with Births | Births / 1,000 Women |
| 15 to 19 years | 0 (0.0%) | 0.0 |
| 20 to 34 years | 0 (0.0%) | 0.0 |
| 35 to 50 years | 0 (0.0%) | 0.0 |
| Total | 0 (0.0%) | 0.0 |
Fertility by Age by Marriage Status in Fish Lake
| Age Bracket | Married | Unmarried |
| 15 to 19 years | 0 (0.0%) | 0 (0.0%) |
| 20 to 34 years | 0 (0.0%) | 0 (0.0%) |
| 35 to 50 years | 0 (0.0%) | 0 (0.0%) |
| Total | 0 (0.0%) | 0 (0.0%) |
Fertility by Education in Fish Lake
| Educational Attainment | Women with Births | Births / 1,000 Women |
| Less than High School | 0 (0.0%) | 0.0 |
| High School Diploma | 0 (0.0%) | 0.0 |
| College or Associate's Degree | 0 (0.0%) | 0.0 |
| Bachelor's Degree | 0 (0.0%) | 0.0 |
| Graduate Degree | 0 (0.0%) | 0.0 |
| Total | 0 (0.0%) | 0.0 |
Fertility by Education by Marriage Status in Fish Lake
| Educational Attainment | Married | Unmarried |
| Less than High School | 0 (0.0%) | 0 (0.0%) |
| High School Diploma | 0 (0.0%) | 0 (0.0%) |
| College or Associate's Degree | 0 (0.0%) | 0 (0.0%) |
| Bachelor's Degree | 0 (0.0%) | 0 (0.0%) |
| Graduate Degree | 0 (0.0%) | 0 (0.0%) |
| Total | 0 (0.0%) | 0 (0.0%) |
Employment Characteristics in Fish Lake
Employment by Class of Employer in Fish Lake
Among the 466 employed individuals in Fish Lake, private company employees (371 | 79.6%), local government employees (31 | 6.7%), and state government employees (23 | 4.9%) make up the most common classes of employment.
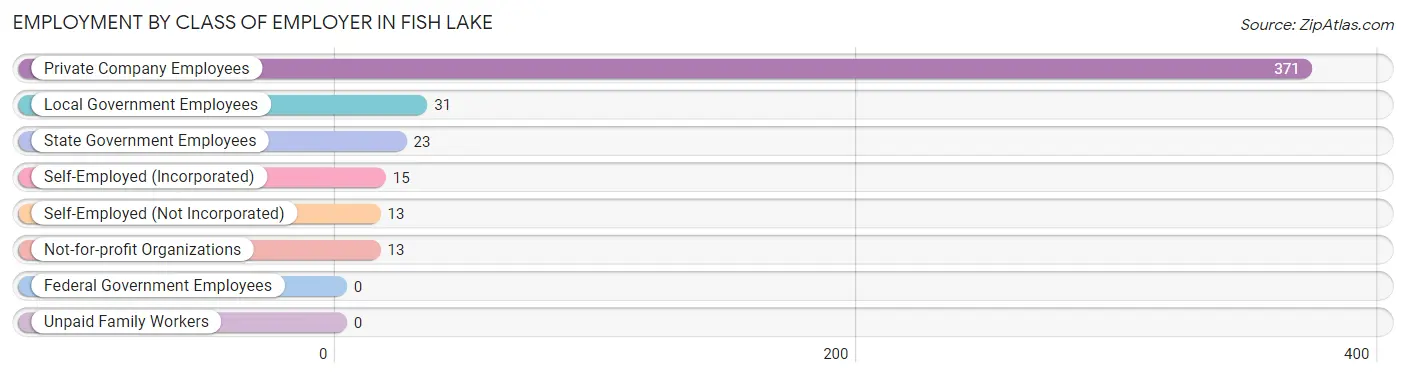
| Employer Class | # Employees | % Employees |
| Private Company Employees | 371 | 79.6% |
| Self-Employed (Incorporated) | 15 | 3.2% |
| Self-Employed (Not Incorporated) | 13 | 2.8% |
| Not-for-profit Organizations | 13 | 2.8% |
| Local Government Employees | 31 | 6.7% |
| State Government Employees | 23 | 4.9% |
| Federal Government Employees | 0 | 0.0% |
| Unpaid Family Workers | 0 | 0.0% |
| Total | 466 | 100.0% |
Employment Status by Age in Fish Lake
According to the labor force statistics for Fish Lake, out of the total population over 16 years of age (661), 74.4% or 492 individuals are in the labor force, with 5.3% or 26 of them unemployed. The age group with the highest labor force participation rate is 16 to 19 years, with 100.0% or 39 individuals in the labor force. Within the labor force, the 16 to 19 years age range has the highest percentage of unemployed individuals, with 33.3% or 13 of them being unemployed.
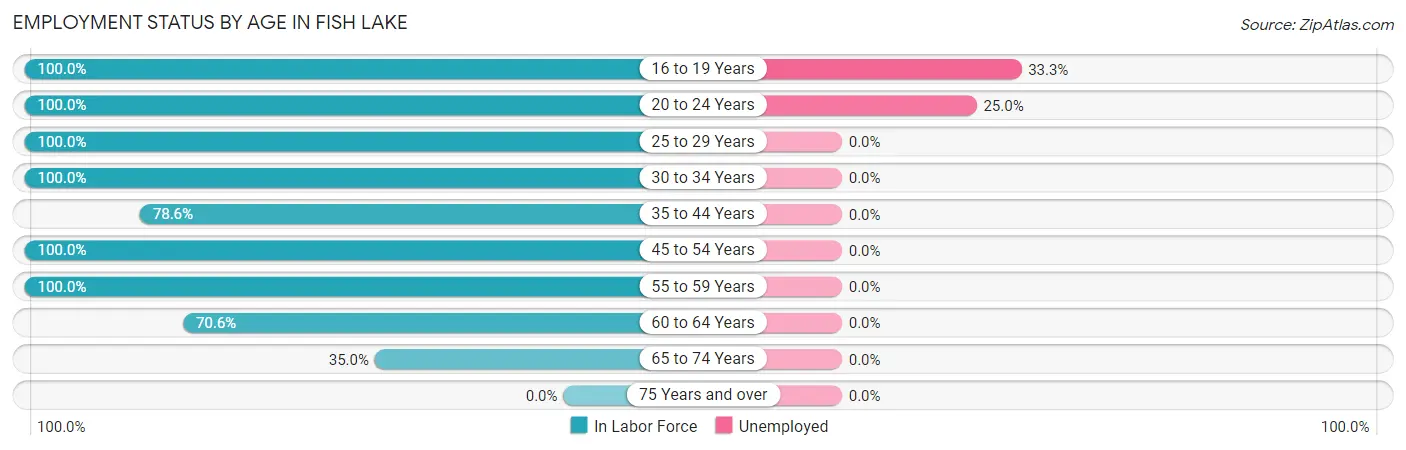
| Age Bracket | In Labor Force | Unemployed |
| 16 to 19 Years | 39 (100.0%) | 13 (33.3%) |
| 20 to 24 Years | 52 (100.0%) | 13 (25.0%) |
| 25 to 29 Years | 70 (100.0%) | 0 (0.0%) |
| 30 to 34 Years | 28 (100.0%) | 0 (0.0%) |
| 35 to 44 Years | 110 (78.6%) | 0 (0.0%) |
| 45 to 54 Years | 68 (100.0%) | 0 (0.0%) |
| 55 to 59 Years | 53 (100.0%) | 0 (0.0%) |
| 60 to 64 Years | 24 (70.6%) | 0 (0.0%) |
| 65 to 74 Years | 48 (35.0%) | 0 (0.0%) |
| 75 Years and over | 0 (0.0%) | 0 (0.0%) |
| Total | 492 (74.4%) | 26 (5.3%) |
Employment Status by Educational Attainment in Fish Lake
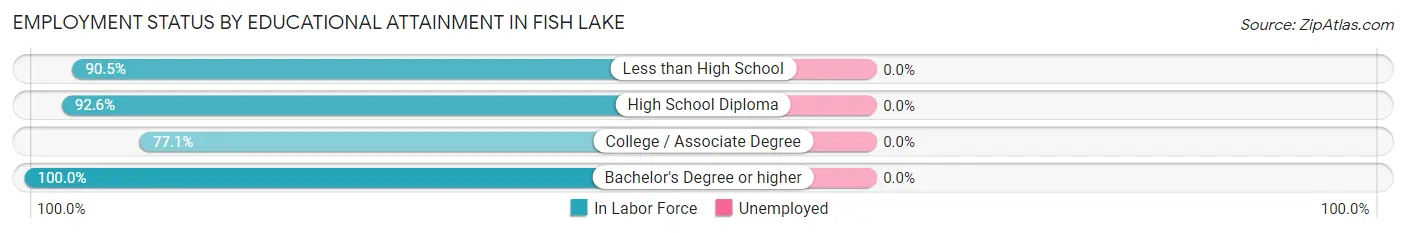
| Educational Attainment | In Labor Force | Unemployed |
| Less than High School | 95 (90.5%) | 0 (0.0%) |
| High School Diploma | 137 (92.6%) | 0 (0.0%) |
| College / Associate Degree | 64 (77.1%) | 0 (0.0%) |
| Bachelor's Degree or higher | 57 (100.0%) | 0 (0.0%) |
| Total | 353 (89.8%) | 0 (0.0%) |
Employment Occupations by Sex in Fish Lake
Management, Business, Science and Arts Occupations
The most common Management, Business, Science and Arts occupations in Fish Lake are Management (27 | 5.8%), Community & Social Service (12 | 2.6%), Education Instruction & Library (12 | 2.6%), Computers, Engineering & Science (7 | 1.5%), and Life, Physical & Social Science (7 | 1.5%).
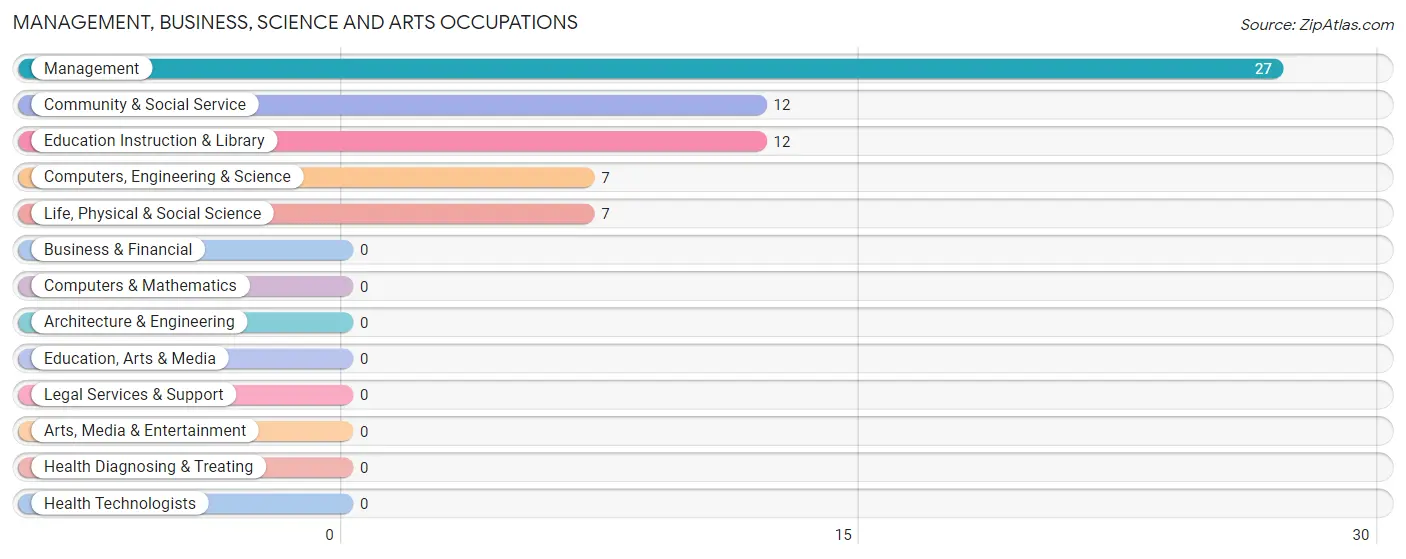
Management, Business, Science and Arts Occupations by Sex
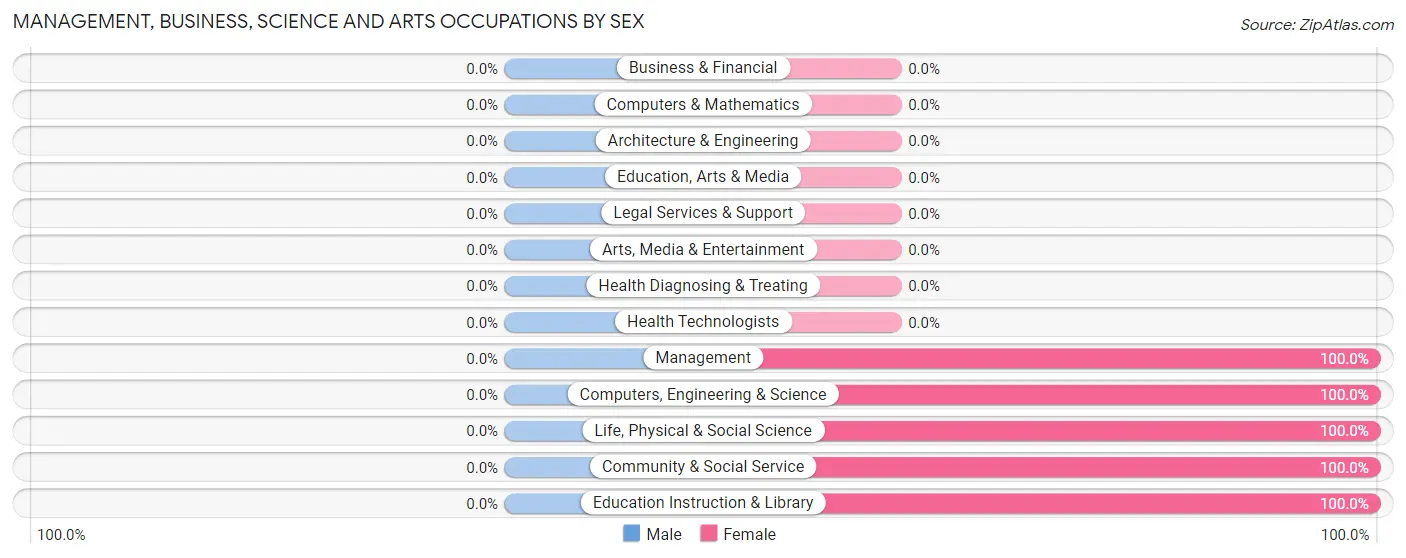
| Occupation | Male | Female |
| Management | 0 (0.0%) | 27 (100.0%) |
| Business & Financial | 0 (0.0%) | 0 (0.0%) |
| Computers, Engineering & Science | 0 (0.0%) | 7 (100.0%) |
| Computers & Mathematics | 0 (0.0%) | 0 (0.0%) |
| Architecture & Engineering | 0 (0.0%) | 0 (0.0%) |
| Life, Physical & Social Science | 0 (0.0%) | 7 (100.0%) |
| Community & Social Service | 0 (0.0%) | 12 (100.0%) |
| Education, Arts & Media | 0 (0.0%) | 0 (0.0%) |
| Legal Services & Support | 0 (0.0%) | 0 (0.0%) |
| Education Instruction & Library | 0 (0.0%) | 12 (100.0%) |
| Arts, Media & Entertainment | 0 (0.0%) | 0 (0.0%) |
| Health Diagnosing & Treating | 0 (0.0%) | 0 (0.0%) |
| Health Technologists | 0 (0.0%) | 0 (0.0%) |
| Total (Category) | 0 (0.0%) | 46 (100.0%) |
| Total (Overall) | 234 (50.2%) | 232 (49.8%) |
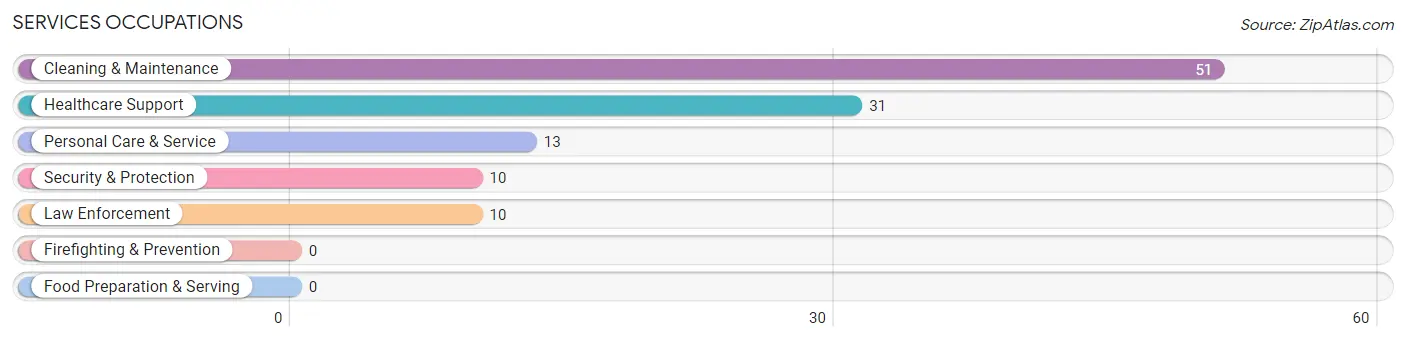
Services Occupations
The most common Services occupations in Fish Lake are Cleaning & Maintenance (51 | 10.9%), Healthcare Support (31 | 6.7%), Personal Care & Service (13 | 2.8%), Security & Protection (10 | 2.1%), and Law Enforcement (10 | 2.1%).
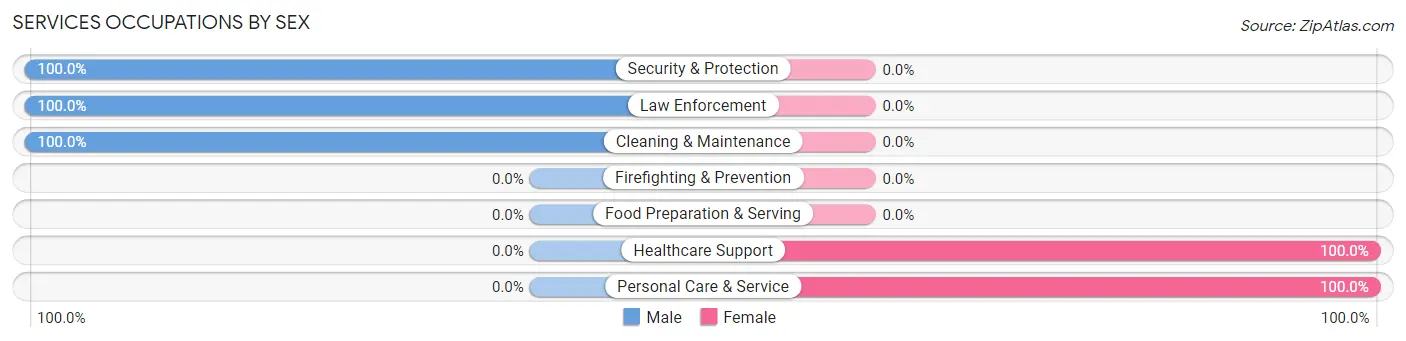
Services Occupations by Sex
Within the Services occupations in Fish Lake, the most male-oriented occupations are Security & Protection (100.0%), Law Enforcement (100.0%), and Cleaning & Maintenance (100.0%), while the most female-oriented occupations are Healthcare Support (100.0%), and Personal Care & Service (100.0%).
| Occupation | Male | Female |
| Healthcare Support | 0 (0.0%) | 31 (100.0%) |
| Security & Protection | 10 (100.0%) | 0 (0.0%) |
| Firefighting & Prevention | 0 (0.0%) | 0 (0.0%) |
| Law Enforcement | 10 (100.0%) | 0 (0.0%) |
| Food Preparation & Serving | 0 (0.0%) | 0 (0.0%) |
| Cleaning & Maintenance | 51 (100.0%) | 0 (0.0%) |
| Personal Care & Service | 0 (0.0%) | 13 (100.0%) |
| Total (Category) | 61 (58.1%) | 44 (41.9%) |
| Total (Overall) | 234 (50.2%) | 232 (49.8%) |
Sales and Office Occupations
The most common Sales and Office occupations in Fish Lake are Sales & Related (51 | 10.9%), and Office & Administration (29 | 6.2%).
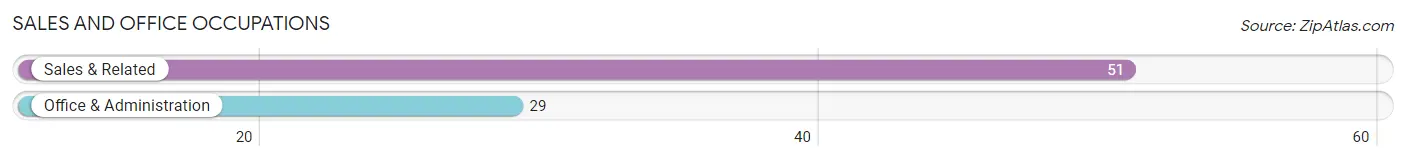
Sales and Office Occupations by Sex
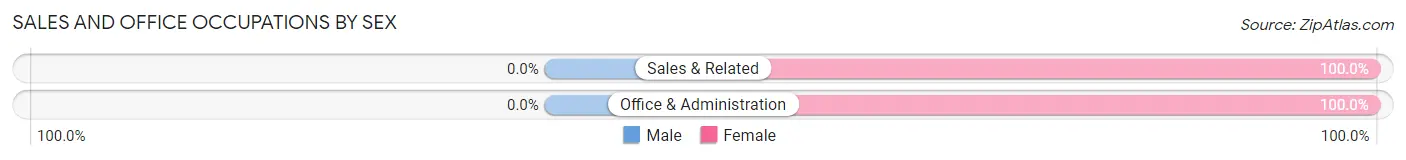
| Occupation | Male | Female |
| Sales & Related | 0 (0.0%) | 51 (100.0%) |
| Office & Administration | 0 (0.0%) | 29 (100.0%) |
| Total (Category) | 0 (0.0%) | 80 (100.0%) |
| Total (Overall) | 234 (50.2%) | 232 (49.8%) |
Natural Resources, Construction and Maintenance Occupations
The most common Natural Resources, Construction and Maintenance occupations in Fish Lake are Construction & Extraction (18 | 3.9%), and Installation, Maintenance & Repair (15 | 3.2%).
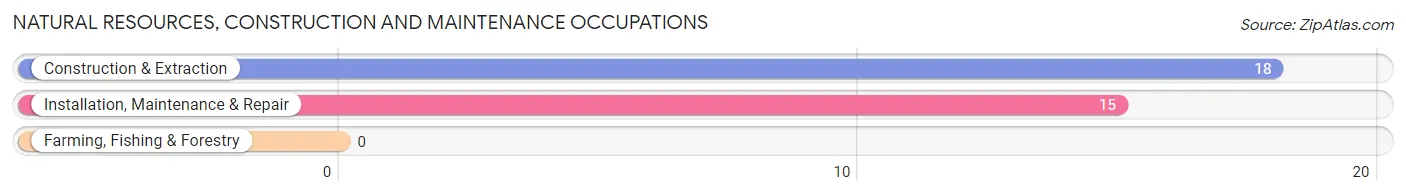
Natural Resources, Construction and Maintenance Occupations by Sex
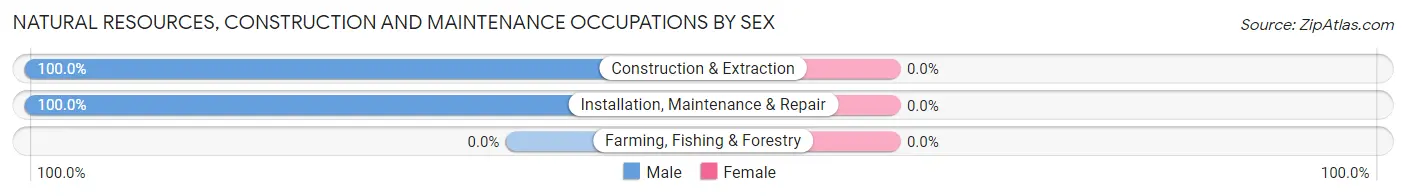
| Occupation | Male | Female |
| Farming, Fishing & Forestry | 0 (0.0%) | 0 (0.0%) |
| Construction & Extraction | 18 (100.0%) | 0 (0.0%) |
| Installation, Maintenance & Repair | 15 (100.0%) | 0 (0.0%) |
| Total (Category) | 33 (100.0%) | 0 (0.0%) |
| Total (Overall) | 234 (50.2%) | 232 (49.8%) |
Production, Transportation and Moving Occupations
The most common Production, Transportation and Moving occupations in Fish Lake are Production (145 | 31.1%), Material Moving (42 | 9.0%), and Transportation (15 | 3.2%).
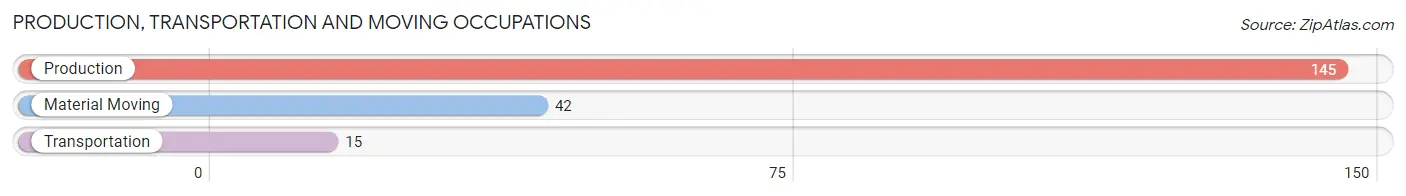
Production, Transportation and Moving Occupations by Sex
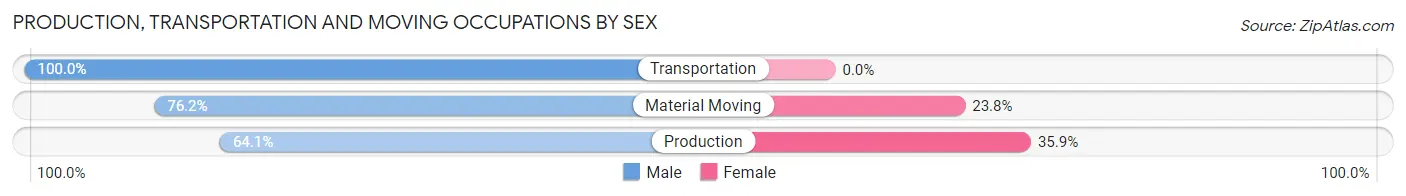
| Occupation | Male | Female |
| Production | 93 (64.1%) | 52 (35.9%) |
| Transportation | 15 (100.0%) | 0 (0.0%) |
| Material Moving | 32 (76.2%) | 10 (23.8%) |
| Total (Category) | 140 (69.3%) | 62 (30.7%) |
| Total (Overall) | 234 (50.2%) | 232 (49.8%) |
Employment Industries by Sex in Fish Lake
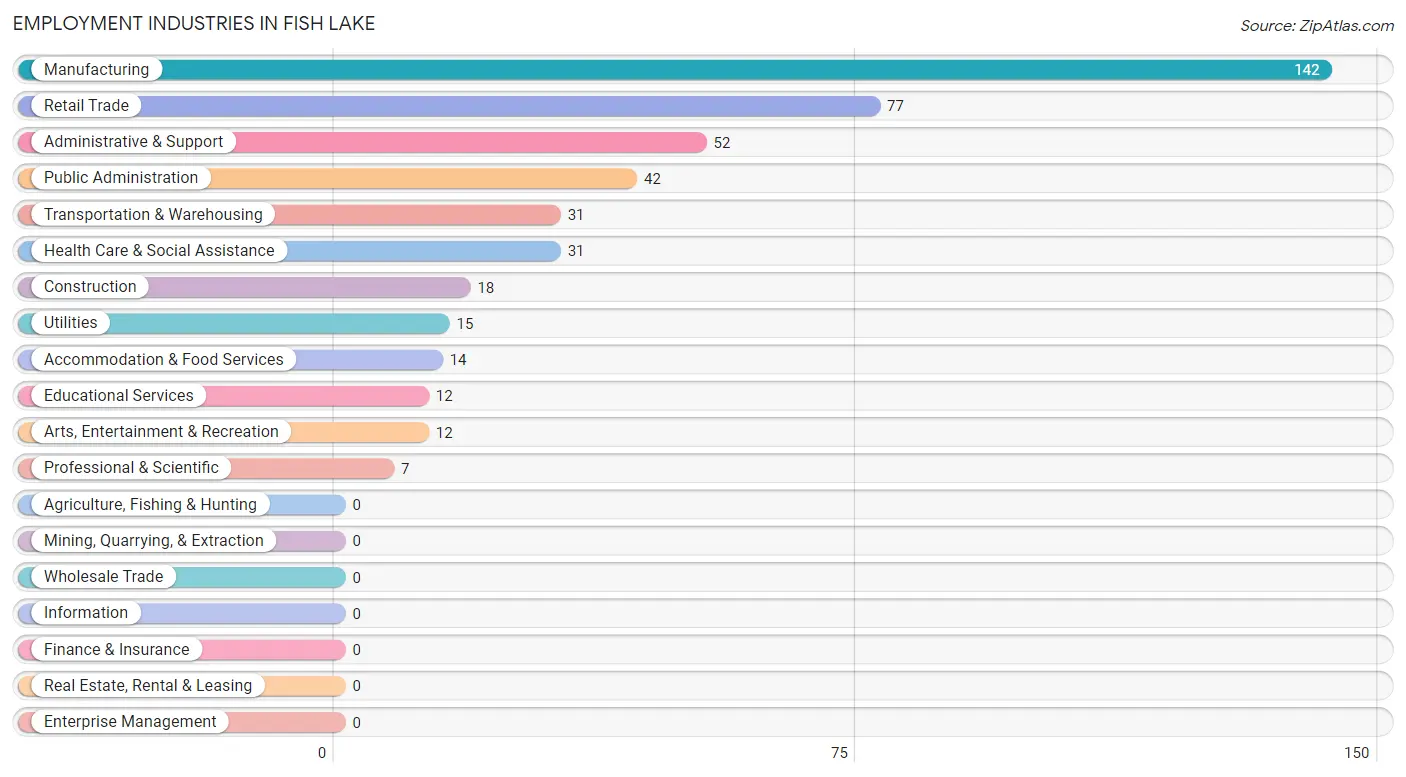
Employment Industries in Fish Lake
The major employment industries in Fish Lake include Manufacturing (142 | 30.5%), Retail Trade (77 | 16.5%), Administrative & Support (52 | 11.2%), Public Administration (42 | 9.0%), and Transportation & Warehousing (31 | 6.7%).
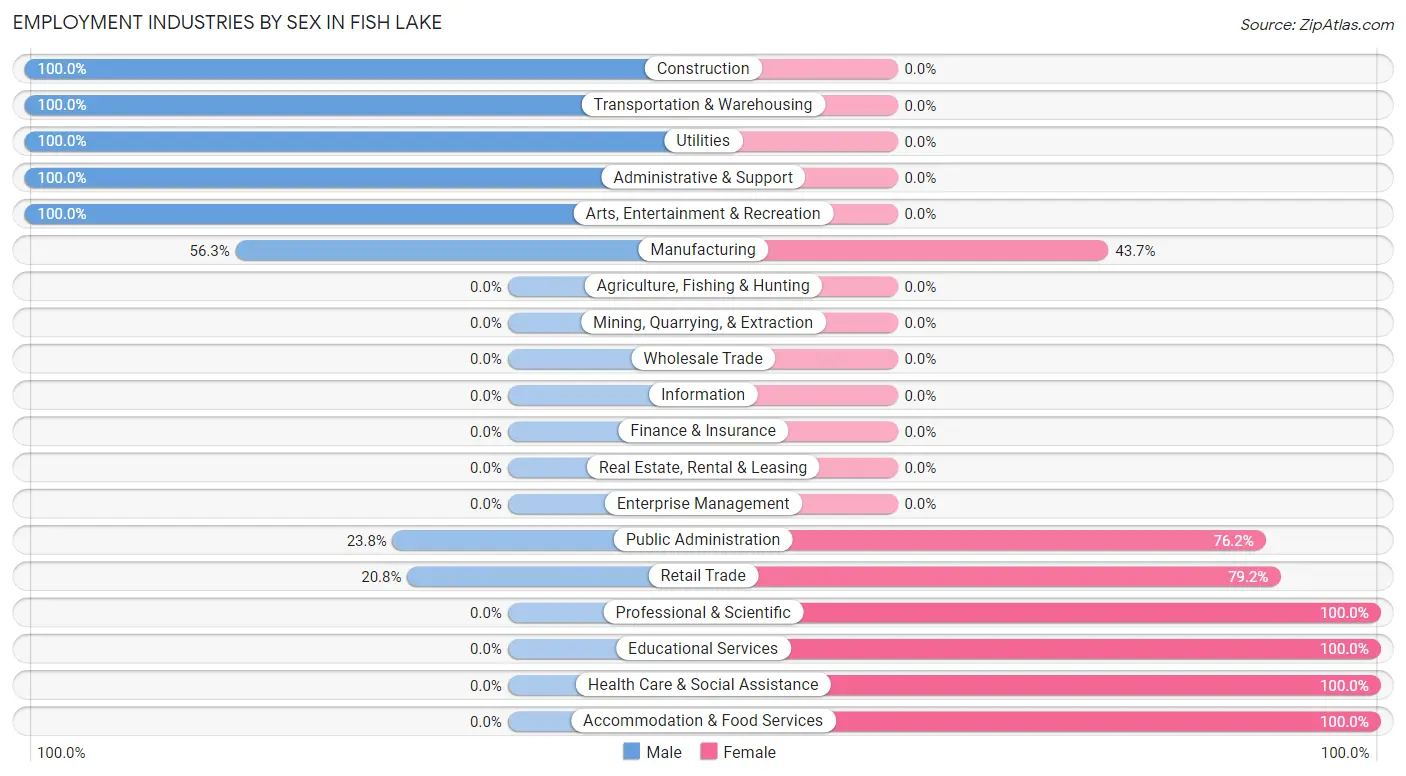
Employment Industries by Sex in Fish Lake
The Fish Lake industries that see more men than women are Construction (100.0%), Transportation & Warehousing (100.0%), and Utilities (100.0%), whereas the industries that tend to have a higher number of women are Professional & Scientific (100.0%), Educational Services (100.0%), and Health Care & Social Assistance (100.0%).
| Industry | Male | Female |
| Agriculture, Fishing & Hunting | 0 (0.0%) | 0 (0.0%) |
| Mining, Quarrying, & Extraction | 0 (0.0%) | 0 (0.0%) |
| Construction | 18 (100.0%) | 0 (0.0%) |
| Manufacturing | 80 (56.3%) | 62 (43.7%) |
| Wholesale Trade | 0 (0.0%) | 0 (0.0%) |
| Retail Trade | 16 (20.8%) | 61 (79.2%) |
| Transportation & Warehousing | 31 (100.0%) | 0 (0.0%) |
| Utilities | 15 (100.0%) | 0 (0.0%) |
| Information | 0 (0.0%) | 0 (0.0%) |
| Finance & Insurance | 0 (0.0%) | 0 (0.0%) |
| Real Estate, Rental & Leasing | 0 (0.0%) | 0 (0.0%) |
| Professional & Scientific | 0 (0.0%) | 7 (100.0%) |
| Enterprise Management | 0 (0.0%) | 0 (0.0%) |
| Administrative & Support | 52 (100.0%) | 0 (0.0%) |
| Educational Services | 0 (0.0%) | 12 (100.0%) |
| Health Care & Social Assistance | 0 (0.0%) | 31 (100.0%) |
| Arts, Entertainment & Recreation | 12 (100.0%) | 0 (0.0%) |
| Accommodation & Food Services | 0 (0.0%) | 14 (100.0%) |
| Public Administration | 10 (23.8%) | 32 (76.2%) |
| Total | 234 (50.2%) | 232 (49.8%) |
Education in Fish Lake
School Enrollment in Fish Lake
The most common levels of schooling among the 196 students in Fish Lake are elementary school (86 | 43.9%), high school (62 | 31.6%), and middle school (35 | 17.9%).
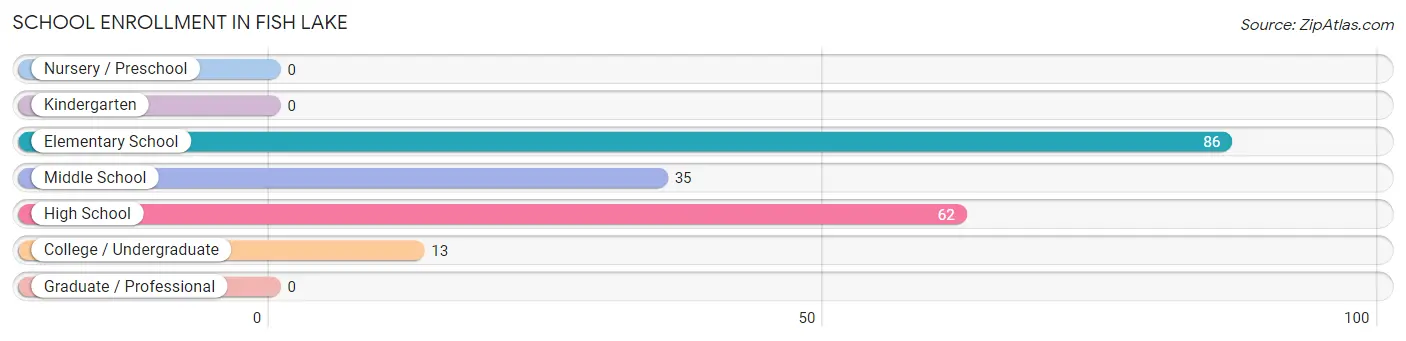
| School Level | # Students | % Students |
| Nursery / Preschool | 0 | 0.0% |
| Kindergarten | 0 | 0.0% |
| Elementary School | 86 | 43.9% |
| Middle School | 35 | 17.9% |
| High School | 62 | 31.6% |
| College / Undergraduate | 13 | 6.6% |
| Graduate / Professional | 0 | 0.0% |
| Total | 196 | 100.0% |
School Enrollment by Age by Funding Source in Fish Lake
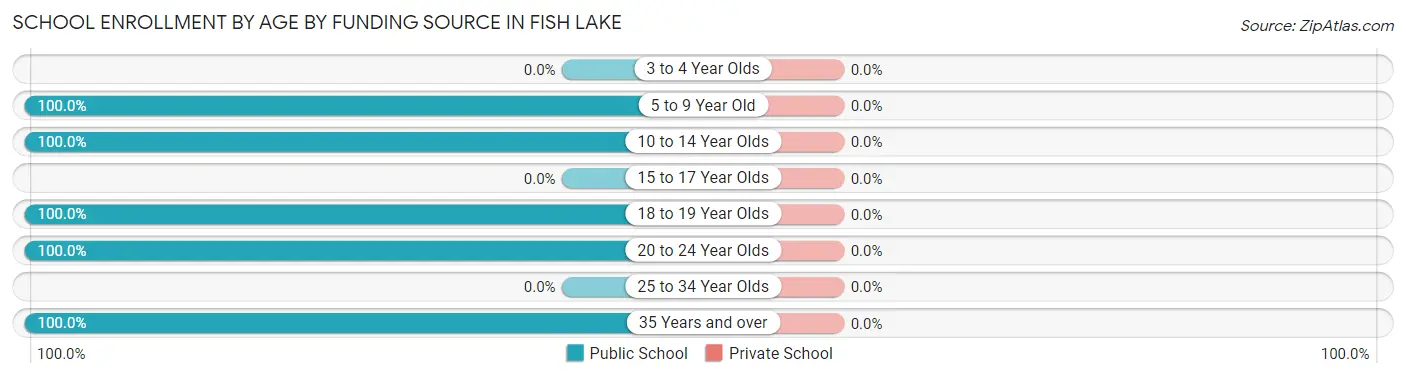
| Age Bracket | Public School | Private School |
| 3 to 4 Year Olds | 0 (0.0%) | 0 (0.0%) |
| 5 to 9 Year Old | 86 (100.0%) | 0 (0.0%) |
| 10 to 14 Year Olds | 35 (100.0%) | 0 (0.0%) |
| 15 to 17 Year Olds | 0 (0.0%) | 0 (0.0%) |
| 18 to 19 Year Olds | 29 (100.0%) | 0 (0.0%) |
| 20 to 24 Year Olds | 13 (100.0%) | 0 (0.0%) |
| 25 to 34 Year Olds | 0 (0.0%) | 0 (0.0%) |
| 35 Years and over | 33 (100.0%) | 0 (0.0%) |
| Total | 196 (100.0%) | 0 (0.0%) |
Educational Attainment by Field of Study in Fish Lake
Business (27 | 27.3%), arts & humanities (23 | 23.2%), physical & health sciences (22 | 22.2%), bio, nature & agricultural (15 | 15.1%), and education (12 | 12.1%) are the most common fields of study among 99 individuals in Fish Lake who have obtained a bachelor's degree or higher.
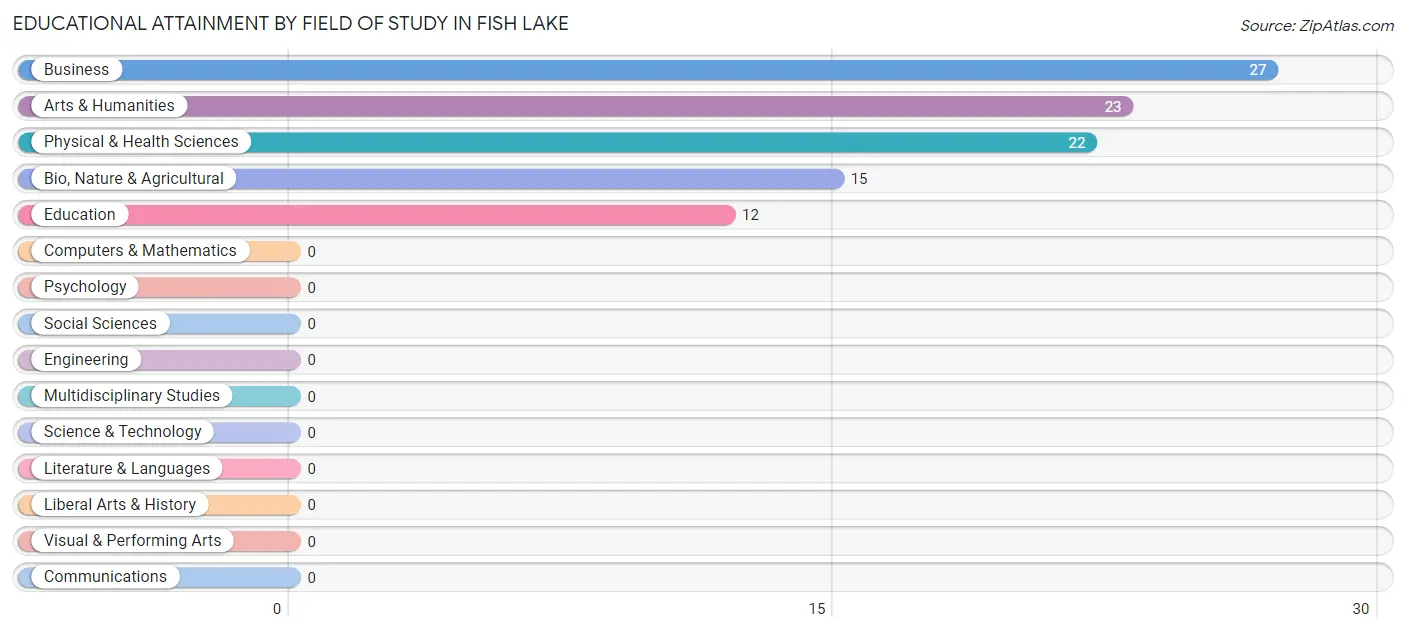
| Field of Study | # Graduates | % Graduates |
| Computers & Mathematics | 0 | 0.0% |
| Bio, Nature & Agricultural | 15 | 15.1% |
| Physical & Health Sciences | 22 | 22.2% |
| Psychology | 0 | 0.0% |
| Social Sciences | 0 | 0.0% |
| Engineering | 0 | 0.0% |
| Multidisciplinary Studies | 0 | 0.0% |
| Science & Technology | 0 | 0.0% |
| Business | 27 | 27.3% |
| Education | 12 | 12.1% |
| Literature & Languages | 0 | 0.0% |
| Liberal Arts & History | 0 | 0.0% |
| Visual & Performing Arts | 0 | 0.0% |
| Communications | 0 | 0.0% |
| Arts & Humanities | 23 | 23.2% |
| Total | 99 | 100.0% |
Transportation & Commute in Fish Lake
Vehicle Availability by Sex in Fish Lake
The most prevalent vehicle ownership categories in Fish Lake are males with 2 vehicles (92, accounting for 39.3%) and females with 2 vehicles (90, making up 39.7%).
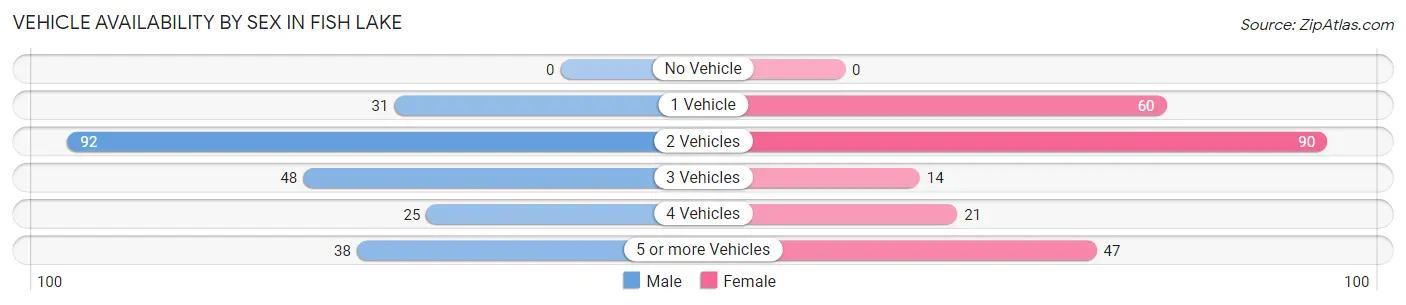
| Vehicles Available | Male | Female |
| No Vehicle | 0 (0.0%) | 0 (0.0%) |
| 1 Vehicle | 31 (13.3%) | 60 (25.9%) |
| 2 Vehicles | 92 (39.3%) | 90 (38.8%) |
| 3 Vehicles | 48 (20.5%) | 14 (6.0%) |
| 4 Vehicles | 25 (10.7%) | 21 (9.0%) |
| 5 or more Vehicles | 38 (16.2%) | 47 (20.3%) |
| Total | 234 (100.0%) | 232 (100.0%) |
Commute Time in Fish Lake
The most frequently occuring commute durations in Fish Lake are 20 to 24 minutes (88 commuters, 20.7%), 30 to 34 minutes (78 commuters, 18.3%), and 15 to 19 minutes (47 commuters, 11.1%).
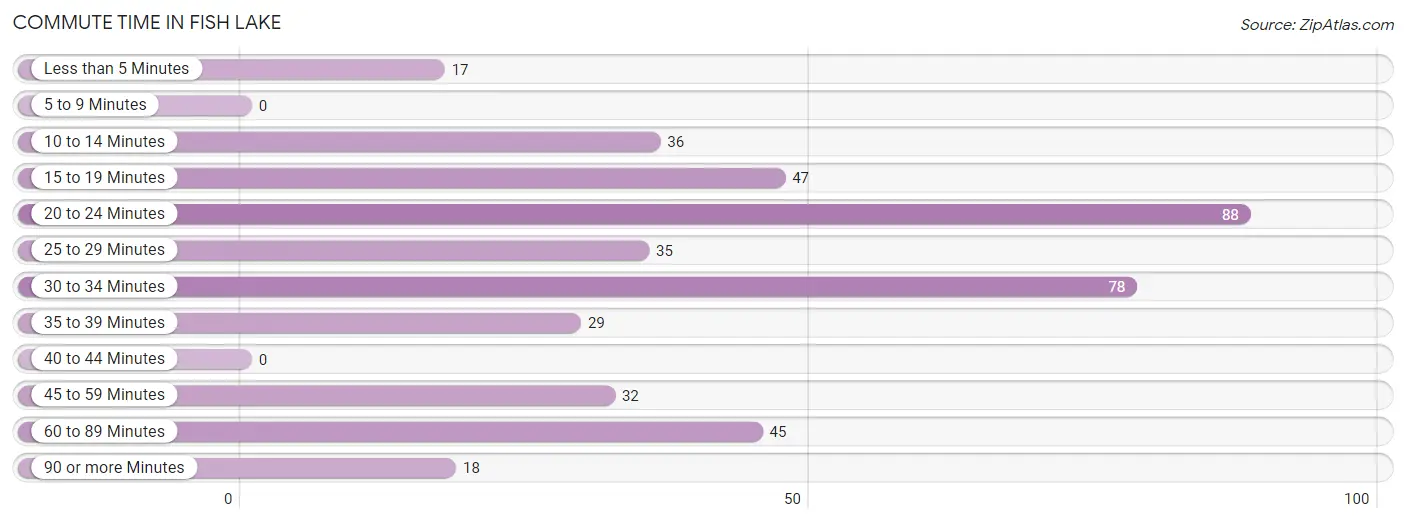
| Commute Time | # Commuters | % Commuters |
| Less than 5 Minutes | 17 | 4.0% |
| 5 to 9 Minutes | 0 | 0.0% |
| 10 to 14 Minutes | 36 | 8.5% |
| 15 to 19 Minutes | 47 | 11.1% |
| 20 to 24 Minutes | 88 | 20.7% |
| 25 to 29 Minutes | 35 | 8.2% |
| 30 to 34 Minutes | 78 | 18.3% |
| 35 to 39 Minutes | 29 | 6.8% |
| 40 to 44 Minutes | 0 | 0.0% |
| 45 to 59 Minutes | 32 | 7.5% |
| 60 to 89 Minutes | 45 | 10.6% |
| 90 or more Minutes | 18 | 4.2% |
Commute Time by Sex in Fish Lake
The most common commute times in Fish Lake are 20 to 24 minutes (60 commuters, 29.1%) for males and 15 to 19 minutes (47 commuters, 21.5%) for females.
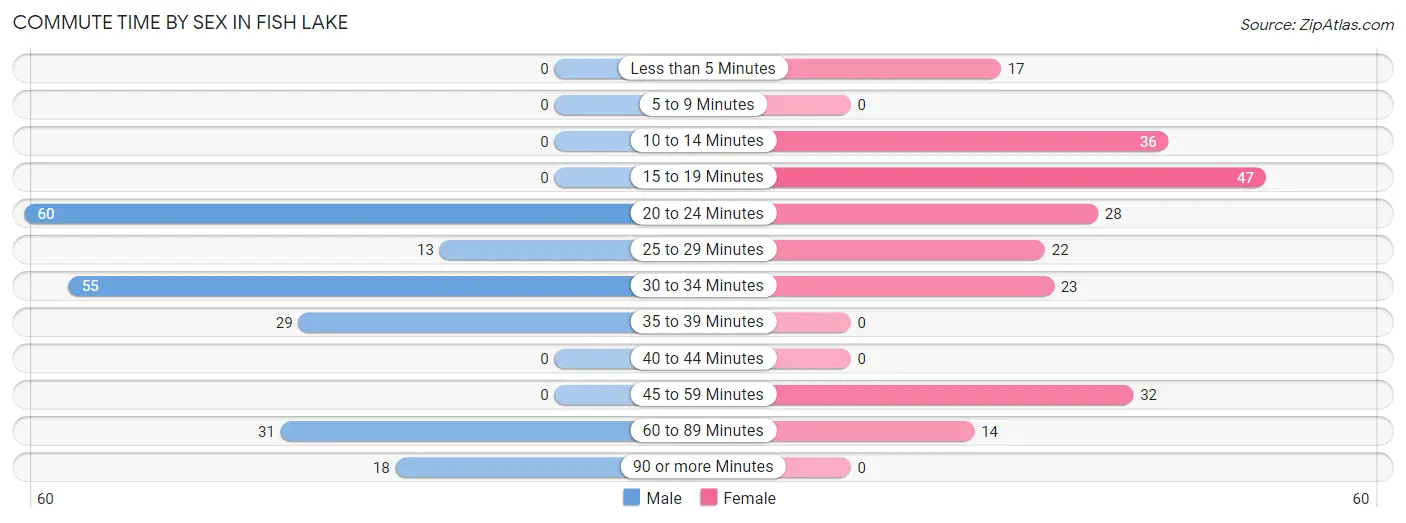
| Commute Time | Male | Female |
| Less than 5 Minutes | 0 (0.0%) | 17 (7.8%) |
| 5 to 9 Minutes | 0 (0.0%) | 0 (0.0%) |
| 10 to 14 Minutes | 0 (0.0%) | 36 (16.4%) |
| 15 to 19 Minutes | 0 (0.0%) | 47 (21.5%) |
| 20 to 24 Minutes | 60 (29.1%) | 28 (12.8%) |
| 25 to 29 Minutes | 13 (6.3%) | 22 (10.1%) |
| 30 to 34 Minutes | 55 (26.7%) | 23 (10.5%) |
| 35 to 39 Minutes | 29 (14.1%) | 0 (0.0%) |
| 40 to 44 Minutes | 0 (0.0%) | 0 (0.0%) |
| 45 to 59 Minutes | 0 (0.0%) | 32 (14.6%) |
| 60 to 89 Minutes | 31 (15.0%) | 14 (6.4%) |
| 90 or more Minutes | 18 (8.7%) | 0 (0.0%) |
Time of Departure to Work by Sex in Fish Lake
The most frequent times of departure to work in Fish Lake are 12:00 AM to 4:59 AM (94, 45.6%) for males and 6:30 AM to 6:59 AM (59, 26.9%) for females.
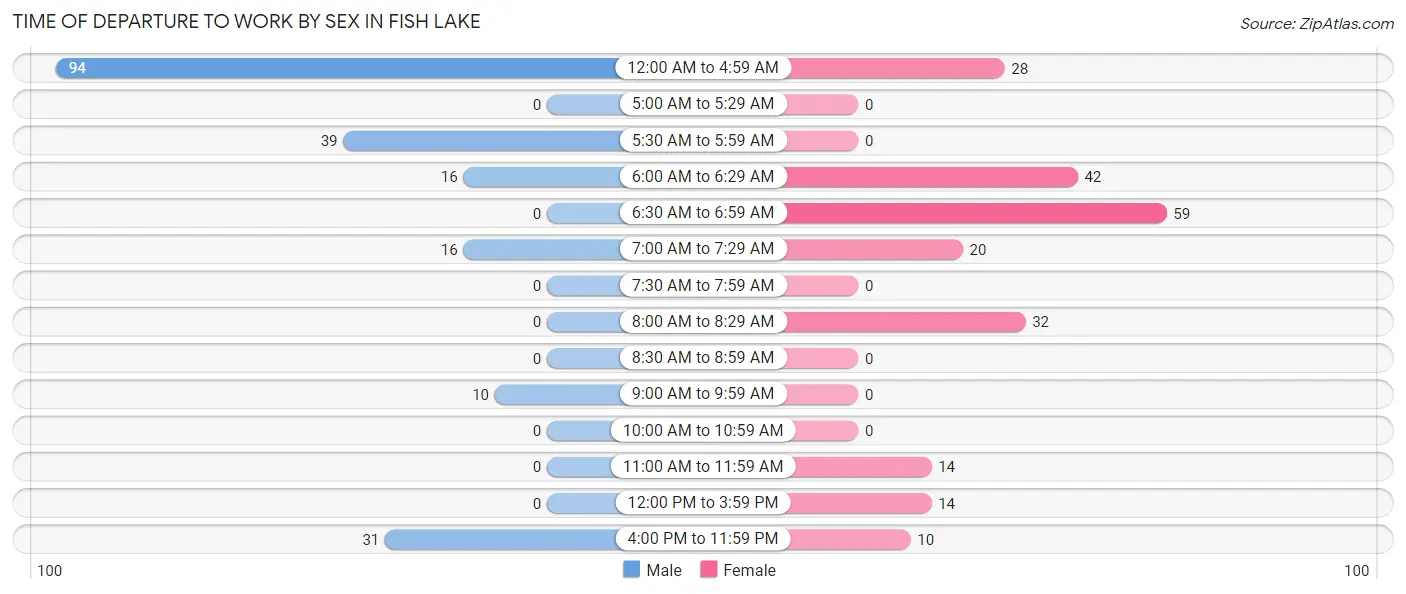
| Time of Departure | Male | Female |
| 12:00 AM to 4:59 AM | 94 (45.6%) | 28 (12.8%) |
| 5:00 AM to 5:29 AM | 0 (0.0%) | 0 (0.0%) |
| 5:30 AM to 5:59 AM | 39 (18.9%) | 0 (0.0%) |
| 6:00 AM to 6:29 AM | 16 (7.8%) | 42 (19.2%) |
| 6:30 AM to 6:59 AM | 0 (0.0%) | 59 (26.9%) |
| 7:00 AM to 7:29 AM | 16 (7.8%) | 20 (9.1%) |
| 7:30 AM to 7:59 AM | 0 (0.0%) | 0 (0.0%) |
| 8:00 AM to 8:29 AM | 0 (0.0%) | 32 (14.6%) |
| 8:30 AM to 8:59 AM | 0 (0.0%) | 0 (0.0%) |
| 9:00 AM to 9:59 AM | 10 (4.9%) | 0 (0.0%) |
| 10:00 AM to 10:59 AM | 0 (0.0%) | 0 (0.0%) |
| 11:00 AM to 11:59 AM | 0 (0.0%) | 14 (6.4%) |
| 12:00 PM to 3:59 PM | 0 (0.0%) | 14 (6.4%) |
| 4:00 PM to 11:59 PM | 31 (15.0%) | 10 (4.6%) |
| Total | 206 (100.0%) | 219 (100.0%) |
Housing Occupancy in Fish Lake
Occupancy by Ownership in Fish Lake
Of the total 294 dwellings in Fish Lake, owner-occupied units account for 204 (69.4%), while renter-occupied units make up 90 (30.6%).
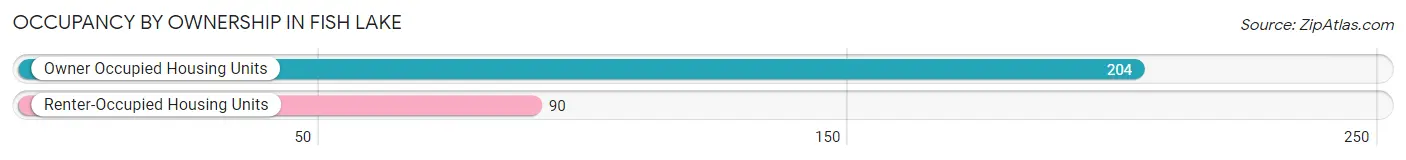
| Occupancy | # Housing Units | % Housing Units |
| Owner Occupied Housing Units | 204 | 69.4% |
| Renter-Occupied Housing Units | 90 | 30.6% |
| Total Occupied Housing Units | 294 | 100.0% |
Occupancy by Household Size in Fish Lake
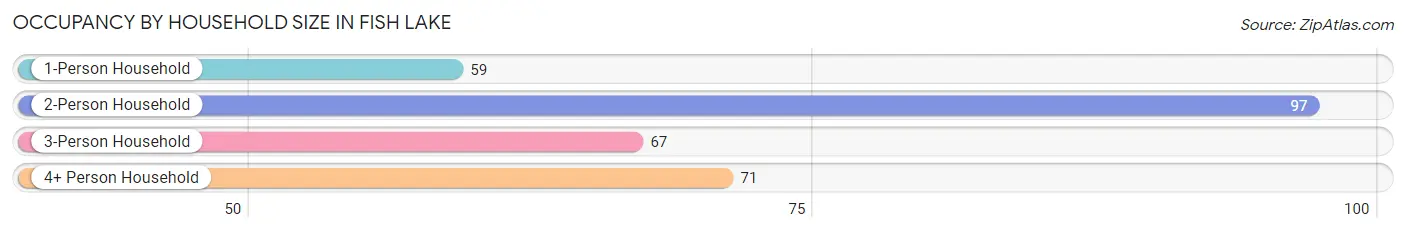
| Household Size | # Housing Units | % Housing Units |
| 1-Person Household | 59 | 20.1% |
| 2-Person Household | 97 | 33.0% |
| 3-Person Household | 67 | 22.8% |
| 4+ Person Household | 71 | 24.1% |
| Total Housing Units | 294 | 100.0% |
Occupancy by Ownership by Household Size in Fish Lake
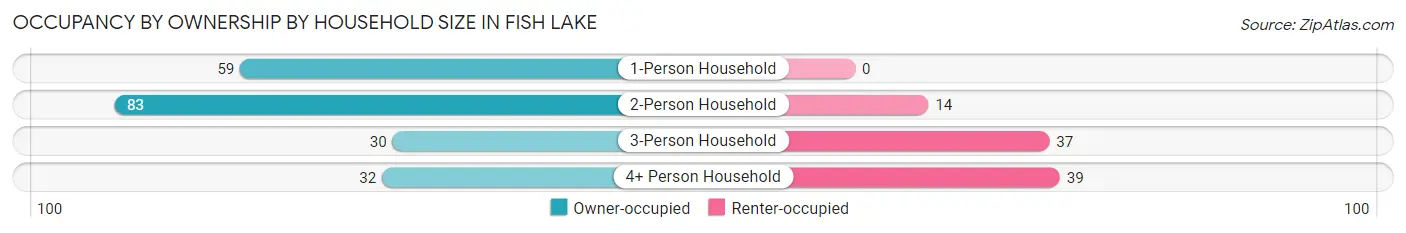
| Household Size | Owner-occupied | Renter-occupied |
| 1-Person Household | 59 (100.0%) | 0 (0.0%) |
| 2-Person Household | 83 (85.6%) | 14 (14.4%) |
| 3-Person Household | 30 (44.8%) | 37 (55.2%) |
| 4+ Person Household | 32 (45.1%) | 39 (54.9%) |
| Total Housing Units | 204 (69.4%) | 90 (30.6%) |
Occupancy by Educational Attainment in Fish Lake
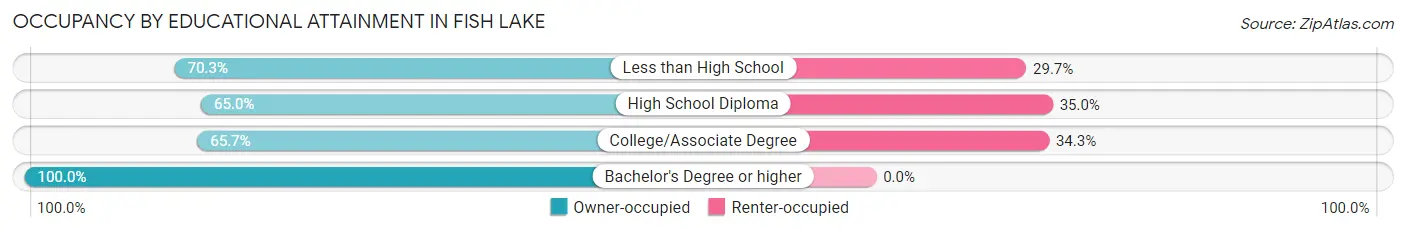
| Household Size | Owner-occupied | Renter-occupied |
| Less than High School | 26 (70.3%) | 11 (29.7%) |
| High School Diploma | 78 (65.0%) | 42 (35.0%) |
| College/Associate Degree | 71 (65.7%) | 37 (34.3%) |
| Bachelor's Degree or higher | 29 (100.0%) | 0 (0.0%) |
Occupancy by Age of Householder in Fish Lake
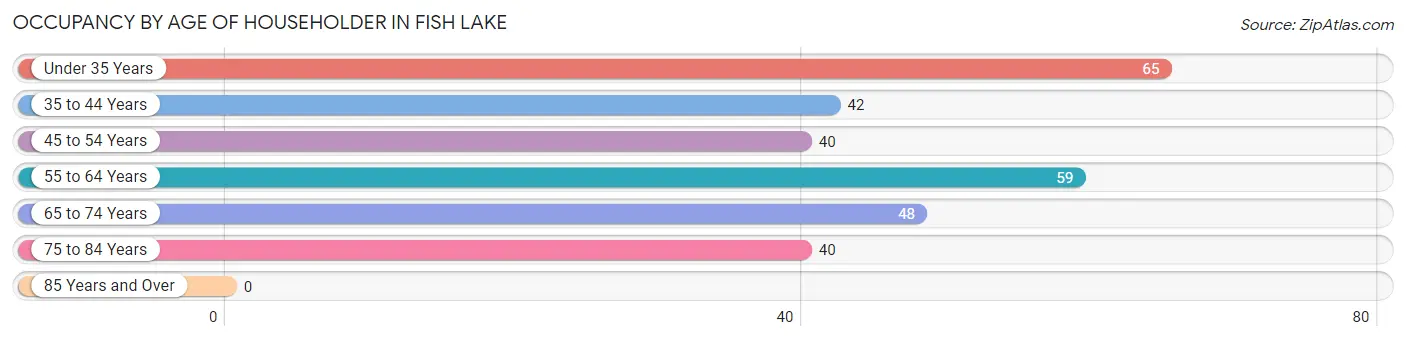
| Age Bracket | # Households | % Households |
| Under 35 Years | 65 | 22.1% |
| 35 to 44 Years | 42 | 14.3% |
| 45 to 54 Years | 40 | 13.6% |
| 55 to 64 Years | 59 | 20.1% |
| 65 to 74 Years | 48 | 16.3% |
| 75 to 84 Years | 40 | 13.6% |
| 85 Years and Over | 0 | 0.0% |
| Total | 294 | 100.0% |
Housing Finances in Fish Lake
Median Income by Occupancy in Fish Lake
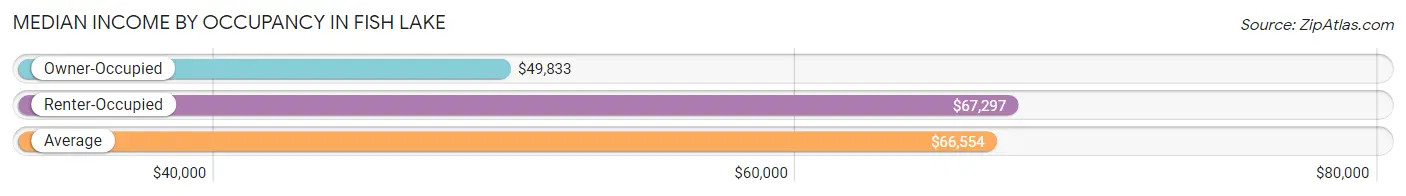
| Occupancy Type | # Households | Median Income |
| Owner-Occupied | 204 (69.4%) | $49,833 |
| Renter-Occupied | 90 (30.6%) | $67,297 |
| Average | 294 (100.0%) | $66,554 |
Occupancy by Householder Income Bracket in Fish Lake
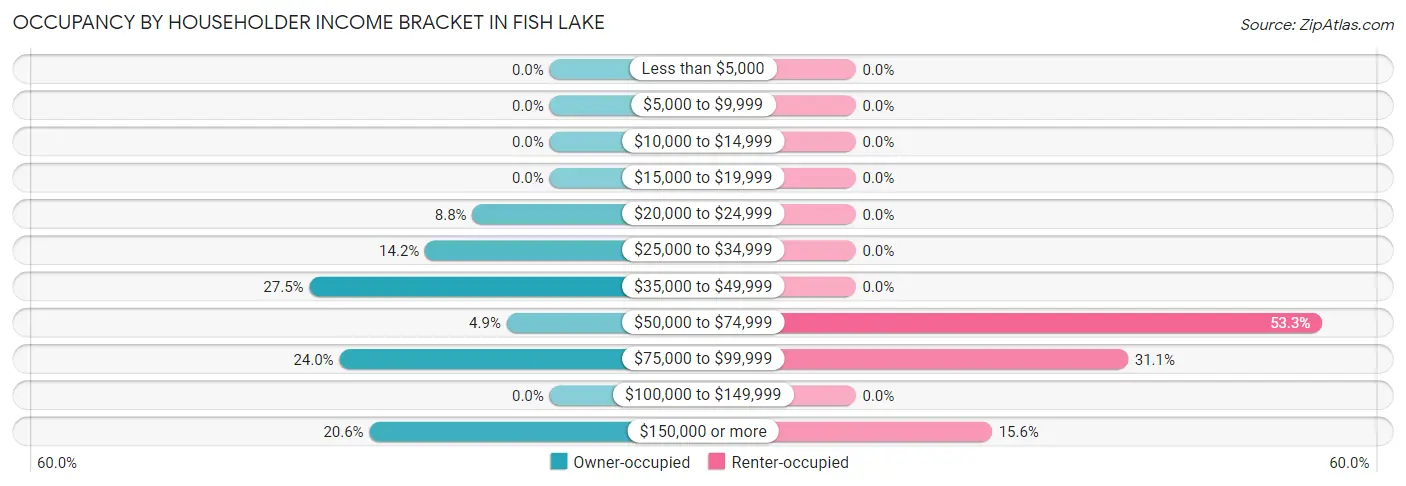
| Income Bracket | Owner-occupied | Renter-occupied |
| Less than $5,000 | 0 (0.0%) | 0 (0.0%) |
| $5,000 to $9,999 | 0 (0.0%) | 0 (0.0%) |
| $10,000 to $14,999 | 0 (0.0%) | 0 (0.0%) |
| $15,000 to $19,999 | 0 (0.0%) | 0 (0.0%) |
| $20,000 to $24,999 | 18 (8.8%) | 0 (0.0%) |
| $25,000 to $34,999 | 29 (14.2%) | 0 (0.0%) |
| $35,000 to $49,999 | 56 (27.5%) | 0 (0.0%) |
| $50,000 to $74,999 | 10 (4.9%) | 48 (53.3%) |
| $75,000 to $99,999 | 49 (24.0%) | 28 (31.1%) |
| $100,000 to $149,999 | 0 (0.0%) | 0 (0.0%) |
| $150,000 or more | 42 (20.6%) | 14 (15.6%) |
| Total | 204 (100.0%) | 90 (100.0%) |
Monthly Housing Cost Tiers in Fish Lake
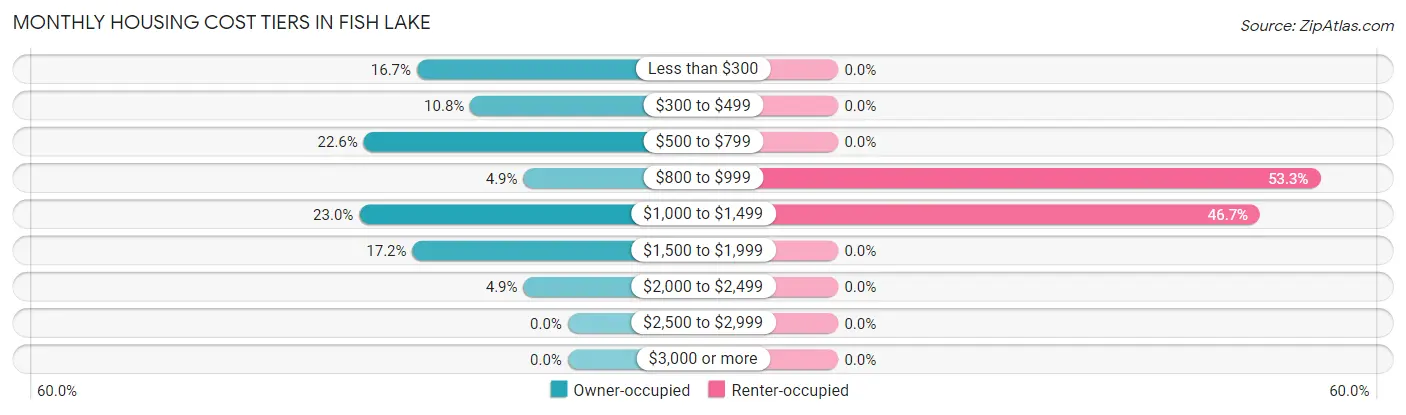
| Monthly Cost | Owner-occupied | Renter-occupied |
| Less than $300 | 34 (16.7%) | 0 (0.0%) |
| $300 to $499 | 22 (10.8%) | 0 (0.0%) |
| $500 to $799 | 46 (22.6%) | 0 (0.0%) |
| $800 to $999 | 10 (4.9%) | 48 (53.3%) |
| $1,000 to $1,499 | 47 (23.0%) | 42 (46.7%) |
| $1,500 to $1,999 | 35 (17.2%) | 0 (0.0%) |
| $2,000 to $2,499 | 10 (4.9%) | 0 (0.0%) |
| $2,500 to $2,999 | 0 (0.0%) | 0 (0.0%) |
| $3,000 or more | 0 (0.0%) | 0 (0.0%) |
| Total | 204 (100.0%) | 90 (100.0%) |
Physical Housing Characteristics in Fish Lake
Housing Structures in Fish Lake
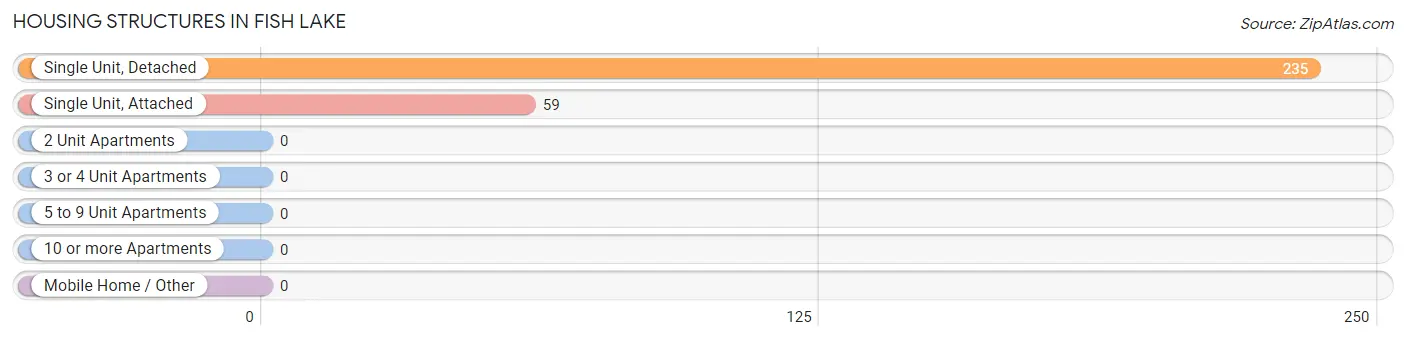
| Structure Type | # Housing Units | % Housing Units |
| Single Unit, Detached | 235 | 79.9% |
| Single Unit, Attached | 59 | 20.1% |
| 2 Unit Apartments | 0 | 0.0% |
| 3 or 4 Unit Apartments | 0 | 0.0% |
| 5 to 9 Unit Apartments | 0 | 0.0% |
| 10 or more Apartments | 0 | 0.0% |
| Mobile Home / Other | 0 | 0.0% |
| Total | 294 | 100.0% |
Housing Structures by Occupancy in Fish Lake
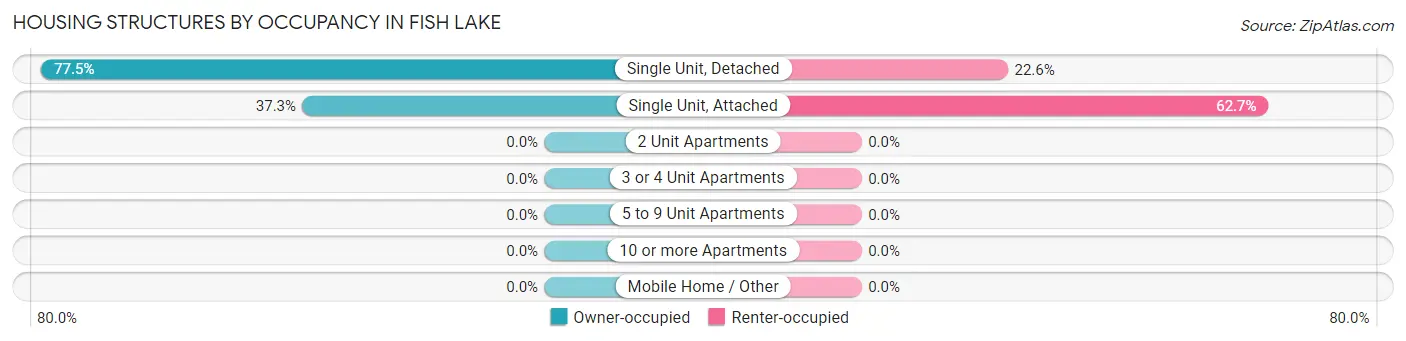
| Structure Type | Owner-occupied | Renter-occupied |
| Single Unit, Detached | 182 (77.4%) | 53 (22.6%) |
| Single Unit, Attached | 22 (37.3%) | 37 (62.7%) |
| 2 Unit Apartments | 0 (0.0%) | 0 (0.0%) |
| 3 or 4 Unit Apartments | 0 (0.0%) | 0 (0.0%) |
| 5 to 9 Unit Apartments | 0 (0.0%) | 0 (0.0%) |
| 10 or more Apartments | 0 (0.0%) | 0 (0.0%) |
| Mobile Home / Other | 0 (0.0%) | 0 (0.0%) |
| Total | 204 (69.4%) | 90 (30.6%) |
Housing Structures by Number of Rooms in Fish Lake
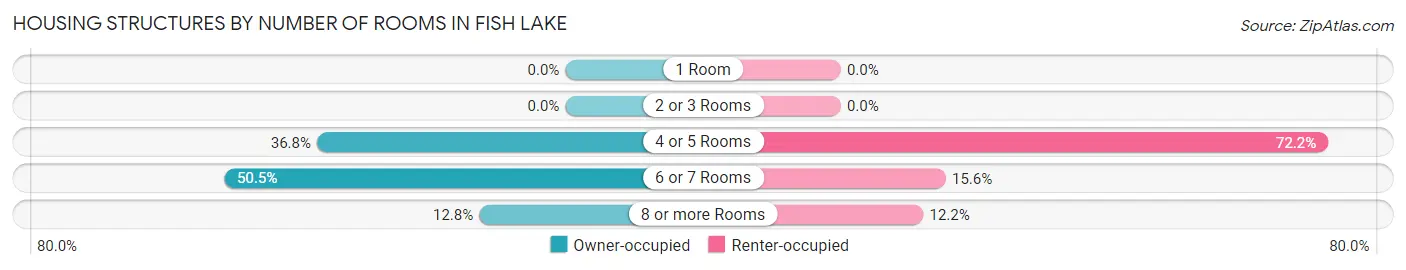
| Number of Rooms | Owner-occupied | Renter-occupied |
| 1 Room | 0 (0.0%) | 0 (0.0%) |
| 2 or 3 Rooms | 0 (0.0%) | 0 (0.0%) |
| 4 or 5 Rooms | 75 (36.8%) | 65 (72.2%) |
| 6 or 7 Rooms | 103 (50.5%) | 14 (15.6%) |
| 8 or more Rooms | 26 (12.8%) | 11 (12.2%) |
| Total | 204 (100.0%) | 90 (100.0%) |
Housing Structure by Heating Type in Fish Lake
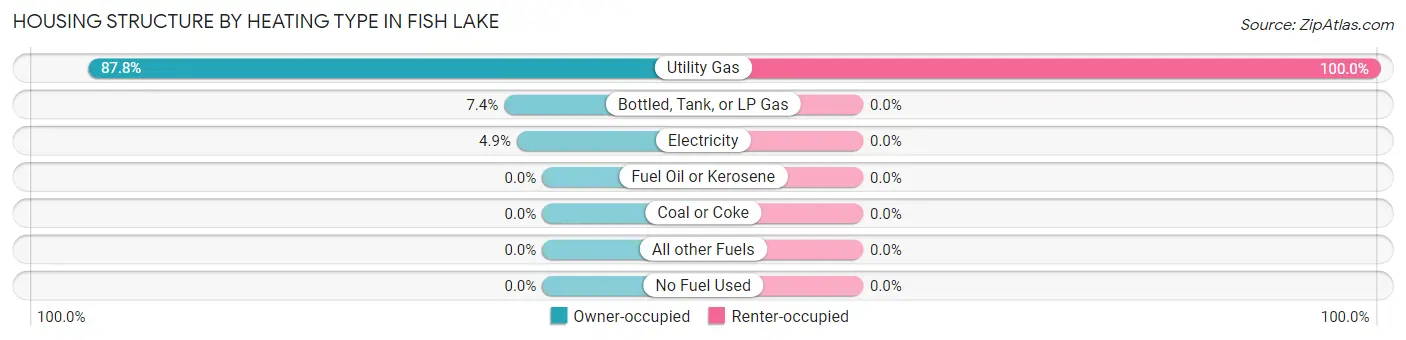
| Heating Type | Owner-occupied | Renter-occupied |
| Utility Gas | 179 (87.7%) | 90 (100.0%) |
| Bottled, Tank, or LP Gas | 15 (7.3%) | 0 (0.0%) |
| Electricity | 10 (4.9%) | 0 (0.0%) |
| Fuel Oil or Kerosene | 0 (0.0%) | 0 (0.0%) |
| Coal or Coke | 0 (0.0%) | 0 (0.0%) |
| All other Fuels | 0 (0.0%) | 0 (0.0%) |
| No Fuel Used | 0 (0.0%) | 0 (0.0%) |
| Total | 204 (100.0%) | 90 (100.0%) |
Household Vehicle Usage in Fish Lake
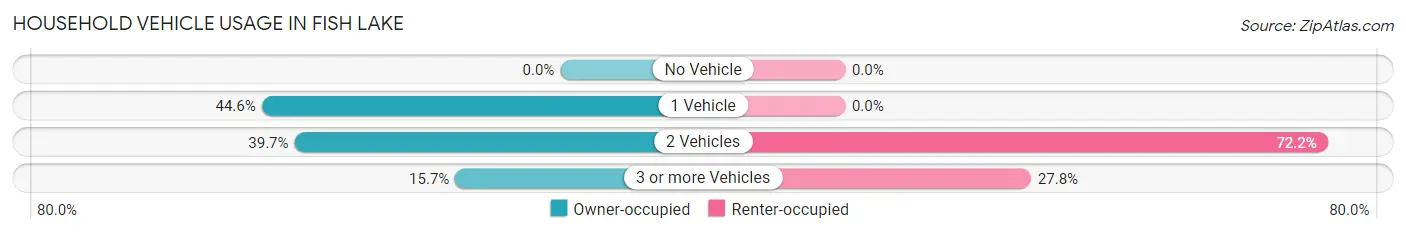
| Vehicles per Household | Owner-occupied | Renter-occupied |
| No Vehicle | 0 (0.0%) | 0 (0.0%) |
| 1 Vehicle | 91 (44.6%) | 0 (0.0%) |
| 2 Vehicles | 81 (39.7%) | 65 (72.2%) |
| 3 or more Vehicles | 32 (15.7%) | 25 (27.8%) |
| Total | 204 (100.0%) | 90 (100.0%) |
Real Estate & Mortgages in Fish Lake
Real Estate and Mortgage Overview in Fish Lake
| Characteristic | Without Mortgage | With Mortgage |
| Housing Units | 102 | 102 |
| Median Property Value | - | - |
| Median Household Income | $49,167 | $29 |
| Monthly Housing Costs | $477 | $0 |
| Real Estate Taxes | - | - |
Property Value by Mortgage Status in Fish Lake
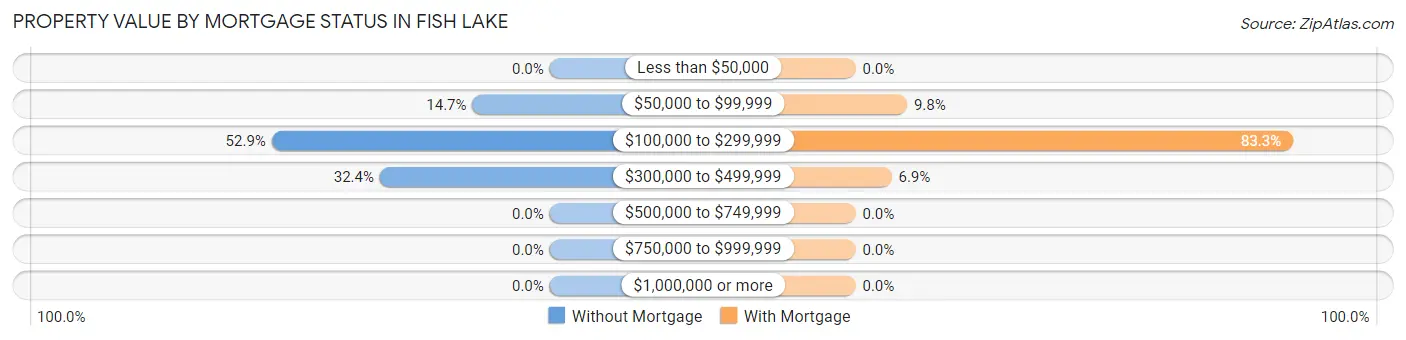
| Property Value | Without Mortgage | With Mortgage |
| Less than $50,000 | 0 (0.0%) | 0 (0.0%) |
| $50,000 to $99,999 | 15 (14.7%) | 10 (9.8%) |
| $100,000 to $299,999 | 54 (52.9%) | 85 (83.3%) |
| $300,000 to $499,999 | 33 (32.4%) | 7 (6.9%) |
| $500,000 to $749,999 | 0 (0.0%) | 0 (0.0%) |
| $750,000 to $999,999 | 0 (0.0%) | 0 (0.0%) |
| $1,000,000 or more | 0 (0.0%) | 0 (0.0%) |
| Total | 102 (100.0%) | 102 (100.0%) |
Household Income by Mortgage Status in Fish Lake
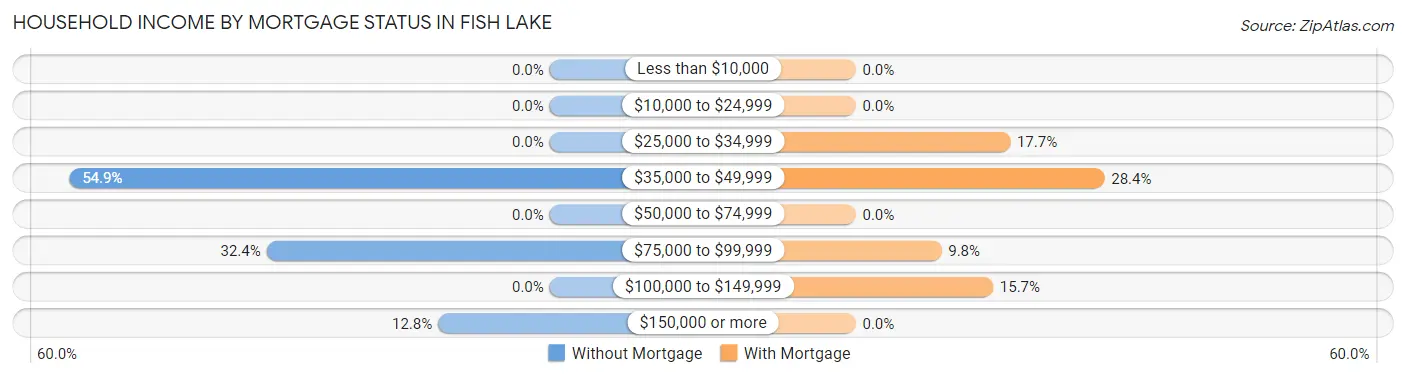
| Household Income | Without Mortgage | With Mortgage |
| Less than $10,000 | 0 (0.0%) | 0 (0.0%) |
| $10,000 to $24,999 | 0 (0.0%) | 0 (0.0%) |
| $25,000 to $34,999 | 0 (0.0%) | 18 (17.6%) |
| $35,000 to $49,999 | 56 (54.9%) | 29 (28.4%) |
| $50,000 to $74,999 | 0 (0.0%) | 0 (0.0%) |
| $75,000 to $99,999 | 33 (32.4%) | 10 (9.8%) |
| $100,000 to $149,999 | 0 (0.0%) | 16 (15.7%) |
| $150,000 or more | 13 (12.8%) | 0 (0.0%) |
| Total | 102 (100.0%) | 102 (100.0%) |
Property Value to Household Income Ratio in Fish Lake
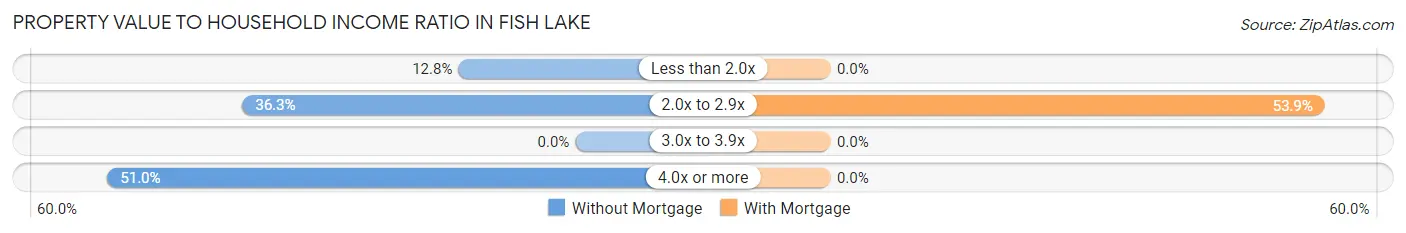
| Value-to-Income Ratio | Without Mortgage | With Mortgage |
| Less than 2.0x | 13 (12.8%) | 0 (0.0%) |
| 2.0x to 2.9x | 37 (36.3%) | 55 (53.9%) |
| 3.0x to 3.9x | 0 (0.0%) | 0 (0.0%) |
| 4.0x or more | 52 (51.0%) | 0 (0.0%) |
| Total | 102 (100.0%) | 102 (100.0%) |
Real Estate Taxes by Mortgage Status in Fish Lake
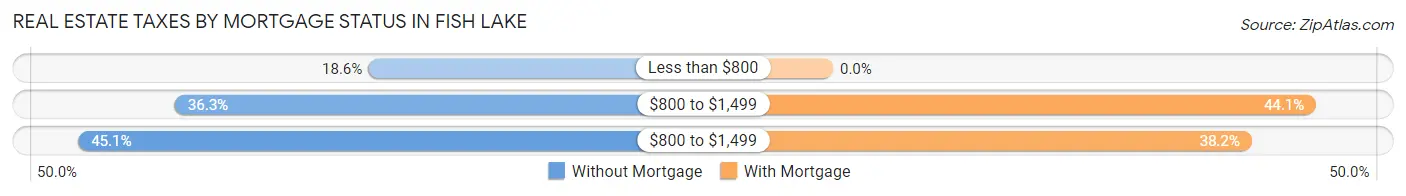
| Property Taxes | Without Mortgage | With Mortgage |
| Less than $800 | 19 (18.6%) | 0 (0.0%) |
| $800 to $1,499 | 37 (36.3%) | 45 (44.1%) |
| $800 to $1,499 | 46 (45.1%) | 39 (38.2%) |
| Total | 102 (100.0%) | 102 (100.0%) |
Health & Disability in Fish Lake
Health Insurance Coverage by Age in Fish Lake
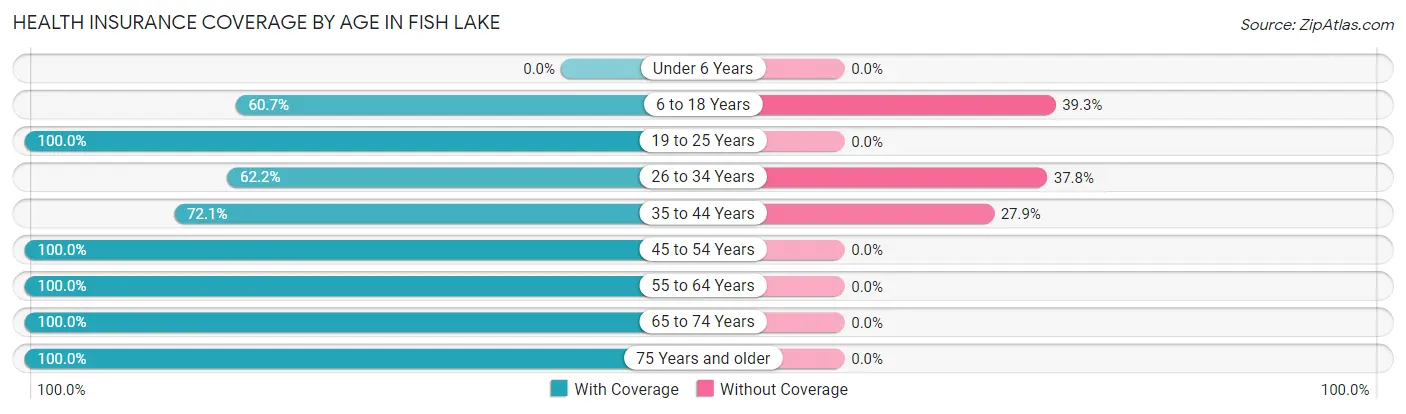
| Age Bracket | With Coverage | Without Coverage |
| Under 6 Years | 0 (0.0%) | 0 (0.0%) |
| 6 to 18 Years | 91 (60.7%) | 59 (39.3%) |
| 19 to 25 Years | 62 (100.0%) | 0 (0.0%) |
| 26 to 34 Years | 61 (62.2%) | 37 (37.8%) |
| 35 to 44 Years | 101 (72.1%) | 39 (27.9%) |
| 45 to 54 Years | 68 (100.0%) | 0 (0.0%) |
| 55 to 64 Years | 87 (100.0%) | 0 (0.0%) |
| 65 to 74 Years | 137 (100.0%) | 0 (0.0%) |
| 75 Years and older | 40 (100.0%) | 0 (0.0%) |
| Total | 647 (82.7%) | 135 (17.3%) |
Health Insurance Coverage by Citizenship Status in Fish Lake
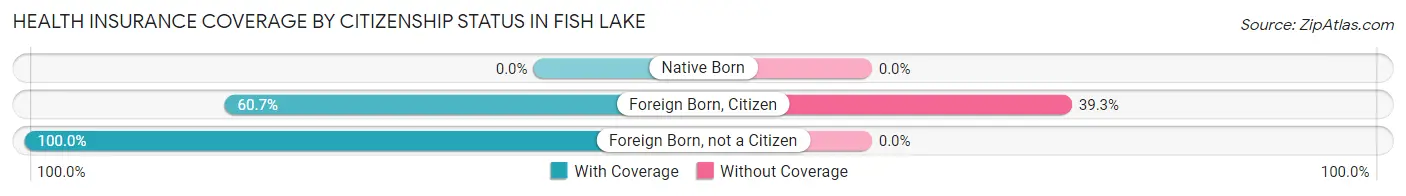
| Citizenship Status | With Coverage | Without Coverage |
| Native Born | 0 (0.0%) | 0 (0.0%) |
| Foreign Born, Citizen | 91 (60.7%) | 59 (39.3%) |
| Foreign Born, not a Citizen | 62 (100.0%) | 0 (0.0%) |
Health Insurance Coverage by Household Income in Fish Lake
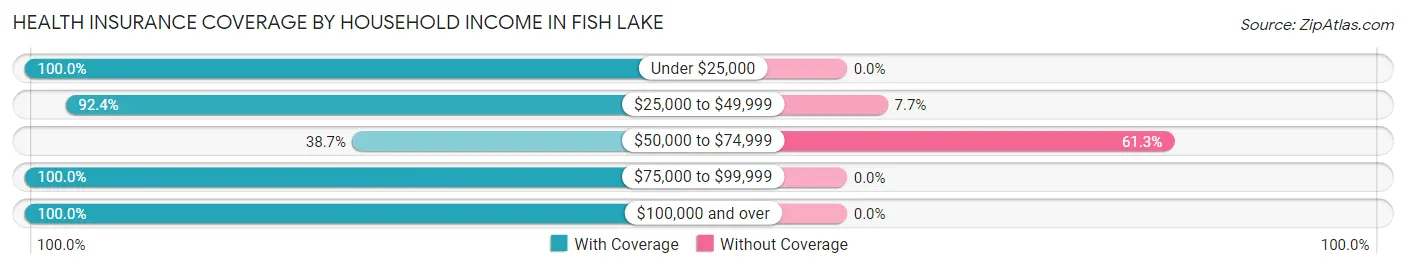
| Household Income | With Coverage | Without Coverage |
| Under $25,000 | 18 (100.0%) | 0 (0.0%) |
| $25,000 to $49,999 | 157 (92.3%) | 13 (7.6%) |
| $50,000 to $74,999 | 77 (38.7%) | 122 (61.3%) |
| $75,000 to $99,999 | 175 (100.0%) | 0 (0.0%) |
| $100,000 and over | 220 (100.0%) | 0 (0.0%) |
Public vs Private Health Insurance Coverage by Age in Fish Lake
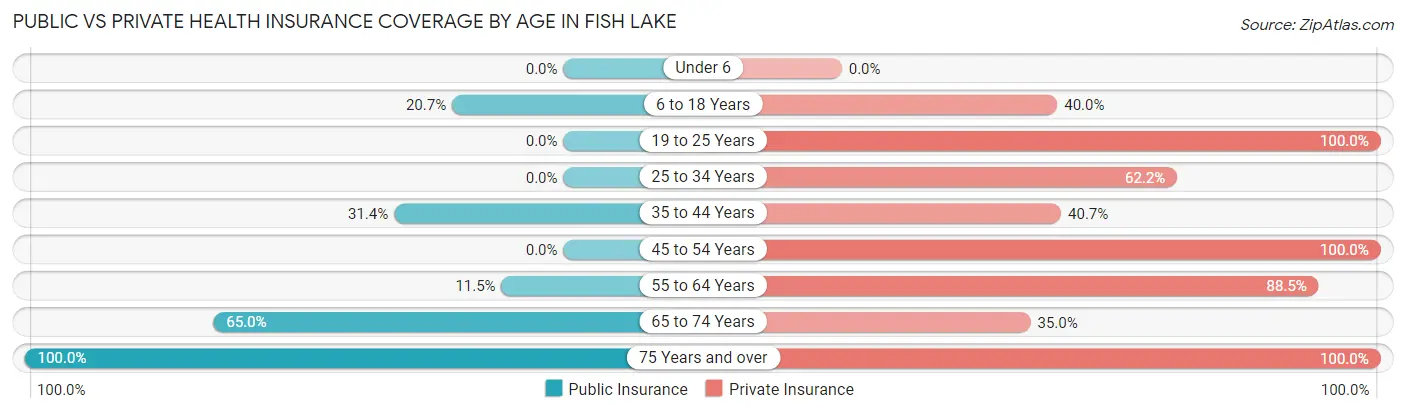
| Age Bracket | Public Insurance | Private Insurance |
| Under 6 | 0 (0.0%) | 0 (0.0%) |
| 6 to 18 Years | 31 (20.7%) | 60 (40.0%) |
| 19 to 25 Years | 0 (0.0%) | 62 (100.0%) |
| 25 to 34 Years | 0 (0.0%) | 61 (62.2%) |
| 35 to 44 Years | 44 (31.4%) | 57 (40.7%) |
| 45 to 54 Years | 0 (0.0%) | 68 (100.0%) |
| 55 to 64 Years | 10 (11.5%) | 77 (88.5%) |
| 65 to 74 Years | 89 (65.0%) | 48 (35.0%) |
| 75 Years and over | 40 (100.0%) | 40 (100.0%) |
| Total | 214 (27.4%) | 473 (60.5%) |
Disability Status by Sex by Age in Fish Lake
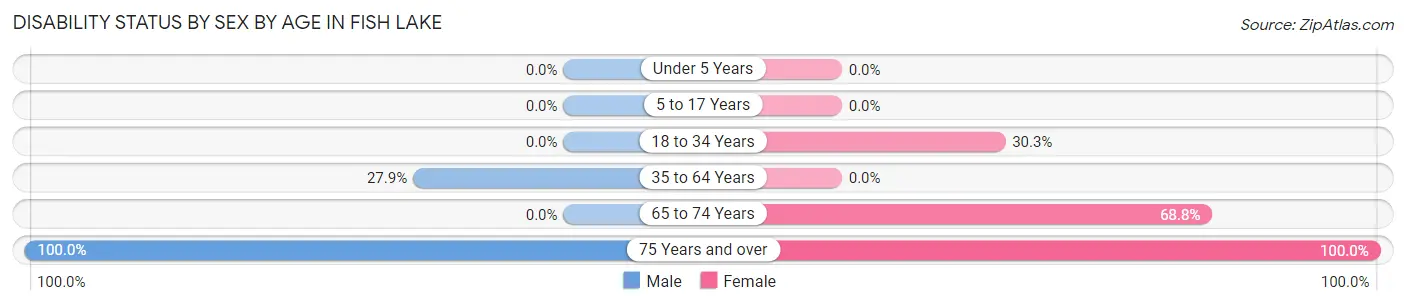
| Age Bracket | Male | Female |
| Under 5 Years | 0 (0.0%) | 0 (0.0%) |
| 5 to 17 Years | 0 (0.0%) | 0 (0.0%) |
| 18 to 34 Years | 0 (0.0%) | 37 (30.3%) |
| 35 to 64 Years | 48 (27.9%) | 0 (0.0%) |
| 65 to 74 Years | 0 (0.0%) | 33 (68.8%) |
| 75 Years and over | 18 (100.0%) | 22 (100.0%) |
Disability Class by Sex by Age in Fish Lake
Disability Class: Hearing Difficulty
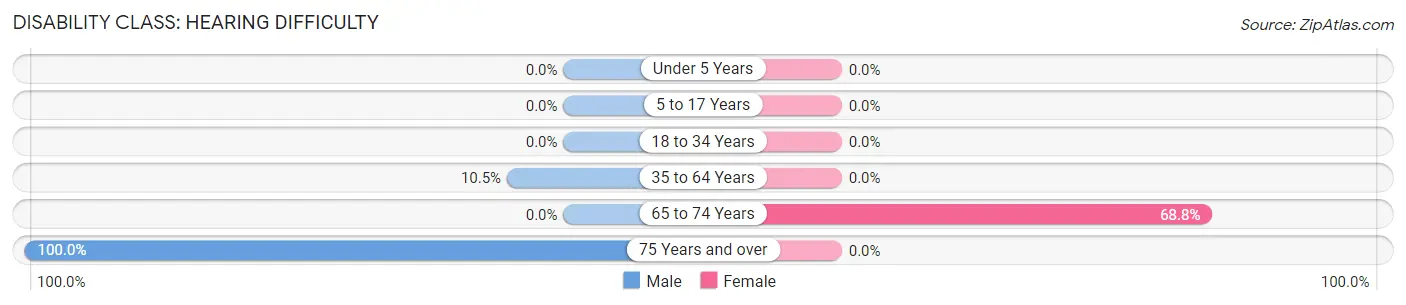
| Age Bracket | Male | Female |
| Under 5 Years | 0 (0.0%) | 0 (0.0%) |
| 5 to 17 Years | 0 (0.0%) | 0 (0.0%) |
| 18 to 34 Years | 0 (0.0%) | 0 (0.0%) |
| 35 to 64 Years | 18 (10.5%) | 0 (0.0%) |
| 65 to 74 Years | 0 (0.0%) | 33 (68.8%) |
| 75 Years and over | 18 (100.0%) | 0 (0.0%) |
Disability Class: Vision Difficulty
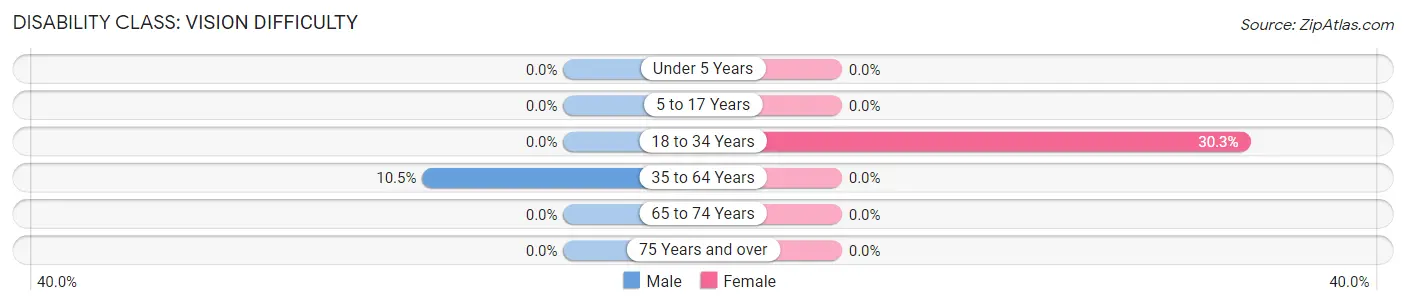
| Age Bracket | Male | Female |
| Under 5 Years | 0 (0.0%) | 0 (0.0%) |
| 5 to 17 Years | 0 (0.0%) | 0 (0.0%) |
| 18 to 34 Years | 0 (0.0%) | 37 (30.3%) |
| 35 to 64 Years | 18 (10.5%) | 0 (0.0%) |
| 65 to 74 Years | 0 (0.0%) | 0 (0.0%) |
| 75 Years and over | 0 (0.0%) | 0 (0.0%) |
Disability Class: Cognitive Difficulty
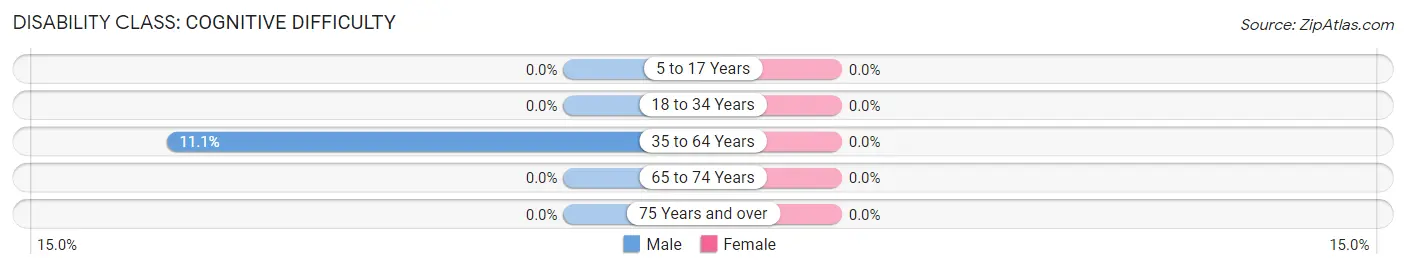
| Age Bracket | Male | Female |
| 5 to 17 Years | 0 (0.0%) | 0 (0.0%) |
| 18 to 34 Years | 0 (0.0%) | 0 (0.0%) |
| 35 to 64 Years | 19 (11.1%) | 0 (0.0%) |
| 65 to 74 Years | 0 (0.0%) | 0 (0.0%) |
| 75 Years and over | 0 (0.0%) | 0 (0.0%) |
Disability Class: Ambulatory Difficulty
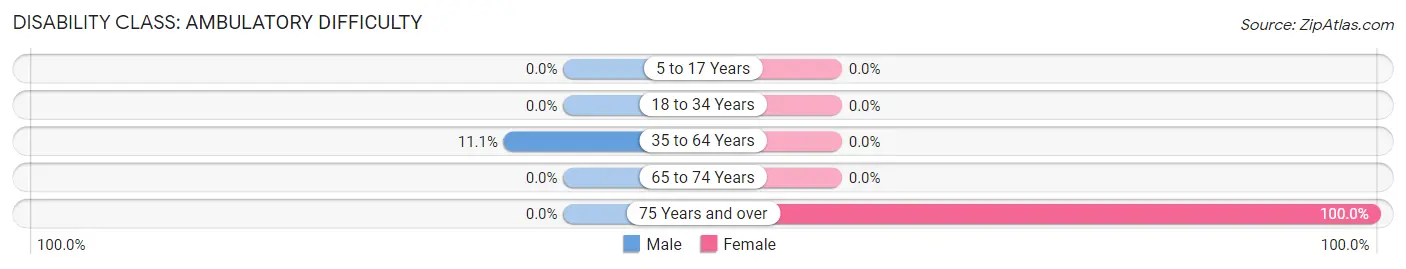
| Age Bracket | Male | Female |
| 5 to 17 Years | 0 (0.0%) | 0 (0.0%) |
| 18 to 34 Years | 0 (0.0%) | 0 (0.0%) |
| 35 to 64 Years | 19 (11.1%) | 0 (0.0%) |
| 65 to 74 Years | 0 (0.0%) | 0 (0.0%) |
| 75 Years and over | 0 (0.0%) | 22 (100.0%) |
Disability Class: Self-Care Difficulty
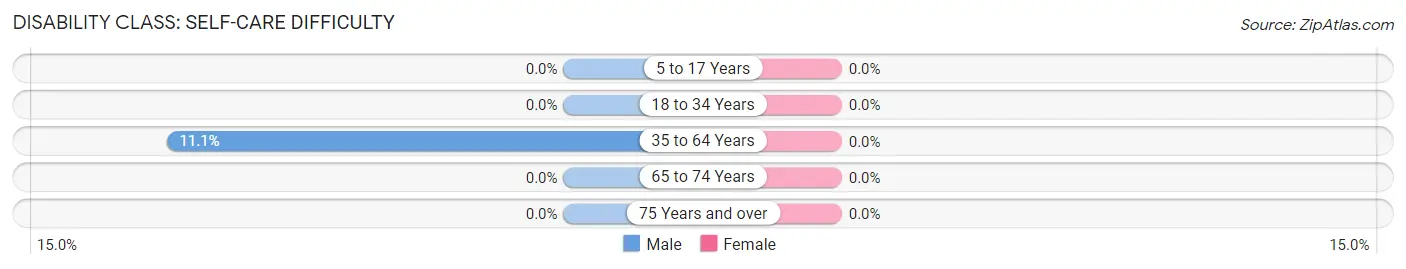
| Age Bracket | Male | Female |
| 5 to 17 Years | 0 (0.0%) | 0 (0.0%) |
| 18 to 34 Years | 0 (0.0%) | 0 (0.0%) |
| 35 to 64 Years | 19 (11.1%) | 0 (0.0%) |
| 65 to 74 Years | 0 (0.0%) | 0 (0.0%) |
| 75 Years and over | 0 (0.0%) | 0 (0.0%) |
Technology Access in Fish Lake
Computing Device Access in Fish Lake
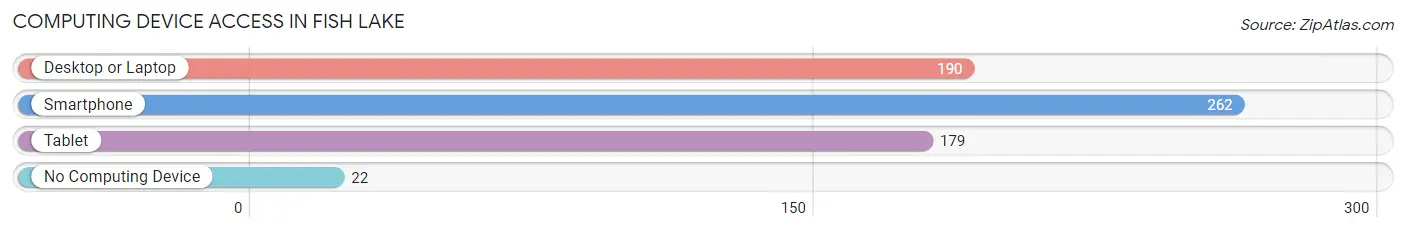
| Device Type | # Households | % Households |
| Desktop or Laptop | 190 | 64.6% |
| Smartphone | 262 | 89.1% |
| Tablet | 179 | 60.9% |
| No Computing Device | 22 | 7.5% |
| Total | 294 | 100.0% |
Internet Access in Fish Lake
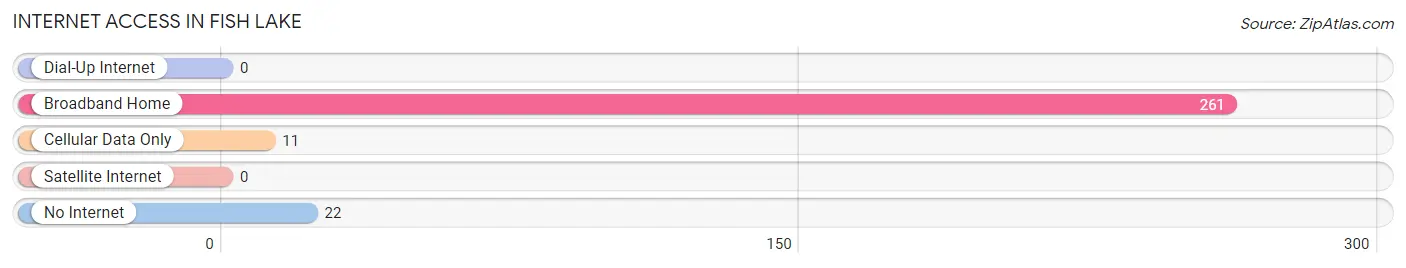
| Internet Type | # Households | % Households |
| Dial-Up Internet | 0 | 0.0% |
| Broadband Home | 261 | 88.8% |
| Cellular Data Only | 11 | 3.7% |
| Satellite Internet | 0 | 0.0% |
| No Internet | 22 | 7.5% |
| Total | 294 | 100.0% |
Fish Lake Summary
Lake Fish is a small town located in the state of Indiana, in the United States. It is situated in the northwest corner of the state, in the county of Porter. The town is located on the shores of Lake Michigan, and is home to a population of just over 1,000 people.
History
The area that is now known as Fish Lake was first settled in the early 1800s by a group of settlers from New England. The settlers were attracted to the area due to its abundance of natural resources, including fish, timber, and fertile soil. The settlers established a small fishing village, which they named Fish Lake.
The town grew slowly over the years, and by the mid-1800s, it had become a popular destination for tourists. The town was known for its beautiful scenery, and its abundance of fish. In the late 1800s, the town was incorporated as a village, and in the early 1900s, it was officially recognized as a town.
Geography
Fish Lake is located in the northwest corner of Indiana, in the county of Porter. It is situated on the shores of Lake Michigan, and is surrounded by the towns of Chesterton, Valparaiso, and Portage. The town is located at an elevation of 645 feet above sea level.
The town is located in a temperate climate, with hot summers and cold winters. The average temperature in the summer is around 75 degrees Fahrenheit, and the average temperature in the winter is around 25 degrees Fahrenheit. The town receives an average of 40 inches of precipitation each year.
Economy
The economy of Fish Lake is largely based on tourism and fishing. The town is home to several popular tourist attractions, including the Fish Lake State Park, which offers camping, fishing, and other outdoor activities. The town is also home to several restaurants, bars, and shops.
The town is also home to several businesses, including a grocery store, a hardware store, and a gas station. The town is also home to a small manufacturing plant, which produces a variety of products, including furniture and clothing.
Demographics
As of the 2010 census, the population of Fish Lake was 1,072. The town is predominantly white, with a population that is 97.3% white. The town also has a small Hispanic population, which makes up 1.2% of the population. The median household income in the town is $45,000, and the median home value is $150,000.
Conclusion
Fish Lake is a small town located in the northwest corner of Indiana, in the county of Porter. The town is situated on the shores of Lake Michigan, and is home to a population of just over 1,000 people. The town is known for its beautiful scenery, and its abundance of fish. The economy of the town is largely based on tourism and fishing, and the town is home to several popular tourist attractions. The town is predominantly white, with a population that is 97.3% white. The median household income in the town is $45,000, and the median home value is $150,000.
Common Questions
What is Per Capita Income in Fish Lake?
Per Capita income in Fish Lake is $33,499.
What is the Median Family Income in Fish Lake?
Median Family Income in Fish Lake is $76,174.
What is the Median Household income in Fish Lake?
Median Household Income in Fish Lake is $66,554.
What is Inequality or Gini Index in Fish Lake?
Inequality or Gini Index in Fish Lake is 0.36.
What is the Total Population of Fish Lake?
Total Population of Fish Lake is 782.
What is the Total Male Population of Fish Lake?
Total Male Population of Fish Lake is 427.
What is the Total Female Population of Fish Lake?
Total Female Population of Fish Lake is 355.
What is the Ratio of Males per 100 Females in Fish Lake?
There are 120.28 Males per 100 Females in Fish Lake.
What is the Ratio of Females per 100 Males in Fish Lake?
There are 83.14 Females per 100 Males in Fish Lake.
What is the Median Population Age in Fish Lake?
Median Population Age in Fish Lake is 36.0 Years.
What is the Average Family Size in Fish Lake
Average Family Size in Fish Lake is 3.1 People.
What is the Average Household Size in Fish Lake
Average Household Size in Fish Lake is 2.7 People.
How Large is the Labor Force in Fish Lake?
There are 492 People in the Labor Forcein in Fish Lake.
What is the Percentage of People in the Labor Force in Fish Lake?
74.4% of People are in the Labor Force in Fish Lake.
What is the Unemployment Rate in Fish Lake?
Unemployment Rate in Fish Lake is 5.3%.