Tri Lakes, IN Map & Demographics
Tri Lakes Map
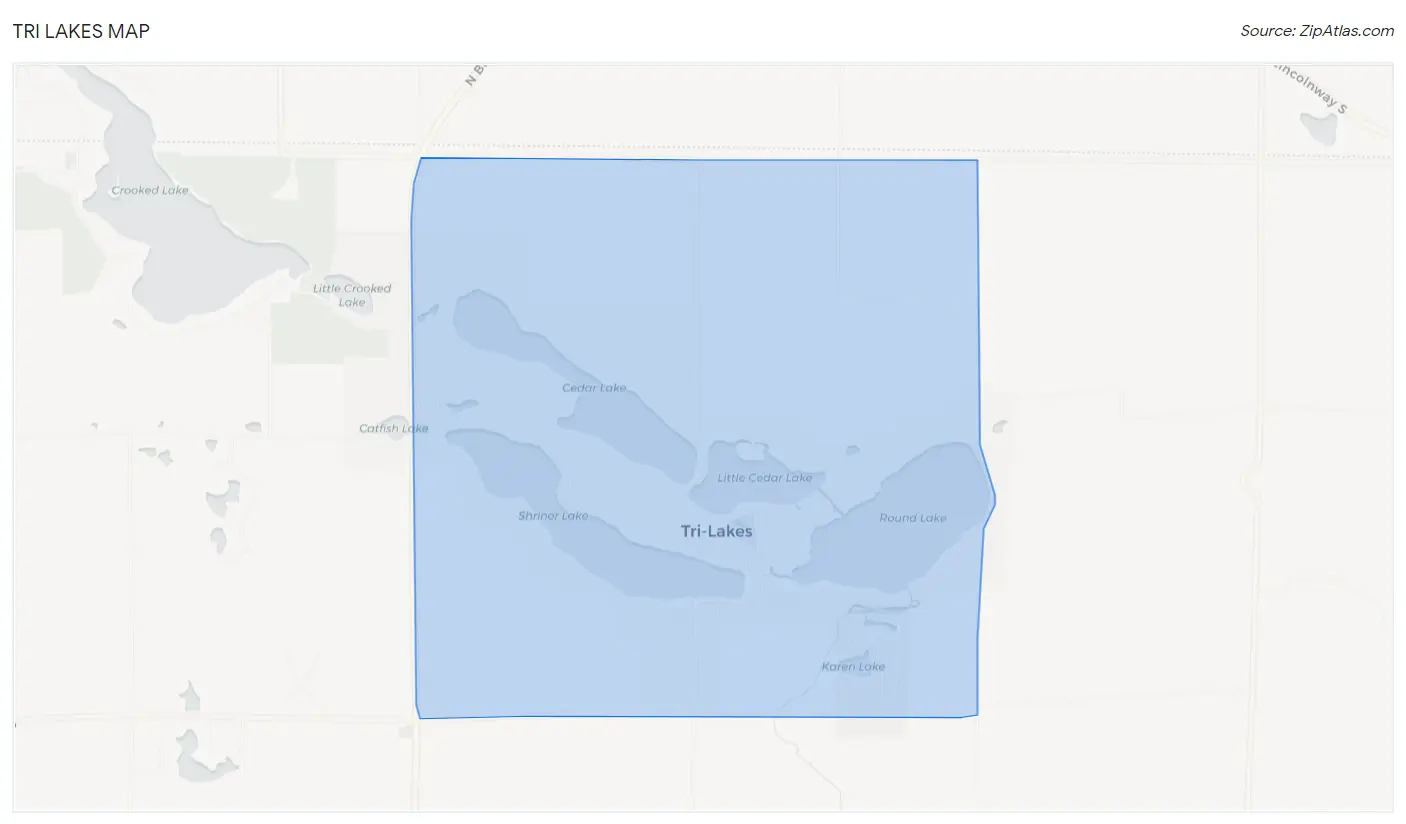
Tri Lakes Overview
$49,141
PER CAPITA INCOME
$104,750
AVG FAMILY INCOME
$126,667
AVG HOUSEHOLD INCOME
3.1%
WAGE / INCOME GAP [ % ]
96.9¢/ $1
WAGE / INCOME GAP [ $ ]
0.35
INEQUALITY / GINI INDEX
1,258
TOTAL POPULATION
717
MALE POPULATION
541
FEMALE POPULATION
132.53
MALES / 100 FEMALES
75.45
FEMALES / 100 MALES
53.6
MEDIAN AGE
2.6
AVG FAMILY SIZE
2.4
AVG HOUSEHOLD SIZE
596
LABOR FORCE [ PEOPLE ]
58.9%
PERCENT IN LABOR FORCE
Income in Tri Lakes
Income Overview in Tri Lakes
Per Capita Income in Tri Lakes is $49,141, while median incomes of families and households are $104,750 and $126,667 respectively.
| Characteristic | Number | Measure |
| Per Capita Income | 1,258 | $49,141 |
| Median Family Income | 400 | $104,750 |
| Mean Family Income | 400 | $118,851 |
| Median Household Income | 534 | $126,667 |
| Mean Household Income | 534 | $112,918 |
| Income Deficit | 400 | $0 |
| Wage / Income Gap (%) | 1,258 | 3.05% |
| Wage / Income Gap ($) | 1,258 | 96.95¢ per $1 |
| Gini / Inequality Index | 1,258 | 0.35 |
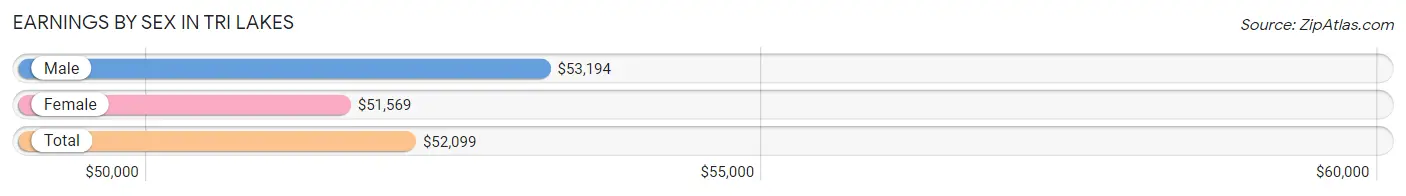
Earnings by Sex in Tri Lakes
Average Earnings in Tri Lakes are $52,099, $53,194 for men and $51,569 for women, a difference of 3.0%.
| Sex | Number | Average Earnings |
| Male | 366 (54.5%) | $53,194 |
| Female | 305 (45.5%) | $51,569 |
| Total | 671 (100.0%) | $52,099 |
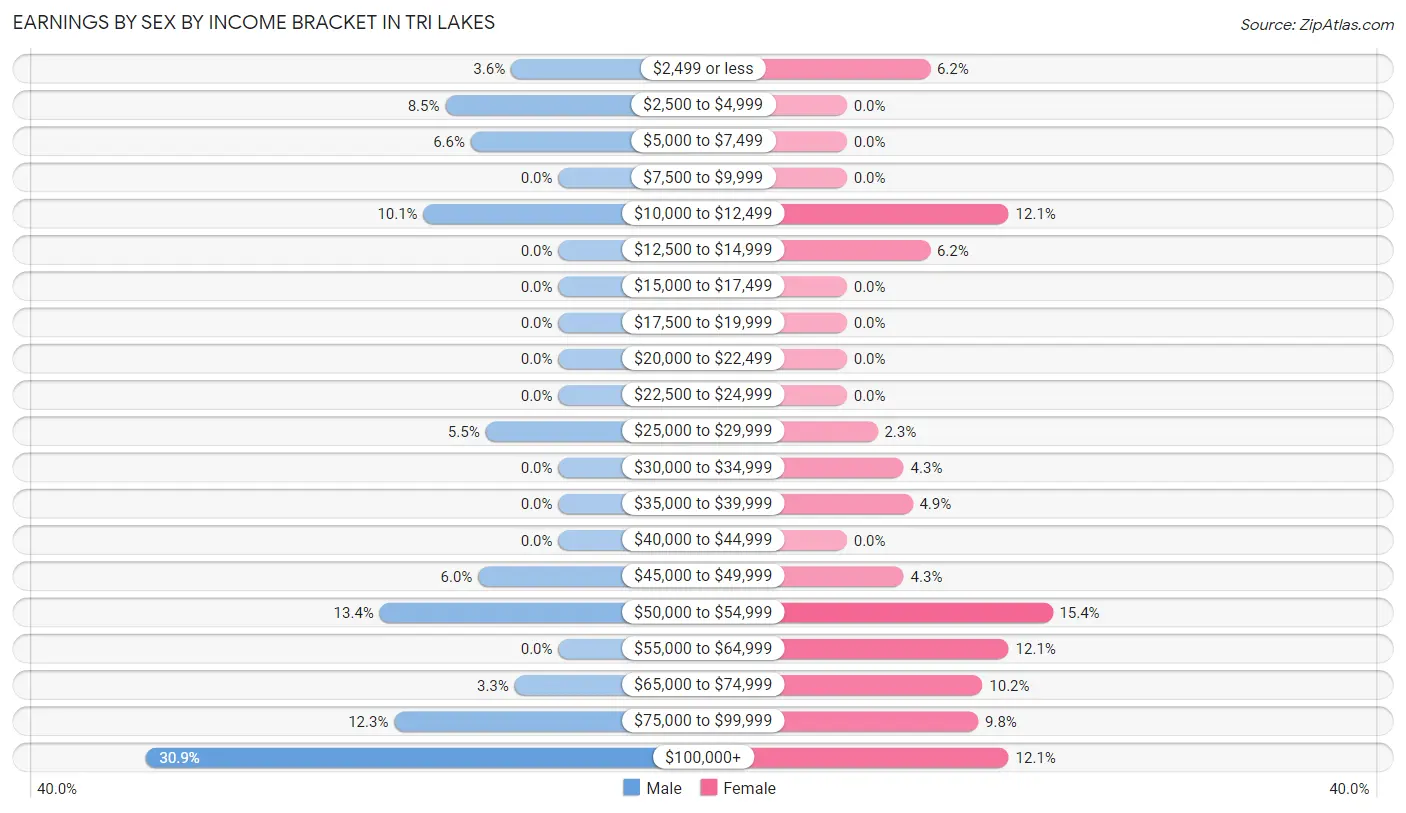
Earnings by Sex by Income Bracket in Tri Lakes
The most common earnings brackets in Tri Lakes are $100,000+ for men (113 | 30.9%) and $50,000 to $54,999 for women (47 | 15.4%).
| Income | Male | Female |
| $2,499 or less | 13 (3.5%) | 19 (6.2%) |
| $2,500 to $4,999 | 31 (8.5%) | 0 (0.0%) |
| $5,000 to $7,499 | 24 (6.6%) | 0 (0.0%) |
| $7,500 to $9,999 | 0 (0.0%) | 0 (0.0%) |
| $10,000 to $12,499 | 37 (10.1%) | 37 (12.1%) |
| $12,500 to $14,999 | 0 (0.0%) | 19 (6.2%) |
| $15,000 to $17,499 | 0 (0.0%) | 0 (0.0%) |
| $17,500 to $19,999 | 0 (0.0%) | 0 (0.0%) |
| $20,000 to $22,499 | 0 (0.0%) | 0 (0.0%) |
| $22,500 to $24,999 | 0 (0.0%) | 0 (0.0%) |
| $25,000 to $29,999 | 20 (5.5%) | 7 (2.3%) |
| $30,000 to $34,999 | 0 (0.0%) | 13 (4.3%) |
| $35,000 to $39,999 | 0 (0.0%) | 15 (4.9%) |
| $40,000 to $44,999 | 0 (0.0%) | 0 (0.0%) |
| $45,000 to $49,999 | 22 (6.0%) | 13 (4.3%) |
| $50,000 to $54,999 | 49 (13.4%) | 47 (15.4%) |
| $55,000 to $64,999 | 0 (0.0%) | 37 (12.1%) |
| $65,000 to $74,999 | 12 (3.3%) | 31 (10.2%) |
| $75,000 to $99,999 | 45 (12.3%) | 30 (9.8%) |
| $100,000+ | 113 (30.9%) | 37 (12.1%) |
| Total | 366 (100.0%) | 305 (100.0%) |
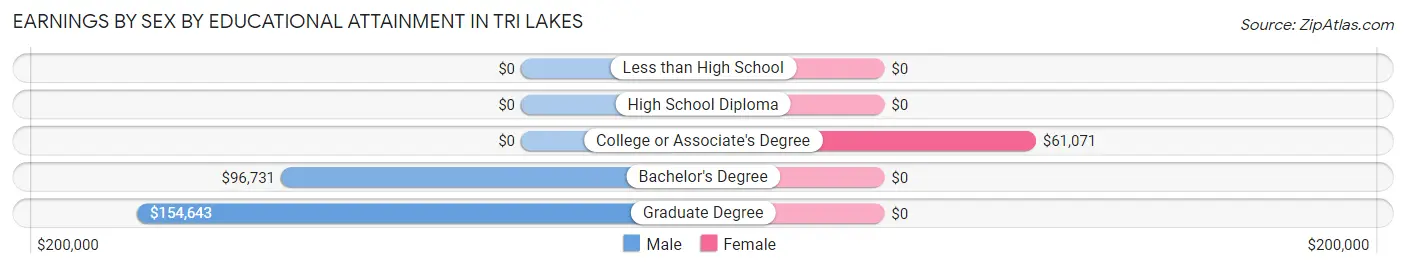
Earnings by Sex by Educational Attainment in Tri Lakes
Average earnings in Tri Lakes are $54,583 for men and $51,569 for women, a difference of 5.5%. Men with an educational attainment of graduate degree enjoy the highest average annual earnings of $154,643, while those with bachelor's degree education earn the least with $96,731. Women with an educational attainment of college or associate's degree earn the most with the average annual earnings of $61,071, while those with college or associate's degree education have the smallest earnings of $61,071.
| Educational Attainment | Male Income | Female Income |
| Less than High School | - | - |
| High School Diploma | - | - |
| College or Associate's Degree | - | - |
| Bachelor's Degree | $96,731 | $0 |
| Graduate Degree | $154,643 | $0 |
| Total | $54,583 | $51,569 |
Family Income in Tri Lakes
Family Income Brackets in Tri Lakes
According to the Tri Lakes family income data, there are 143 families falling into the $150,000 to $199,999 income range, which is the most common income bracket and makes up 35.7% of all families.
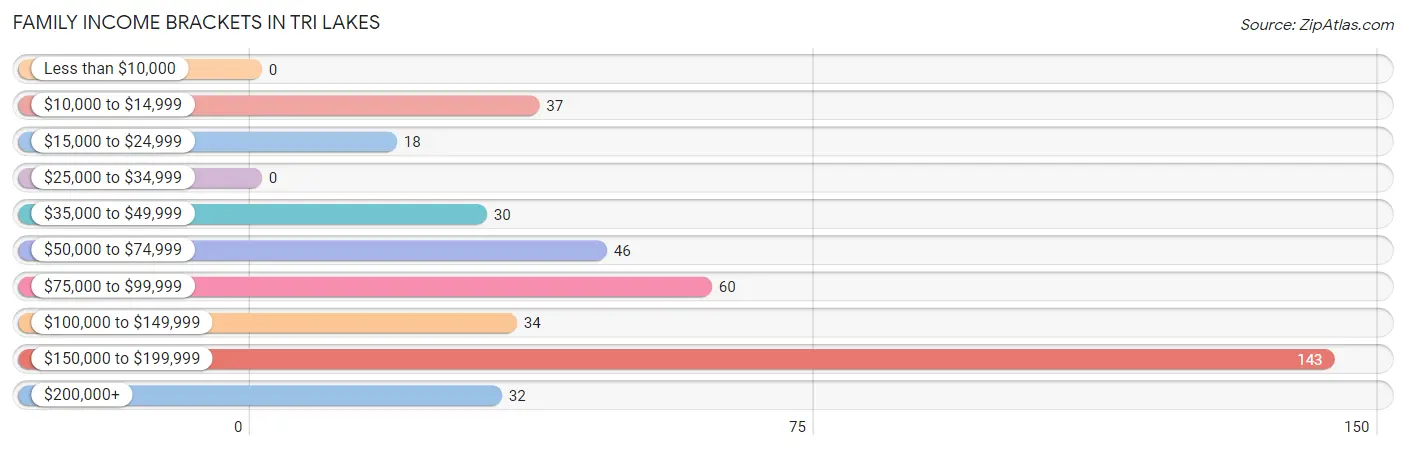
| Income Bracket | # Families | % Families |
| Less than $10,000 | 0 | 0.0% |
| $10,000 to $14,999 | 37 | 9.3% |
| $15,000 to $24,999 | 18 | 4.5% |
| $25,000 to $34,999 | 0 | 0.0% |
| $35,000 to $49,999 | 30 | 7.5% |
| $50,000 to $74,999 | 46 | 11.5% |
| $75,000 to $99,999 | 60 | 15.0% |
| $100,000 to $149,999 | 34 | 8.5% |
| $150,000 to $199,999 | 143 | 35.8% |
| $200,000+ | 32 | 8.0% |
Family Income by Famaliy Size in Tri Lakes
4-person families (45 | 11.3%) account for the highest median family income in Tri Lakes with $176,563 per family, while 3-person families (75 | 18.8%) have the highest median income of $56,146 per family member.
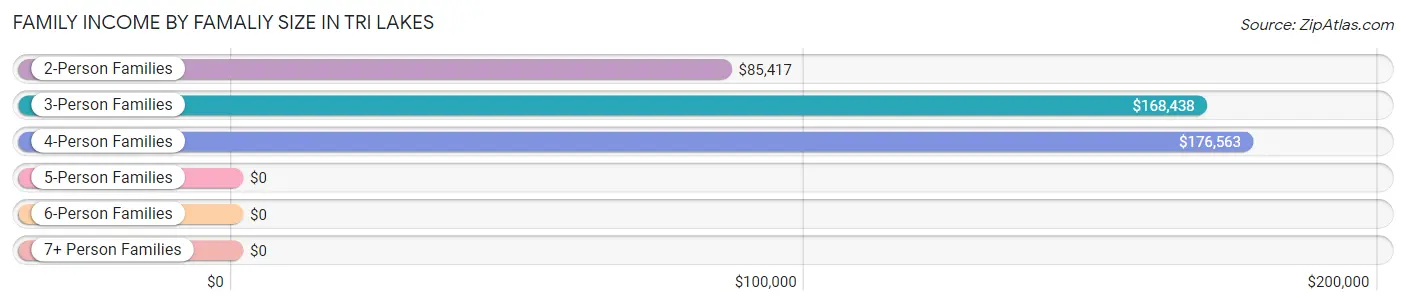
| Income Bracket | # Families | Median Income |
| 2-Person Families | 266 (66.5%) | $85,417 |
| 3-Person Families | 75 (18.8%) | $168,438 |
| 4-Person Families | 45 (11.3%) | $176,563 |
| 5-Person Families | 14 (3.5%) | $0 |
| 6-Person Families | 0 (0.0%) | $0 |
| 7+ Person Families | 0 (0.0%) | $0 |
| Total | 400 (100.0%) | $104,750 |
Family Income by Number of Earners in Tri Lakes
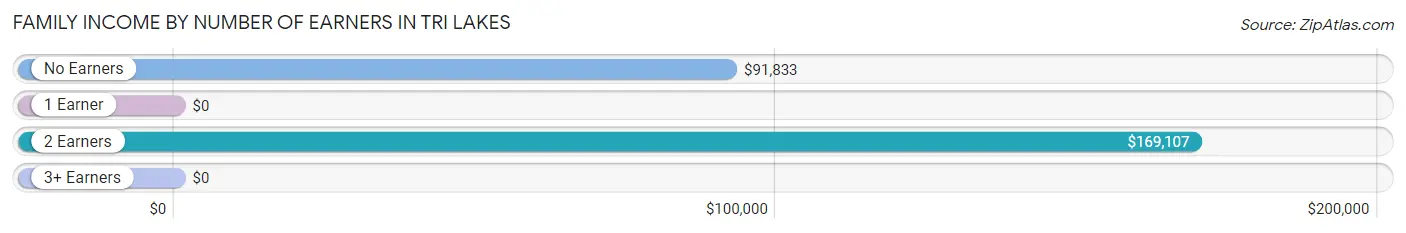
| Number of Earners | # Families | Median Income |
| No Earners | 88 (22.0%) | $91,833 |
| 1 Earner | 122 (30.5%) | $0 |
| 2 Earners | 190 (47.5%) | $169,107 |
| 3+ Earners | 0 (0.0%) | $0 |
| Total | 400 (100.0%) | $104,750 |
Household Income in Tri Lakes
Household Income Brackets in Tri Lakes
With 175 households falling in the category, the $150,000 to $199,999 income range is the most frequent in Tri Lakes, accounting for 32.8% of all households. In contrast, only 13 households (2.4%) fall into the less than $10,000 income bracket, making it the least populous group.
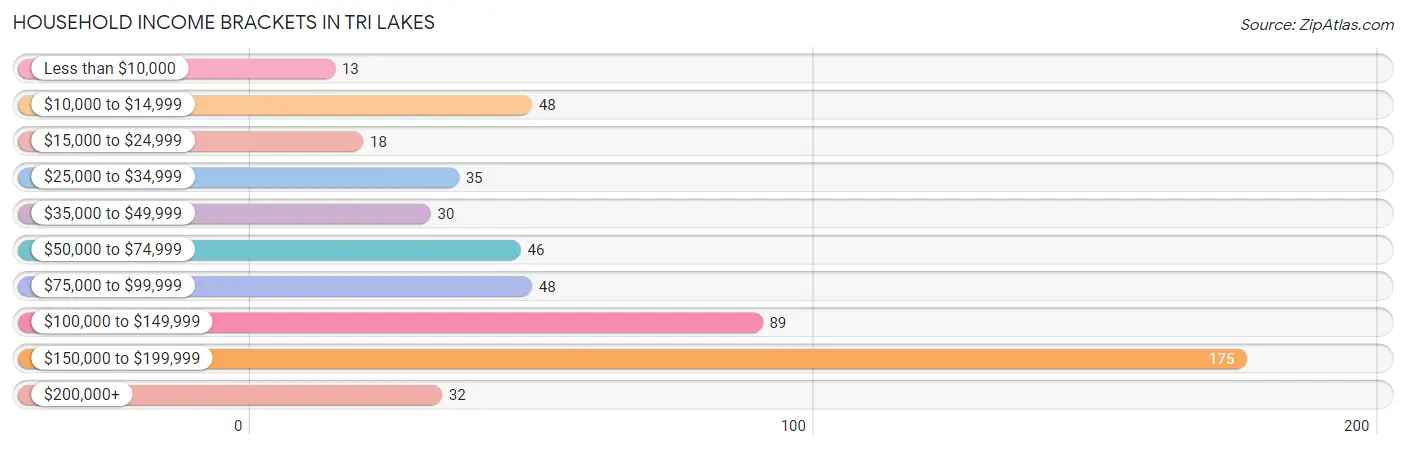
| Income Bracket | # Households | % Households |
| Less than $10,000 | 13 | 2.4% |
| $10,000 to $14,999 | 48 | 9.0% |
| $15,000 to $24,999 | 18 | 3.4% |
| $25,000 to $34,999 | 35 | 6.6% |
| $35,000 to $49,999 | 30 | 5.6% |
| $50,000 to $74,999 | 46 | 8.6% |
| $75,000 to $99,999 | 48 | 9.0% |
| $100,000 to $149,999 | 89 | 16.7% |
| $150,000 to $199,999 | 175 | 32.8% |
| $200,000+ | 32 | 6.0% |
Household Income by Householder Age in Tri Lakes
The median household income in Tri Lakes is $126,667, with the highest median household income of $150,156 found in the 45 to 64 years age bracket for the primary householder. A total of 208 households (39.0%) fall into this category.
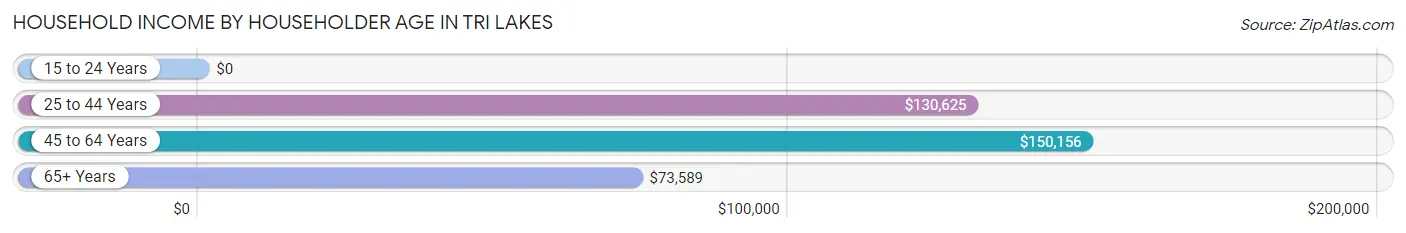
| Income Bracket | # Households | Median Income |
| 15 to 24 Years | 0 (0.0%) | $0 |
| 25 to 44 Years | 107 (20.0%) | $130,625 |
| 45 to 64 Years | 208 (39.0%) | $150,156 |
| 65+ Years | 219 (41.0%) | $73,589 |
| Total | 534 (100.0%) | $126,667 |
Poverty in Tri Lakes
Income Below Poverty by Sex and Age in Tri Lakes
With 8.5% poverty level for males and 6.1% for females among the residents of Tri Lakes, 55 to 64 year old males and 12 to 14 year old females are the most vulnerable to poverty, with 37 males (36.3%) and 33 females (73.3%) in their respective age groups living below the poverty level.
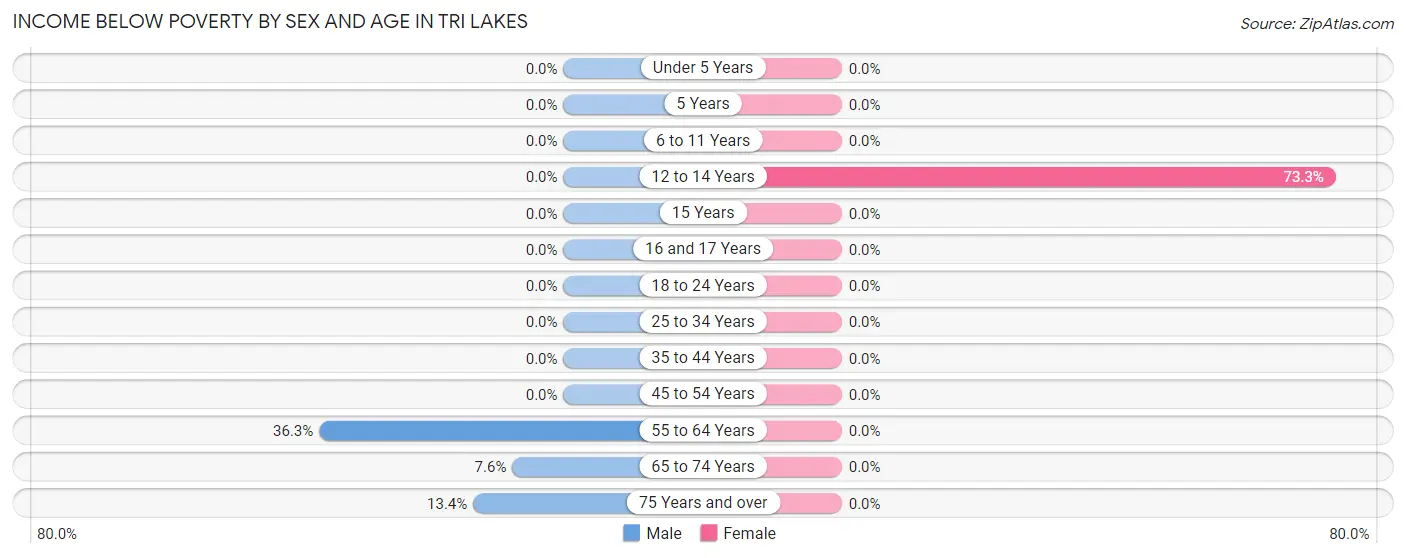
| Age Bracket | Male | Female |
| Under 5 Years | 0 (0.0%) | 0 (0.0%) |
| 5 Years | 0 (0.0%) | 0 (0.0%) |
| 6 to 11 Years | 0 (0.0%) | 0 (0.0%) |
| 12 to 14 Years | 0 (0.0%) | 33 (73.3%) |
| 15 Years | 0 (0.0%) | 0 (0.0%) |
| 16 and 17 Years | 0 (0.0%) | 0 (0.0%) |
| 18 to 24 Years | 0 (0.0%) | 0 (0.0%) |
| 25 to 34 Years | 0 (0.0%) | 0 (0.0%) |
| 35 to 44 Years | 0 (0.0%) | 0 (0.0%) |
| 45 to 54 Years | 0 (0.0%) | 0 (0.0%) |
| 55 to 64 Years | 37 (36.3%) | 0 (0.0%) |
| 65 to 74 Years | 11 (7.6%) | 0 (0.0%) |
| 75 Years and over | 13 (13.4%) | 0 (0.0%) |
| Total | 61 (8.5%) | 33 (6.1%) |
Income Above Poverty by Sex and Age in Tri Lakes
According to the poverty statistics in Tri Lakes, males aged under 5 years and females aged under 5 years are the age groups that are most secure financially, with 100.0% of males and 100.0% of females in these age groups living above the poverty line.
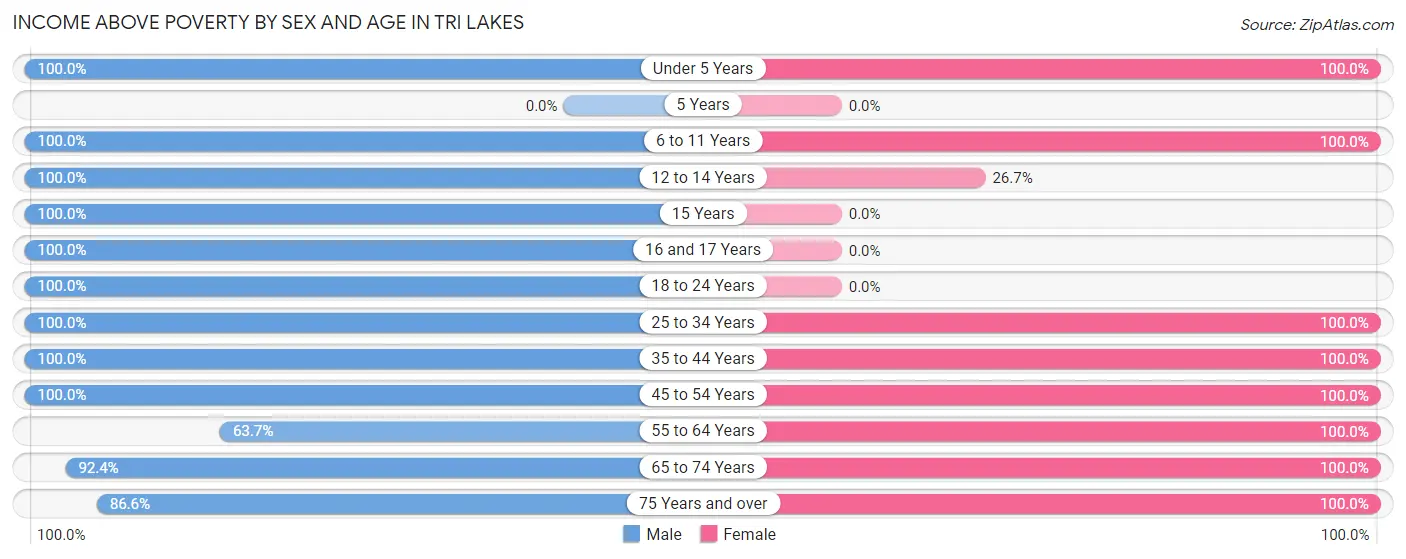
| Age Bracket | Male | Female |
| Under 5 Years | 20 (100.0%) | 9 (100.0%) |
| 5 Years | 0 (0.0%) | 0 (0.0%) |
| 6 to 11 Years | 86 (100.0%) | 12 (100.0%) |
| 12 to 14 Years | 35 (100.0%) | 12 (26.7%) |
| 15 Years | 39 (100.0%) | 0 (0.0%) |
| 16 and 17 Years | 22 (100.0%) | 0 (0.0%) |
| 18 to 24 Years | 20 (100.0%) | 0 (0.0%) |
| 25 to 34 Years | 53 (100.0%) | 44 (100.0%) |
| 35 to 44 Years | 28 (100.0%) | 77 (100.0%) |
| 45 to 54 Years | 70 (100.0%) | 114 (100.0%) |
| 55 to 64 Years | 65 (63.7%) | 145 (100.0%) |
| 65 to 74 Years | 134 (92.4%) | 43 (100.0%) |
| 75 Years and over | 84 (86.6%) | 52 (100.0%) |
| Total | 656 (91.5%) | 508 (93.9%) |
Income Below Poverty Among Married-Couple Families in Tri Lakes
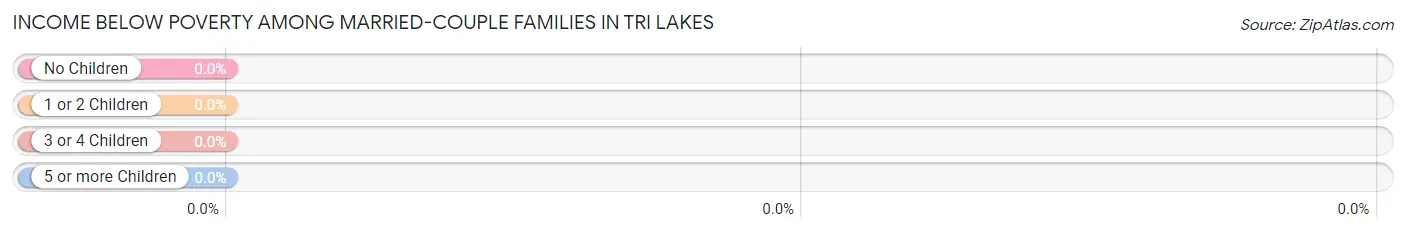
| Children | Above Poverty | Below Poverty |
| No Children | 226 (100.0%) | 0 (0.0%) |
| 1 or 2 Children | 90 (100.0%) | 0 (0.0%) |
| 3 or 4 Children | 14 (100.0%) | 0 (0.0%) |
| 5 or more Children | 0 (0.0%) | 0 (0.0%) |
| Total | 330 (100.0%) | 0 (0.0%) |
Income Below Poverty Among Single-Parent Households in Tri Lakes
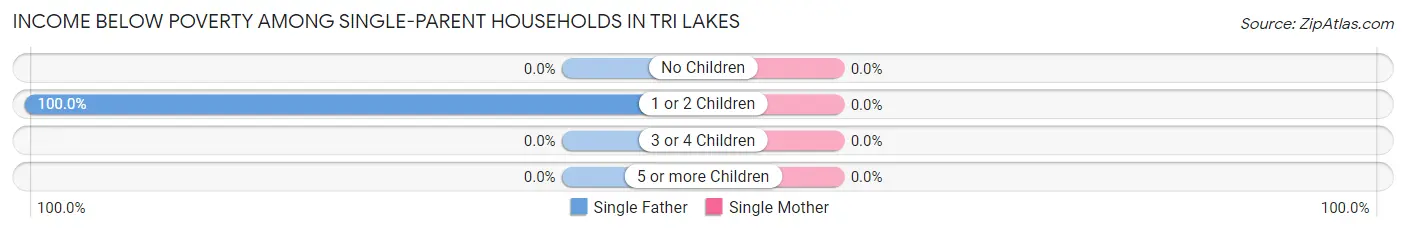
| Children | Single Father | Single Mother |
| No Children | 0 (0.0%) | 0 (0.0%) |
| 1 or 2 Children | 37 (100.0%) | 0 (0.0%) |
| 3 or 4 Children | 0 (0.0%) | 0 (0.0%) |
| 5 or more Children | 0 (0.0%) | 0 (0.0%) |
| Total | 37 (100.0%) | 0 (0.0%) |
Income Below Poverty Among Married-Couple vs Single-Parent Households in Tri Lakes
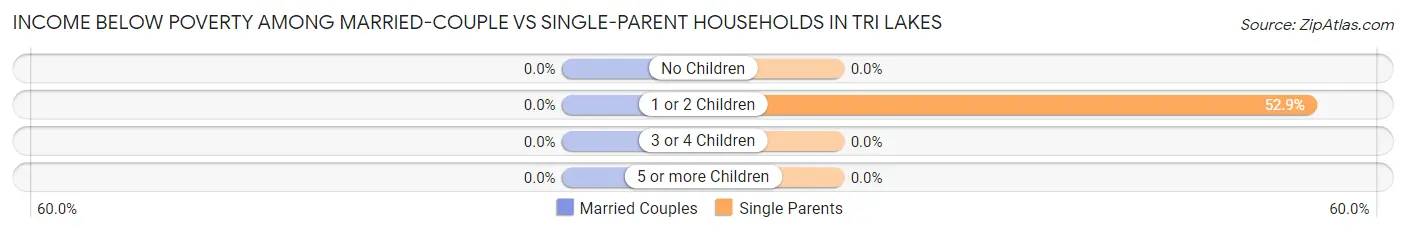
| Children | Married-Couple Families | Single-Parent Households |
| No Children | 0 (0.0%) | 0 (0.0%) |
| 1 or 2 Children | 0 (0.0%) | 37 (52.9%) |
| 3 or 4 Children | 0 (0.0%) | 0 (0.0%) |
| 5 or more Children | 0 (0.0%) | 0 (0.0%) |
| Total | 0 (0.0%) | 37 (52.9%) |
Race in Tri Lakes
The most populous races in Tri Lakes are White / Caucasian (1,122 | 89.2%), and Two or more Races (136 | 10.8%).
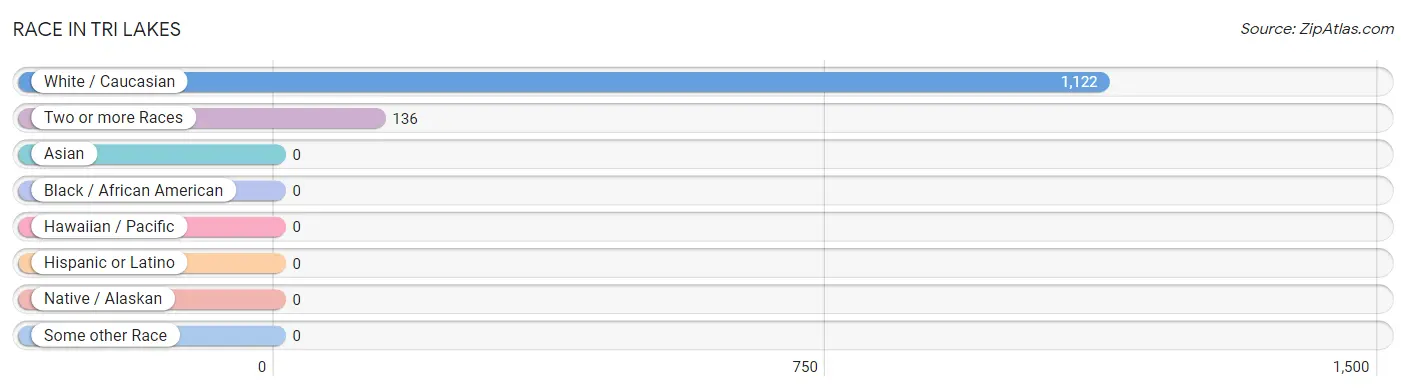
| Race | # Population | % Population |
| Asian | 0 | 0.0% |
| Black / African American | 0 | 0.0% |
| Hawaiian / Pacific | 0 | 0.0% |
| Hispanic or Latino | 0 | 0.0% |
| Native / Alaskan | 0 | 0.0% |
| White / Caucasian | 1,122 | 89.2% |
| Two or more Races | 136 | 10.8% |
| Some other Race | 0 | 0.0% |
| Total | 1,258 | 100.0% |
Ancestry in Tri Lakes
The most populous ancestries reported in Tri Lakes are German (564 | 44.8%), English (140 | 11.1%), Irish (133 | 10.6%), American (82 | 6.5%), and Bhutanese (56 | 4.4%), together accounting for 77.5% of all Tri Lakes residents.
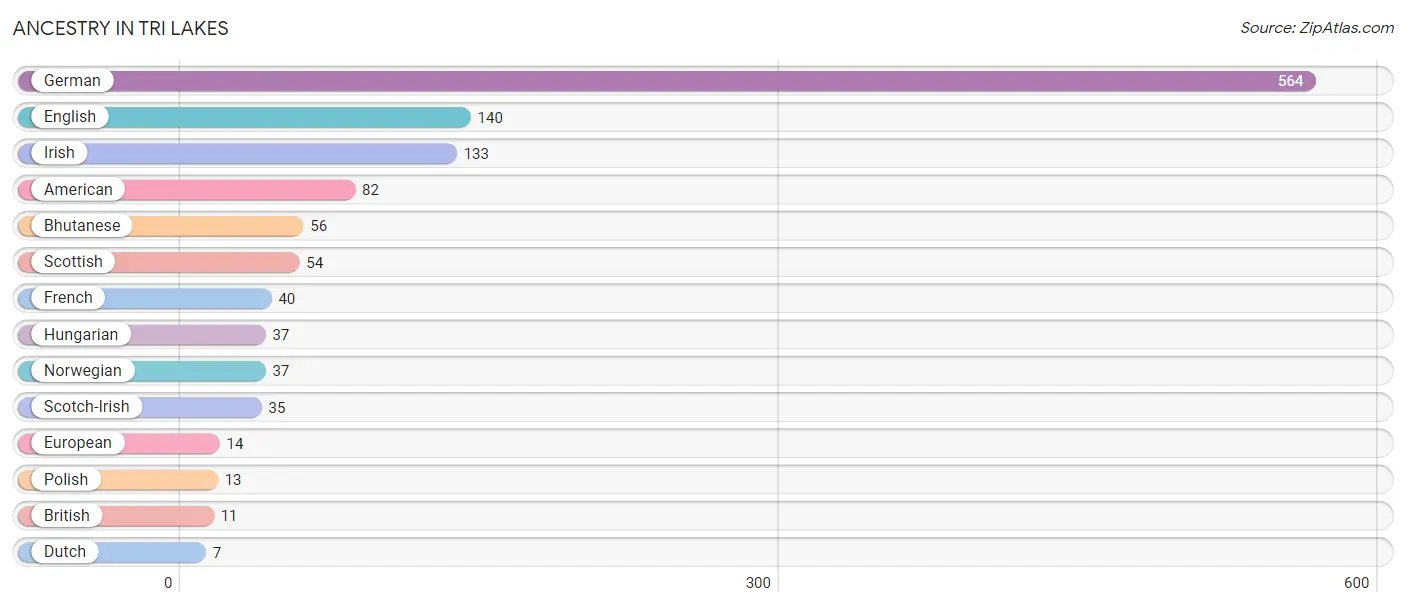
| Ancestry | # Population | % Population |
| American | 82 | 6.5% |
| Bhutanese | 56 | 4.4% |
| British | 11 | 0.9% |
| Dutch | 7 | 0.6% |
| English | 140 | 11.1% |
| European | 14 | 1.1% |
| French | 40 | 3.2% |
| German | 564 | 44.8% |
| Hungarian | 37 | 2.9% |
| Irish | 133 | 10.6% |
| Norwegian | 37 | 2.9% |
| Polish | 13 | 1.0% |
| Scotch-Irish | 35 | 2.8% |
| Scottish | 54 | 4.3% | View All 14 Rows |
Immigrants in Tri Lakes

| Immigration Origin | # Population | % Population | View All 0 Rows |
Sex and Age in Tri Lakes
Sex and Age in Tri Lakes
The most populous age groups in Tri Lakes are 55 to 59 Years (102 | 14.2%) for men and 60 to 64 Years (88 | 16.3%) for women.
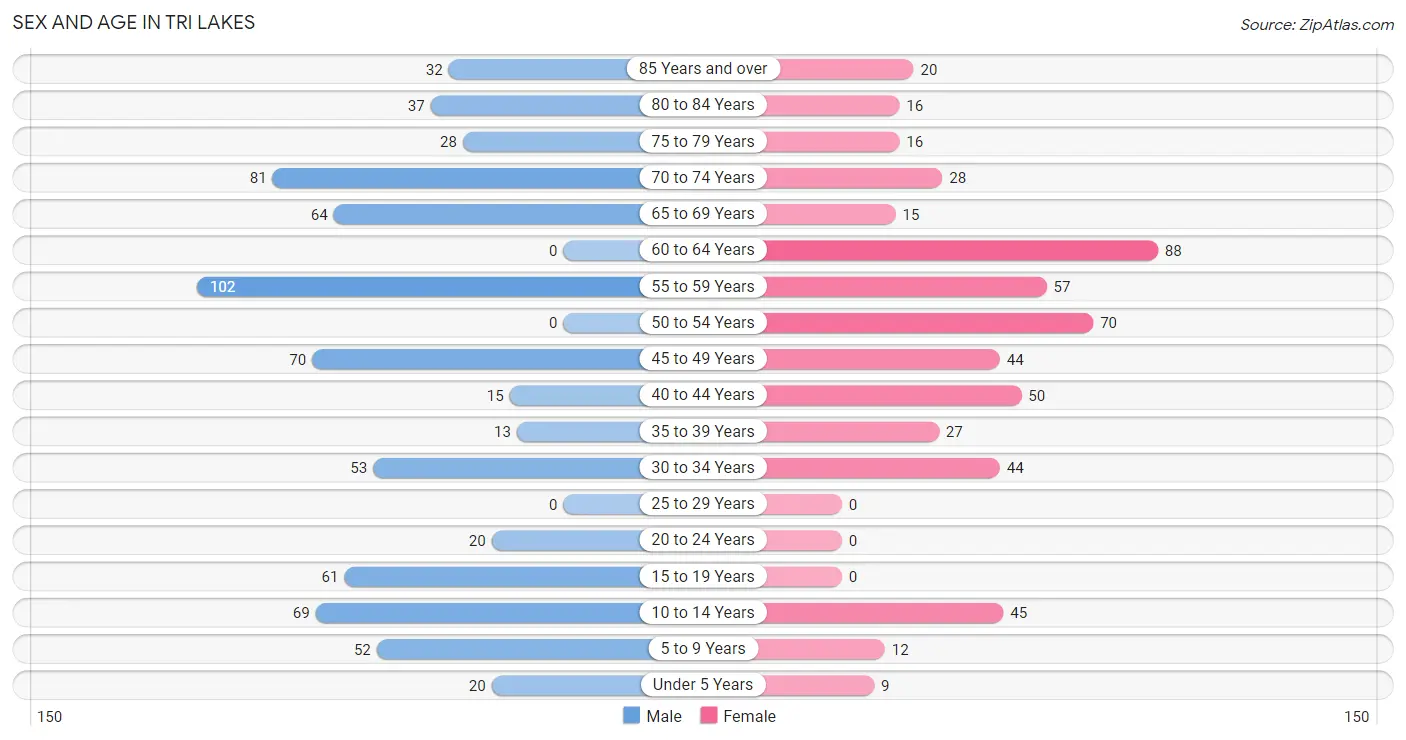
| Age Bracket | Male | Female |
| Under 5 Years | 20 (2.8%) | 9 (1.7%) |
| 5 to 9 Years | 52 (7.2%) | 12 (2.2%) |
| 10 to 14 Years | 69 (9.6%) | 45 (8.3%) |
| 15 to 19 Years | 61 (8.5%) | 0 (0.0%) |
| 20 to 24 Years | 20 (2.8%) | 0 (0.0%) |
| 25 to 29 Years | 0 (0.0%) | 0 (0.0%) |
| 30 to 34 Years | 53 (7.4%) | 44 (8.1%) |
| 35 to 39 Years | 13 (1.8%) | 27 (5.0%) |
| 40 to 44 Years | 15 (2.1%) | 50 (9.2%) |
| 45 to 49 Years | 70 (9.8%) | 44 (8.1%) |
| 50 to 54 Years | 0 (0.0%) | 70 (12.9%) |
| 55 to 59 Years | 102 (14.2%) | 57 (10.5%) |
| 60 to 64 Years | 0 (0.0%) | 88 (16.3%) |
| 65 to 69 Years | 64 (8.9%) | 15 (2.8%) |
| 70 to 74 Years | 81 (11.3%) | 28 (5.2%) |
| 75 to 79 Years | 28 (3.9%) | 16 (3.0%) |
| 80 to 84 Years | 37 (5.2%) | 16 (3.0%) |
| 85 Years and over | 32 (4.5%) | 20 (3.7%) |
| Total | 717 (100.0%) | 541 (100.0%) |
Families and Households in Tri Lakes
Median Family Size in Tri Lakes
The median family size in Tri Lakes is 2.64 persons per family, with married-couple families (330 | 82.5%) accounting for the largest median family size of 2.74 persons per family. On the other hand, single male/father families (37 | 9.2%) represent the smallest median family size with 1.89 persons per family.
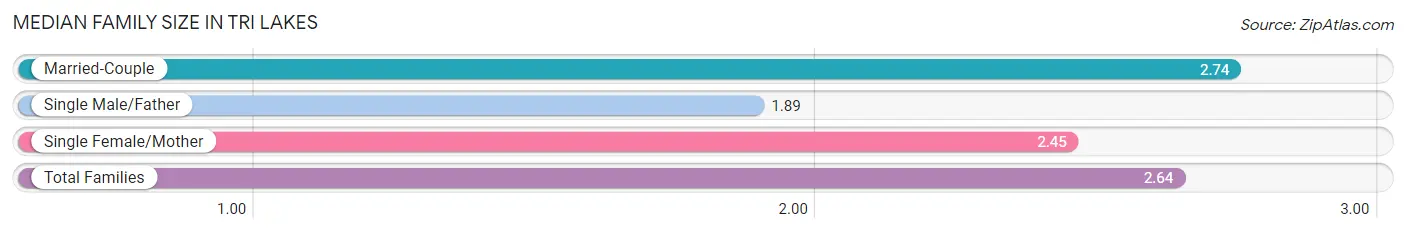
| Family Type | # Families | Family Size |
| Married-Couple | 330 (82.5%) | 2.74 |
| Single Male/Father | 37 (9.2%) | 1.89 |
| Single Female/Mother | 33 (8.3%) | 2.45 |
| Total Families | 400 (100.0%) | 2.64 |
Median Household Size in Tri Lakes
The median household size in Tri Lakes is 2.36 persons per household, with single female/mother households (33 | 6.2%) accounting for the largest median household size of 3 persons per household. non-family households (134 | 25.1%) represent the smallest median household size with 1.39 persons per household.
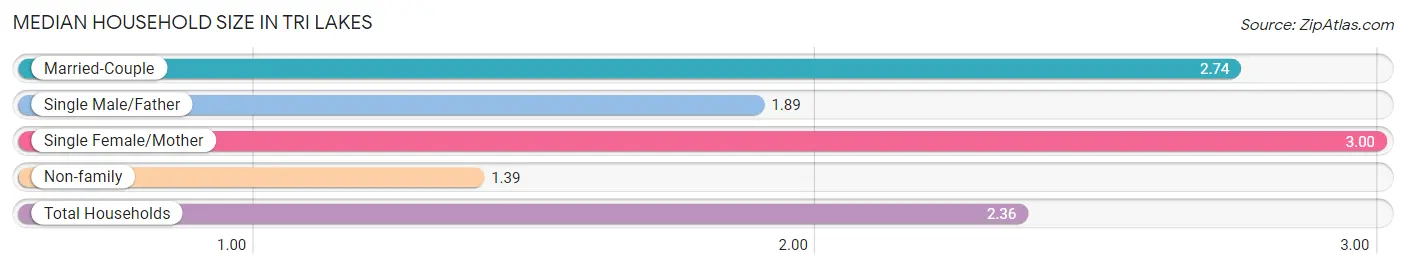
| Household Type | # Households | Household Size |
| Married-Couple | 330 (61.8%) | 2.74 |
| Single Male/Father | 37 (6.9%) | 1.89 |
| Single Female/Mother | 33 (6.2%) | 3.00 |
| Non-family | 134 (25.1%) | 1.39 |
| Total Households | 534 (100.0%) | 2.36 |
Household Size by Marriage Status in Tri Lakes
Out of a total of 534 households in Tri Lakes, 400 (74.9%) are family households, while 134 (25.1%) are nonfamily households. The most numerous type of family households are 2-person households, comprising 266, and the most common type of nonfamily households are 1-person households, comprising 102.
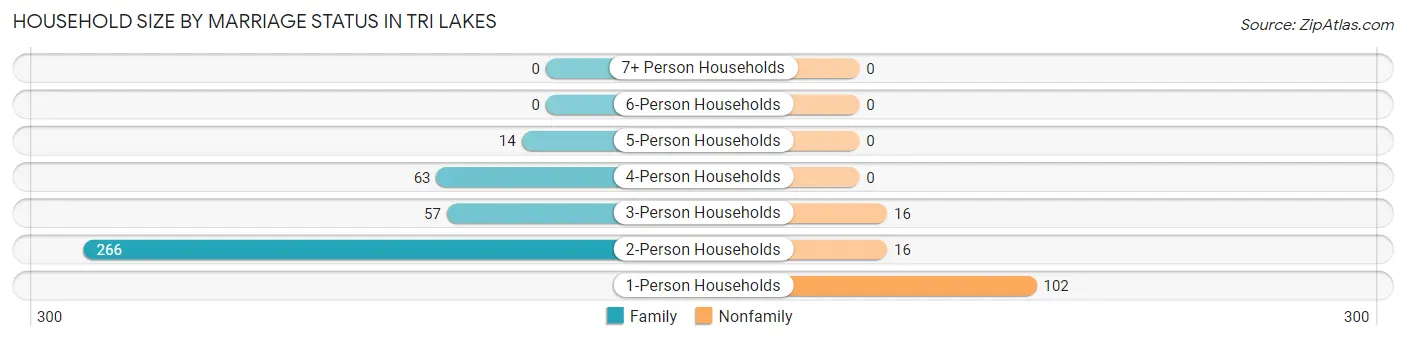
| Household Size | Family Households | Nonfamily Households |
| 1-Person Households | - | 102 (19.1%) |
| 2-Person Households | 266 (49.8%) | 16 (3.0%) |
| 3-Person Households | 57 (10.7%) | 16 (3.0%) |
| 4-Person Households | 63 (11.8%) | 0 (0.0%) |
| 5-Person Households | 14 (2.6%) | 0 (0.0%) |
| 6-Person Households | 0 (0.0%) | 0 (0.0%) |
| 7+ Person Households | 0 (0.0%) | 0 (0.0%) |
| Total | 400 (74.9%) | 134 (25.1%) |
Female Fertility in Tri Lakes
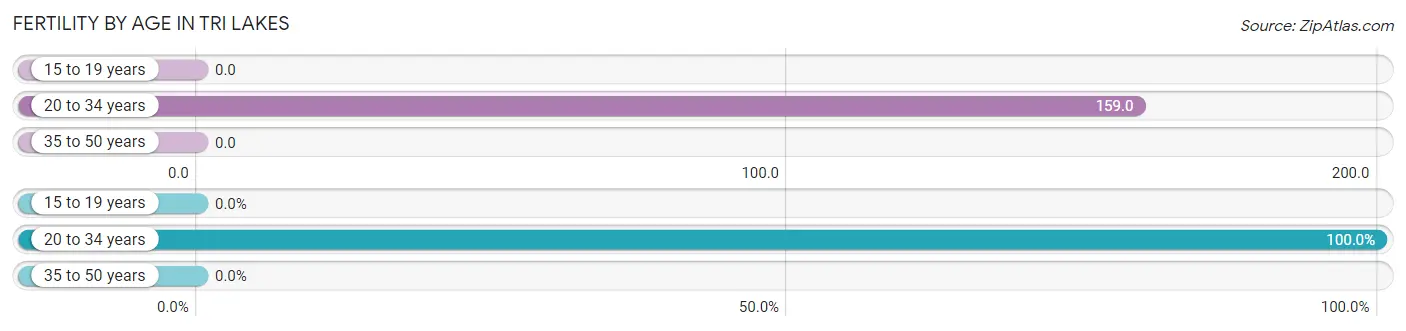
Fertility by Age in Tri Lakes
Average fertility rate in Tri Lakes is 42.0 births per 1,000 women. Women in the age bracket of 20 to 34 years have the highest fertility rate with 159.0 births per 1,000 women. Women in the age bracket of 20 to 34 years acount for 100.0% of all women with births.
| Age Bracket | Women with Births | Births / 1,000 Women |
| 15 to 19 years | 0 (0.0%) | 0.0 |
| 20 to 34 years | 7 (100.0%) | 159.0 |
| 35 to 50 years | 0 (0.0%) | 0.0 |
| Total | 7 (100.0%) | 42.0 |
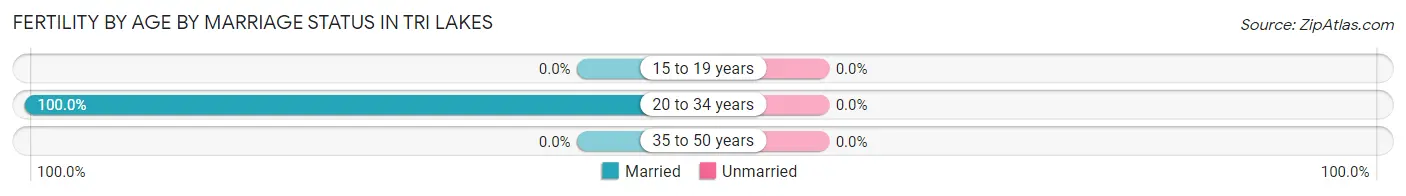
Fertility by Age by Marriage Status in Tri Lakes
| Age Bracket | Married | Unmarried |
| 15 to 19 years | 0 (0.0%) | 0 (0.0%) |
| 20 to 34 years | 7 (100.0%) | 0 (0.0%) |
| 35 to 50 years | 0 (0.0%) | 0 (0.0%) |
| Total | 7 (100.0%) | 0 (0.0%) |
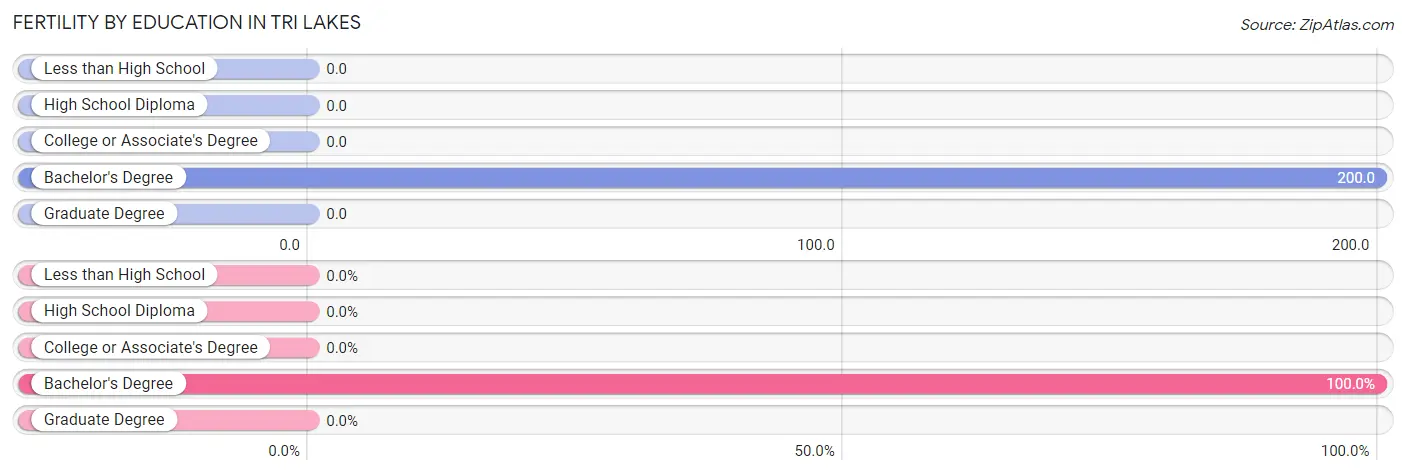
Fertility by Education in Tri Lakes
| Educational Attainment | Women with Births | Births / 1,000 Women |
| Less than High School | 0 (0.0%) | 0.0 |
| High School Diploma | 0 (0.0%) | 0.0 |
| College or Associate's Degree | 0 (0.0%) | 0.0 |
| Bachelor's Degree | 7 (100.0%) | 200.0 |
| Graduate Degree | 0 (0.0%) | 0.0 |
| Total | 7 (100.0%) | 42.0 |
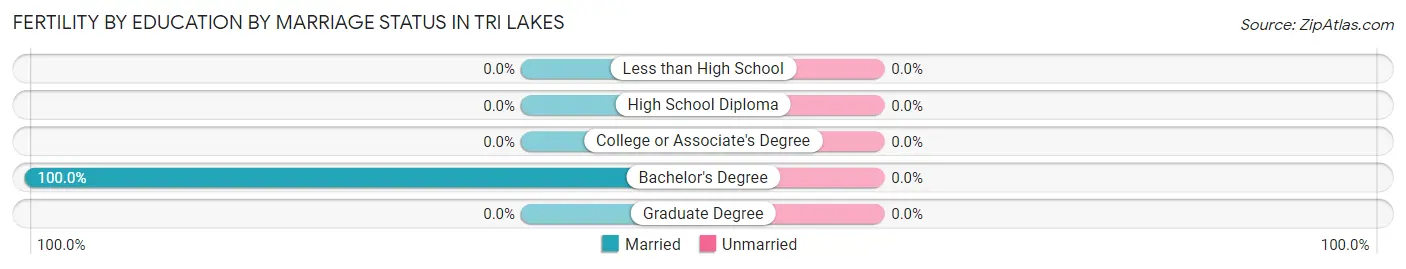
Fertility by Education by Marriage Status in Tri Lakes
| Educational Attainment | Married | Unmarried |
| Less than High School | 0 (0.0%) | 0 (0.0%) |
| High School Diploma | 0 (0.0%) | 0 (0.0%) |
| College or Associate's Degree | 0 (0.0%) | 0 (0.0%) |
| Bachelor's Degree | 7 (100.0%) | 0 (0.0%) |
| Graduate Degree | 0 (0.0%) | 0 (0.0%) |
| Total | 7 (100.0%) | 0 (0.0%) |
Employment Characteristics in Tri Lakes
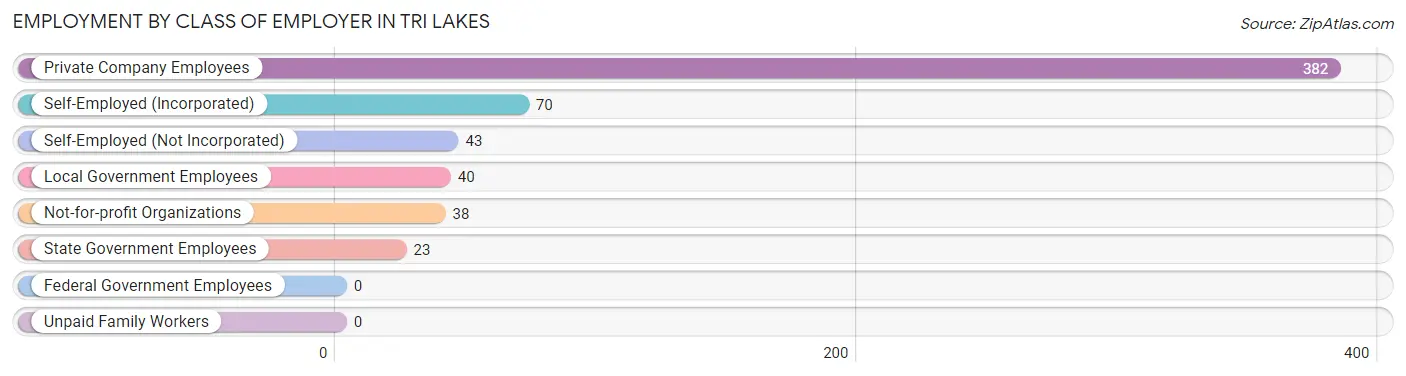
Employment by Class of Employer in Tri Lakes
Among the 596 employed individuals in Tri Lakes, private company employees (382 | 64.1%), self-employed (incorporated) (70 | 11.7%), and self-employed (not incorporated) (43 | 7.2%) make up the most common classes of employment.
| Employer Class | # Employees | % Employees |
| Private Company Employees | 382 | 64.1% |
| Self-Employed (Incorporated) | 70 | 11.7% |
| Self-Employed (Not Incorporated) | 43 | 7.2% |
| Not-for-profit Organizations | 38 | 6.4% |
| Local Government Employees | 40 | 6.7% |
| State Government Employees | 23 | 3.9% |
| Federal Government Employees | 0 | 0.0% |
| Unpaid Family Workers | 0 | 0.0% |
| Total | 596 | 100.0% |
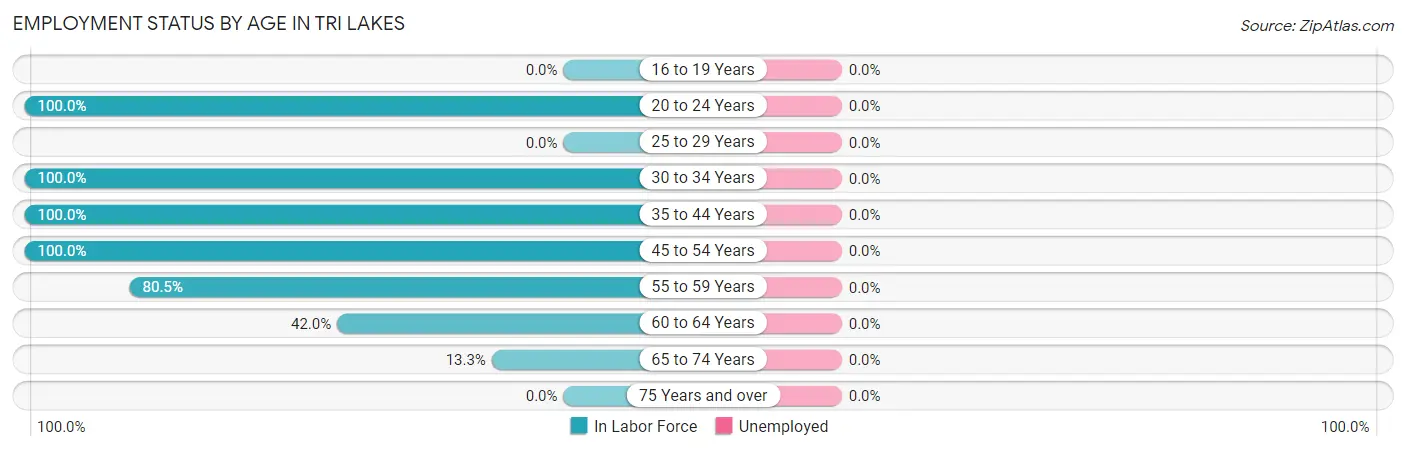
Employment Status by Age in Tri Lakes
| Age Bracket | In Labor Force | Unemployed |
| 16 to 19 Years | 0 (0.0%) | 0 (0.0%) |
| 20 to 24 Years | 20 (100.0%) | 0 (0.0%) |
| 25 to 29 Years | 0 (0.0%) | 0 (0.0%) |
| 30 to 34 Years | 97 (100.0%) | 0 (0.0%) |
| 35 to 44 Years | 105 (100.0%) | 0 (0.0%) |
| 45 to 54 Years | 184 (100.0%) | 0 (0.0%) |
| 55 to 59 Years | 128 (80.5%) | 0 (0.0%) |
| 60 to 64 Years | 37 (42.0%) | 0 (0.0%) |
| 65 to 74 Years | 25 (13.3%) | 0 (0.0%) |
| 75 Years and over | 0 (0.0%) | 0 (0.0%) |
| Total | 596 (58.9%) | 0 (0.0%) |
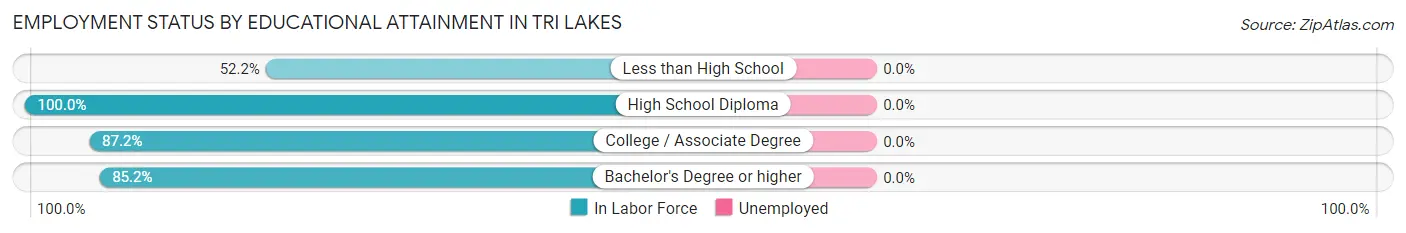
Employment Status by Educational Attainment in Tri Lakes
| Educational Attainment | In Labor Force | Unemployed |
| Less than High School | 12 (52.2%) | 0 (0.0%) |
| High School Diploma | 91 (100.0%) | 0 (0.0%) |
| College / Associate Degree | 258 (87.2%) | 0 (0.0%) |
| Bachelor's Degree or higher | 190 (85.2%) | 0 (0.0%) |
| Total | 551 (87.0%) | 0 (0.0%) |
Employment Occupations by Sex in Tri Lakes
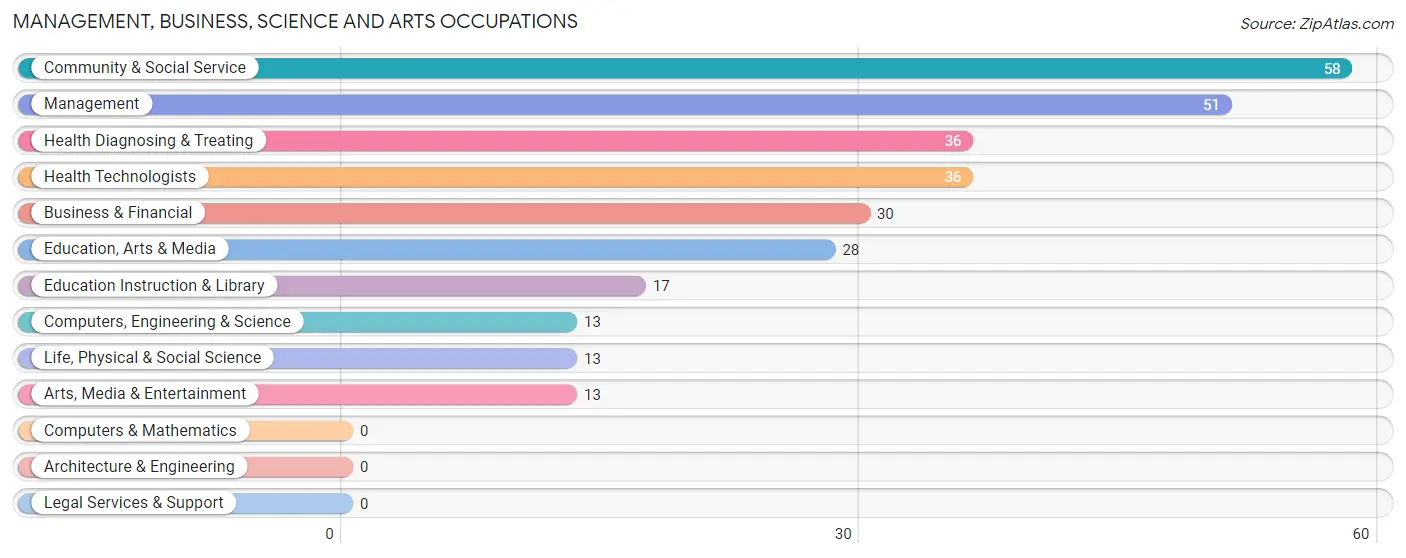
Management, Business, Science and Arts Occupations
The most common Management, Business, Science and Arts occupations in Tri Lakes are Community & Social Service (58 | 9.7%), Management (51 | 8.6%), Health Diagnosing & Treating (36 | 6.0%), Health Technologists (36 | 6.0%), and Business & Financial (30 | 5.0%).
Management, Business, Science and Arts Occupations by Sex
Within the Management, Business, Science and Arts occupations in Tri Lakes, the most male-oriented occupations are Management (100.0%), Business & Financial (100.0%), and Computers, Engineering & Science (100.0%), while the most female-oriented occupations are Education, Arts & Media (100.0%), Arts, Media & Entertainment (100.0%), and Health Diagnosing & Treating (100.0%).
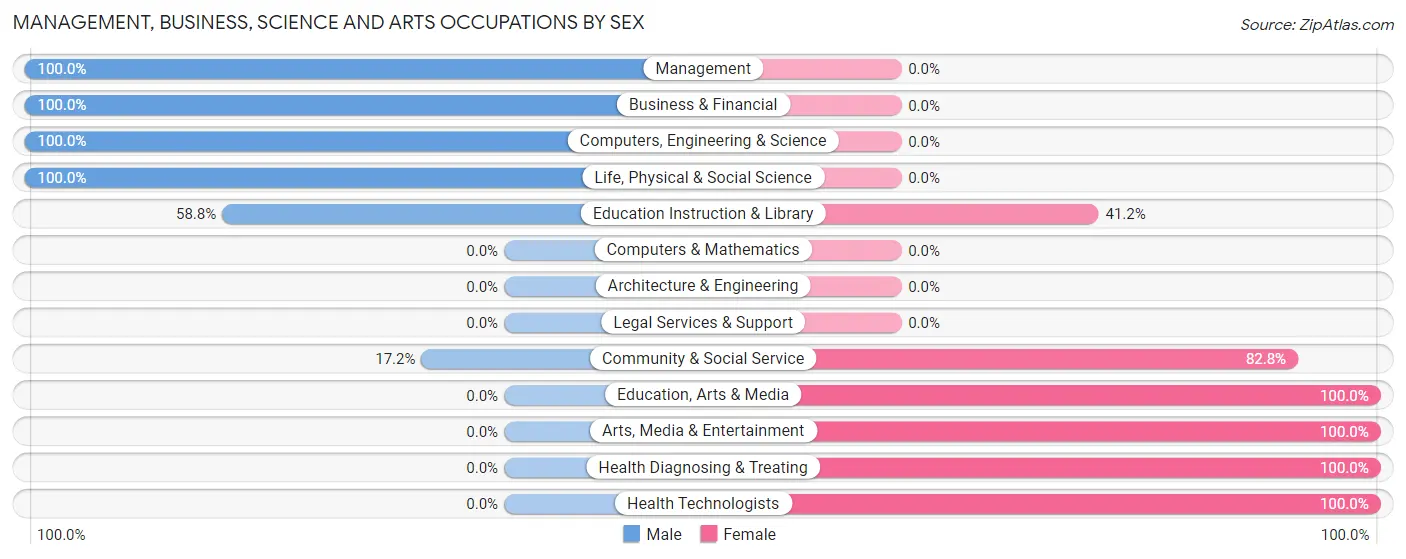
| Occupation | Male | Female |
| Management | 51 (100.0%) | 0 (0.0%) |
| Business & Financial | 30 (100.0%) | 0 (0.0%) |
| Computers, Engineering & Science | 13 (100.0%) | 0 (0.0%) |
| Computers & Mathematics | 0 (0.0%) | 0 (0.0%) |
| Architecture & Engineering | 0 (0.0%) | 0 (0.0%) |
| Life, Physical & Social Science | 13 (100.0%) | 0 (0.0%) |
| Community & Social Service | 10 (17.2%) | 48 (82.8%) |
| Education, Arts & Media | 0 (0.0%) | 28 (100.0%) |
| Legal Services & Support | 0 (0.0%) | 0 (0.0%) |
| Education Instruction & Library | 10 (58.8%) | 7 (41.2%) |
| Arts, Media & Entertainment | 0 (0.0%) | 13 (100.0%) |
| Health Diagnosing & Treating | 0 (0.0%) | 36 (100.0%) |
| Health Technologists | 0 (0.0%) | 36 (100.0%) |
| Total (Category) | 104 (55.3%) | 84 (44.7%) |
| Total (Overall) | 298 (50.0%) | 298 (50.0%) |
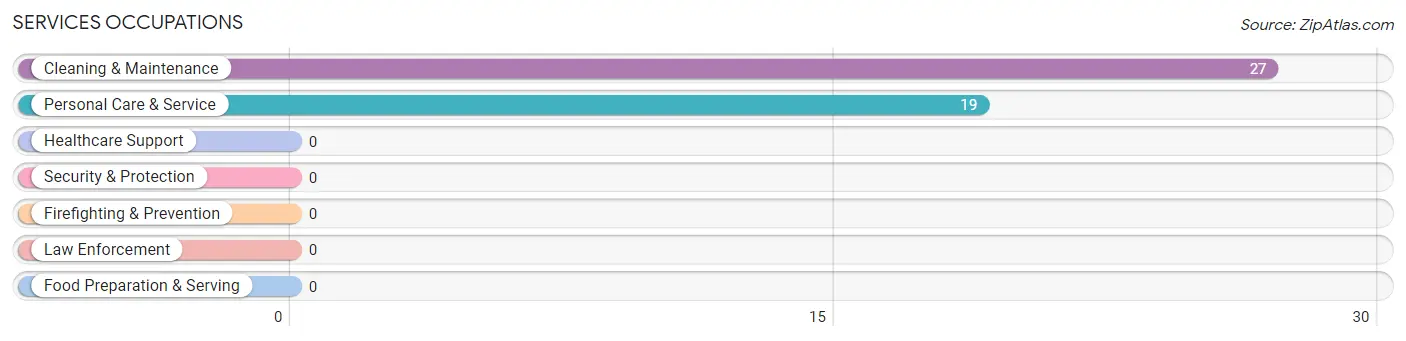
Services Occupations
The most common Services occupations in Tri Lakes are Cleaning & Maintenance (27 | 4.5%), and Personal Care & Service (19 | 3.2%).
Services Occupations by Sex
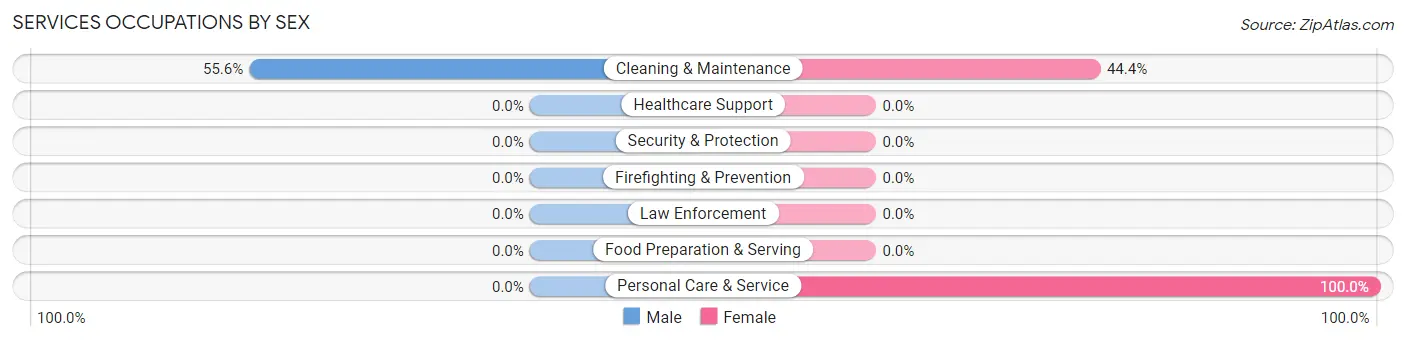
| Occupation | Male | Female |
| Healthcare Support | 0 (0.0%) | 0 (0.0%) |
| Security & Protection | 0 (0.0%) | 0 (0.0%) |
| Firefighting & Prevention | 0 (0.0%) | 0 (0.0%) |
| Law Enforcement | 0 (0.0%) | 0 (0.0%) |
| Food Preparation & Serving | 0 (0.0%) | 0 (0.0%) |
| Cleaning & Maintenance | 15 (55.6%) | 12 (44.4%) |
| Personal Care & Service | 0 (0.0%) | 19 (100.0%) |
| Total (Category) | 15 (32.6%) | 31 (67.4%) |
| Total (Overall) | 298 (50.0%) | 298 (50.0%) |
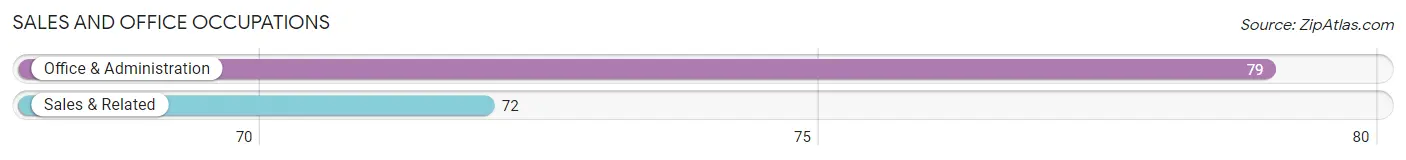
Sales and Office Occupations
The most common Sales and Office occupations in Tri Lakes are Office & Administration (79 | 13.3%), and Sales & Related (72 | 12.1%).
Sales and Office Occupations by Sex
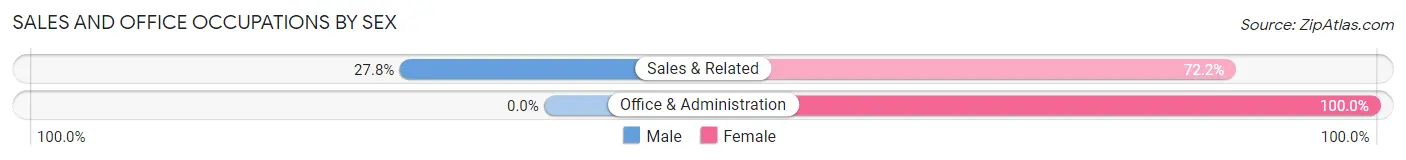
| Occupation | Male | Female |
| Sales & Related | 20 (27.8%) | 52 (72.2%) |
| Office & Administration | 0 (0.0%) | 79 (100.0%) |
| Total (Category) | 20 (13.3%) | 131 (86.8%) |
| Total (Overall) | 298 (50.0%) | 298 (50.0%) |
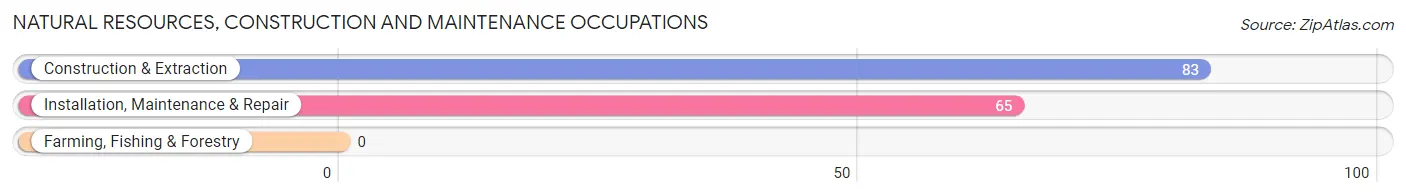
Natural Resources, Construction and Maintenance Occupations
The most common Natural Resources, Construction and Maintenance occupations in Tri Lakes are Construction & Extraction (83 | 13.9%), and Installation, Maintenance & Repair (65 | 10.9%).
Natural Resources, Construction and Maintenance Occupations by Sex
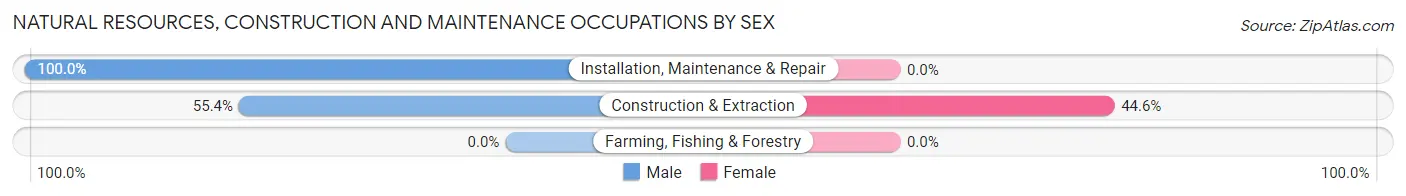
| Occupation | Male | Female |
| Farming, Fishing & Forestry | 0 (0.0%) | 0 (0.0%) |
| Construction & Extraction | 46 (55.4%) | 37 (44.6%) |
| Installation, Maintenance & Repair | 65 (100.0%) | 0 (0.0%) |
| Total (Category) | 111 (75.0%) | 37 (25.0%) |
| Total (Overall) | 298 (50.0%) | 298 (50.0%) |
Production, Transportation and Moving Occupations
The most common Production, Transportation and Moving occupations in Tri Lakes are Production (43 | 7.2%), and Material Moving (20 | 3.4%).
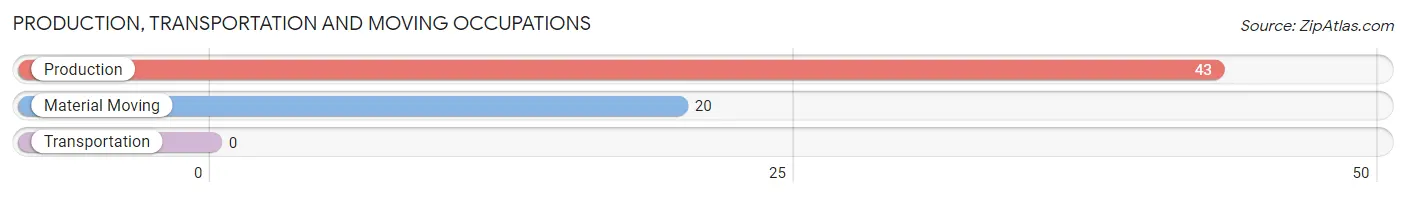
Production, Transportation and Moving Occupations by Sex
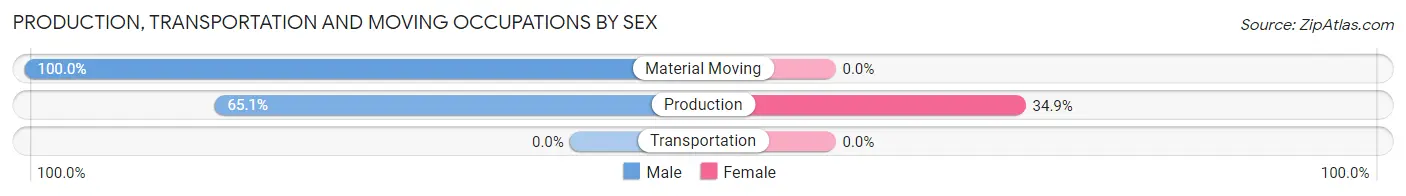
| Occupation | Male | Female |
| Production | 28 (65.1%) | 15 (34.9%) |
| Transportation | 0 (0.0%) | 0 (0.0%) |
| Material Moving | 20 (100.0%) | 0 (0.0%) |
| Total (Category) | 48 (76.2%) | 15 (23.8%) |
| Total (Overall) | 298 (50.0%) | 298 (50.0%) |
Employment Industries by Sex in Tri Lakes
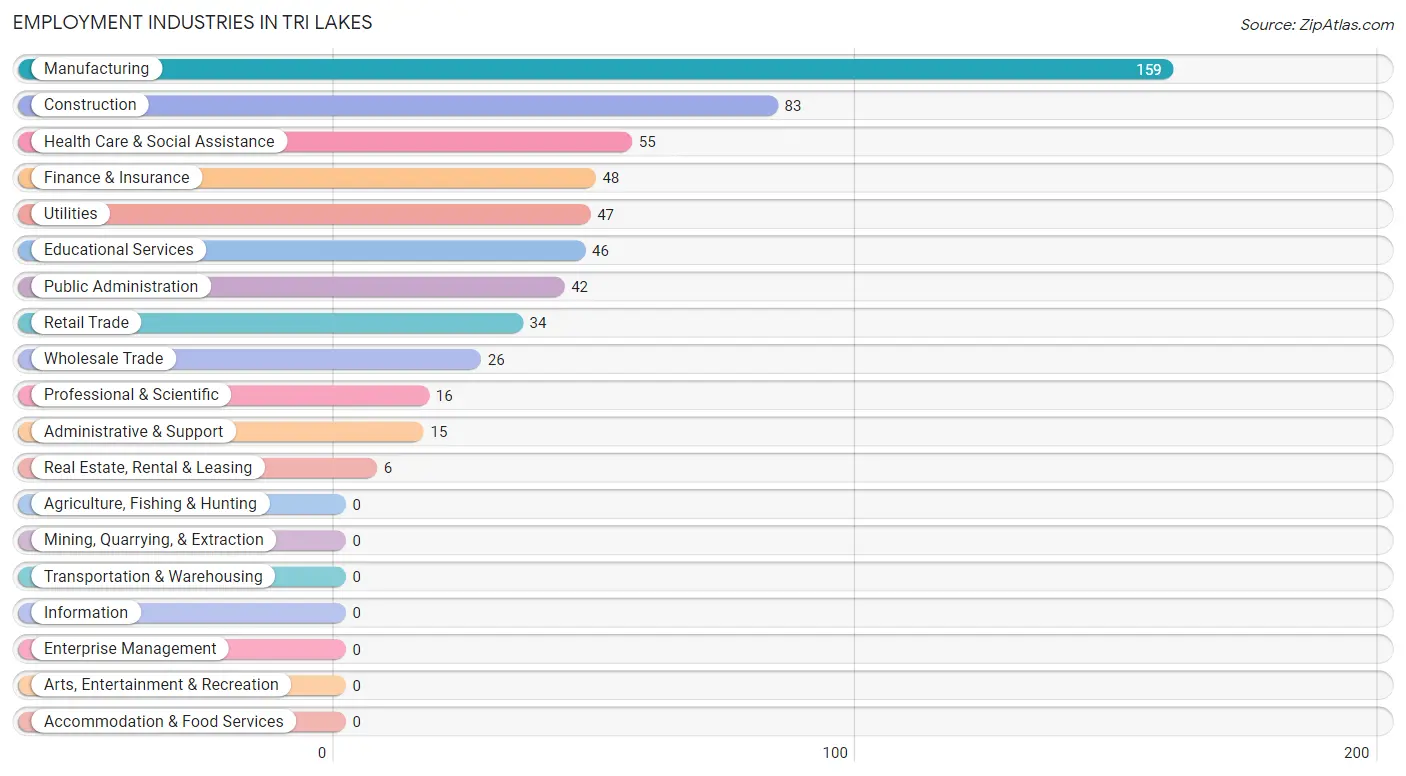
Employment Industries in Tri Lakes
The major employment industries in Tri Lakes include Manufacturing (159 | 26.7%), Construction (83 | 13.9%), Health Care & Social Assistance (55 | 9.2%), Finance & Insurance (48 | 8.1%), and Utilities (47 | 7.9%).
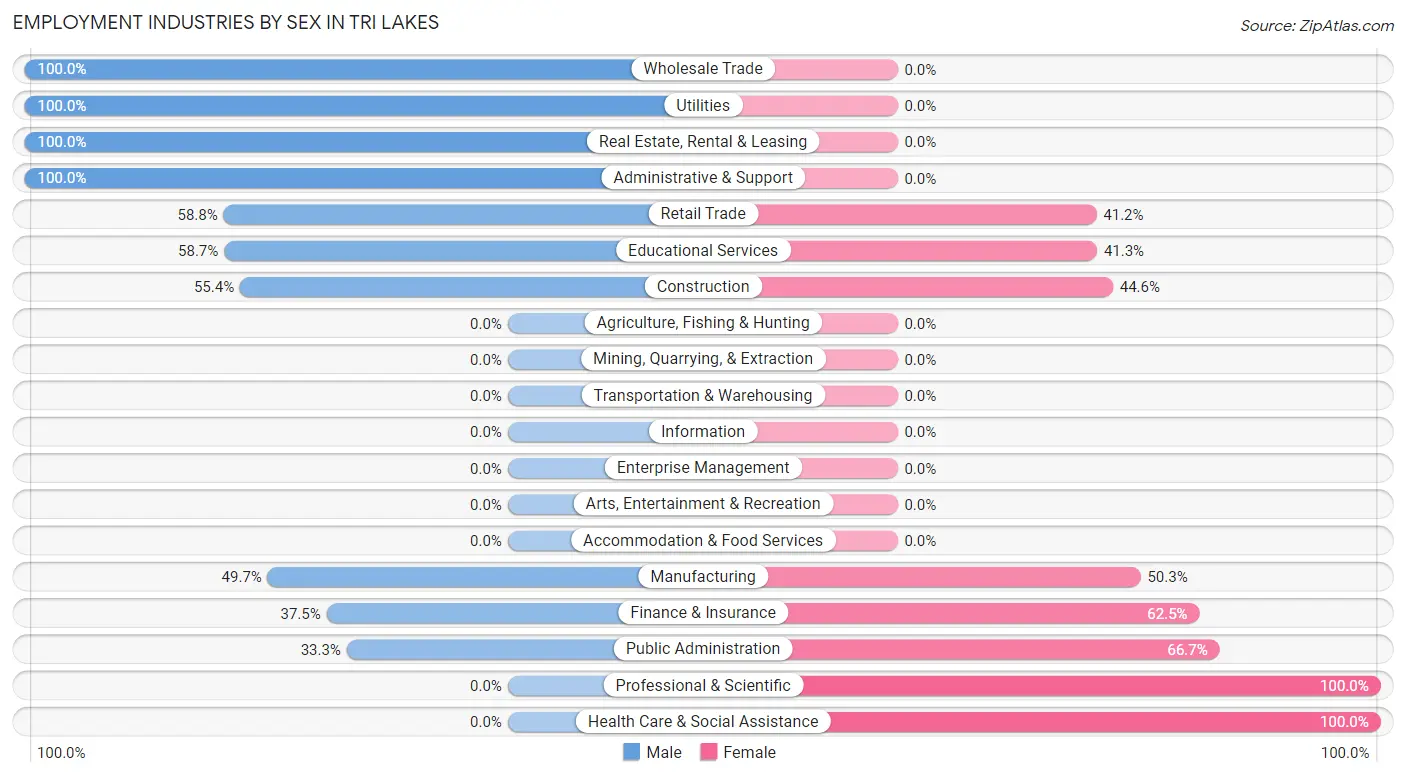
Employment Industries by Sex in Tri Lakes
The Tri Lakes industries that see more men than women are Wholesale Trade (100.0%), Utilities (100.0%), and Real Estate, Rental & Leasing (100.0%), whereas the industries that tend to have a higher number of women are Professional & Scientific (100.0%), Health Care & Social Assistance (100.0%), and Public Administration (66.7%).
| Industry | Male | Female |
| Agriculture, Fishing & Hunting | 0 (0.0%) | 0 (0.0%) |
| Mining, Quarrying, & Extraction | 0 (0.0%) | 0 (0.0%) |
| Construction | 46 (55.4%) | 37 (44.6%) |
| Manufacturing | 79 (49.7%) | 80 (50.3%) |
| Wholesale Trade | 26 (100.0%) | 0 (0.0%) |
| Retail Trade | 20 (58.8%) | 14 (41.2%) |
| Transportation & Warehousing | 0 (0.0%) | 0 (0.0%) |
| Utilities | 47 (100.0%) | 0 (0.0%) |
| Information | 0 (0.0%) | 0 (0.0%) |
| Finance & Insurance | 18 (37.5%) | 30 (62.5%) |
| Real Estate, Rental & Leasing | 6 (100.0%) | 0 (0.0%) |
| Professional & Scientific | 0 (0.0%) | 16 (100.0%) |
| Enterprise Management | 0 (0.0%) | 0 (0.0%) |
| Administrative & Support | 15 (100.0%) | 0 (0.0%) |
| Educational Services | 27 (58.7%) | 19 (41.3%) |
| Health Care & Social Assistance | 0 (0.0%) | 55 (100.0%) |
| Arts, Entertainment & Recreation | 0 (0.0%) | 0 (0.0%) |
| Accommodation & Food Services | 0 (0.0%) | 0 (0.0%) |
| Public Administration | 14 (33.3%) | 28 (66.7%) |
| Total | 298 (50.0%) | 298 (50.0%) |
Education in Tri Lakes
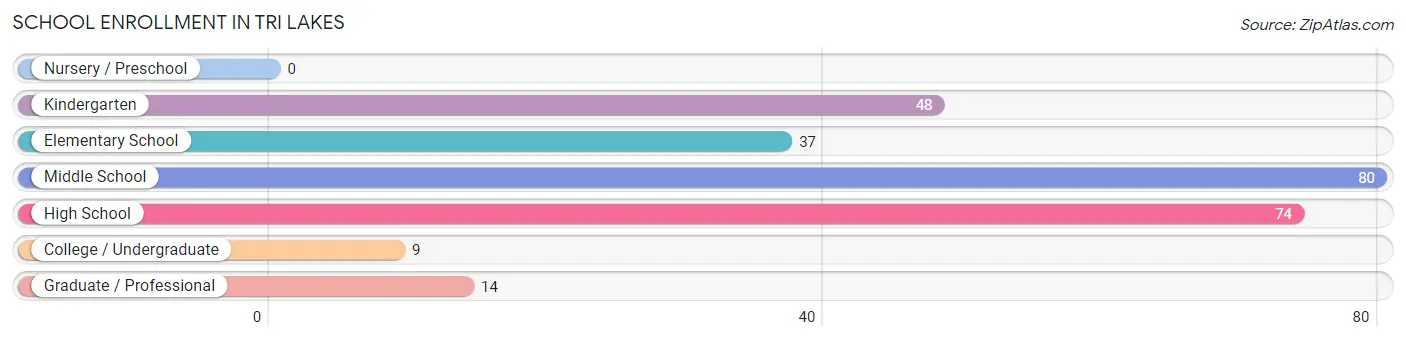
School Enrollment in Tri Lakes
The most common levels of schooling among the 262 students in Tri Lakes are middle school (80 | 30.5%), high school (74 | 28.2%), and kindergarten (48 | 18.3%).
| School Level | # Students | % Students |
| Nursery / Preschool | 0 | 0.0% |
| Kindergarten | 48 | 18.3% |
| Elementary School | 37 | 14.1% |
| Middle School | 80 | 30.5% |
| High School | 74 | 28.2% |
| College / Undergraduate | 9 | 3.4% |
| Graduate / Professional | 14 | 5.3% |
| Total | 262 | 100.0% |
School Enrollment by Age by Funding Source in Tri Lakes
Out of a total of 262 students who are enrolled in schools in Tri Lakes, 16 (6.1%) attend a private institution, while the remaining 246 (93.9%) are enrolled in public schools. The age group of 5 to 9 year old has the highest likelihood of being enrolled in private schools, with 16 (25.0% in the age bracket) enrolled. Conversely, the age group of 10 to 14 year olds has the lowest likelihood of being enrolled in a private school, with 114 (100.0% in the age bracket) attending a public institution.
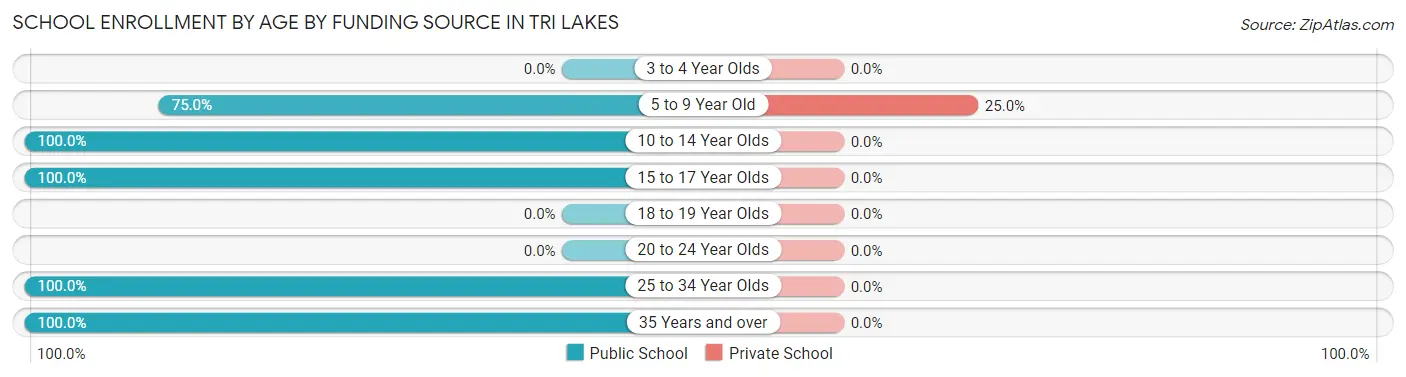
| Age Bracket | Public School | Private School |
| 3 to 4 Year Olds | 0 (0.0%) | 0 (0.0%) |
| 5 to 9 Year Old | 48 (75.0%) | 16 (25.0%) |
| 10 to 14 Year Olds | 114 (100.0%) | 0 (0.0%) |
| 15 to 17 Year Olds | 61 (100.0%) | 0 (0.0%) |
| 18 to 19 Year Olds | 0 (0.0%) | 0 (0.0%) |
| 20 to 24 Year Olds | 0 (0.0%) | 0 (0.0%) |
| 25 to 34 Year Olds | 9 (100.0%) | 0 (0.0%) |
| 35 Years and over | 14 (100.0%) | 0 (0.0%) |
| Total | 246 (93.9%) | 16 (6.1%) |
Educational Attainment by Field of Study in Tri Lakes
Business (136 | 40.4%), education (88 | 26.1%), science & technology (37 | 11.0%), social sciences (34 | 10.1%), and bio, nature & agricultural (15 | 4.4%) are the most common fields of study among 337 individuals in Tri Lakes who have obtained a bachelor's degree or higher.
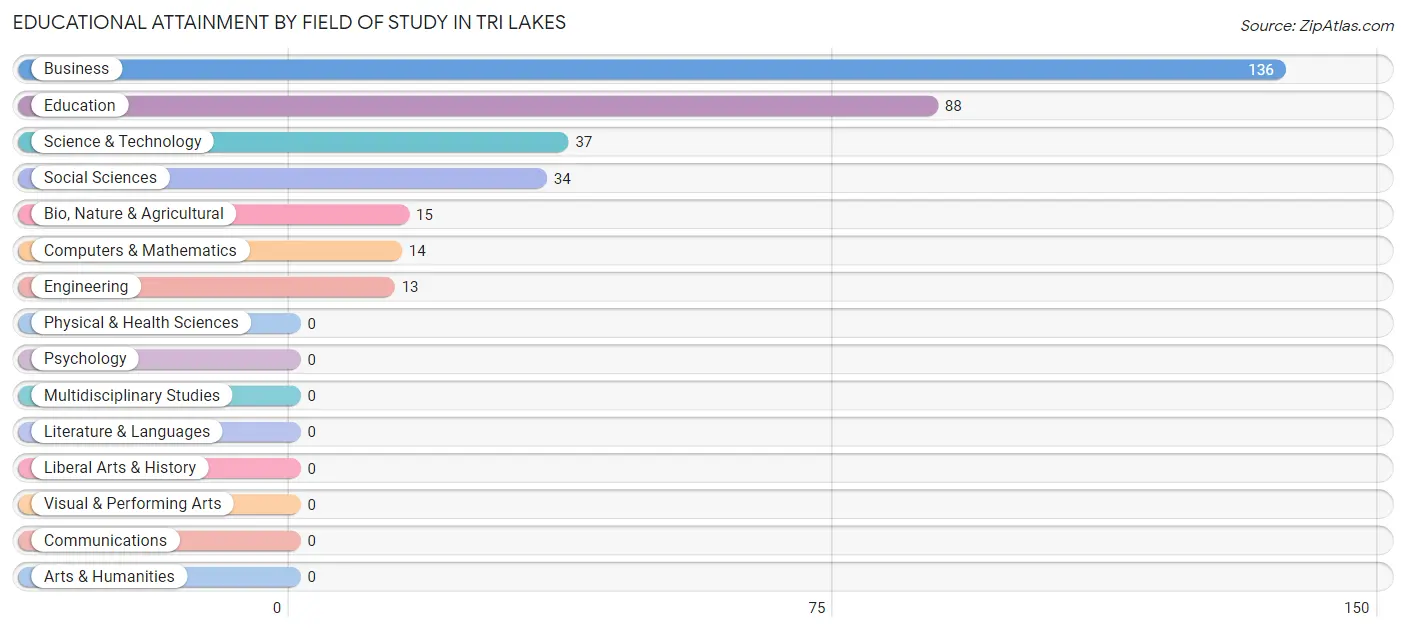
| Field of Study | # Graduates | % Graduates |
| Computers & Mathematics | 14 | 4.2% |
| Bio, Nature & Agricultural | 15 | 4.4% |
| Physical & Health Sciences | 0 | 0.0% |
| Psychology | 0 | 0.0% |
| Social Sciences | 34 | 10.1% |
| Engineering | 13 | 3.9% |
| Multidisciplinary Studies | 0 | 0.0% |
| Science & Technology | 37 | 11.0% |
| Business | 136 | 40.4% |
| Education | 88 | 26.1% |
| Literature & Languages | 0 | 0.0% |
| Liberal Arts & History | 0 | 0.0% |
| Visual & Performing Arts | 0 | 0.0% |
| Communications | 0 | 0.0% |
| Arts & Humanities | 0 | 0.0% |
| Total | 337 | 100.0% |
Transportation & Commute in Tri Lakes
Vehicle Availability by Sex in Tri Lakes
The most prevalent vehicle ownership categories in Tri Lakes are males with 2 vehicles (152, accounting for 51.0%) and females with 2 vehicles (174, making up 51.0%).
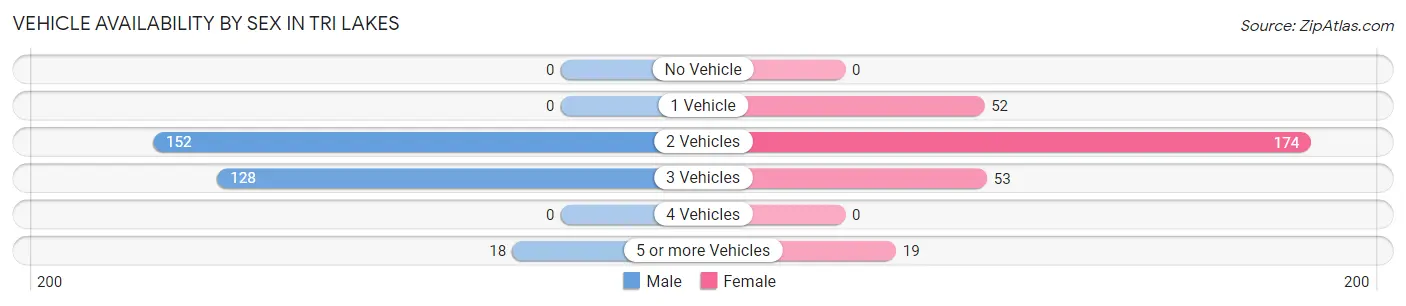
| Vehicles Available | Male | Female |
| No Vehicle | 0 (0.0%) | 0 (0.0%) |
| 1 Vehicle | 0 (0.0%) | 52 (17.4%) |
| 2 Vehicles | 152 (51.0%) | 174 (58.4%) |
| 3 Vehicles | 128 (42.9%) | 53 (17.8%) |
| 4 Vehicles | 0 (0.0%) | 0 (0.0%) |
| 5 or more Vehicles | 18 (6.0%) | 19 (6.4%) |
| Total | 298 (100.0%) | 298 (100.0%) |
Commute Time in Tri Lakes
The most frequently occuring commute durations in Tri Lakes are 15 to 19 minutes (126 commuters, 22.2%), 25 to 29 minutes (116 commuters, 20.5%), and 40 to 44 minutes (61 commuters, 10.8%).
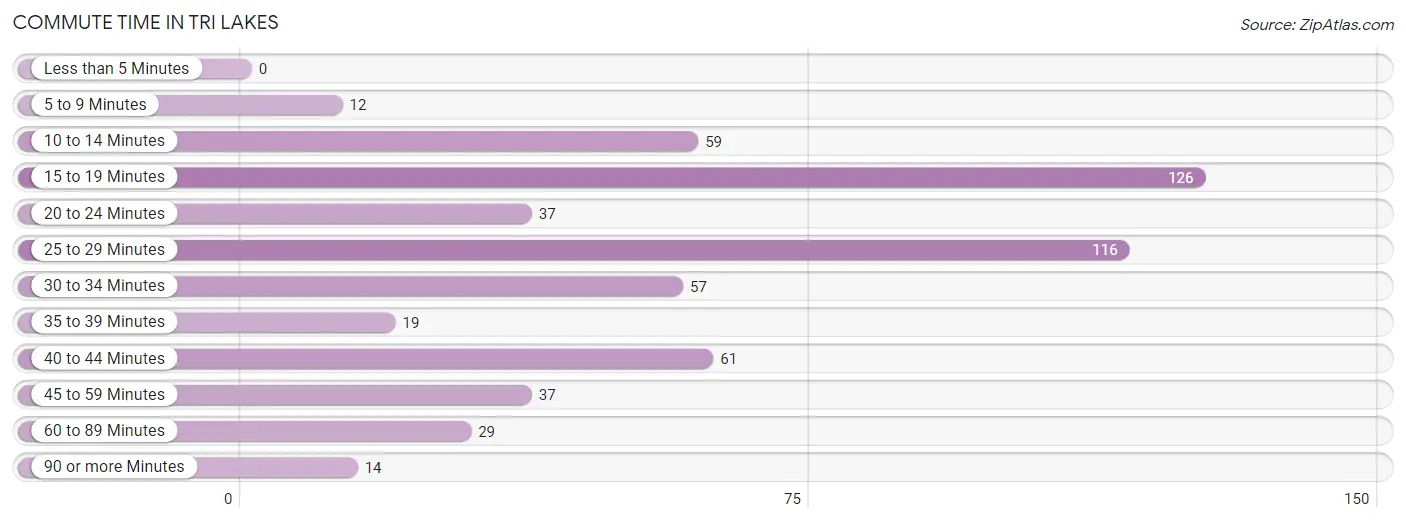
| Commute Time | # Commuters | % Commuters |
| Less than 5 Minutes | 0 | 0.0% |
| 5 to 9 Minutes | 12 | 2.1% |
| 10 to 14 Minutes | 59 | 10.4% |
| 15 to 19 Minutes | 126 | 22.2% |
| 20 to 24 Minutes | 37 | 6.5% |
| 25 to 29 Minutes | 116 | 20.5% |
| 30 to 34 Minutes | 57 | 10.1% |
| 35 to 39 Minutes | 19 | 3.4% |
| 40 to 44 Minutes | 61 | 10.8% |
| 45 to 59 Minutes | 37 | 6.5% |
| 60 to 89 Minutes | 29 | 5.1% |
| 90 or more Minutes | 14 | 2.5% |
Commute Time by Sex in Tri Lakes
The most common commute times in Tri Lakes are 15 to 19 minutes (71 commuters, 24.9%) for males and 15 to 19 minutes (55 commuters, 19.5%) for females.
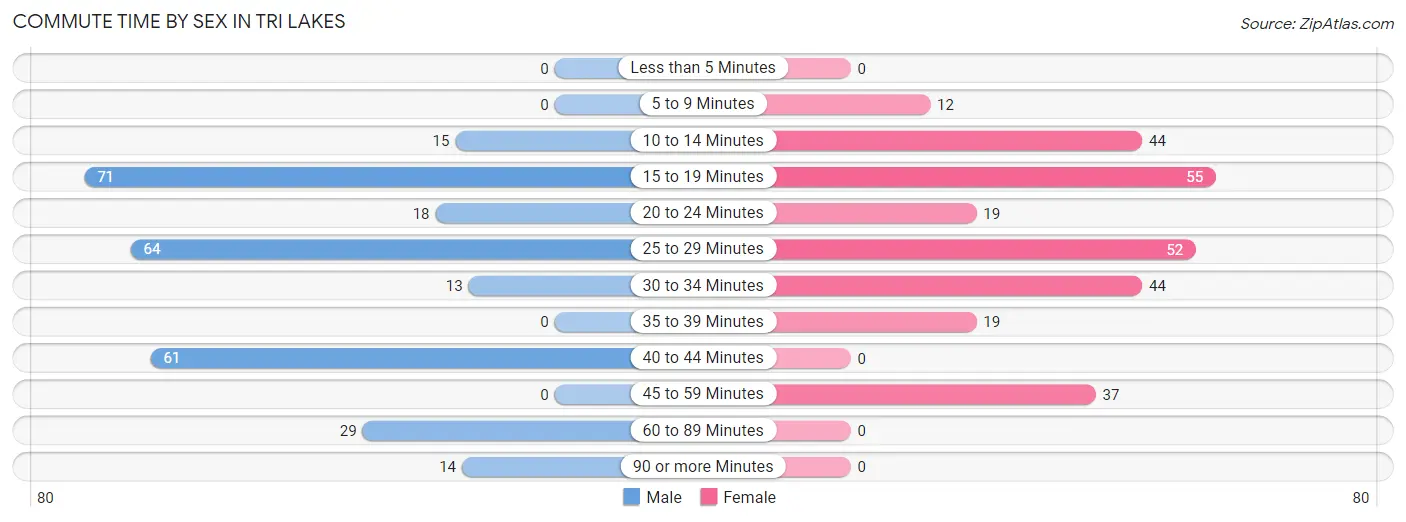
| Commute Time | Male | Female |
| Less than 5 Minutes | 0 (0.0%) | 0 (0.0%) |
| 5 to 9 Minutes | 0 (0.0%) | 12 (4.3%) |
| 10 to 14 Minutes | 15 (5.3%) | 44 (15.6%) |
| 15 to 19 Minutes | 71 (24.9%) | 55 (19.5%) |
| 20 to 24 Minutes | 18 (6.3%) | 19 (6.7%) |
| 25 to 29 Minutes | 64 (22.5%) | 52 (18.4%) |
| 30 to 34 Minutes | 13 (4.6%) | 44 (15.6%) |
| 35 to 39 Minutes | 0 (0.0%) | 19 (6.7%) |
| 40 to 44 Minutes | 61 (21.4%) | 0 (0.0%) |
| 45 to 59 Minutes | 0 (0.0%) | 37 (13.1%) |
| 60 to 89 Minutes | 29 (10.2%) | 0 (0.0%) |
| 90 or more Minutes | 14 (4.9%) | 0 (0.0%) |
Time of Departure to Work by Sex in Tri Lakes
The most frequent times of departure to work in Tri Lakes are 6:30 AM to 6:59 AM (66, 23.2%) for males and 7:00 AM to 7:29 AM (108, 38.3%) for females.
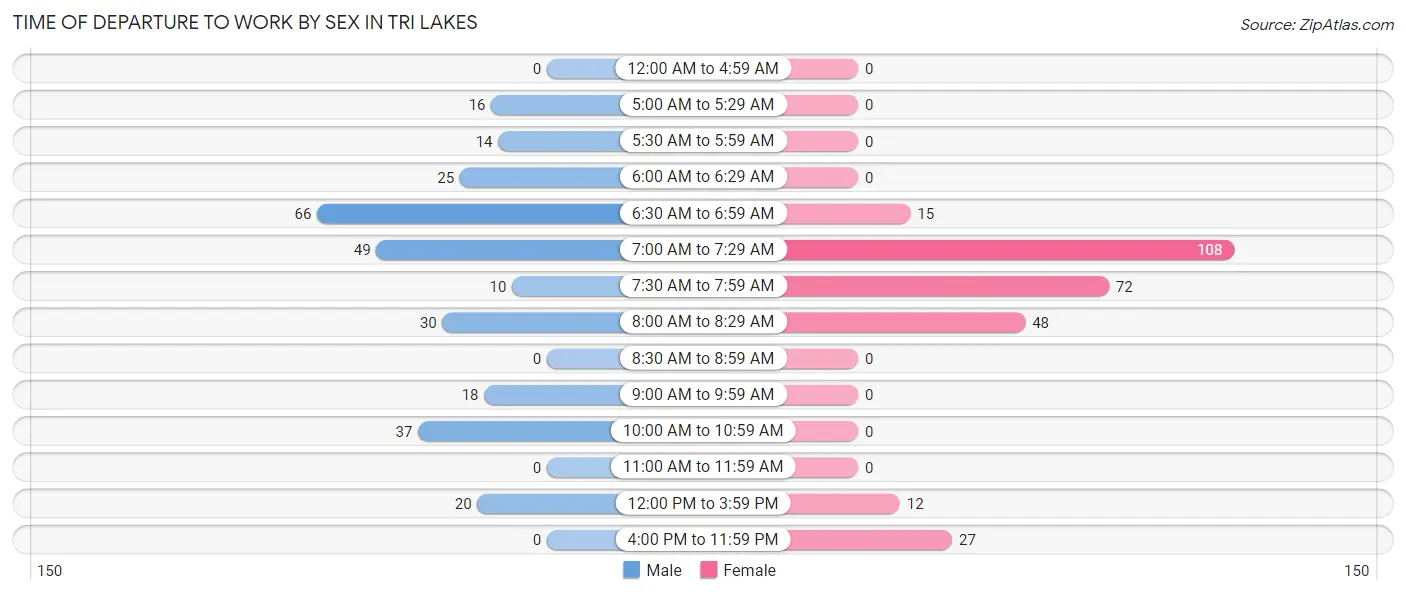
| Time of Departure | Male | Female |
| 12:00 AM to 4:59 AM | 0 (0.0%) | 0 (0.0%) |
| 5:00 AM to 5:29 AM | 16 (5.6%) | 0 (0.0%) |
| 5:30 AM to 5:59 AM | 14 (4.9%) | 0 (0.0%) |
| 6:00 AM to 6:29 AM | 25 (8.8%) | 0 (0.0%) |
| 6:30 AM to 6:59 AM | 66 (23.2%) | 15 (5.3%) |
| 7:00 AM to 7:29 AM | 49 (17.2%) | 108 (38.3%) |
| 7:30 AM to 7:59 AM | 10 (3.5%) | 72 (25.5%) |
| 8:00 AM to 8:29 AM | 30 (10.5%) | 48 (17.0%) |
| 8:30 AM to 8:59 AM | 0 (0.0%) | 0 (0.0%) |
| 9:00 AM to 9:59 AM | 18 (6.3%) | 0 (0.0%) |
| 10:00 AM to 10:59 AM | 37 (13.0%) | 0 (0.0%) |
| 11:00 AM to 11:59 AM | 0 (0.0%) | 0 (0.0%) |
| 12:00 PM to 3:59 PM | 20 (7.0%) | 12 (4.3%) |
| 4:00 PM to 11:59 PM | 0 (0.0%) | 27 (9.6%) |
| Total | 285 (100.0%) | 282 (100.0%) |
Housing Occupancy in Tri Lakes
Occupancy by Ownership in Tri Lakes
Of the total 534 dwellings in Tri Lakes, owner-occupied units account for 534 (100.0%), while renter-occupied units make up 0 (0.0%).
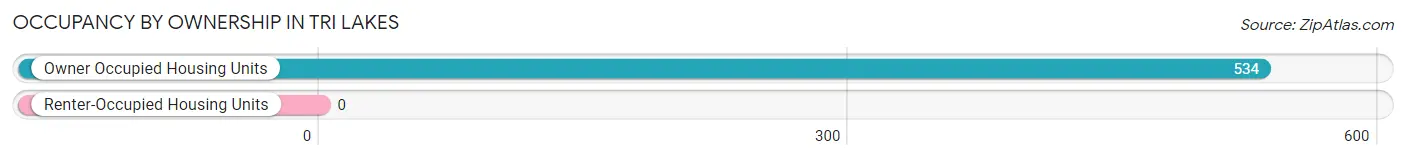
| Occupancy | # Housing Units | % Housing Units |
| Owner Occupied Housing Units | 534 | 100.0% |
| Renter-Occupied Housing Units | 0 | 0.0% |
| Total Occupied Housing Units | 534 | 100.0% |
Occupancy by Household Size in Tri Lakes
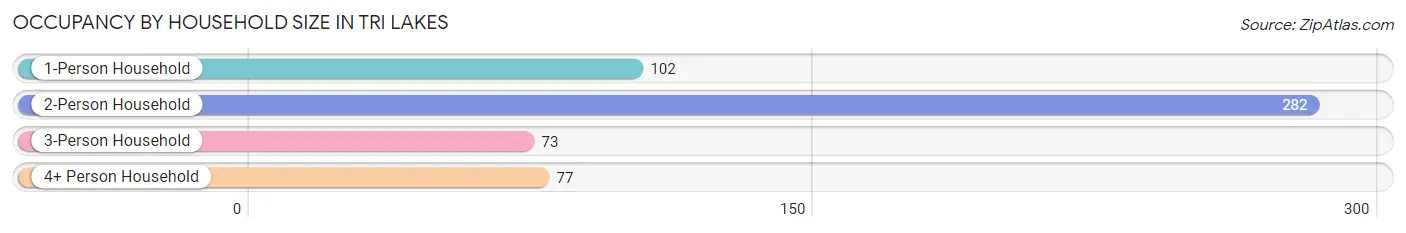
| Household Size | # Housing Units | % Housing Units |
| 1-Person Household | 102 | 19.1% |
| 2-Person Household | 282 | 52.8% |
| 3-Person Household | 73 | 13.7% |
| 4+ Person Household | 77 | 14.4% |
| Total Housing Units | 534 | 100.0% |
Occupancy by Ownership by Household Size in Tri Lakes
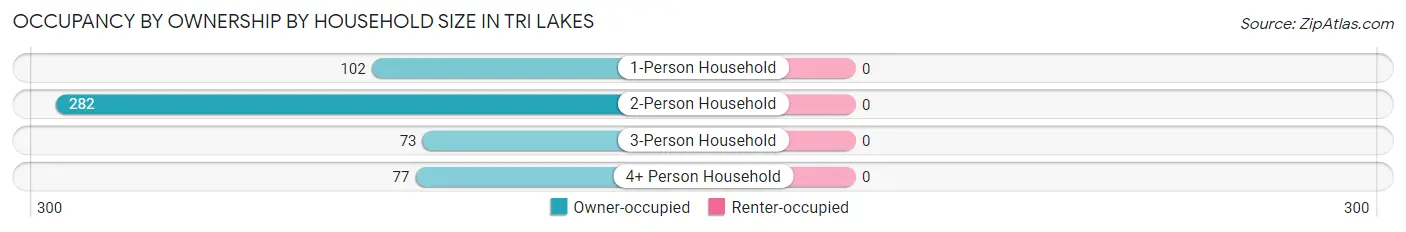
| Household Size | Owner-occupied | Renter-occupied |
| 1-Person Household | 102 (100.0%) | 0 (0.0%) |
| 2-Person Household | 282 (100.0%) | 0 (0.0%) |
| 3-Person Household | 73 (100.0%) | 0 (0.0%) |
| 4+ Person Household | 77 (100.0%) | 0 (0.0%) |
| Total Housing Units | 534 (100.0%) | 0 (0.0%) |
Occupancy by Educational Attainment in Tri Lakes
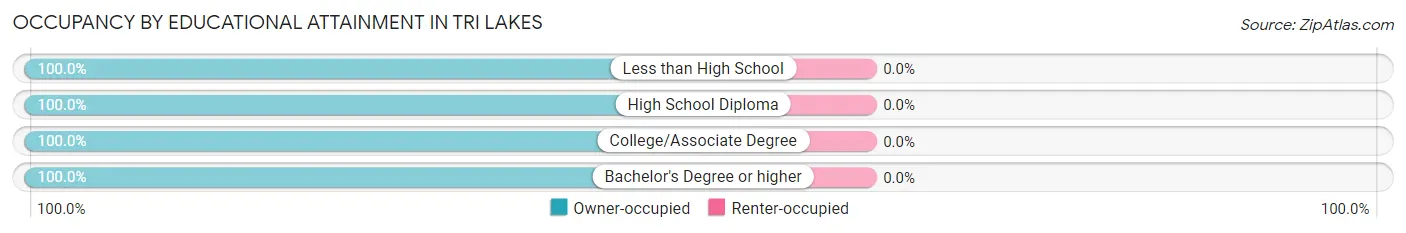
| Household Size | Owner-occupied | Renter-occupied |
| Less than High School | 11 (100.0%) | 0 (0.0%) |
| High School Diploma | 66 (100.0%) | 0 (0.0%) |
| College/Associate Degree | 310 (100.0%) | 0 (0.0%) |
| Bachelor's Degree or higher | 147 (100.0%) | 0 (0.0%) |
Occupancy by Age of Householder in Tri Lakes
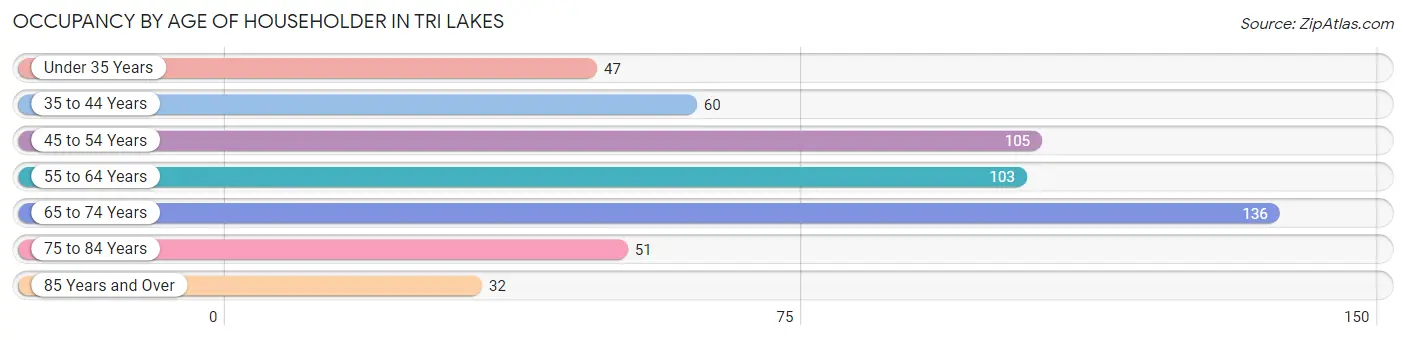
| Age Bracket | # Households | % Households |
| Under 35 Years | 47 | 8.8% |
| 35 to 44 Years | 60 | 11.2% |
| 45 to 54 Years | 105 | 19.7% |
| 55 to 64 Years | 103 | 19.3% |
| 65 to 74 Years | 136 | 25.5% |
| 75 to 84 Years | 51 | 9.6% |
| 85 Years and Over | 32 | 6.0% |
| Total | 534 | 100.0% |
Housing Finances in Tri Lakes
Median Income by Occupancy in Tri Lakes
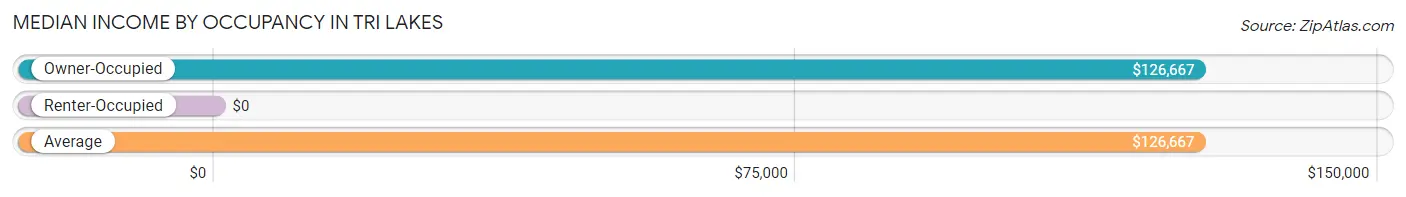
| Occupancy Type | # Households | Median Income |
| Owner-Occupied | 534 (100.0%) | $126,667 |
| Renter-Occupied | 0 (0.0%) | $0 |
| Average | 534 (100.0%) | $126,667 |
Occupancy by Householder Income Bracket in Tri Lakes
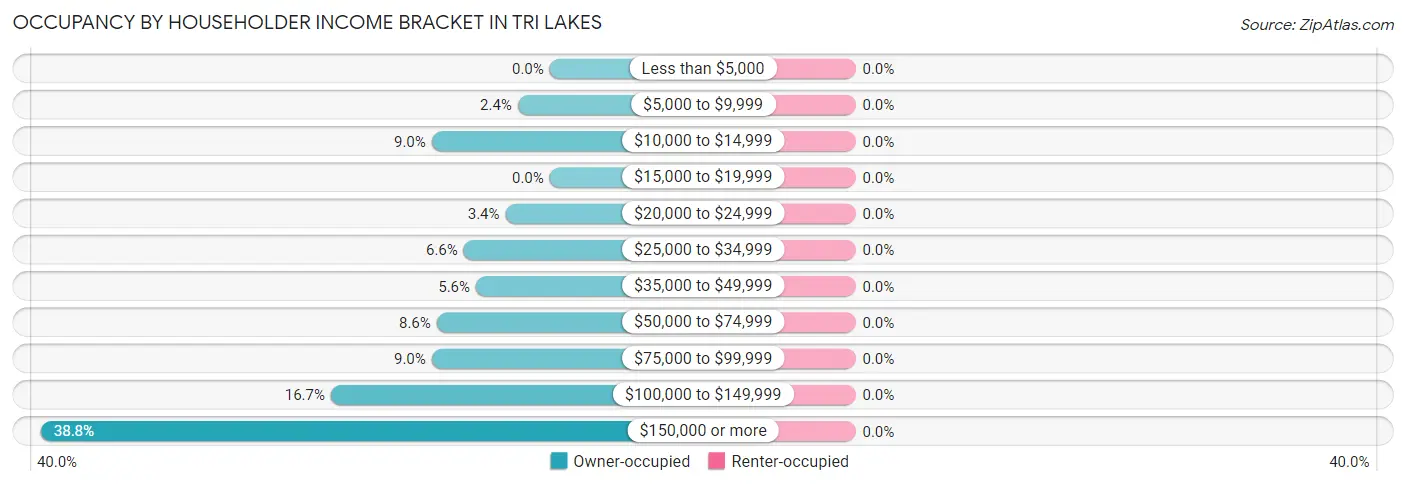
| Income Bracket | Owner-occupied | Renter-occupied |
| Less than $5,000 | 0 (0.0%) | 0 (0.0%) |
| $5,000 to $9,999 | 13 (2.4%) | 0 (0.0%) |
| $10,000 to $14,999 | 48 (9.0%) | 0 (0.0%) |
| $15,000 to $19,999 | 0 (0.0%) | 0 (0.0%) |
| $20,000 to $24,999 | 18 (3.4%) | 0 (0.0%) |
| $25,000 to $34,999 | 35 (6.6%) | 0 (0.0%) |
| $35,000 to $49,999 | 30 (5.6%) | 0 (0.0%) |
| $50,000 to $74,999 | 46 (8.6%) | 0 (0.0%) |
| $75,000 to $99,999 | 48 (9.0%) | 0 (0.0%) |
| $100,000 to $149,999 | 89 (16.7%) | 0 (0.0%) |
| $150,000 or more | 207 (38.8%) | 0 (0.0%) |
| Total | 534 (100.0%) | 0 (0.0%) |
Monthly Housing Cost Tiers in Tri Lakes
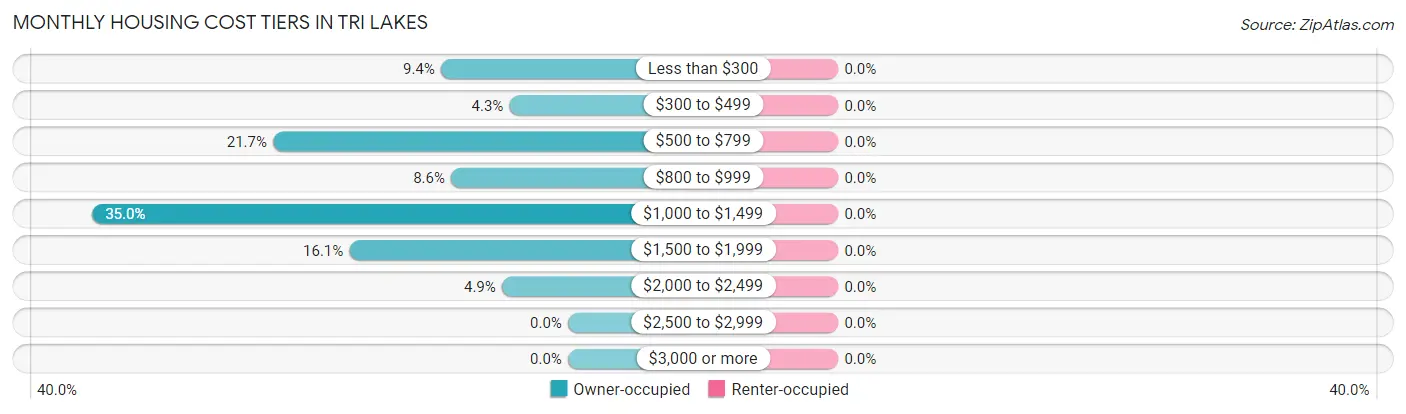
| Monthly Cost | Owner-occupied | Renter-occupied |
| Less than $300 | 50 (9.4%) | 0 (0.0%) |
| $300 to $499 | 23 (4.3%) | 0 (0.0%) |
| $500 to $799 | 116 (21.7%) | 0 (0.0%) |
| $800 to $999 | 46 (8.6%) | 0 (0.0%) |
| $1,000 to $1,499 | 187 (35.0%) | 0 (0.0%) |
| $1,500 to $1,999 | 86 (16.1%) | 0 (0.0%) |
| $2,000 to $2,499 | 26 (4.9%) | 0 (0.0%) |
| $2,500 to $2,999 | 0 (0.0%) | 0 (0.0%) |
| $3,000 or more | 0 (0.0%) | 0 (0.0%) |
| Total | 534 (100.0%) | 0 (0.0%) |
Physical Housing Characteristics in Tri Lakes
Housing Structures in Tri Lakes
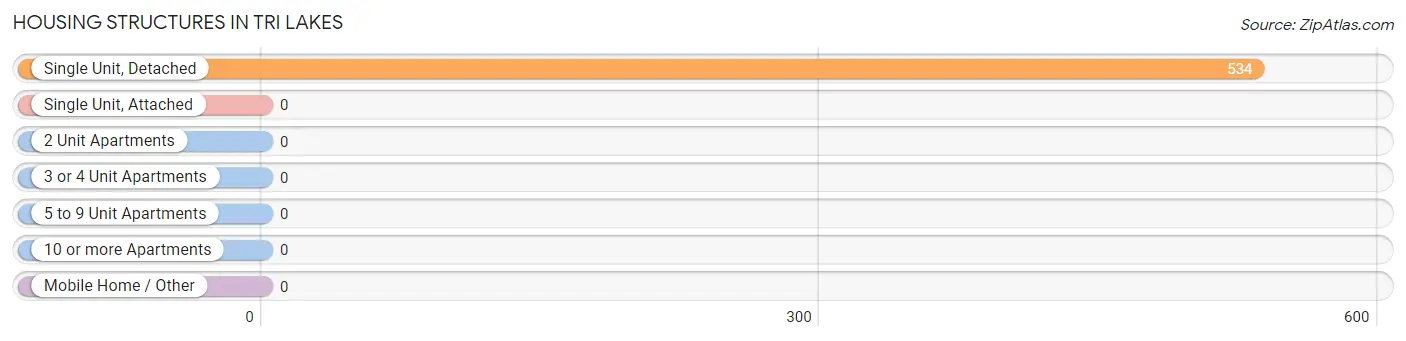
| Structure Type | # Housing Units | % Housing Units |
| Single Unit, Detached | 534 | 100.0% |
| Single Unit, Attached | 0 | 0.0% |
| 2 Unit Apartments | 0 | 0.0% |
| 3 or 4 Unit Apartments | 0 | 0.0% |
| 5 to 9 Unit Apartments | 0 | 0.0% |
| 10 or more Apartments | 0 | 0.0% |
| Mobile Home / Other | 0 | 0.0% |
| Total | 534 | 100.0% |
Housing Structures by Occupancy in Tri Lakes
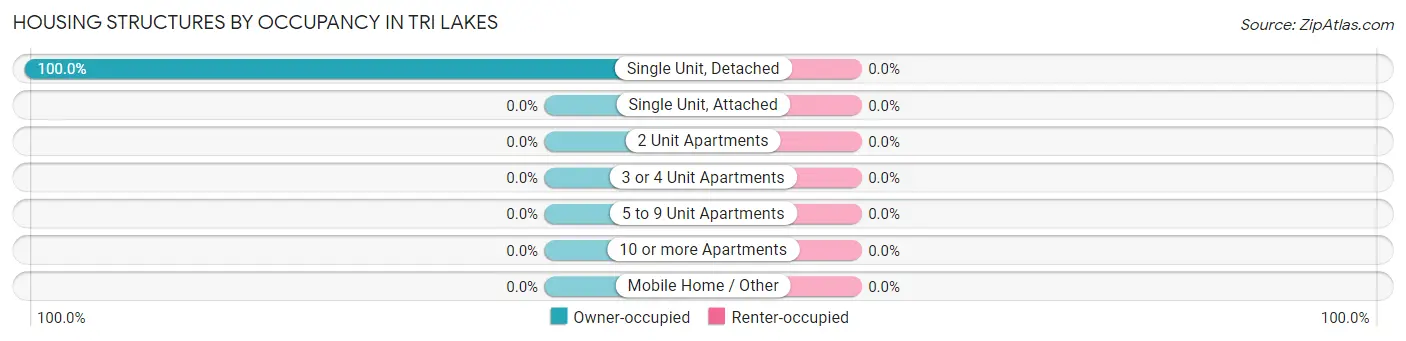
| Structure Type | Owner-occupied | Renter-occupied |
| Single Unit, Detached | 534 (100.0%) | 0 (0.0%) |
| Single Unit, Attached | 0 (0.0%) | 0 (0.0%) |
| 2 Unit Apartments | 0 (0.0%) | 0 (0.0%) |
| 3 or 4 Unit Apartments | 0 (0.0%) | 0 (0.0%) |
| 5 to 9 Unit Apartments | 0 (0.0%) | 0 (0.0%) |
| 10 or more Apartments | 0 (0.0%) | 0 (0.0%) |
| Mobile Home / Other | 0 (0.0%) | 0 (0.0%) |
| Total | 534 (100.0%) | 0 (0.0%) |
Housing Structures by Number of Rooms in Tri Lakes
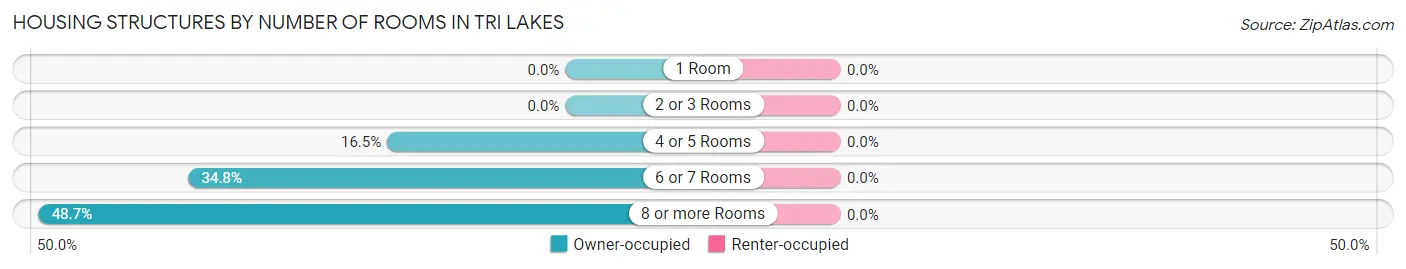
| Number of Rooms | Owner-occupied | Renter-occupied |
| 1 Room | 0 (0.0%) | 0 (0.0%) |
| 2 or 3 Rooms | 0 (0.0%) | 0 (0.0%) |
| 4 or 5 Rooms | 88 (16.5%) | 0 (0.0%) |
| 6 or 7 Rooms | 186 (34.8%) | 0 (0.0%) |
| 8 or more Rooms | 260 (48.7%) | 0 (0.0%) |
| Total | 534 (100.0%) | 0 (0.0%) |
Housing Structure by Heating Type in Tri Lakes
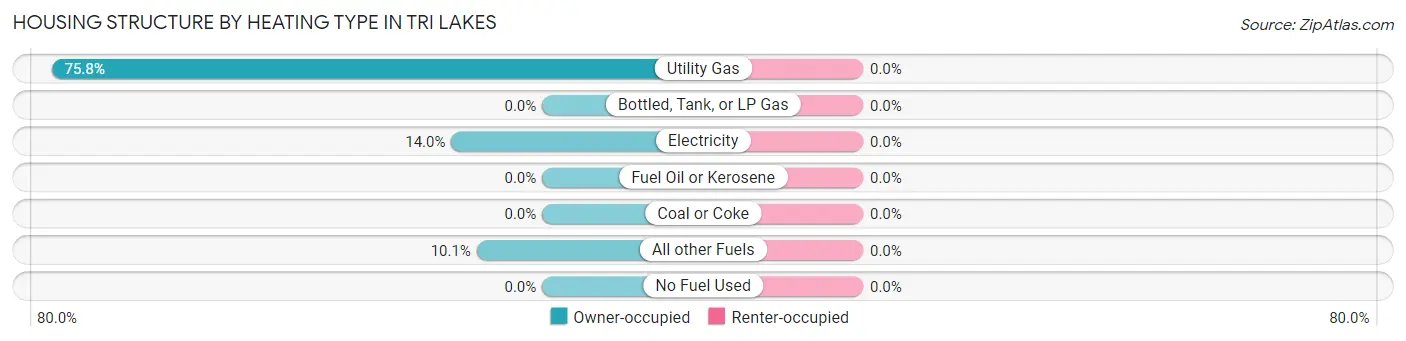
| Heating Type | Owner-occupied | Renter-occupied |
| Utility Gas | 405 (75.8%) | 0 (0.0%) |
| Bottled, Tank, or LP Gas | 0 (0.0%) | 0 (0.0%) |
| Electricity | 75 (14.0%) | 0 (0.0%) |
| Fuel Oil or Kerosene | 0 (0.0%) | 0 (0.0%) |
| Coal or Coke | 0 (0.0%) | 0 (0.0%) |
| All other Fuels | 54 (10.1%) | 0 (0.0%) |
| No Fuel Used | 0 (0.0%) | 0 (0.0%) |
| Total | 534 (100.0%) | 0 (0.0%) |
Household Vehicle Usage in Tri Lakes
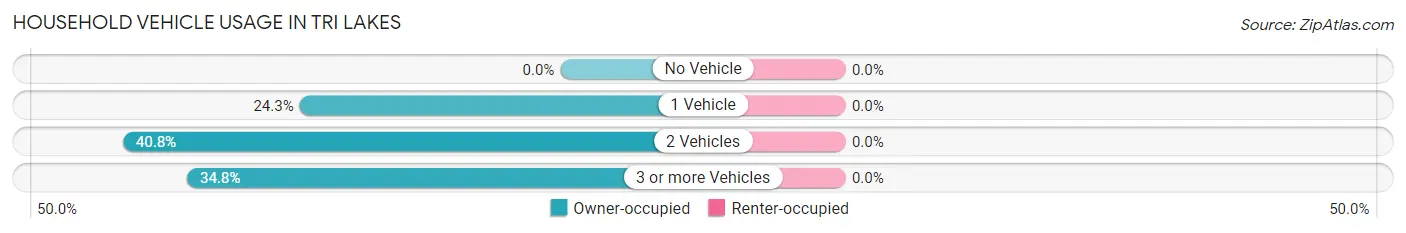
| Vehicles per Household | Owner-occupied | Renter-occupied |
| No Vehicle | 0 (0.0%) | 0 (0.0%) |
| 1 Vehicle | 130 (24.3%) | 0 (0.0%) |
| 2 Vehicles | 218 (40.8%) | 0 (0.0%) |
| 3 or more Vehicles | 186 (34.8%) | 0 (0.0%) |
| Total | 534 (100.0%) | 0 (0.0%) |
Real Estate & Mortgages in Tri Lakes
Real Estate and Mortgage Overview in Tri Lakes
| Characteristic | Without Mortgage | With Mortgage |
| Housing Units | 202 | 332 |
| Median Property Value | $266,700 | $310,100 |
| Median Household Income | $74,597 | $141 |
| Monthly Housing Costs | $570 | $0 |
| Real Estate Taxes | $2,325 | $0 |
Property Value by Mortgage Status in Tri Lakes
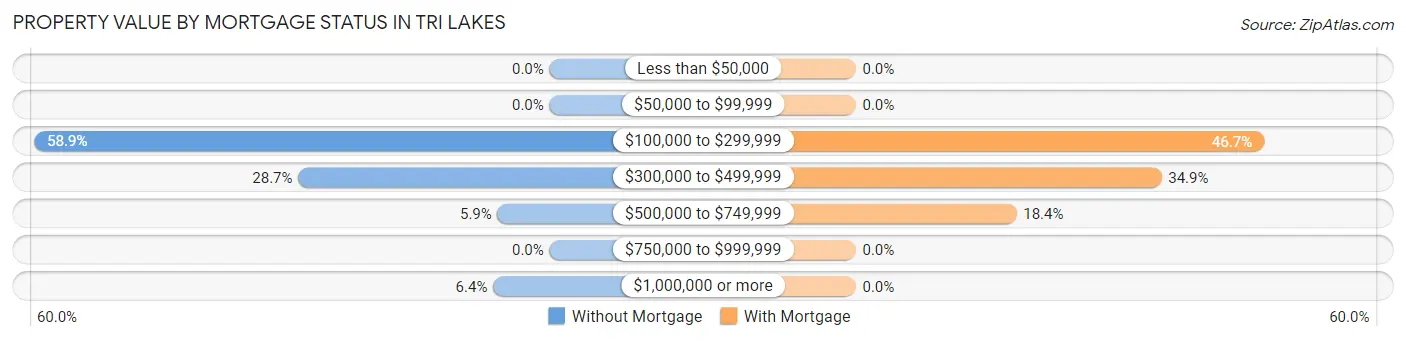
| Property Value | Without Mortgage | With Mortgage |
| Less than $50,000 | 0 (0.0%) | 0 (0.0%) |
| $50,000 to $99,999 | 0 (0.0%) | 0 (0.0%) |
| $100,000 to $299,999 | 119 (58.9%) | 155 (46.7%) |
| $300,000 to $499,999 | 58 (28.7%) | 116 (34.9%) |
| $500,000 to $749,999 | 12 (5.9%) | 61 (18.4%) |
| $750,000 to $999,999 | 0 (0.0%) | 0 (0.0%) |
| $1,000,000 or more | 13 (6.4%) | 0 (0.0%) |
| Total | 202 (100.0%) | 332 (100.0%) |
Household Income by Mortgage Status in Tri Lakes
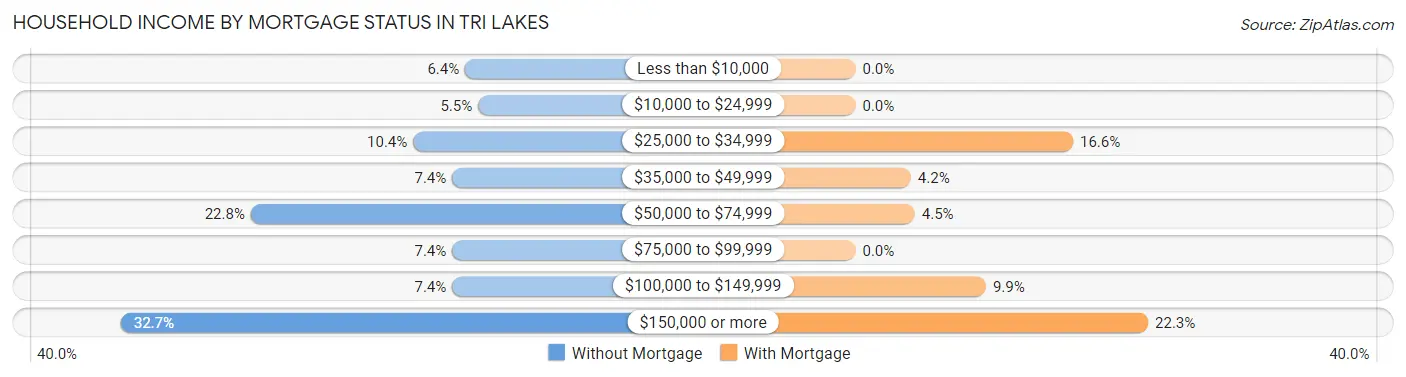
| Household Income | Without Mortgage | With Mortgage |
| Less than $10,000 | 13 (6.4%) | 0 (0.0%) |
| $10,000 to $24,999 | 11 (5.4%) | 0 (0.0%) |
| $25,000 to $34,999 | 21 (10.4%) | 55 (16.6%) |
| $35,000 to $49,999 | 15 (7.4%) | 14 (4.2%) |
| $50,000 to $74,999 | 46 (22.8%) | 15 (4.5%) |
| $75,000 to $99,999 | 15 (7.4%) | 0 (0.0%) |
| $100,000 to $149,999 | 15 (7.4%) | 33 (9.9%) |
| $150,000 or more | 66 (32.7%) | 74 (22.3%) |
| Total | 202 (100.0%) | 332 (100.0%) |
Property Value to Household Income Ratio in Tri Lakes
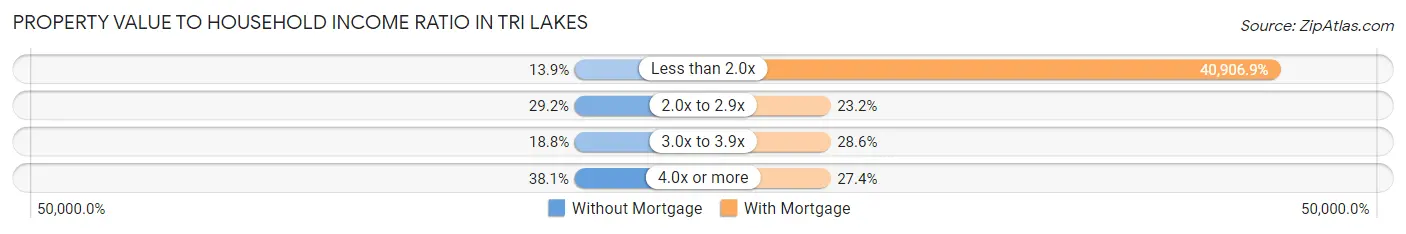
| Value-to-Income Ratio | Without Mortgage | With Mortgage |
| Less than 2.0x | 28 (13.9%) | 135,811 (40,906.9%) |
| 2.0x to 2.9x | 59 (29.2%) | 77 (23.2%) |
| 3.0x to 3.9x | 38 (18.8%) | 95 (28.6%) |
| 4.0x or more | 77 (38.1%) | 91 (27.4%) |
| Total | 202 (100.0%) | 332 (100.0%) |
Real Estate Taxes by Mortgage Status in Tri Lakes
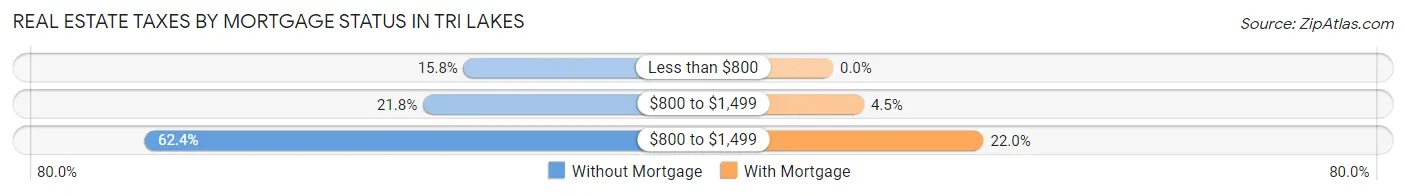
| Property Taxes | Without Mortgage | With Mortgage |
| Less than $800 | 32 (15.8%) | 0 (0.0%) |
| $800 to $1,499 | 44 (21.8%) | 15 (4.5%) |
| $800 to $1,499 | 126 (62.4%) | 73 (22.0%) |
| Total | 202 (100.0%) | 332 (100.0%) |
Health & Disability in Tri Lakes
Health Insurance Coverage by Age in Tri Lakes
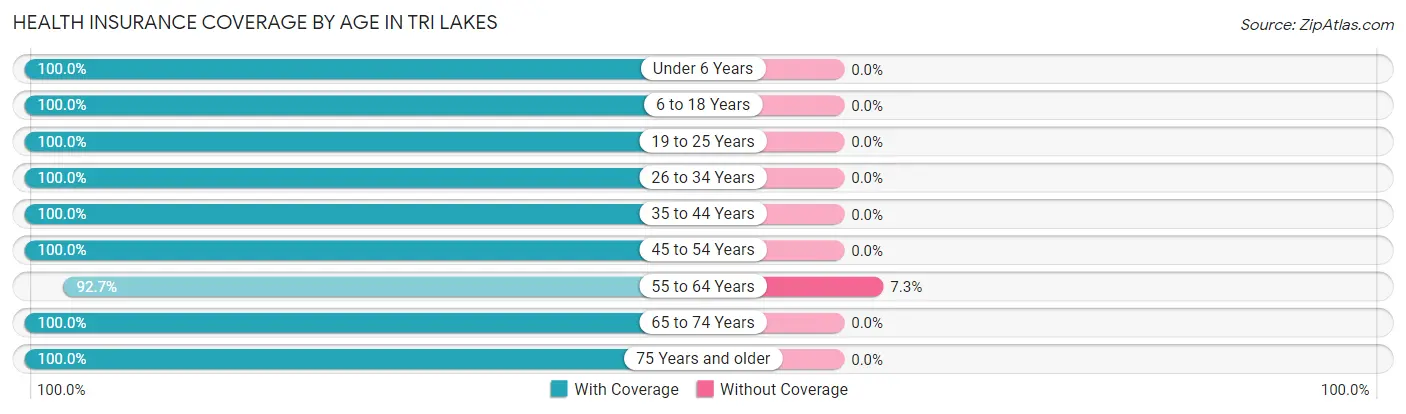
| Age Bracket | With Coverage | Without Coverage |
| Under 6 Years | 29 (100.0%) | 0 (0.0%) |
| 6 to 18 Years | 239 (100.0%) | 0 (0.0%) |
| 19 to 25 Years | 20 (100.0%) | 0 (0.0%) |
| 26 to 34 Years | 97 (100.0%) | 0 (0.0%) |
| 35 to 44 Years | 105 (100.0%) | 0 (0.0%) |
| 45 to 54 Years | 184 (100.0%) | 0 (0.0%) |
| 55 to 64 Years | 229 (92.7%) | 18 (7.3%) |
| 65 to 74 Years | 188 (100.0%) | 0 (0.0%) |
| 75 Years and older | 149 (100.0%) | 0 (0.0%) |
| Total | 1,240 (98.6%) | 18 (1.4%) |
Health Insurance Coverage by Citizenship Status in Tri Lakes
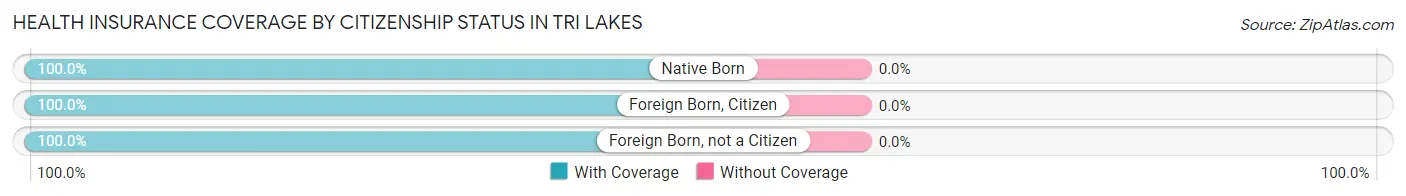
| Citizenship Status | With Coverage | Without Coverage |
| Native Born | 29 (100.0%) | 0 (0.0%) |
| Foreign Born, Citizen | 239 (100.0%) | 0 (0.0%) |
| Foreign Born, not a Citizen | 20 (100.0%) | 0 (0.0%) |
Health Insurance Coverage by Household Income in Tri Lakes
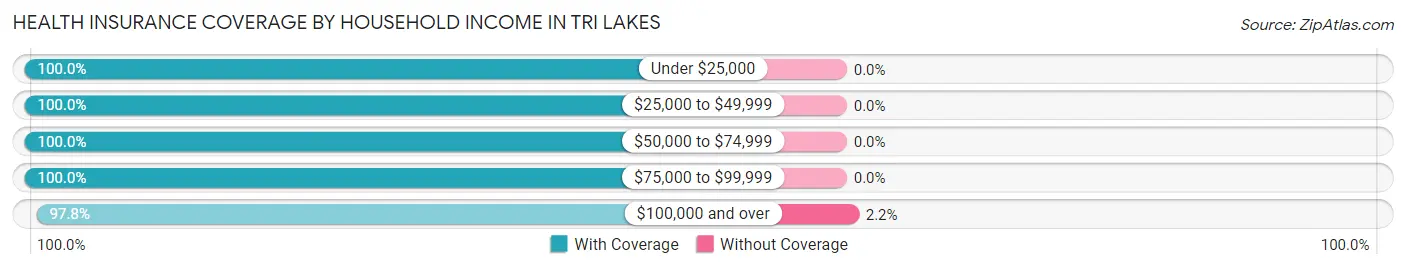
| Household Income | With Coverage | Without Coverage |
| Under $25,000 | 132 (100.0%) | 0 (0.0%) |
| $25,000 to $49,999 | 92 (100.0%) | 0 (0.0%) |
| $50,000 to $74,999 | 99 (100.0%) | 0 (0.0%) |
| $75,000 to $99,999 | 131 (100.0%) | 0 (0.0%) |
| $100,000 and over | 786 (97.8%) | 18 (2.2%) |
Public vs Private Health Insurance Coverage by Age in Tri Lakes
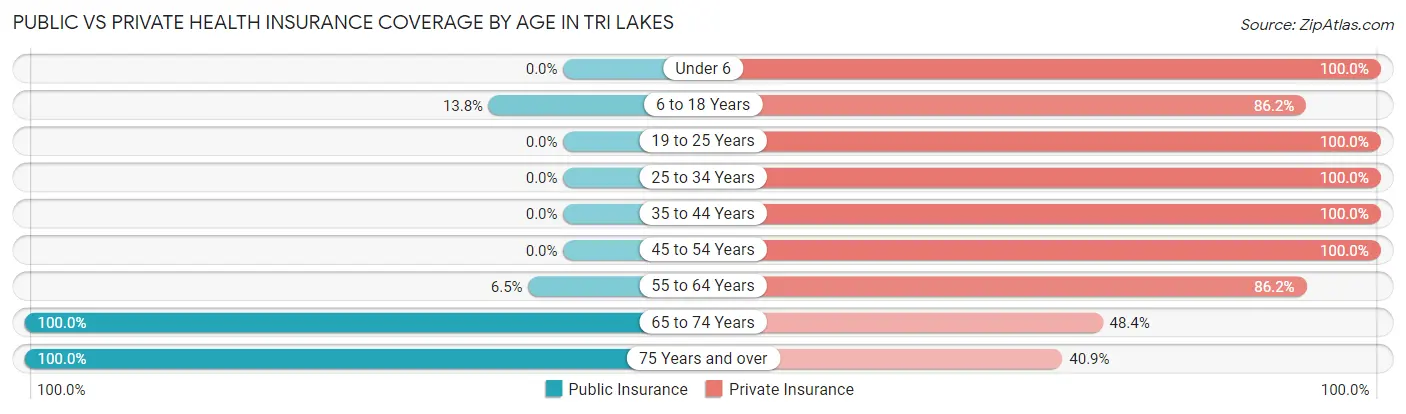
| Age Bracket | Public Insurance | Private Insurance |
| Under 6 | 0 (0.0%) | 29 (100.0%) |
| 6 to 18 Years | 33 (13.8%) | 206 (86.2%) |
| 19 to 25 Years | 0 (0.0%) | 20 (100.0%) |
| 25 to 34 Years | 0 (0.0%) | 97 (100.0%) |
| 35 to 44 Years | 0 (0.0%) | 105 (100.0%) |
| 45 to 54 Years | 0 (0.0%) | 184 (100.0%) |
| 55 to 64 Years | 16 (6.5%) | 213 (86.2%) |
| 65 to 74 Years | 188 (100.0%) | 91 (48.4%) |
| 75 Years and over | 149 (100.0%) | 61 (40.9%) |
| Total | 386 (30.7%) | 1,006 (80.0%) |
Disability Status by Sex by Age in Tri Lakes
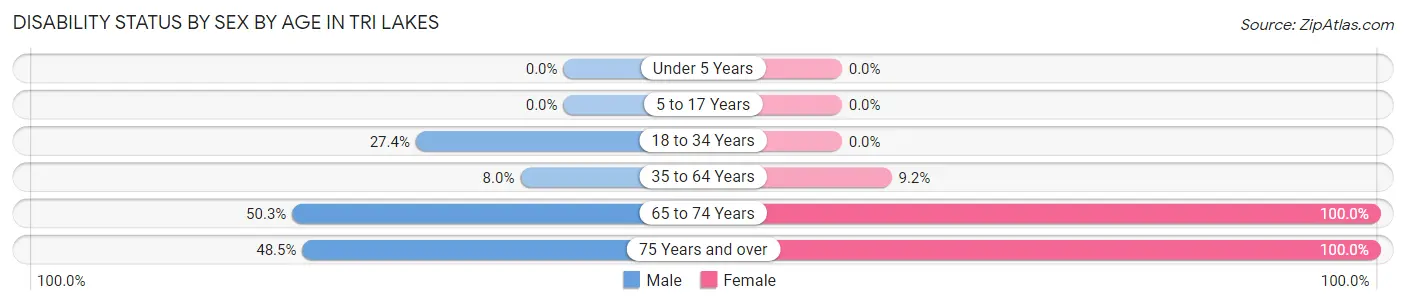
| Age Bracket | Male | Female |
| Under 5 Years | 0 (0.0%) | 0 (0.0%) |
| 5 to 17 Years | 0 (0.0%) | 0 (0.0%) |
| 18 to 34 Years | 20 (27.4%) | 0 (0.0%) |
| 35 to 64 Years | 16 (8.0%) | 31 (9.2%) |
| 65 to 74 Years | 73 (50.3%) | 43 (100.0%) |
| 75 Years and over | 47 (48.4%) | 52 (100.0%) |
Disability Class by Sex by Age in Tri Lakes
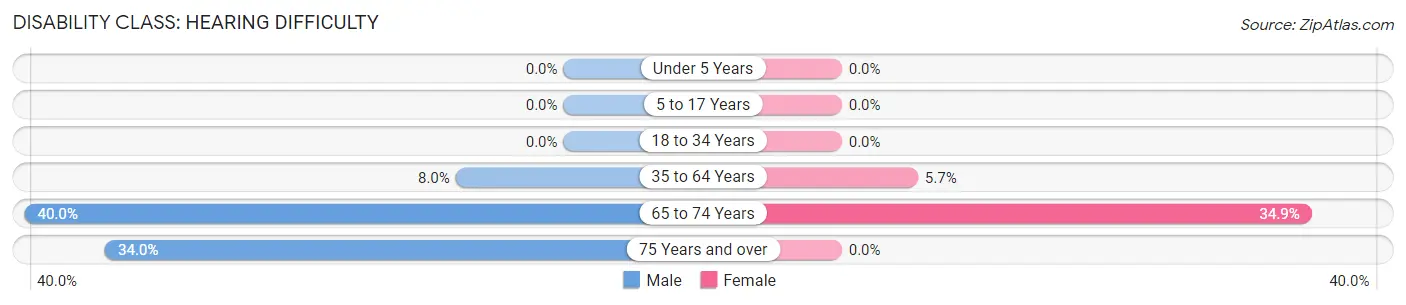
Disability Class: Hearing Difficulty
| Age Bracket | Male | Female |
| Under 5 Years | 0 (0.0%) | 0 (0.0%) |
| 5 to 17 Years | 0 (0.0%) | 0 (0.0%) |
| 18 to 34 Years | 0 (0.0%) | 0 (0.0%) |
| 35 to 64 Years | 16 (8.0%) | 19 (5.7%) |
| 65 to 74 Years | 58 (40.0%) | 15 (34.9%) |
| 75 Years and over | 33 (34.0%) | 0 (0.0%) |
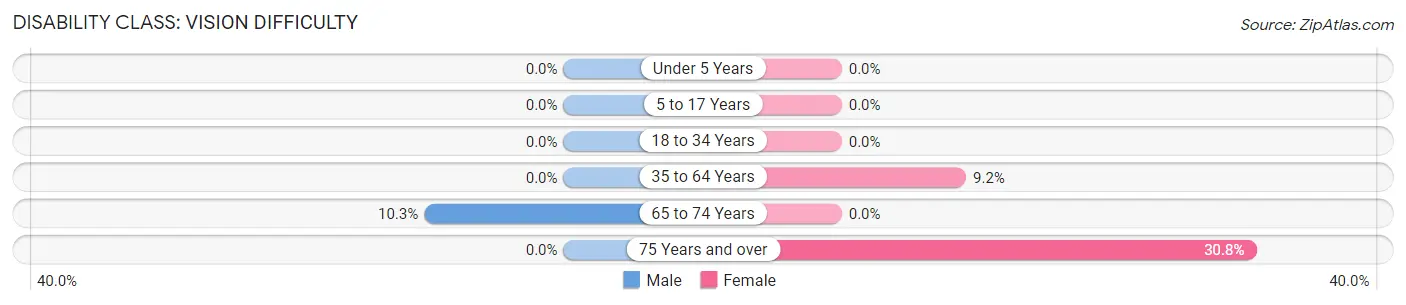
Disability Class: Vision Difficulty
| Age Bracket | Male | Female |
| Under 5 Years | 0 (0.0%) | 0 (0.0%) |
| 5 to 17 Years | 0 (0.0%) | 0 (0.0%) |
| 18 to 34 Years | 0 (0.0%) | 0 (0.0%) |
| 35 to 64 Years | 0 (0.0%) | 31 (9.2%) |
| 65 to 74 Years | 15 (10.3%) | 0 (0.0%) |
| 75 Years and over | 0 (0.0%) | 16 (30.8%) |
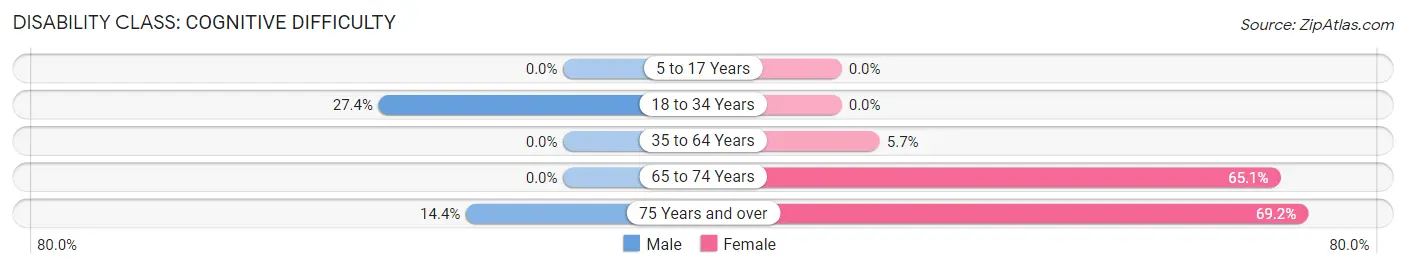
Disability Class: Cognitive Difficulty
| Age Bracket | Male | Female |
| 5 to 17 Years | 0 (0.0%) | 0 (0.0%) |
| 18 to 34 Years | 20 (27.4%) | 0 (0.0%) |
| 35 to 64 Years | 0 (0.0%) | 19 (5.7%) |
| 65 to 74 Years | 0 (0.0%) | 28 (65.1%) |
| 75 Years and over | 14 (14.4%) | 36 (69.2%) |
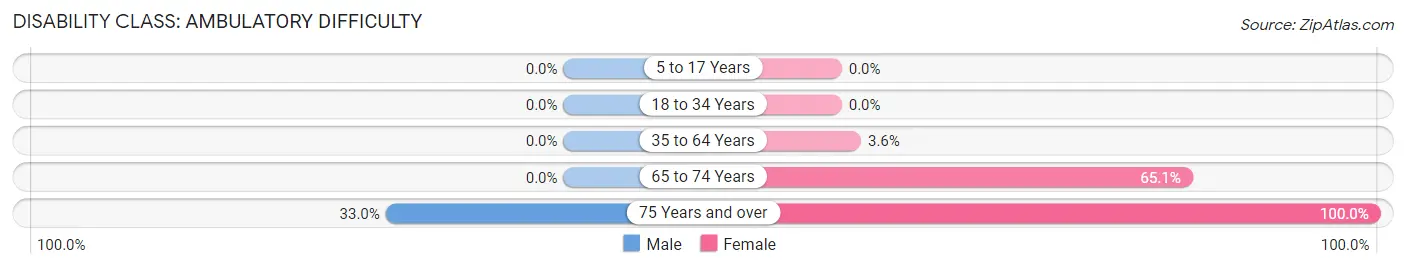
Disability Class: Ambulatory Difficulty
| Age Bracket | Male | Female |
| 5 to 17 Years | 0 (0.0%) | 0 (0.0%) |
| 18 to 34 Years | 0 (0.0%) | 0 (0.0%) |
| 35 to 64 Years | 0 (0.0%) | 12 (3.6%) |
| 65 to 74 Years | 0 (0.0%) | 28 (65.1%) |
| 75 Years and over | 32 (33.0%) | 52 (100.0%) |
Disability Class: Self-Care Difficulty
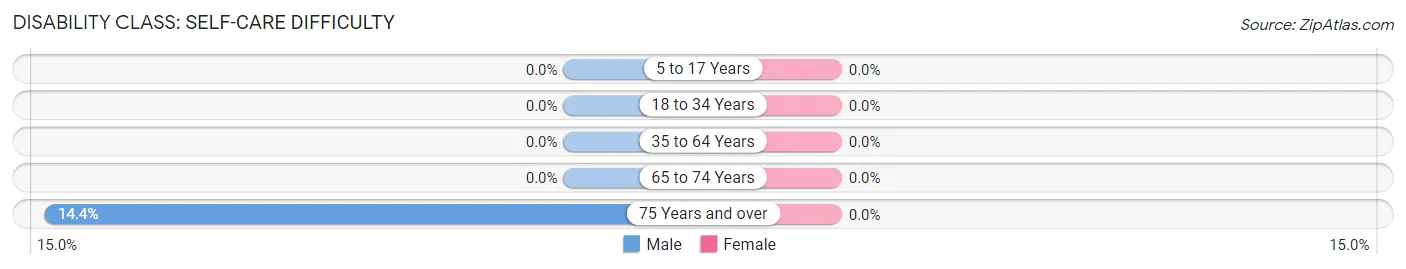
| Age Bracket | Male | Female |
| 5 to 17 Years | 0 (0.0%) | 0 (0.0%) |
| 18 to 34 Years | 0 (0.0%) | 0 (0.0%) |
| 35 to 64 Years | 0 (0.0%) | 0 (0.0%) |
| 65 to 74 Years | 0 (0.0%) | 0 (0.0%) |
| 75 Years and over | 14 (14.4%) | 0 (0.0%) |
Technology Access in Tri Lakes
Computing Device Access in Tri Lakes
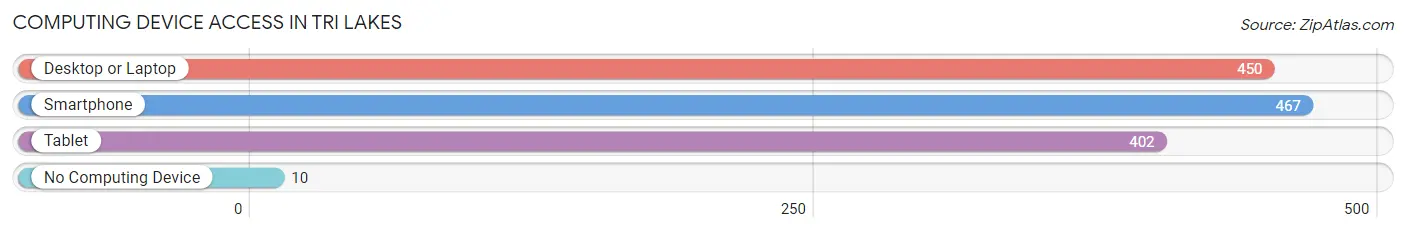
| Device Type | # Households | % Households |
| Desktop or Laptop | 450 | 84.3% |
| Smartphone | 467 | 87.5% |
| Tablet | 402 | 75.3% |
| No Computing Device | 10 | 1.9% |
| Total | 534 | 100.0% |
Internet Access in Tri Lakes
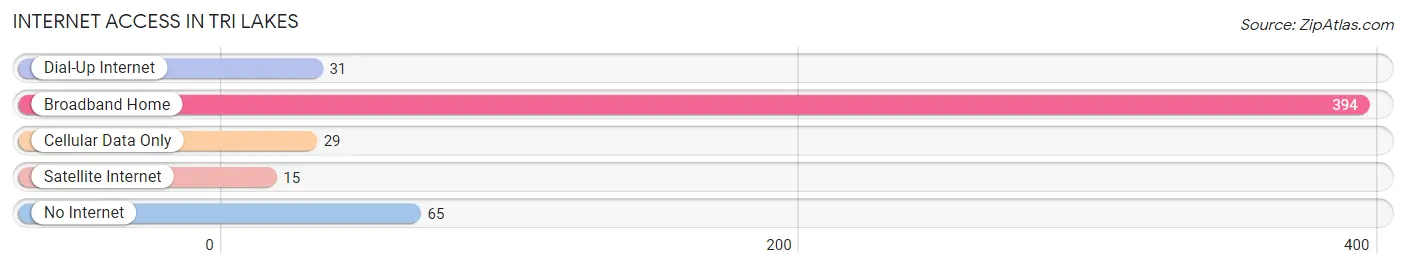
| Internet Type | # Households | % Households |
| Dial-Up Internet | 31 | 5.8% |
| Broadband Home | 394 | 73.8% |
| Cellular Data Only | 29 | 5.4% |
| Satellite Internet | 15 | 2.8% |
| No Internet | 65 | 12.2% |
| Total | 534 | 100.0% |
Tri Lakes Summary
History
Tri Lakes, Indiana is a small town located in the northern part of the state. It is situated in the Tippecanoe County, and is part of the Lafayette metropolitan area. The town was founded in 1836 by a group of settlers from Ohio, and was originally known as “Tri-Lakes” due to its location near three lakes. The town was officially incorporated in 1837, and has since grown to a population of over 1,000 people.
The town has a rich history, and was an important stop on the Underground Railroad. During the Civil War, Tri Lakes was a major supplier of food and supplies to the Union Army. The town was also home to a number of prominent figures, including the first African American mayor of a major city, William H. Harrison.
Geography
Tri Lakes is located in the northern part of Indiana, in Tippecanoe County. It is situated in the Lafayette metropolitan area, and is bordered by the Wabash River to the east and the Tippecanoe River to the west. The town is located in a rural area, and is surrounded by farmland and woodlands. The town is also home to three lakes, which give the town its name.
Economy
The economy of Tri Lakes is largely based on agriculture and tourism. The town is home to a number of farms, which produce a variety of crops, including corn, soybeans, and wheat. The town is also home to a number of small businesses, including restaurants, shops, and other services.
The town is also a popular tourist destination, and is home to a number of attractions, including the Tri Lakes Historical Museum, the Tri Lakes Nature Center, and the Tri Lakes State Park. The town is also home to a number of festivals and events, including the Tri Lakes Festival of Lights, the Tri Lakes Music Festival, and the Tri Lakes Arts and Crafts Fair.
Demographics
As of the 2010 census, the population of Tri Lakes was 1,072. The town is predominantly white, with 91.3% of the population identifying as such. The town also has a small Hispanic population, with 4.3% of the population identifying as Hispanic or Latino. The town also has a small African American population, with 1.2% of the population identifying as such. The median household income in the town is $45,938, and the median home value is $117,400.
Common Questions
What is Per Capita Income in Tri Lakes?
Per Capita income in Tri Lakes is $49,141.
What is the Median Family Income in Tri Lakes?
Median Family Income in Tri Lakes is $104,750.
What is the Median Household income in Tri Lakes?
Median Household Income in Tri Lakes is $126,667.
What is Income or Wage Gap in Tri Lakes?
Income or Wage Gap in Tri Lakes is 3.1%.
Women in Tri Lakes earn 96.9 cents for every dollar earned by a man.
What is Inequality or Gini Index in Tri Lakes?
Inequality or Gini Index in Tri Lakes is 0.35.
What is the Total Population of Tri Lakes?
Total Population of Tri Lakes is 1,258.
What is the Total Male Population of Tri Lakes?
Total Male Population of Tri Lakes is 717.
What is the Total Female Population of Tri Lakes?
Total Female Population of Tri Lakes is 541.
What is the Ratio of Males per 100 Females in Tri Lakes?
There are 132.53 Males per 100 Females in Tri Lakes.
What is the Ratio of Females per 100 Males in Tri Lakes?
There are 75.45 Females per 100 Males in Tri Lakes.
What is the Median Population Age in Tri Lakes?
Median Population Age in Tri Lakes is 53.6 Years.
What is the Average Family Size in Tri Lakes
Average Family Size in Tri Lakes is 2.6 People.
What is the Average Household Size in Tri Lakes
Average Household Size in Tri Lakes is 2.4 People.
How Large is the Labor Force in Tri Lakes?
There are 596 People in the Labor Forcein in Tri Lakes.
What is the Percentage of People in the Labor Force in Tri Lakes?
58.9% of People are in the Labor Force in Tri Lakes.