Zip Codes with the Highest Percentage of Population Employed in Life, Physical & Social Science in Fishers, IN
RELATED REPORTS & OPTIONS
Life, Physical & Social Science
Fishers
Compare Zip Codes
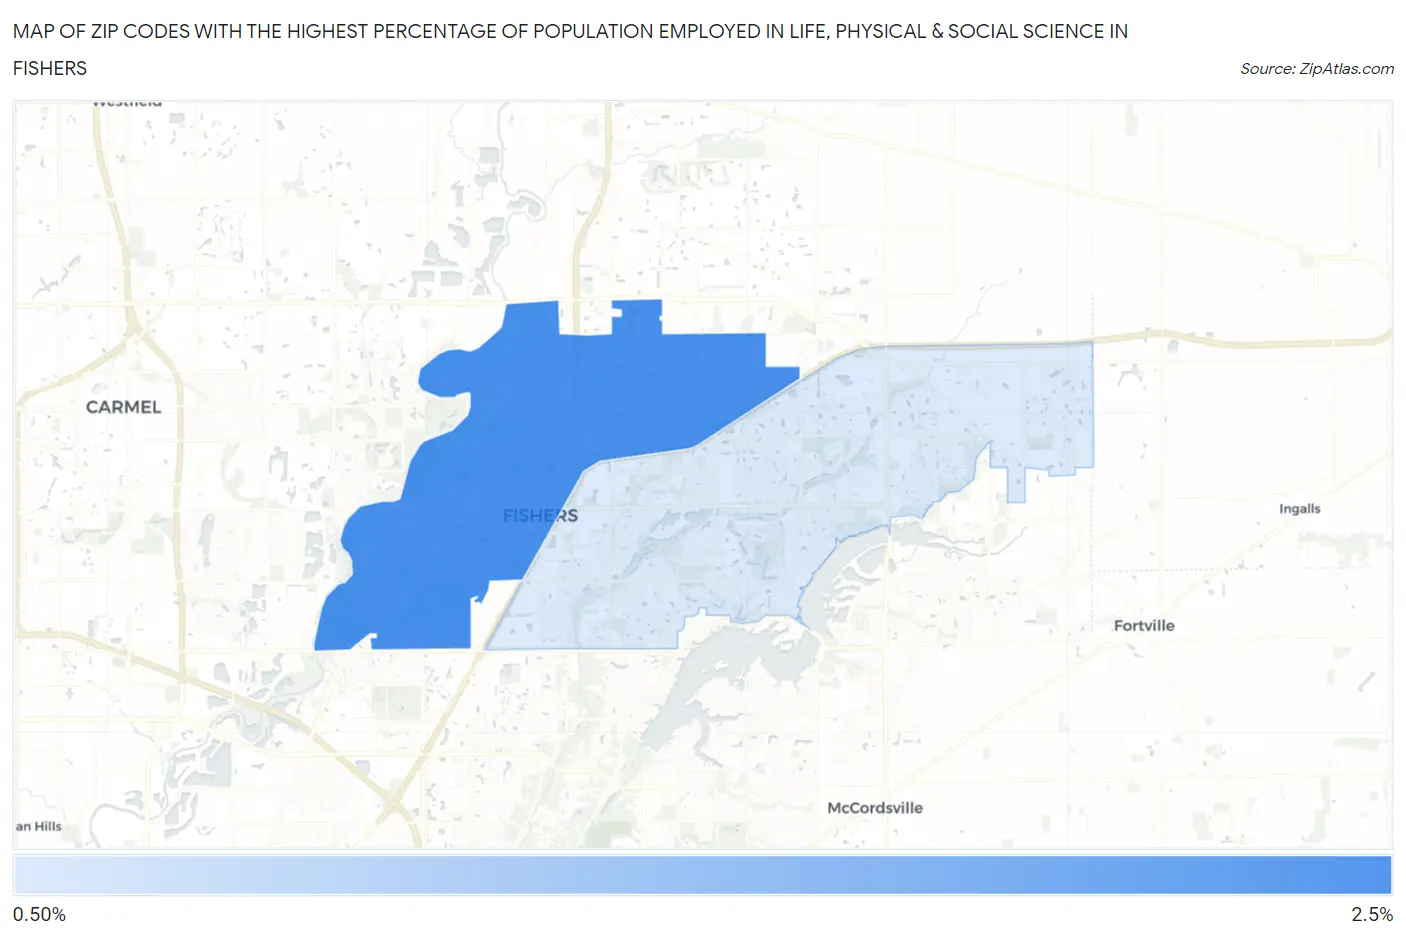
Map of Zip Codes with the Highest Percentage of Population Employed in Life, Physical & Social Science in Fishers
1.3%
2.5%
Zip Codes with the Highest Percentage of Population Employed in Life, Physical & Social Science in Fishers, IN
| Zip Code | % Employed | vs State | vs National | |
| 1. | 46038 | 2.5% | 0.83%(+1.64)#34 | 1.1%(+1.38)#2,622 |
| 2. | 46037 | 1.3% | 0.83%(+0.437)#106 | 1.1%(+0.178)#7,012 |
1
Common Questions
What are the Top Zip Codes with the Highest Percentage of Population Employed in Life, Physical & Social Science in Fishers, IN?
Top Zip Codes with the Highest Percentage of Population Employed in Life, Physical & Social Science in Fishers, IN are:
What zip code has the Highest Percentage of Population Employed in Life, Physical & Social Science in Fishers, IN?
46038 has the Highest Percentage of Population Employed in Life, Physical & Social Science in Fishers, IN with 2.5%.
What is the Percentage of Population Employed in Life, Physical & Social Science in Fishers, IN?
Percentage of Population Employed in Life, Physical & Social Science in Fishers is 1.7%.
What is the Percentage of Population Employed in Life, Physical & Social Science in Indiana?
Percentage of Population Employed in Life, Physical & Social Science in Indiana is 0.83%.
What is the Percentage of Population Employed in Life, Physical & Social Science in the United States?
Percentage of Population Employed in Life, Physical & Social Science in the United States is 1.1%.