Highland, IN Map & Demographics
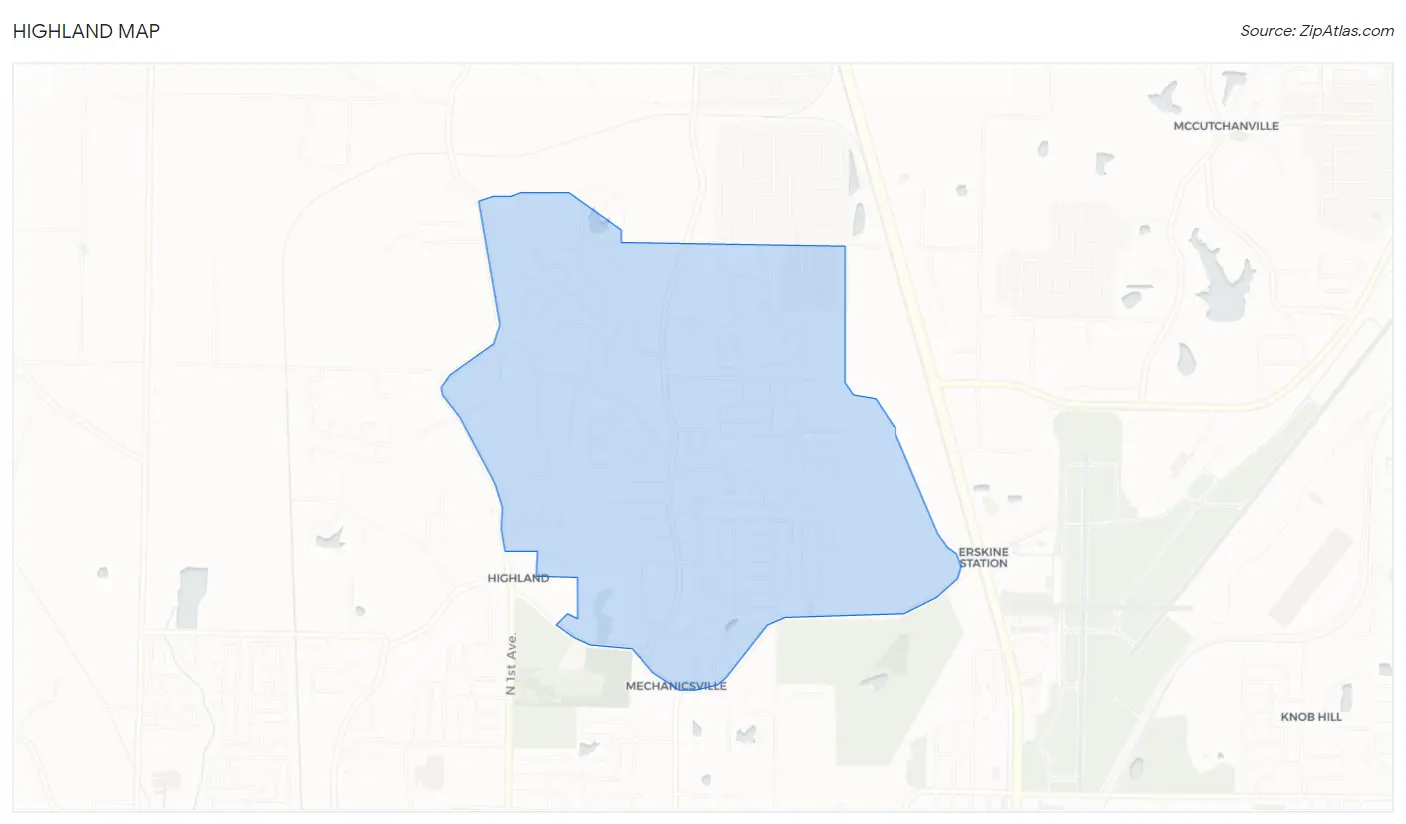
Highland Map
Highland Overview
$36,949
PER CAPITA INCOME
$92,376
AVG FAMILY INCOME
$90,787
AVG HOUSEHOLD INCOME
47.6%
WAGE / INCOME GAP [ % ]
52.4¢/ $1
WAGE / INCOME GAP [ $ ]
0.35
INEQUALITY / GINI INDEX
5,590
TOTAL POPULATION
2,815
MALE POPULATION
2,775
FEMALE POPULATION
101.44
MALES / 100 FEMALES
98.58
FEMALES / 100 MALES
43.9
MEDIAN AGE
3.0
AVG FAMILY SIZE
2.7
AVG HOUSEHOLD SIZE
2,693
LABOR FORCE [ PEOPLE ]
60.0%
PERCENT IN LABOR FORCE
1.8%
UNEMPLOYMENT RATE
Highland Zip Codes
Highland Area Codes
Income in Highland
Income Overview in Highland
Per Capita Income in Highland is $36,949, while median incomes of families and households are $92,376 and $90,787 respectively.
| Characteristic | Number | Measure |
| Per Capita Income | 5,590 | $36,949 |
| Median Family Income | 1,737 | $92,376 |
| Mean Family Income | 1,737 | $108,091 |
| Median Household Income | 2,083 | $90,787 |
| Mean Household Income | 2,083 | $99,345 |
| Income Deficit | 1,737 | $0 |
| Wage / Income Gap (%) | 5,590 | 47.61% |
| Wage / Income Gap ($) | 5,590 | 52.39¢ per $1 |
| Gini / Inequality Index | 5,590 | 0.35 |
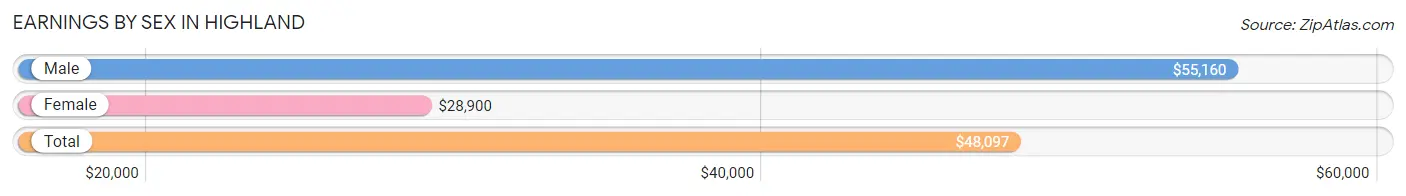
Earnings by Sex in Highland
Average Earnings in Highland are $48,097, $55,160 for men and $28,900 for women, a difference of 47.6%.
| Sex | Number | Average Earnings |
| Male | 1,688 (56.7%) | $55,160 |
| Female | 1,290 (43.3%) | $28,900 |
| Total | 2,978 (100.0%) | $48,097 |
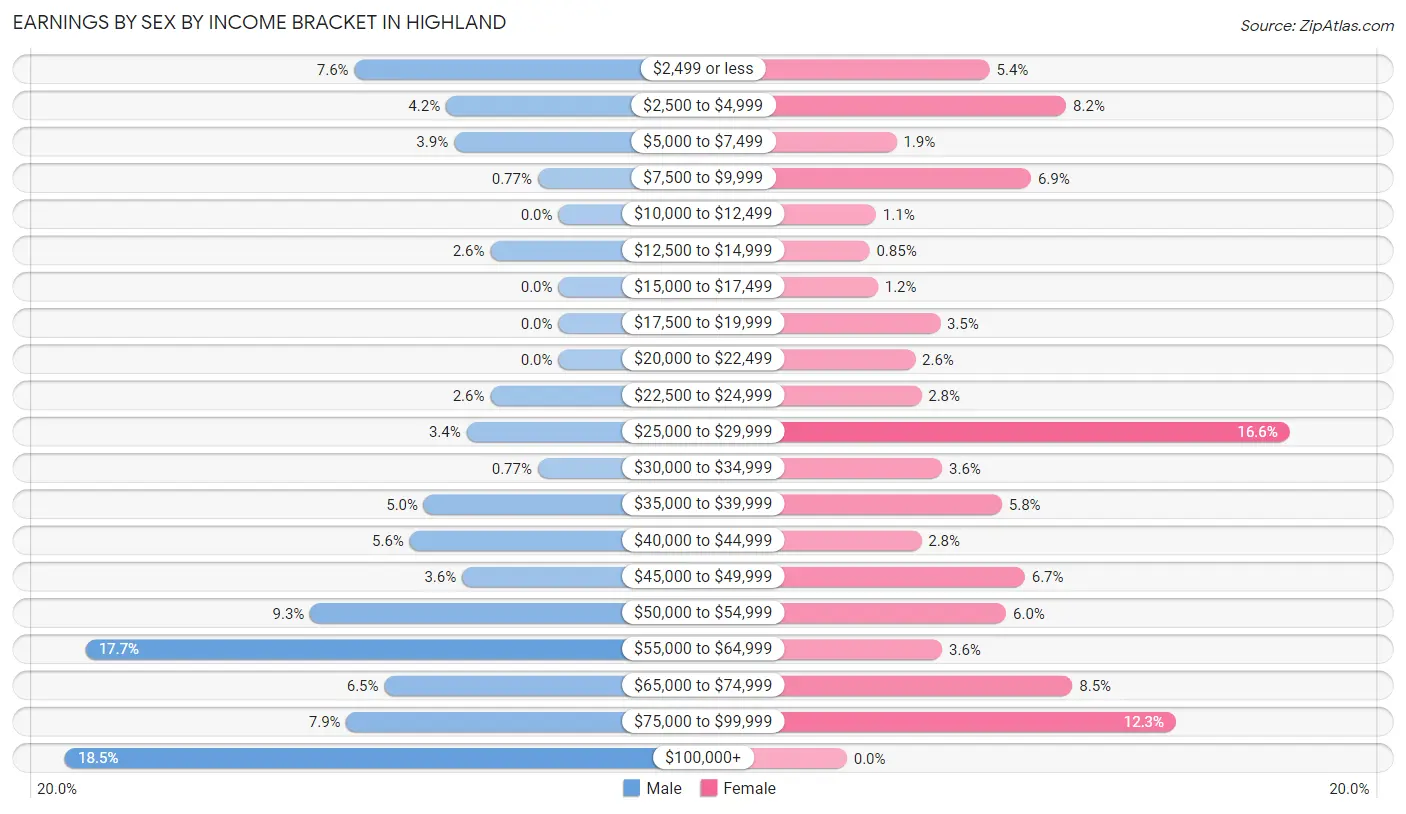
Earnings by Sex by Income Bracket in Highland
The most common earnings brackets in Highland are $100,000+ for men (312 | 18.5%) and $25,000 to $29,999 for women (214 | 16.6%).
| Income | Male | Female |
| $2,499 or less | 129 (7.6%) | 69 (5.3%) |
| $2,500 to $4,999 | 71 (4.2%) | 106 (8.2%) |
| $5,000 to $7,499 | 66 (3.9%) | 24 (1.9%) |
| $7,500 to $9,999 | 13 (0.8%) | 89 (6.9%) |
| $10,000 to $12,499 | 0 (0.0%) | 14 (1.1%) |
| $12,500 to $14,999 | 43 (2.5%) | 11 (0.9%) |
| $15,000 to $17,499 | 0 (0.0%) | 15 (1.2%) |
| $17,500 to $19,999 | 0 (0.0%) | 45 (3.5%) |
| $20,000 to $22,499 | 0 (0.0%) | 33 (2.6%) |
| $22,500 to $24,999 | 43 (2.5%) | 36 (2.8%) |
| $25,000 to $29,999 | 58 (3.4%) | 214 (16.6%) |
| $30,000 to $34,999 | 13 (0.8%) | 46 (3.6%) |
| $35,000 to $39,999 | 85 (5.0%) | 75 (5.8%) |
| $40,000 to $44,999 | 94 (5.6%) | 36 (2.8%) |
| $45,000 to $49,999 | 61 (3.6%) | 86 (6.7%) |
| $50,000 to $54,999 | 157 (9.3%) | 77 (6.0%) |
| $55,000 to $64,999 | 299 (17.7%) | 46 (3.6%) |
| $65,000 to $74,999 | 110 (6.5%) | 109 (8.5%) |
| $75,000 to $99,999 | 134 (7.9%) | 159 (12.3%) |
| $100,000+ | 312 (18.5%) | 0 (0.0%) |
| Total | 1,688 (100.0%) | 1,290 (100.0%) |
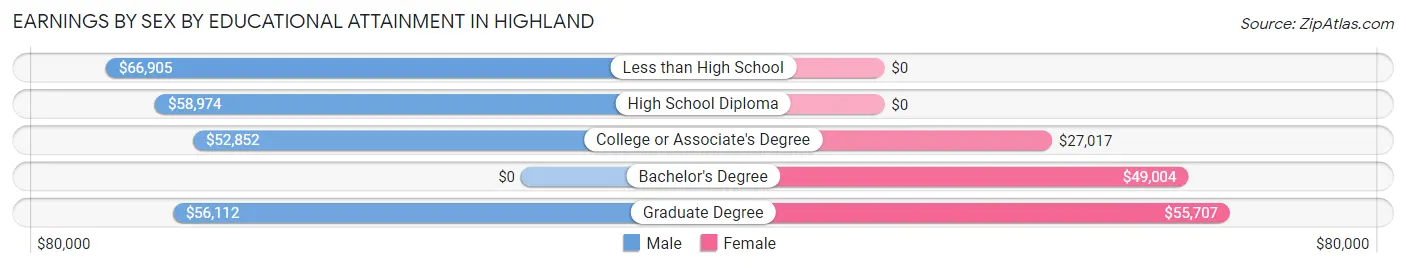
Earnings by Sex by Educational Attainment in Highland
Average earnings in Highland are $56,715 for men and $36,133 for women, a difference of 36.3%. Men with an educational attainment of less than high school enjoy the highest average annual earnings of $66,905, while those with college or associate's degree education earn the least with $52,852. Women with an educational attainment of graduate degree earn the most with the average annual earnings of $55,707, while those with college or associate's degree education have the smallest earnings of $27,017.
| Educational Attainment | Male Income | Female Income |
| Less than High School | $66,905 | $0 |
| High School Diploma | $58,974 | $0 |
| College or Associate's Degree | $52,852 | $27,017 |
| Bachelor's Degree | - | - |
| Graduate Degree | $56,112 | $55,707 |
| Total | $56,715 | $36,133 |
Family Income in Highland
Family Income Brackets in Highland
According to the Highland family income data, there are 426 families falling into the $100,000 to $149,999 income range, which is the most common income bracket and makes up 24.5% of all families. Conversely, the less than $10,000 income bracket is the least frequent group with only 10 families (0.6%) belonging to this category.
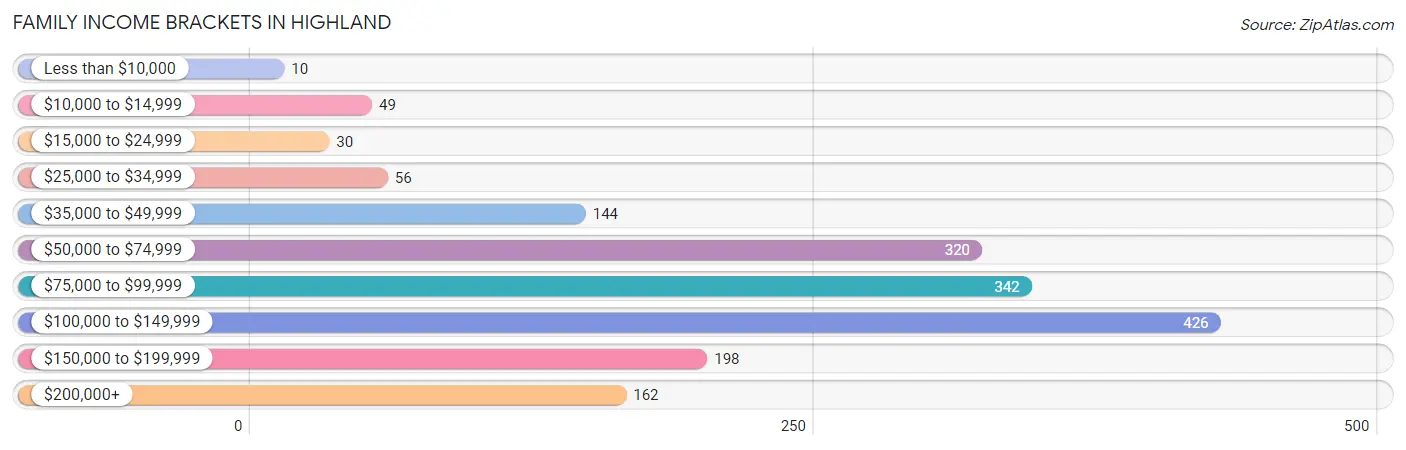
| Income Bracket | # Families | % Families |
| Less than $10,000 | 10 | 0.6% |
| $10,000 to $14,999 | 49 | 2.8% |
| $15,000 to $24,999 | 30 | 1.7% |
| $25,000 to $34,999 | 56 | 3.2% |
| $35,000 to $49,999 | 144 | 8.3% |
| $50,000 to $74,999 | 320 | 18.4% |
| $75,000 to $99,999 | 342 | 19.7% |
| $100,000 to $149,999 | 426 | 24.5% |
| $150,000 to $199,999 | 198 | 11.4% |
| $200,000+ | 162 | 9.3% |
Family Income by Famaliy Size in Highland
5-person families (177 | 10.2%) account for the highest median family income in Highland with $155,938 per family, while 2-person families (950 | 54.7%) have the highest median income of $45,262 per family member.
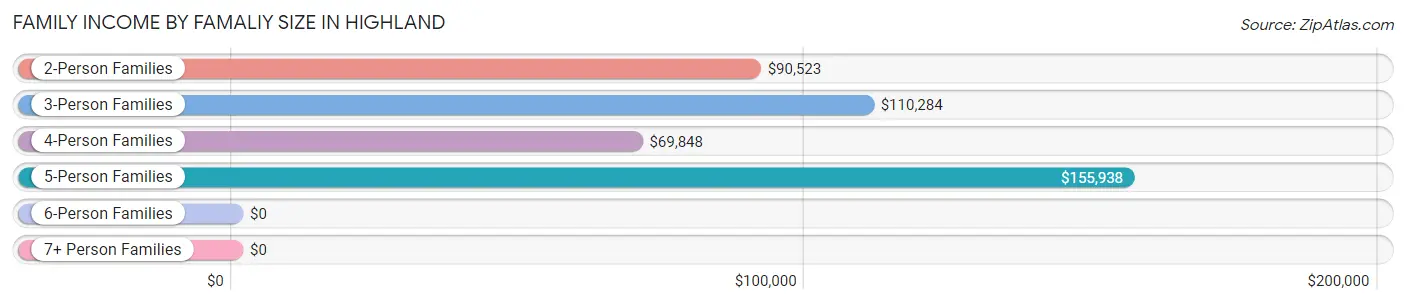
| Income Bracket | # Families | Median Income |
| 2-Person Families | 950 (54.7%) | $90,523 |
| 3-Person Families | 199 (11.5%) | $110,284 |
| 4-Person Families | 386 (22.2%) | $69,848 |
| 5-Person Families | 177 (10.2%) | $155,938 |
| 6-Person Families | 0 (0.0%) | $0 |
| 7+ Person Families | 25 (1.4%) | $0 |
| Total | 1,737 (100.0%) | $92,376 |
Family Income by Number of Earners in Highland
The median family income in Highland is $92,376, with families comprising 3+ earners (317) having the highest median family income of $155,740, while families with no earners (264) have the lowest median family income of $49,292, accounting for 18.2% and 15.2% of families, respectively.
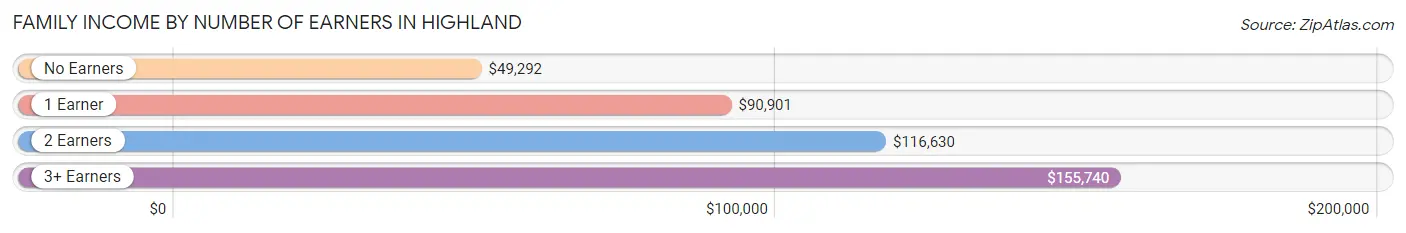
| Number of Earners | # Families | Median Income |
| No Earners | 264 (15.2%) | $49,292 |
| 1 Earner | 490 (28.2%) | $90,901 |
| 2 Earners | 666 (38.3%) | $116,630 |
| 3+ Earners | 317 (18.2%) | $155,740 |
| Total | 1,737 (100.0%) | $92,376 |
Household Income in Highland
Household Income Brackets in Highland
With 458 households falling in the category, the $100,000 to $149,999 income range is the most frequent in Highland, accounting for 22.0% of all households. In contrast, only 27 households (1.3%) fall into the less than $10,000 income bracket, making it the least populous group.
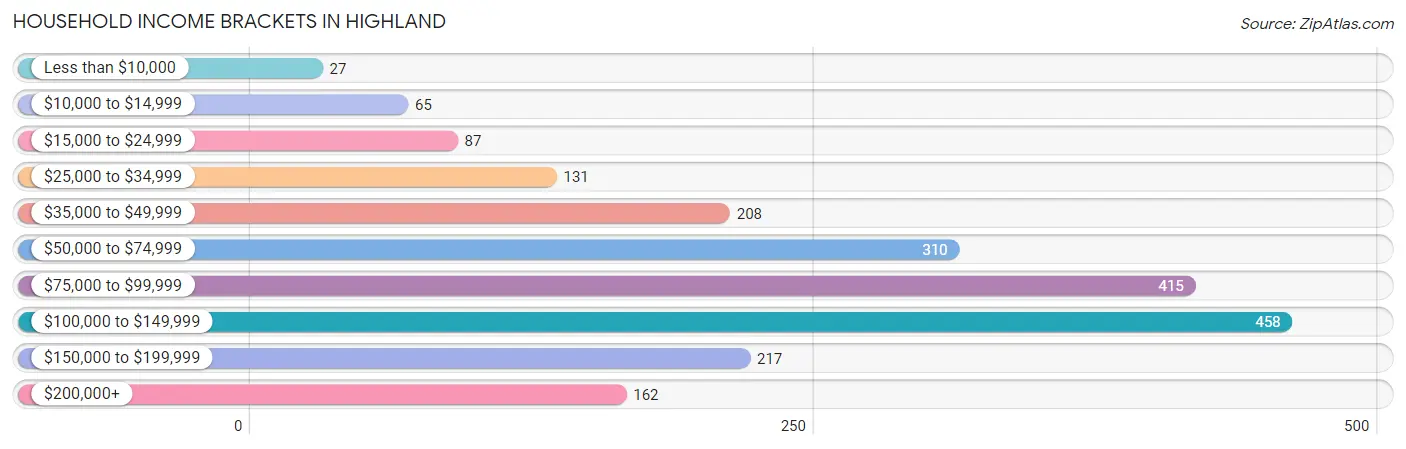
| Income Bracket | # Households | % Households |
| Less than $10,000 | 27 | 1.3% |
| $10,000 to $14,999 | 65 | 3.1% |
| $15,000 to $24,999 | 87 | 4.2% |
| $25,000 to $34,999 | 131 | 6.3% |
| $35,000 to $49,999 | 208 | 10.0% |
| $50,000 to $74,999 | 310 | 14.9% |
| $75,000 to $99,999 | 415 | 19.9% |
| $100,000 to $149,999 | 458 | 22.0% |
| $150,000 to $199,999 | 217 | 10.4% |
| $200,000+ | 162 | 7.8% |
Household Income by Householder Age in Highland
The median household income in Highland is $90,787, with the highest median household income of $106,813 found in the 45 to 64 years age bracket for the primary householder. A total of 737 households (35.4%) fall into this category. Meanwhile, the 15 to 24 years age bracket for the primary householder has the lowest median household income of $0, with 8 households (0.4%) in this group.
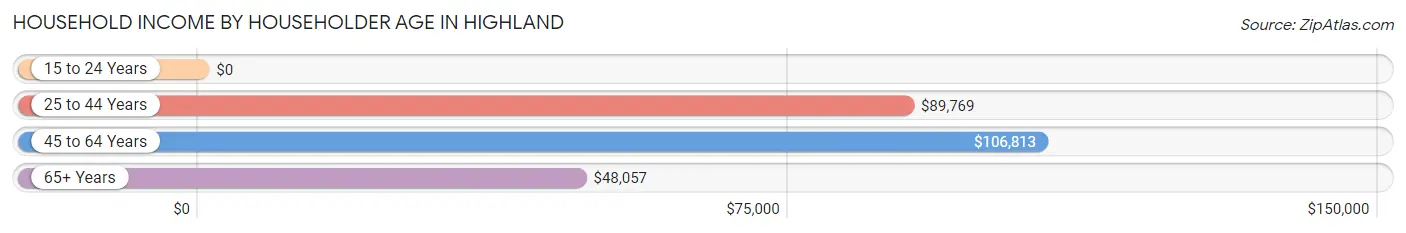
| Income Bracket | # Households | Median Income |
| 15 to 24 Years | 8 (0.4%) | $0 |
| 25 to 44 Years | 609 (29.2%) | $89,769 |
| 45 to 64 Years | 737 (35.4%) | $106,813 |
| 65+ Years | 729 (35.0%) | $48,057 |
| Total | 2,083 (100.0%) | $90,787 |
Poverty in Highland
Income Below Poverty by Sex and Age in Highland
With 4.2% poverty level for males and 6.3% for females among the residents of Highland, 15 year old males and 16 and 17 year old females are the most vulnerable to poverty, with 25 males (100.0%) and 17 females (23.3%) in their respective age groups living below the poverty level.
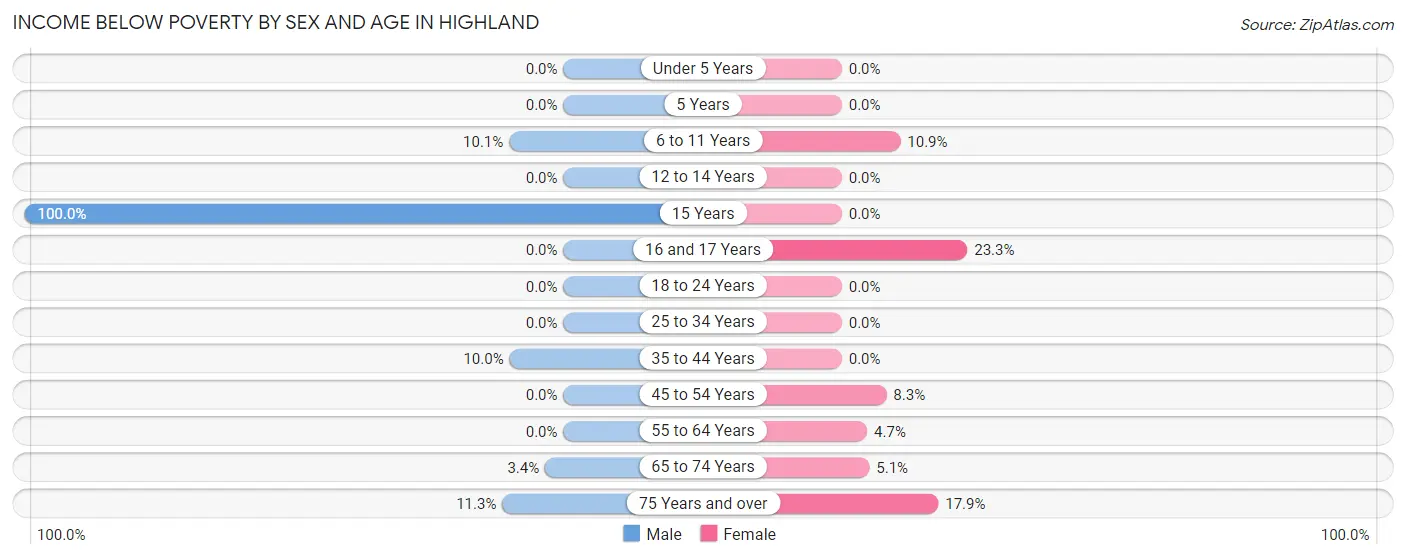
| Age Bracket | Male | Female |
| Under 5 Years | 0 (0.0%) | 0 (0.0%) |
| 5 Years | 0 (0.0%) | 0 (0.0%) |
| 6 to 11 Years | 29 (10.1%) | 25 (10.9%) |
| 12 to 14 Years | 0 (0.0%) | 0 (0.0%) |
| 15 Years | 25 (100.0%) | 0 (0.0%) |
| 16 and 17 Years | 0 (0.0%) | 17 (23.3%) |
| 18 to 24 Years | 0 (0.0%) | 0 (0.0%) |
| 25 to 34 Years | 0 (0.0%) | 0 (0.0%) |
| 35 to 44 Years | 30 (10.0%) | 0 (0.0%) |
| 45 to 54 Years | 0 (0.0%) | 27 (8.3%) |
| 55 to 64 Years | 0 (0.0%) | 23 (4.7%) |
| 65 to 74 Years | 11 (3.4%) | 12 (5.1%) |
| 75 Years and over | 22 (11.3%) | 72 (17.9%) |
| Total | 117 (4.2%) | 176 (6.3%) |
Income Above Poverty by Sex and Age in Highland
According to the poverty statistics in Highland, males aged under 5 years and females aged under 5 years are the age groups that are most secure financially, with 100.0% of males and 100.0% of females in these age groups living above the poverty line.
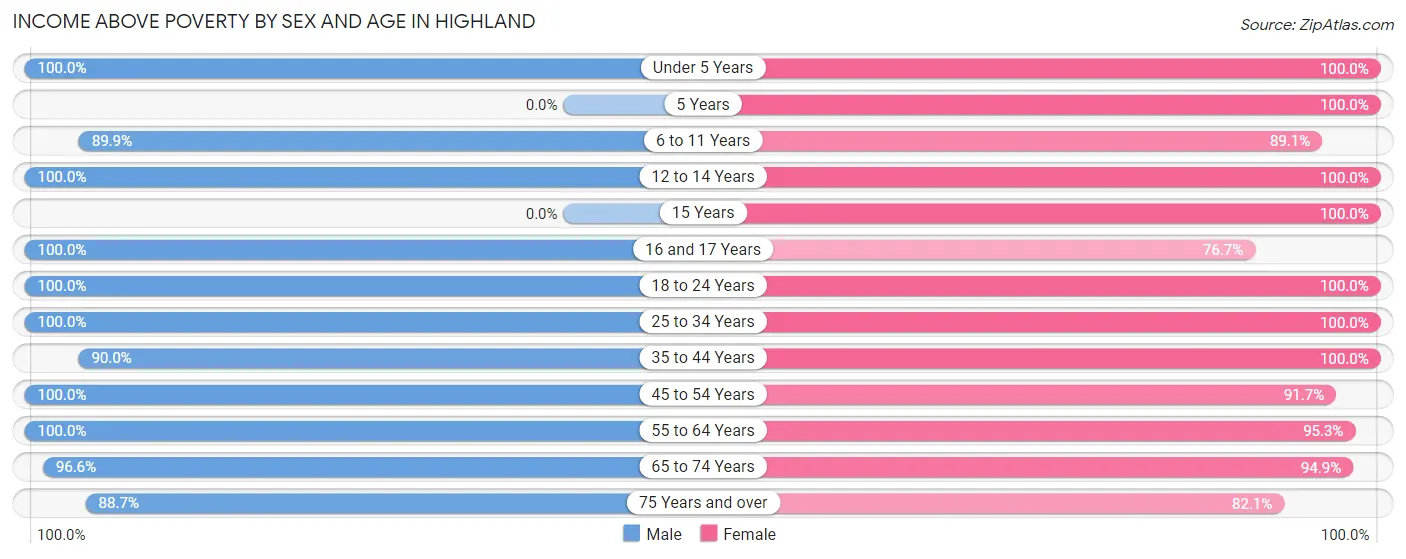
| Age Bracket | Male | Female |
| Under 5 Years | 157 (100.0%) | 162 (100.0%) |
| 5 Years | 0 (0.0%) | 54 (100.0%) |
| 6 to 11 Years | 259 (89.9%) | 205 (89.1%) |
| 12 to 14 Years | 112 (100.0%) | 27 (100.0%) |
| 15 Years | 0 (0.0%) | 47 (100.0%) |
| 16 and 17 Years | 147 (100.0%) | 56 (76.7%) |
| 18 to 24 Years | 165 (100.0%) | 149 (100.0%) |
| 25 to 34 Years | 319 (100.0%) | 435 (100.0%) |
| 35 to 44 Years | 270 (90.0%) | 147 (100.0%) |
| 45 to 54 Years | 371 (100.0%) | 299 (91.7%) |
| 55 to 64 Years | 413 (100.0%) | 465 (95.3%) |
| 65 to 74 Years | 313 (96.6%) | 223 (94.9%) |
| 75 Years and over | 172 (88.7%) | 330 (82.1%) |
| Total | 2,698 (95.8%) | 2,599 (93.7%) |
Income Below Poverty Among Married-Couple Families in Highland
The poverty statistics for married-couple families in Highland show that 2.1% or 33 of the total 1,568 families live below the poverty line. Families with no children have the highest poverty rate of 3.5%, comprising of 33 families. On the other hand, families with 1 or 2 children have the lowest poverty rate of 0.0%, which includes 0 families.
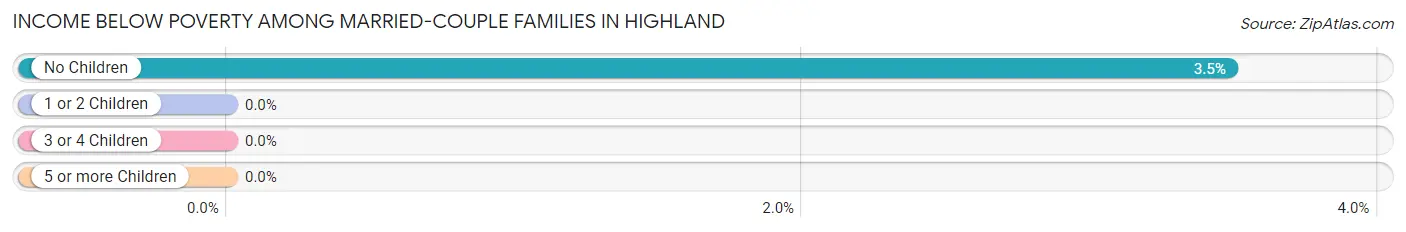
| Children | Above Poverty | Below Poverty |
| No Children | 916 (96.5%) | 33 (3.5%) |
| 1 or 2 Children | 594 (100.0%) | 0 (0.0%) |
| 3 or 4 Children | 25 (100.0%) | 0 (0.0%) |
| 5 or more Children | 0 (0.0%) | 0 (0.0%) |
| Total | 1,535 (97.9%) | 33 (2.1%) |
Income Below Poverty Among Single-Parent Households in Highland
According to the poverty data in Highland, 27.5% or 30 single-father households and 45.0% or 27 single-mother households are living below the poverty line. Among single-father households, those with 3 or 4 children have the highest poverty rate, with 30 households (100.0%) experiencing poverty. Likewise, among single-mother households, those with 1 or 2 children have the highest poverty rate, with 27 households (45.0%) falling below the poverty line.
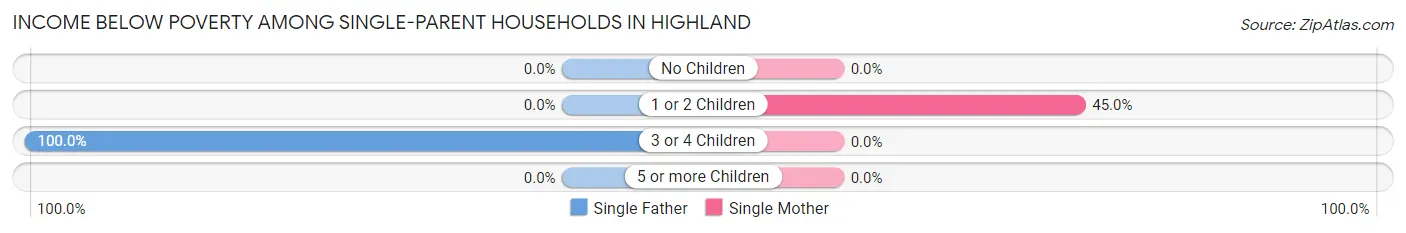
| Children | Single Father | Single Mother |
| No Children | 0 (0.0%) | 0 (0.0%) |
| 1 or 2 Children | 0 (0.0%) | 27 (45.0%) |
| 3 or 4 Children | 30 (100.0%) | 0 (0.0%) |
| 5 or more Children | 0 (0.0%) | 0 (0.0%) |
| Total | 30 (27.5%) | 27 (45.0%) |
Income Below Poverty Among Married-Couple vs Single-Parent Households in Highland
The poverty data for Highland shows that 33 of the married-couple family households (2.1%) and 57 of the single-parent households (33.7%) are living below the poverty level. Within the married-couple family households, those with no children have the highest poverty rate, with 33 households (3.5%) falling below the poverty line. Among the single-parent households, those with 3 or 4 children have the highest poverty rate, with 30 household (100.0%) living below poverty.
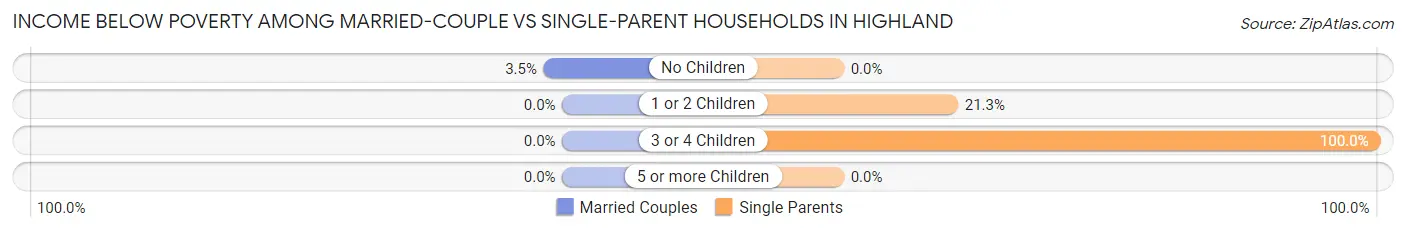
| Children | Married-Couple Families | Single-Parent Households |
| No Children | 33 (3.5%) | 0 (0.0%) |
| 1 or 2 Children | 0 (0.0%) | 27 (21.3%) |
| 3 or 4 Children | 0 (0.0%) | 30 (100.0%) |
| 5 or more Children | 0 (0.0%) | 0 (0.0%) |
| Total | 33 (2.1%) | 57 (33.7%) |
Race in Highland
The most populous races in Highland are White / Caucasian (5,366 | 96.0%), Hispanic or Latino (215 | 3.8%), and Black / African American (128 | 2.3%).
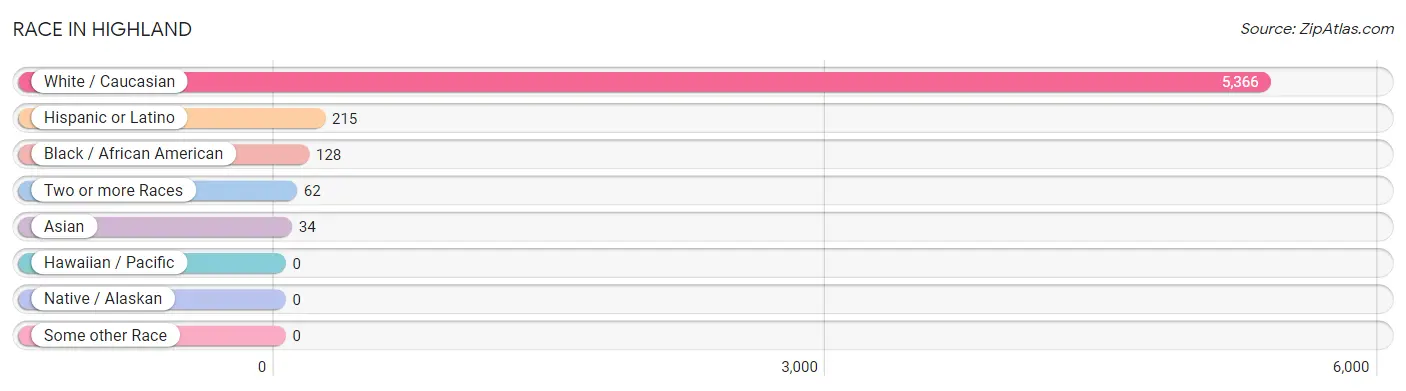
| Race | # Population | % Population |
| Asian | 34 | 0.6% |
| Black / African American | 128 | 2.3% |
| Hawaiian / Pacific | 0 | 0.0% |
| Hispanic or Latino | 215 | 3.8% |
| Native / Alaskan | 0 | 0.0% |
| White / Caucasian | 5,366 | 96.0% |
| Two or more Races | 62 | 1.1% |
| Some other Race | 0 | 0.0% |
| Total | 5,590 | 100.0% |
Ancestry in Highland
The most populous ancestries reported in Highland are German (1,776 | 31.8%), English (795 | 14.2%), Irish (357 | 6.4%), American (233 | 4.2%), and Mexican (200 | 3.6%), together accounting for 60.1% of all Highland residents.
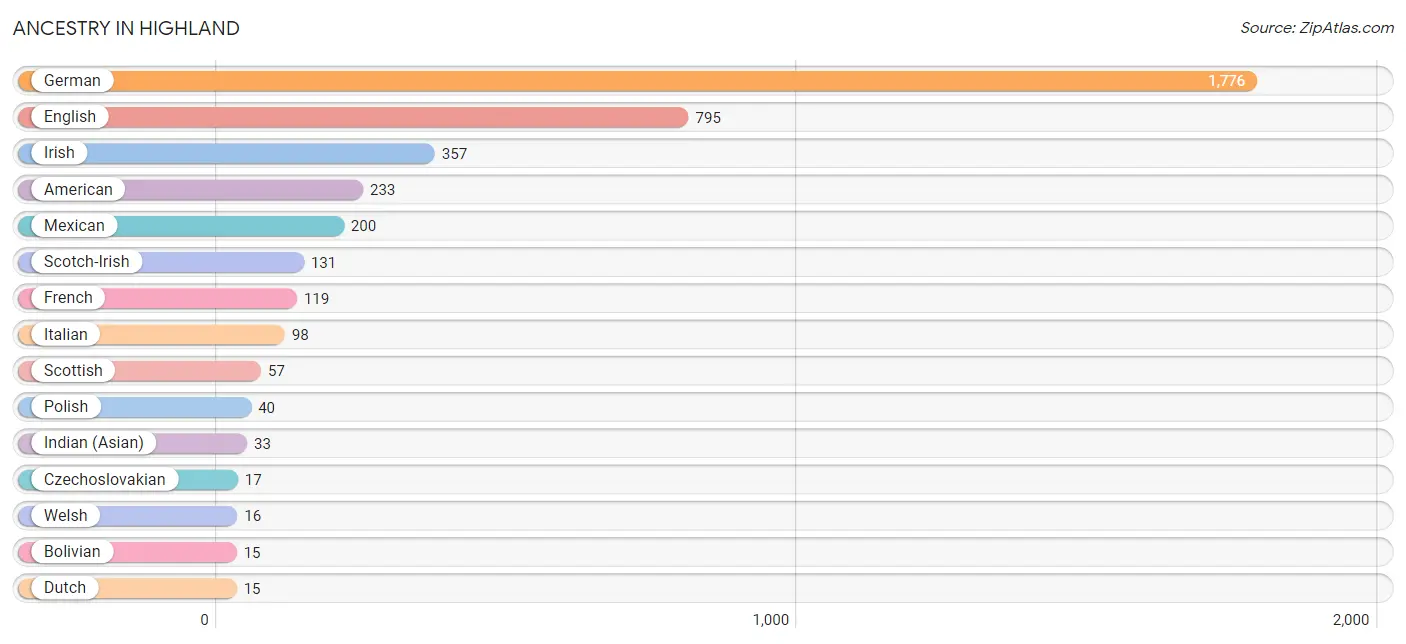
| Ancestry | # Population | % Population |
| American | 233 | 4.2% |
| Bolivian | 15 | 0.3% |
| Canadian | 14 | 0.3% |
| Cherokee | 2 | 0.0% |
| Czechoslovakian | 17 | 0.3% |
| Dutch | 15 | 0.3% |
| English | 795 | 14.2% |
| European | 3 | 0.1% |
| French | 119 | 2.1% |
| German | 1,776 | 31.8% |
| Indian (Asian) | 33 | 0.6% |
| Irish | 357 | 6.4% |
| Italian | 98 | 1.8% |
| Mexican | 200 | 3.6% |
| Polish | 40 | 0.7% |
| Scandinavian | 15 | 0.3% |
| Scotch-Irish | 131 | 2.3% |
| Scottish | 57 | 1.0% |
| Slovak | 14 | 0.3% |
| South American | 15 | 0.3% |
| Thai | 1 | 0.0% |
| Welsh | 16 | 0.3% | View All 22 Rows |
Immigrants in Highland
The most numerous immigrant groups reported in Highland came from Europe (49 | 0.9%), Asia (34 | 0.6%), China (33 | 0.6%), Eastern Asia (33 | 0.6%), and Eastern Europe (33 | 0.6%), together accounting for 3.3% of all Highland residents.
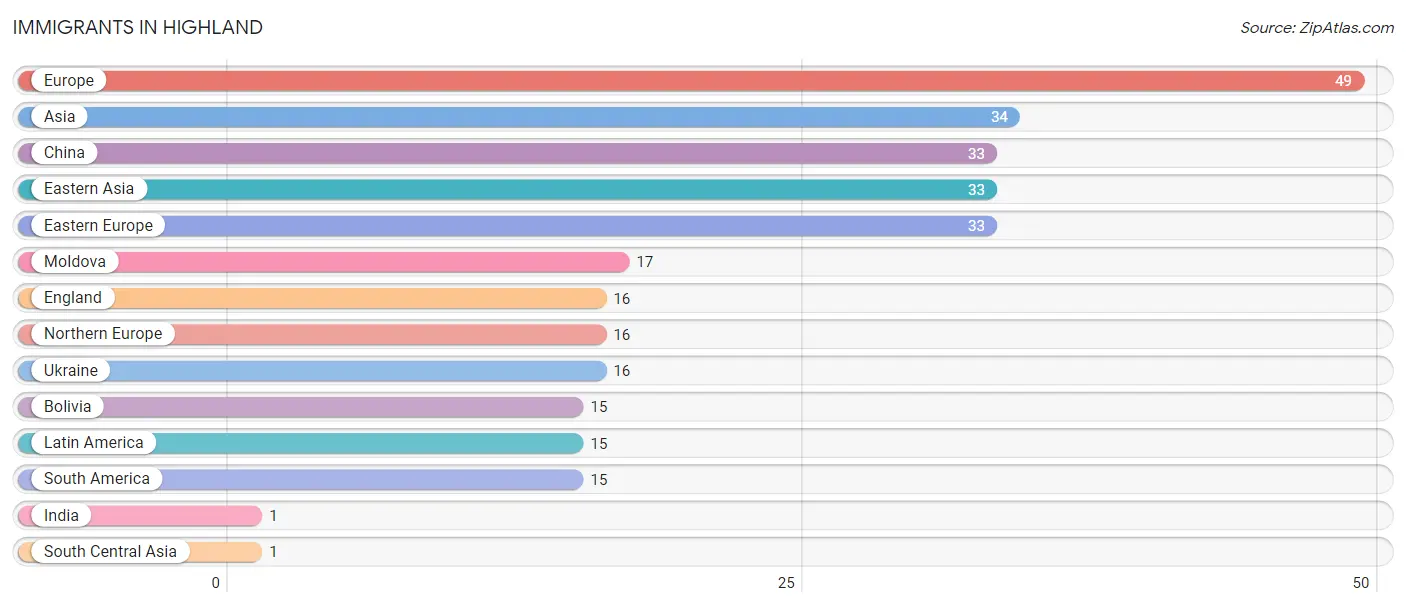
| Immigration Origin | # Population | % Population |
| Asia | 34 | 0.6% |
| Bolivia | 15 | 0.3% |
| China | 33 | 0.6% |
| Eastern Asia | 33 | 0.6% |
| Eastern Europe | 33 | 0.6% |
| England | 16 | 0.3% |
| Europe | 49 | 0.9% |
| India | 1 | 0.0% |
| Latin America | 15 | 0.3% |
| Moldova | 17 | 0.3% |
| Northern Europe | 16 | 0.3% |
| South America | 15 | 0.3% |
| South Central Asia | 1 | 0.0% |
| Ukraine | 16 | 0.3% | View All 14 Rows |
Sex and Age in Highland
Sex and Age in Highland
The most populous age groups in Highland are 55 to 59 Years (316 | 11.2%) for men and 60 to 64 Years (374 | 13.5%) for women.
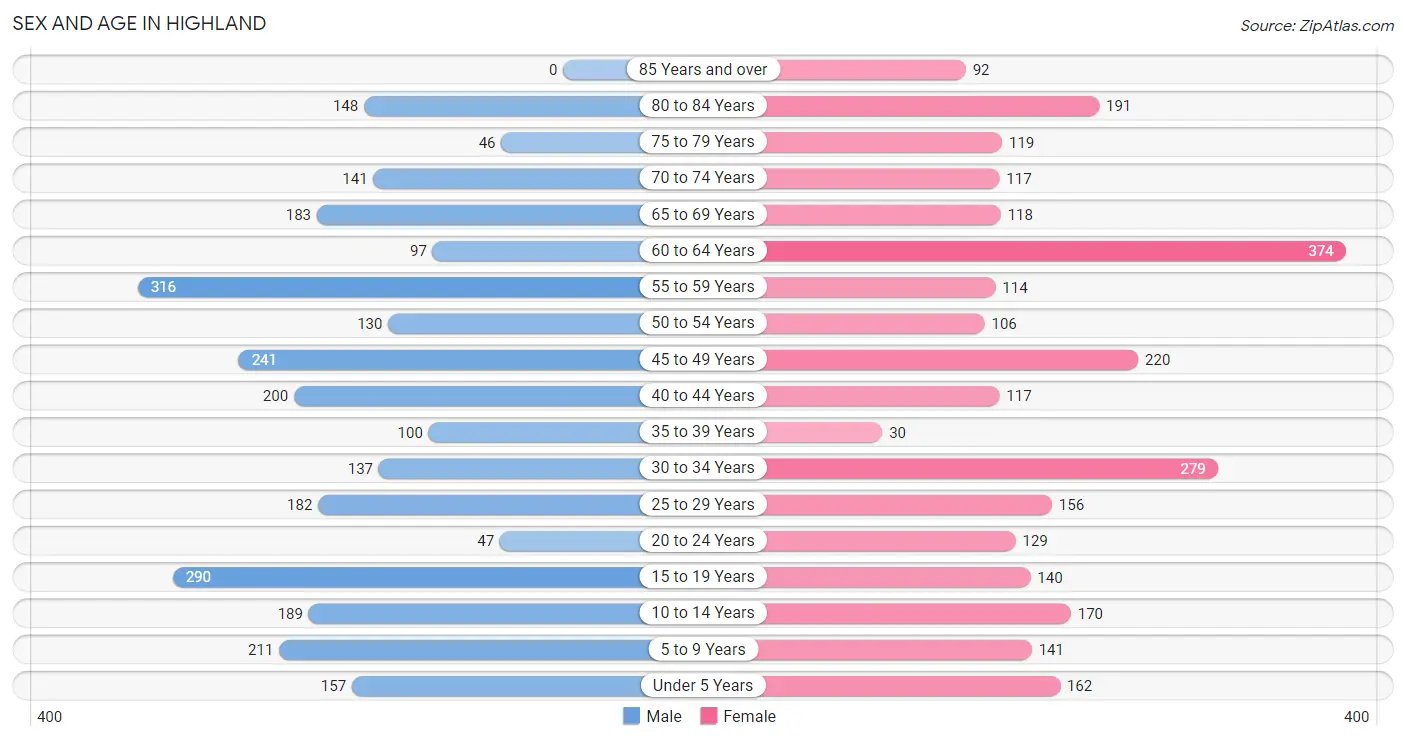
| Age Bracket | Male | Female |
| Under 5 Years | 157 (5.6%) | 162 (5.8%) |
| 5 to 9 Years | 211 (7.5%) | 141 (5.1%) |
| 10 to 14 Years | 189 (6.7%) | 170 (6.1%) |
| 15 to 19 Years | 290 (10.3%) | 140 (5.1%) |
| 20 to 24 Years | 47 (1.7%) | 129 (4.6%) |
| 25 to 29 Years | 182 (6.5%) | 156 (5.6%) |
| 30 to 34 Years | 137 (4.9%) | 279 (10.1%) |
| 35 to 39 Years | 100 (3.5%) | 30 (1.1%) |
| 40 to 44 Years | 200 (7.1%) | 117 (4.2%) |
| 45 to 49 Years | 241 (8.6%) | 220 (7.9%) |
| 50 to 54 Years | 130 (4.6%) | 106 (3.8%) |
| 55 to 59 Years | 316 (11.2%) | 114 (4.1%) |
| 60 to 64 Years | 97 (3.5%) | 374 (13.5%) |
| 65 to 69 Years | 183 (6.5%) | 118 (4.3%) |
| 70 to 74 Years | 141 (5.0%) | 117 (4.2%) |
| 75 to 79 Years | 46 (1.6%) | 119 (4.3%) |
| 80 to 84 Years | 148 (5.3%) | 191 (6.9%) |
| 85 Years and over | 0 (0.0%) | 92 (3.3%) |
| Total | 2,815 (100.0%) | 2,775 (100.0%) |
Families and Households in Highland
Median Family Size in Highland
The median family size in Highland is 2.96 persons per family, with single male/father families (109 | 6.3%) accounting for the largest median family size of 3.28 persons per family. On the other hand, single female/mother families (60 | 3.5%) represent the smallest median family size with 2.65 persons per family.
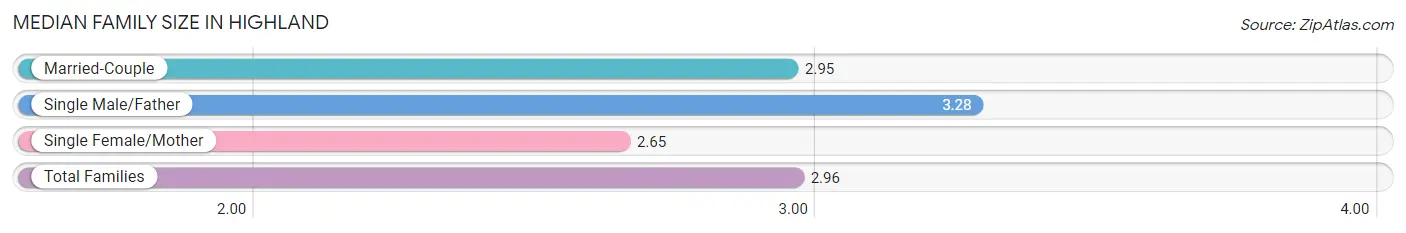
| Family Type | # Families | Family Size |
| Married-Couple | 1,568 (90.3%) | 2.95 |
| Single Male/Father | 109 (6.3%) | 3.28 |
| Single Female/Mother | 60 (3.5%) | 2.65 |
| Total Families | 1,737 (100.0%) | 2.96 |
Median Household Size in Highland
The median household size in Highland is 2.68 persons per household, with single female/mother households (60 | 2.9%) accounting for the largest median household size of 3.47 persons per household. non-family households (346 | 16.6%) represent the smallest median household size with 1.05 persons per household.
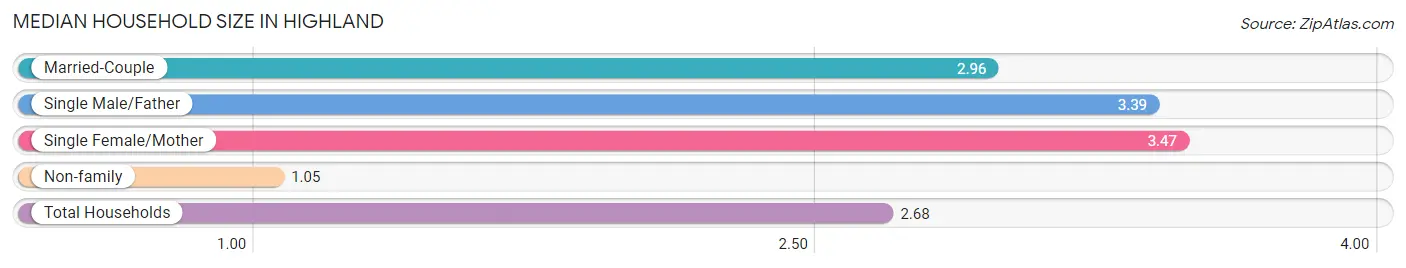
| Household Type | # Households | Household Size |
| Married-Couple | 1,568 (75.3%) | 2.96 |
| Single Male/Father | 109 (5.2%) | 3.39 |
| Single Female/Mother | 60 (2.9%) | 3.47 |
| Non-family | 346 (16.6%) | 1.05 |
| Total Households | 2,083 (100.0%) | 2.68 |
Household Size by Marriage Status in Highland
Out of a total of 2,083 households in Highland, 1,737 (83.4%) are family households, while 346 (16.6%) are nonfamily households. The most numerous type of family households are 2-person households, comprising 902, and the most common type of nonfamily households are 1-person households, comprising 329.
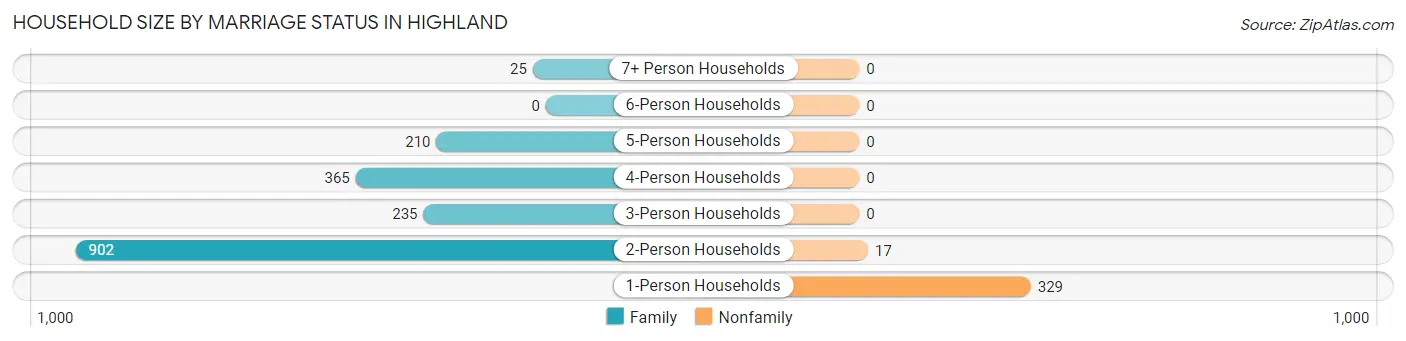
| Household Size | Family Households | Nonfamily Households |
| 1-Person Households | - | 329 (15.8%) |
| 2-Person Households | 902 (43.3%) | 17 (0.8%) |
| 3-Person Households | 235 (11.3%) | 0 (0.0%) |
| 4-Person Households | 365 (17.5%) | 0 (0.0%) |
| 5-Person Households | 210 (10.1%) | 0 (0.0%) |
| 6-Person Households | 0 (0.0%) | 0 (0.0%) |
| 7+ Person Households | 25 (1.2%) | 0 (0.0%) |
| Total | 1,737 (83.4%) | 346 (16.6%) |
Female Fertility in Highland
Fertility by Age in Highland
Average fertility rate in Highland is 69.0 births per 1,000 women. Women in the age bracket of 15 to 19 years have the highest fertility rate with 143.0 births per 1,000 women. Women in the age bracket of 20 to 34 years acount for 73.3% of all women with births.
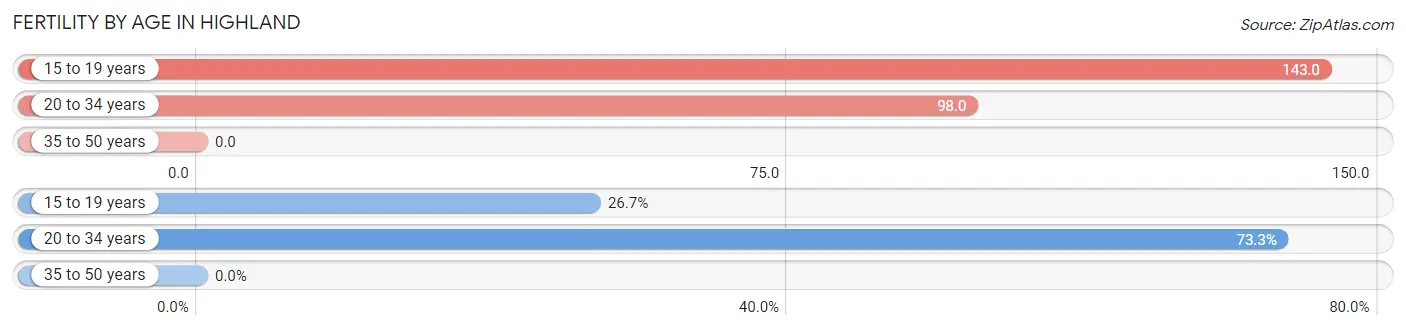
| Age Bracket | Women with Births | Births / 1,000 Women |
| 15 to 19 years | 20 (26.7%) | 143.0 |
| 20 to 34 years | 55 (73.3%) | 98.0 |
| 35 to 50 years | 0 (0.0%) | 0.0 |
| Total | 75 (100.0%) | 69.0 |
Fertility by Age by Marriage Status in Highland
73.3% of women with births (75) in Highland are married. The highest percentage of unmarried women with births falls into 15 to 19 years age bracket with 100.0% of them unmarried at the time of birth, while the lowest percentage of unmarried women with births belong to 20 to 34 years age bracket with 0.0% of them unmarried.
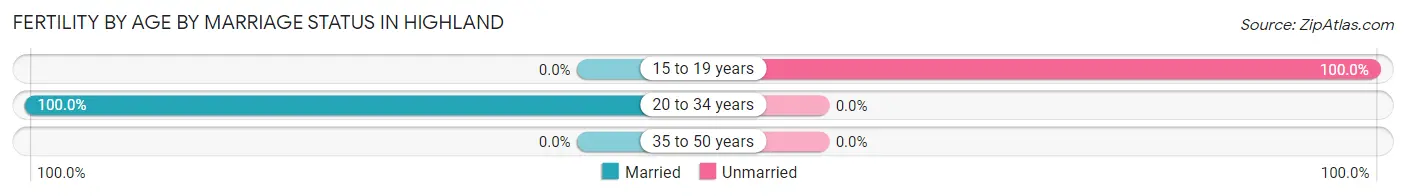
| Age Bracket | Married | Unmarried |
| 15 to 19 years | 0 (0.0%) | 20 (100.0%) |
| 20 to 34 years | 55 (100.0%) | 0 (0.0%) |
| 35 to 50 years | 0 (0.0%) | 0 (0.0%) |
| Total | 55 (73.3%) | 20 (26.7%) |
Fertility by Education in Highland
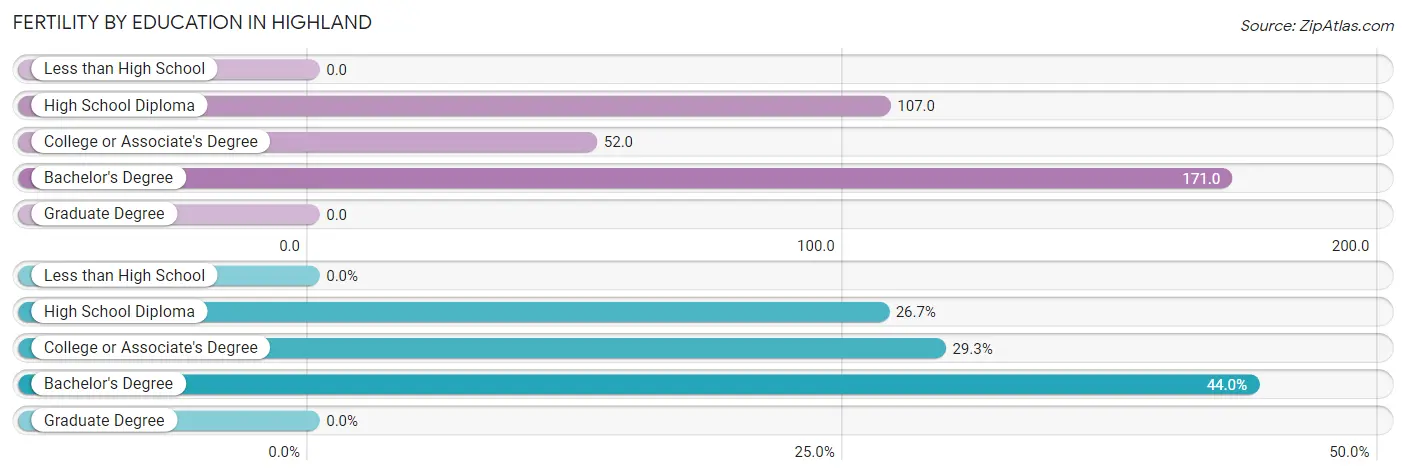
| Educational Attainment | Women with Births | Births / 1,000 Women |
| Less than High School | 0 (0.0%) | 0.0 |
| High School Diploma | 20 (26.7%) | 107.0 |
| College or Associate's Degree | 22 (29.3%) | 52.0 |
| Bachelor's Degree | 33 (44.0%) | 171.0 |
| Graduate Degree | 0 (0.0%) | 0.0 |
| Total | 75 (100.0%) | 69.0 |
Fertility by Education by Marriage Status in Highland
26.7% of women with births in Highland are unmarried. Women with the educational attainment of college or associate's degree are most likely to be married with 100.0% of them married at childbirth, while women with the educational attainment of high school diploma are least likely to be married with 100.0% of them unmarried at childbirth.
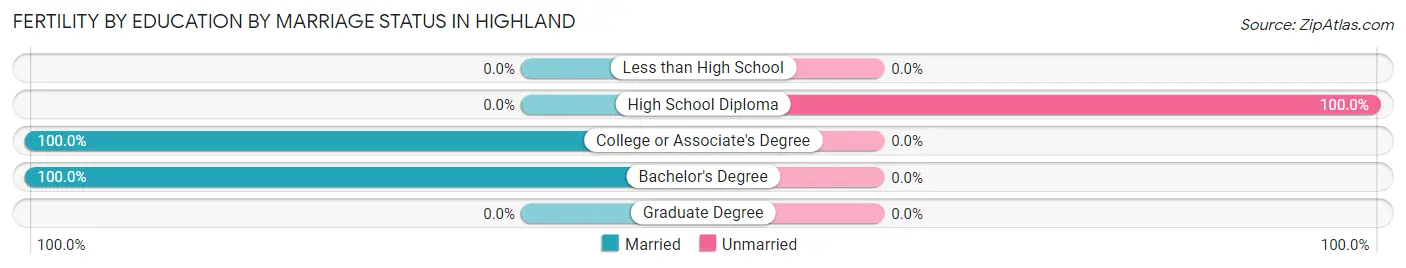
| Educational Attainment | Married | Unmarried |
| Less than High School | 0 (0.0%) | 0 (0.0%) |
| High School Diploma | 0 (0.0%) | 20 (100.0%) |
| College or Associate's Degree | 22 (100.0%) | 0 (0.0%) |
| Bachelor's Degree | 33 (100.0%) | 0 (0.0%) |
| Graduate Degree | 0 (0.0%) | 0 (0.0%) |
| Total | 55 (73.3%) | 20 (26.7%) |
Employment Characteristics in Highland
Employment by Class of Employer in Highland
Among the 2,535 employed individuals in Highland, private company employees (1,800 | 71.0%), local government employees (368 | 14.5%), and not-for-profit organizations (143 | 5.6%) make up the most common classes of employment.
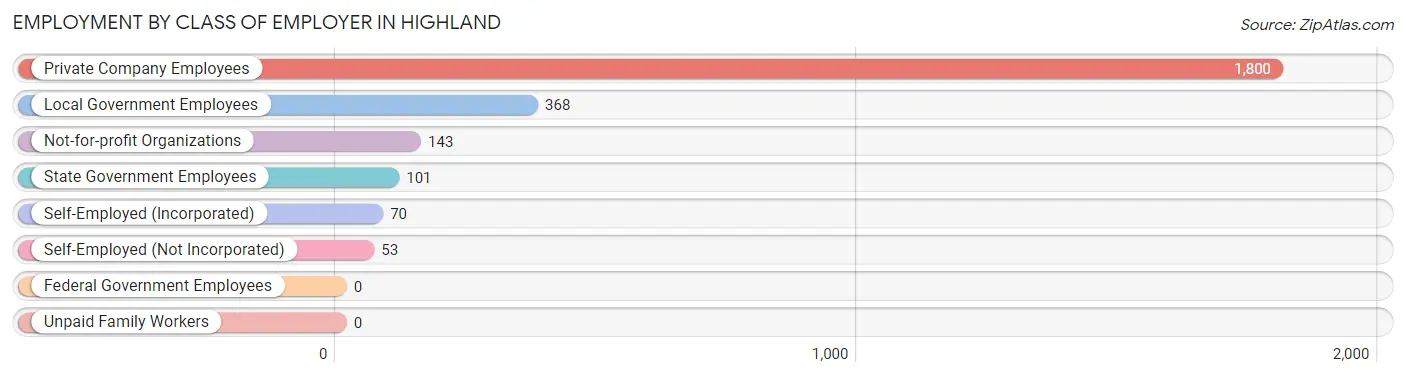
| Employer Class | # Employees | % Employees |
| Private Company Employees | 1,800 | 71.0% |
| Self-Employed (Incorporated) | 70 | 2.8% |
| Self-Employed (Not Incorporated) | 53 | 2.1% |
| Not-for-profit Organizations | 143 | 5.6% |
| Local Government Employees | 368 | 14.5% |
| State Government Employees | 101 | 4.0% |
| Federal Government Employees | 0 | 0.0% |
| Unpaid Family Workers | 0 | 0.0% |
| Total | 2,535 | 100.0% |
Employment Status by Age in Highland
According to the labor force statistics for Highland, out of the total population over 16 years of age (4,488), 60.0% or 2,693 individuals are in the labor force, with 1.8% or 48 of them unemployed. The age group with the highest labor force participation rate is 20 to 24 years, with 95.5% or 168 individuals in the labor force. Within the labor force, the 20 to 24 years age range has the highest percentage of unemployed individuals, with 8.9% or 15 of them being unemployed.
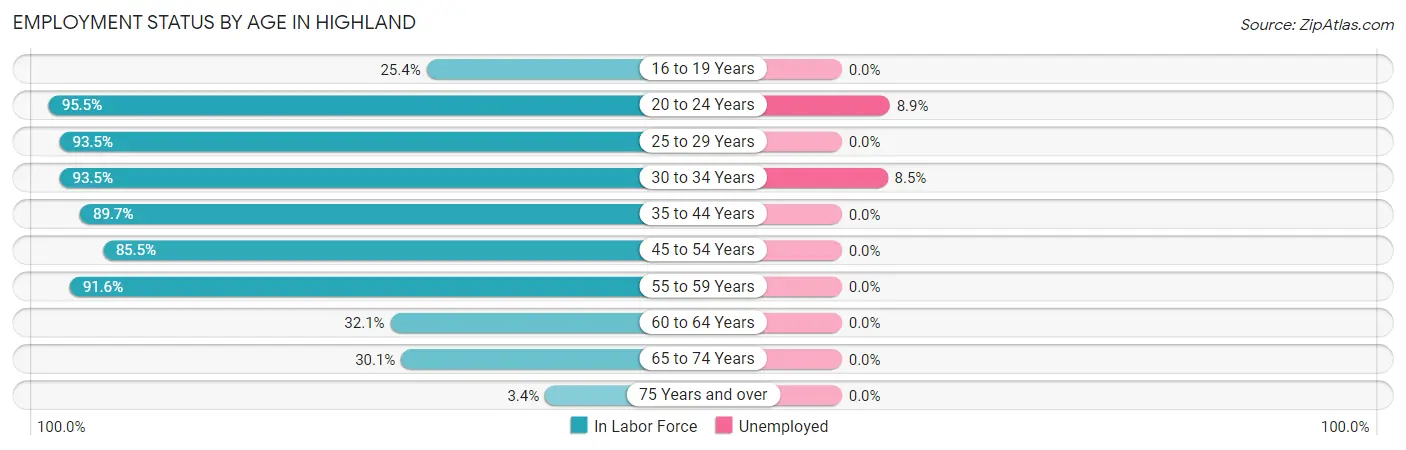
| Age Bracket | In Labor Force | Unemployed |
| 16 to 19 Years | 91 (25.4%) | 0 (0.0%) |
| 20 to 24 Years | 168 (95.5%) | 15 (8.9%) |
| 25 to 29 Years | 316 (93.5%) | 0 (0.0%) |
| 30 to 34 Years | 389 (93.5%) | 33 (8.5%) |
| 35 to 44 Years | 401 (89.7%) | 0 (0.0%) |
| 45 to 54 Years | 596 (85.5%) | 0 (0.0%) |
| 55 to 59 Years | 394 (91.6%) | 0 (0.0%) |
| 60 to 64 Years | 151 (32.1%) | 0 (0.0%) |
| 65 to 74 Years | 168 (30.1%) | 0 (0.0%) |
| 75 Years and over | 20 (3.4%) | 0 (0.0%) |
| Total | 2,693 (60.0%) | 48 (1.8%) |
Employment Status by Educational Attainment in Highland
According to labor force statistics for Highland, 80.3% of individuals (2,248) out of the total population between 25 and 64 years of age (2,799) are in the labor force, with 1.5% or 34 of them being unemployed. The group with the highest labor force participation rate are those with the educational attainment of less than high school, with 100.0% or 114 individuals in the labor force. Within the labor force, individuals with college / associate degree education have the highest percentage of unemployment, with 3.6% or 33 of them being unemployed.
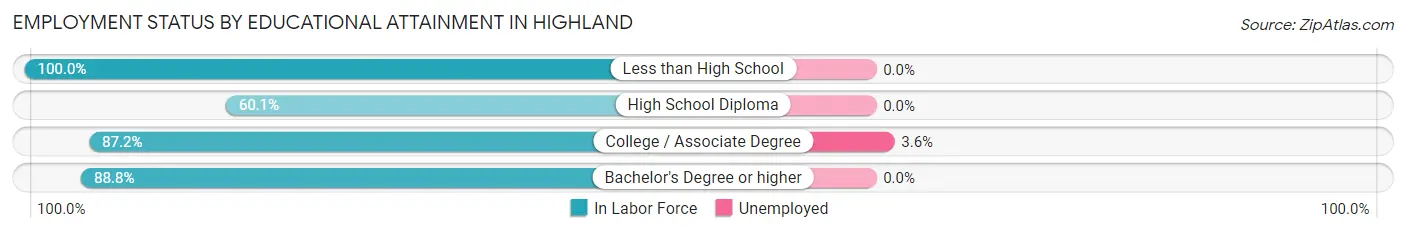
| Educational Attainment | In Labor Force | Unemployed |
| Less than High School | 114 (100.0%) | 0 (0.0%) |
| High School Diploma | 492 (60.1%) | 0 (0.0%) |
| College / Associate Degree | 920 (87.2%) | 38 (3.6%) |
| Bachelor's Degree or higher | 721 (88.8%) | 0 (0.0%) |
| Total | 2,248 (80.3%) | 42 (1.5%) |
Employment Occupations by Sex in Highland
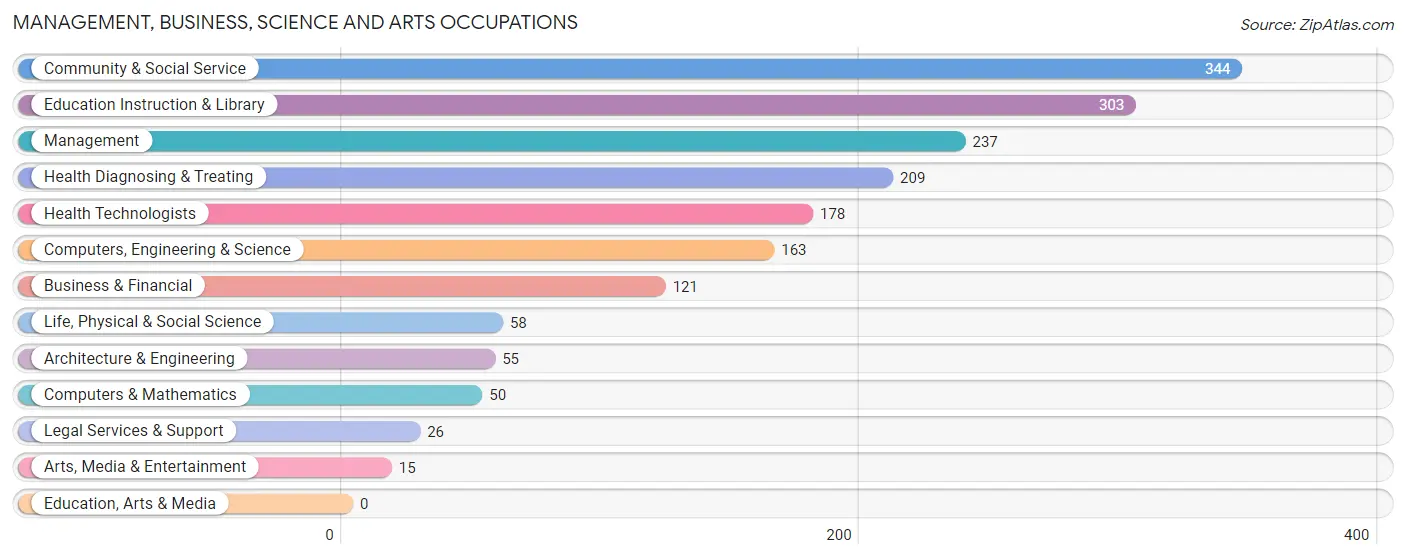
Management, Business, Science and Arts Occupations
The most common Management, Business, Science and Arts occupations in Highland are Community & Social Service (344 | 13.0%), Education Instruction & Library (303 | 11.5%), Management (237 | 9.0%), Health Diagnosing & Treating (209 | 7.9%), and Health Technologists (178 | 6.7%).
Management, Business, Science and Arts Occupations by Sex
Within the Management, Business, Science and Arts occupations in Highland, the most male-oriented occupations are Computers & Mathematics (100.0%), Legal Services & Support (100.0%), and Management (91.1%), while the most female-oriented occupations are Arts, Media & Entertainment (100.0%), Health Diagnosing & Treating (100.0%), and Health Technologists (100.0%).
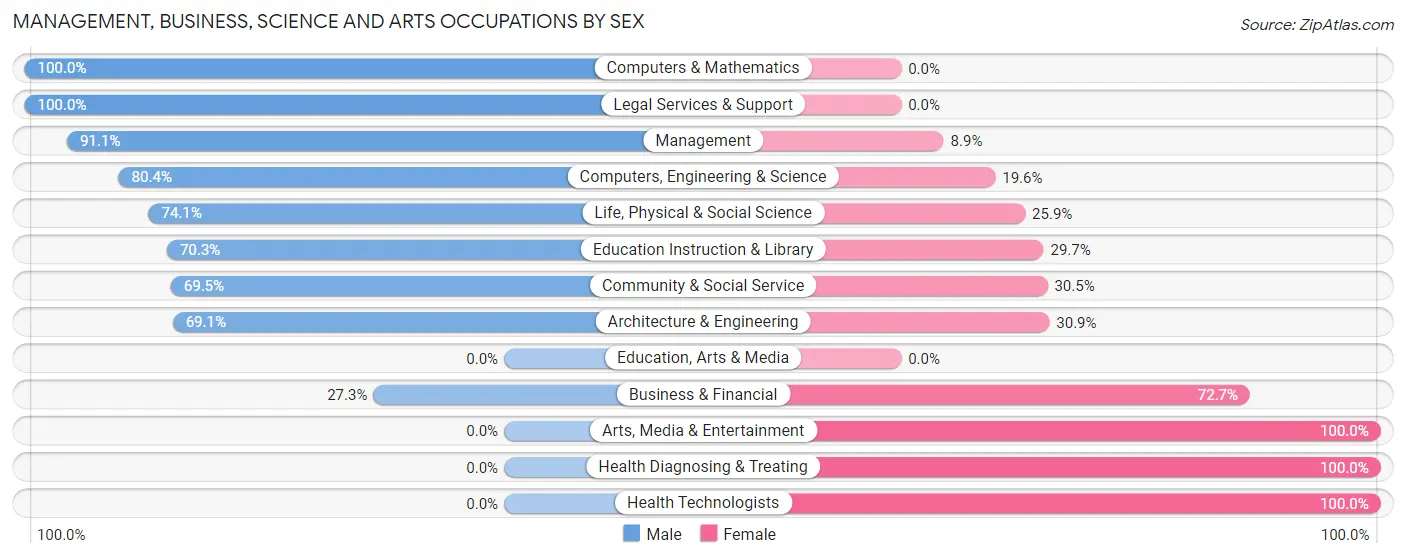
| Occupation | Male | Female |
| Management | 216 (91.1%) | 21 (8.9%) |
| Business & Financial | 33 (27.3%) | 88 (72.7%) |
| Computers, Engineering & Science | 131 (80.4%) | 32 (19.6%) |
| Computers & Mathematics | 50 (100.0%) | 0 (0.0%) |
| Architecture & Engineering | 38 (69.1%) | 17 (30.9%) |
| Life, Physical & Social Science | 43 (74.1%) | 15 (25.9%) |
| Community & Social Service | 239 (69.5%) | 105 (30.5%) |
| Education, Arts & Media | 0 (0.0%) | 0 (0.0%) |
| Legal Services & Support | 26 (100.0%) | 0 (0.0%) |
| Education Instruction & Library | 213 (70.3%) | 90 (29.7%) |
| Arts, Media & Entertainment | 0 (0.0%) | 15 (100.0%) |
| Health Diagnosing & Treating | 0 (0.0%) | 209 (100.0%) |
| Health Technologists | 0 (0.0%) | 178 (100.0%) |
| Total (Category) | 619 (57.6%) | 455 (42.4%) |
| Total (Overall) | 1,470 (55.6%) | 1,176 (44.4%) |
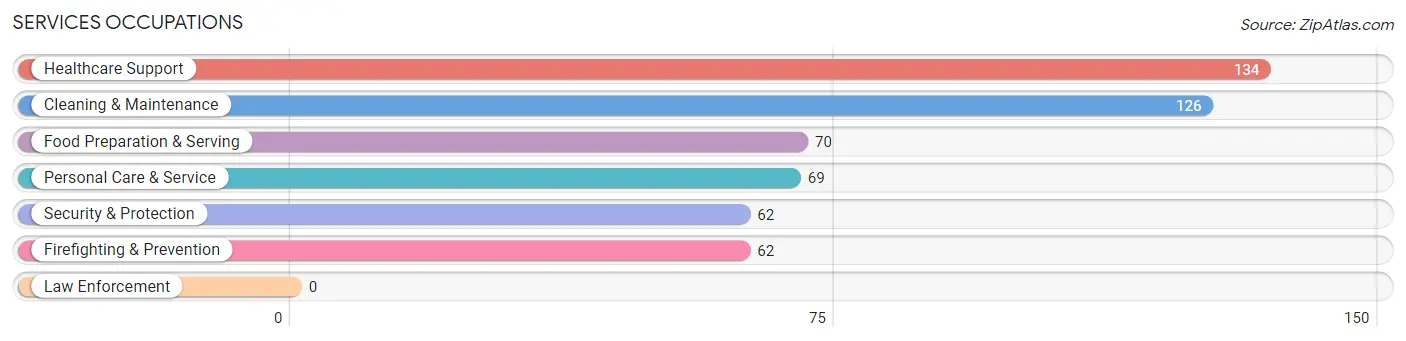
Services Occupations
The most common Services occupations in Highland are Healthcare Support (134 | 5.1%), Cleaning & Maintenance (126 | 4.8%), Food Preparation & Serving (70 | 2.6%), Personal Care & Service (69 | 2.6%), and Security & Protection (62 | 2.3%).
Services Occupations by Sex
Within the Services occupations in Highland, the most male-oriented occupations are Cleaning & Maintenance (78.6%), Security & Protection (67.7%), and Firefighting & Prevention (67.7%), while the most female-oriented occupations are Healthcare Support (100.0%), Food Preparation & Serving (100.0%), and Personal Care & Service (100.0%).
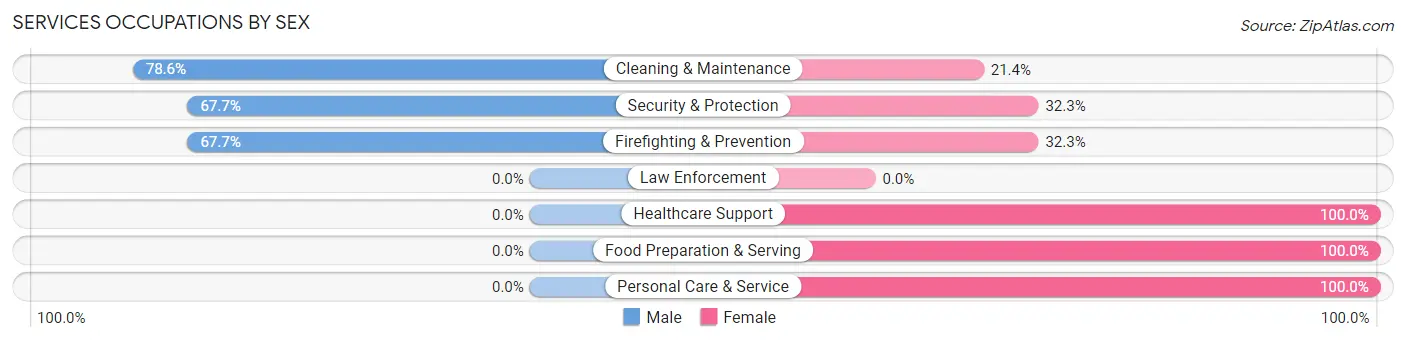
| Occupation | Male | Female |
| Healthcare Support | 0 (0.0%) | 134 (100.0%) |
| Security & Protection | 42 (67.7%) | 20 (32.3%) |
| Firefighting & Prevention | 42 (67.7%) | 20 (32.3%) |
| Law Enforcement | 0 (0.0%) | 0 (0.0%) |
| Food Preparation & Serving | 0 (0.0%) | 70 (100.0%) |
| Cleaning & Maintenance | 99 (78.6%) | 27 (21.4%) |
| Personal Care & Service | 0 (0.0%) | 69 (100.0%) |
| Total (Category) | 141 (30.6%) | 320 (69.4%) |
| Total (Overall) | 1,470 (55.6%) | 1,176 (44.4%) |
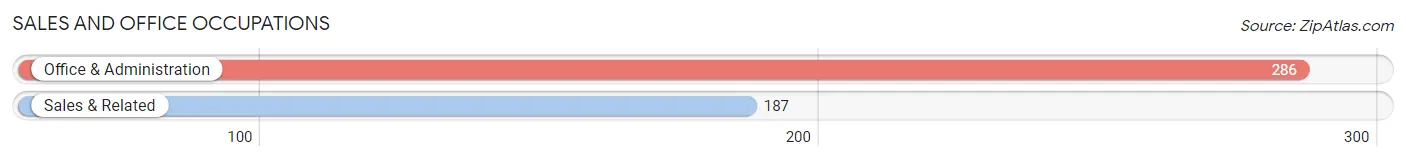
Sales and Office Occupations
The most common Sales and Office occupations in Highland are Office & Administration (286 | 10.8%), and Sales & Related (187 | 7.1%).
Sales and Office Occupations by Sex
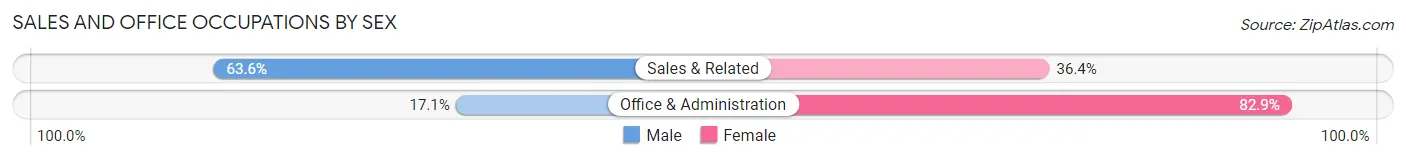
| Occupation | Male | Female |
| Sales & Related | 119 (63.6%) | 68 (36.4%) |
| Office & Administration | 49 (17.1%) | 237 (82.9%) |
| Total (Category) | 168 (35.5%) | 305 (64.5%) |
| Total (Overall) | 1,470 (55.6%) | 1,176 (44.4%) |
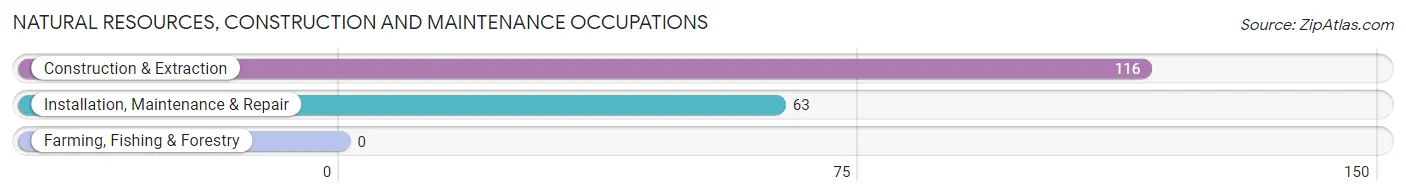
Natural Resources, Construction and Maintenance Occupations
The most common Natural Resources, Construction and Maintenance occupations in Highland are Construction & Extraction (116 | 4.4%), and Installation, Maintenance & Repair (63 | 2.4%).
Natural Resources, Construction and Maintenance Occupations by Sex
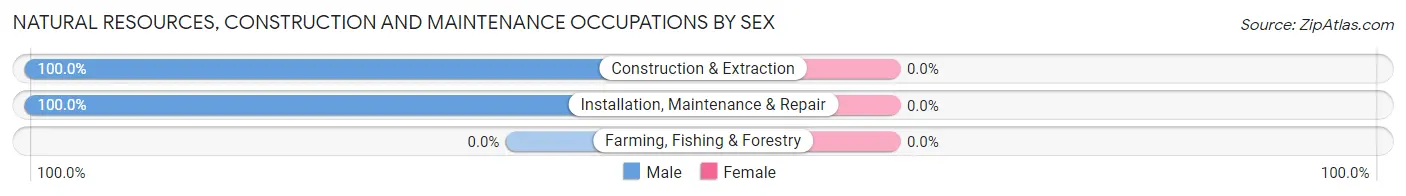
| Occupation | Male | Female |
| Farming, Fishing & Forestry | 0 (0.0%) | 0 (0.0%) |
| Construction & Extraction | 116 (100.0%) | 0 (0.0%) |
| Installation, Maintenance & Repair | 63 (100.0%) | 0 (0.0%) |
| Total (Category) | 179 (100.0%) | 0 (0.0%) |
| Total (Overall) | 1,470 (55.6%) | 1,176 (44.4%) |
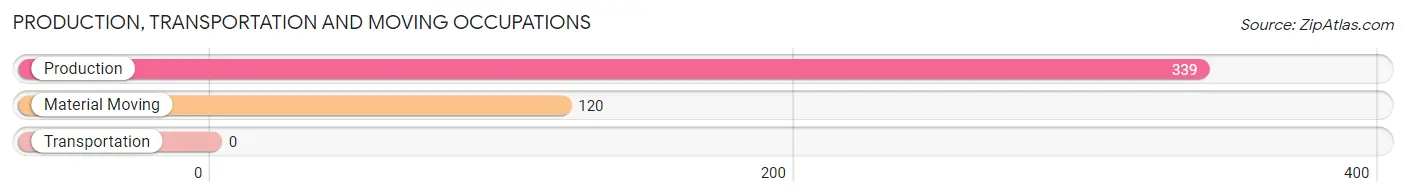
Production, Transportation and Moving Occupations
The most common Production, Transportation and Moving occupations in Highland are Production (339 | 12.8%), and Material Moving (120 | 4.5%).
Production, Transportation and Moving Occupations by Sex
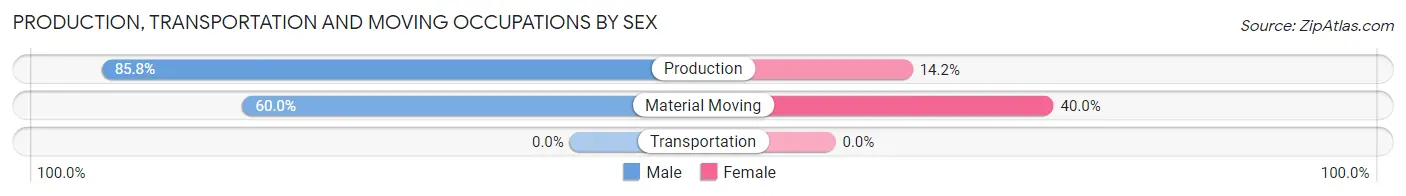
| Occupation | Male | Female |
| Production | 291 (85.8%) | 48 (14.2%) |
| Transportation | 0 (0.0%) | 0 (0.0%) |
| Material Moving | 72 (60.0%) | 48 (40.0%) |
| Total (Category) | 363 (79.1%) | 96 (20.9%) |
| Total (Overall) | 1,470 (55.6%) | 1,176 (44.4%) |
Employment Industries by Sex in Highland
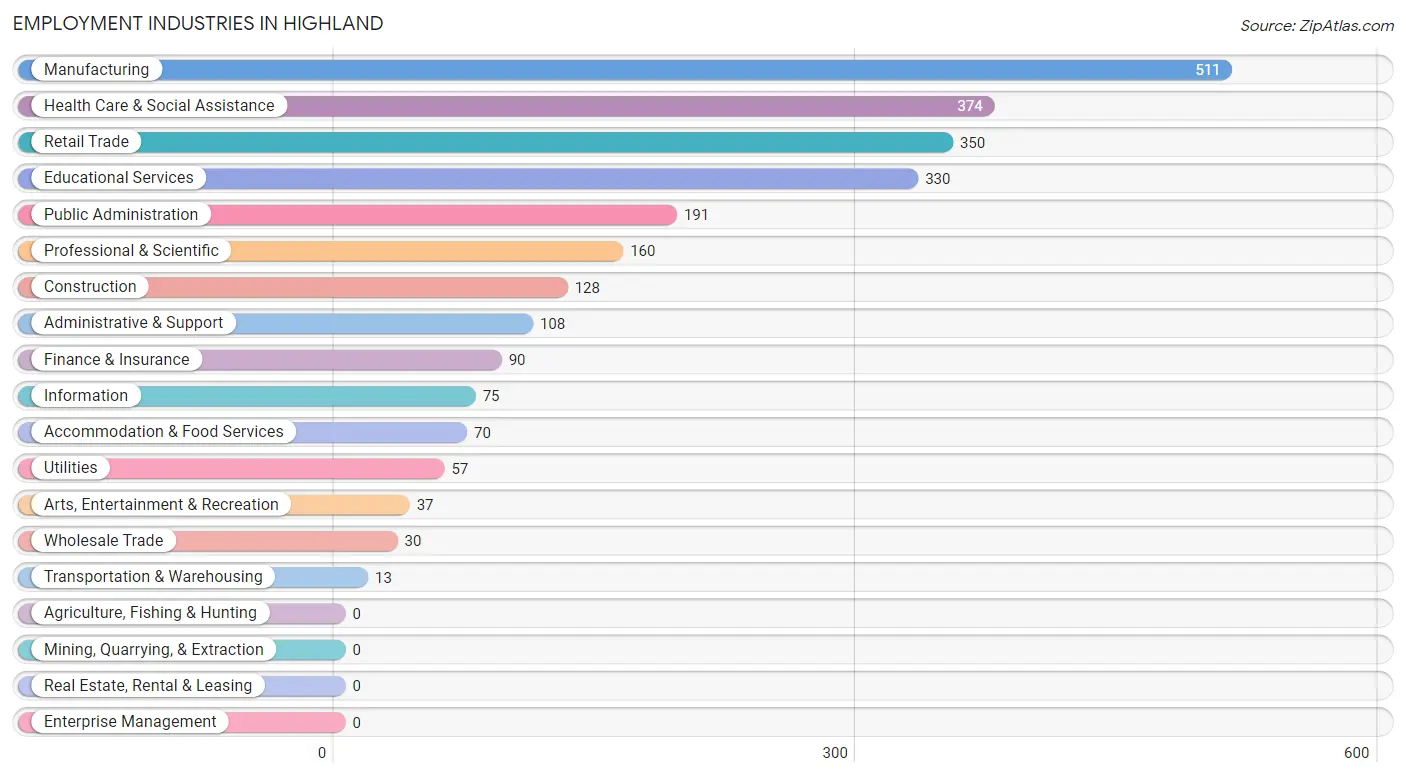
Employment Industries in Highland
The major employment industries in Highland include Manufacturing (511 | 19.3%), Health Care & Social Assistance (374 | 14.1%), Retail Trade (350 | 13.2%), Educational Services (330 | 12.5%), and Public Administration (191 | 7.2%).
Employment Industries by Sex in Highland
The Highland industries that see more men than women are Construction (100.0%), Utilities (100.0%), and Administrative & Support (100.0%), whereas the industries that tend to have a higher number of women are Transportation & Warehousing (100.0%), Finance & Insurance (100.0%), and Arts, Entertainment & Recreation (100.0%).
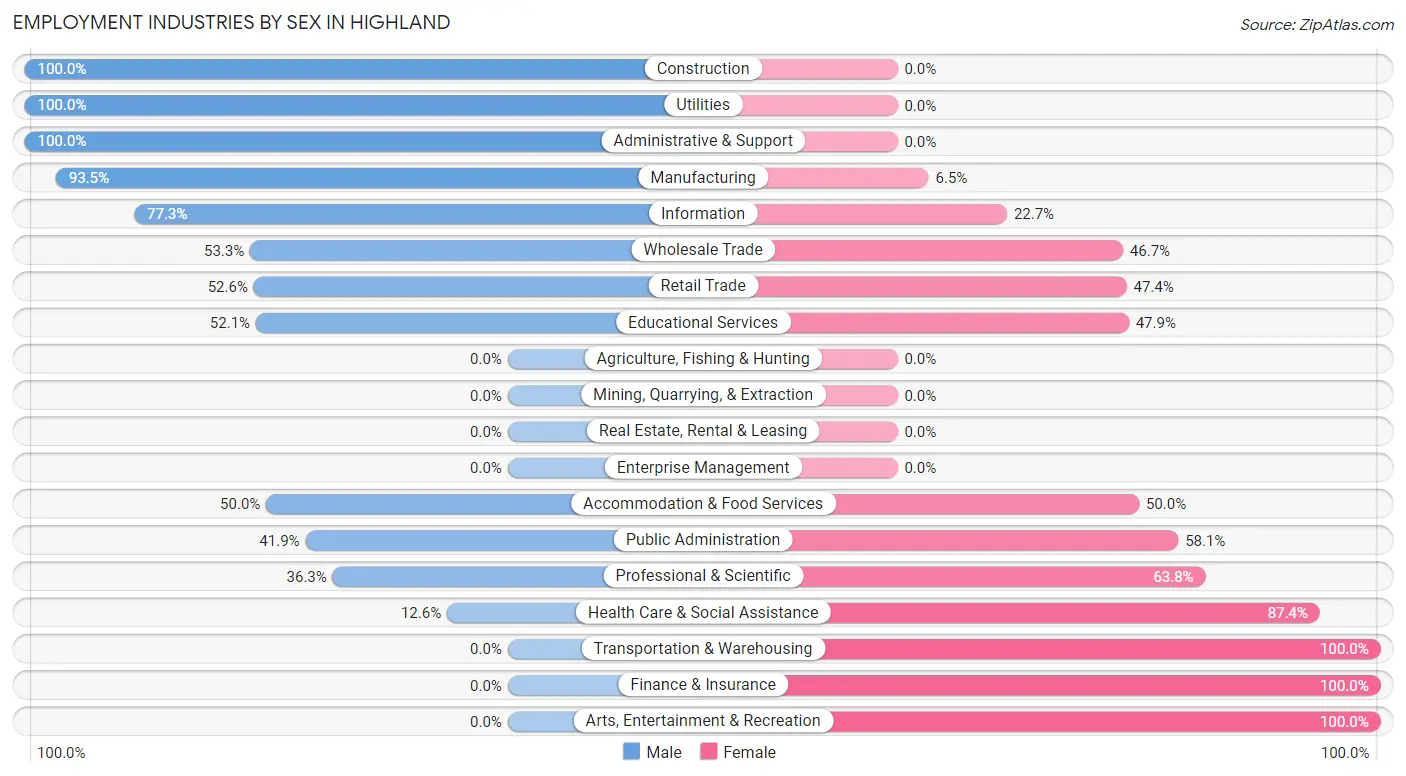
| Industry | Male | Female |
| Agriculture, Fishing & Hunting | 0 (0.0%) | 0 (0.0%) |
| Mining, Quarrying, & Extraction | 0 (0.0%) | 0 (0.0%) |
| Construction | 128 (100.0%) | 0 (0.0%) |
| Manufacturing | 478 (93.5%) | 33 (6.5%) |
| Wholesale Trade | 16 (53.3%) | 14 (46.7%) |
| Retail Trade | 184 (52.6%) | 166 (47.4%) |
| Transportation & Warehousing | 0 (0.0%) | 13 (100.0%) |
| Utilities | 57 (100.0%) | 0 (0.0%) |
| Information | 58 (77.3%) | 17 (22.7%) |
| Finance & Insurance | 0 (0.0%) | 90 (100.0%) |
| Real Estate, Rental & Leasing | 0 (0.0%) | 0 (0.0%) |
| Professional & Scientific | 58 (36.2%) | 102 (63.7%) |
| Enterprise Management | 0 (0.0%) | 0 (0.0%) |
| Administrative & Support | 108 (100.0%) | 0 (0.0%) |
| Educational Services | 172 (52.1%) | 158 (47.9%) |
| Health Care & Social Assistance | 47 (12.6%) | 327 (87.4%) |
| Arts, Entertainment & Recreation | 0 (0.0%) | 37 (100.0%) |
| Accommodation & Food Services | 35 (50.0%) | 35 (50.0%) |
| Public Administration | 80 (41.9%) | 111 (58.1%) |
| Total | 1,470 (55.6%) | 1,176 (44.4%) |
Education in Highland
School Enrollment in Highland
The most common levels of schooling among the 1,355 students in Highland are high school (398 | 29.4%), middle school (278 | 20.5%), and elementary school (252 | 18.6%).
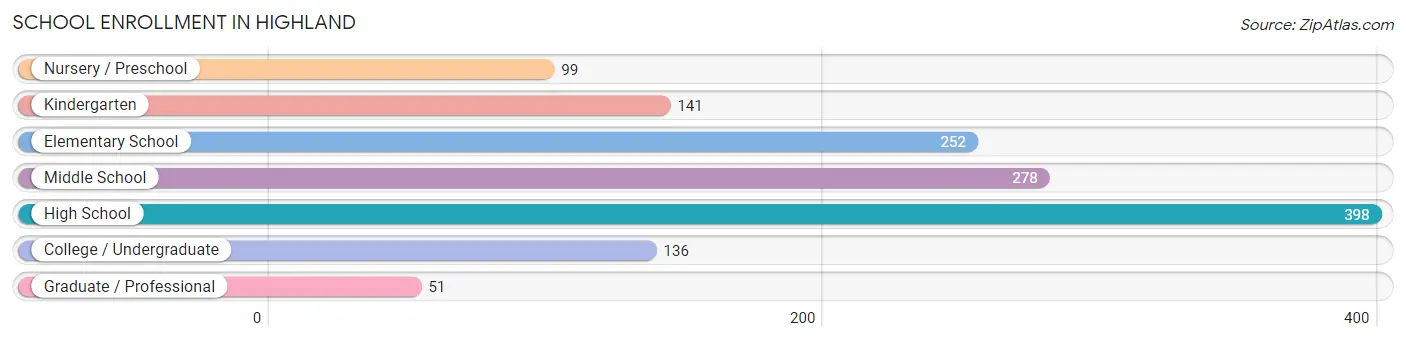
| School Level | # Students | % Students |
| Nursery / Preschool | 99 | 7.3% |
| Kindergarten | 141 | 10.4% |
| Elementary School | 252 | 18.6% |
| Middle School | 278 | 20.5% |
| High School | 398 | 29.4% |
| College / Undergraduate | 136 | 10.0% |
| Graduate / Professional | 51 | 3.8% |
| Total | 1,355 | 100.0% |
School Enrollment by Age by Funding Source in Highland
Out of a total of 1,355 students who are enrolled in schools in Highland, 425 (31.4%) attend a private institution, while the remaining 930 (68.6%) are enrolled in public schools. The age group of 25 to 34 year olds has the highest likelihood of being enrolled in private schools, with 36 (67.9% in the age bracket) enrolled. Conversely, the age group of 10 to 14 year olds has the lowest likelihood of being enrolled in a private school, with 359 (100.0% in the age bracket) attending a public institution.
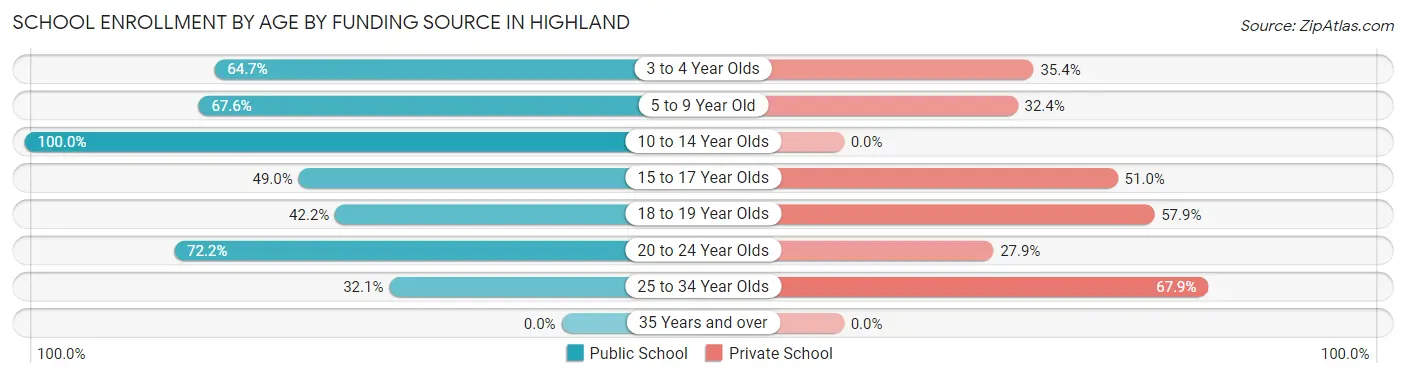
| Age Bracket | Public School | Private School |
| 3 to 4 Year Olds | 64 (64.6%) | 35 (35.3%) |
| 5 to 9 Year Old | 238 (67.6%) | 114 (32.4%) |
| 10 to 14 Year Olds | 359 (100.0%) | 0 (0.0%) |
| 15 to 17 Year Olds | 143 (49.0%) | 149 (51.0%) |
| 18 to 19 Year Olds | 51 (42.1%) | 70 (57.9%) |
| 20 to 24 Year Olds | 57 (72.2%) | 22 (27.9%) |
| 25 to 34 Year Olds | 17 (32.1%) | 36 (67.9%) |
| 35 Years and over | 0 (0.0%) | 0 (0.0%) |
| Total | 930 (68.6%) | 425 (31.4%) |
Educational Attainment by Field of Study in Highland
Business (270 | 21.5%), arts & humanities (230 | 18.4%), education (202 | 16.1%), science & technology (153 | 12.2%), and social sciences (87 | 6.9%) are the most common fields of study among 1,253 individuals in Highland who have obtained a bachelor's degree or higher.
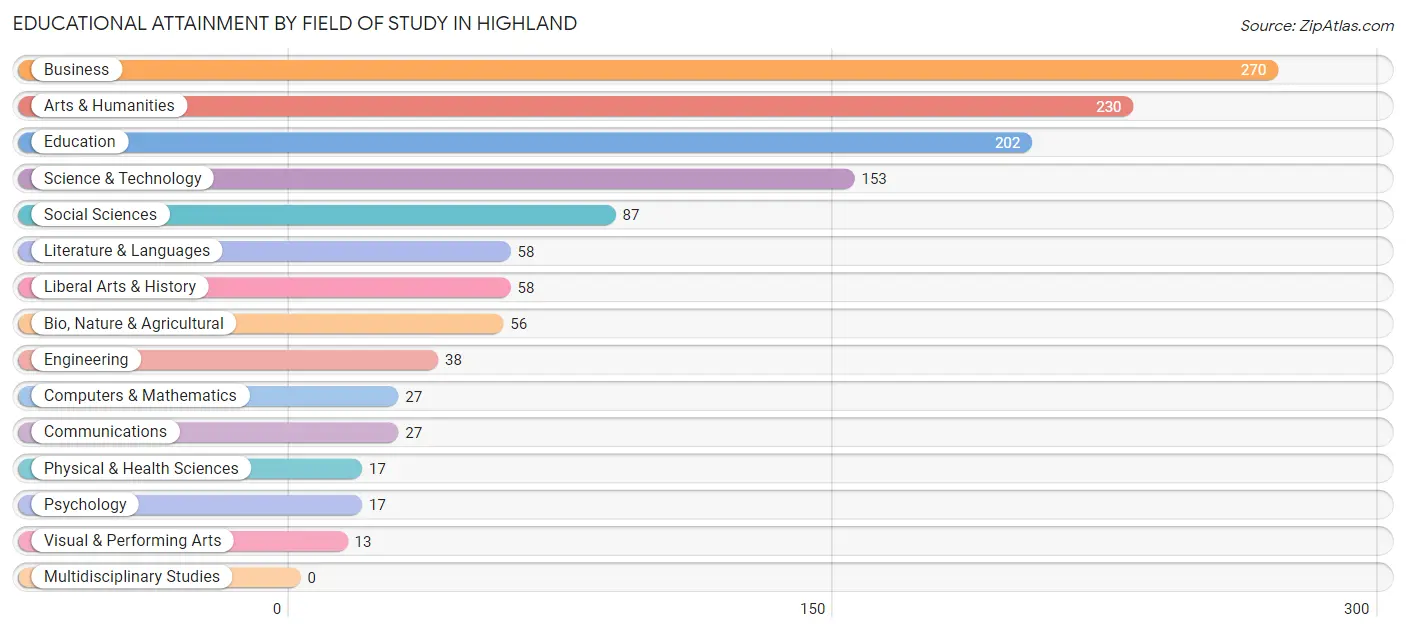
| Field of Study | # Graduates | % Graduates |
| Computers & Mathematics | 27 | 2.1% |
| Bio, Nature & Agricultural | 56 | 4.5% |
| Physical & Health Sciences | 17 | 1.4% |
| Psychology | 17 | 1.4% |
| Social Sciences | 87 | 6.9% |
| Engineering | 38 | 3.0% |
| Multidisciplinary Studies | 0 | 0.0% |
| Science & Technology | 153 | 12.2% |
| Business | 270 | 21.5% |
| Education | 202 | 16.1% |
| Literature & Languages | 58 | 4.6% |
| Liberal Arts & History | 58 | 4.6% |
| Visual & Performing Arts | 13 | 1.0% |
| Communications | 27 | 2.1% |
| Arts & Humanities | 230 | 18.4% |
| Total | 1,253 | 100.0% |
Transportation & Commute in Highland
Vehicle Availability by Sex in Highland
The most prevalent vehicle ownership categories in Highland are males with 2 vehicles (739, accounting for 51.8%) and females with 2 vehicles (388, making up 66.7%).
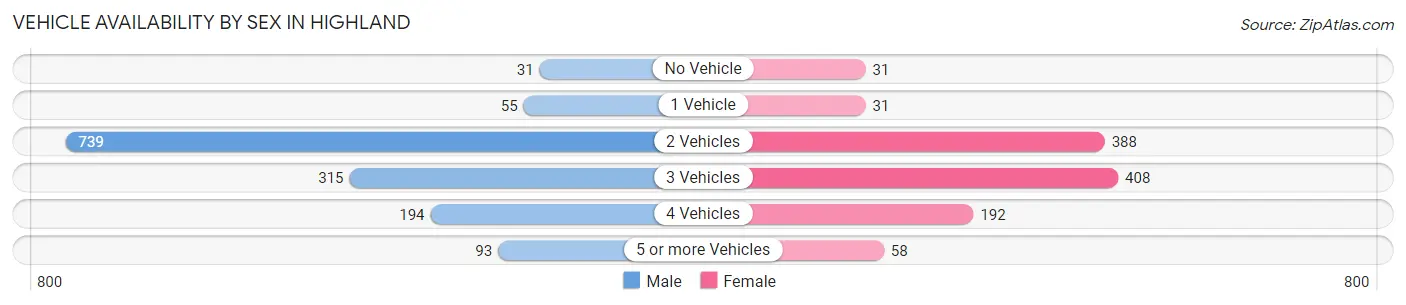
| Vehicles Available | Male | Female |
| No Vehicle | 31 (2.2%) | 31 (2.8%) |
| 1 Vehicle | 55 (3.8%) | 31 (2.8%) |
| 2 Vehicles | 739 (51.8%) | 388 (35.0%) |
| 3 Vehicles | 315 (22.1%) | 408 (36.8%) |
| 4 Vehicles | 194 (13.6%) | 192 (17.3%) |
| 5 or more Vehicles | 93 (6.5%) | 58 (5.2%) |
| Total | 1,427 (100.0%) | 1,108 (100.0%) |
Commute Time in Highland
The most frequently occuring commute durations in Highland are 15 to 19 minutes (561 commuters, 23.0%), 10 to 14 minutes (421 commuters, 17.2%), and 20 to 24 minutes (334 commuters, 13.7%).
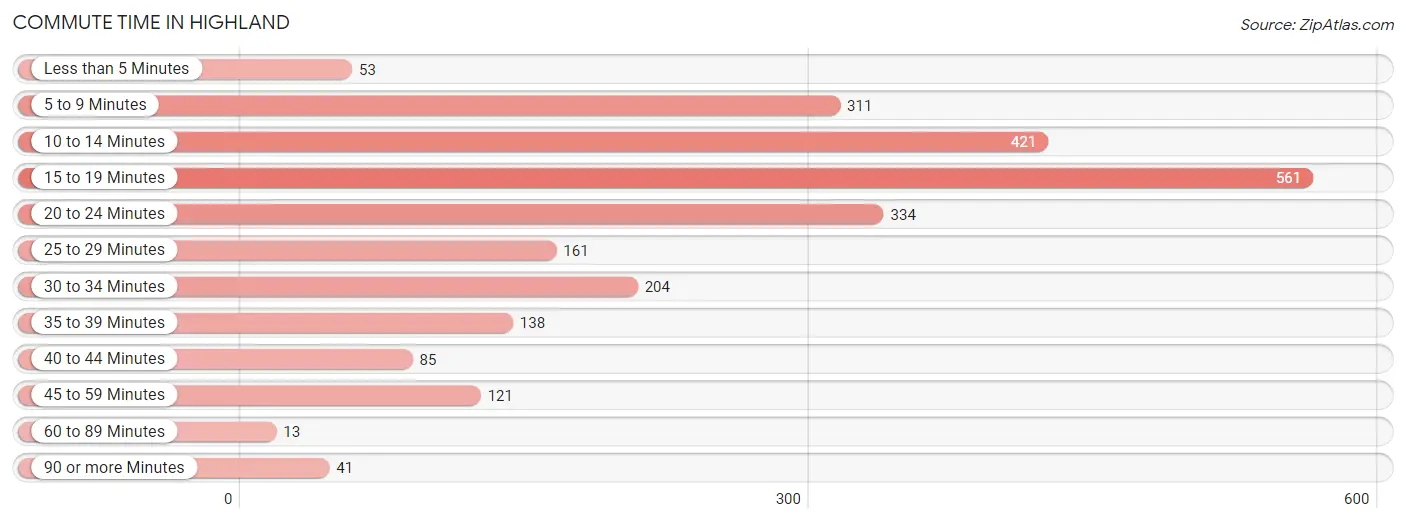
| Commute Time | # Commuters | % Commuters |
| Less than 5 Minutes | 53 | 2.2% |
| 5 to 9 Minutes | 311 | 12.7% |
| 10 to 14 Minutes | 421 | 17.2% |
| 15 to 19 Minutes | 561 | 23.0% |
| 20 to 24 Minutes | 334 | 13.7% |
| 25 to 29 Minutes | 161 | 6.6% |
| 30 to 34 Minutes | 204 | 8.4% |
| 35 to 39 Minutes | 138 | 5.7% |
| 40 to 44 Minutes | 85 | 3.5% |
| 45 to 59 Minutes | 121 | 5.0% |
| 60 to 89 Minutes | 13 | 0.5% |
| 90 or more Minutes | 41 | 1.7% |
Commute Time by Sex in Highland
The most common commute times in Highland are 15 to 19 minutes (224 commuters, 15.9%) for males and 15 to 19 minutes (337 commuters, 32.6%) for females.
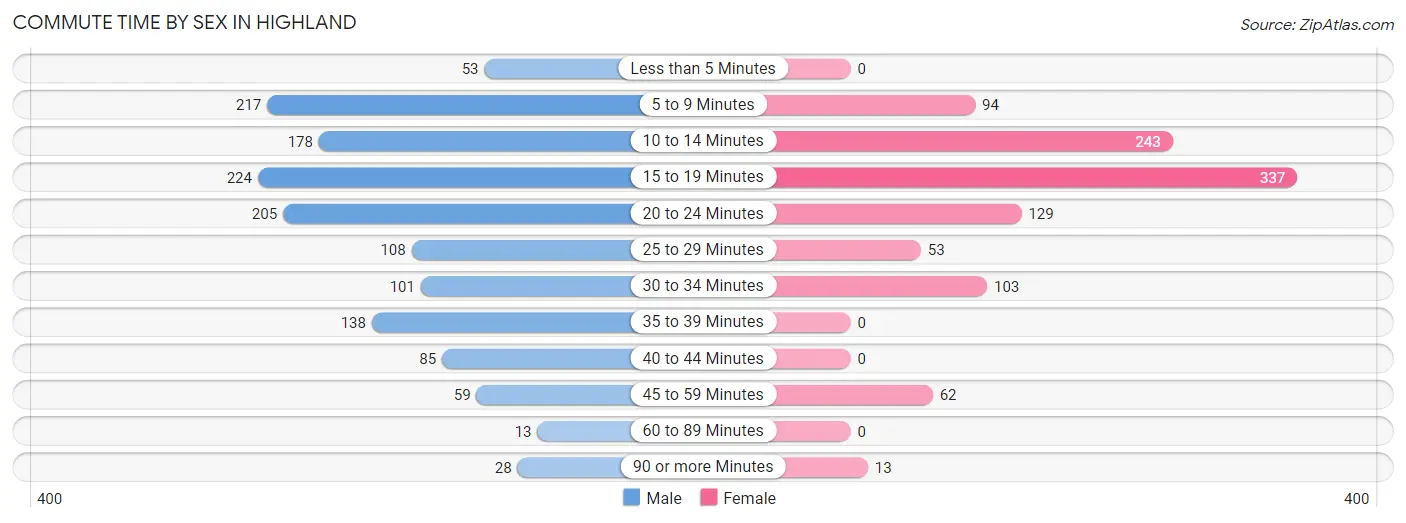
| Commute Time | Male | Female |
| Less than 5 Minutes | 53 (3.8%) | 0 (0.0%) |
| 5 to 9 Minutes | 217 (15.4%) | 94 (9.1%) |
| 10 to 14 Minutes | 178 (12.6%) | 243 (23.5%) |
| 15 to 19 Minutes | 224 (15.9%) | 337 (32.6%) |
| 20 to 24 Minutes | 205 (14.5%) | 129 (12.5%) |
| 25 to 29 Minutes | 108 (7.7%) | 53 (5.1%) |
| 30 to 34 Minutes | 101 (7.2%) | 103 (10.0%) |
| 35 to 39 Minutes | 138 (9.8%) | 0 (0.0%) |
| 40 to 44 Minutes | 85 (6.0%) | 0 (0.0%) |
| 45 to 59 Minutes | 59 (4.2%) | 62 (6.0%) |
| 60 to 89 Minutes | 13 (0.9%) | 0 (0.0%) |
| 90 or more Minutes | 28 (2.0%) | 13 (1.3%) |
Time of Departure to Work by Sex in Highland
The most frequent times of departure to work in Highland are 7:30 AM to 7:59 AM (279, 19.8%) for males and 6:30 AM to 6:59 AM (299, 28.9%) for females.
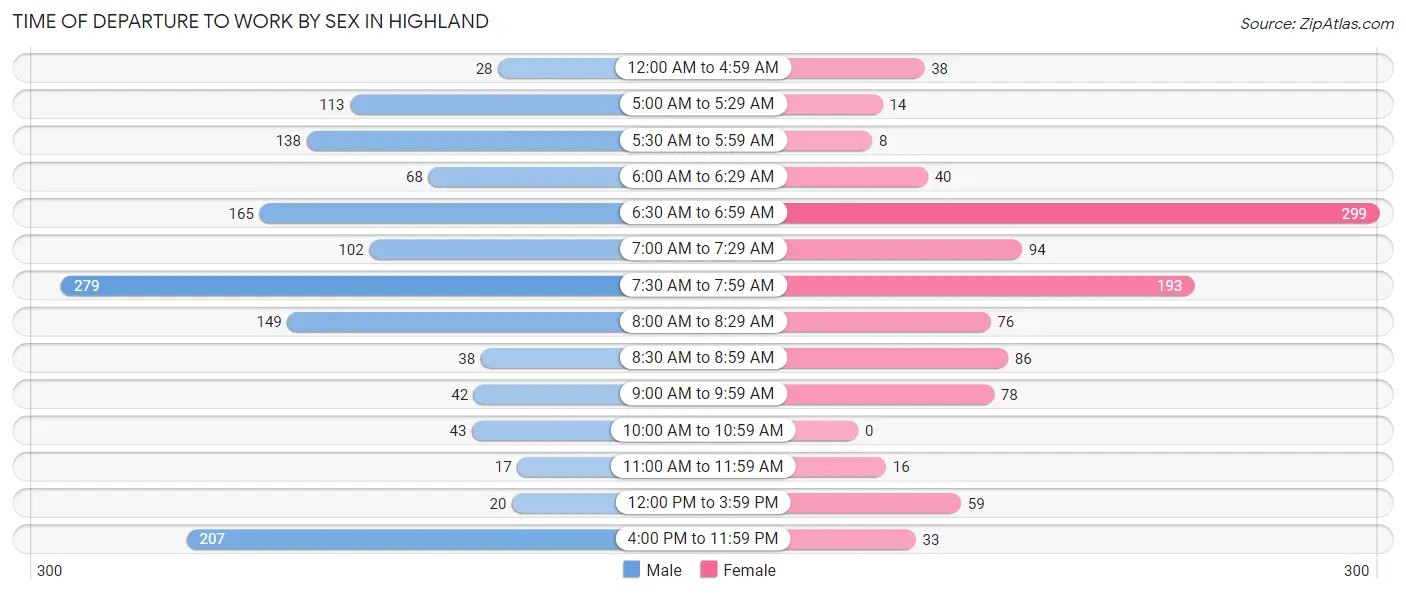
| Time of Departure | Male | Female |
| 12:00 AM to 4:59 AM | 28 (2.0%) | 38 (3.7%) |
| 5:00 AM to 5:29 AM | 113 (8.0%) | 14 (1.3%) |
| 5:30 AM to 5:59 AM | 138 (9.8%) | 8 (0.8%) |
| 6:00 AM to 6:29 AM | 68 (4.8%) | 40 (3.9%) |
| 6:30 AM to 6:59 AM | 165 (11.7%) | 299 (28.9%) |
| 7:00 AM to 7:29 AM | 102 (7.2%) | 94 (9.1%) |
| 7:30 AM to 7:59 AM | 279 (19.8%) | 193 (18.7%) |
| 8:00 AM to 8:29 AM | 149 (10.6%) | 76 (7.3%) |
| 8:30 AM to 8:59 AM | 38 (2.7%) | 86 (8.3%) |
| 9:00 AM to 9:59 AM | 42 (3.0%) | 78 (7.5%) |
| 10:00 AM to 10:59 AM | 43 (3.0%) | 0 (0.0%) |
| 11:00 AM to 11:59 AM | 17 (1.2%) | 16 (1.5%) |
| 12:00 PM to 3:59 PM | 20 (1.4%) | 59 (5.7%) |
| 4:00 PM to 11:59 PM | 207 (14.7%) | 33 (3.2%) |
| Total | 1,409 (100.0%) | 1,034 (100.0%) |
Housing Occupancy in Highland
Occupancy by Ownership in Highland
Of the total 2,083 dwellings in Highland, owner-occupied units account for 1,938 (93.0%), while renter-occupied units make up 145 (7.0%).
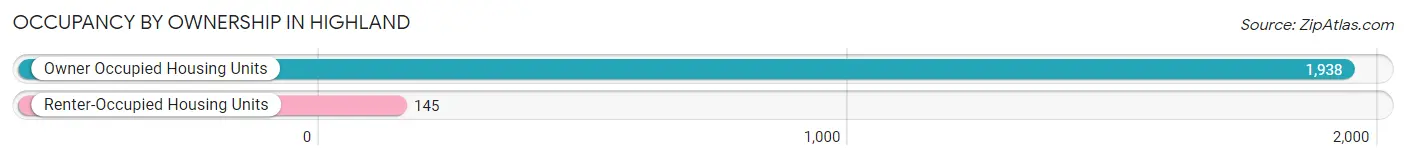
| Occupancy | # Housing Units | % Housing Units |
| Owner Occupied Housing Units | 1,938 | 93.0% |
| Renter-Occupied Housing Units | 145 | 7.0% |
| Total Occupied Housing Units | 2,083 | 100.0% |
Occupancy by Household Size in Highland
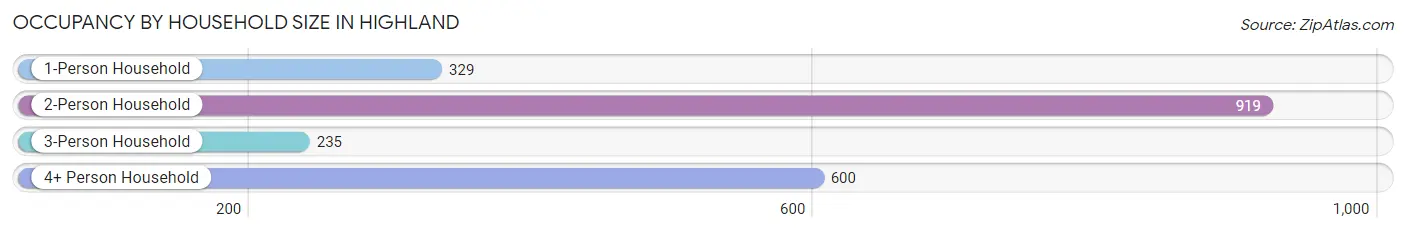
| Household Size | # Housing Units | % Housing Units |
| 1-Person Household | 329 | 15.8% |
| 2-Person Household | 919 | 44.1% |
| 3-Person Household | 235 | 11.3% |
| 4+ Person Household | 600 | 28.8% |
| Total Housing Units | 2,083 | 100.0% |
Occupancy by Ownership by Household Size in Highland
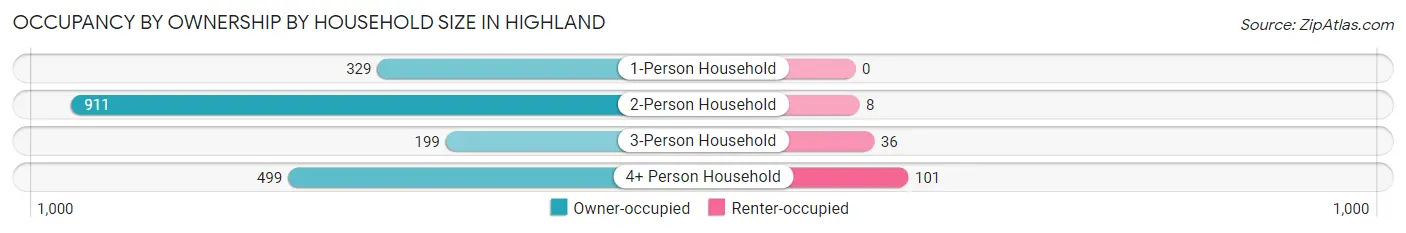
| Household Size | Owner-occupied | Renter-occupied |
| 1-Person Household | 329 (100.0%) | 0 (0.0%) |
| 2-Person Household | 911 (99.1%) | 8 (0.9%) |
| 3-Person Household | 199 (84.7%) | 36 (15.3%) |
| 4+ Person Household | 499 (83.2%) | 101 (16.8%) |
| Total Housing Units | 1,938 (93.0%) | 145 (7.0%) |
Occupancy by Educational Attainment in Highland
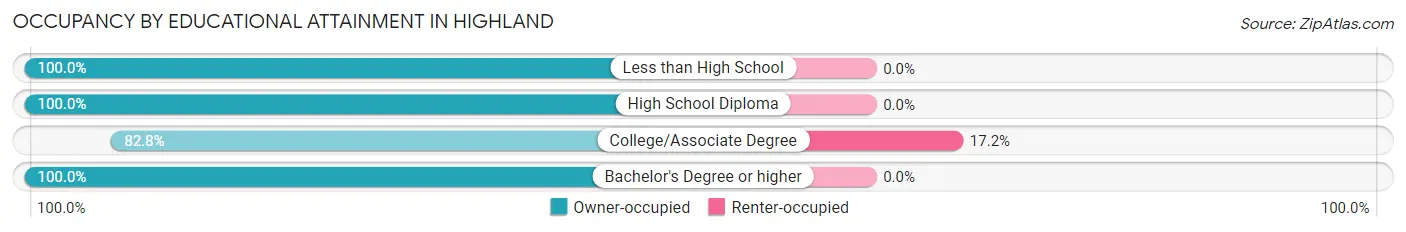
| Household Size | Owner-occupied | Renter-occupied |
| Less than High School | 67 (100.0%) | 0 (0.0%) |
| High School Diploma | 470 (100.0%) | 0 (0.0%) |
| College/Associate Degree | 698 (82.8%) | 145 (17.2%) |
| Bachelor's Degree or higher | 703 (100.0%) | 0 (0.0%) |
Occupancy by Age of Householder in Highland
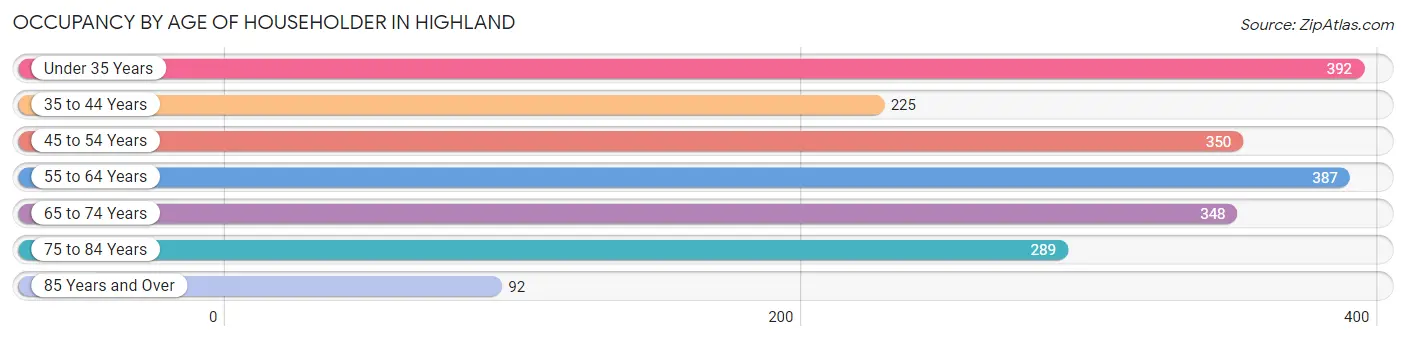
| Age Bracket | # Households | % Households |
| Under 35 Years | 392 | 18.8% |
| 35 to 44 Years | 225 | 10.8% |
| 45 to 54 Years | 350 | 16.8% |
| 55 to 64 Years | 387 | 18.6% |
| 65 to 74 Years | 348 | 16.7% |
| 75 to 84 Years | 289 | 13.9% |
| 85 Years and Over | 92 | 4.4% |
| Total | 2,083 | 100.0% |
Housing Finances in Highland
Median Income by Occupancy in Highland
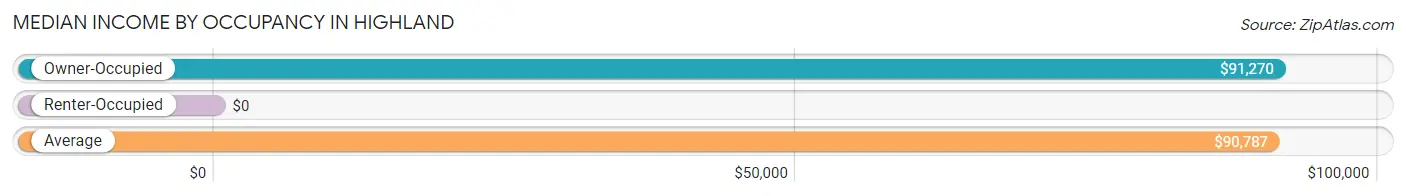
| Occupancy Type | # Households | Median Income |
| Owner-Occupied | 1,938 (93.0%) | $91,270 |
| Renter-Occupied | 145 (7.0%) | $0 |
| Average | 2,083 (100.0%) | $90,787 |
Occupancy by Householder Income Bracket in Highland
| Income Bracket | Owner-occupied | Renter-occupied |
| Less than $5,000 | 11 (0.6%) | 0 (0.0%) |
| $5,000 to $9,999 | 17 (0.9%) | 0 (0.0%) |
| $10,000 to $14,999 | 64 (3.3%) | 0 (0.0%) |
| $15,000 to $19,999 | 57 (2.9%) | 0 (0.0%) |
| $20,000 to $24,999 | 30 (1.5%) | 0 (0.0%) |
| $25,000 to $34,999 | 131 (6.8%) | 0 (0.0%) |
| $35,000 to $49,999 | 209 (10.8%) | 0 (0.0%) |
| $50,000 to $74,999 | 210 (10.8%) | 101 (69.7%) |
| $75,000 to $99,999 | 407 (21.0%) | 8 (5.5%) |
| $100,000 to $149,999 | 423 (21.8%) | 36 (24.8%) |
| $150,000 or more | 379 (19.6%) | 0 (0.0%) |
| Total | 1,938 (100.0%) | 145 (100.0%) |
Monthly Housing Cost Tiers in Highland
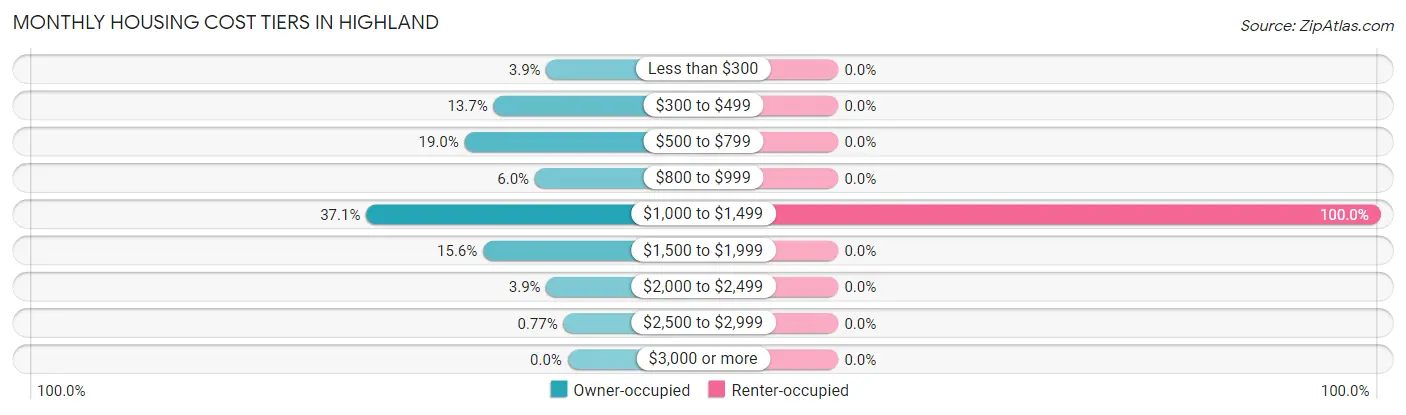
| Monthly Cost | Owner-occupied | Renter-occupied |
| Less than $300 | 76 (3.9%) | 0 (0.0%) |
| $300 to $499 | 265 (13.7%) | 0 (0.0%) |
| $500 to $799 | 368 (19.0%) | 0 (0.0%) |
| $800 to $999 | 117 (6.0%) | 0 (0.0%) |
| $1,000 to $1,499 | 719 (37.1%) | 145 (100.0%) |
| $1,500 to $1,999 | 302 (15.6%) | 0 (0.0%) |
| $2,000 to $2,499 | 76 (3.9%) | 0 (0.0%) |
| $2,500 to $2,999 | 15 (0.8%) | 0 (0.0%) |
| $3,000 or more | 0 (0.0%) | 0 (0.0%) |
| Total | 1,938 (100.0%) | 145 (100.0%) |
Physical Housing Characteristics in Highland
Housing Structures in Highland
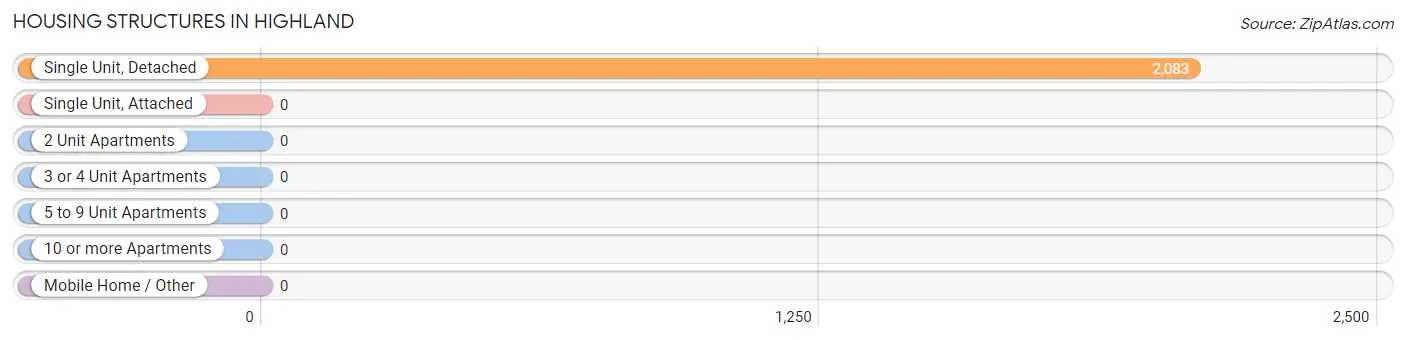
| Structure Type | # Housing Units | % Housing Units |
| Single Unit, Detached | 2,083 | 100.0% |
| Single Unit, Attached | 0 | 0.0% |
| 2 Unit Apartments | 0 | 0.0% |
| 3 or 4 Unit Apartments | 0 | 0.0% |
| 5 to 9 Unit Apartments | 0 | 0.0% |
| 10 or more Apartments | 0 | 0.0% |
| Mobile Home / Other | 0 | 0.0% |
| Total | 2,083 | 100.0% |
Housing Structures by Occupancy in Highland
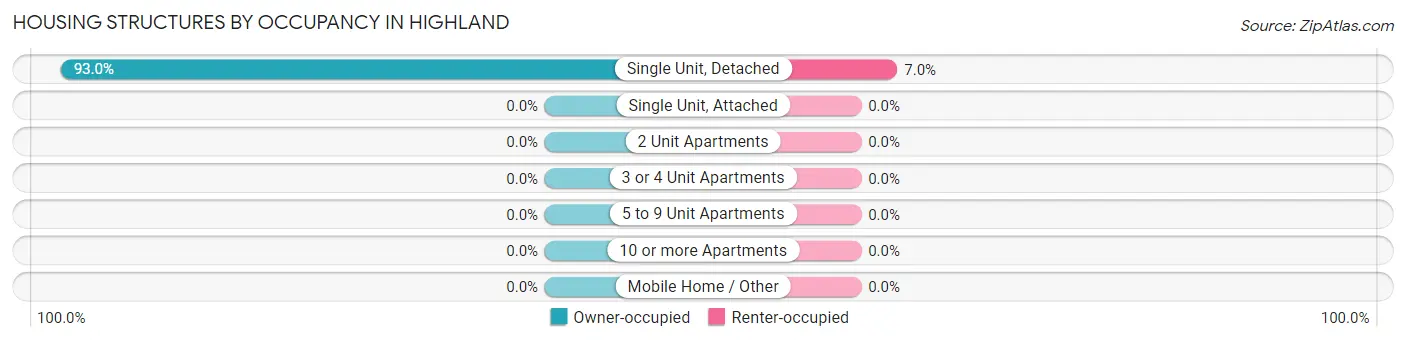
| Structure Type | Owner-occupied | Renter-occupied |
| Single Unit, Detached | 1,938 (93.0%) | 145 (7.0%) |
| Single Unit, Attached | 0 (0.0%) | 0 (0.0%) |
| 2 Unit Apartments | 0 (0.0%) | 0 (0.0%) |
| 3 or 4 Unit Apartments | 0 (0.0%) | 0 (0.0%) |
| 5 to 9 Unit Apartments | 0 (0.0%) | 0 (0.0%) |
| 10 or more Apartments | 0 (0.0%) | 0 (0.0%) |
| Mobile Home / Other | 0 (0.0%) | 0 (0.0%) |
| Total | 1,938 (93.0%) | 145 (7.0%) |
Housing Structures by Number of Rooms in Highland
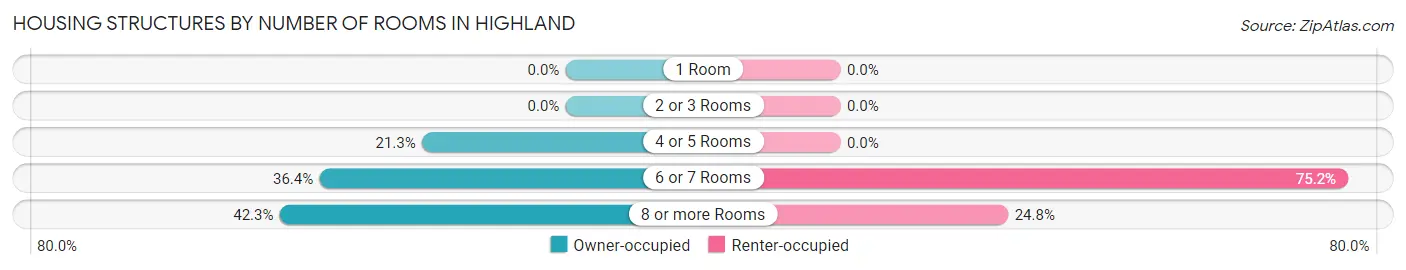
| Number of Rooms | Owner-occupied | Renter-occupied |
| 1 Room | 0 (0.0%) | 0 (0.0%) |
| 2 or 3 Rooms | 0 (0.0%) | 0 (0.0%) |
| 4 or 5 Rooms | 412 (21.3%) | 0 (0.0%) |
| 6 or 7 Rooms | 706 (36.4%) | 109 (75.2%) |
| 8 or more Rooms | 820 (42.3%) | 36 (24.8%) |
| Total | 1,938 (100.0%) | 145 (100.0%) |
Housing Structure by Heating Type in Highland
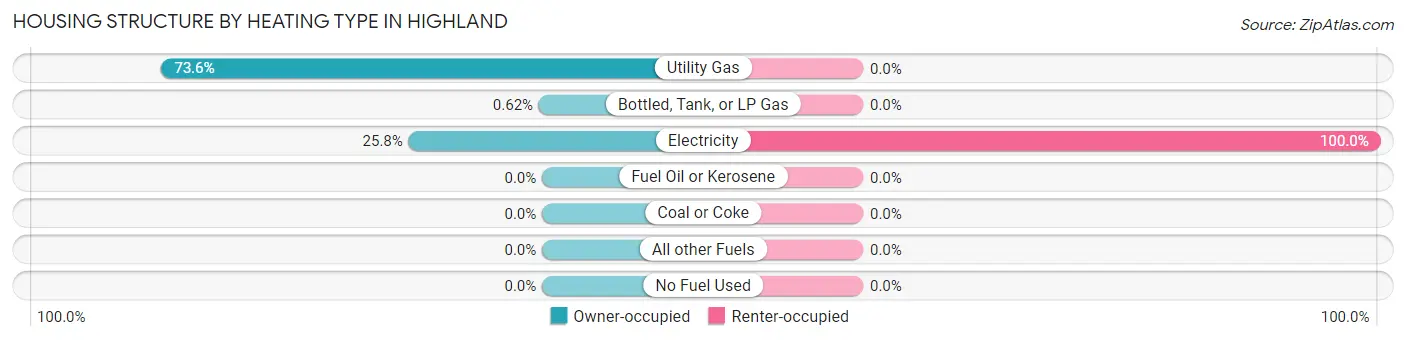
| Heating Type | Owner-occupied | Renter-occupied |
| Utility Gas | 1,426 (73.6%) | 0 (0.0%) |
| Bottled, Tank, or LP Gas | 12 (0.6%) | 0 (0.0%) |
| Electricity | 500 (25.8%) | 145 (100.0%) |
| Fuel Oil or Kerosene | 0 (0.0%) | 0 (0.0%) |
| Coal or Coke | 0 (0.0%) | 0 (0.0%) |
| All other Fuels | 0 (0.0%) | 0 (0.0%) |
| No Fuel Used | 0 (0.0%) | 0 (0.0%) |
| Total | 1,938 (100.0%) | 145 (100.0%) |
Household Vehicle Usage in Highland
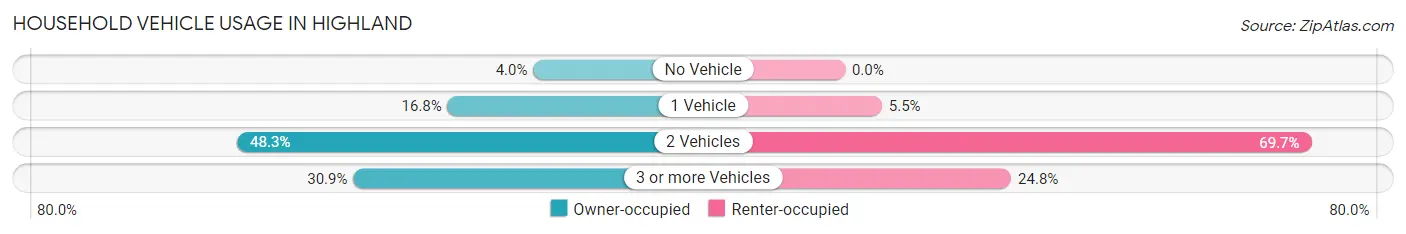
| Vehicles per Household | Owner-occupied | Renter-occupied |
| No Vehicle | 78 (4.0%) | 0 (0.0%) |
| 1 Vehicle | 326 (16.8%) | 8 (5.5%) |
| 2 Vehicles | 935 (48.2%) | 101 (69.7%) |
| 3 or more Vehicles | 599 (30.9%) | 36 (24.8%) |
| Total | 1,938 (100.0%) | 145 (100.0%) |
Real Estate & Mortgages in Highland
Real Estate and Mortgage Overview in Highland
| Characteristic | Without Mortgage | With Mortgage |
| Housing Units | 704 | 1,234 |
| Median Property Value | $195,500 | $221,400 |
| Median Household Income | $48,441 | $303 |
| Monthly Housing Costs | $523 | $0 |
| Real Estate Taxes | $1,354 | $11 |
Property Value by Mortgage Status in Highland
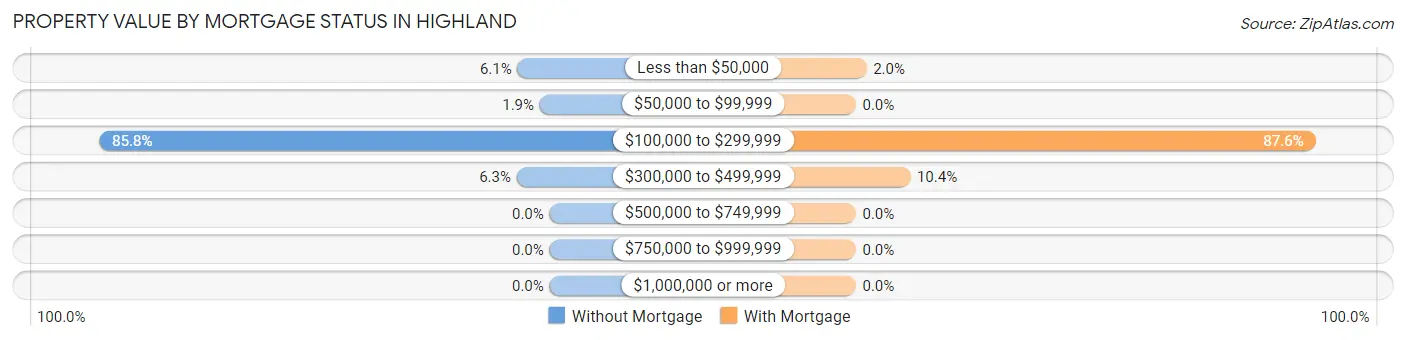
| Property Value | Without Mortgage | With Mortgage |
| Less than $50,000 | 43 (6.1%) | 25 (2.0%) |
| $50,000 to $99,999 | 13 (1.8%) | 0 (0.0%) |
| $100,000 to $299,999 | 604 (85.8%) | 1,081 (87.6%) |
| $300,000 to $499,999 | 44 (6.2%) | 128 (10.4%) |
| $500,000 to $749,999 | 0 (0.0%) | 0 (0.0%) |
| $750,000 to $999,999 | 0 (0.0%) | 0 (0.0%) |
| $1,000,000 or more | 0 (0.0%) | 0 (0.0%) |
| Total | 704 (100.0%) | 1,234 (100.0%) |
Household Income by Mortgage Status in Highland
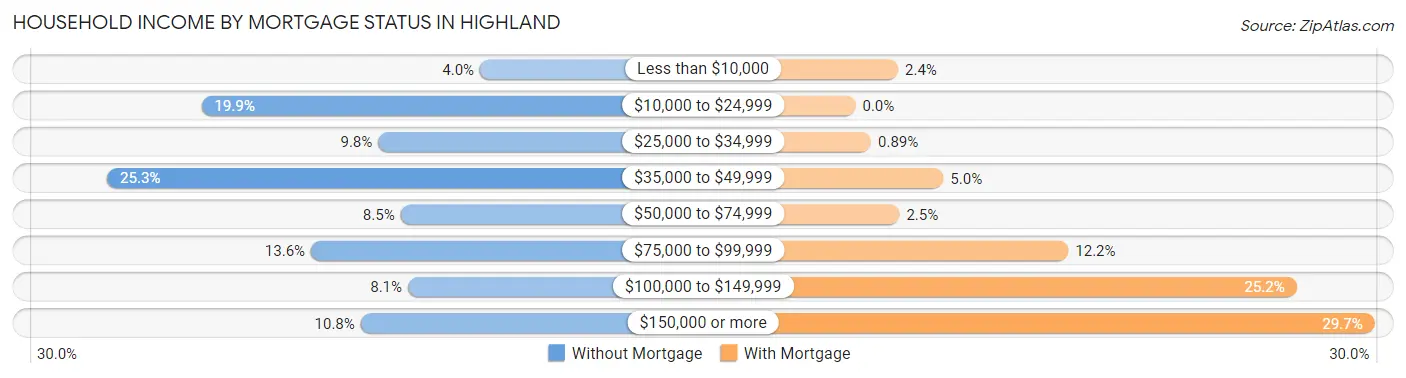
| Household Income | Without Mortgage | With Mortgage |
| Less than $10,000 | 28 (4.0%) | 30 (2.4%) |
| $10,000 to $24,999 | 140 (19.9%) | 0 (0.0%) |
| $25,000 to $34,999 | 69 (9.8%) | 11 (0.9%) |
| $35,000 to $49,999 | 178 (25.3%) | 62 (5.0%) |
| $50,000 to $74,999 | 60 (8.5%) | 31 (2.5%) |
| $75,000 to $99,999 | 96 (13.6%) | 150 (12.2%) |
| $100,000 to $149,999 | 57 (8.1%) | 311 (25.2%) |
| $150,000 or more | 76 (10.8%) | 366 (29.7%) |
| Total | 704 (100.0%) | 1,234 (100.0%) |
Property Value to Household Income Ratio in Highland

| Value-to-Income Ratio | Without Mortgage | With Mortgage |
| Less than 2.0x | 149 (21.2%) | 113,542 (9,201.1%) |
| 2.0x to 2.9x | 90 (12.8%) | 674 (54.6%) |
| 3.0x to 3.9x | 154 (21.9%) | 199 (16.1%) |
| 4.0x or more | 300 (42.6%) | 233 (18.9%) |
| Total | 704 (100.0%) | 1,234 (100.0%) |
Real Estate Taxes by Mortgage Status in Highland
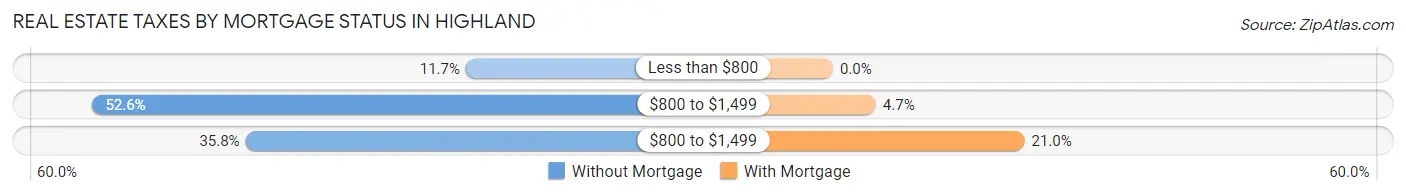
| Property Taxes | Without Mortgage | With Mortgage |
| Less than $800 | 82 (11.7%) | 0 (0.0%) |
| $800 to $1,499 | 370 (52.6%) | 58 (4.7%) |
| $800 to $1,499 | 252 (35.8%) | 259 (21.0%) |
| Total | 704 (100.0%) | 1,234 (100.0%) |
Health & Disability in Highland
Health Insurance Coverage by Age in Highland
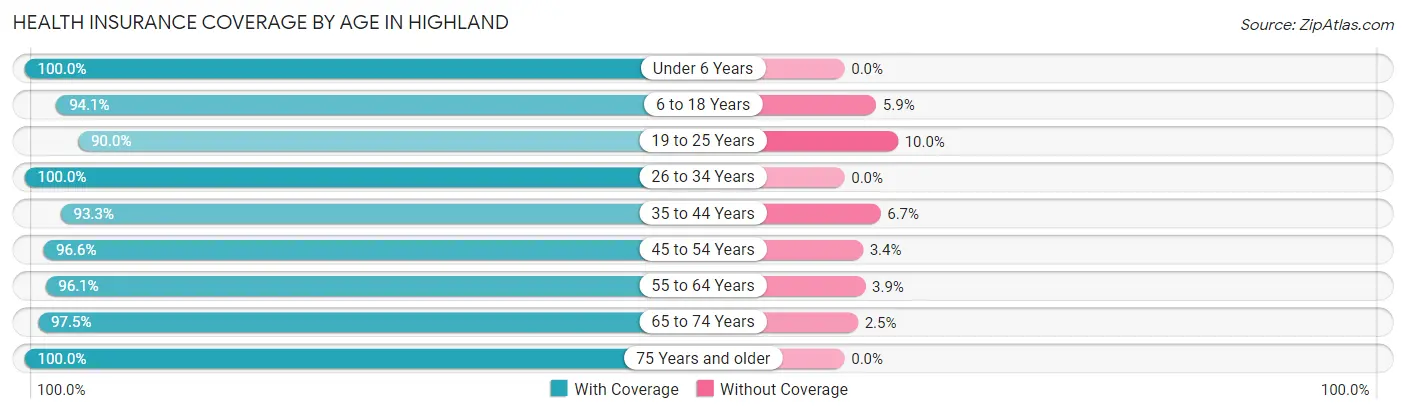
| Age Bracket | With Coverage | Without Coverage |
| Under 6 Years | 373 (100.0%) | 0 (0.0%) |
| 6 to 18 Years | 1,004 (94.1%) | 63 (5.9%) |
| 19 to 25 Years | 235 (90.0%) | 26 (10.0%) |
| 26 to 34 Years | 689 (100.0%) | 0 (0.0%) |
| 35 to 44 Years | 417 (93.3%) | 30 (6.7%) |
| 45 to 54 Years | 673 (96.6%) | 24 (3.4%) |
| 55 to 64 Years | 866 (96.1%) | 35 (3.9%) |
| 65 to 74 Years | 545 (97.5%) | 14 (2.5%) |
| 75 Years and older | 596 (100.0%) | 0 (0.0%) |
| Total | 5,398 (96.6%) | 192 (3.4%) |
Health Insurance Coverage by Citizenship Status in Highland
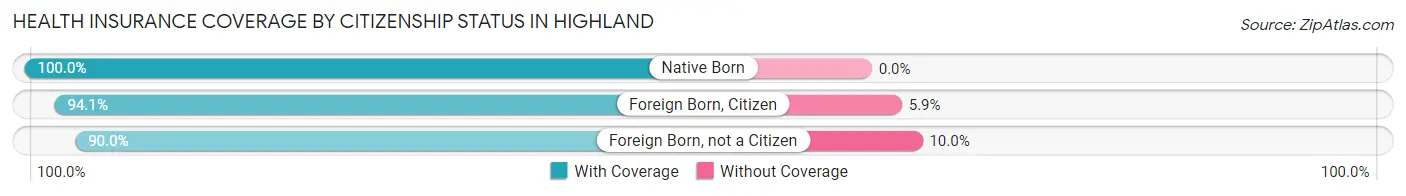
| Citizenship Status | With Coverage | Without Coverage |
| Native Born | 373 (100.0%) | 0 (0.0%) |
| Foreign Born, Citizen | 1,004 (94.1%) | 63 (5.9%) |
| Foreign Born, not a Citizen | 235 (90.0%) | 26 (10.0%) |
Health Insurance Coverage by Household Income in Highland
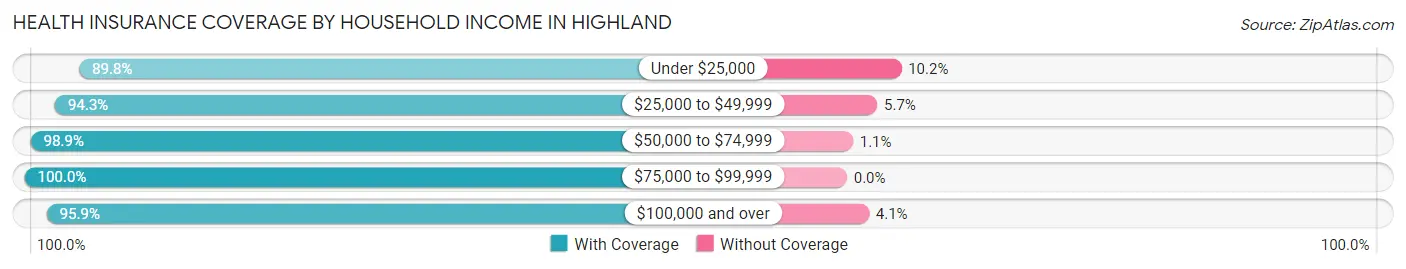
| Household Income | With Coverage | Without Coverage |
| Under $25,000 | 264 (89.8%) | 30 (10.2%) |
| $25,000 to $49,999 | 581 (94.3%) | 35 (5.7%) |
| $50,000 to $74,999 | 886 (98.9%) | 10 (1.1%) |
| $75,000 to $99,999 | 947 (100.0%) | 0 (0.0%) |
| $100,000 and over | 2,717 (95.9%) | 117 (4.1%) |
Public vs Private Health Insurance Coverage by Age in Highland
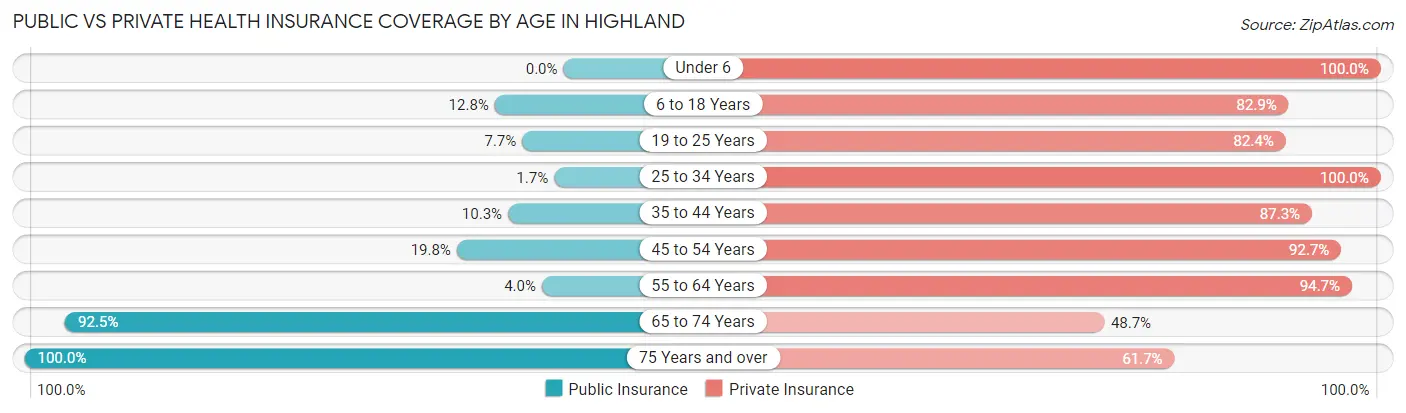
| Age Bracket | Public Insurance | Private Insurance |
| Under 6 | 0 (0.0%) | 373 (100.0%) |
| 6 to 18 Years | 136 (12.8%) | 885 (82.9%) |
| 19 to 25 Years | 20 (7.7%) | 215 (82.4%) |
| 25 to 34 Years | 12 (1.7%) | 689 (100.0%) |
| 35 to 44 Years | 46 (10.3%) | 390 (87.3%) |
| 45 to 54 Years | 138 (19.8%) | 646 (92.7%) |
| 55 to 64 Years | 36 (4.0%) | 853 (94.7%) |
| 65 to 74 Years | 517 (92.5%) | 272 (48.7%) |
| 75 Years and over | 596 (100.0%) | 368 (61.7%) |
| Total | 1,501 (26.9%) | 4,691 (83.9%) |
Disability Status by Sex by Age in Highland
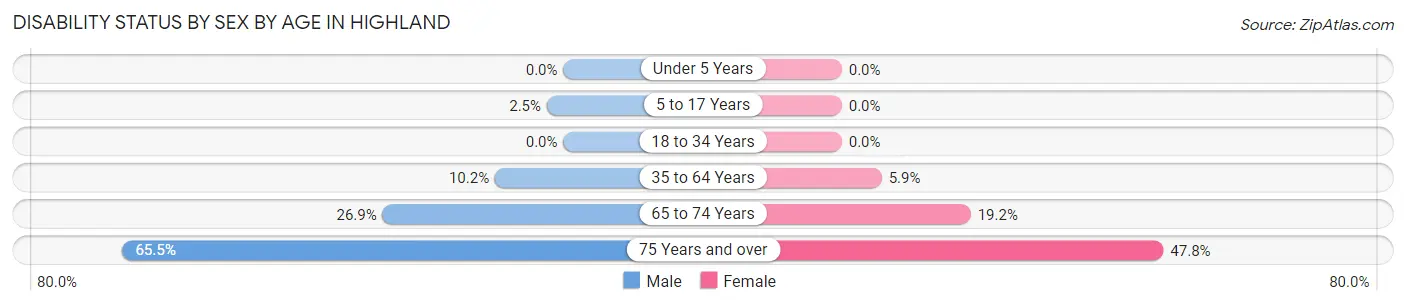
| Age Bracket | Male | Female |
| Under 5 Years | 0 (0.0%) | 0 (0.0%) |
| 5 to 17 Years | 14 (2.5%) | 0 (0.0%) |
| 18 to 34 Years | 0 (0.0%) | 0 (0.0%) |
| 35 to 64 Years | 110 (10.2%) | 57 (5.9%) |
| 65 to 74 Years | 87 (26.9%) | 45 (19.2%) |
| 75 Years and over | 127 (65.5%) | 192 (47.8%) |
Disability Class by Sex by Age in Highland
Disability Class: Hearing Difficulty
| Age Bracket | Male | Female |
| Under 5 Years | 0 (0.0%) | 0 (0.0%) |
| 5 to 17 Years | 0 (0.0%) | 0 (0.0%) |
| 18 to 34 Years | 0 (0.0%) | 0 (0.0%) |
| 35 to 64 Years | 12 (1.1%) | 0 (0.0%) |
| 65 to 74 Years | 74 (22.8%) | 0 (0.0%) |
| 75 Years and over | 16 (8.3%) | 0 (0.0%) |
Disability Class: Vision Difficulty
| Age Bracket | Male | Female |
| Under 5 Years | 0 (0.0%) | 0 (0.0%) |
| 5 to 17 Years | 0 (0.0%) | 0 (0.0%) |
| 18 to 34 Years | 0 (0.0%) | 0 (0.0%) |
| 35 to 64 Years | 14 (1.3%) | 0 (0.0%) |
| 65 to 74 Years | 0 (0.0%) | 0 (0.0%) |
| 75 Years and over | 0 (0.0%) | 0 (0.0%) |
Disability Class: Cognitive Difficulty
| Age Bracket | Male | Female |
| 5 to 17 Years | 14 (2.5%) | 0 (0.0%) |
| 18 to 34 Years | 0 (0.0%) | 0 (0.0%) |
| 35 to 64 Years | 98 (9.0%) | 26 (2.7%) |
| 65 to 74 Years | 0 (0.0%) | 3 (1.3%) |
| 75 Years and over | 0 (0.0%) | 129 (32.1%) |
Disability Class: Ambulatory Difficulty
| Age Bracket | Male | Female |
| 5 to 17 Years | 0 (0.0%) | 0 (0.0%) |
| 18 to 34 Years | 0 (0.0%) | 0 (0.0%) |
| 35 to 64 Years | 41 (3.8%) | 44 (4.6%) |
| 65 to 74 Years | 13 (4.0%) | 42 (17.9%) |
| 75 Years and over | 11 (5.7%) | 175 (43.5%) |
Disability Class: Self-Care Difficulty
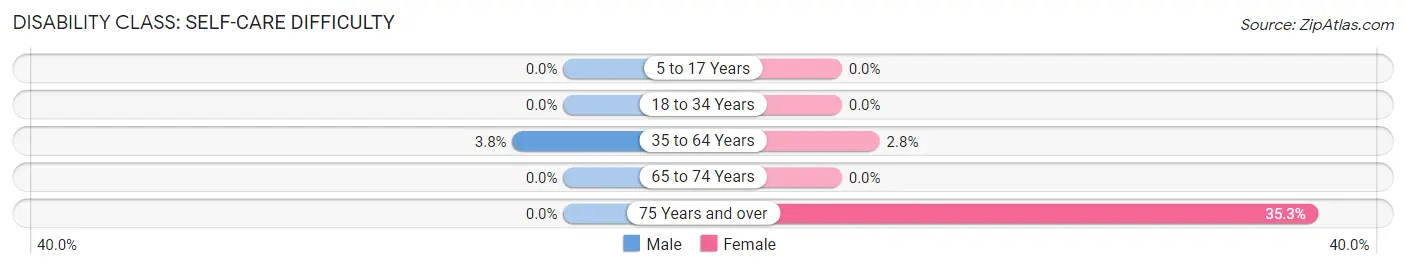
| Age Bracket | Male | Female |
| 5 to 17 Years | 0 (0.0%) | 0 (0.0%) |
| 18 to 34 Years | 0 (0.0%) | 0 (0.0%) |
| 35 to 64 Years | 41 (3.8%) | 27 (2.8%) |
| 65 to 74 Years | 0 (0.0%) | 0 (0.0%) |
| 75 Years and over | 0 (0.0%) | 142 (35.3%) |
Technology Access in Highland
Computing Device Access in Highland
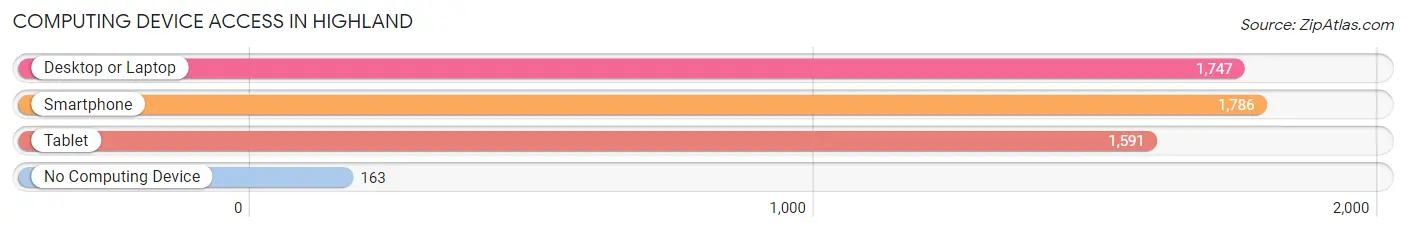
| Device Type | # Households | % Households |
| Desktop or Laptop | 1,747 | 83.9% |
| Smartphone | 1,786 | 85.7% |
| Tablet | 1,591 | 76.4% |
| No Computing Device | 163 | 7.8% |
| Total | 2,083 | 100.0% |
Internet Access in Highland
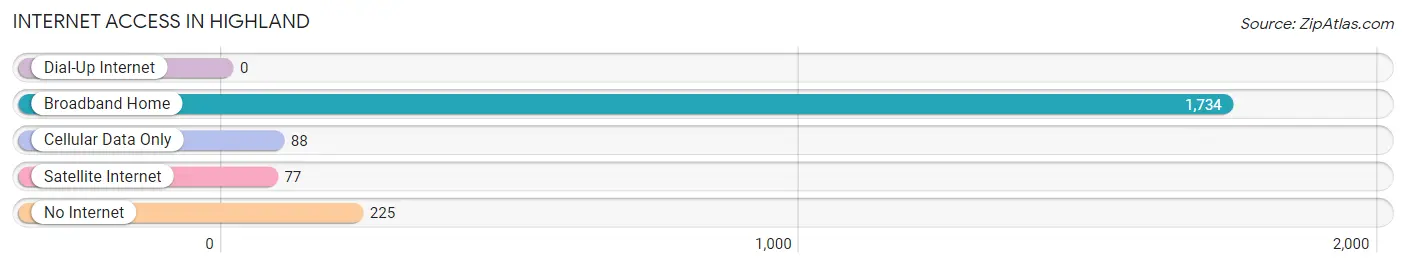
| Internet Type | # Households | % Households |
| Dial-Up Internet | 0 | 0.0% |
| Broadband Home | 1,734 | 83.3% |
| Cellular Data Only | 88 | 4.2% |
| Satellite Internet | 77 | 3.7% |
| No Internet | 225 | 10.8% |
| Total | 2,083 | 100.0% |
Highland Summary
Highland, Indiana is a small town located in Lake County, Indiana, about 25 miles southeast of Chicago. It is part of the Chicago metropolitan area and is home to a population of about 24,000 people. Highland is known for its small-town charm and its close proximity to the city of Chicago.
Geography
Highland is located in the northwest corner of Lake County, Indiana, about 25 miles southeast of Chicago. It is bordered by the towns of Munster, Schererville, Griffith, and Hammond. The town is situated on the Valparaiso Moraine, a ridge of glacial deposits that runs through the area. The town is also located on the Calumet River, which flows through the town and into Lake Michigan.
The town is divided into two distinct sections: the Highland area and the Calumet area. The Highland area is located on the Valparaiso Moraine and is home to the majority of the town's population. The Calumet area is located on the banks of the Calumet River and is home to a number of industrial sites.
Economy
Highland's economy is largely based on manufacturing and retail. The town is home to a number of manufacturing companies, including the Highland Foundry, which produces cast iron products, and the Highland Steel Company, which produces steel products. The town is also home to a number of retail stores, including a Walmart Supercenter, a Target, and a number of smaller stores.
The town is also home to a number of small businesses, including restaurants, bars, and other service-oriented businesses. The town is also home to a number of medical facilities, including the Highland Hospital and the Highland Medical Center.
Demographics
As of the 2010 census, the population of Highland was 24,099. The racial makeup of the town was 87.3% White, 5.3% African American, 0.4% Native American, 1.7% Asian, 0.1% Pacific Islander, 2.7% from other races, and 2.5% from two or more races. Hispanic or Latino of any race were 8.2% of the population.
The median income for a household in the town was $50,945, and the median income for a family was $60,945. The per capita income for the town was $25,945. About 5.3% of families and 7.2% of the population were below the poverty line, including 8.7% of those under age 18 and 6.2% of those age 65 or over.
Highland is a small town with a lot of charm and a close proximity to the city of Chicago. It is home to a diverse population and a strong economy based on manufacturing and retail. The town is also home to a number of small businesses and medical facilities. Highland is a great place to live and work, and it is a great place to visit.
Common Questions
What is Per Capita Income in Highland?
Per Capita income in Highland is $36,949.
What is the Median Family Income in Highland?
Median Family Income in Highland is $92,376.
What is the Median Household income in Highland?
Median Household Income in Highland is $90,787.
What is Income or Wage Gap in Highland?
Income or Wage Gap in Highland is 47.6%.
Women in Highland earn 52.4 cents for every dollar earned by a man.
What is Inequality or Gini Index in Highland?
Inequality or Gini Index in Highland is 0.35.
What is the Total Population of Highland?
Total Population of Highland is 5,590.
What is the Total Male Population of Highland?
Total Male Population of Highland is 2,815.
What is the Total Female Population of Highland?
Total Female Population of Highland is 2,775.
What is the Ratio of Males per 100 Females in Highland?
There are 101.44 Males per 100 Females in Highland.
What is the Ratio of Females per 100 Males in Highland?
There are 98.58 Females per 100 Males in Highland.
What is the Median Population Age in Highland?
Median Population Age in Highland is 43.9 Years.
What is the Average Family Size in Highland
Average Family Size in Highland is 3.0 People.
What is the Average Household Size in Highland
Average Household Size in Highland is 2.7 People.
How Large is the Labor Force in Highland?
There are 2,693 People in the Labor Forcein in Highland.
What is the Percentage of People in the Labor Force in Highland?
60.0% of People are in the Labor Force in Highland.
What is the Unemployment Rate in Highland?
Unemployment Rate in Highland is 1.8%.