Des Moines County, IA Map & Demographics
Des Moines County Map
Des Moines County Overview
$35,689
PER CAPITA INCOME
$76,866
AVG FAMILY INCOME
$58,084
AVG HOUSEHOLD INCOME
32.0%
WAGE / INCOME GAP [ % ]
68.0¢/ $1
WAGE / INCOME GAP [ $ ]
$10,156
FAMILY INCOME DEFICIT
0.47
INEQUALITY / GINI INDEX
38,824
TOTAL POPULATION
19,118
MALE POPULATION
19,706
FEMALE POPULATION
97.02
MALES / 100 FEMALES
103.08
FEMALES / 100 MALES
42.1
MEDIAN AGE
2.8
AVG FAMILY SIZE
2.2
AVG HOUSEHOLD SIZE
19,150
LABOR FORCE [ PEOPLE ]
61.0%
PERCENT IN LABOR FORCE
2.9%
UNEMPLOYMENT RATE
Des Moines County Area Codes
Income in Des Moines County
Income Overview in Des Moines County
Per Capita Income in Des Moines County is $35,689, while median incomes of families and households are $76,866 and $58,084 respectively.
| Characteristic | Number | Measure |
| Per Capita Income | 38,824 | $35,689 |
| Median Family Income | 10,253 | $76,866 |
| Mean Family Income | 10,253 | $100,510 |
| Median Household Income | 17,251 | $58,084 |
| Mean Household Income | 17,251 | $80,551 |
| Income Deficit | 10,253 | $10,156 |
| Wage / Income Gap (%) | 38,824 | 32.00% |
| Wage / Income Gap ($) | 38,824 | 68.00¢ per $1 |
| Gini / Inequality Index | 38,824 | 0.47 |
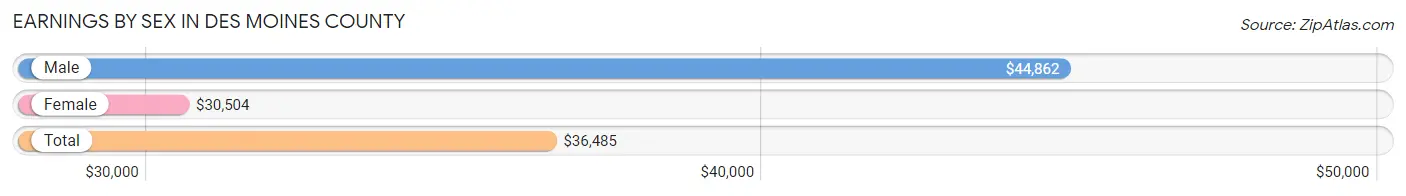
Earnings by Sex in Des Moines County
Average Earnings in Des Moines County are $36,485, $44,862 for men and $30,504 for women, a difference of 32.0%.
| Sex | Number | Average Earnings |
| Male | 10,520 (51.8%) | $44,862 |
| Female | 9,778 (48.2%) | $30,504 |
| Total | 20,298 (100.0%) | $36,485 |
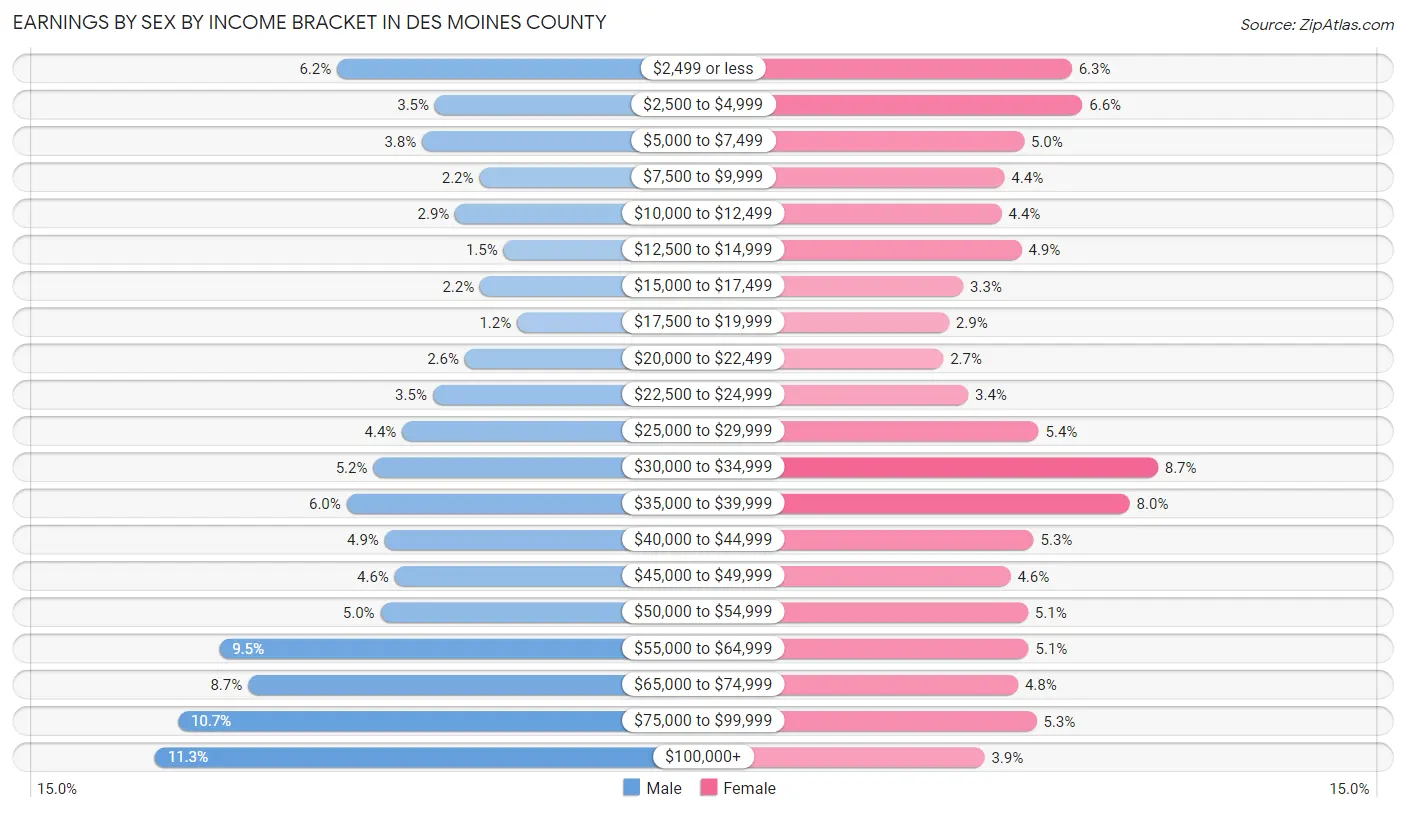
Earnings by Sex by Income Bracket in Des Moines County
The most common earnings brackets in Des Moines County are $100,000+ for men (1,193 | 11.3%) and $30,000 to $34,999 for women (855 | 8.7%).
| Income | Male | Female |
| $2,499 or less | 654 (6.2%) | 618 (6.3%) |
| $2,500 to $4,999 | 365 (3.5%) | 647 (6.6%) |
| $5,000 to $7,499 | 403 (3.8%) | 487 (5.0%) |
| $7,500 to $9,999 | 234 (2.2%) | 433 (4.4%) |
| $10,000 to $12,499 | 305 (2.9%) | 425 (4.3%) |
| $12,500 to $14,999 | 162 (1.5%) | 480 (4.9%) |
| $15,000 to $17,499 | 231 (2.2%) | 320 (3.3%) |
| $17,500 to $19,999 | 122 (1.2%) | 281 (2.9%) |
| $20,000 to $22,499 | 277 (2.6%) | 265 (2.7%) |
| $22,500 to $24,999 | 371 (3.5%) | 333 (3.4%) |
| $25,000 to $29,999 | 462 (4.4%) | 527 (5.4%) |
| $30,000 to $34,999 | 547 (5.2%) | 855 (8.7%) |
| $35,000 to $39,999 | 626 (5.9%) | 777 (8.0%) |
| $40,000 to $44,999 | 513 (4.9%) | 513 (5.2%) |
| $45,000 to $49,999 | 484 (4.6%) | 450 (4.6%) |
| $50,000 to $54,999 | 526 (5.0%) | 498 (5.1%) |
| $55,000 to $64,999 | 1,003 (9.5%) | 500 (5.1%) |
| $65,000 to $74,999 | 917 (8.7%) | 470 (4.8%) |
| $75,000 to $99,999 | 1,125 (10.7%) | 521 (5.3%) |
| $100,000+ | 1,193 (11.3%) | 378 (3.9%) |
| Total | 10,520 (100.0%) | 9,778 (100.0%) |
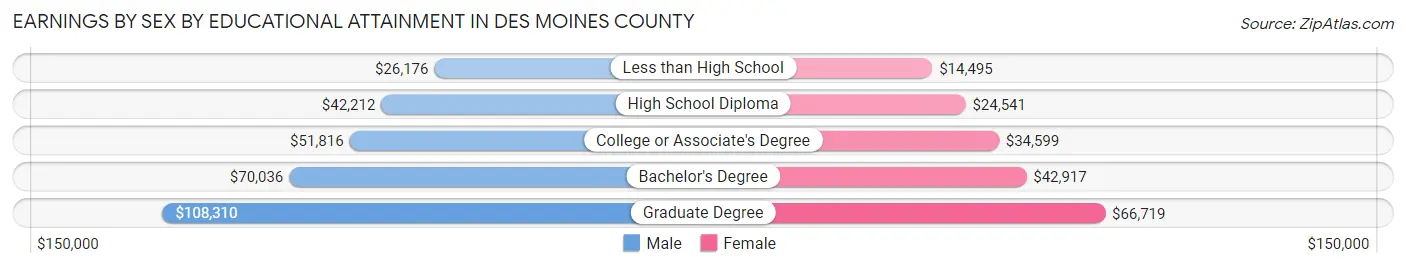
Earnings by Sex by Educational Attainment in Des Moines County
Average earnings in Des Moines County are $52,120 for men and $33,744 for women, a difference of 35.3%. Men with an educational attainment of graduate degree enjoy the highest average annual earnings of $108,310, while those with less than high school education earn the least with $26,176. Women with an educational attainment of graduate degree earn the most with the average annual earnings of $66,719, while those with less than high school education have the smallest earnings of $14,495.
| Educational Attainment | Male Income | Female Income |
| Less than High School | $26,176 | $14,495 |
| High School Diploma | $42,212 | $24,541 |
| College or Associate's Degree | $51,816 | $34,599 |
| Bachelor's Degree | $70,036 | $42,917 |
| Graduate Degree | $108,310 | $66,719 |
| Total | $52,120 | $33,744 |
Family Income in Des Moines County
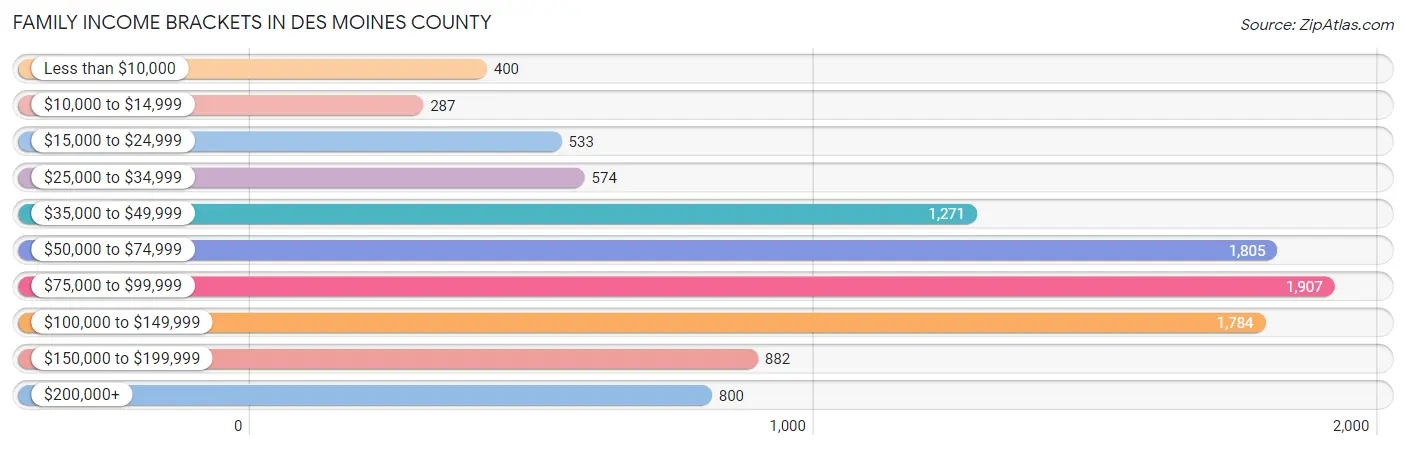
Family Income Brackets in Des Moines County
According to the Des Moines County family income data, there are 1,907 families falling into the $75,000 to $99,999 income range, which is the most common income bracket and makes up 18.6% of all families. Conversely, the $10,000 to $14,999 income bracket is the least frequent group with only 287 families (2.8%) belonging to this category.
| Income Bracket | # Families | % Families |
| Less than $10,000 | 400 | 3.9% |
| $10,000 to $14,999 | 287 | 2.8% |
| $15,000 to $24,999 | 533 | 5.2% |
| $25,000 to $34,999 | 574 | 5.6% |
| $35,000 to $49,999 | 1,271 | 12.4% |
| $50,000 to $74,999 | 1,805 | 17.6% |
| $75,000 to $99,999 | 1,907 | 18.6% |
| $100,000 to $149,999 | 1,784 | 17.4% |
| $150,000 to $199,999 | 882 | 8.6% |
| $200,000+ | 800 | 7.8% |
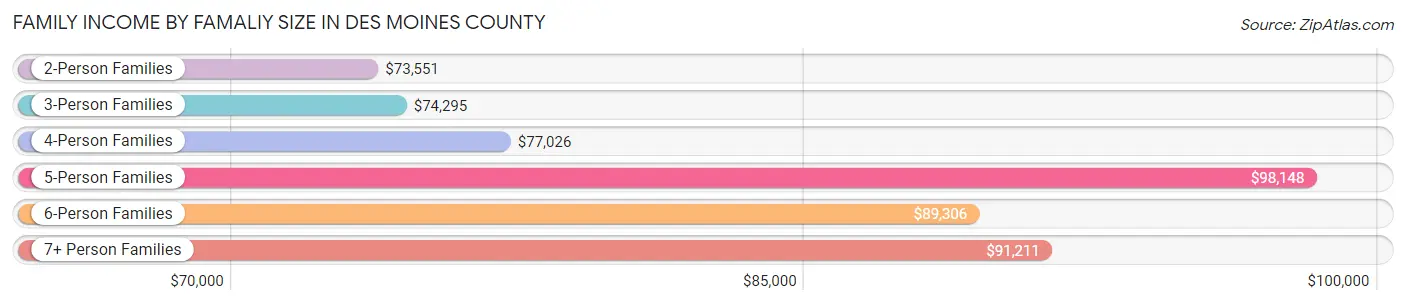
Family Income by Famaliy Size in Des Moines County
5-person families (776 | 7.6%) account for the highest median family income in Des Moines County with $98,148 per family, while 2-person families (5,515 | 53.8%) have the highest median income of $36,776 per family member.
| Income Bracket | # Families | Median Income |
| 2-Person Families | 5,515 (53.8%) | $73,551 |
| 3-Person Families | 2,025 (19.8%) | $74,295 |
| 4-Person Families | 1,663 (16.2%) | $77,026 |
| 5-Person Families | 776 (7.6%) | $98,148 |
| 6-Person Families | 229 (2.2%) | $89,306 |
| 7+ Person Families | 45 (0.4%) | $91,211 |
| Total | 10,253 (100.0%) | $76,866 |
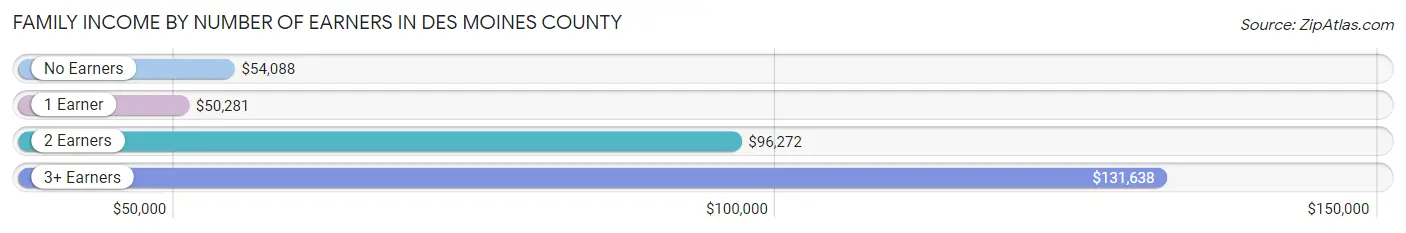
Family Income by Number of Earners in Des Moines County
The median family income in Des Moines County is $76,866, with families comprising 3+ earners (968) having the highest median family income of $131,638, while families with 1 earner (3,474) have the lowest median family income of $50,281, accounting for 9.4% and 33.9% of families, respectively.
| Number of Earners | # Families | Median Income |
| No Earners | 1,642 (16.0%) | $54,088 |
| 1 Earner | 3,474 (33.9%) | $50,281 |
| 2 Earners | 4,169 (40.7%) | $96,272 |
| 3+ Earners | 968 (9.4%) | $131,638 |
| Total | 10,253 (100.0%) | $76,866 |
Household Income in Des Moines County
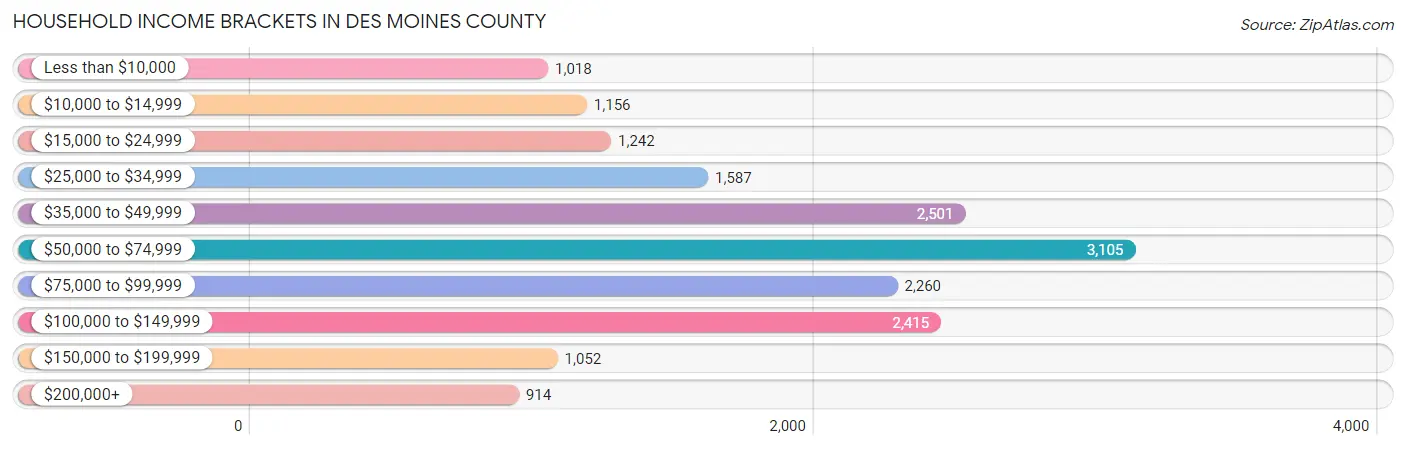
Household Income Brackets in Des Moines County
With 3,105 households falling in the category, the $50,000 to $74,999 income range is the most frequent in Des Moines County, accounting for 18.0% of all households. In contrast, only 914 households (5.3%) fall into the $200,000+ income bracket, making it the least populous group.
| Income Bracket | # Households | % Households |
| Less than $10,000 | 1,018 | 5.9% |
| $10,000 to $14,999 | 1,156 | 6.7% |
| $15,000 to $24,999 | 1,242 | 7.2% |
| $25,000 to $34,999 | 1,587 | 9.2% |
| $35,000 to $49,999 | 2,501 | 14.5% |
| $50,000 to $74,999 | 3,105 | 18.0% |
| $75,000 to $99,999 | 2,260 | 13.1% |
| $100,000 to $149,999 | 2,415 | 14.0% |
| $150,000 to $199,999 | 1,052 | 6.1% |
| $200,000+ | 914 | 5.3% |
Household Income by Householder Age in Des Moines County
The median household income in Des Moines County is $58,084, with the highest median household income of $72,083 found in the 45 to 64 years age bracket for the primary householder. A total of 5,868 households (34.0%) fall into this category. Meanwhile, the 15 to 24 years age bracket for the primary householder has the lowest median household income of $35,584, with 729 households (4.2%) in this group.
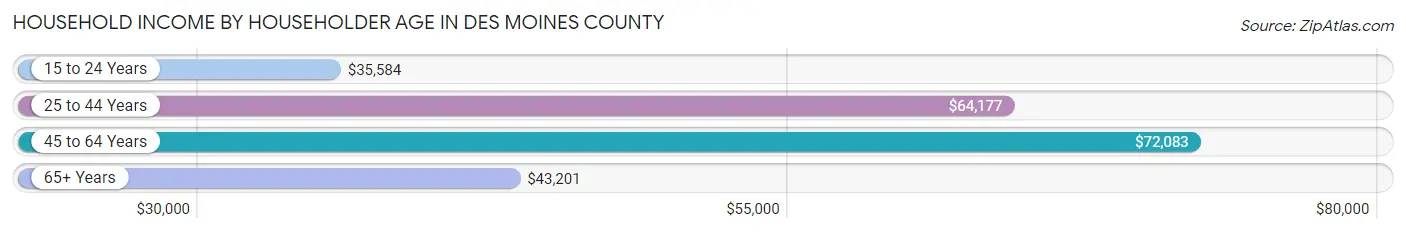
| Income Bracket | # Households | Median Income |
| 15 to 24 Years | 729 (4.2%) | $35,584 |
| 25 to 44 Years | 5,173 (30.0%) | $64,177 |
| 45 to 64 Years | 5,868 (34.0%) | $72,083 |
| 65+ Years | 5,481 (31.8%) | $43,201 |
| Total | 17,251 (100.0%) | $58,084 |
Poverty in Des Moines County
Income Below Poverty by Sex and Age in Des Moines County
With 12.0% poverty level for males and 17.2% for females among the residents of Des Moines County, under 5 year old males and 15 year old females are the most vulnerable to poverty, with 235 males (23.4%) and 99 females (41.4%) in their respective age groups living below the poverty level.
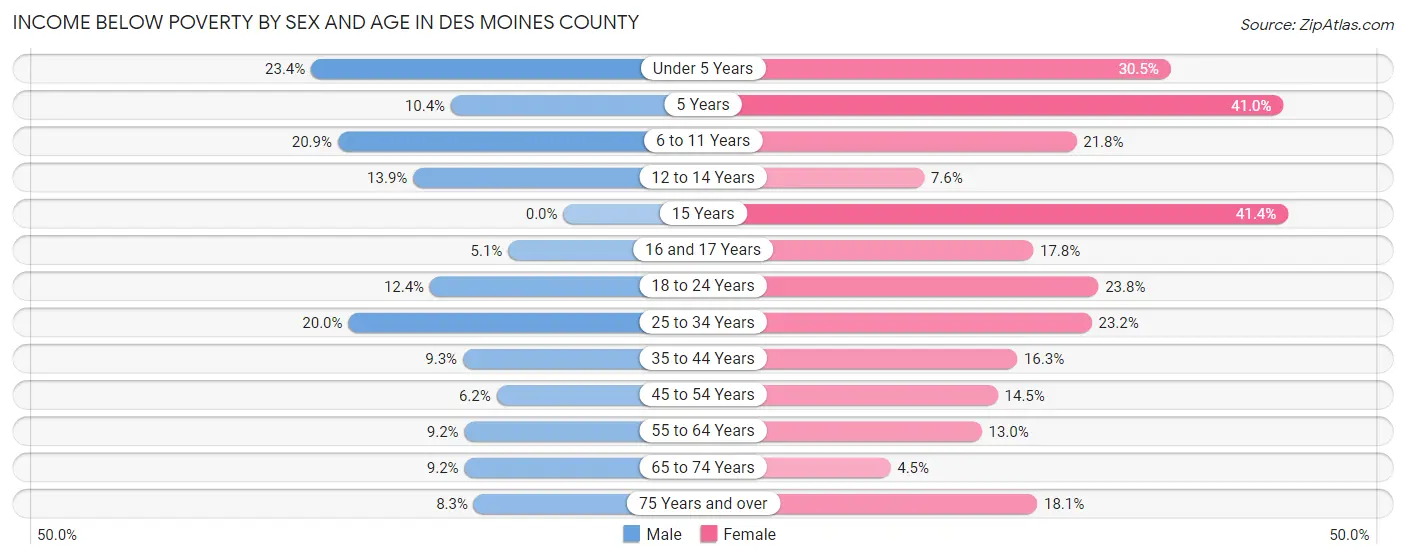
| Age Bracket | Male | Female |
| Under 5 Years | 235 (23.4%) | 343 (30.5%) |
| 5 Years | 48 (10.4%) | 100 (41.0%) |
| 6 to 11 Years | 302 (20.9%) | 279 (21.8%) |
| 12 to 14 Years | 70 (13.9%) | 58 (7.6%) |
| 15 Years | 0 (0.0%) | 99 (41.4%) |
| 16 and 17 Years | 35 (5.1%) | 109 (17.7%) |
| 18 to 24 Years | 168 (12.4%) | 341 (23.8%) |
| 25 to 34 Years | 443 (20.0%) | 504 (23.2%) |
| 35 to 44 Years | 205 (9.3%) | 393 (16.3%) |
| 45 to 54 Years | 140 (6.2%) | 327 (14.5%) |
| 55 to 64 Years | 244 (9.2%) | 360 (13.0%) |
| 65 to 74 Years | 216 (9.2%) | 104 (4.5%) |
| 75 Years and over | 107 (8.3%) | 327 (18.1%) |
| Total | 2,213 (12.0%) | 3,344 (17.2%) |
Income Above Poverty by Sex and Age in Des Moines County
According to the poverty statistics in Des Moines County, males aged 15 years and females aged 65 to 74 years are the age groups that are most secure financially, with 100.0% of males and 95.5% of females in these age groups living above the poverty line.
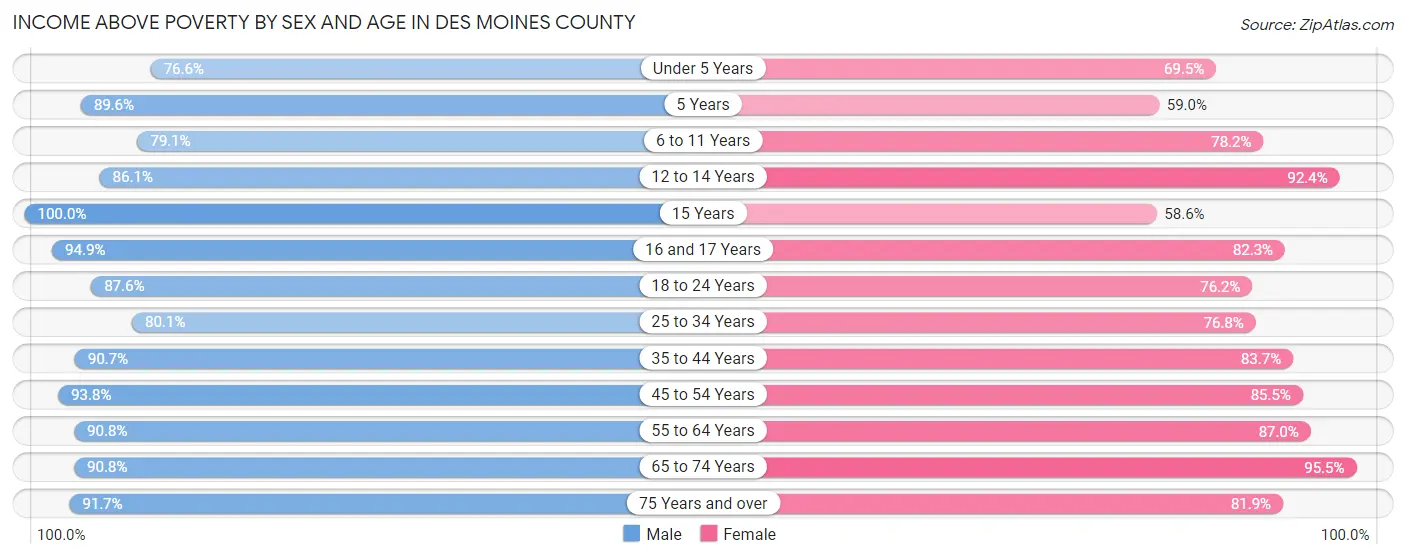
| Age Bracket | Male | Female |
| Under 5 Years | 769 (76.6%) | 781 (69.5%) |
| 5 Years | 412 (89.6%) | 144 (59.0%) |
| 6 to 11 Years | 1,141 (79.1%) | 1,003 (78.2%) |
| 12 to 14 Years | 432 (86.1%) | 703 (92.4%) |
| 15 Years | 81 (100.0%) | 140 (58.6%) |
| 16 and 17 Years | 649 (94.9%) | 505 (82.3%) |
| 18 to 24 Years | 1,189 (87.6%) | 1,092 (76.2%) |
| 25 to 34 Years | 1,778 (80.0%) | 1,670 (76.8%) |
| 35 to 44 Years | 1,995 (90.7%) | 2,024 (83.7%) |
| 45 to 54 Years | 2,117 (93.8%) | 1,934 (85.5%) |
| 55 to 64 Years | 2,415 (90.8%) | 2,415 (87.0%) |
| 65 to 74 Years | 2,136 (90.8%) | 2,209 (95.5%) |
| 75 Years and over | 1,181 (91.7%) | 1,478 (81.9%) |
| Total | 16,295 (88.0%) | 16,098 (82.8%) |
Income Below Poverty Among Married-Couple Families in Des Moines County
The poverty statistics for married-couple families in Des Moines County show that 4.0% or 288 of the total 7,244 families live below the poverty line. Families with 1 or 2 children have the highest poverty rate of 5.2%, comprising of 101 families. On the other hand, families with 5 or more children have the lowest poverty rate of 0.0%, which includes 0 families.
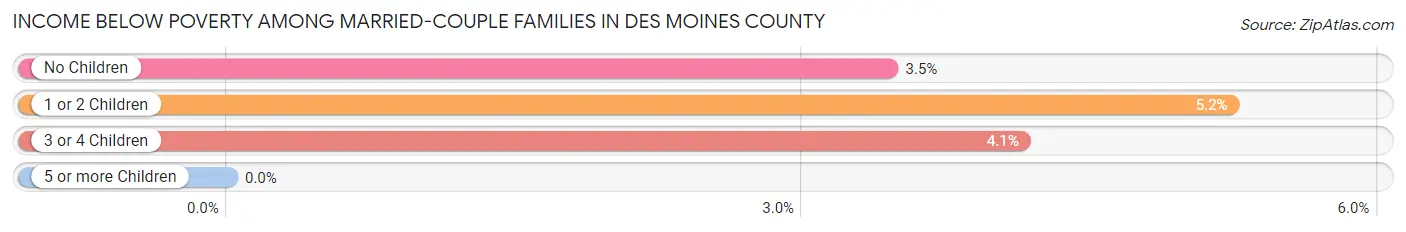
| Children | Above Poverty | Below Poverty |
| No Children | 4,540 (96.6%) | 162 (3.5%) |
| 1 or 2 Children | 1,831 (94.8%) | 101 (5.2%) |
| 3 or 4 Children | 579 (95.9%) | 25 (4.1%) |
| 5 or more Children | 6 (100.0%) | 0 (0.0%) |
| Total | 6,956 (96.0%) | 288 (4.0%) |
Income Below Poverty Among Single-Parent Households in Des Moines County
According to the poverty data in Des Moines County, 18.6% or 170 single-father households and 33.9% or 711 single-mother households are living below the poverty line. Among single-father households, those with 1 or 2 children have the highest poverty rate, with 147 households (40.4%) experiencing poverty. Likewise, among single-mother households, those with 3 or 4 children have the highest poverty rate, with 246 households (75.2%) falling below the poverty line.
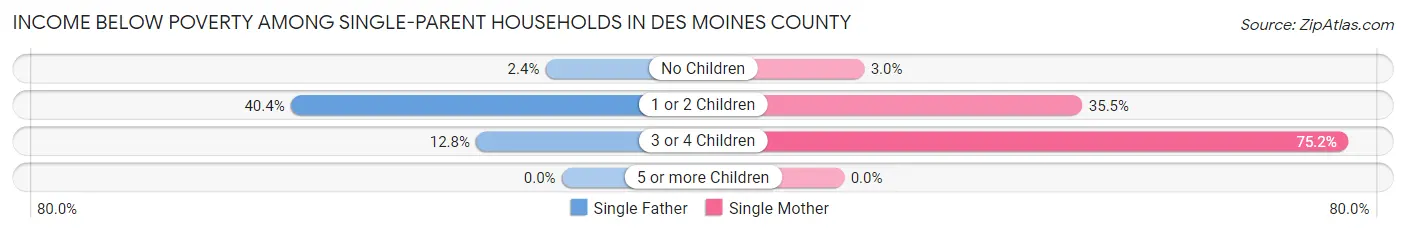
| Children | Single Father | Single Mother |
| No Children | 11 (2.4%) | 15 (3.0%) |
| 1 or 2 Children | 147 (40.4%) | 450 (35.5%) |
| 3 or 4 Children | 12 (12.8%) | 246 (75.2%) |
| 5 or more Children | 0 (0.0%) | 0 (0.0%) |
| Total | 170 (18.6%) | 711 (33.9%) |
Income Below Poverty Among Married-Couple vs Single-Parent Households in Des Moines County
The poverty data for Des Moines County shows that 288 of the married-couple family households (4.0%) and 881 of the single-parent households (29.3%) are living below the poverty level. Within the married-couple family households, those with 1 or 2 children have the highest poverty rate, with 101 households (5.2%) falling below the poverty line. Among the single-parent households, those with 3 or 4 children have the highest poverty rate, with 258 household (61.3%) living below poverty.
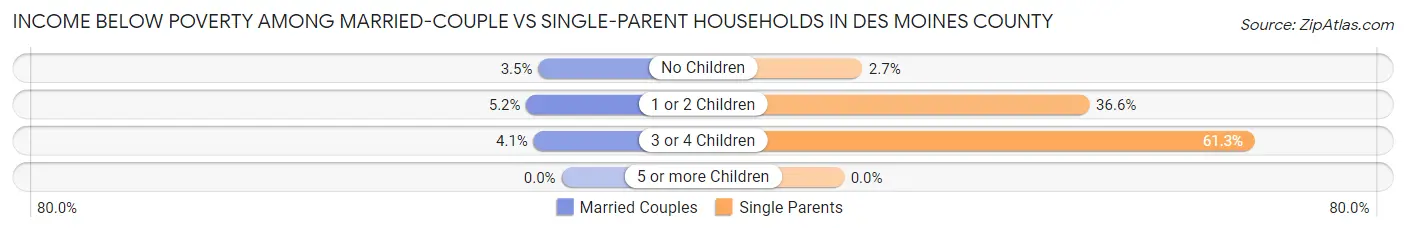
| Children | Married-Couple Families | Single-Parent Households |
| No Children | 162 (3.5%) | 26 (2.7%) |
| 1 or 2 Children | 101 (5.2%) | 597 (36.6%) |
| 3 or 4 Children | 25 (4.1%) | 258 (61.3%) |
| 5 or more Children | 0 (0.0%) | 0 (0.0%) |
| Total | 288 (4.0%) | 881 (29.3%) |
Race in Des Moines County
The most populous races in Des Moines County are White / Caucasian (33,941 | 87.4%), Two or more Races (2,148 | 5.5%), and Black / African American (2,043 | 5.3%).
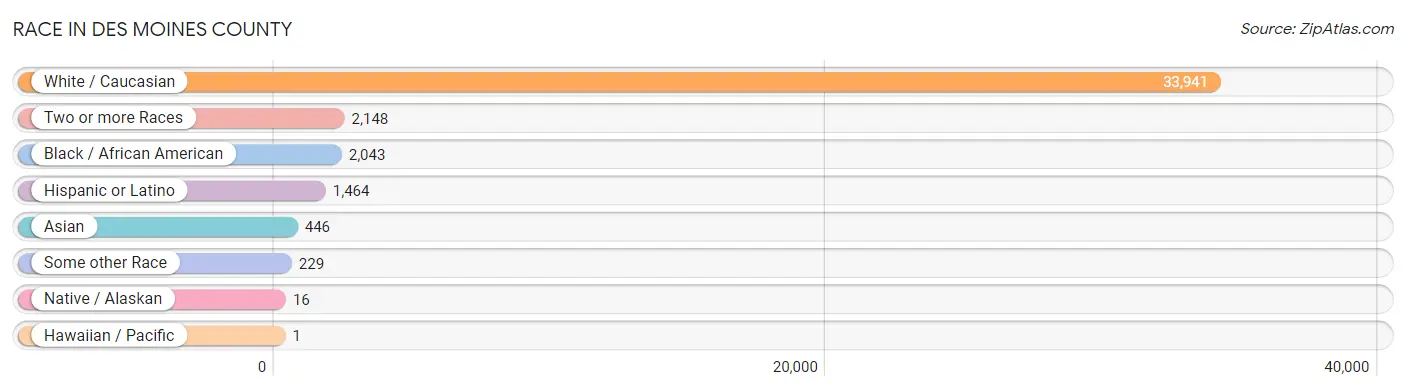
| Race | # Population | % Population |
| Asian | 446 | 1.1% |
| Black / African American | 2,043 | 5.3% |
| Hawaiian / Pacific | 1 | 0.0% |
| Hispanic or Latino | 1,464 | 3.8% |
| Native / Alaskan | 16 | 0.0% |
| White / Caucasian | 33,941 | 87.4% |
| Two or more Races | 2,148 | 5.5% |
| Some other Race | 229 | 0.6% |
| Total | 38,824 | 100.0% |
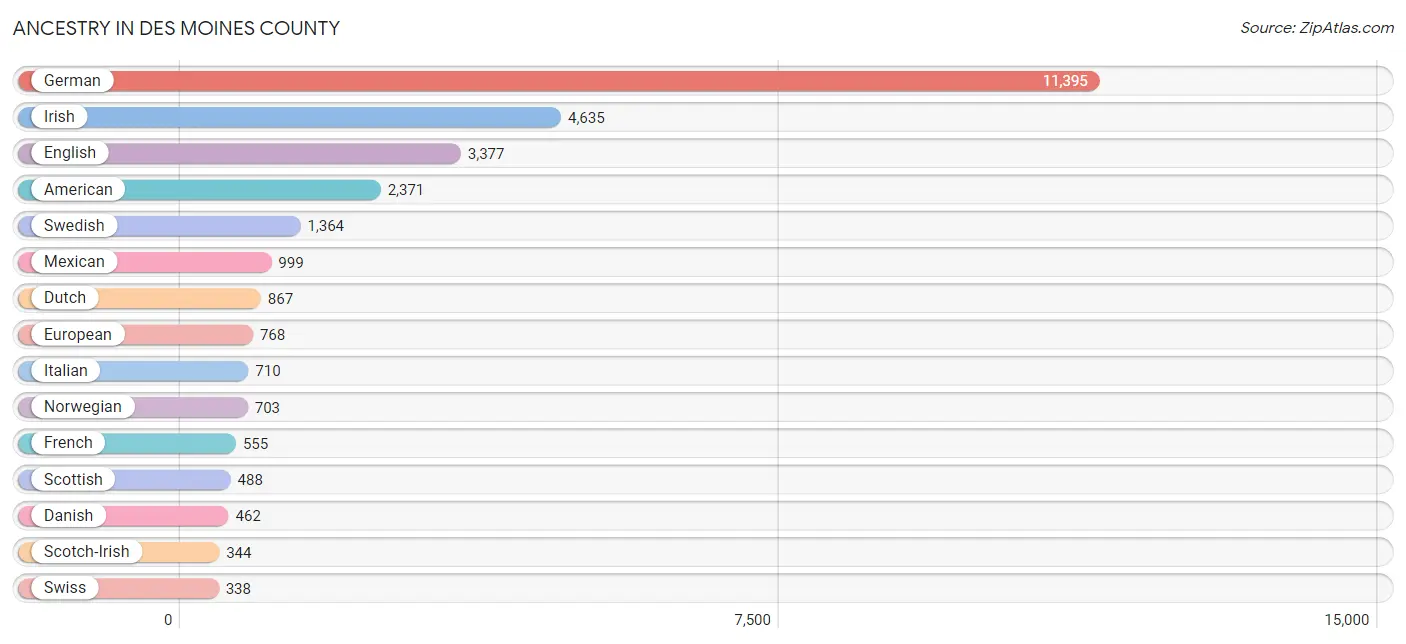
Ancestry in Des Moines County
The most populous ancestries reported in Des Moines County are German (11,395 | 29.3%), Irish (4,635 | 11.9%), English (3,377 | 8.7%), American (2,371 | 6.1%), and Swedish (1,364 | 3.5%), together accounting for 59.6% of all Des Moines County residents.
| Ancestry | # Population | % Population |
| African | 134 | 0.4% |
| Albanian | 3 | 0.0% |
| American | 2,371 | 6.1% |
| Arab | 73 | 0.2% |
| Argentinean | 4 | 0.0% |
| Armenian | 55 | 0.1% |
| Australian | 21 | 0.1% |
| Austrian | 27 | 0.1% |
| Belgian | 6 | 0.0% |
| Blackfeet | 6 | 0.0% |
| British | 104 | 0.3% |
| Burmese | 120 | 0.3% |
| Canadian | 71 | 0.2% |
| Celtic | 23 | 0.1% |
| Central American | 32 | 0.1% |
| Cherokee | 95 | 0.2% |
| Chickasaw | 8 | 0.0% |
| Croatian | 24 | 0.1% |
| Cuban | 21 | 0.1% |
| Czech | 201 | 0.5% |
| Czechoslovakian | 14 | 0.0% |
| Danish | 462 | 1.2% |
| Dominican | 119 | 0.3% |
| Dutch | 867 | 2.2% |
| Eastern European | 32 | 0.1% |
| Ecuadorian | 19 | 0.1% |
| Egyptian | 73 | 0.2% |
| English | 3,377 | 8.7% |
| European | 768 | 2.0% |
| French | 555 | 1.4% |
| French Canadian | 58 | 0.2% |
| German | 11,395 | 29.3% |
| Greek | 30 | 0.1% |
| Guamanian / Chamorro | 1 | 0.0% |
| Guatemalan | 32 | 0.1% |
| Hungarian | 37 | 0.1% |
| Indian (Asian) | 58 | 0.2% |
| Inupiat | 15 | 0.0% |
| Irish | 4,635 | 11.9% |
| Italian | 710 | 1.8% |
| Kenyan | 45 | 0.1% |
| Korean | 120 | 0.3% |
| Lithuanian | 12 | 0.0% |
| Maltese | 7 | 0.0% |
| Mexican | 999 | 2.6% |
| Mexican American Indian | 7 | 0.0% |
| Native Hawaiian | 55 | 0.1% |
| Nigerian | 21 | 0.1% |
| Northern European | 66 | 0.2% |
| Norwegian | 703 | 1.8% |
| Pakistani | 12 | 0.0% |
| Pennsylvania German | 102 | 0.3% |
| Polish | 308 | 0.8% |
| Portuguese | 33 | 0.1% |
| Puerto Rican | 82 | 0.2% |
| Romanian | 44 | 0.1% |
| Russian | 19 | 0.1% |
| Scandinavian | 65 | 0.2% |
| Scotch-Irish | 344 | 0.9% |
| Scottish | 488 | 1.3% |
| Serbian | 13 | 0.0% |
| Sioux | 3 | 0.0% |
| Slovak | 13 | 0.0% |
| Slovene | 14 | 0.0% |
| South American | 90 | 0.2% |
| Spaniard | 6 | 0.0% |
| Spanish | 43 | 0.1% |
| Subsaharan African | 200 | 0.5% |
| Swedish | 1,364 | 3.5% |
| Swiss | 338 | 0.9% |
| Thai | 268 | 0.7% |
| Ukrainian | 17 | 0.0% |
| Venezuelan | 67 | 0.2% |
| Welsh | 293 | 0.7% | View All 74 Rows |
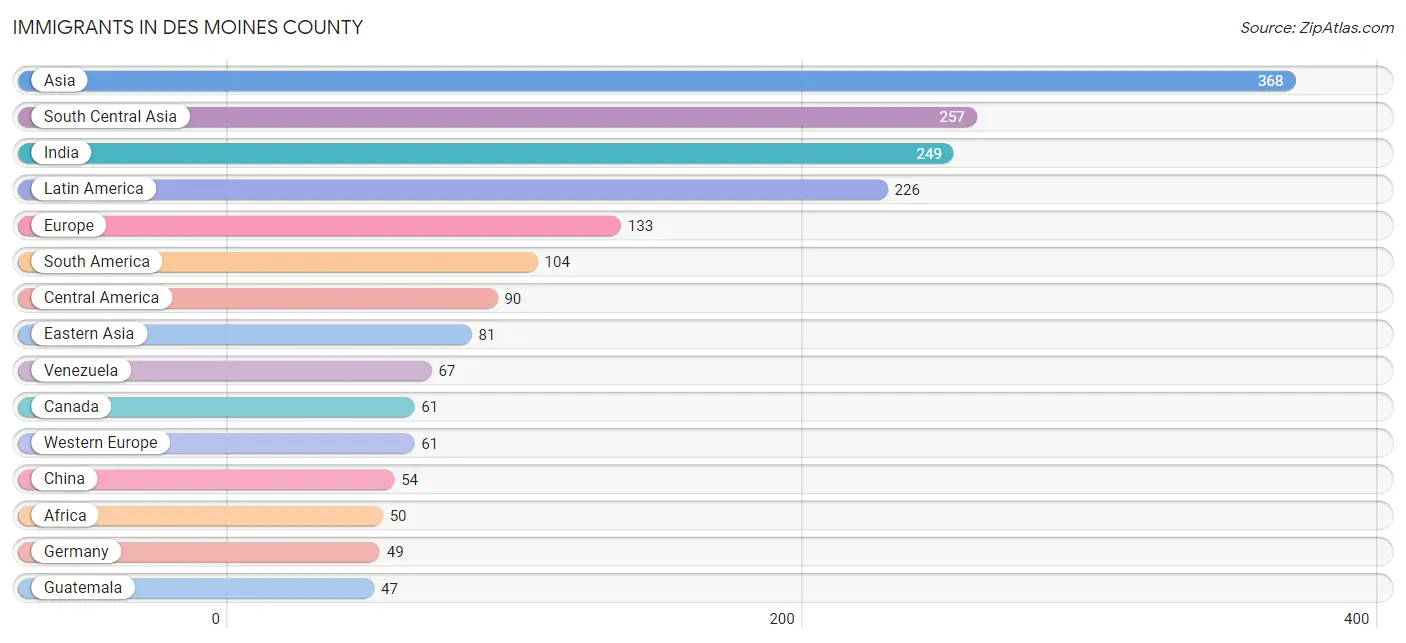
Immigrants in Des Moines County
The most numerous immigrant groups reported in Des Moines County came from Asia (368 | 0.9%), South Central Asia (257 | 0.7%), India (249 | 0.6%), Latin America (226 | 0.6%), and Europe (133 | 0.3%), together accounting for 3.2% of all Des Moines County residents.
| Immigration Origin | # Population | % Population |
| Africa | 50 | 0.1% |
| Asia | 368 | 0.9% |
| Australia | 19 | 0.1% |
| Brazil | 18 | 0.1% |
| Canada | 61 | 0.2% |
| Caribbean | 32 | 0.1% |
| Central America | 90 | 0.2% |
| China | 54 | 0.1% |
| Dominican Republic | 32 | 0.1% |
| Eastern Asia | 81 | 0.2% |
| Eastern Europe | 25 | 0.1% |
| Ecuador | 19 | 0.1% |
| Egypt | 37 | 0.1% |
| England | 19 | 0.1% |
| Europe | 133 | 0.3% |
| Germany | 49 | 0.1% |
| Greece | 12 | 0.0% |
| Guatemala | 47 | 0.1% |
| India | 249 | 0.6% |
| Ireland | 6 | 0.0% |
| Korea | 27 | 0.1% |
| Latin America | 226 | 0.6% |
| Mexico | 43 | 0.1% |
| Nepal | 5 | 0.0% |
| Netherlands | 2 | 0.0% |
| Nigeria | 4 | 0.0% |
| Northern Africa | 46 | 0.1% |
| Northern Europe | 25 | 0.1% |
| Oceania | 19 | 0.1% |
| Philippines | 30 | 0.1% |
| Portugal | 10 | 0.0% |
| Romania | 14 | 0.0% |
| Russia | 11 | 0.0% |
| South America | 104 | 0.3% |
| South Central Asia | 257 | 0.7% |
| South Eastern Asia | 30 | 0.1% |
| Southern Europe | 22 | 0.1% |
| Switzerland | 10 | 0.0% |
| Venezuela | 67 | 0.2% |
| Western Africa | 4 | 0.0% |
| Western Europe | 61 | 0.2% | View All 41 Rows |
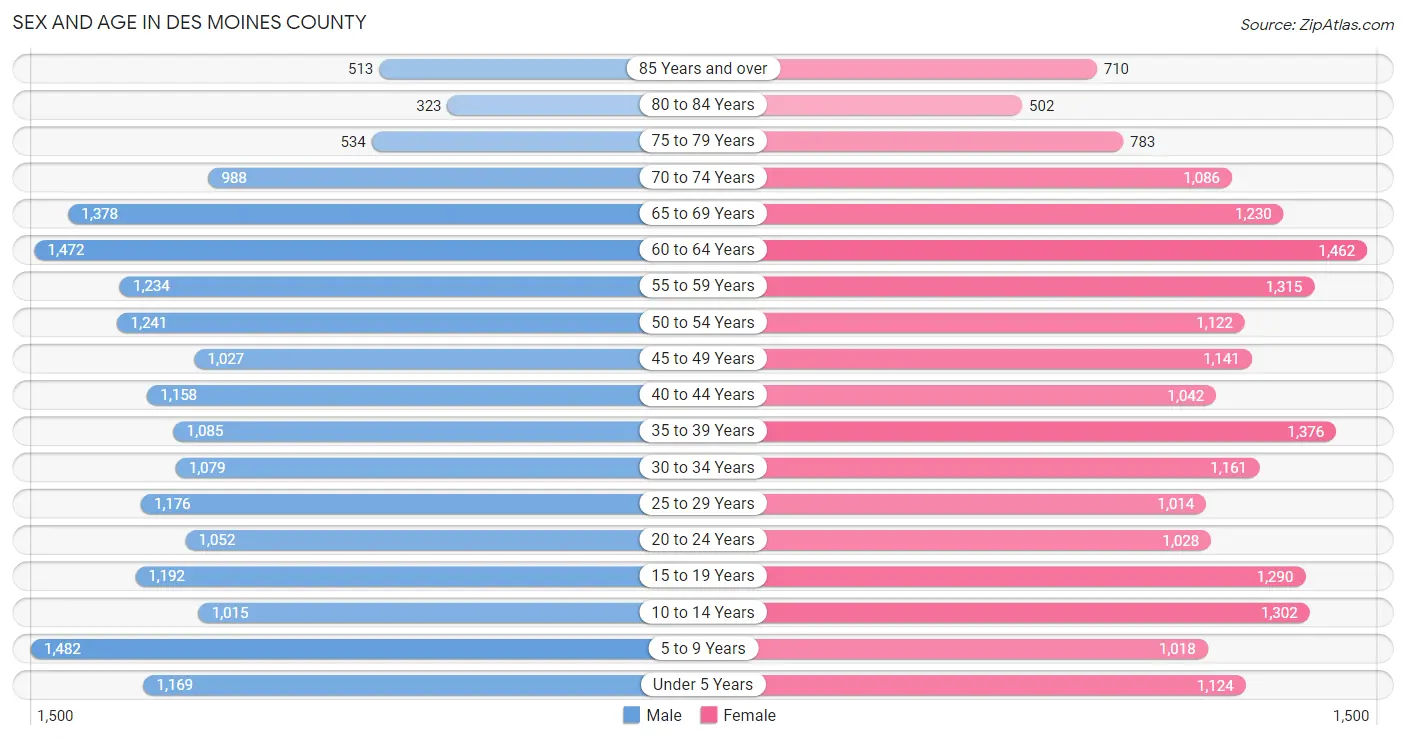
Sex and Age in Des Moines County
Sex and Age in Des Moines County
The most populous age groups in Des Moines County are 5 to 9 Years (1,482 | 7.7%) for men and 60 to 64 Years (1,462 | 7.4%) for women.
| Age Bracket | Male | Female |
| Under 5 Years | 1,169 (6.1%) | 1,124 (5.7%) |
| 5 to 9 Years | 1,482 (7.7%) | 1,018 (5.2%) |
| 10 to 14 Years | 1,015 (5.3%) | 1,302 (6.6%) |
| 15 to 19 Years | 1,192 (6.2%) | 1,290 (6.6%) |
| 20 to 24 Years | 1,052 (5.5%) | 1,028 (5.2%) |
| 25 to 29 Years | 1,176 (6.1%) | 1,014 (5.1%) |
| 30 to 34 Years | 1,079 (5.6%) | 1,161 (5.9%) |
| 35 to 39 Years | 1,085 (5.7%) | 1,376 (7.0%) |
| 40 to 44 Years | 1,158 (6.1%) | 1,042 (5.3%) |
| 45 to 49 Years | 1,027 (5.4%) | 1,141 (5.8%) |
| 50 to 54 Years | 1,241 (6.5%) | 1,122 (5.7%) |
| 55 to 59 Years | 1,234 (6.5%) | 1,315 (6.7%) |
| 60 to 64 Years | 1,472 (7.7%) | 1,462 (7.4%) |
| 65 to 69 Years | 1,378 (7.2%) | 1,230 (6.2%) |
| 70 to 74 Years | 988 (5.2%) | 1,086 (5.5%) |
| 75 to 79 Years | 534 (2.8%) | 783 (4.0%) |
| 80 to 84 Years | 323 (1.7%) | 502 (2.5%) |
| 85 Years and over | 513 (2.7%) | 710 (3.6%) |
| Total | 19,118 (100.0%) | 19,706 (100.0%) |
Families and Households in Des Moines County
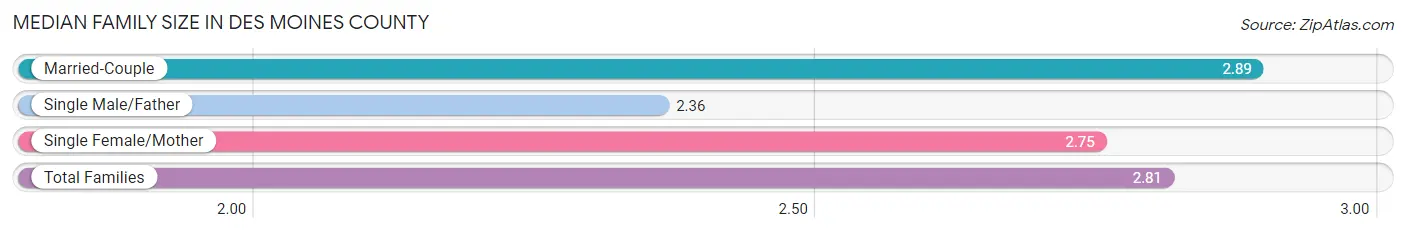
Median Family Size in Des Moines County
The median family size in Des Moines County is 2.81 persons per family, with married-couple families (7,244 | 70.7%) accounting for the largest median family size of 2.89 persons per family. On the other hand, single male/father families (913 | 8.9%) represent the smallest median family size with 2.36 persons per family.
| Family Type | # Families | Family Size |
| Married-Couple | 7,244 (70.7%) | 2.89 |
| Single Male/Father | 913 (8.9%) | 2.36 |
| Single Female/Mother | 2,096 (20.4%) | 2.75 |
| Total Families | 10,253 (100.0%) | 2.81 |
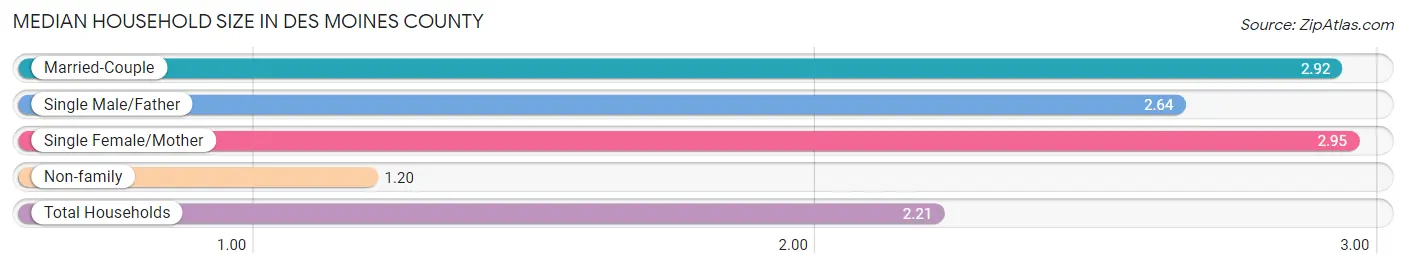
Median Household Size in Des Moines County
The median household size in Des Moines County is 2.21 persons per household, with single female/mother households (2,096 | 12.1%) accounting for the largest median household size of 2.95 persons per household. non-family households (6,998 | 40.6%) represent the smallest median household size with 1.20 persons per household.
| Household Type | # Households | Household Size |
| Married-Couple | 7,244 (42.0%) | 2.92 |
| Single Male/Father | 913 (5.3%) | 2.64 |
| Single Female/Mother | 2,096 (12.1%) | 2.95 |
| Non-family | 6,998 (40.6%) | 1.20 |
| Total Households | 17,251 (100.0%) | 2.21 |
Household Size by Marriage Status in Des Moines County
Out of a total of 17,251 households in Des Moines County, 10,253 (59.4%) are family households, while 6,998 (40.6%) are nonfamily households. The most numerous type of family households are 2-person households, comprising 5,187, and the most common type of nonfamily households are 1-person households, comprising 5,833.
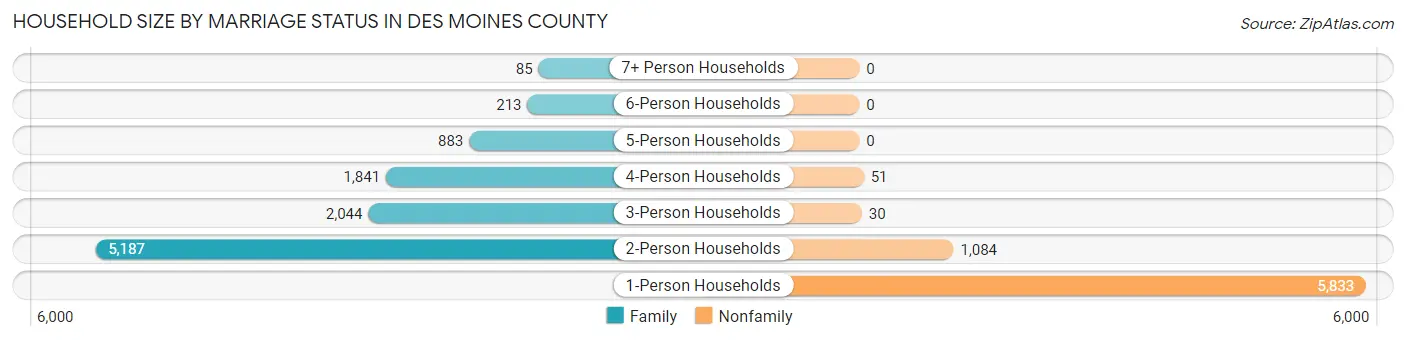
| Household Size | Family Households | Nonfamily Households |
| 1-Person Households | - | 5,833 (33.8%) |
| 2-Person Households | 5,187 (30.1%) | 1,084 (6.3%) |
| 3-Person Households | 2,044 (11.8%) | 30 (0.2%) |
| 4-Person Households | 1,841 (10.7%) | 51 (0.3%) |
| 5-Person Households | 883 (5.1%) | 0 (0.0%) |
| 6-Person Households | 213 (1.2%) | 0 (0.0%) |
| 7+ Person Households | 85 (0.5%) | 0 (0.0%) |
| Total | 10,253 (59.4%) | 6,998 (40.6%) |
Female Fertility in Des Moines County
Fertility by Age in Des Moines County
Average fertility rate in Des Moines County is 46.0 births per 1,000 women. Women in the age bracket of 20 to 34 years have the highest fertility rate with 87.0 births per 1,000 women. Women in the age bracket of 20 to 34 years acount for 72.0% of all women with births.
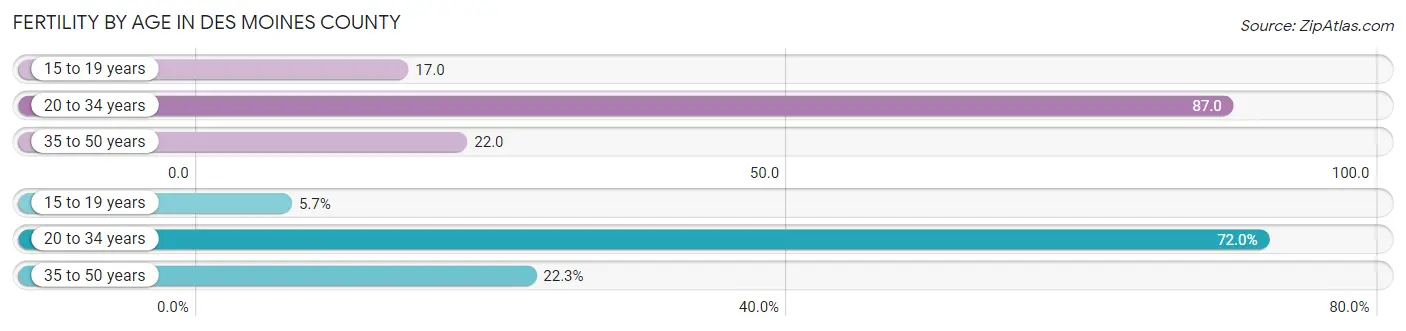
| Age Bracket | Women with Births | Births / 1,000 Women |
| 15 to 19 years | 22 (5.7%) | 17.0 |
| 20 to 34 years | 278 (72.0%) | 87.0 |
| 35 to 50 years | 86 (22.3%) | 22.0 |
| Total | 386 (100.0%) | 46.0 |
Fertility by Age by Marriage Status in Des Moines County
61.1% of women with births (386) in Des Moines County are married. The highest percentage of unmarried women with births falls into 15 to 19 years age bracket with 100.0% of them unmarried at the time of birth, while the lowest percentage of unmarried women with births belong to 35 to 50 years age bracket with 30.2% of them unmarried.
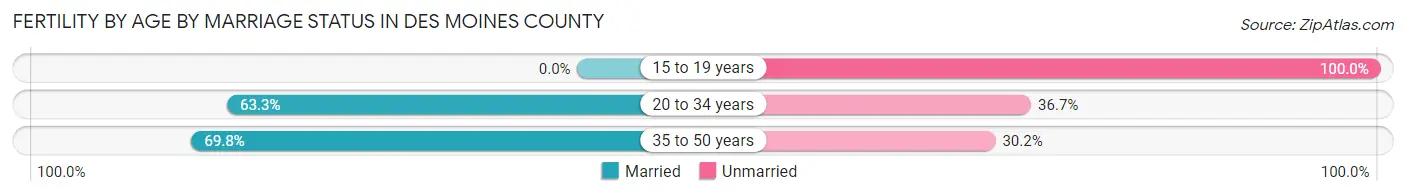
| Age Bracket | Married | Unmarried |
| 15 to 19 years | 0 (0.0%) | 22 (100.0%) |
| 20 to 34 years | 176 (63.3%) | 102 (36.7%) |
| 35 to 50 years | 60 (69.8%) | 26 (30.2%) |
| Total | 236 (61.1%) | 150 (38.9%) |
Fertility by Education in Des Moines County
Average fertility rate in Des Moines County is 46.0 births per 1,000 women. Women with the education attainment of high school diploma have the highest fertility rate of 91.0 births per 1,000 women, while women with the education attainment of less than high school have the lowest fertility at 9.0 births per 1,000 women. Women with the education attainment of high school diploma represent 43.3% of all women with births.
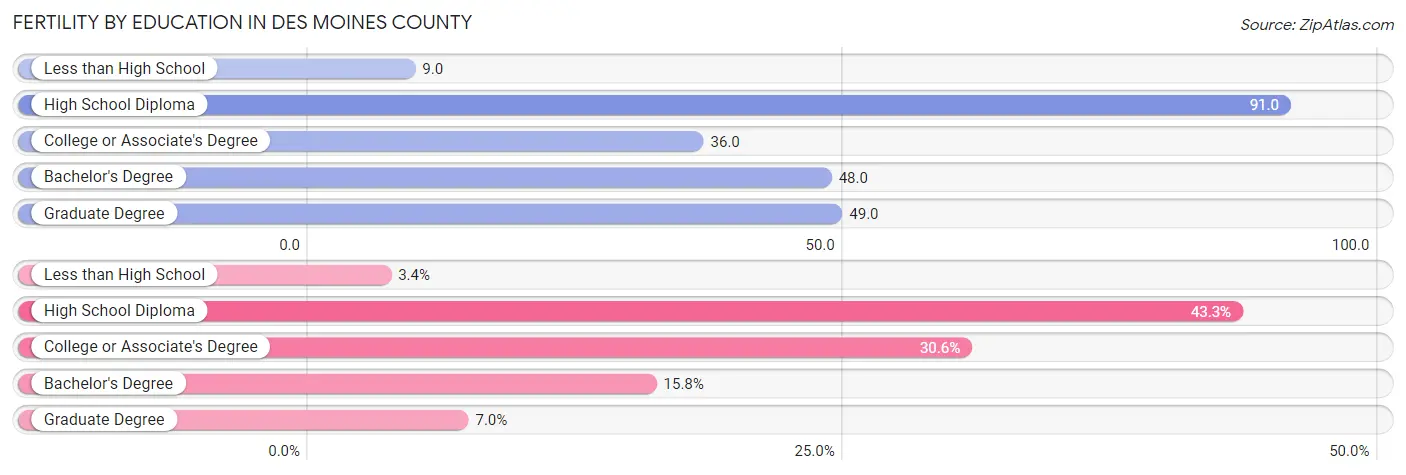
| Educational Attainment | Women with Births | Births / 1,000 Women |
| Less than High School | 13 (3.4%) | 9.0 |
| High School Diploma | 167 (43.3%) | 91.0 |
| College or Associate's Degree | 118 (30.6%) | 36.0 |
| Bachelor's Degree | 61 (15.8%) | 48.0 |
| Graduate Degree | 27 (7.0%) | 49.0 |
| Total | 386 (100.0%) | 46.0 |
Fertility by Education by Marriage Status in Des Moines County
38.9% of women with births in Des Moines County are unmarried. Women with the educational attainment of bachelor's degree are most likely to be married with 100.0% of them married at childbirth, while women with the educational attainment of less than high school are least likely to be married with 100.0% of them unmarried at childbirth.
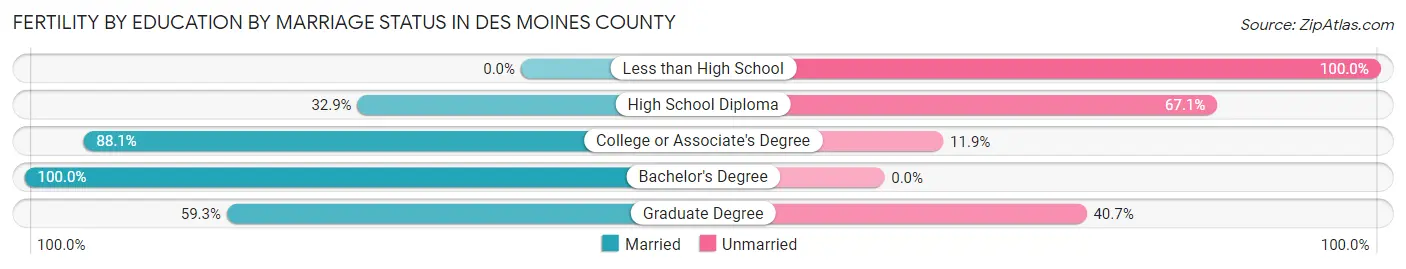
| Educational Attainment | Married | Unmarried |
| Less than High School | 0 (0.0%) | 13 (100.0%) |
| High School Diploma | 55 (32.9%) | 112 (67.1%) |
| College or Associate's Degree | 104 (88.1%) | 14 (11.9%) |
| Bachelor's Degree | 61 (100.0%) | 0 (0.0%) |
| Graduate Degree | 16 (59.3%) | 11 (40.7%) |
| Total | 236 (61.1%) | 150 (38.9%) |
Employment Characteristics in Des Moines County
Employment by Class of Employer in Des Moines County
Among the 18,215 employed individuals in Des Moines County, private company employees (12,571 | 69.0%), local government employees (1,592 | 8.7%), and not-for-profit organizations (1,510 | 8.3%) make up the most common classes of employment.
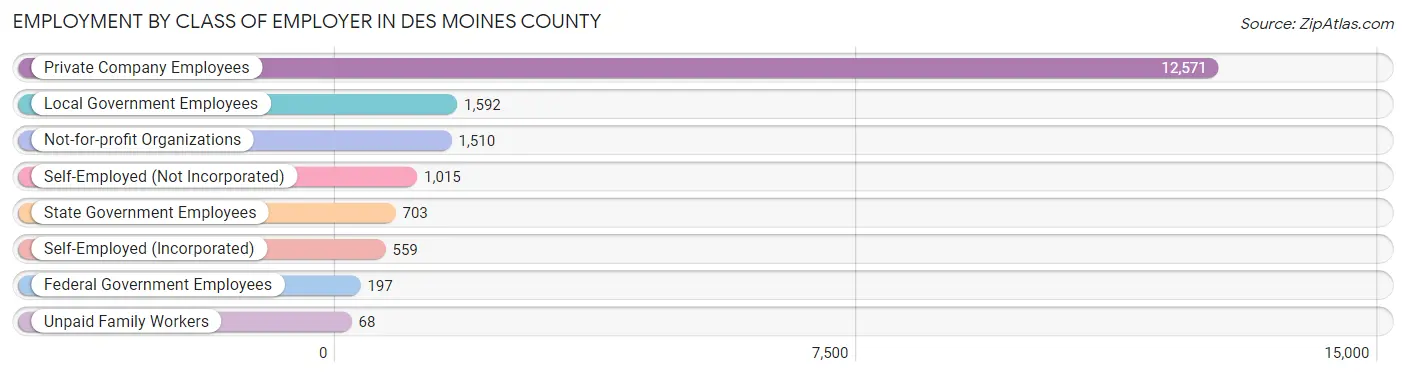
| Employer Class | # Employees | % Employees |
| Private Company Employees | 12,571 | 69.0% |
| Self-Employed (Incorporated) | 559 | 3.1% |
| Self-Employed (Not Incorporated) | 1,015 | 5.6% |
| Not-for-profit Organizations | 1,510 | 8.3% |
| Local Government Employees | 1,592 | 8.7% |
| State Government Employees | 703 | 3.9% |
| Federal Government Employees | 197 | 1.1% |
| Unpaid Family Workers | 68 | 0.4% |
| Total | 18,215 | 100.0% |
Employment Status by Age in Des Moines County
According to the labor force statistics for Des Moines County, out of the total population over 16 years of age (31,393), 61.0% or 19,150 individuals are in the labor force, with 2.9% or 555 of them unemployed. The age group with the highest labor force participation rate is 35 to 44 years, with 89.2% or 4,158 individuals in the labor force. Within the labor force, the 20 to 24 years age range has the highest percentage of unemployed individuals, with 7.7% or 131 of them being unemployed.
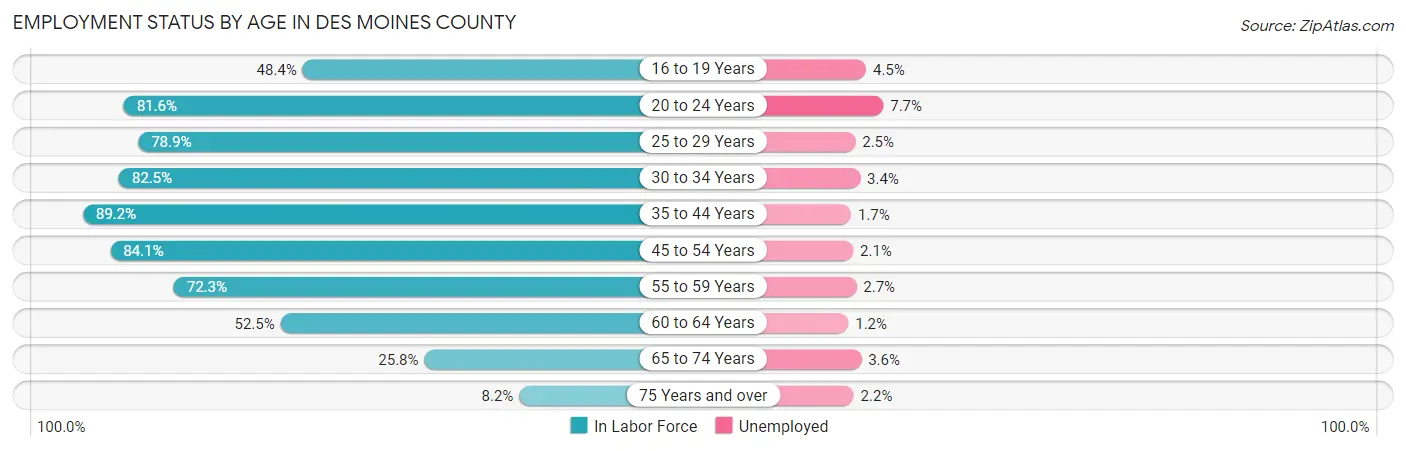
| Age Bracket | In Labor Force | Unemployed |
| 16 to 19 Years | 1,046 (48.4%) | 47 (4.5%) |
| 20 to 24 Years | 1,697 (81.6%) | 131 (7.7%) |
| 25 to 29 Years | 1,728 (78.9%) | 43 (2.5%) |
| 30 to 34 Years | 1,848 (82.5%) | 63 (3.4%) |
| 35 to 44 Years | 4,158 (89.2%) | 71 (1.7%) |
| 45 to 54 Years | 3,811 (84.1%) | 80 (2.1%) |
| 55 to 59 Years | 1,843 (72.3%) | 50 (2.7%) |
| 60 to 64 Years | 1,540 (52.5%) | 18 (1.2%) |
| 65 to 74 Years | 1,208 (25.8%) | 43 (3.6%) |
| 75 Years and over | 276 (8.2%) | 6 (2.2%) |
| Total | 19,150 (61.0%) | 555 (2.9%) |
Employment Status by Educational Attainment in Des Moines County
According to labor force statistics for Des Moines County, 78.1% of individuals (14,921) out of the total population between 25 and 64 years of age (19,105) are in the labor force, with 2.2% or 328 of them being unemployed. The group with the highest labor force participation rate are those with the educational attainment of bachelor's degree or higher, with 90.3% or 4,189 individuals in the labor force. Within the labor force, individuals with less than high school education have the highest percentage of unemployment, with 10.6% or 88 of them being unemployed.
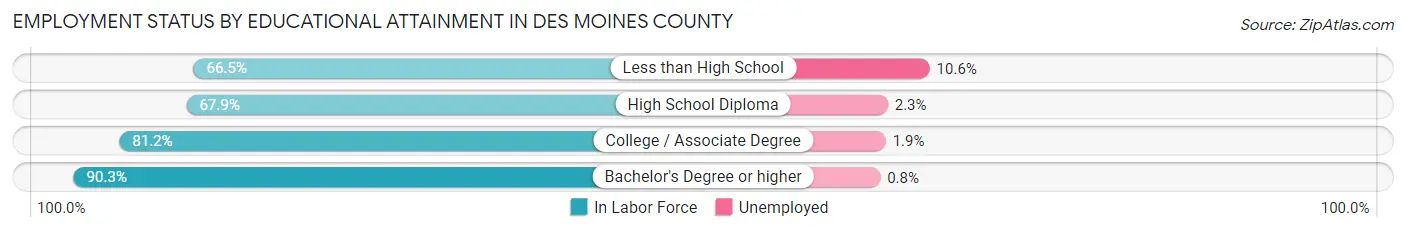
| Educational Attainment | In Labor Force | Unemployed |
| Less than High School | 831 (66.5%) | 132 (10.6%) |
| High School Diploma | 4,219 (67.9%) | 143 (2.3%) |
| College / Associate Degree | 5,686 (81.2%) | 133 (1.9%) |
| Bachelor's Degree or higher | 4,189 (90.3%) | 37 (0.8%) |
| Total | 14,921 (78.1%) | 420 (2.2%) |
Employment Occupations by Sex in Des Moines County
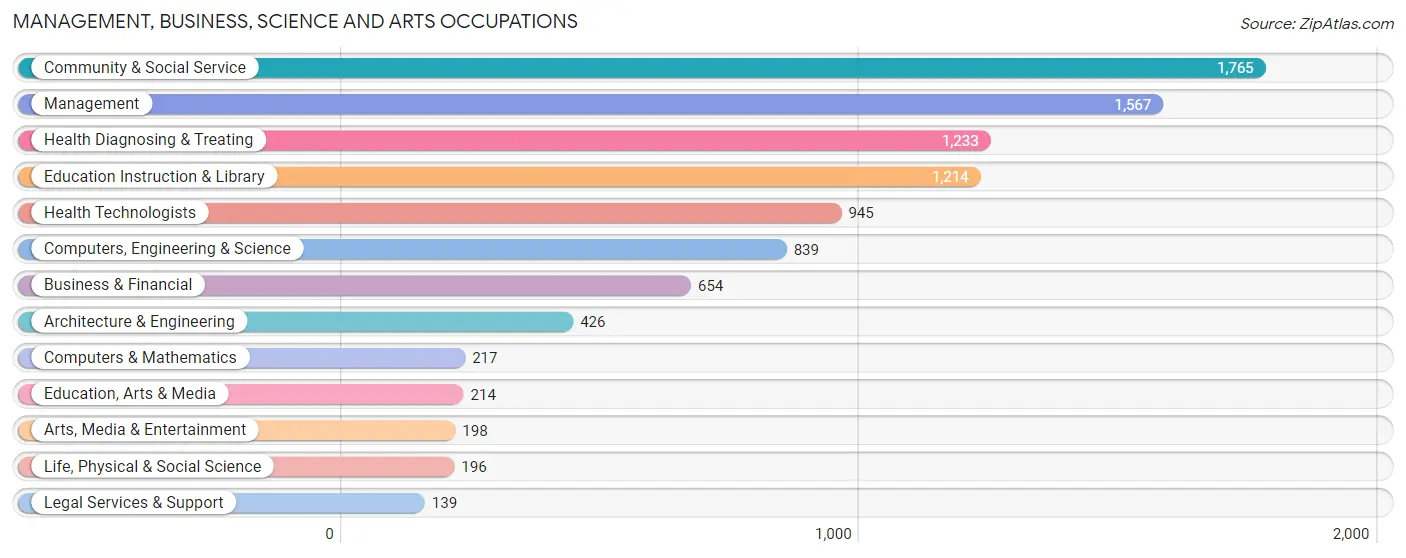
Management, Business, Science and Arts Occupations
The most common Management, Business, Science and Arts occupations in Des Moines County are Community & Social Service (1,765 | 9.5%), Management (1,567 | 8.4%), Health Diagnosing & Treating (1,233 | 6.6%), Education Instruction & Library (1,214 | 6.5%), and Health Technologists (945 | 5.1%).
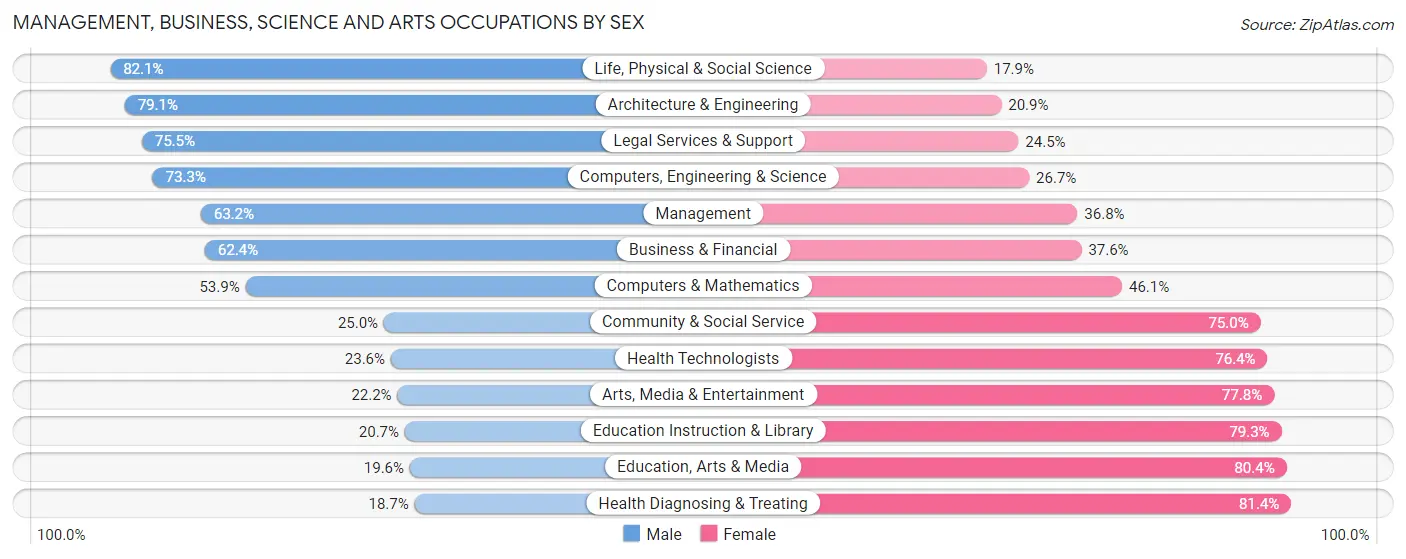
Management, Business, Science and Arts Occupations by Sex
Within the Management, Business, Science and Arts occupations in Des Moines County, the most male-oriented occupations are Life, Physical & Social Science (82.1%), Architecture & Engineering (79.1%), and Legal Services & Support (75.5%), while the most female-oriented occupations are Health Diagnosing & Treating (81.4%), Education, Arts & Media (80.4%), and Education Instruction & Library (79.3%).
| Occupation | Male | Female |
| Management | 991 (63.2%) | 576 (36.8%) |
| Business & Financial | 408 (62.4%) | 246 (37.6%) |
| Computers, Engineering & Science | 615 (73.3%) | 224 (26.7%) |
| Computers & Mathematics | 117 (53.9%) | 100 (46.1%) |
| Architecture & Engineering | 337 (79.1%) | 89 (20.9%) |
| Life, Physical & Social Science | 161 (82.1%) | 35 (17.9%) |
| Community & Social Service | 442 (25.0%) | 1,323 (75.0%) |
| Education, Arts & Media | 42 (19.6%) | 172 (80.4%) |
| Legal Services & Support | 105 (75.5%) | 34 (24.5%) |
| Education Instruction & Library | 251 (20.7%) | 963 (79.3%) |
| Arts, Media & Entertainment | 44 (22.2%) | 154 (77.8%) |
| Health Diagnosing & Treating | 230 (18.6%) | 1,003 (81.4%) |
| Health Technologists | 223 (23.6%) | 722 (76.4%) |
| Total (Category) | 2,686 (44.3%) | 3,372 (55.7%) |
| Total (Overall) | 9,598 (51.6%) | 9,001 (48.4%) |
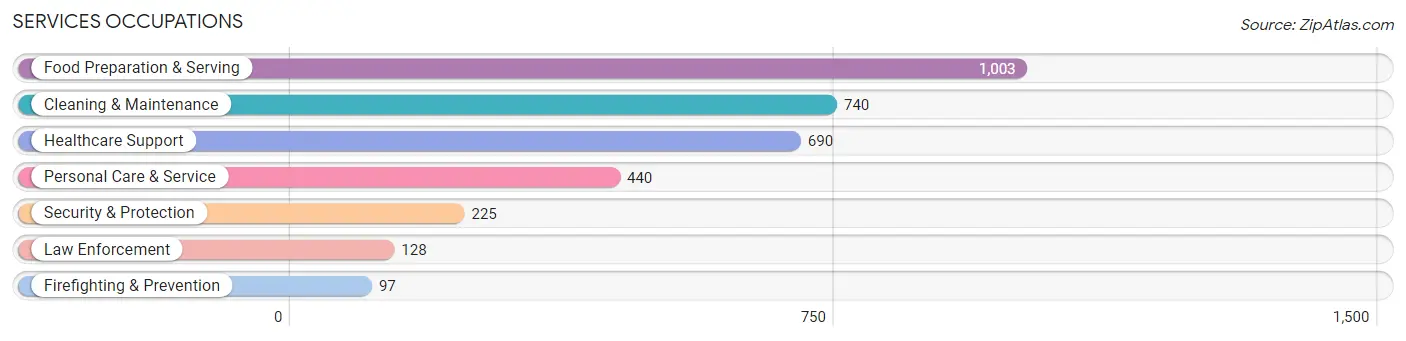
Services Occupations
The most common Services occupations in Des Moines County are Food Preparation & Serving (1,003 | 5.4%), Cleaning & Maintenance (740 | 4.0%), Healthcare Support (690 | 3.7%), Personal Care & Service (440 | 2.4%), and Security & Protection (225 | 1.2%).
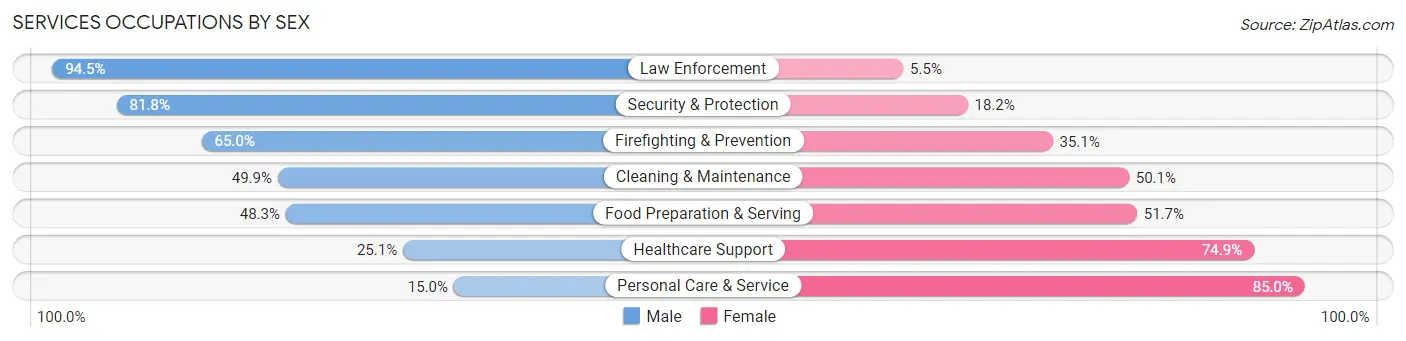
Services Occupations by Sex
Within the Services occupations in Des Moines County, the most male-oriented occupations are Law Enforcement (94.5%), Security & Protection (81.8%), and Firefighting & Prevention (64.9%), while the most female-oriented occupations are Personal Care & Service (85.0%), Healthcare Support (74.9%), and Food Preparation & Serving (51.7%).
| Occupation | Male | Female |
| Healthcare Support | 173 (25.1%) | 517 (74.9%) |
| Security & Protection | 184 (81.8%) | 41 (18.2%) |
| Firefighting & Prevention | 63 (64.9%) | 34 (35.0%) |
| Law Enforcement | 121 (94.5%) | 7 (5.5%) |
| Food Preparation & Serving | 484 (48.3%) | 519 (51.7%) |
| Cleaning & Maintenance | 369 (49.9%) | 371 (50.1%) |
| Personal Care & Service | 66 (15.0%) | 374 (85.0%) |
| Total (Category) | 1,276 (41.2%) | 1,822 (58.8%) |
| Total (Overall) | 9,598 (51.6%) | 9,001 (48.4%) |
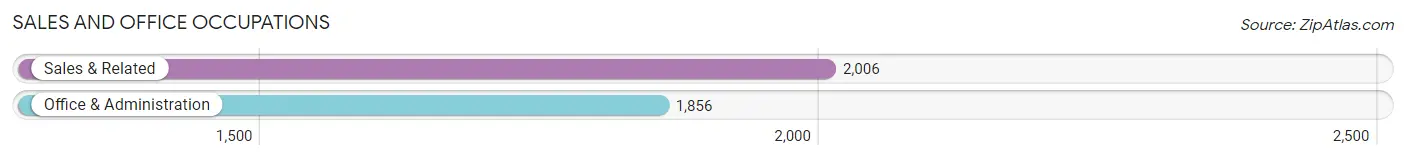
Sales and Office Occupations
The most common Sales and Office occupations in Des Moines County are Sales & Related (2,006 | 10.8%), and Office & Administration (1,856 | 10.0%).
Sales and Office Occupations by Sex
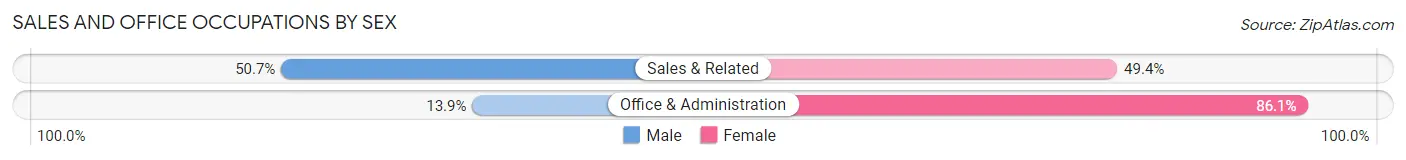
| Occupation | Male | Female |
| Sales & Related | 1,016 (50.6%) | 990 (49.3%) |
| Office & Administration | 258 (13.9%) | 1,598 (86.1%) |
| Total (Category) | 1,274 (33.0%) | 2,588 (67.0%) |
| Total (Overall) | 9,598 (51.6%) | 9,001 (48.4%) |
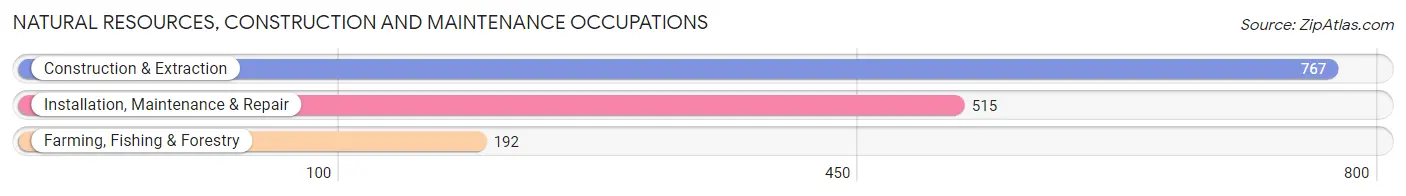
Natural Resources, Construction and Maintenance Occupations
The most common Natural Resources, Construction and Maintenance occupations in Des Moines County are Construction & Extraction (767 | 4.1%), Installation, Maintenance & Repair (515 | 2.8%), and Farming, Fishing & Forestry (192 | 1.0%).
Natural Resources, Construction and Maintenance Occupations by Sex
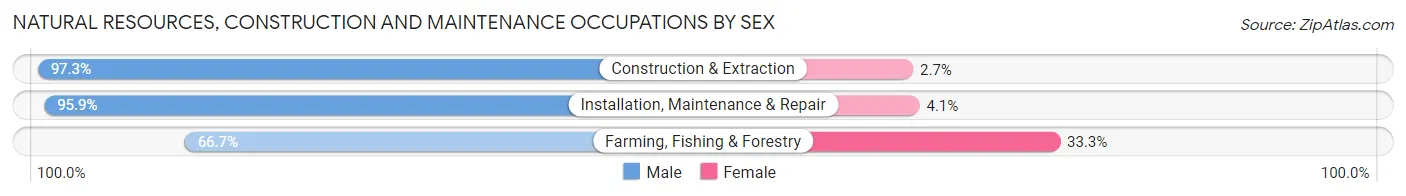
| Occupation | Male | Female |
| Farming, Fishing & Forestry | 128 (66.7%) | 64 (33.3%) |
| Construction & Extraction | 746 (97.3%) | 21 (2.7%) |
| Installation, Maintenance & Repair | 494 (95.9%) | 21 (4.1%) |
| Total (Category) | 1,368 (92.8%) | 106 (7.2%) |
| Total (Overall) | 9,598 (51.6%) | 9,001 (48.4%) |
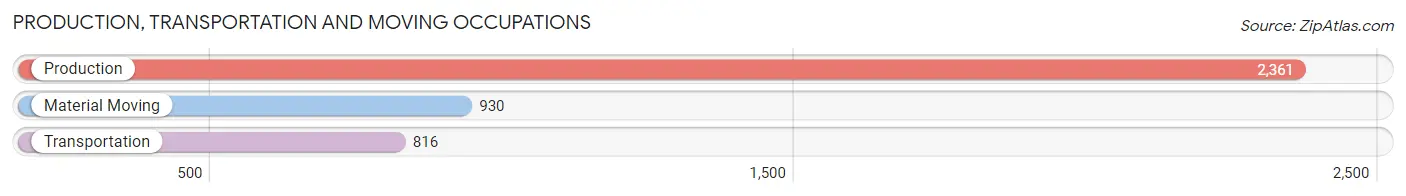
Production, Transportation and Moving Occupations
The most common Production, Transportation and Moving occupations in Des Moines County are Production (2,361 | 12.7%), Material Moving (930 | 5.0%), and Transportation (816 | 4.4%).
Production, Transportation and Moving Occupations by Sex
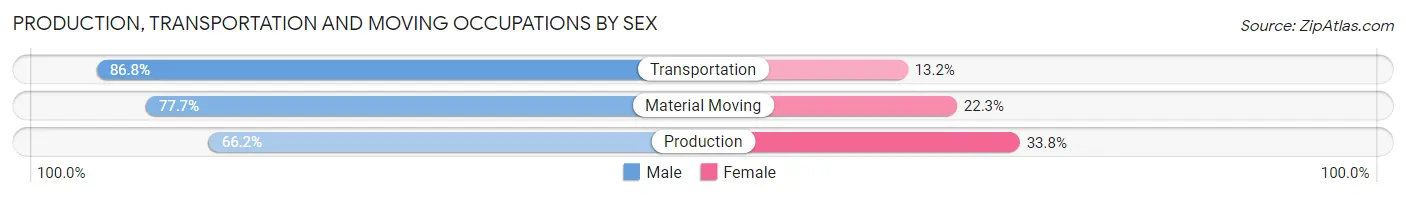
| Occupation | Male | Female |
| Production | 1,563 (66.2%) | 798 (33.8%) |
| Transportation | 708 (86.8%) | 108 (13.2%) |
| Material Moving | 723 (77.7%) | 207 (22.3%) |
| Total (Category) | 2,994 (72.9%) | 1,113 (27.1%) |
| Total (Overall) | 9,598 (51.6%) | 9,001 (48.4%) |
Employment Industries by Sex in Des Moines County
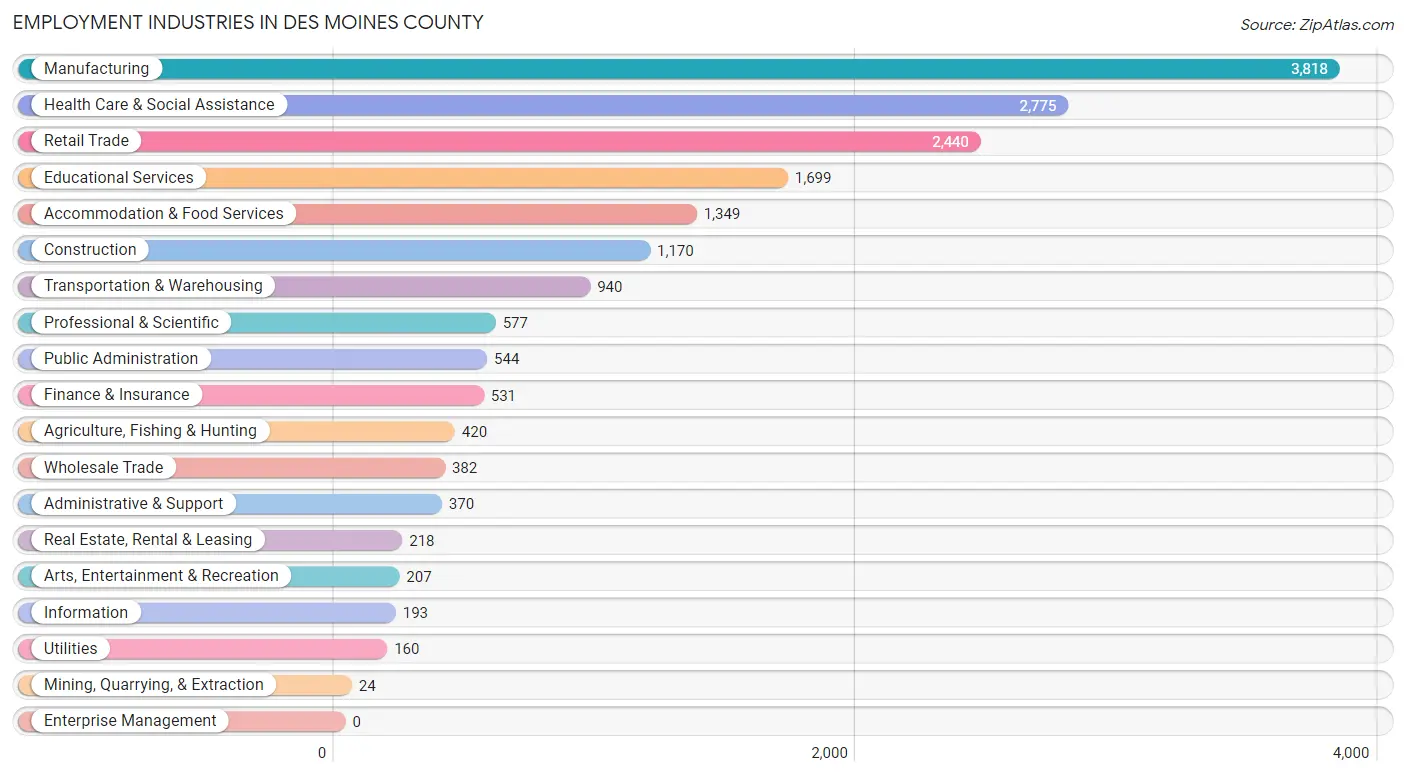
Employment Industries in Des Moines County
The major employment industries in Des Moines County include Manufacturing (3,818 | 20.5%), Health Care & Social Assistance (2,775 | 14.9%), Retail Trade (2,440 | 13.1%), Educational Services (1,699 | 9.1%), and Accommodation & Food Services (1,349 | 7.2%).
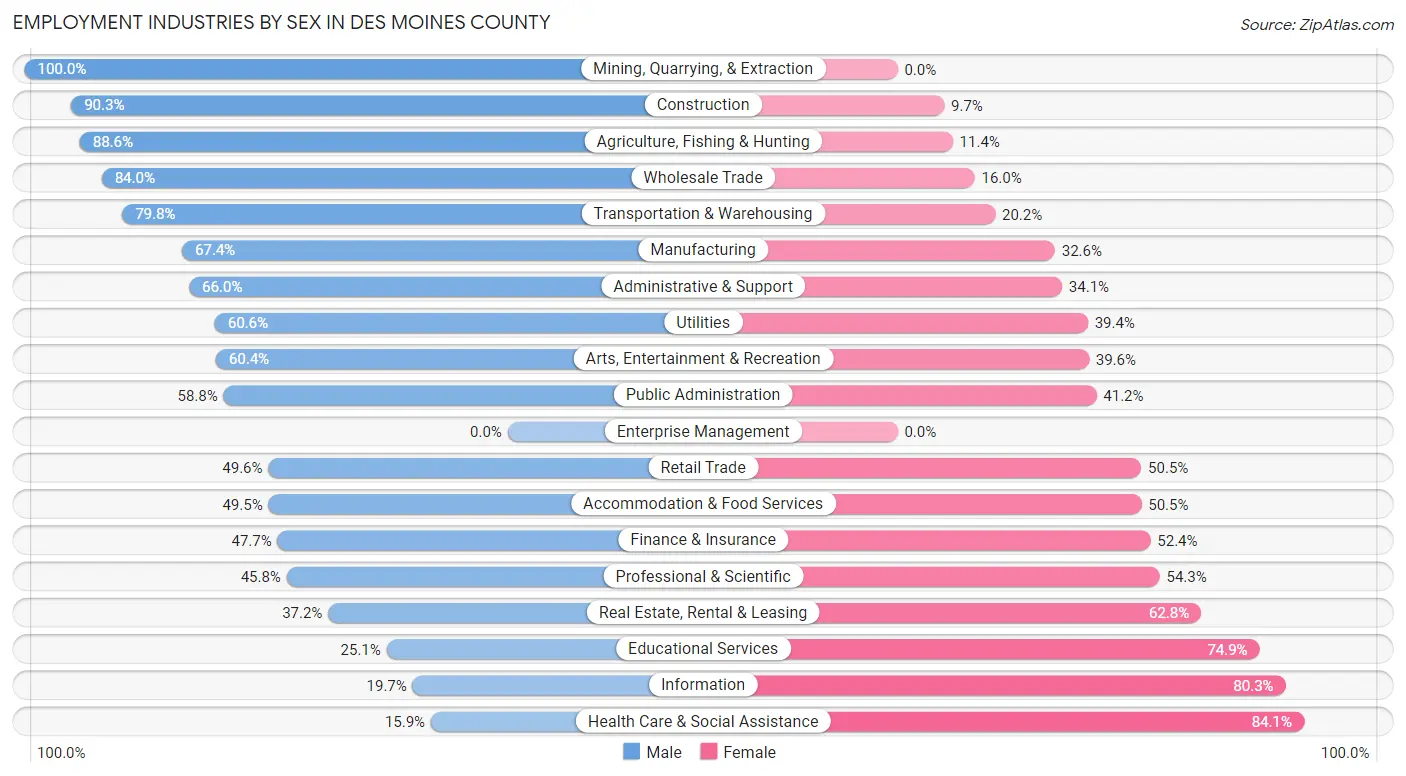
Employment Industries by Sex in Des Moines County
The Des Moines County industries that see more men than women are Mining, Quarrying, & Extraction (100.0%), Construction (90.3%), and Agriculture, Fishing & Hunting (88.6%), whereas the industries that tend to have a higher number of women are Health Care & Social Assistance (84.1%), Information (80.3%), and Educational Services (74.9%).
| Industry | Male | Female |
| Agriculture, Fishing & Hunting | 372 (88.6%) | 48 (11.4%) |
| Mining, Quarrying, & Extraction | 24 (100.0%) | 0 (0.0%) |
| Construction | 1,057 (90.3%) | 113 (9.7%) |
| Manufacturing | 2,574 (67.4%) | 1,244 (32.6%) |
| Wholesale Trade | 321 (84.0%) | 61 (16.0%) |
| Retail Trade | 1,209 (49.5%) | 1,231 (50.4%) |
| Transportation & Warehousing | 750 (79.8%) | 190 (20.2%) |
| Utilities | 97 (60.6%) | 63 (39.4%) |
| Information | 38 (19.7%) | 155 (80.3%) |
| Finance & Insurance | 253 (47.6%) | 278 (52.3%) |
| Real Estate, Rental & Leasing | 81 (37.2%) | 137 (62.8%) |
| Professional & Scientific | 264 (45.8%) | 313 (54.2%) |
| Enterprise Management | 0 (0.0%) | 0 (0.0%) |
| Administrative & Support | 244 (65.9%) | 126 (34.1%) |
| Educational Services | 426 (25.1%) | 1,273 (74.9%) |
| Health Care & Social Assistance | 441 (15.9%) | 2,334 (84.1%) |
| Arts, Entertainment & Recreation | 125 (60.4%) | 82 (39.6%) |
| Accommodation & Food Services | 668 (49.5%) | 681 (50.5%) |
| Public Administration | 320 (58.8%) | 224 (41.2%) |
| Total | 9,598 (51.6%) | 9,001 (48.4%) |
Education in Des Moines County
School Enrollment in Des Moines County
The most common levels of schooling among the 8,251 students in Des Moines County are high school (1,999 | 24.2%), middle school (1,893 | 22.9%), and elementary school (1,732 | 21.0%).
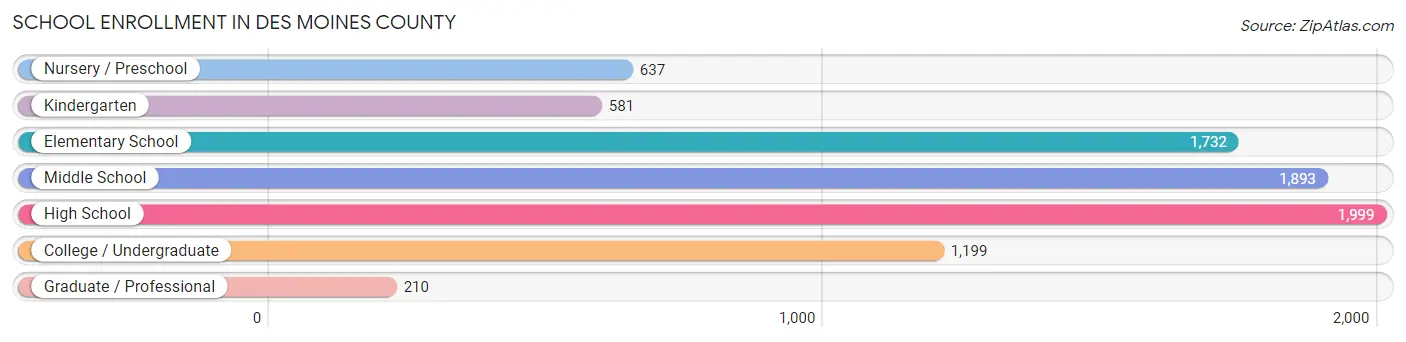
| School Level | # Students | % Students |
| Nursery / Preschool | 637 | 7.7% |
| Kindergarten | 581 | 7.0% |
| Elementary School | 1,732 | 21.0% |
| Middle School | 1,893 | 22.9% |
| High School | 1,999 | 24.2% |
| College / Undergraduate | 1,199 | 14.5% |
| Graduate / Professional | 210 | 2.5% |
| Total | 8,251 | 100.0% |
School Enrollment by Age by Funding Source in Des Moines County
Out of a total of 8,251 students who are enrolled in schools in Des Moines County, 998 (12.1%) attend a private institution, while the remaining 7,253 (87.9%) are enrolled in public schools. The age group of 25 to 34 year olds has the highest likelihood of being enrolled in private schools, with 115 (51.3% in the age bracket) enrolled. Conversely, the age group of 18 to 19 year olds has the lowest likelihood of being enrolled in a private school, with 521 (95.8% in the age bracket) attending a public institution.
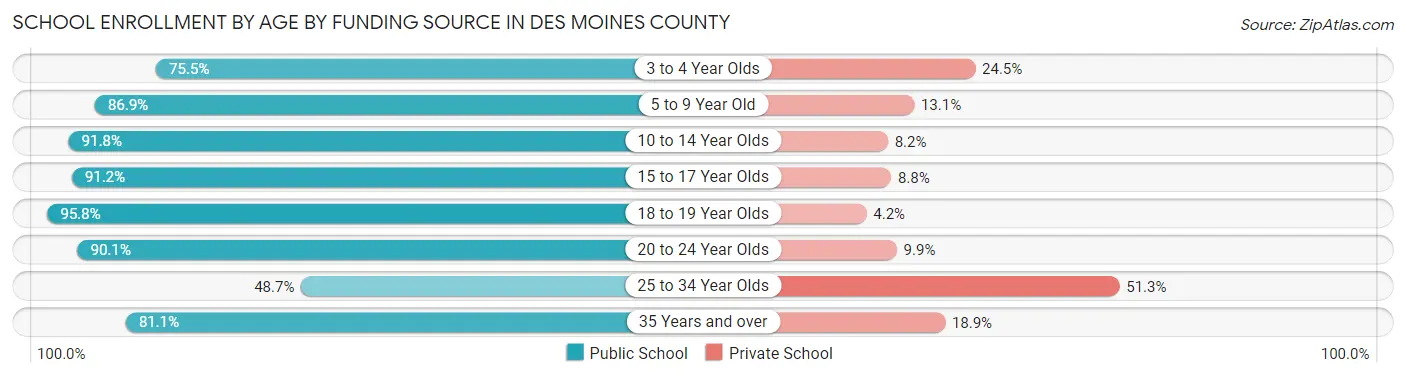
| Age Bracket | Public School | Private School |
| 3 to 4 Year Olds | 327 (75.5%) | 106 (24.5%) |
| 5 to 9 Year Old | 2,017 (86.9%) | 304 (13.1%) |
| 10 to 14 Year Olds | 2,106 (91.8%) | 188 (8.2%) |
| 15 to 17 Year Olds | 1,398 (91.2%) | 135 (8.8%) |
| 18 to 19 Year Olds | 521 (95.8%) | 23 (4.2%) |
| 20 to 24 Year Olds | 402 (90.1%) | 44 (9.9%) |
| 25 to 34 Year Olds | 109 (48.7%) | 115 (51.3%) |
| 35 Years and over | 370 (81.1%) | 86 (18.9%) |
| Total | 7,253 (87.9%) | 998 (12.1%) |
Educational Attainment by Field of Study in Des Moines County
Business (1,513 | 21.9%), education (1,406 | 20.4%), bio, nature & agricultural (758 | 11.0%), science & technology (588 | 8.5%), and engineering (542 | 7.9%) are the most common fields of study among 6,907 individuals in Des Moines County who have obtained a bachelor's degree or higher.
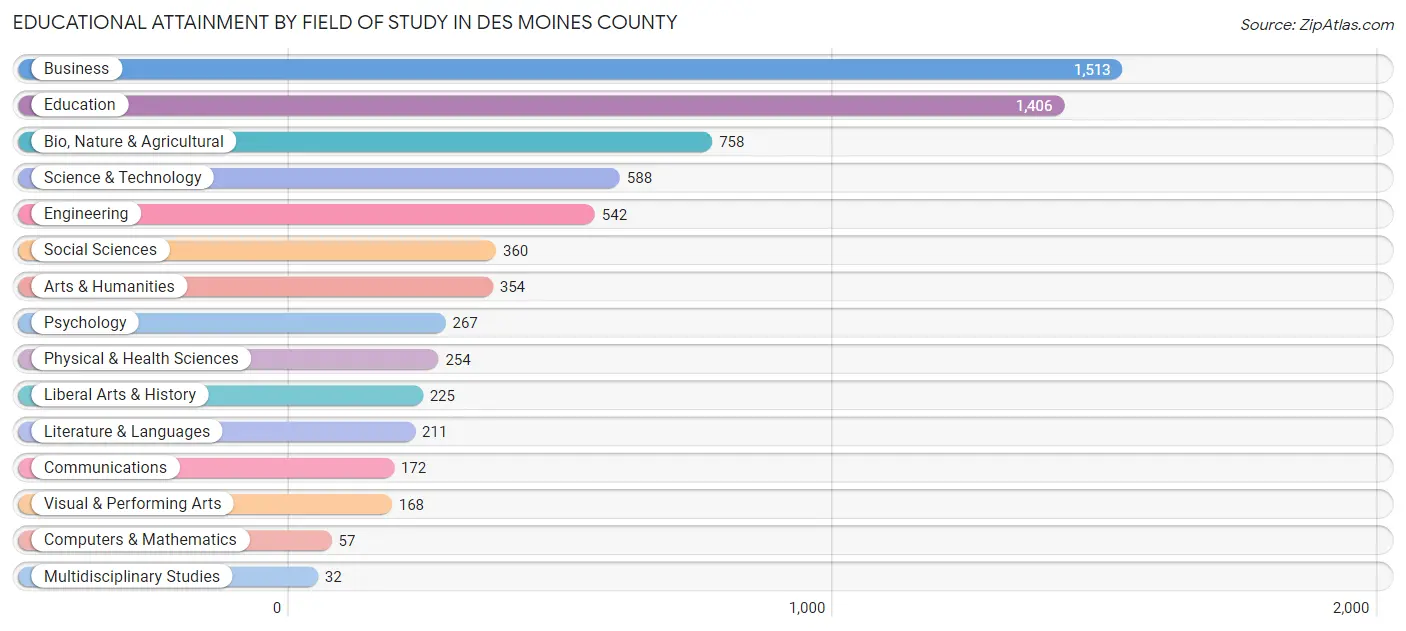
| Field of Study | # Graduates | % Graduates |
| Computers & Mathematics | 57 | 0.8% |
| Bio, Nature & Agricultural | 758 | 11.0% |
| Physical & Health Sciences | 254 | 3.7% |
| Psychology | 267 | 3.9% |
| Social Sciences | 360 | 5.2% |
| Engineering | 542 | 7.9% |
| Multidisciplinary Studies | 32 | 0.5% |
| Science & Technology | 588 | 8.5% |
| Business | 1,513 | 21.9% |
| Education | 1,406 | 20.4% |
| Literature & Languages | 211 | 3.0% |
| Liberal Arts & History | 225 | 3.3% |
| Visual & Performing Arts | 168 | 2.4% |
| Communications | 172 | 2.5% |
| Arts & Humanities | 354 | 5.1% |
| Total | 6,907 | 100.0% |
Transportation & Commute in Des Moines County
Vehicle Availability by Sex in Des Moines County
The most prevalent vehicle ownership categories in Des Moines County are males with 2 vehicles (3,585, accounting for 37.8%) and females with 2 vehicles (3,152, making up 41.2%).
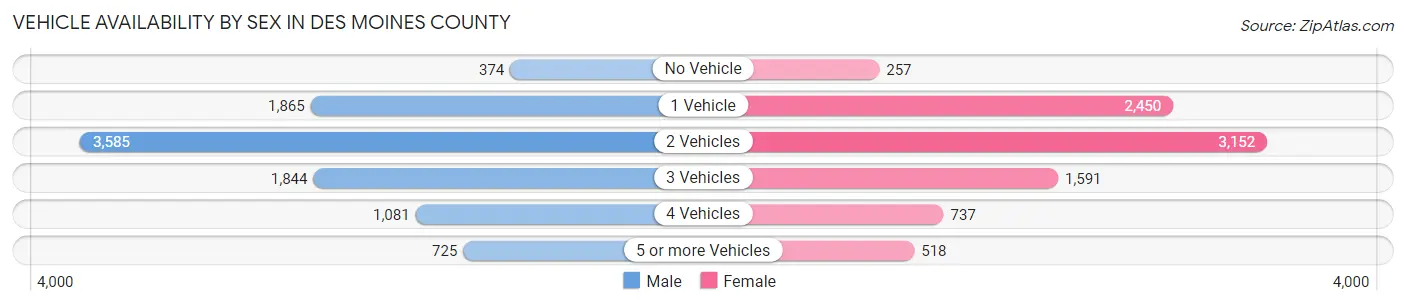
| Vehicles Available | Male | Female |
| No Vehicle | 374 (4.0%) | 257 (2.9%) |
| 1 Vehicle | 1,865 (19.7%) | 2,450 (28.1%) |
| 2 Vehicles | 3,585 (37.8%) | 3,152 (36.2%) |
| 3 Vehicles | 1,844 (19.5%) | 1,591 (18.3%) |
| 4 Vehicles | 1,081 (11.4%) | 737 (8.5%) |
| 5 or more Vehicles | 725 (7.6%) | 518 (5.9%) |
| Total | 9,474 (100.0%) | 8,705 (100.0%) |
Commute Time in Des Moines County
The most frequently occuring commute durations in Des Moines County are 10 to 14 minutes (4,719 commuters, 27.0%), 5 to 9 minutes (3,808 commuters, 21.8%), and 15 to 19 minutes (3,197 commuters, 18.3%).
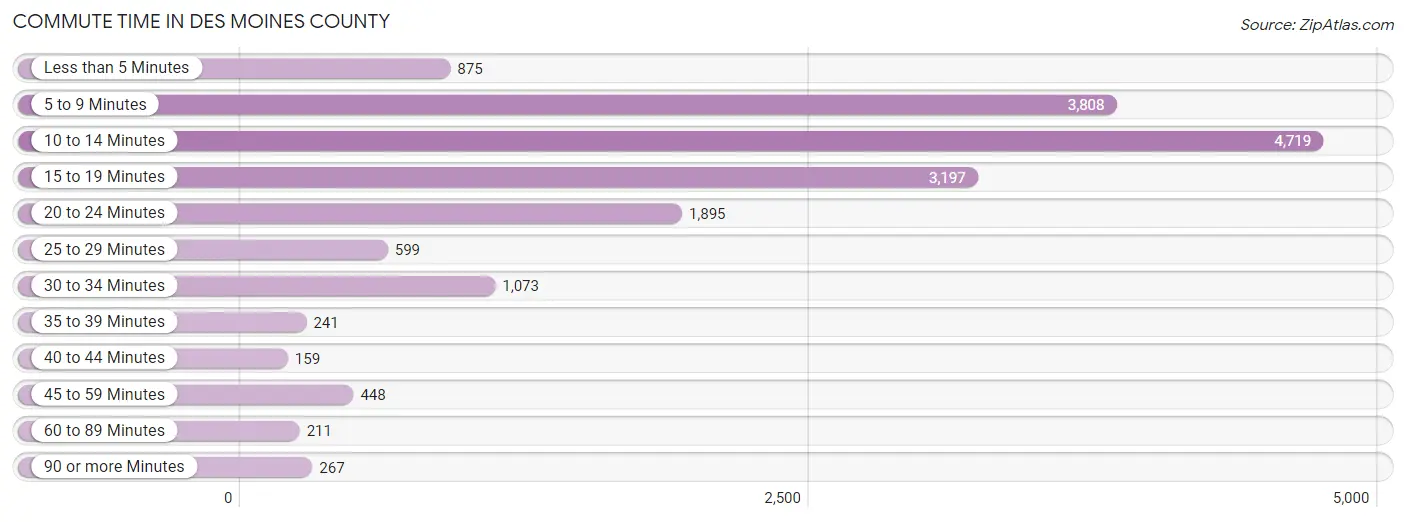
| Commute Time | # Commuters | % Commuters |
| Less than 5 Minutes | 875 | 5.0% |
| 5 to 9 Minutes | 3,808 | 21.8% |
| 10 to 14 Minutes | 4,719 | 27.0% |
| 15 to 19 Minutes | 3,197 | 18.3% |
| 20 to 24 Minutes | 1,895 | 10.8% |
| 25 to 29 Minutes | 599 | 3.4% |
| 30 to 34 Minutes | 1,073 | 6.1% |
| 35 to 39 Minutes | 241 | 1.4% |
| 40 to 44 Minutes | 159 | 0.9% |
| 45 to 59 Minutes | 448 | 2.6% |
| 60 to 89 Minutes | 211 | 1.2% |
| 90 or more Minutes | 267 | 1.5% |
Commute Time by Sex in Des Moines County
The most common commute times in Des Moines County are 10 to 14 minutes (2,214 commuters, 24.2%) for males and 10 to 14 minutes (2,505 commuters, 30.0%) for females.
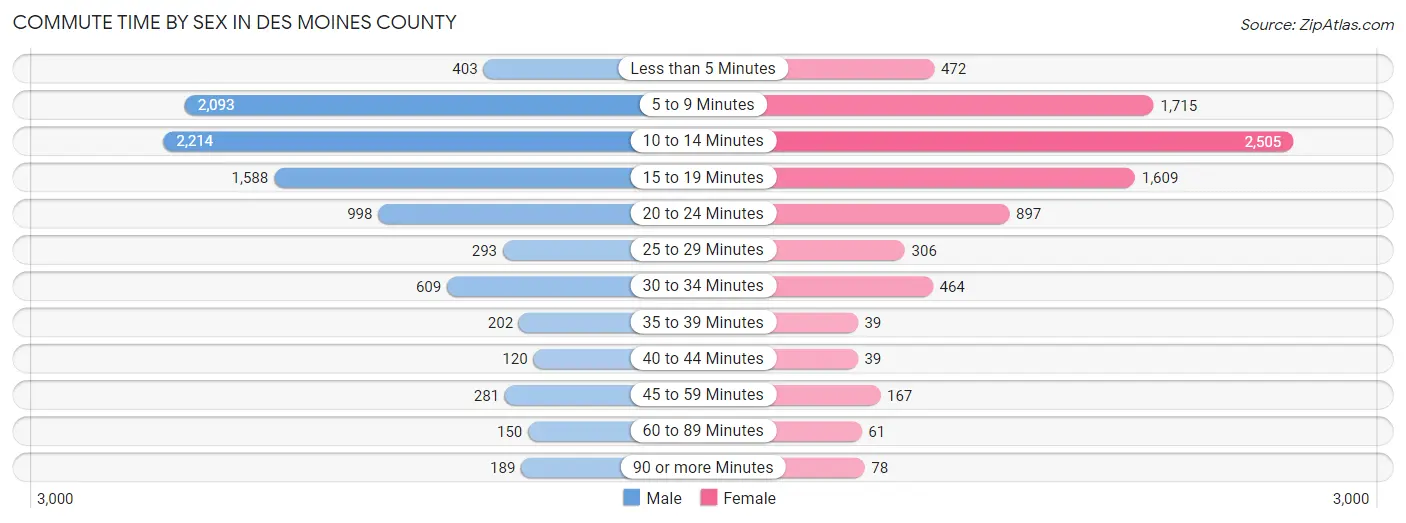
| Commute Time | Male | Female |
| Less than 5 Minutes | 403 (4.4%) | 472 (5.7%) |
| 5 to 9 Minutes | 2,093 (22.9%) | 1,715 (20.5%) |
| 10 to 14 Minutes | 2,214 (24.2%) | 2,505 (30.0%) |
| 15 to 19 Minutes | 1,588 (17.4%) | 1,609 (19.3%) |
| 20 to 24 Minutes | 998 (10.9%) | 897 (10.7%) |
| 25 to 29 Minutes | 293 (3.2%) | 306 (3.7%) |
| 30 to 34 Minutes | 609 (6.7%) | 464 (5.6%) |
| 35 to 39 Minutes | 202 (2.2%) | 39 (0.5%) |
| 40 to 44 Minutes | 120 (1.3%) | 39 (0.5%) |
| 45 to 59 Minutes | 281 (3.1%) | 167 (2.0%) |
| 60 to 89 Minutes | 150 (1.6%) | 61 (0.7%) |
| 90 or more Minutes | 189 (2.1%) | 78 (0.9%) |
Time of Departure to Work by Sex in Des Moines County
The most frequent times of departure to work in Des Moines County are 7:00 AM to 7:29 AM (1,334, 14.6%) for males and 7:30 AM to 7:59 AM (1,437, 17.2%) for females.
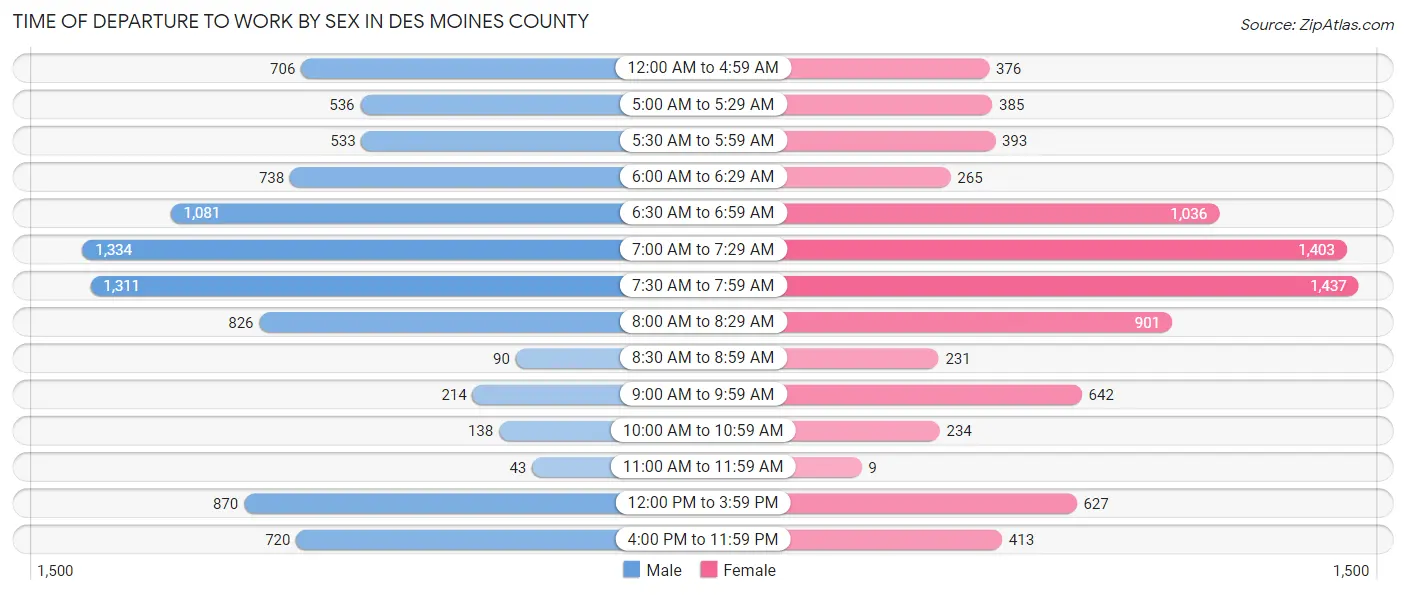
| Time of Departure | Male | Female |
| 12:00 AM to 4:59 AM | 706 (7.7%) | 376 (4.5%) |
| 5:00 AM to 5:29 AM | 536 (5.9%) | 385 (4.6%) |
| 5:30 AM to 5:59 AM | 533 (5.8%) | 393 (4.7%) |
| 6:00 AM to 6:29 AM | 738 (8.1%) | 265 (3.2%) |
| 6:30 AM to 6:59 AM | 1,081 (11.8%) | 1,036 (12.4%) |
| 7:00 AM to 7:29 AM | 1,334 (14.6%) | 1,403 (16.8%) |
| 7:30 AM to 7:59 AM | 1,311 (14.3%) | 1,437 (17.2%) |
| 8:00 AM to 8:29 AM | 826 (9.0%) | 901 (10.8%) |
| 8:30 AM to 8:59 AM | 90 (1.0%) | 231 (2.8%) |
| 9:00 AM to 9:59 AM | 214 (2.3%) | 642 (7.7%) |
| 10:00 AM to 10:59 AM | 138 (1.5%) | 234 (2.8%) |
| 11:00 AM to 11:59 AM | 43 (0.5%) | 9 (0.1%) |
| 12:00 PM to 3:59 PM | 870 (9.5%) | 627 (7.5%) |
| 4:00 PM to 11:59 PM | 720 (7.9%) | 413 (4.9%) |
| Total | 9,140 (100.0%) | 8,352 (100.0%) |
Housing Occupancy in Des Moines County
Occupancy by Ownership in Des Moines County
Of the total 17,251 dwellings in Des Moines County, owner-occupied units account for 12,067 (70.0%), while renter-occupied units make up 5,184 (30.0%).
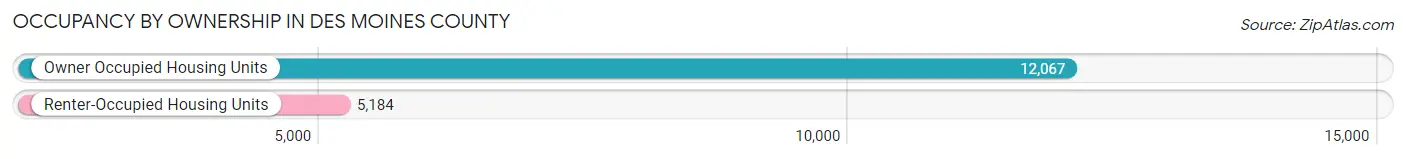
| Occupancy | # Housing Units | % Housing Units |
| Owner Occupied Housing Units | 12,067 | 70.0% |
| Renter-Occupied Housing Units | 5,184 | 30.0% |
| Total Occupied Housing Units | 17,251 | 100.0% |
Occupancy by Household Size in Des Moines County
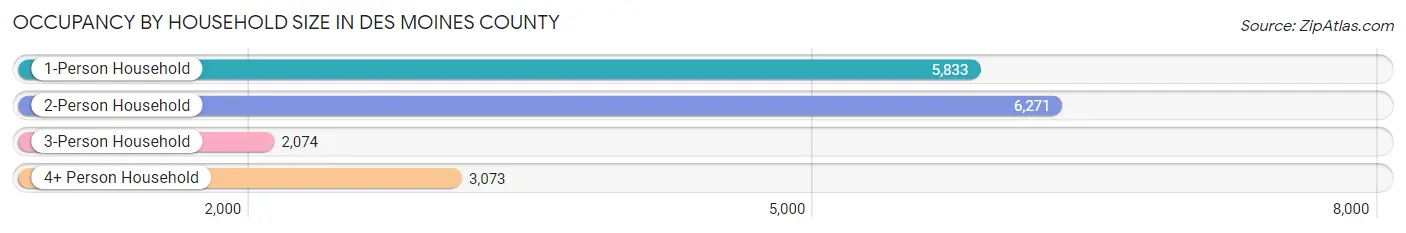
| Household Size | # Housing Units | % Housing Units |
| 1-Person Household | 5,833 | 33.8% |
| 2-Person Household | 6,271 | 36.3% |
| 3-Person Household | 2,074 | 12.0% |
| 4+ Person Household | 3,073 | 17.8% |
| Total Housing Units | 17,251 | 100.0% |
Occupancy by Ownership by Household Size in Des Moines County
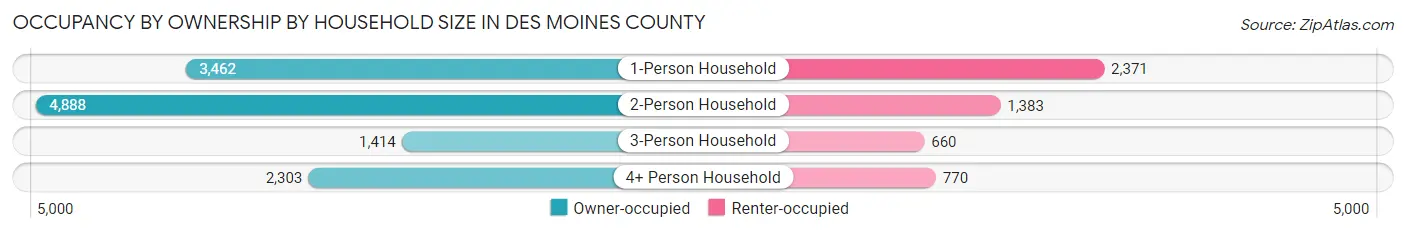
| Household Size | Owner-occupied | Renter-occupied |
| 1-Person Household | 3,462 (59.4%) | 2,371 (40.6%) |
| 2-Person Household | 4,888 (77.9%) | 1,383 (22.1%) |
| 3-Person Household | 1,414 (68.2%) | 660 (31.8%) |
| 4+ Person Household | 2,303 (74.9%) | 770 (25.1%) |
| Total Housing Units | 12,067 (70.0%) | 5,184 (30.0%) |
Occupancy by Educational Attainment in Des Moines County
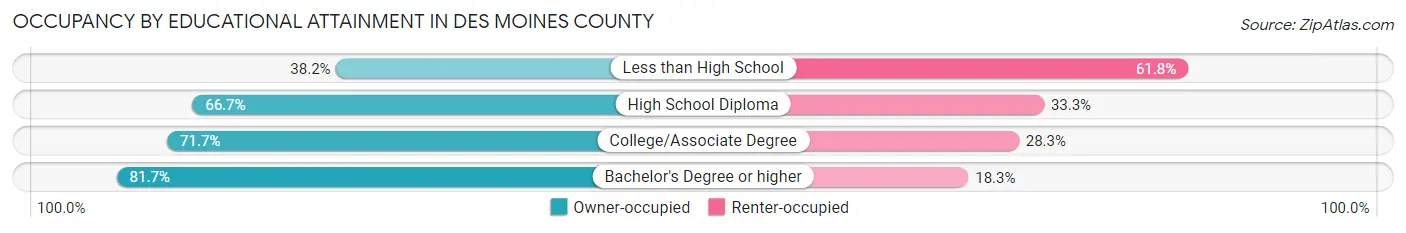
| Household Size | Owner-occupied | Renter-occupied |
| Less than High School | 475 (38.2%) | 769 (61.8%) |
| High School Diploma | 3,818 (66.7%) | 1,903 (33.3%) |
| College/Associate Degree | 4,541 (71.7%) | 1,790 (28.3%) |
| Bachelor's Degree or higher | 3,233 (81.7%) | 722 (18.3%) |
Occupancy by Age of Householder in Des Moines County
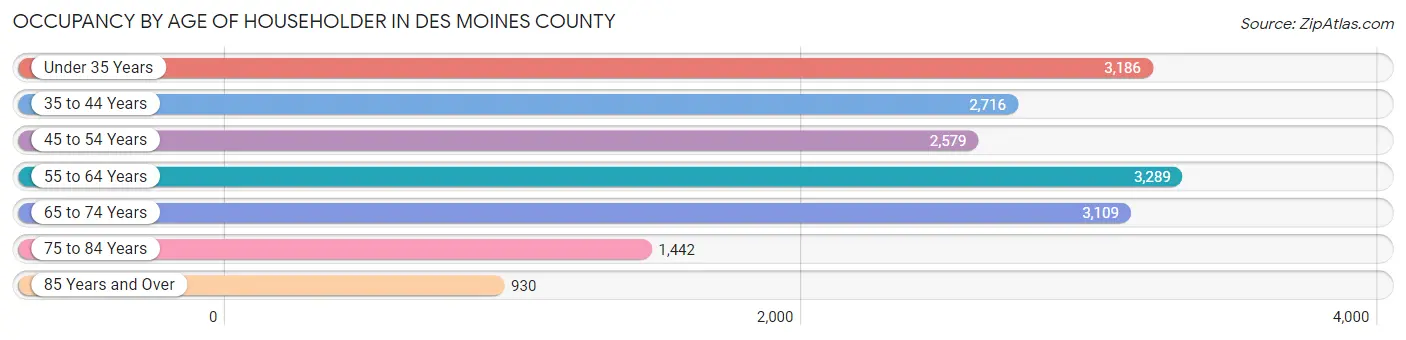
| Age Bracket | # Households | % Households |
| Under 35 Years | 3,186 | 18.5% |
| 35 to 44 Years | 2,716 | 15.7% |
| 45 to 54 Years | 2,579 | 14.9% |
| 55 to 64 Years | 3,289 | 19.1% |
| 65 to 74 Years | 3,109 | 18.0% |
| 75 to 84 Years | 1,442 | 8.4% |
| 85 Years and Over | 930 | 5.4% |
| Total | 17,251 | 100.0% |
Housing Finances in Des Moines County
Median Income by Occupancy in Des Moines County
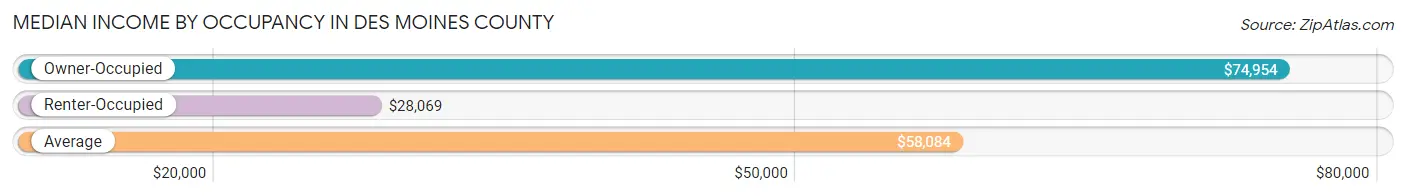
| Occupancy Type | # Households | Median Income |
| Owner-Occupied | 12,067 (70.0%) | $74,954 |
| Renter-Occupied | 5,184 (30.0%) | $28,069 |
| Average | 17,251 (100.0%) | $58,084 |
Occupancy by Householder Income Bracket in Des Moines County
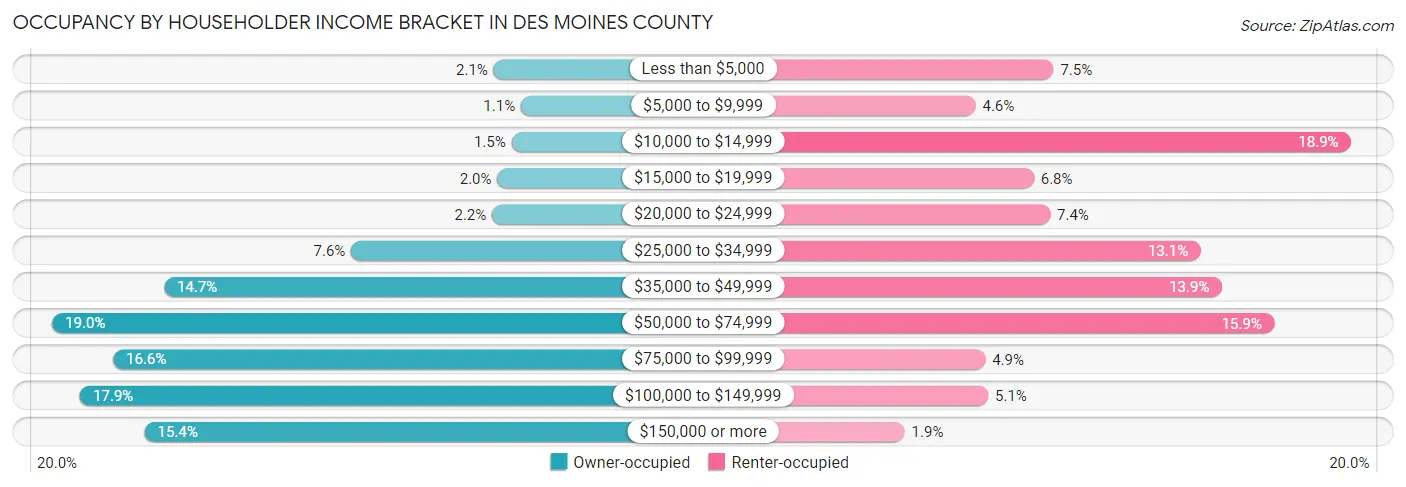
| Income Bracket | Owner-occupied | Renter-occupied |
| Less than $5,000 | 257 (2.1%) | 391 (7.5%) |
| $5,000 to $9,999 | 131 (1.1%) | 237 (4.6%) |
| $10,000 to $14,999 | 175 (1.5%) | 977 (18.9%) |
| $15,000 to $19,999 | 240 (2.0%) | 352 (6.8%) |
| $20,000 to $24,999 | 264 (2.2%) | 384 (7.4%) |
| $25,000 to $34,999 | 912 (7.6%) | 680 (13.1%) |
| $35,000 to $49,999 | 1,773 (14.7%) | 722 (13.9%) |
| $50,000 to $74,999 | 2,287 (19.0%) | 826 (15.9%) |
| $75,000 to $99,999 | 2,007 (16.6%) | 256 (4.9%) |
| $100,000 to $149,999 | 2,159 (17.9%) | 262 (5.1%) |
| $150,000 or more | 1,862 (15.4%) | 97 (1.9%) |
| Total | 12,067 (100.0%) | 5,184 (100.0%) |
Monthly Housing Cost Tiers in Des Moines County
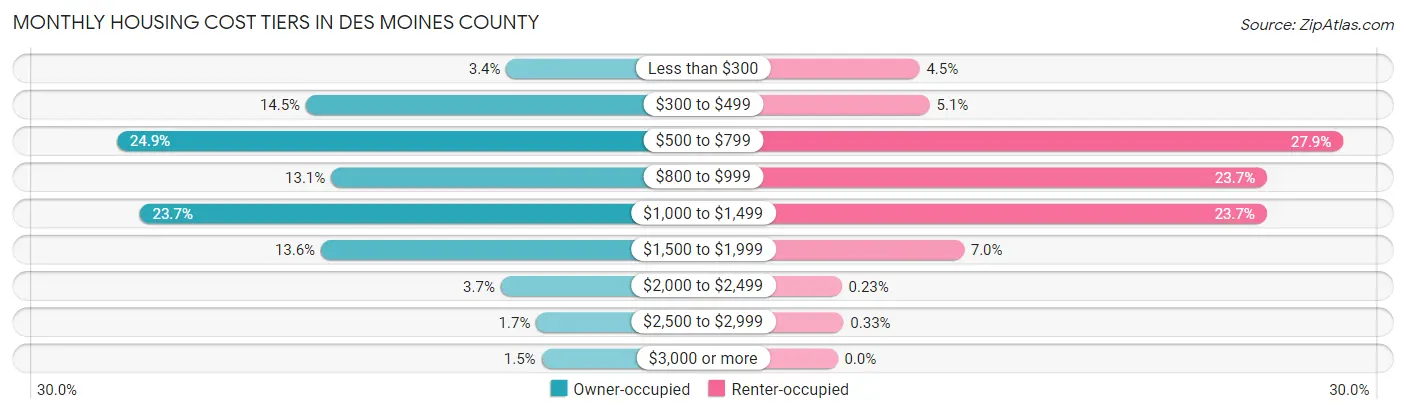
| Monthly Cost | Owner-occupied | Renter-occupied |
| Less than $300 | 409 (3.4%) | 235 (4.5%) |
| $300 to $499 | 1,745 (14.5%) | 264 (5.1%) |
| $500 to $799 | 3,005 (24.9%) | 1,448 (27.9%) |
| $800 to $999 | 1,577 (13.1%) | 1,230 (23.7%) |
| $1,000 to $1,499 | 2,854 (23.6%) | 1,229 (23.7%) |
| $1,500 to $1,999 | 1,645 (13.6%) | 362 (7.0%) |
| $2,000 to $2,499 | 447 (3.7%) | 12 (0.2%) |
| $2,500 to $2,999 | 210 (1.7%) | 17 (0.3%) |
| $3,000 or more | 175 (1.5%) | 0 (0.0%) |
| Total | 12,067 (100.0%) | 5,184 (100.0%) |
Physical Housing Characteristics in Des Moines County
Housing Structures in Des Moines County
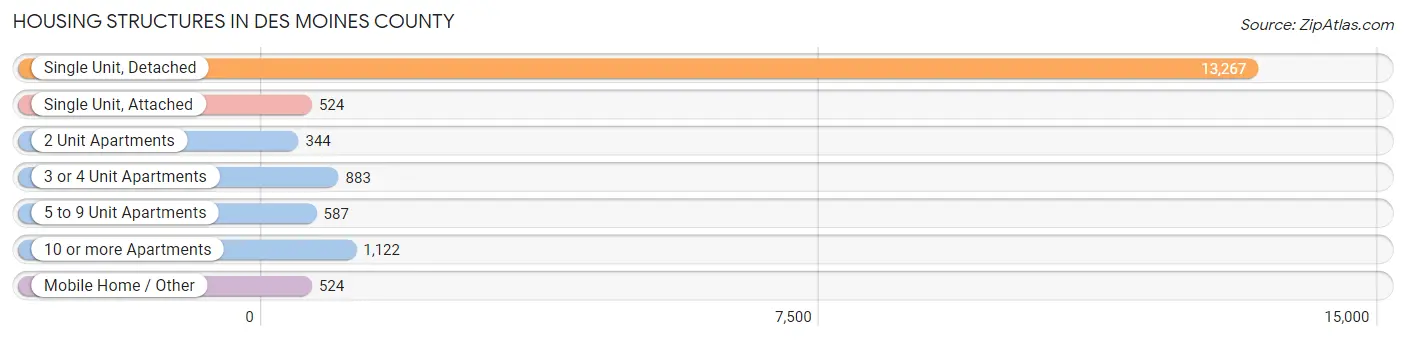
| Structure Type | # Housing Units | % Housing Units |
| Single Unit, Detached | 13,267 | 76.9% |
| Single Unit, Attached | 524 | 3.0% |
| 2 Unit Apartments | 344 | 2.0% |
| 3 or 4 Unit Apartments | 883 | 5.1% |
| 5 to 9 Unit Apartments | 587 | 3.4% |
| 10 or more Apartments | 1,122 | 6.5% |
| Mobile Home / Other | 524 | 3.0% |
| Total | 17,251 | 100.0% |
Housing Structures by Occupancy in Des Moines County
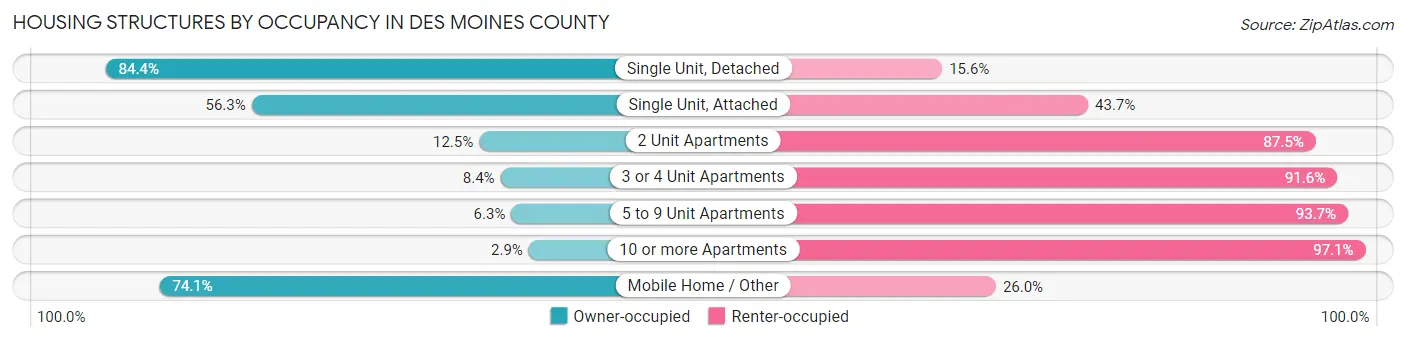
| Structure Type | Owner-occupied | Renter-occupied |
| Single Unit, Detached | 11,197 (84.4%) | 2,070 (15.6%) |
| Single Unit, Attached | 295 (56.3%) | 229 (43.7%) |
| 2 Unit Apartments | 43 (12.5%) | 301 (87.5%) |
| 3 or 4 Unit Apartments | 74 (8.4%) | 809 (91.6%) |
| 5 to 9 Unit Apartments | 37 (6.3%) | 550 (93.7%) |
| 10 or more Apartments | 33 (2.9%) | 1,089 (97.1%) |
| Mobile Home / Other | 388 (74.1%) | 136 (26.0%) |
| Total | 12,067 (70.0%) | 5,184 (30.0%) |
Housing Structures by Number of Rooms in Des Moines County
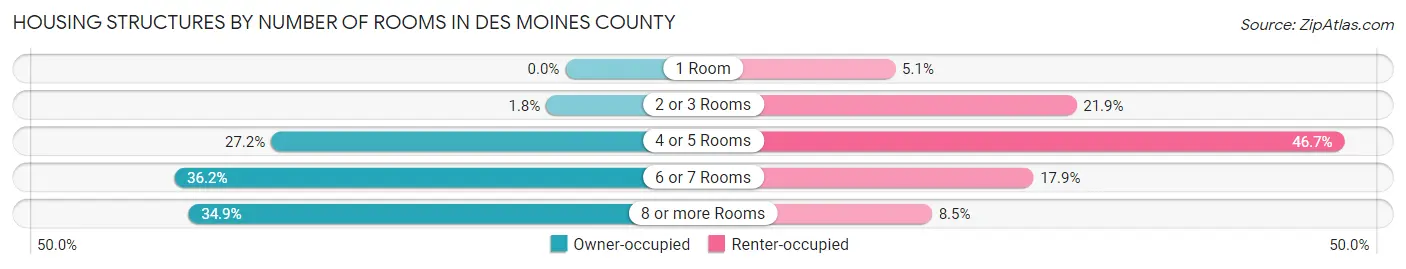
| Number of Rooms | Owner-occupied | Renter-occupied |
| 1 Room | 0 (0.0%) | 265 (5.1%) |
| 2 or 3 Rooms | 213 (1.8%) | 1,133 (21.9%) |
| 4 or 5 Rooms | 3,283 (27.2%) | 2,419 (46.7%) |
| 6 or 7 Rooms | 4,365 (36.2%) | 927 (17.9%) |
| 8 or more Rooms | 4,206 (34.9%) | 440 (8.5%) |
| Total | 12,067 (100.0%) | 5,184 (100.0%) |
Housing Structure by Heating Type in Des Moines County
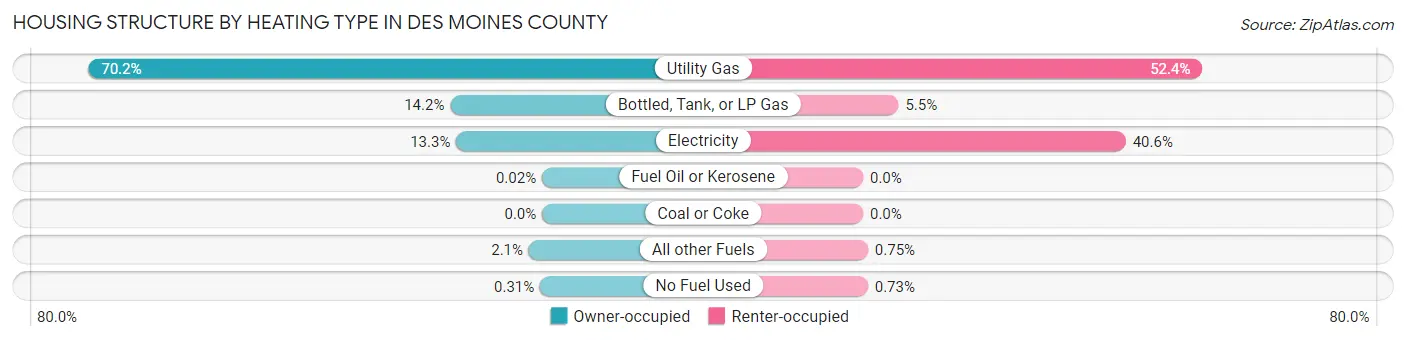
| Heating Type | Owner-occupied | Renter-occupied |
| Utility Gas | 8,465 (70.2%) | 2,718 (52.4%) |
| Bottled, Tank, or LP Gas | 1,713 (14.2%) | 284 (5.5%) |
| Electricity | 1,601 (13.3%) | 2,105 (40.6%) |
| Fuel Oil or Kerosene | 3 (0.0%) | 0 (0.0%) |
| Coal or Coke | 0 (0.0%) | 0 (0.0%) |
| All other Fuels | 247 (2.1%) | 39 (0.7%) |
| No Fuel Used | 38 (0.3%) | 38 (0.7%) |
| Total | 12,067 (100.0%) | 5,184 (100.0%) |
Household Vehicle Usage in Des Moines County
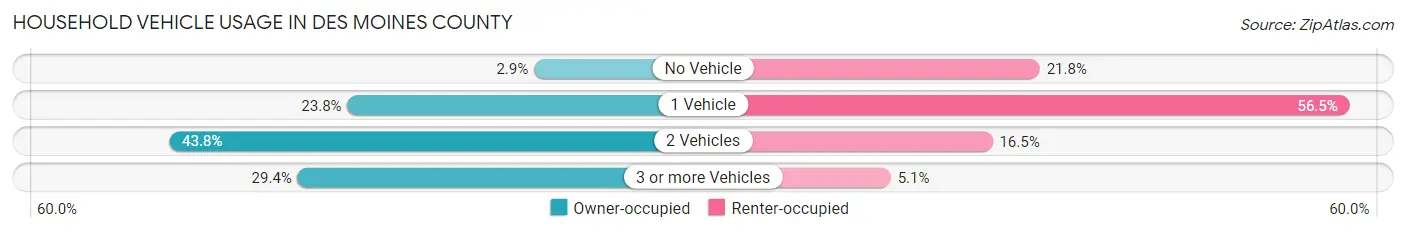
| Vehicles per Household | Owner-occupied | Renter-occupied |
| No Vehicle | 354 (2.9%) | 1,131 (21.8%) |
| 1 Vehicle | 2,877 (23.8%) | 2,930 (56.5%) |
| 2 Vehicles | 5,287 (43.8%) | 857 (16.5%) |
| 3 or more Vehicles | 3,549 (29.4%) | 266 (5.1%) |
| Total | 12,067 (100.0%) | 5,184 (100.0%) |
Real Estate & Mortgages in Des Moines County
Real Estate and Mortgage Overview in Des Moines County
| Characteristic | Without Mortgage | With Mortgage |
| Housing Units | 5,416 | 6,651 |
| Median Property Value | $119,300 | $146,900 |
| Median Household Income | $53,591 | $1,204 |
| Monthly Housing Costs | $561 | $155 |
| Real Estate Taxes | $1,877 | $135 |
Property Value by Mortgage Status in Des Moines County
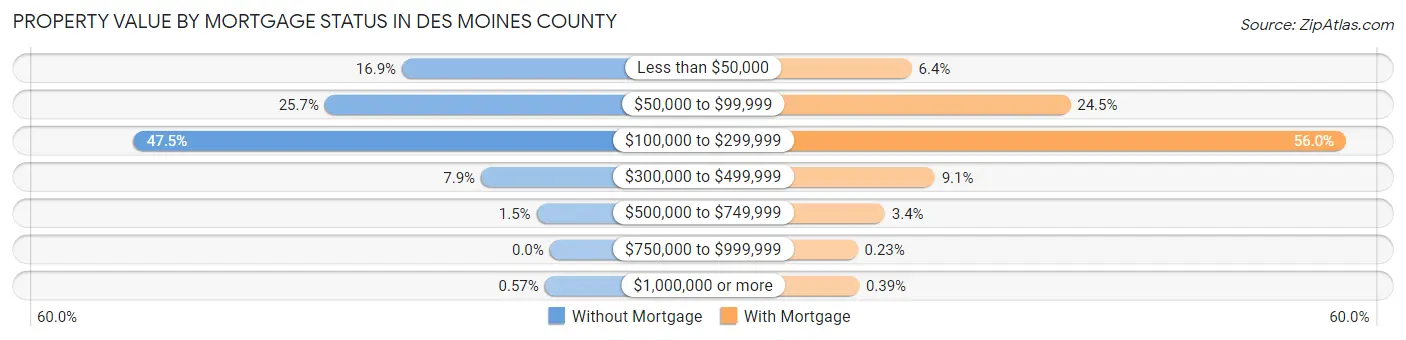
| Property Value | Without Mortgage | With Mortgage |
| Less than $50,000 | 914 (16.9%) | 426 (6.4%) |
| $50,000 to $99,999 | 1,392 (25.7%) | 1,632 (24.5%) |
| $100,000 to $299,999 | 2,573 (47.5%) | 3,727 (56.0%) |
| $300,000 to $499,999 | 425 (7.9%) | 602 (9.0%) |
| $500,000 to $749,999 | 81 (1.5%) | 223 (3.4%) |
| $750,000 to $999,999 | 0 (0.0%) | 15 (0.2%) |
| $1,000,000 or more | 31 (0.6%) | 26 (0.4%) |
| Total | 5,416 (100.0%) | 6,651 (100.0%) |
Household Income by Mortgage Status in Des Moines County
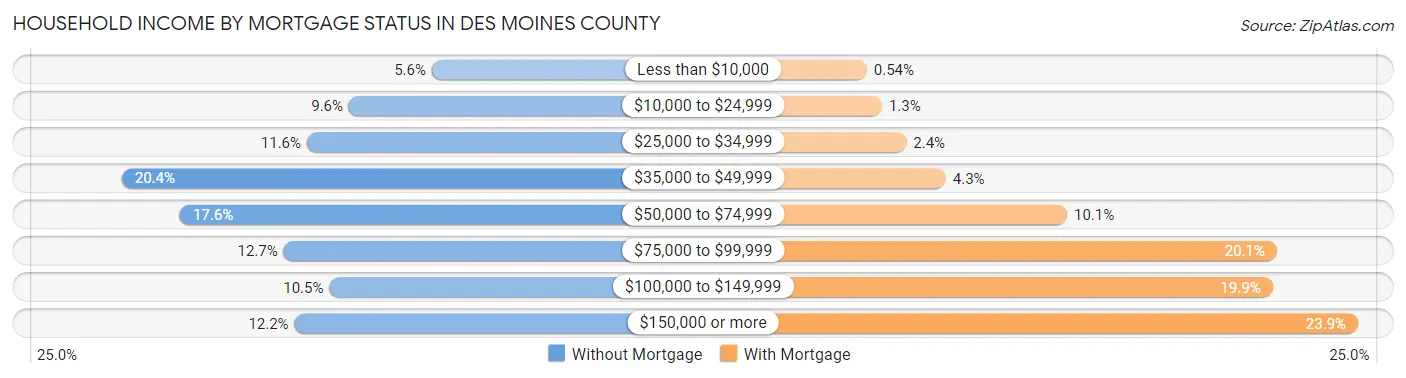
| Household Income | Without Mortgage | With Mortgage |
| Less than $10,000 | 304 (5.6%) | 36 (0.5%) |
| $10,000 to $24,999 | 518 (9.6%) | 84 (1.3%) |
| $25,000 to $34,999 | 626 (11.6%) | 161 (2.4%) |
| $35,000 to $49,999 | 1,103 (20.4%) | 286 (4.3%) |
| $50,000 to $74,999 | 953 (17.6%) | 670 (10.1%) |
| $75,000 to $99,999 | 686 (12.7%) | 1,334 (20.1%) |
| $100,000 to $149,999 | 568 (10.5%) | 1,321 (19.9%) |
| $150,000 or more | 658 (12.1%) | 1,591 (23.9%) |
| Total | 5,416 (100.0%) | 6,651 (100.0%) |
Property Value to Household Income Ratio in Des Moines County
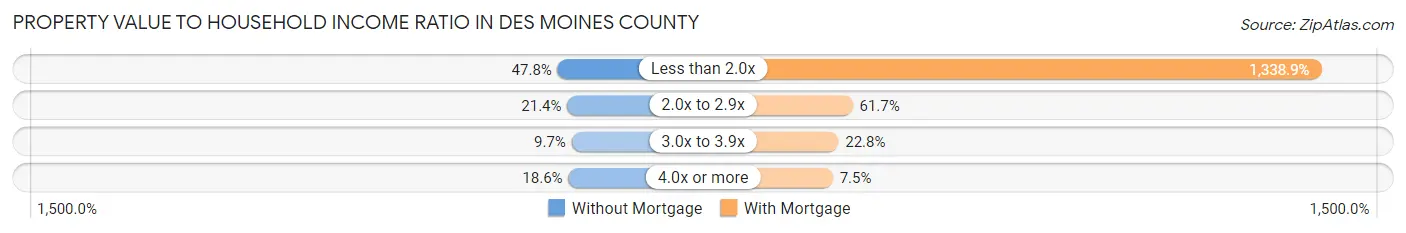
| Value-to-Income Ratio | Without Mortgage | With Mortgage |
| Less than 2.0x | 2,590 (47.8%) | 89,050 (1,338.9%) |
| 2.0x to 2.9x | 1,157 (21.4%) | 4,101 (61.7%) |
| 3.0x to 3.9x | 527 (9.7%) | 1,517 (22.8%) |
| 4.0x or more | 1,007 (18.6%) | 500 (7.5%) |
| Total | 5,416 (100.0%) | 6,651 (100.0%) |
Real Estate Taxes by Mortgage Status in Des Moines County
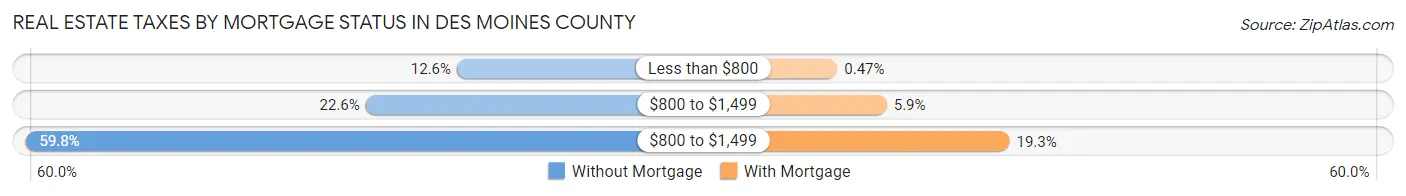
| Property Taxes | Without Mortgage | With Mortgage |
| Less than $800 | 684 (12.6%) | 31 (0.5%) |
| $800 to $1,499 | 1,226 (22.6%) | 392 (5.9%) |
| $800 to $1,499 | 3,239 (59.8%) | 1,286 (19.3%) |
| Total | 5,416 (100.0%) | 6,651 (100.0%) |
Health & Disability in Des Moines County
Health Insurance Coverage by Age in Des Moines County
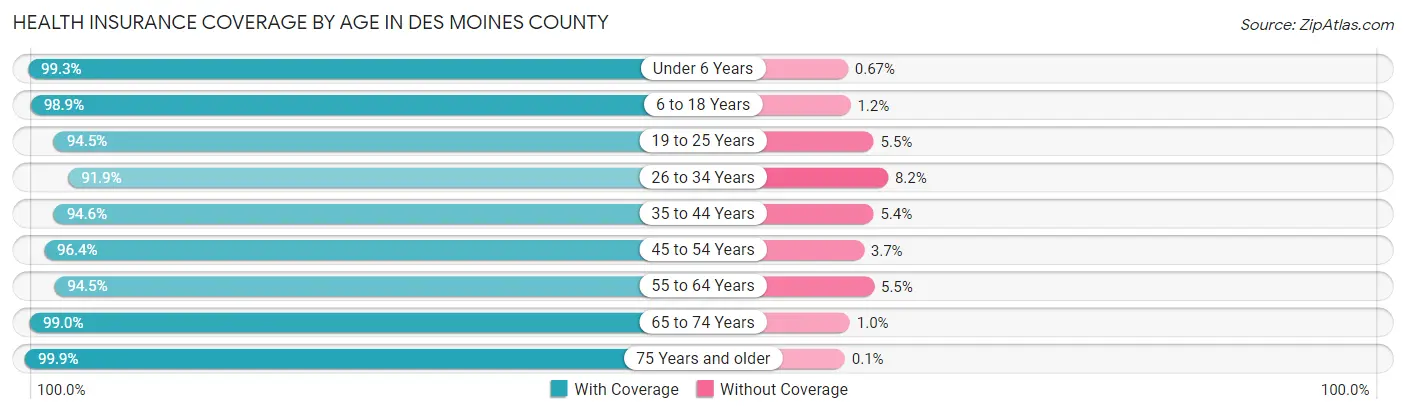
| Age Bracket | With Coverage | Without Coverage |
| Under 6 Years | 2,977 (99.3%) | 20 (0.7%) |
| 6 to 18 Years | 6,117 (98.9%) | 71 (1.1%) |
| 19 to 25 Years | 2,679 (94.5%) | 155 (5.5%) |
| 26 to 34 Years | 3,684 (91.8%) | 327 (8.2%) |
| 35 to 44 Years | 4,366 (94.6%) | 251 (5.4%) |
| 45 to 54 Years | 4,353 (96.4%) | 165 (3.6%) |
| 55 to 64 Years | 5,133 (94.5%) | 301 (5.5%) |
| 65 to 74 Years | 4,617 (99.0%) | 48 (1.0%) |
| 75 Years and older | 3,090 (99.9%) | 3 (0.1%) |
| Total | 37,016 (96.5%) | 1,341 (3.5%) |
Health Insurance Coverage by Citizenship Status in Des Moines County
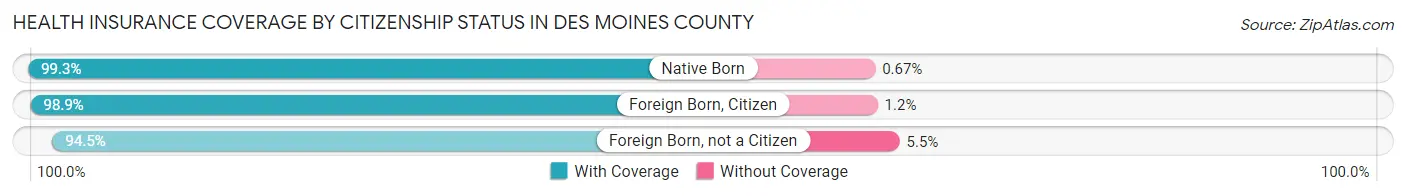
| Citizenship Status | With Coverage | Without Coverage |
| Native Born | 2,977 (99.3%) | 20 (0.7%) |
| Foreign Born, Citizen | 6,117 (98.9%) | 71 (1.1%) |
| Foreign Born, not a Citizen | 2,679 (94.5%) | 155 (5.5%) |
Health Insurance Coverage by Household Income in Des Moines County
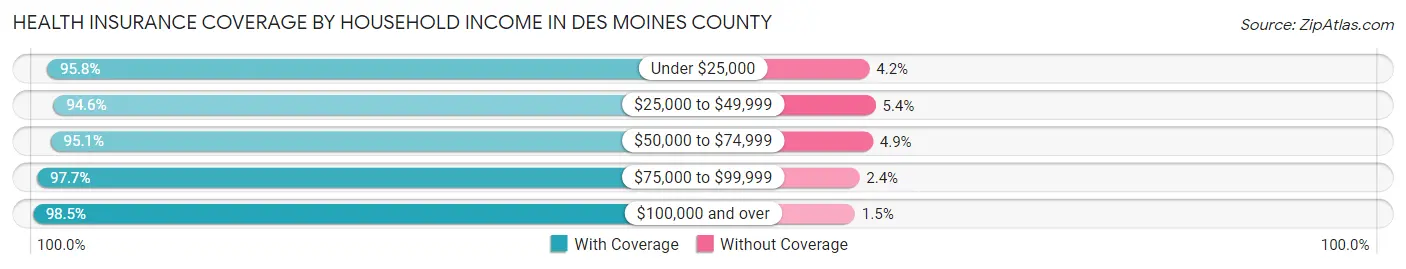
| Household Income | With Coverage | Without Coverage |
| Under $25,000 | 5,263 (95.8%) | 232 (4.2%) |
| $25,000 to $49,999 | 6,683 (94.6%) | 381 (5.4%) |
| $50,000 to $74,999 | 6,660 (95.1%) | 342 (4.9%) |
| $75,000 to $99,999 | 6,274 (97.7%) | 151 (2.4%) |
| $100,000 and over | 11,958 (98.5%) | 185 (1.5%) |
Public vs Private Health Insurance Coverage by Age in Des Moines County
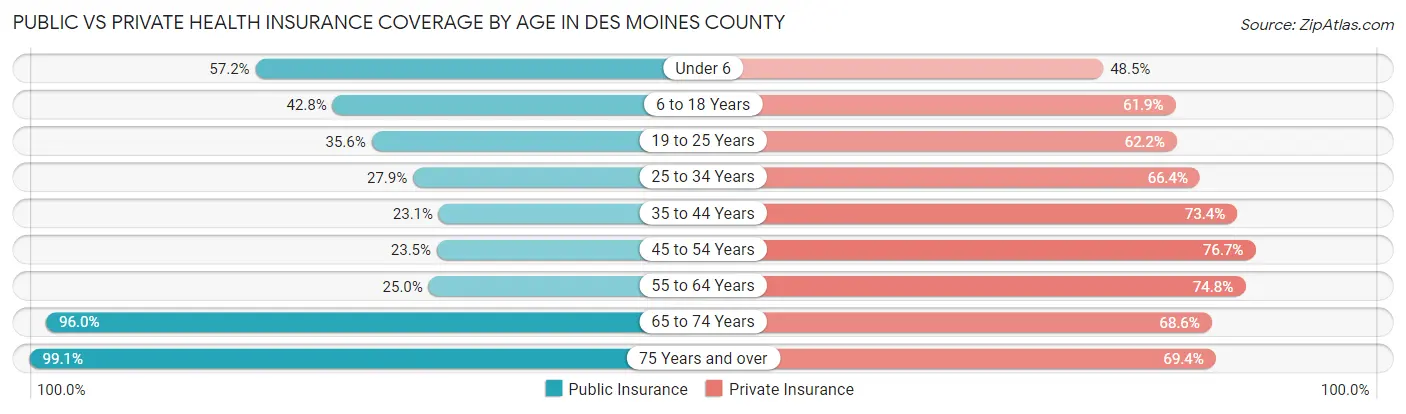
| Age Bracket | Public Insurance | Private Insurance |
| Under 6 | 1,713 (57.2%) | 1,454 (48.5%) |
| 6 to 18 Years | 2,651 (42.8%) | 3,830 (61.9%) |
| 19 to 25 Years | 1,009 (35.6%) | 1,762 (62.2%) |
| 25 to 34 Years | 1,119 (27.9%) | 2,665 (66.4%) |
| 35 to 44 Years | 1,067 (23.1%) | 3,387 (73.4%) |
| 45 to 54 Years | 1,061 (23.5%) | 3,466 (76.7%) |
| 55 to 64 Years | 1,359 (25.0%) | 4,066 (74.8%) |
| 65 to 74 Years | 4,478 (96.0%) | 3,202 (68.6%) |
| 75 Years and over | 3,064 (99.1%) | 2,146 (69.4%) |
| Total | 17,521 (45.7%) | 25,978 (67.7%) |
Disability Status by Sex by Age in Des Moines County
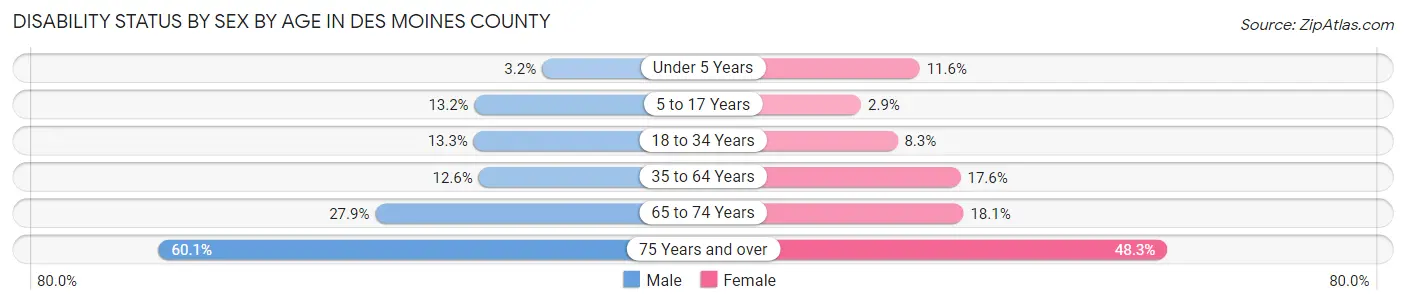
| Age Bracket | Male | Female |
| Under 5 Years | 37 (3.2%) | 130 (11.6%) |
| 5 to 17 Years | 430 (13.2%) | 91 (2.9%) |
| 18 to 34 Years | 489 (13.3%) | 300 (8.3%) |
| 35 to 64 Years | 896 (12.6%) | 1,314 (17.6%) |
| 65 to 74 Years | 657 (27.9%) | 418 (18.1%) |
| 75 Years and over | 774 (60.1%) | 872 (48.3%) |
Disability Class by Sex by Age in Des Moines County
Disability Class: Hearing Difficulty
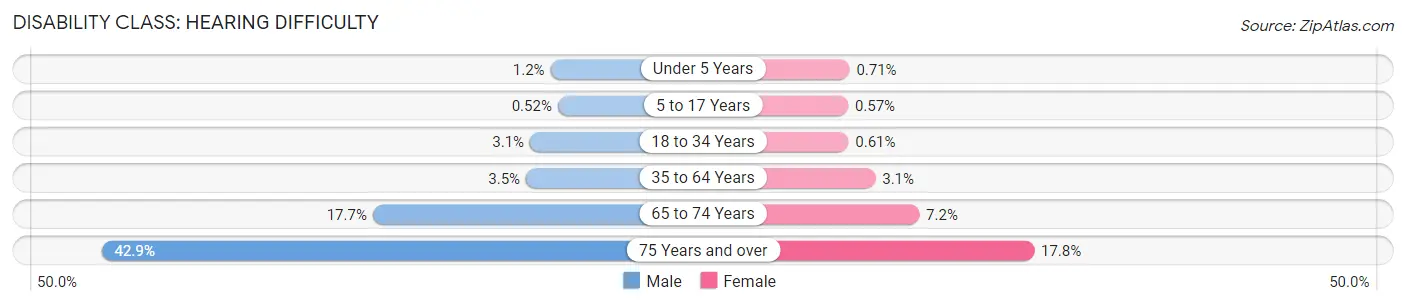
| Age Bracket | Male | Female |
| Under 5 Years | 14 (1.2%) | 8 (0.7%) |
| 5 to 17 Years | 17 (0.5%) | 18 (0.6%) |
| 18 to 34 Years | 114 (3.1%) | 22 (0.6%) |
| 35 to 64 Years | 247 (3.5%) | 232 (3.1%) |
| 65 to 74 Years | 416 (17.7%) | 166 (7.2%) |
| 75 Years and over | 552 (42.9%) | 322 (17.8%) |
Disability Class: Vision Difficulty
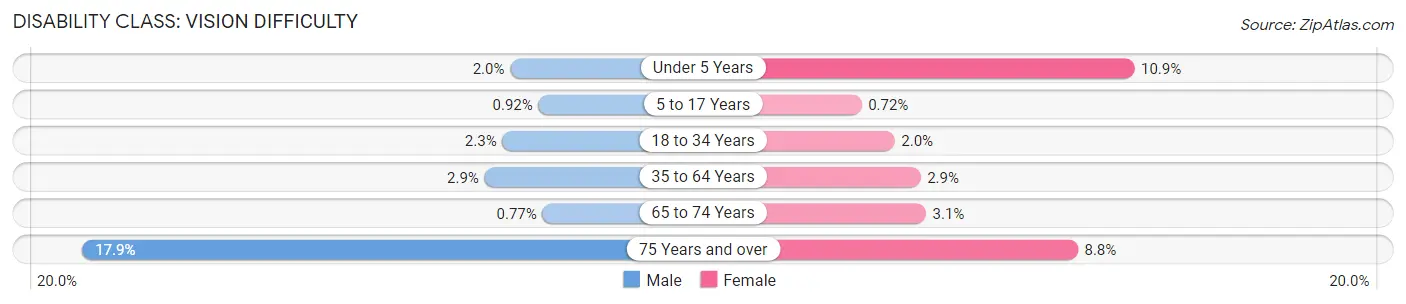
| Age Bracket | Male | Female |
| Under 5 Years | 23 (2.0%) | 122 (10.8%) |
| 5 to 17 Years | 30 (0.9%) | 23 (0.7%) |
| 18 to 34 Years | 83 (2.3%) | 71 (1.9%) |
| 35 to 64 Years | 208 (2.9%) | 217 (2.9%) |
| 65 to 74 Years | 18 (0.8%) | 72 (3.1%) |
| 75 Years and over | 230 (17.9%) | 158 (8.7%) |
Disability Class: Cognitive Difficulty
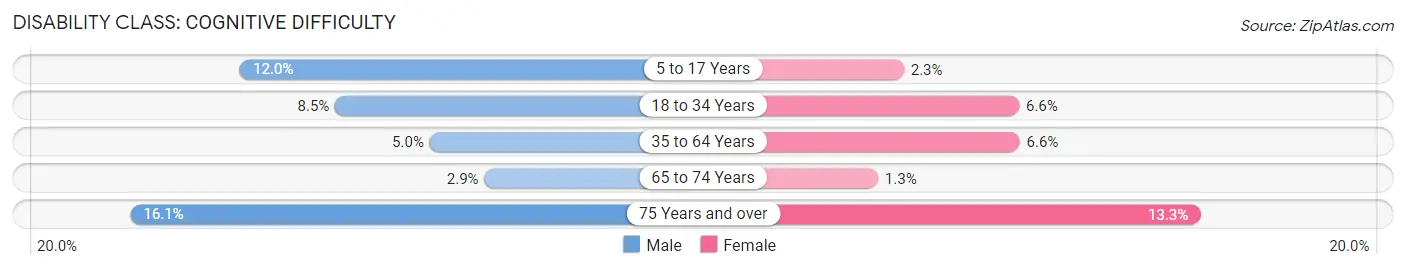
| Age Bracket | Male | Female |
| 5 to 17 Years | 391 (12.0%) | 73 (2.3%) |
| 18 to 34 Years | 311 (8.5%) | 239 (6.6%) |
| 35 to 64 Years | 353 (5.0%) | 492 (6.6%) |
| 65 to 74 Years | 69 (2.9%) | 31 (1.3%) |
| 75 Years and over | 207 (16.1%) | 240 (13.3%) |
Disability Class: Ambulatory Difficulty
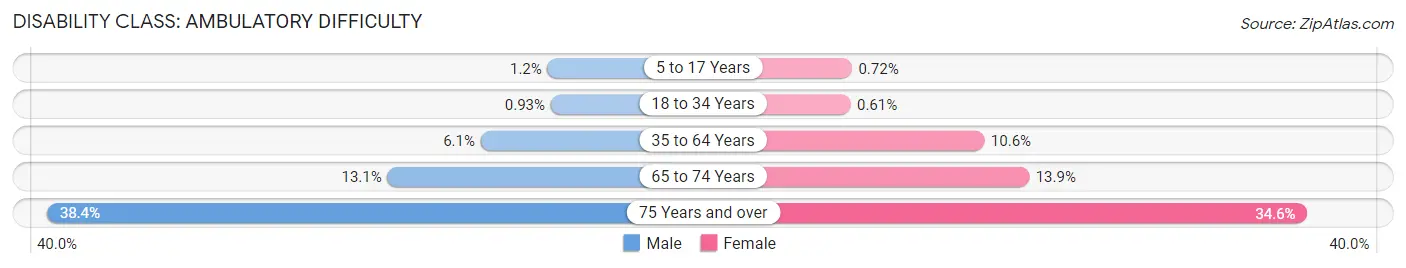
| Age Bracket | Male | Female |
| 5 to 17 Years | 38 (1.2%) | 23 (0.7%) |
| 18 to 34 Years | 34 (0.9%) | 22 (0.6%) |
| 35 to 64 Years | 436 (6.1%) | 786 (10.5%) |
| 65 to 74 Years | 307 (13.1%) | 321 (13.9%) |
| 75 Years and over | 494 (38.4%) | 624 (34.6%) |
Disability Class: Self-Care Difficulty
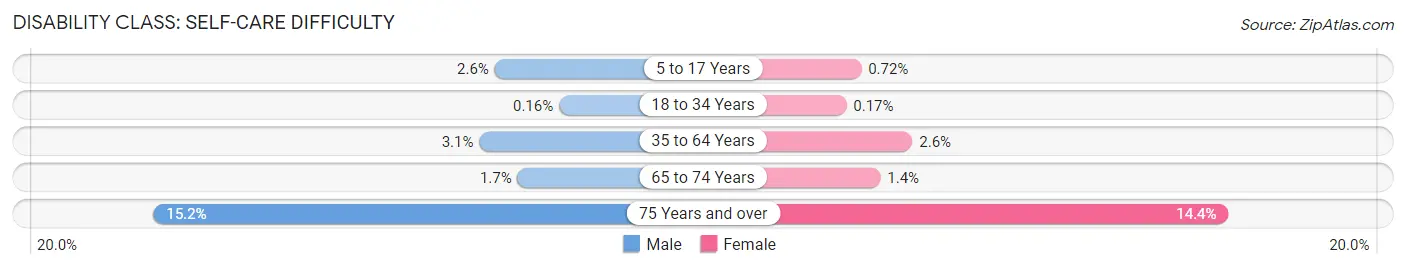
| Age Bracket | Male | Female |
| 5 to 17 Years | 83 (2.5%) | 23 (0.7%) |
| 18 to 34 Years | 6 (0.2%) | 6 (0.2%) |
| 35 to 64 Years | 222 (3.1%) | 195 (2.6%) |
| 65 to 74 Years | 40 (1.7%) | 33 (1.4%) |
| 75 Years and over | 196 (15.2%) | 259 (14.3%) |
Technology Access in Des Moines County
Computing Device Access in Des Moines County
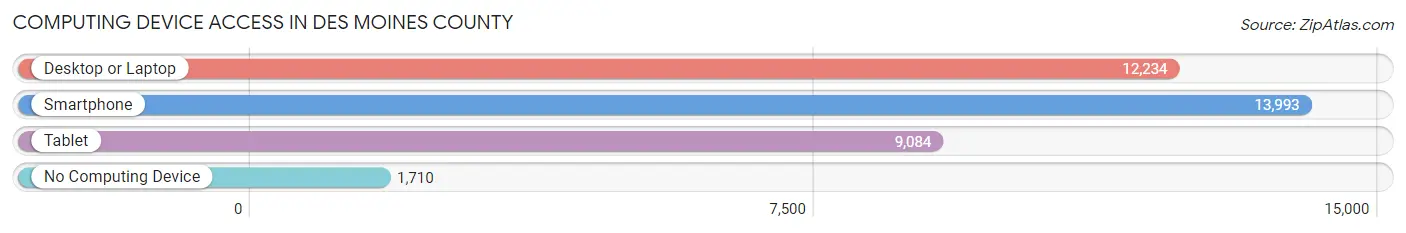
| Device Type | # Households | % Households |
| Desktop or Laptop | 12,234 | 70.9% |
| Smartphone | 13,993 | 81.1% |
| Tablet | 9,084 | 52.7% |
| No Computing Device | 1,710 | 9.9% |
| Total | 17,251 | 100.0% |
Internet Access in Des Moines County
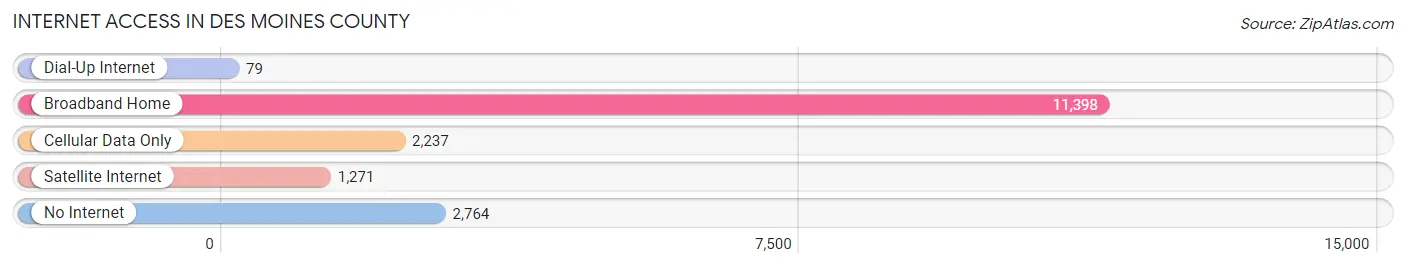
| Internet Type | # Households | % Households |
| Dial-Up Internet | 79 | 0.5% |
| Broadband Home | 11,398 | 66.1% |
| Cellular Data Only | 2,237 | 13.0% |
| Satellite Internet | 1,271 | 7.4% |
| No Internet | 2,764 | 16.0% |
| Total | 17,251 | 100.0% |
Des Moines County Summary
Des Moines County, Iowa is located in the southeastern corner of the state and is part of the Burlington-West Burlington Metropolitan Statistical Area. The county is bordered by Lee County to the north, Henry County to the east, Louisa County to the south, and Muscatine County to the west. Des Moines County has a total area of 468 square miles, of which 463 square miles is land and 5 square miles is water.
The county was established in 1834 and was named after the Des Moines River, which runs through the county. The county seat is Burlington, which is the largest city in the county. Other cities in the county include West Burlington, Mediapolis, Danville, Middletown, and Yarmouth.
The population of Des Moines County was 43,945 in the 2010 census, an increase of 4.3% from the 2000 census. The population is spread out with a median age of 38.7 years. The racial makeup of the county is 90.2% White, 4.3% African American, 0.5% Native American, 1.7% Asian, 0.1% Pacific Islander, 1.7% from other races, and 1.5% from two or more races. The population is also spread out with 25.2% under the age of 18, 8.7% from 18 to 24, 28.2% from 25 to 44, 24.2% from 45 to 64, and 13.7% who were 65 years of age or older.
The median income for a household in Des Moines County was $45,845 in the 2000 census, and the median income for a family was $54,845. The per capita income for the county was $21,845. About 6.2% of families and 8.7% of the population were below the poverty line, including 10.2% of those under age 18 and 6.2% of those age 65 or over.
The economy of Des Moines County is largely based on agriculture, manufacturing, and services. The county is home to several large employers, including the Burlington Northern Santa Fe Railroad, the Great River Medical Center, and the Burlington Community School District. The county also has a large number of small businesses, including retail stores, restaurants, and professional services.
The county is served by several major highways, including Interstate 80, U.S. Route 61, and U.S. Route 34. The Burlington Municipal Airport is located in the county, and the Burlington Amtrak station is located in the city of Burlington.
Des Moines County is home to several parks and recreational areas, including the Big Hollow Recreation Area, the Des Moines County Conservation Board, and the Des Moines County Historical Society. The county also has several museums, including the Des Moines County Heritage Center and the Burlington Steamboat Days Museum.
Des Moines County is a great place to live, work, and play. With its diverse economy, beautiful parks and recreational areas, and rich history, Des Moines County is a great place to call home.
Common Questions
What is Per Capita Income in Des Moines County?
Per Capita income in Des Moines County is $35,689.
What is the Median Family Income in Des Moines County?
Median Family Income in Des Moines County is $76,866.
What is the Median Household income in Des Moines County?
Median Household Income in Des Moines County is $58,084.
What is Income or Wage Gap in Des Moines County?
Income or Wage Gap in Des Moines County is 32.0%.
Women in Des Moines County earn 68.0 cents for every dollar earned by a man.
What is Family Income Deficit in Des Moines County?
Family Income Deficit in Des Moines County is $10,156.
Families that are below poverty line in Des Moines County earn $10,156 less on average than the poverty threshold level.
What is Inequality or Gini Index in Des Moines County?
Inequality or Gini Index in Des Moines County is 0.47.
What is the Total Population of Des Moines County?
Total Population of Des Moines County is 38,824.
What is the Total Male Population of Des Moines County?
Total Male Population of Des Moines County is 19,118.
What is the Total Female Population of Des Moines County?
Total Female Population of Des Moines County is 19,706.
What is the Ratio of Males per 100 Females in Des Moines County?
There are 97.02 Males per 100 Females in Des Moines County.
What is the Ratio of Females per 100 Males in Des Moines County?
There are 103.08 Females per 100 Males in Des Moines County.
What is the Median Population Age in Des Moines County?
Median Population Age in Des Moines County is 42.1 Years.
What is the Average Family Size in Des Moines County
Average Family Size in Des Moines County is 2.8 People.
What is the Average Household Size in Des Moines County
Average Household Size in Des Moines County is 2.2 People.
How Large is the Labor Force in Des Moines County?
There are 19,150 People in the Labor Forcein in Des Moines County.
What is the Percentage of People in the Labor Force in Des Moines County?
61.0% of People are in the Labor Force in Des Moines County.
What is the Unemployment Rate in Des Moines County?
Unemployment Rate in Des Moines County is 2.9%.