Indianola, IA Map & Demographics
Indianola Map
Indianola Overview
$34,577
PER CAPITA INCOME
$95,694
AVG FAMILY INCOME
$73,534
AVG HOUSEHOLD INCOME
42.6%
WAGE / INCOME GAP [ % ]
57.4¢/ $1
WAGE / INCOME GAP [ $ ]
$11,961
FAMILY INCOME DEFICIT
0.41
INEQUALITY / GINI INDEX
15,845
TOTAL POPULATION
7,617
MALE POPULATION
8,228
FEMALE POPULATION
92.57
MALES / 100 FEMALES
108.02
FEMALES / 100 MALES
34.7
MEDIAN AGE
3.0
AVG FAMILY SIZE
2.4
AVG HOUSEHOLD SIZE
8,136
LABOR FORCE [ PEOPLE ]
65.1%
PERCENT IN LABOR FORCE
3.9%
UNEMPLOYMENT RATE
Indianola Zip Codes
Indianola Area Codes
Income in Indianola
Income Overview in Indianola
Per Capita Income in Indianola is $34,577, while median incomes of families and households are $95,694 and $73,534 respectively.
| Characteristic | Number | Measure |
| Per Capita Income | 15,845 | $34,577 |
| Median Family Income | 3,785 | $95,694 |
| Mean Family Income | 3,785 | $106,489 |
| Median Household Income | 5,944 | $73,534 |
| Mean Household Income | 5,944 | $86,799 |
| Income Deficit | 3,785 | $11,961 |
| Wage / Income Gap (%) | 15,845 | 42.64% |
| Wage / Income Gap ($) | 15,845 | 57.36¢ per $1 |
| Gini / Inequality Index | 15,845 | 0.41 |
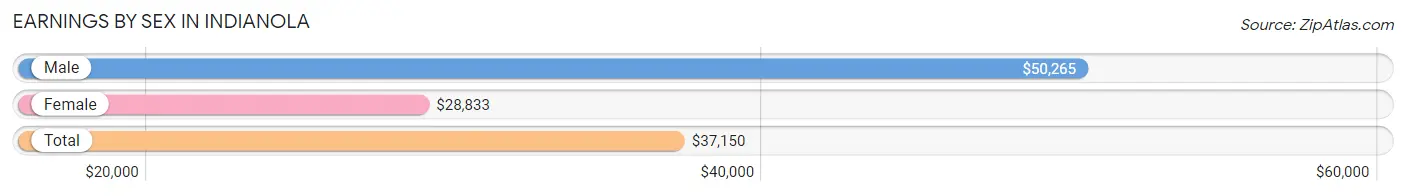
Earnings by Sex in Indianola
Average Earnings in Indianola are $37,150, $50,265 for men and $28,833 for women, a difference of 42.6%.
| Sex | Number | Average Earnings |
| Male | 4,631 (51.7%) | $50,265 |
| Female | 4,323 (48.3%) | $28,833 |
| Total | 8,954 (100.0%) | $37,150 |
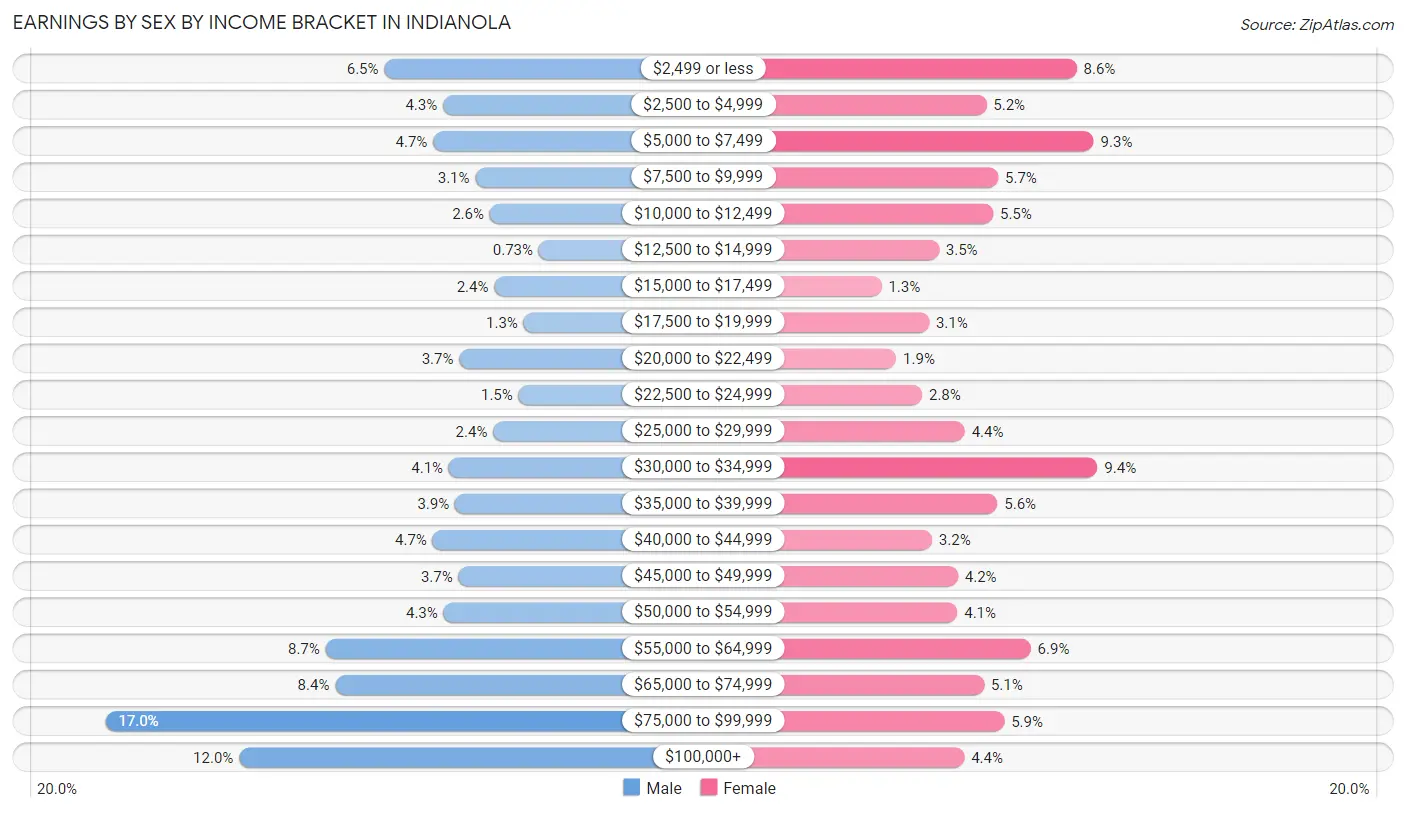
Earnings by Sex by Income Bracket in Indianola
The most common earnings brackets in Indianola are $75,000 to $99,999 for men (786 | 17.0%) and $30,000 to $34,999 for women (406 | 9.4%).
| Income | Male | Female |
| $2,499 or less | 302 (6.5%) | 372 (8.6%) |
| $2,500 to $4,999 | 200 (4.3%) | 226 (5.2%) |
| $5,000 to $7,499 | 217 (4.7%) | 400 (9.2%) |
| $7,500 to $9,999 | 144 (3.1%) | 245 (5.7%) |
| $10,000 to $12,499 | 119 (2.6%) | 237 (5.5%) |
| $12,500 to $14,999 | 34 (0.7%) | 149 (3.5%) |
| $15,000 to $17,499 | 111 (2.4%) | 56 (1.3%) |
| $17,500 to $19,999 | 60 (1.3%) | 133 (3.1%) |
| $20,000 to $22,499 | 172 (3.7%) | 80 (1.8%) |
| $22,500 to $24,999 | 69 (1.5%) | 122 (2.8%) |
| $25,000 to $29,999 | 113 (2.4%) | 191 (4.4%) |
| $30,000 to $34,999 | 190 (4.1%) | 406 (9.4%) |
| $35,000 to $39,999 | 179 (3.9%) | 244 (5.6%) |
| $40,000 to $44,999 | 218 (4.7%) | 138 (3.2%) |
| $45,000 to $49,999 | 173 (3.7%) | 180 (4.2%) |
| $50,000 to $54,999 | 199 (4.3%) | 179 (4.1%) |
| $55,000 to $64,999 | 404 (8.7%) | 298 (6.9%) |
| $65,000 to $74,999 | 387 (8.4%) | 222 (5.1%) |
| $75,000 to $99,999 | 786 (17.0%) | 255 (5.9%) |
| $100,000+ | 554 (12.0%) | 190 (4.4%) |
| Total | 4,631 (100.0%) | 4,323 (100.0%) |
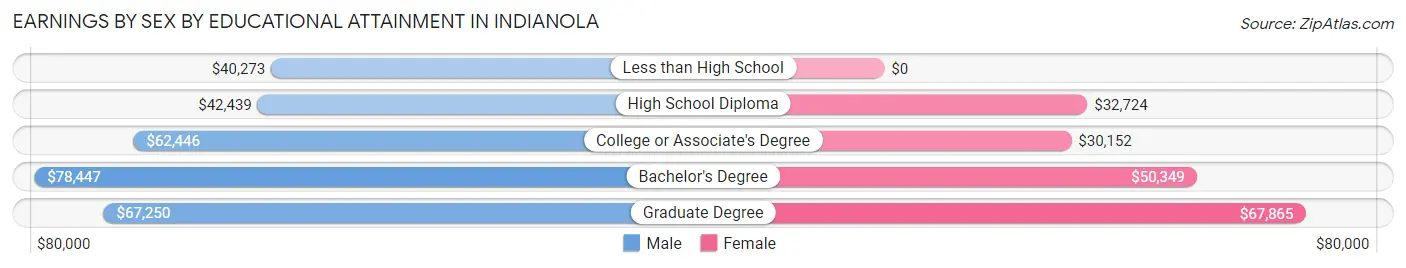
Earnings by Sex by Educational Attainment in Indianola
Average earnings in Indianola are $61,314 for men and $37,723 for women, a difference of 38.5%. Men with an educational attainment of bachelor's degree enjoy the highest average annual earnings of $78,447, while those with less than high school education earn the least with $40,273. Women with an educational attainment of graduate degree earn the most with the average annual earnings of $67,865, while those with college or associate's degree education have the smallest earnings of $30,152.
| Educational Attainment | Male Income | Female Income |
| Less than High School | $40,273 | $0 |
| High School Diploma | $42,439 | $32,724 |
| College or Associate's Degree | $62,446 | $30,152 |
| Bachelor's Degree | $78,447 | $50,349 |
| Graduate Degree | $67,250 | $67,865 |
| Total | $61,314 | $37,723 |
Family Income in Indianola
Family Income Brackets in Indianola
According to the Indianola family income data, there are 1,086 families falling into the $100,000 to $149,999 income range, which is the most common income bracket and makes up 28.7% of all families. Conversely, the $10,000 to $14,999 income bracket is the least frequent group with only 30 families (0.8%) belonging to this category.
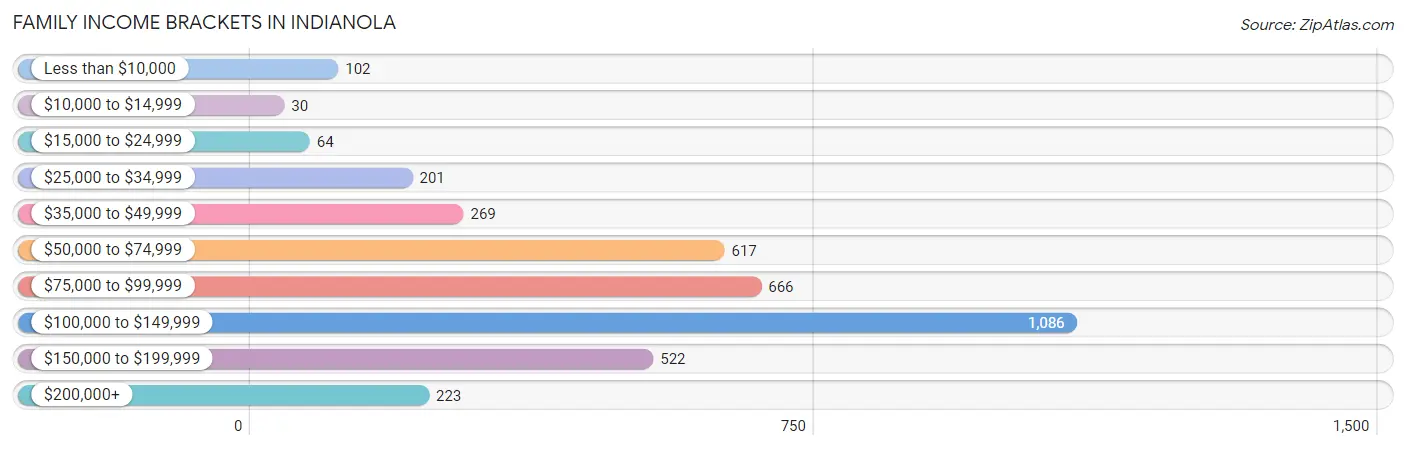
| Income Bracket | # Families | % Families |
| Less than $10,000 | 102 | 2.7% |
| $10,000 to $14,999 | 30 | 0.8% |
| $15,000 to $24,999 | 64 | 1.7% |
| $25,000 to $34,999 | 201 | 5.3% |
| $35,000 to $49,999 | 269 | 7.1% |
| $50,000 to $74,999 | 617 | 16.3% |
| $75,000 to $99,999 | 666 | 17.6% |
| $100,000 to $149,999 | 1,086 | 28.7% |
| $150,000 to $199,999 | 522 | 13.8% |
| $200,000+ | 223 | 5.9% |
Family Income by Famaliy Size in Indianola
6-person families (127 | 3.4%) account for the highest median family income in Indianola with $124,543 per family, while 2-person families (1,826 | 48.2%) have the highest median income of $44,292 per family member.
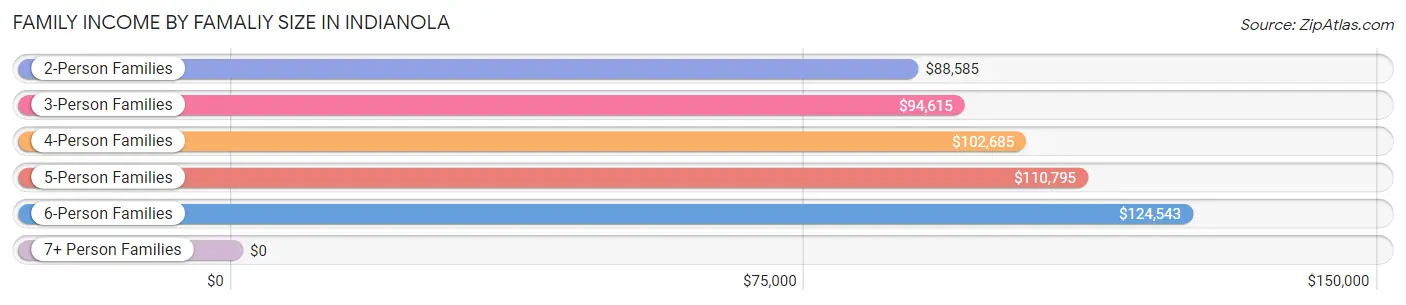
| Income Bracket | # Families | Median Income |
| 2-Person Families | 1,826 (48.2%) | $88,585 |
| 3-Person Families | 656 (17.3%) | $94,615 |
| 4-Person Families | 752 (19.9%) | $102,685 |
| 5-Person Families | 373 (9.9%) | $110,795 |
| 6-Person Families | 127 (3.4%) | $124,543 |
| 7+ Person Families | 51 (1.3%) | $0 |
| Total | 3,785 (100.0%) | $95,694 |
Family Income by Number of Earners in Indianola
The median family income in Indianola is $95,694, with families comprising 3+ earners (434) having the highest median family income of $153,750, while families with no earners (386) have the lowest median family income of $67,045, accounting for 11.5% and 10.2% of families, respectively.
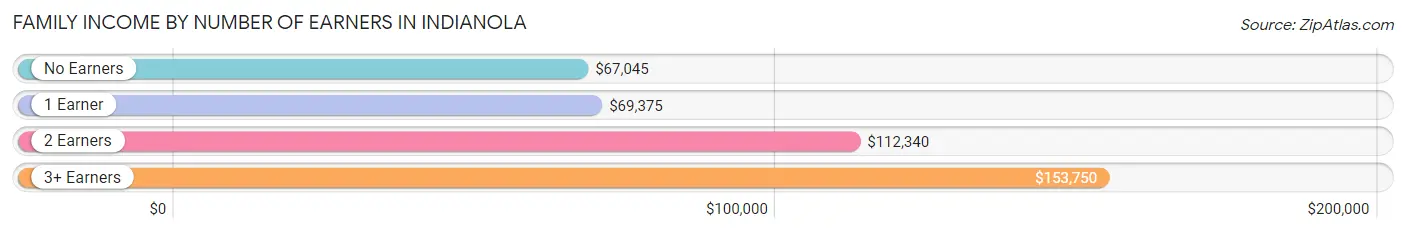
| Number of Earners | # Families | Median Income |
| No Earners | 386 (10.2%) | $67,045 |
| 1 Earner | 1,301 (34.4%) | $69,375 |
| 2 Earners | 1,664 (44.0%) | $112,340 |
| 3+ Earners | 434 (11.5%) | $153,750 |
| Total | 3,785 (100.0%) | $95,694 |
Household Income in Indianola
Household Income Brackets in Indianola
With 1,343 households falling in the category, the $100,000 to $149,999 income range is the most frequent in Indianola, accounting for 22.6% of all households. In contrast, only 137 households (2.3%) fall into the $10,000 to $14,999 income bracket, making it the least populous group.
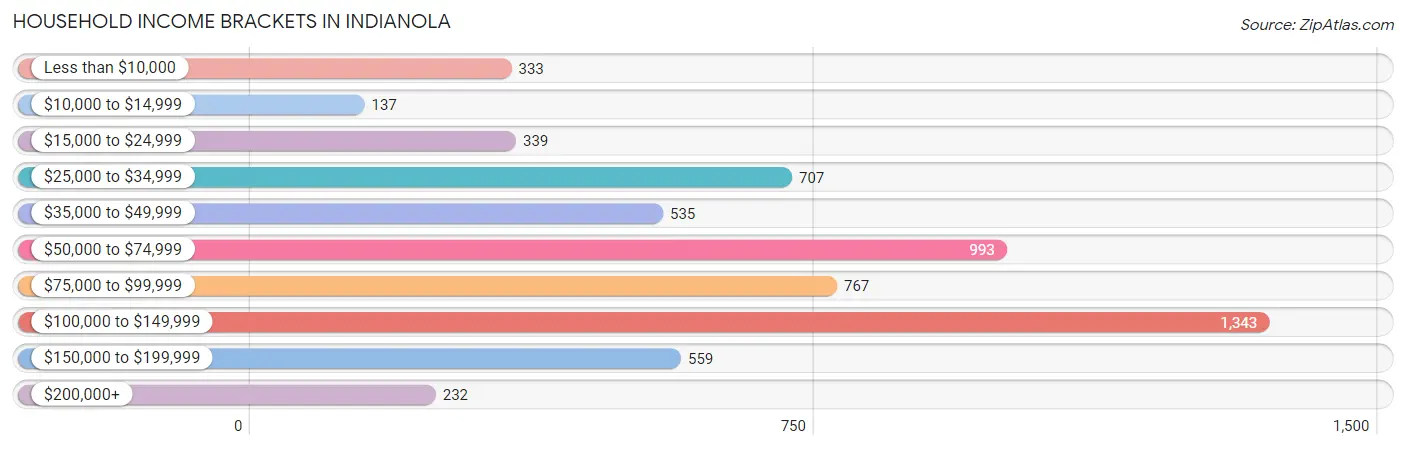
| Income Bracket | # Households | % Households |
| Less than $10,000 | 333 | 5.6% |
| $10,000 to $14,999 | 137 | 2.3% |
| $15,000 to $24,999 | 339 | 5.7% |
| $25,000 to $34,999 | 707 | 11.9% |
| $35,000 to $49,999 | 535 | 9.0% |
| $50,000 to $74,999 | 993 | 16.7% |
| $75,000 to $99,999 | 767 | 12.9% |
| $100,000 to $149,999 | 1,343 | 22.6% |
| $150,000 to $199,999 | 559 | 9.4% |
| $200,000+ | 232 | 3.9% |
Household Income by Householder Age in Indianola
The median household income in Indianola is $73,534, with the highest median household income of $95,052 found in the 45 to 64 years age bracket for the primary householder. A total of 1,785 households (30.0%) fall into this category. Meanwhile, the 15 to 24 years age bracket for the primary householder has the lowest median household income of $0, with 334 households (5.6%) in this group.
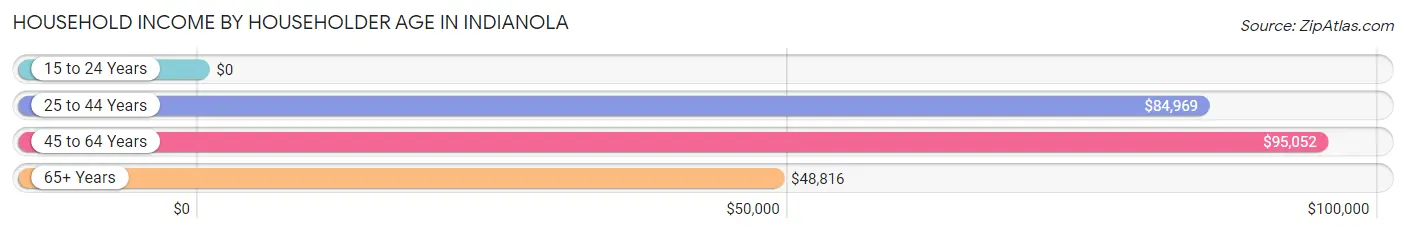
| Income Bracket | # Households | Median Income |
| 15 to 24 Years | 334 (5.6%) | $0 |
| 25 to 44 Years | 2,141 (36.0%) | $84,969 |
| 45 to 64 Years | 1,785 (30.0%) | $95,052 |
| 65+ Years | 1,684 (28.3%) | $48,816 |
| Total | 5,944 (100.0%) | $73,534 |
Poverty in Indianola
Income Below Poverty by Sex and Age in Indianola
With 7.6% poverty level for males and 9.7% for females among the residents of Indianola, 15 year old males and 18 to 24 year old females are the most vulnerable to poverty, with 25 males (42.4%) and 198 females (27.9%) in their respective age groups living below the poverty level.
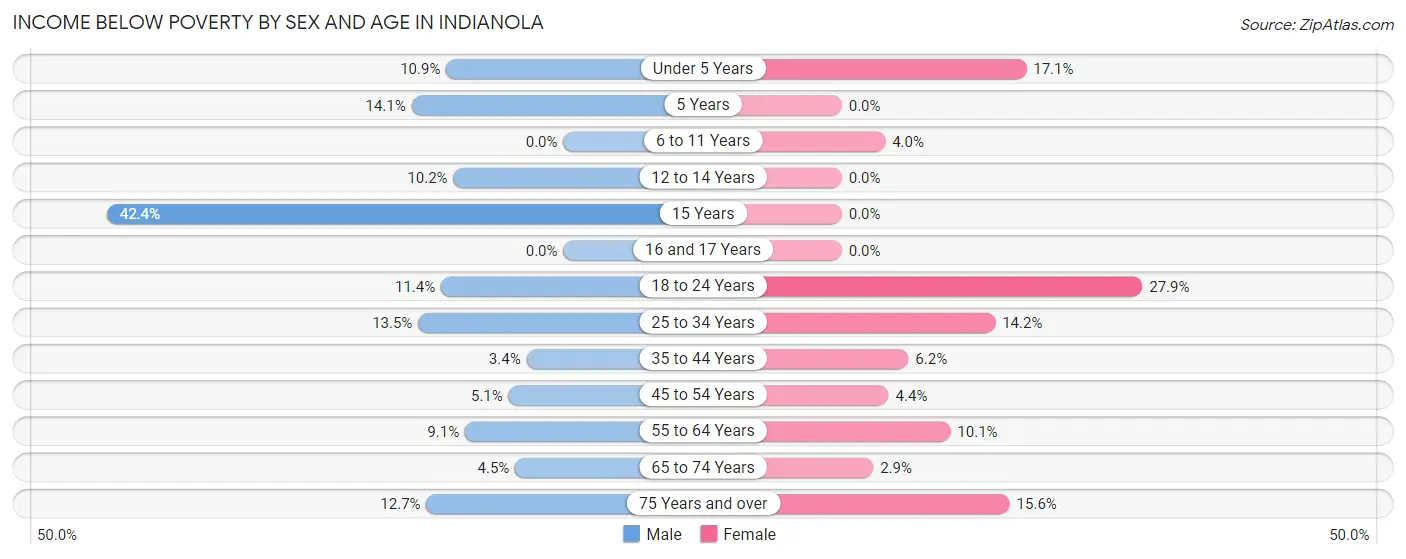
| Age Bracket | Male | Female |
| Under 5 Years | 50 (10.9%) | 76 (17.1%) |
| 5 Years | 31 (14.1%) | 0 (0.0%) |
| 6 to 11 Years | 0 (0.0%) | 27 (4.0%) |
| 12 to 14 Years | 26 (10.2%) | 0 (0.0%) |
| 15 Years | 25 (42.4%) | 0 (0.0%) |
| 16 and 17 Years | 0 (0.0%) | 0 (0.0%) |
| 18 to 24 Years | 64 (11.4%) | 198 (27.9%) |
| 25 to 34 Years | 125 (13.5%) | 134 (14.2%) |
| 35 to 44 Years | 39 (3.4%) | 60 (6.2%) |
| 45 to 54 Years | 40 (5.1%) | 31 (4.3%) |
| 55 to 64 Years | 57 (9.1%) | 87 (10.1%) |
| 65 to 74 Years | 30 (4.5%) | 25 (2.9%) |
| 75 Years and over | 46 (12.7%) | 81 (15.6%) |
| Total | 533 (7.6%) | 719 (9.7%) |
Income Above Poverty by Sex and Age in Indianola
According to the poverty statistics in Indianola, males aged 6 to 11 years and females aged 5 years are the age groups that are most secure financially, with 100.0% of males and 100.0% of females in these age groups living above the poverty line.
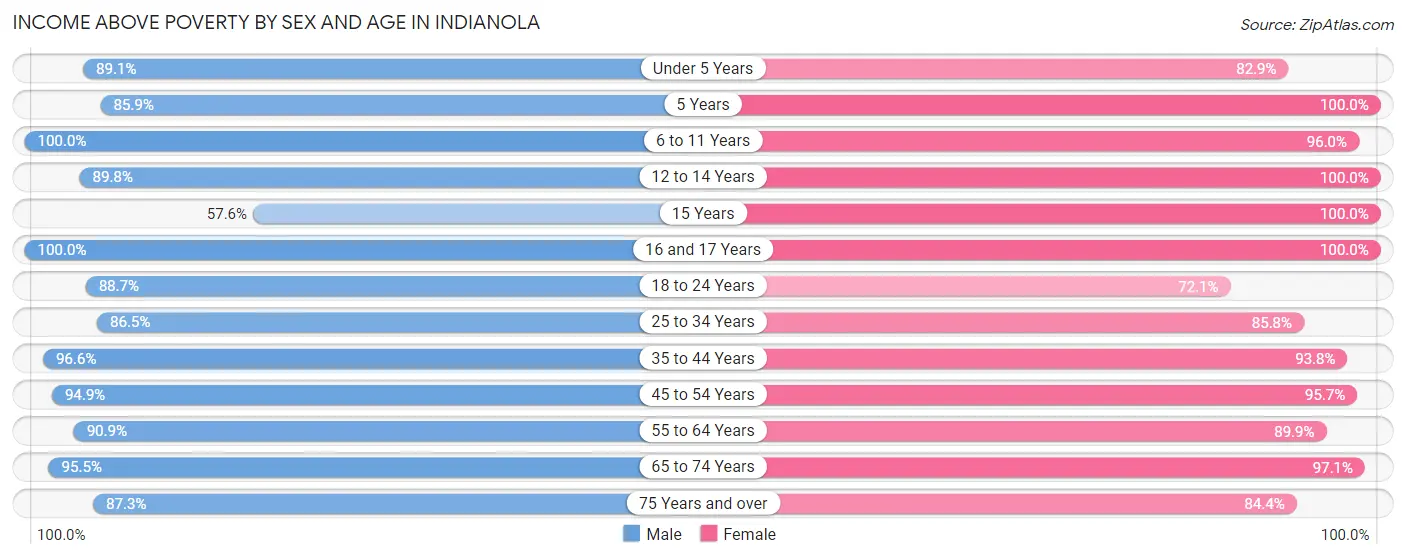
| Age Bracket | Male | Female |
| Under 5 Years | 410 (89.1%) | 368 (82.9%) |
| 5 Years | 189 (85.9%) | 39 (100.0%) |
| 6 to 11 Years | 726 (100.0%) | 643 (96.0%) |
| 12 to 14 Years | 229 (89.8%) | 372 (100.0%) |
| 15 Years | 34 (57.6%) | 73 (100.0%) |
| 16 and 17 Years | 173 (100.0%) | 244 (100.0%) |
| 18 to 24 Years | 500 (88.6%) | 512 (72.1%) |
| 25 to 34 Years | 803 (86.5%) | 807 (85.8%) |
| 35 to 44 Years | 1,102 (96.6%) | 911 (93.8%) |
| 45 to 54 Years | 748 (94.9%) | 681 (95.7%) |
| 55 to 64 Years | 567 (90.9%) | 776 (89.9%) |
| 65 to 74 Years | 641 (95.5%) | 832 (97.1%) |
| 75 Years and over | 316 (87.3%) | 439 (84.4%) |
| Total | 6,438 (92.3%) | 6,697 (90.3%) |
Income Below Poverty Among Married-Couple Families in Indianola
The poverty statistics for married-couple families in Indianola show that 2.2% or 63 of the total 2,832 families live below the poverty line. Families with 1 or 2 children have the highest poverty rate of 2.7%, comprising of 23 families. On the other hand, families with 5 or more children have the lowest poverty rate of 0.0%, which includes 0 families.
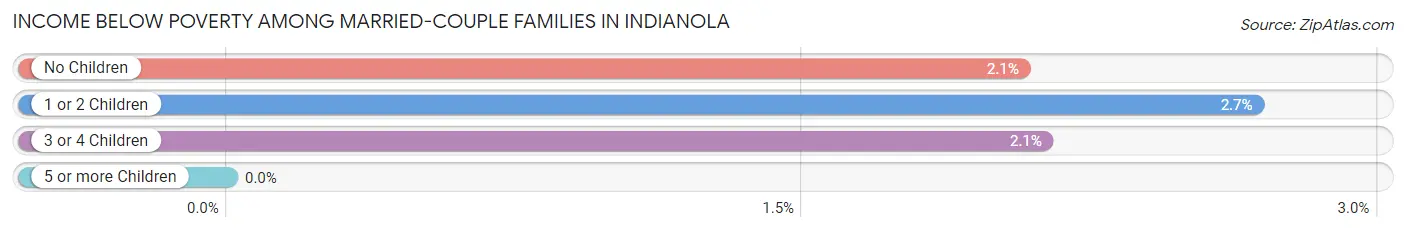
| Children | Above Poverty | Below Poverty |
| No Children | 1,517 (97.9%) | 32 (2.1%) |
| 1 or 2 Children | 834 (97.3%) | 23 (2.7%) |
| 3 or 4 Children | 367 (97.9%) | 8 (2.1%) |
| 5 or more Children | 51 (100.0%) | 0 (0.0%) |
| Total | 2,769 (97.8%) | 63 (2.2%) |
Income Below Poverty Among Single-Parent Households in Indianola
According to the poverty data in Indianola, 9.0% or 34 single-father households and 16.1% or 93 single-mother households are living below the poverty line. Among single-father households, those with no children have the highest poverty rate, with 12 households (10.5%) experiencing poverty. Likewise, among single-mother households, those with 3 or 4 children have the highest poverty rate, with 54 households (39.7%) falling below the poverty line.
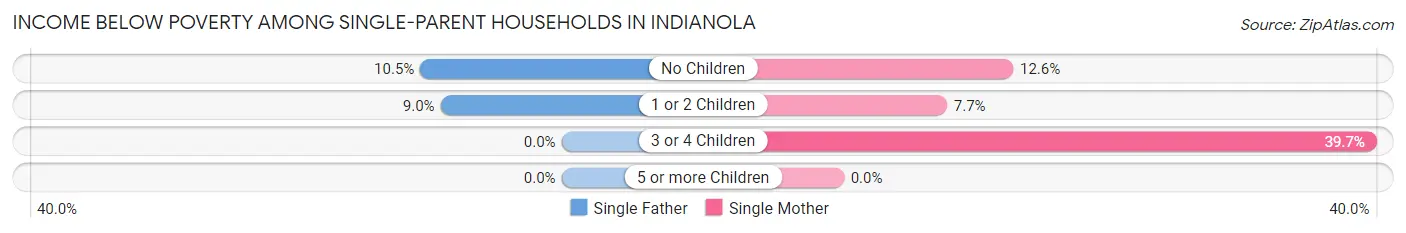
| Children | Single Father | Single Mother |
| No Children | 12 (10.5%) | 13 (12.6%) |
| 1 or 2 Children | 22 (9.0%) | 26 (7.7%) |
| 3 or 4 Children | 0 (0.0%) | 54 (39.7%) |
| 5 or more Children | 0 (0.0%) | 0 (0.0%) |
| Total | 34 (9.0%) | 93 (16.1%) |
Income Below Poverty Among Married-Couple vs Single-Parent Households in Indianola
The poverty data for Indianola shows that 63 of the married-couple family households (2.2%) and 127 of the single-parent households (13.3%) are living below the poverty level. Within the married-couple family households, those with 1 or 2 children have the highest poverty rate, with 23 households (2.7%) falling below the poverty line. Among the single-parent households, those with 3 or 4 children have the highest poverty rate, with 54 household (35.1%) living below poverty.
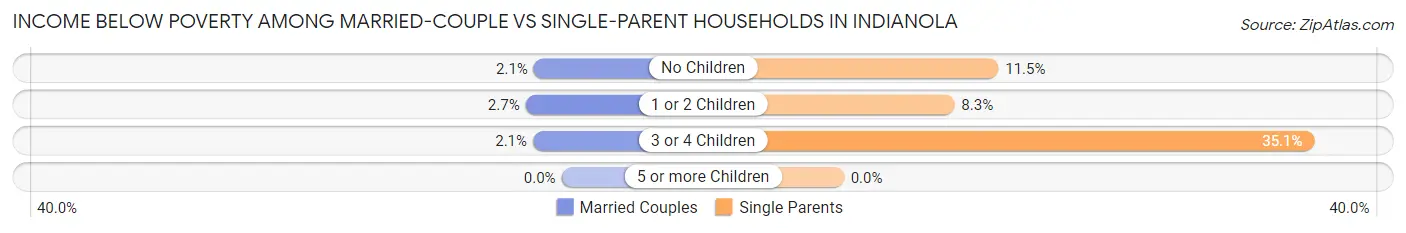
| Children | Married-Couple Families | Single-Parent Households |
| No Children | 32 (2.1%) | 25 (11.5%) |
| 1 or 2 Children | 23 (2.7%) | 48 (8.3%) |
| 3 or 4 Children | 8 (2.1%) | 54 (35.1%) |
| 5 or more Children | 0 (0.0%) | 0 (0.0%) |
| Total | 63 (2.2%) | 127 (13.3%) |
Race in Indianola
The most populous races in Indianola are White / Caucasian (14,710 | 92.8%), Two or more Races (620 | 3.9%), and Hispanic or Latino (395 | 2.5%).
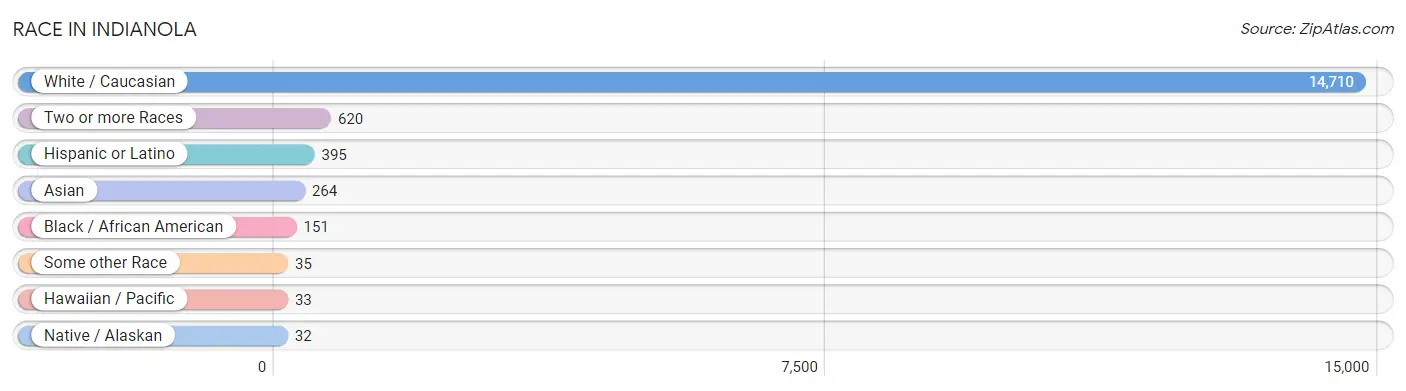
| Race | # Population | % Population |
| Asian | 264 | 1.7% |
| Black / African American | 151 | 0.9% |
| Hawaiian / Pacific | 33 | 0.2% |
| Hispanic or Latino | 395 | 2.5% |
| Native / Alaskan | 32 | 0.2% |
| White / Caucasian | 14,710 | 92.8% |
| Two or more Races | 620 | 3.9% |
| Some other Race | 35 | 0.2% |
| Total | 15,845 | 100.0% |
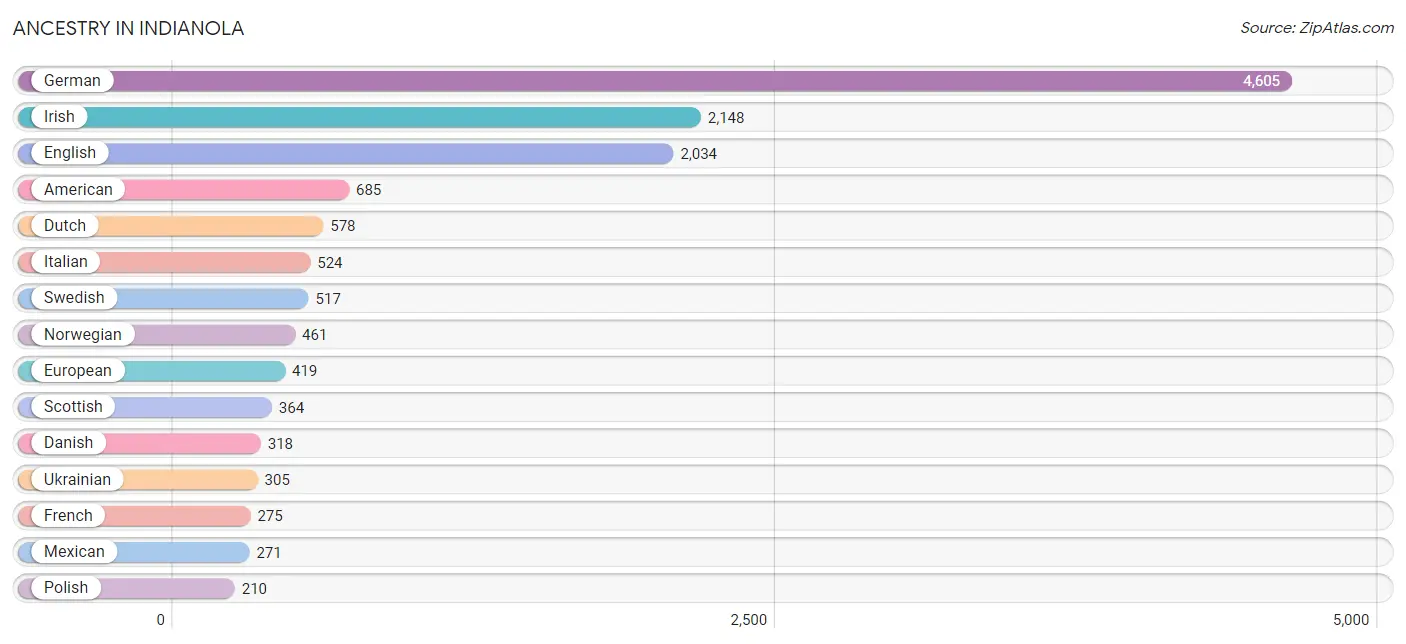
Ancestry in Indianola
The most populous ancestries reported in Indianola are German (4,605 | 29.1%), Irish (2,148 | 13.6%), English (2,034 | 12.8%), American (685 | 4.3%), and Dutch (578 | 3.6%), together accounting for 63.4% of all Indianola residents.
| Ancestry | # Population | % Population |
| Aleut | 5 | 0.0% |
| American | 685 | 4.3% |
| Arab | 2 | 0.0% |
| Australian | 42 | 0.3% |
| Belgian | 80 | 0.5% |
| British | 82 | 0.5% |
| Burmese | 43 | 0.3% |
| Canadian | 77 | 0.5% |
| Central American | 38 | 0.2% |
| Cherokee | 75 | 0.5% |
| Colombian | 9 | 0.1% |
| Cuban | 13 | 0.1% |
| Czech | 112 | 0.7% |
| Czechoslovakian | 22 | 0.1% |
| Danish | 318 | 2.0% |
| Dutch | 578 | 3.6% |
| Eastern European | 10 | 0.1% |
| English | 2,034 | 12.8% |
| European | 419 | 2.6% |
| Finnish | 32 | 0.2% |
| French | 275 | 1.7% |
| French American Indian | 3 | 0.0% |
| French Canadian | 17 | 0.1% |
| German | 4,605 | 29.1% |
| Greek | 21 | 0.1% |
| Guamanian / Chamorro | 11 | 0.1% |
| Honduran | 22 | 0.1% |
| Hungarian | 29 | 0.2% |
| Indian (Asian) | 24 | 0.2% |
| Irish | 2,148 | 13.6% |
| Italian | 524 | 3.3% |
| Jamaican | 23 | 0.2% |
| Korean | 54 | 0.3% |
| Lebanese | 2 | 0.0% |
| Luxembourger | 23 | 0.2% |
| Malaysian | 12 | 0.1% |
| Mexican | 271 | 1.7% |
| Native Hawaiian | 119 | 0.7% |
| Northern European | 10 | 0.1% |
| Norwegian | 461 | 2.9% |
| Paraguayan | 9 | 0.1% |
| Polish | 210 | 1.3% |
| Portuguese | 5 | 0.0% |
| Romanian | 14 | 0.1% |
| Russian | 38 | 0.2% |
| Salvadoran | 16 | 0.1% |
| Scandinavian | 29 | 0.2% |
| Scotch-Irish | 200 | 1.3% |
| Scottish | 364 | 2.3% |
| Sioux | 3 | 0.0% |
| Slavic | 9 | 0.1% |
| Slovak | 4 | 0.0% |
| South American | 18 | 0.1% |
| Spanish | 55 | 0.4% |
| Sri Lankan | 150 | 0.9% |
| Swedish | 517 | 3.3% |
| Swiss | 46 | 0.3% |
| Thai | 25 | 0.2% |
| Ukrainian | 305 | 1.9% |
| Welsh | 35 | 0.2% |
| Yugoslavian | 30 | 0.2% | View All 61 Rows |
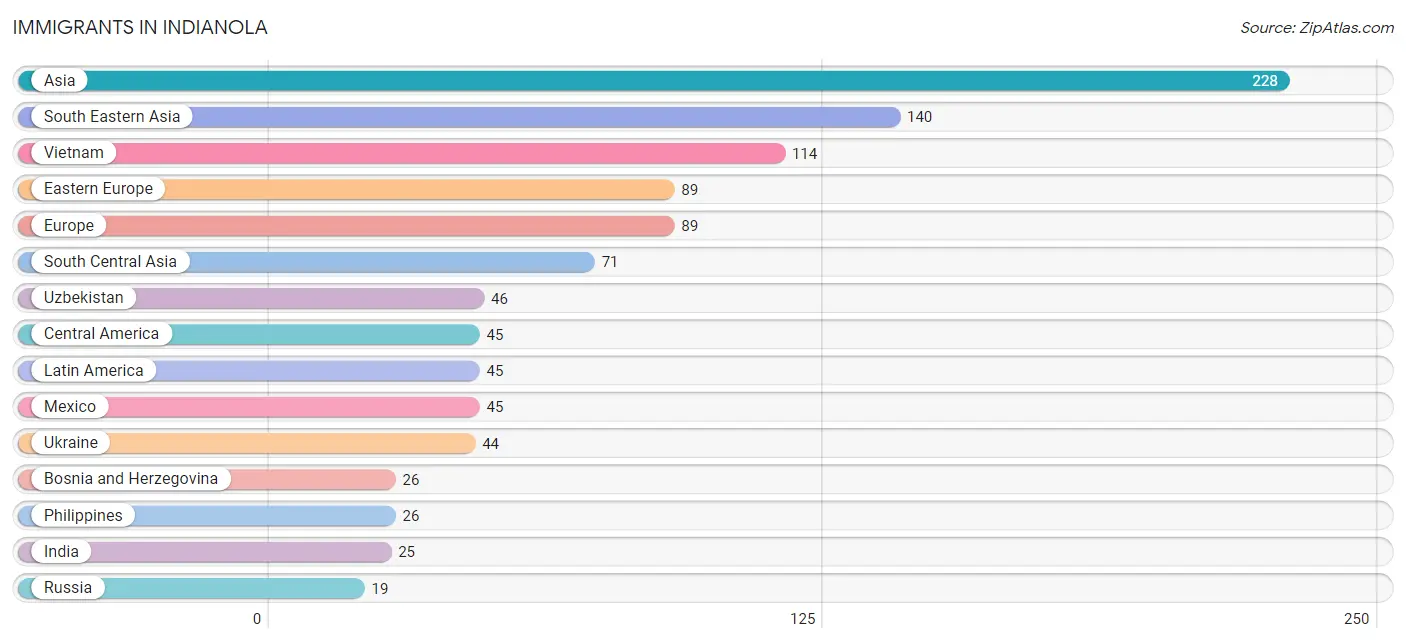
Immigrants in Indianola
The most numerous immigrant groups reported in Indianola came from Asia (228 | 1.4%), South Eastern Asia (140 | 0.9%), Vietnam (114 | 0.7%), Eastern Europe (89 | 0.6%), and Europe (89 | 0.6%), together accounting for 4.2% of all Indianola residents.
| Immigration Origin | # Population | % Population |
| Asia | 228 | 1.4% |
| Bosnia and Herzegovina | 26 | 0.2% |
| Central America | 45 | 0.3% |
| China | 9 | 0.1% |
| Eastern Asia | 17 | 0.1% |
| Eastern Europe | 89 | 0.6% |
| Europe | 89 | 0.6% |
| India | 25 | 0.2% |
| Korea | 8 | 0.1% |
| Latin America | 45 | 0.3% |
| Mexico | 45 | 0.3% |
| Philippines | 26 | 0.2% |
| Russia | 19 | 0.1% |
| South Central Asia | 71 | 0.4% |
| South Eastern Asia | 140 | 0.9% |
| Ukraine | 44 | 0.3% |
| Uzbekistan | 46 | 0.3% |
| Vietnam | 114 | 0.7% | View All 18 Rows |
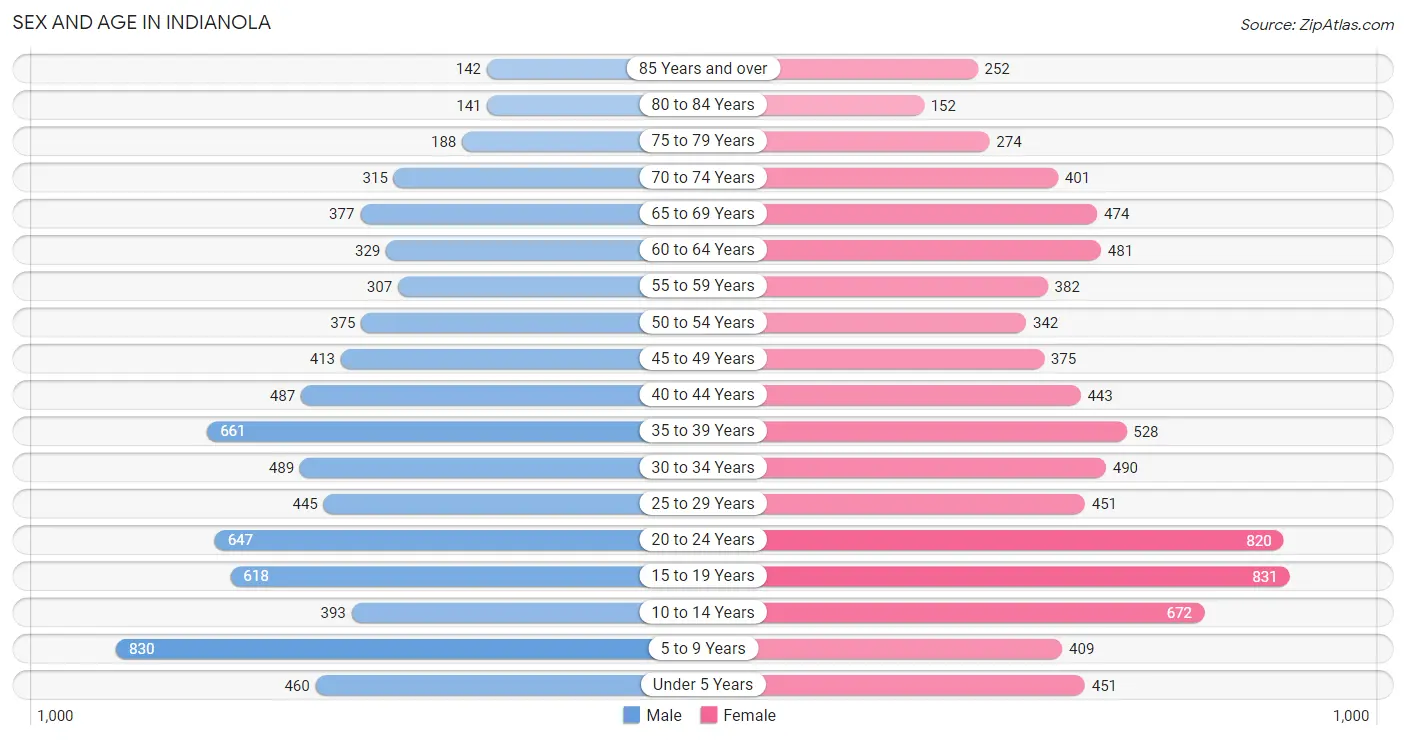
Sex and Age in Indianola
Sex and Age in Indianola
The most populous age groups in Indianola are 5 to 9 Years (830 | 10.9%) for men and 15 to 19 Years (831 | 10.1%) for women.
| Age Bracket | Male | Female |
| Under 5 Years | 460 (6.0%) | 451 (5.5%) |
| 5 to 9 Years | 830 (10.9%) | 409 (5.0%) |
| 10 to 14 Years | 393 (5.2%) | 672 (8.2%) |
| 15 to 19 Years | 618 (8.1%) | 831 (10.1%) |
| 20 to 24 Years | 647 (8.5%) | 820 (10.0%) |
| 25 to 29 Years | 445 (5.8%) | 451 (5.5%) |
| 30 to 34 Years | 489 (6.4%) | 490 (6.0%) |
| 35 to 39 Years | 661 (8.7%) | 528 (6.4%) |
| 40 to 44 Years | 487 (6.4%) | 443 (5.4%) |
| 45 to 49 Years | 413 (5.4%) | 375 (4.6%) |
| 50 to 54 Years | 375 (4.9%) | 342 (4.2%) |
| 55 to 59 Years | 307 (4.0%) | 382 (4.6%) |
| 60 to 64 Years | 329 (4.3%) | 481 (5.9%) |
| 65 to 69 Years | 377 (5.0%) | 474 (5.8%) |
| 70 to 74 Years | 315 (4.1%) | 401 (4.9%) |
| 75 to 79 Years | 188 (2.5%) | 274 (3.3%) |
| 80 to 84 Years | 141 (1.8%) | 152 (1.8%) |
| 85 Years and over | 142 (1.9%) | 252 (3.1%) |
| Total | 7,617 (100.0%) | 8,228 (100.0%) |
Families and Households in Indianola
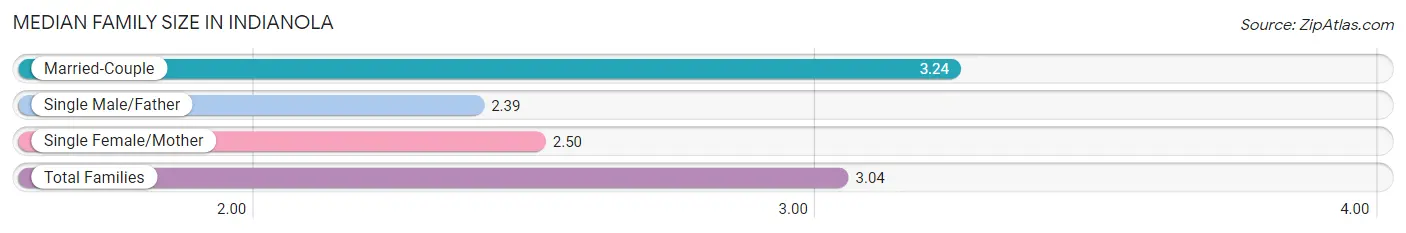
Median Family Size in Indianola
The median family size in Indianola is 3.04 persons per family, with married-couple families (2,832 | 74.8%) accounting for the largest median family size of 3.24 persons per family. On the other hand, single male/father families (376 | 9.9%) represent the smallest median family size with 2.39 persons per family.
| Family Type | # Families | Family Size |
| Married-Couple | 2,832 (74.8%) | 3.24 |
| Single Male/Father | 376 (9.9%) | 2.39 |
| Single Female/Mother | 577 (15.2%) | 2.50 |
| Total Families | 3,785 (100.0%) | 3.04 |
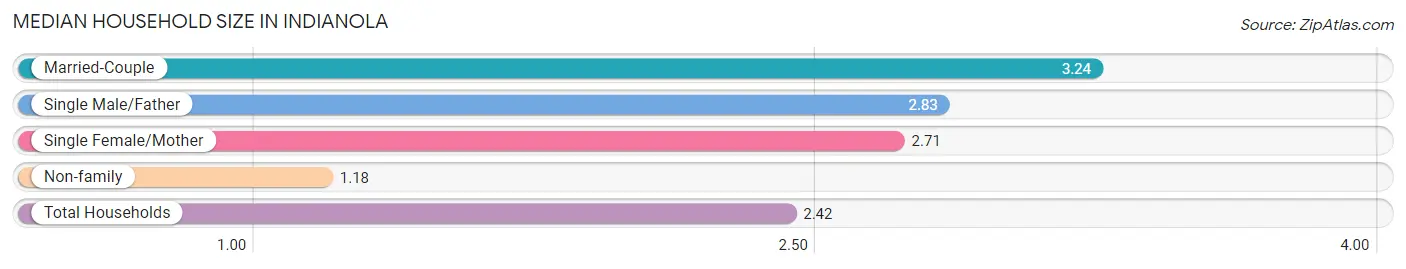
Median Household Size in Indianola
The median household size in Indianola is 2.42 persons per household, with married-couple households (2,832 | 47.6%) accounting for the largest median household size of 3.24 persons per household. non-family households (2,159 | 36.3%) represent the smallest median household size with 1.18 persons per household.
| Household Type | # Households | Household Size |
| Married-Couple | 2,832 (47.6%) | 3.24 |
| Single Male/Father | 376 (6.3%) | 2.83 |
| Single Female/Mother | 577 (9.7%) | 2.71 |
| Non-family | 2,159 (36.3%) | 1.18 |
| Total Households | 5,944 (100.0%) | 2.42 |
Household Size by Marriage Status in Indianola
Out of a total of 5,944 households in Indianola, 3,785 (63.7%) are family households, while 2,159 (36.3%) are nonfamily households. The most numerous type of family households are 2-person households, comprising 1,690, and the most common type of nonfamily households are 1-person households, comprising 1,865.
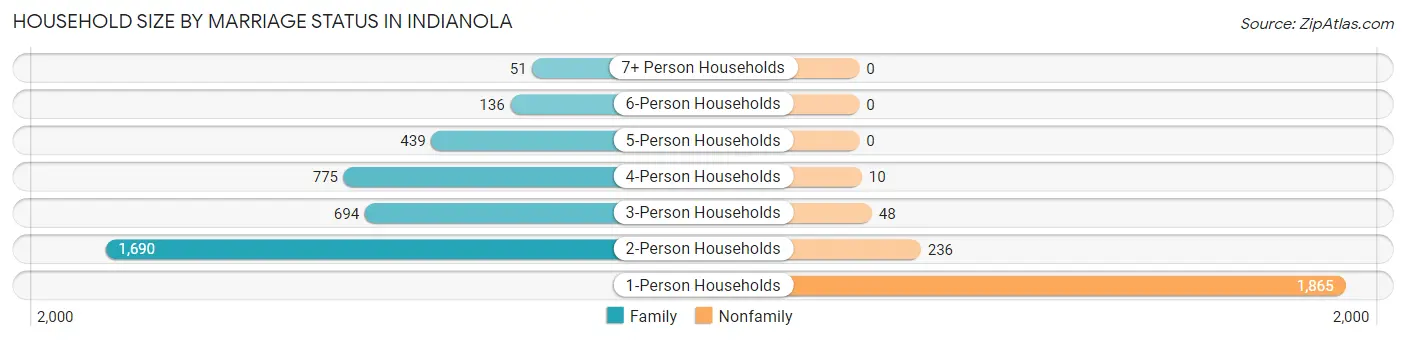
| Household Size | Family Households | Nonfamily Households |
| 1-Person Households | - | 1,865 (31.4%) |
| 2-Person Households | 1,690 (28.4%) | 236 (4.0%) |
| 3-Person Households | 694 (11.7%) | 48 (0.8%) |
| 4-Person Households | 775 (13.0%) | 10 (0.2%) |
| 5-Person Households | 439 (7.4%) | 0 (0.0%) |
| 6-Person Households | 136 (2.3%) | 0 (0.0%) |
| 7+ Person Households | 51 (0.9%) | 0 (0.0%) |
| Total | 3,785 (63.7%) | 2,159 (36.3%) |
Female Fertility in Indianola
Fertility by Age in Indianola
Average fertility rate in Indianola is 84.0 births per 1,000 women. Women in the age bracket of 20 to 34 years have the highest fertility rate with 142.0 births per 1,000 women. Women in the age bracket of 20 to 34 years acount for 73.5% of all women with births.
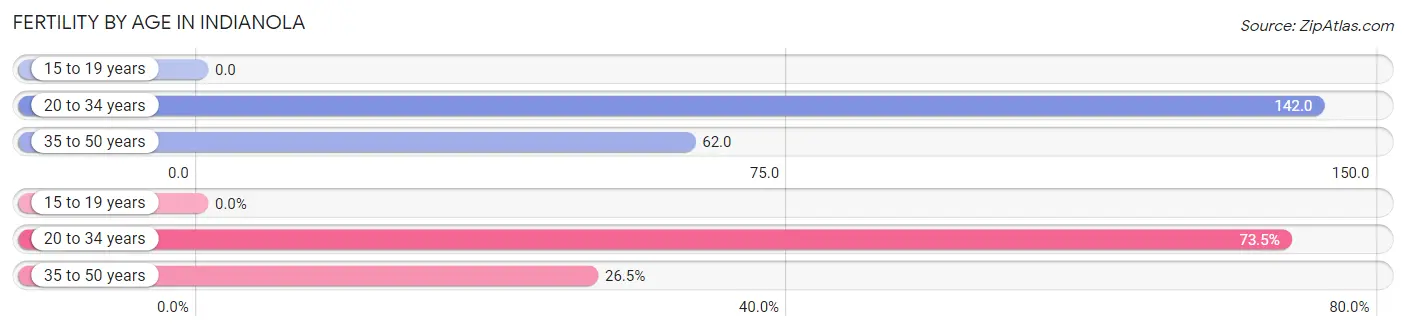
| Age Bracket | Women with Births | Births / 1,000 Women |
| 15 to 19 years | 0 (0.0%) | 0.0 |
| 20 to 34 years | 250 (73.5%) | 142.0 |
| 35 to 50 years | 90 (26.5%) | 62.0 |
| Total | 340 (100.0%) | 84.0 |
Fertility by Age by Marriage Status in Indianola
68.5% of women with births (340) in Indianola are married. The highest percentage of unmarried women with births falls into 20 to 34 years age bracket with 39.2% of them unmarried at the time of birth, while the lowest percentage of unmarried women with births belong to 35 to 50 years age bracket with 10.0% of them unmarried.
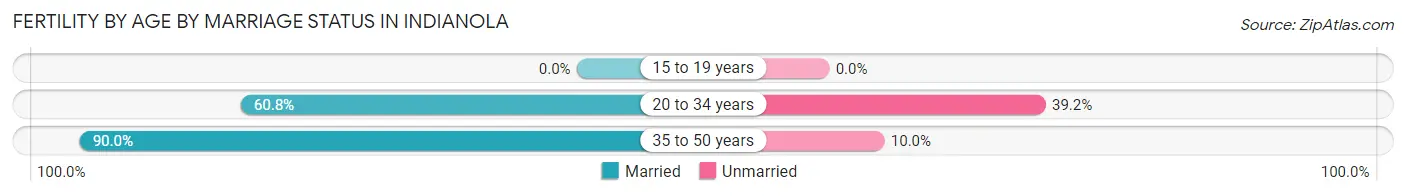
| Age Bracket | Married | Unmarried |
| 15 to 19 years | 0 (0.0%) | 0 (0.0%) |
| 20 to 34 years | 152 (60.8%) | 98 (39.2%) |
| 35 to 50 years | 81 (90.0%) | 9 (10.0%) |
| Total | 233 (68.5%) | 107 (31.5%) |
Fertility by Education in Indianola
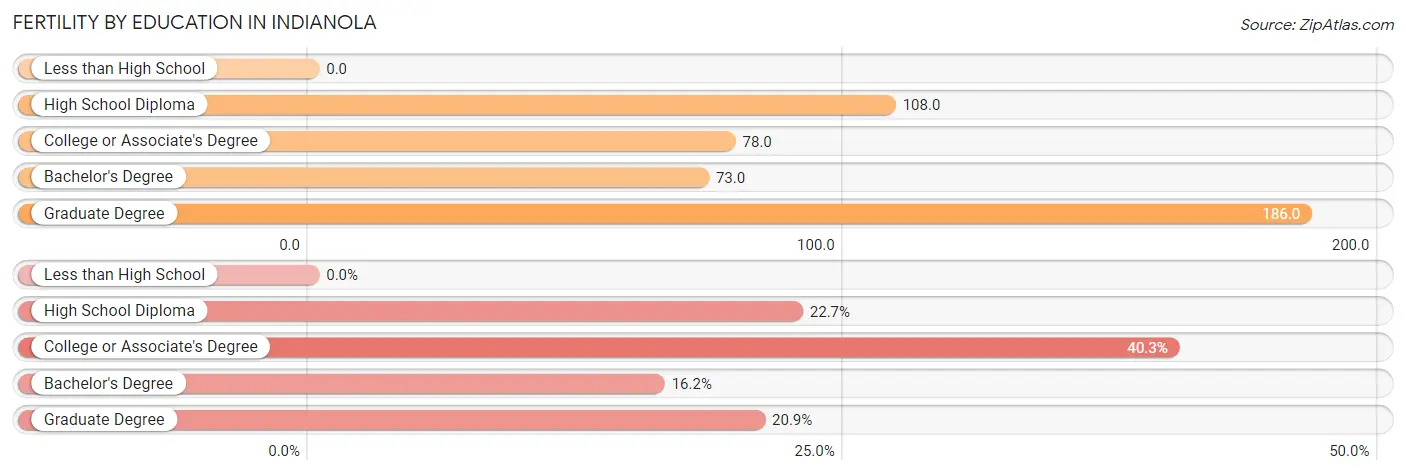
| Educational Attainment | Women with Births | Births / 1,000 Women |
| Less than High School | 0 (0.0%) | 0.0 |
| High School Diploma | 77 (22.7%) | 108.0 |
| College or Associate's Degree | 137 (40.3%) | 78.0 |
| Bachelor's Degree | 55 (16.2%) | 73.0 |
| Graduate Degree | 71 (20.9%) | 186.0 |
| Total | 340 (100.0%) | 84.0 |
Fertility by Education by Marriage Status in Indianola
31.5% of women with births in Indianola are unmarried. Women with the educational attainment of high school diploma are most likely to be married with 100.0% of them married at childbirth, while women with the educational attainment of college or associate's degree are least likely to be married with 71.5% of them unmarried at childbirth.
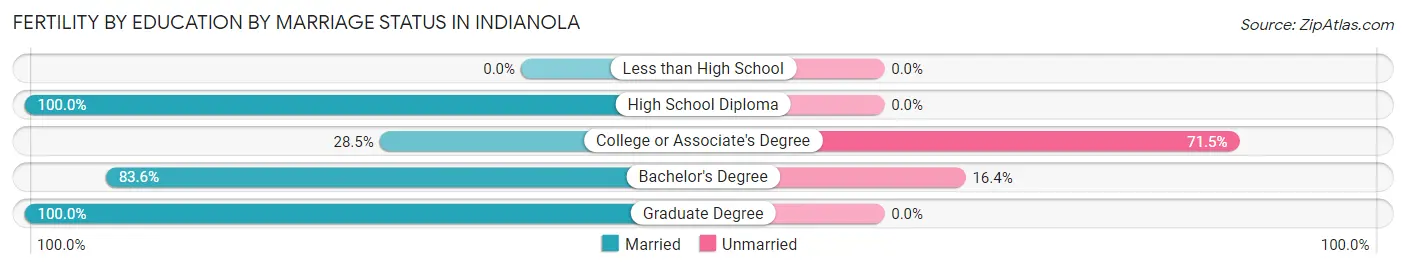
| Educational Attainment | Married | Unmarried |
| Less than High School | 0 (0.0%) | 0 (0.0%) |
| High School Diploma | 77 (100.0%) | 0 (0.0%) |
| College or Associate's Degree | 39 (28.5%) | 98 (71.5%) |
| Bachelor's Degree | 46 (83.6%) | 9 (16.4%) |
| Graduate Degree | 71 (100.0%) | 0 (0.0%) |
| Total | 233 (68.5%) | 107 (31.5%) |
Employment Characteristics in Indianola
Employment by Class of Employer in Indianola
Among the 7,585 employed individuals in Indianola, private company employees (5,107 | 67.3%), not-for-profit organizations (889 | 11.7%), and local government employees (544 | 7.2%) make up the most common classes of employment.
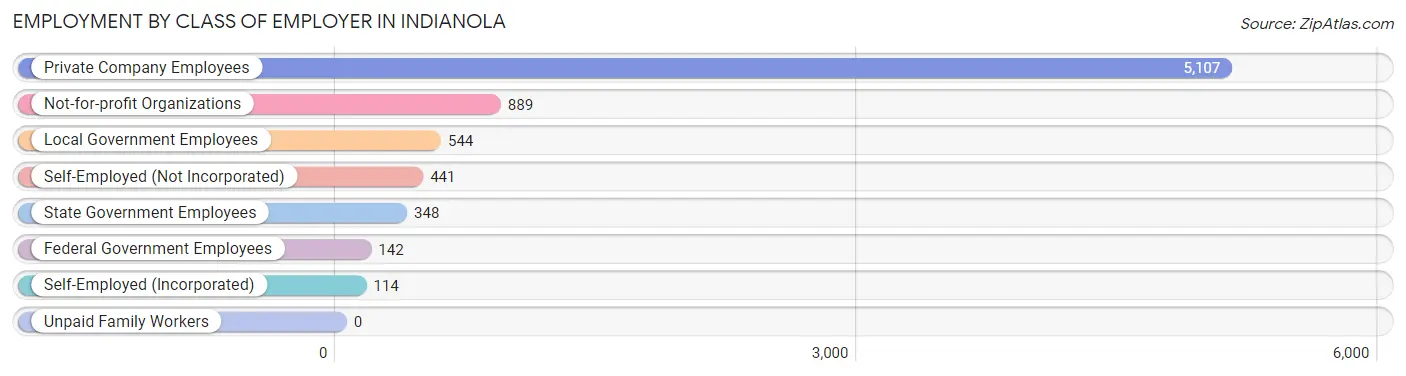
| Employer Class | # Employees | % Employees |
| Private Company Employees | 5,107 | 67.3% |
| Self-Employed (Incorporated) | 114 | 1.5% |
| Self-Employed (Not Incorporated) | 441 | 5.8% |
| Not-for-profit Organizations | 889 | 11.7% |
| Local Government Employees | 544 | 7.2% |
| State Government Employees | 348 | 4.6% |
| Federal Government Employees | 142 | 1.9% |
| Unpaid Family Workers | 0 | 0.0% |
| Total | 7,585 | 100.0% |
Employment Status by Age in Indianola
According to the labor force statistics for Indianola, out of the total population over 16 years of age (12,498), 65.1% or 8,136 individuals are in the labor force, with 3.9% or 317 of them unemployed. The age group with the highest labor force participation rate is 25 to 29 years, with 91.1% or 816 individuals in the labor force. Within the labor force, the 16 to 19 years age range has the highest percentage of unemployed individuals, with 11.8% or 72 of them being unemployed.
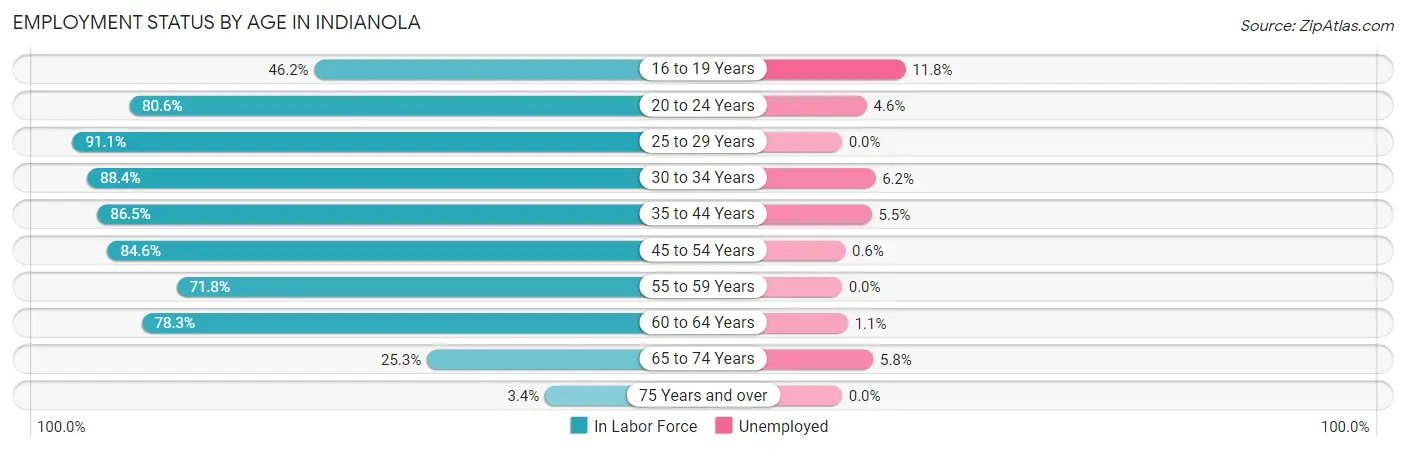
| Age Bracket | In Labor Force | Unemployed |
| 16 to 19 Years | 608 (46.2%) | 72 (11.8%) |
| 20 to 24 Years | 1,182 (80.6%) | 54 (4.6%) |
| 25 to 29 Years | 816 (91.1%) | 0 (0.0%) |
| 30 to 34 Years | 865 (88.4%) | 54 (6.2%) |
| 35 to 44 Years | 1,833 (86.5%) | 101 (5.5%) |
| 45 to 54 Years | 1,273 (84.6%) | 8 (0.6%) |
| 55 to 59 Years | 495 (71.8%) | 0 (0.0%) |
| 60 to 64 Years | 634 (78.3%) | 7 (1.1%) |
| 65 to 74 Years | 396 (25.3%) | 23 (5.8%) |
| 75 Years and over | 39 (3.4%) | 0 (0.0%) |
| Total | 8,136 (65.1%) | 317 (3.9%) |
Employment Status by Educational Attainment in Indianola
According to labor force statistics for Indianola, 84.5% of individuals (5,913) out of the total population between 25 and 64 years of age (6,998) are in the labor force, with 2.9% or 171 of them being unemployed. The group with the highest labor force participation rate are those with the educational attainment of bachelor's degree or higher, with 90.9% or 2,143 individuals in the labor force. Within the labor force, individuals with less than high school education have the highest percentage of unemployment, with 20.4% or 28 of them being unemployed.
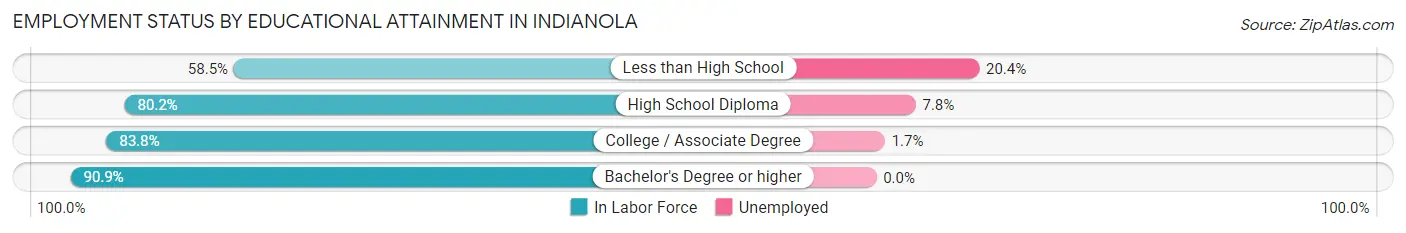
| Educational Attainment | In Labor Force | Unemployed |
| Less than High School | 137 (58.5%) | 48 (20.4%) |
| High School Diploma | 1,291 (80.2%) | 126 (7.8%) |
| College / Associate Degree | 2,344 (83.8%) | 48 (1.7%) |
| Bachelor's Degree or higher | 2,143 (90.9%) | 0 (0.0%) |
| Total | 5,913 (84.5%) | 203 (2.9%) |
Employment Occupations by Sex in Indianola
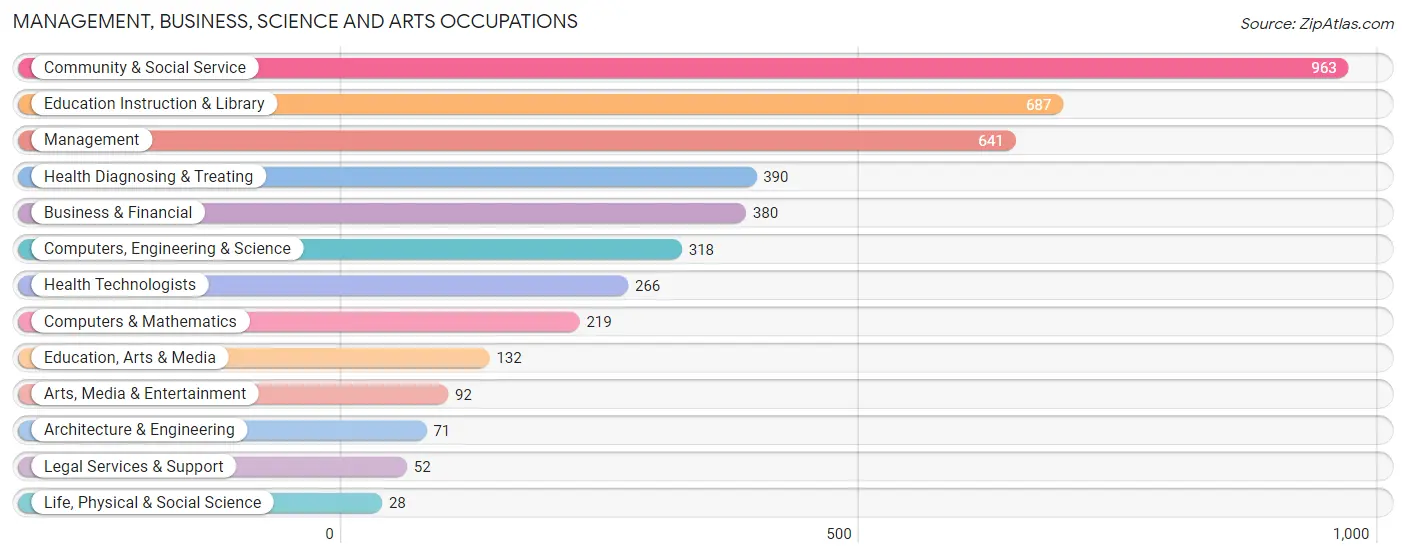
Management, Business, Science and Arts Occupations
The most common Management, Business, Science and Arts occupations in Indianola are Community & Social Service (963 | 12.3%), Education Instruction & Library (687 | 8.8%), Management (641 | 8.2%), Health Diagnosing & Treating (390 | 5.0%), and Business & Financial (380 | 4.9%).
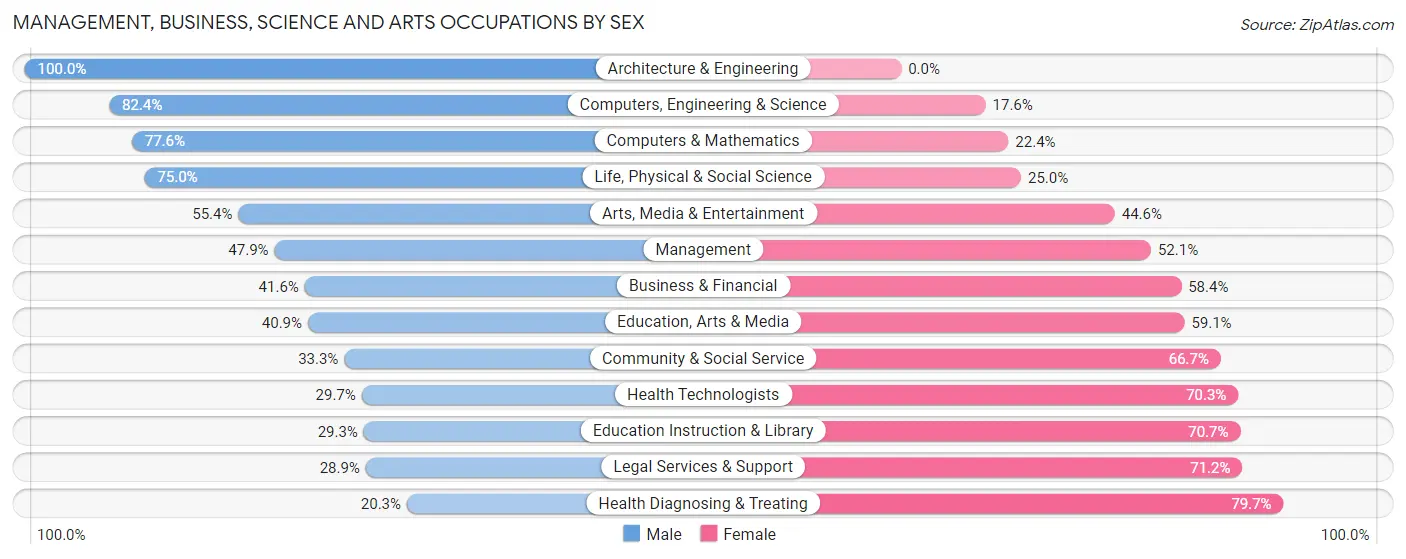
Management, Business, Science and Arts Occupations by Sex
Within the Management, Business, Science and Arts occupations in Indianola, the most male-oriented occupations are Architecture & Engineering (100.0%), Computers, Engineering & Science (82.4%), and Computers & Mathematics (77.6%), while the most female-oriented occupations are Health Diagnosing & Treating (79.7%), Legal Services & Support (71.2%), and Education Instruction & Library (70.7%).
| Occupation | Male | Female |
| Management | 307 (47.9%) | 334 (52.1%) |
| Business & Financial | 158 (41.6%) | 222 (58.4%) |
| Computers, Engineering & Science | 262 (82.4%) | 56 (17.6%) |
| Computers & Mathematics | 170 (77.6%) | 49 (22.4%) |
| Architecture & Engineering | 71 (100.0%) | 0 (0.0%) |
| Life, Physical & Social Science | 21 (75.0%) | 7 (25.0%) |
| Community & Social Service | 321 (33.3%) | 642 (66.7%) |
| Education, Arts & Media | 54 (40.9%) | 78 (59.1%) |
| Legal Services & Support | 15 (28.8%) | 37 (71.2%) |
| Education Instruction & Library | 201 (29.3%) | 486 (70.7%) |
| Arts, Media & Entertainment | 51 (55.4%) | 41 (44.6%) |
| Health Diagnosing & Treating | 79 (20.3%) | 311 (79.7%) |
| Health Technologists | 79 (29.7%) | 187 (70.3%) |
| Total (Category) | 1,127 (41.9%) | 1,565 (58.1%) |
| Total (Overall) | 3,972 (50.9%) | 3,833 (49.1%) |
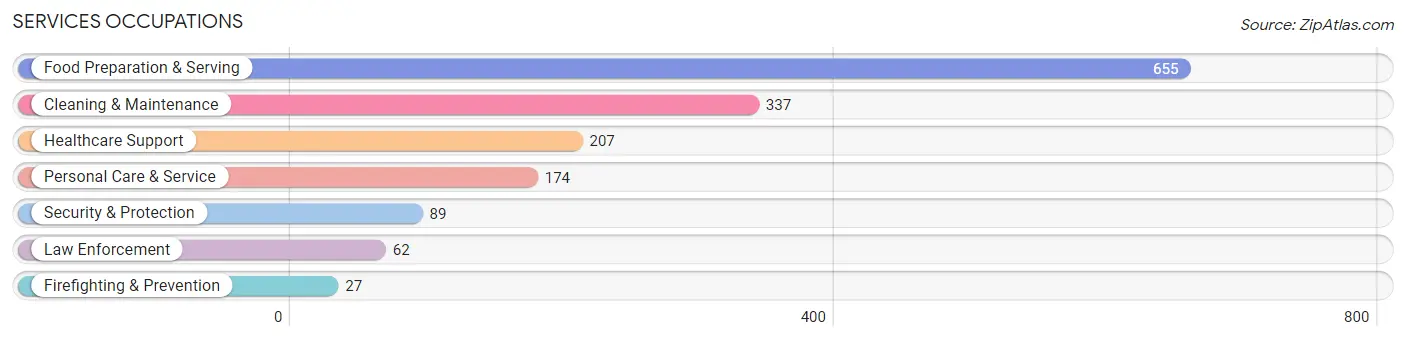
Services Occupations
The most common Services occupations in Indianola are Food Preparation & Serving (655 | 8.4%), Cleaning & Maintenance (337 | 4.3%), Healthcare Support (207 | 2.6%), Personal Care & Service (174 | 2.2%), and Security & Protection (89 | 1.1%).
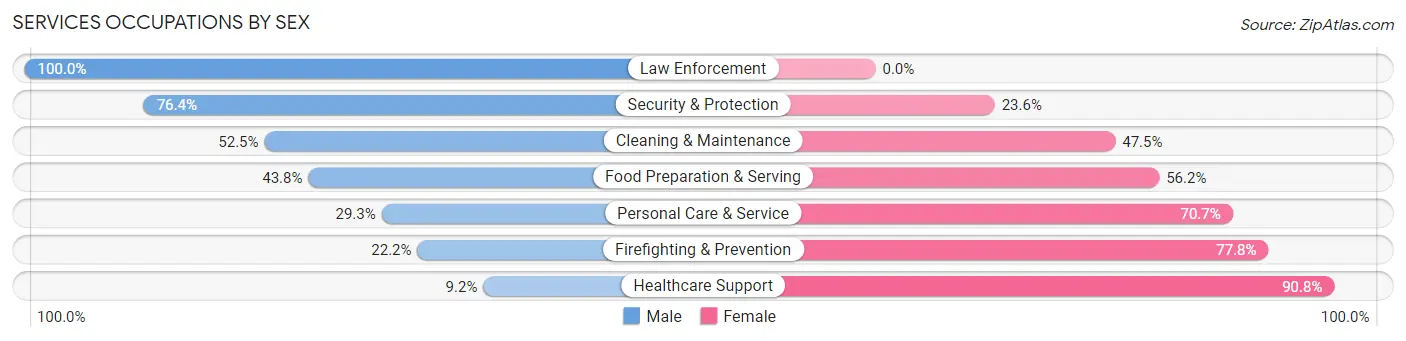
Services Occupations by Sex
Within the Services occupations in Indianola, the most male-oriented occupations are Law Enforcement (100.0%), Security & Protection (76.4%), and Cleaning & Maintenance (52.5%), while the most female-oriented occupations are Healthcare Support (90.8%), Firefighting & Prevention (77.8%), and Personal Care & Service (70.7%).
| Occupation | Male | Female |
| Healthcare Support | 19 (9.2%) | 188 (90.8%) |
| Security & Protection | 68 (76.4%) | 21 (23.6%) |
| Firefighting & Prevention | 6 (22.2%) | 21 (77.8%) |
| Law Enforcement | 62 (100.0%) | 0 (0.0%) |
| Food Preparation & Serving | 287 (43.8%) | 368 (56.2%) |
| Cleaning & Maintenance | 177 (52.5%) | 160 (47.5%) |
| Personal Care & Service | 51 (29.3%) | 123 (70.7%) |
| Total (Category) | 602 (41.2%) | 860 (58.8%) |
| Total (Overall) | 3,972 (50.9%) | 3,833 (49.1%) |
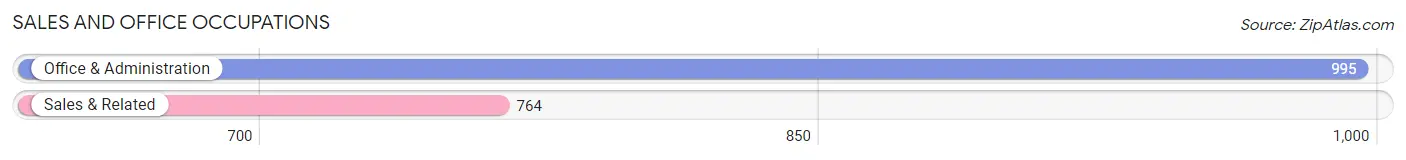
Sales and Office Occupations
The most common Sales and Office occupations in Indianola are Office & Administration (995 | 12.8%), and Sales & Related (764 | 9.8%).
Sales and Office Occupations by Sex
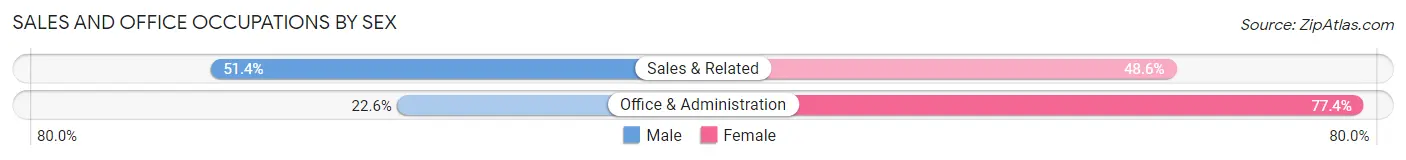
| Occupation | Male | Female |
| Sales & Related | 393 (51.4%) | 371 (48.6%) |
| Office & Administration | 225 (22.6%) | 770 (77.4%) |
| Total (Category) | 618 (35.1%) | 1,141 (64.9%) |
| Total (Overall) | 3,972 (50.9%) | 3,833 (49.1%) |
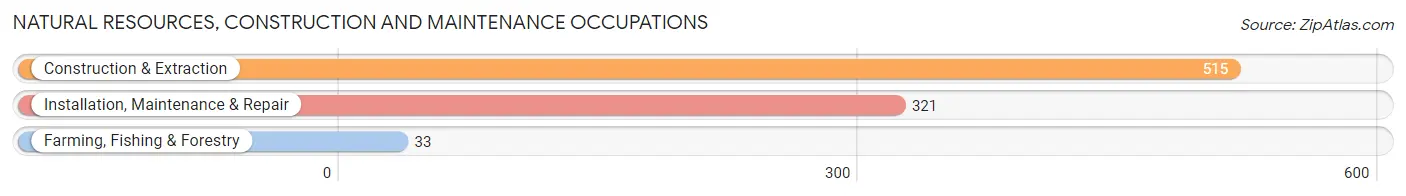
Natural Resources, Construction and Maintenance Occupations
The most common Natural Resources, Construction and Maintenance occupations in Indianola are Construction & Extraction (515 | 6.6%), Installation, Maintenance & Repair (321 | 4.1%), and Farming, Fishing & Forestry (33 | 0.4%).
Natural Resources, Construction and Maintenance Occupations by Sex
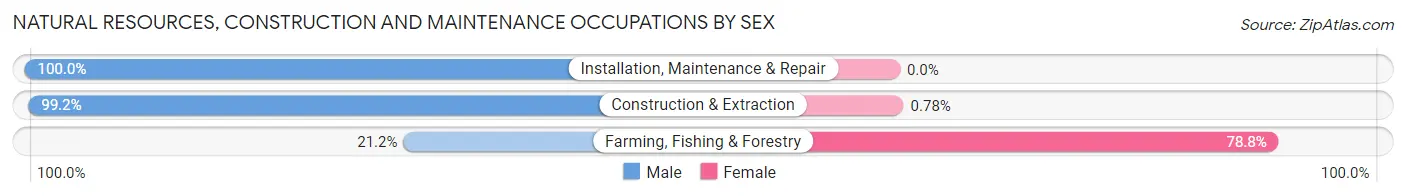
| Occupation | Male | Female |
| Farming, Fishing & Forestry | 7 (21.2%) | 26 (78.8%) |
| Construction & Extraction | 511 (99.2%) | 4 (0.8%) |
| Installation, Maintenance & Repair | 321 (100.0%) | 0 (0.0%) |
| Total (Category) | 839 (96.6%) | 30 (3.5%) |
| Total (Overall) | 3,972 (50.9%) | 3,833 (49.1%) |
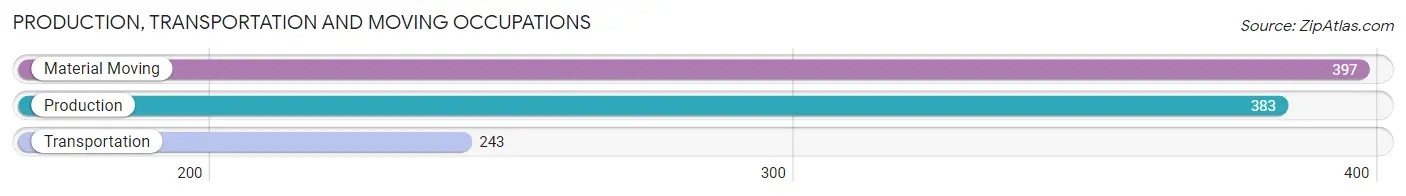
Production, Transportation and Moving Occupations
The most common Production, Transportation and Moving occupations in Indianola are Material Moving (397 | 5.1%), Production (383 | 4.9%), and Transportation (243 | 3.1%).
Production, Transportation and Moving Occupations by Sex
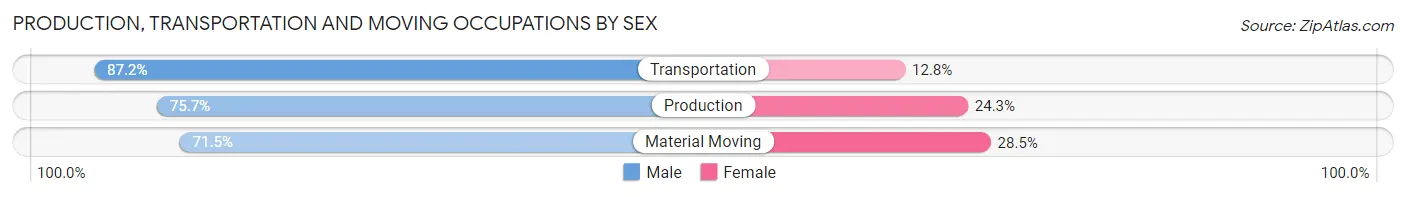
| Occupation | Male | Female |
| Production | 290 (75.7%) | 93 (24.3%) |
| Transportation | 212 (87.2%) | 31 (12.8%) |
| Material Moving | 284 (71.5%) | 113 (28.5%) |
| Total (Category) | 786 (76.8%) | 237 (23.2%) |
| Total (Overall) | 3,972 (50.9%) | 3,833 (49.1%) |
Employment Industries by Sex in Indianola
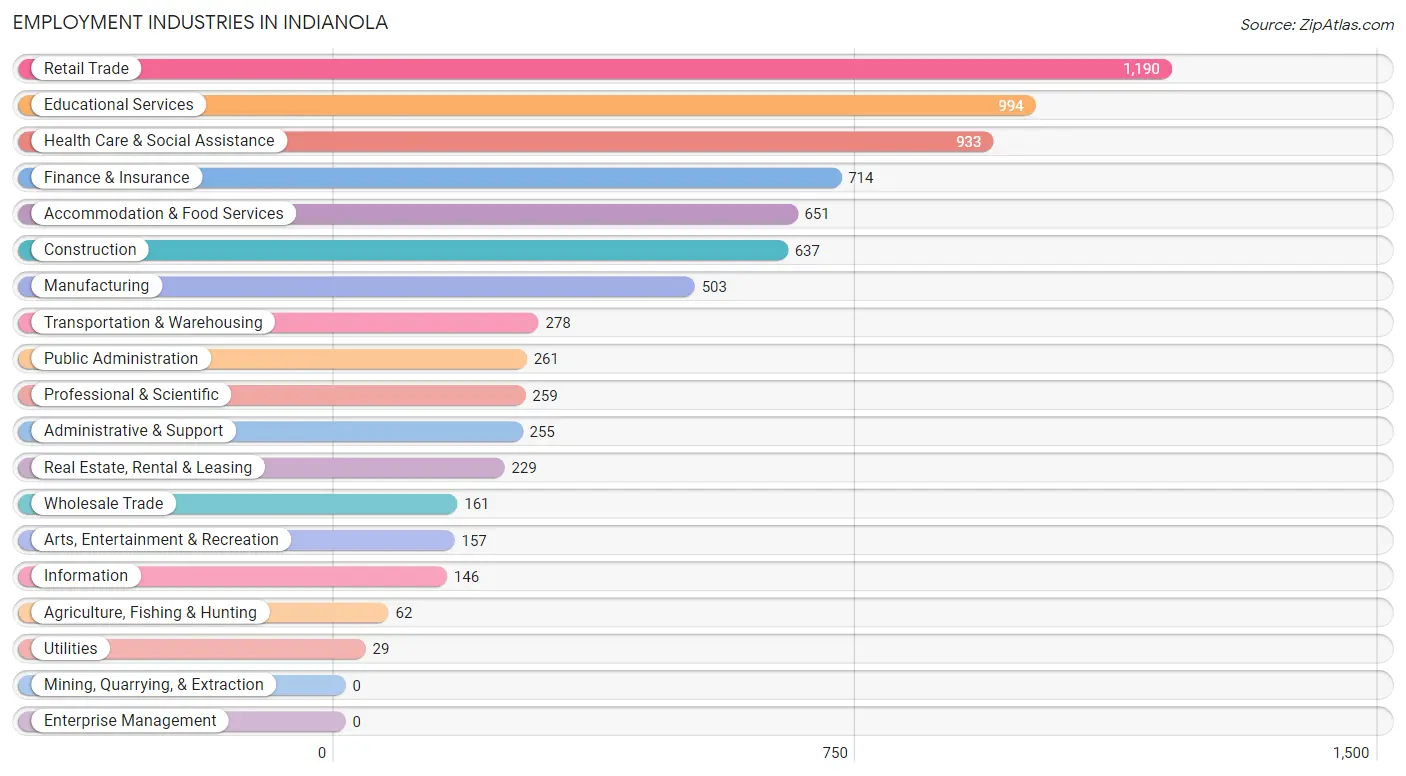
Employment Industries in Indianola
The major employment industries in Indianola include Retail Trade (1,190 | 15.2%), Educational Services (994 | 12.7%), Health Care & Social Assistance (933 | 11.9%), Finance & Insurance (714 | 9.1%), and Accommodation & Food Services (651 | 8.3%).
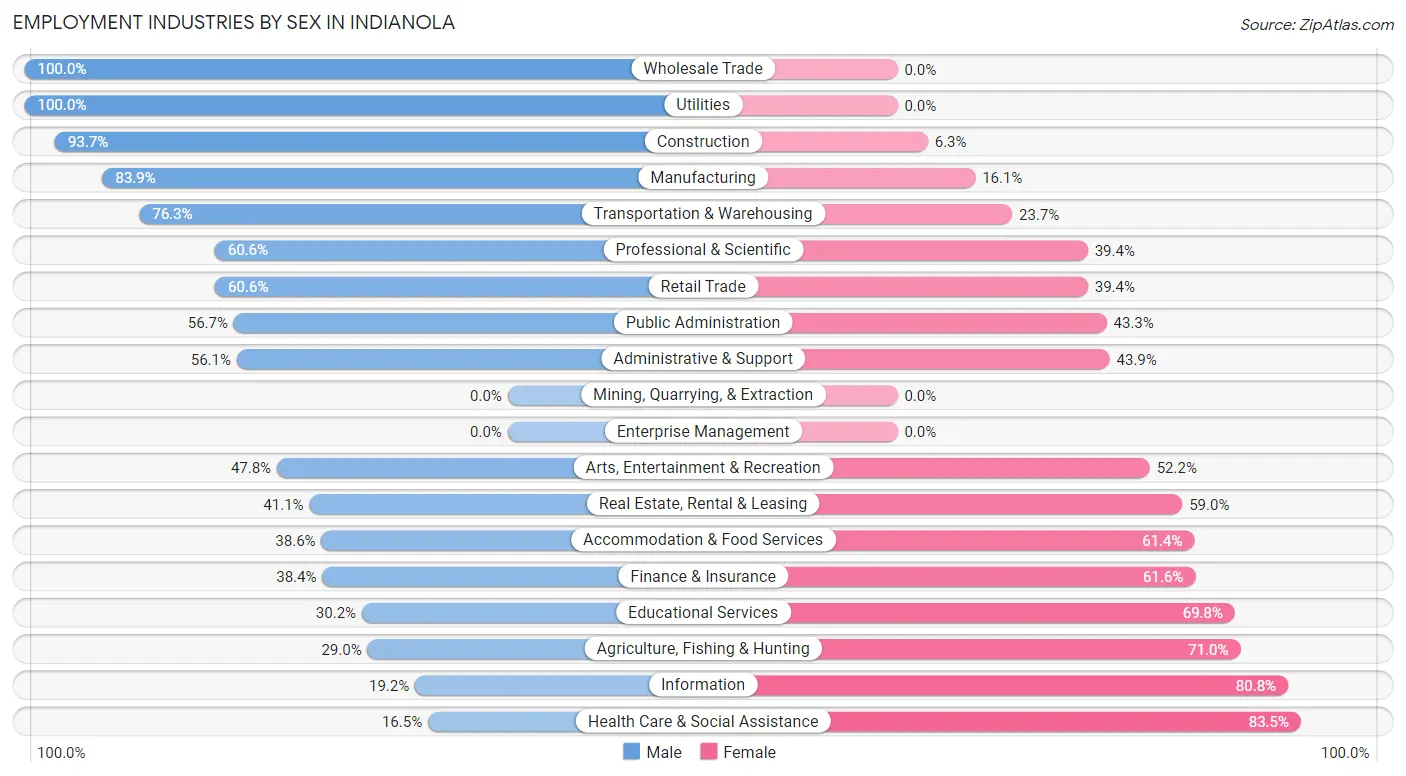
Employment Industries by Sex in Indianola
The Indianola industries that see more men than women are Wholesale Trade (100.0%), Utilities (100.0%), and Construction (93.7%), whereas the industries that tend to have a higher number of women are Health Care & Social Assistance (83.5%), Information (80.8%), and Agriculture, Fishing & Hunting (71.0%).
| Industry | Male | Female |
| Agriculture, Fishing & Hunting | 18 (29.0%) | 44 (71.0%) |
| Mining, Quarrying, & Extraction | 0 (0.0%) | 0 (0.0%) |
| Construction | 597 (93.7%) | 40 (6.3%) |
| Manufacturing | 422 (83.9%) | 81 (16.1%) |
| Wholesale Trade | 161 (100.0%) | 0 (0.0%) |
| Retail Trade | 721 (60.6%) | 469 (39.4%) |
| Transportation & Warehousing | 212 (76.3%) | 66 (23.7%) |
| Utilities | 29 (100.0%) | 0 (0.0%) |
| Information | 28 (19.2%) | 118 (80.8%) |
| Finance & Insurance | 274 (38.4%) | 440 (61.6%) |
| Real Estate, Rental & Leasing | 94 (41.0%) | 135 (59.0%) |
| Professional & Scientific | 157 (60.6%) | 102 (39.4%) |
| Enterprise Management | 0 (0.0%) | 0 (0.0%) |
| Administrative & Support | 143 (56.1%) | 112 (43.9%) |
| Educational Services | 300 (30.2%) | 694 (69.8%) |
| Health Care & Social Assistance | 154 (16.5%) | 779 (83.5%) |
| Arts, Entertainment & Recreation | 75 (47.8%) | 82 (52.2%) |
| Accommodation & Food Services | 251 (38.6%) | 400 (61.4%) |
| Public Administration | 148 (56.7%) | 113 (43.3%) |
| Total | 3,972 (50.9%) | 3,833 (49.1%) |
Education in Indianola
School Enrollment in Indianola
The most common levels of schooling among the 4,551 students in Indianola are college / undergraduate (1,474 | 32.4%), elementary school (939 | 20.6%), and middle school (885 | 19.5%).
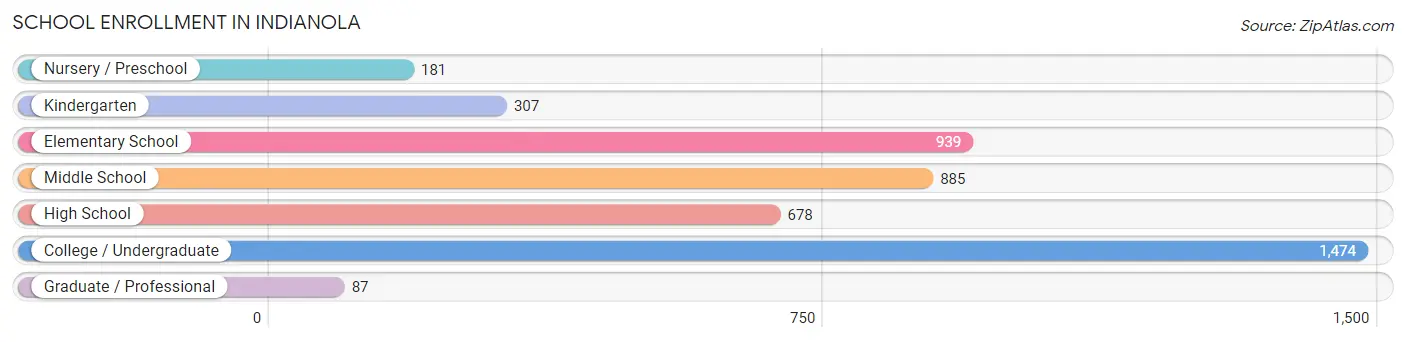
| School Level | # Students | % Students |
| Nursery / Preschool | 181 | 4.0% |
| Kindergarten | 307 | 6.8% |
| Elementary School | 939 | 20.6% |
| Middle School | 885 | 19.5% |
| High School | 678 | 14.9% |
| College / Undergraduate | 1,474 | 32.4% |
| Graduate / Professional | 87 | 1.9% |
| Total | 4,551 | 100.0% |
School Enrollment by Age by Funding Source in Indianola
Out of a total of 4,551 students who are enrolled in schools in Indianola, 1,484 (32.6%) attend a private institution, while the remaining 3,067 (67.4%) are enrolled in public schools. The age group of 20 to 24 year olds has the highest likelihood of being enrolled in private schools, with 508 (80.8% in the age bracket) enrolled. Conversely, the age group of 10 to 14 year olds has the lowest likelihood of being enrolled in a private school, with 1,008 (94.7% in the age bracket) attending a public institution.
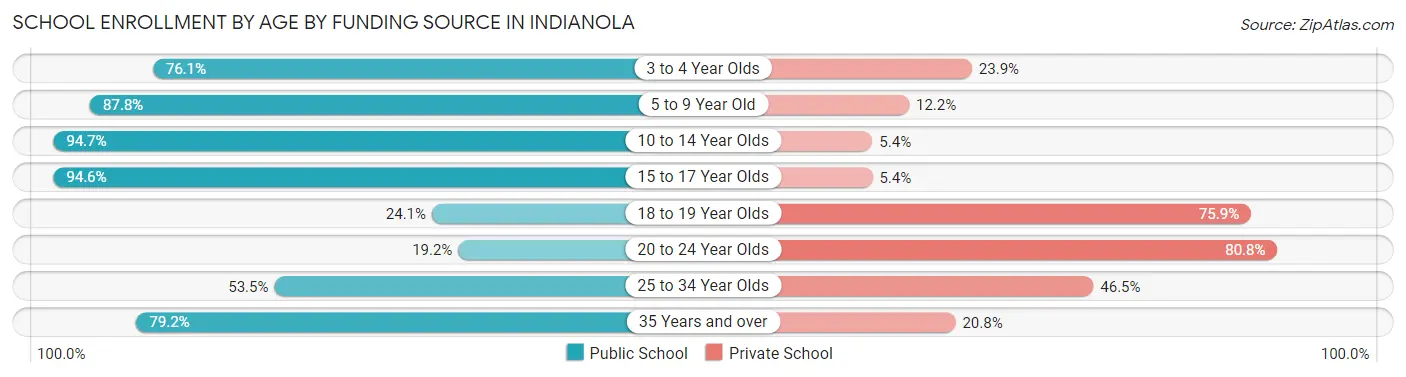
| Age Bracket | Public School | Private School |
| 3 to 4 Year Olds | 86 (76.1%) | 27 (23.9%) |
| 5 to 9 Year Old | 1,061 (87.8%) | 147 (12.2%) |
| 10 to 14 Year Olds | 1,008 (94.7%) | 57 (5.3%) |
| 15 to 17 Year Olds | 477 (94.6%) | 27 (5.4%) |
| 18 to 19 Year Olds | 211 (24.1%) | 663 (75.9%) |
| 20 to 24 Year Olds | 121 (19.2%) | 508 (80.8%) |
| 25 to 34 Year Olds | 46 (53.5%) | 40 (46.5%) |
| 35 Years and over | 57 (79.2%) | 15 (20.8%) |
| Total | 3,067 (67.4%) | 1,484 (32.6%) |
Educational Attainment by Field of Study in Indianola
Business (793 | 22.4%), education (658 | 18.6%), bio, nature & agricultural (268 | 7.6%), science & technology (260 | 7.3%), and arts & humanities (250 | 7.1%) are the most common fields of study among 3,542 individuals in Indianola who have obtained a bachelor's degree or higher.
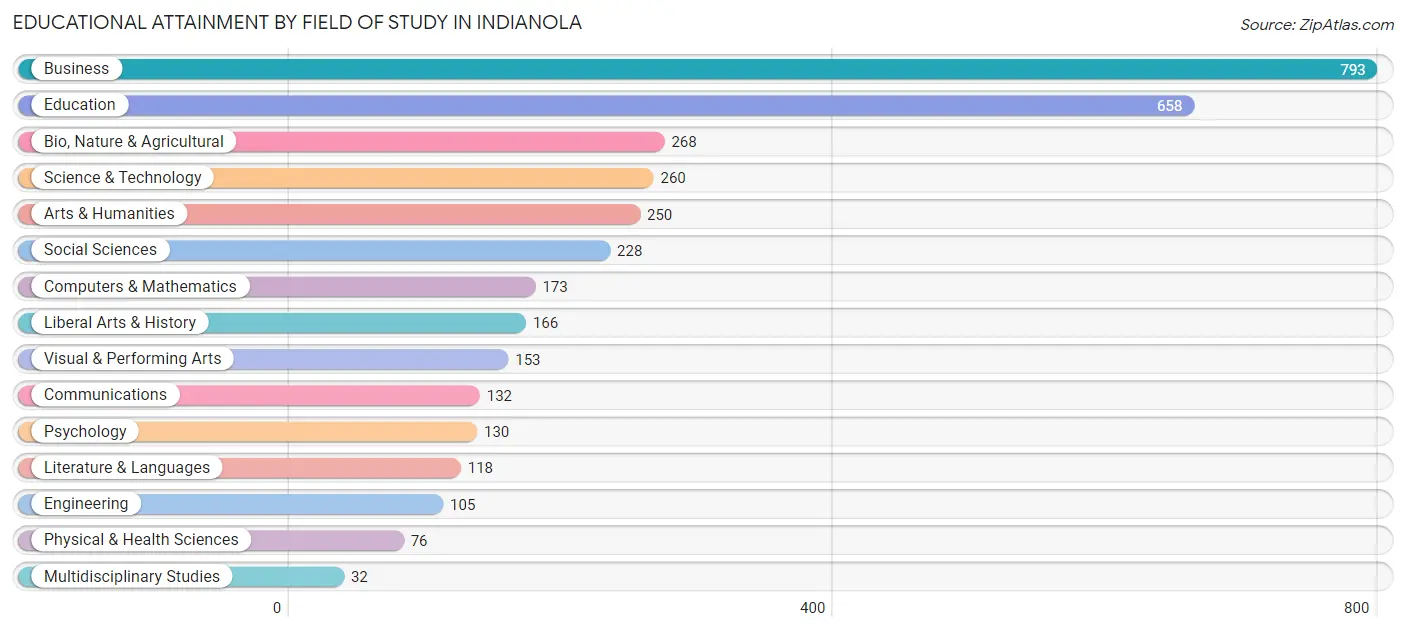
| Field of Study | # Graduates | % Graduates |
| Computers & Mathematics | 173 | 4.9% |
| Bio, Nature & Agricultural | 268 | 7.6% |
| Physical & Health Sciences | 76 | 2.1% |
| Psychology | 130 | 3.7% |
| Social Sciences | 228 | 6.4% |
| Engineering | 105 | 3.0% |
| Multidisciplinary Studies | 32 | 0.9% |
| Science & Technology | 260 | 7.3% |
| Business | 793 | 22.4% |
| Education | 658 | 18.6% |
| Literature & Languages | 118 | 3.3% |
| Liberal Arts & History | 166 | 4.7% |
| Visual & Performing Arts | 153 | 4.3% |
| Communications | 132 | 3.7% |
| Arts & Humanities | 250 | 7.1% |
| Total | 3,542 | 100.0% |
Transportation & Commute in Indianola
Vehicle Availability by Sex in Indianola
The most prevalent vehicle ownership categories in Indianola are males with 2 vehicles (1,576, accounting for 42.1%) and females with 2 vehicles (1,383, making up 48.7%).
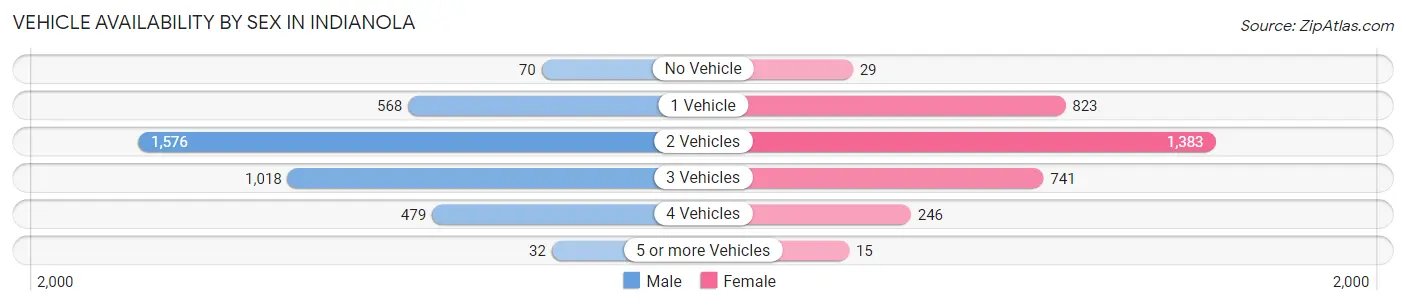
| Vehicles Available | Male | Female |
| No Vehicle | 70 (1.9%) | 29 (0.9%) |
| 1 Vehicle | 568 (15.2%) | 823 (25.4%) |
| 2 Vehicles | 1,576 (42.1%) | 1,383 (42.7%) |
| 3 Vehicles | 1,018 (27.2%) | 741 (22.9%) |
| 4 Vehicles | 479 (12.8%) | 246 (7.6%) |
| 5 or more Vehicles | 32 (0.9%) | 15 (0.5%) |
| Total | 3,743 (100.0%) | 3,237 (100.0%) |
Commute Time in Indianola
The most frequently occuring commute durations in Indianola are 5 to 9 minutes (1,460 commuters, 21.4%), 30 to 34 minutes (1,433 commuters, 21.0%), and 10 to 14 minutes (883 commuters, 13.0%).
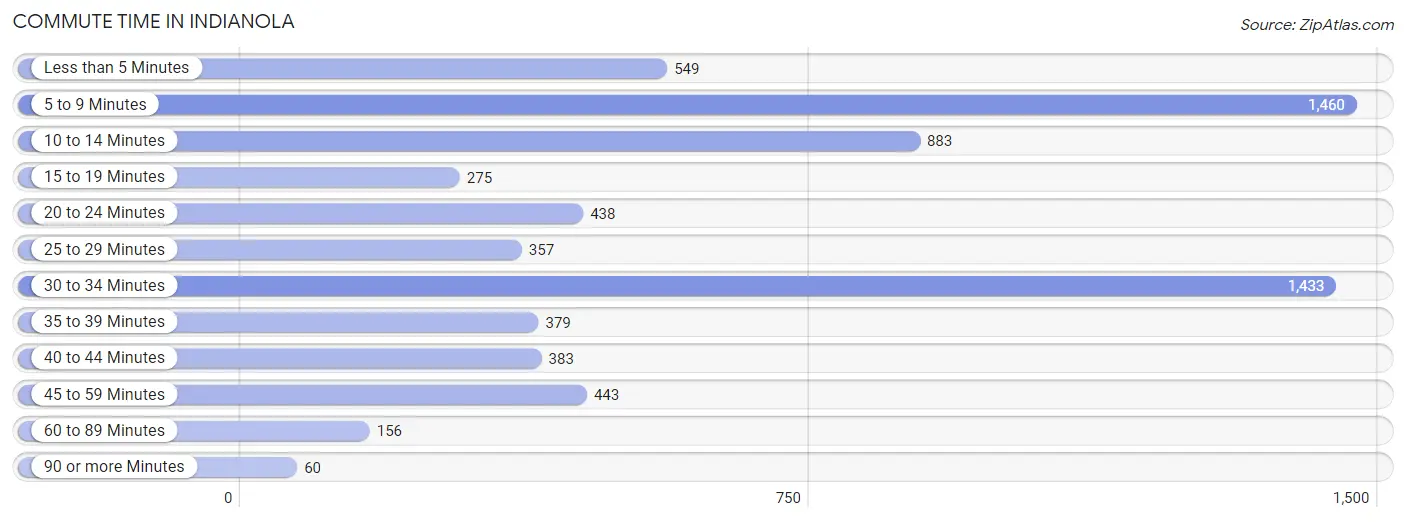
| Commute Time | # Commuters | % Commuters |
| Less than 5 Minutes | 549 | 8.1% |
| 5 to 9 Minutes | 1,460 | 21.4% |
| 10 to 14 Minutes | 883 | 13.0% |
| 15 to 19 Minutes | 275 | 4.0% |
| 20 to 24 Minutes | 438 | 6.4% |
| 25 to 29 Minutes | 357 | 5.2% |
| 30 to 34 Minutes | 1,433 | 21.0% |
| 35 to 39 Minutes | 379 | 5.6% |
| 40 to 44 Minutes | 383 | 5.6% |
| 45 to 59 Minutes | 443 | 6.5% |
| 60 to 89 Minutes | 156 | 2.3% |
| 90 or more Minutes | 60 | 0.9% |
Commute Time by Sex in Indianola
The most common commute times in Indianola are 30 to 34 minutes (889 commuters, 24.9%) for males and 5 to 9 minutes (906 commuters, 27.9%) for females.
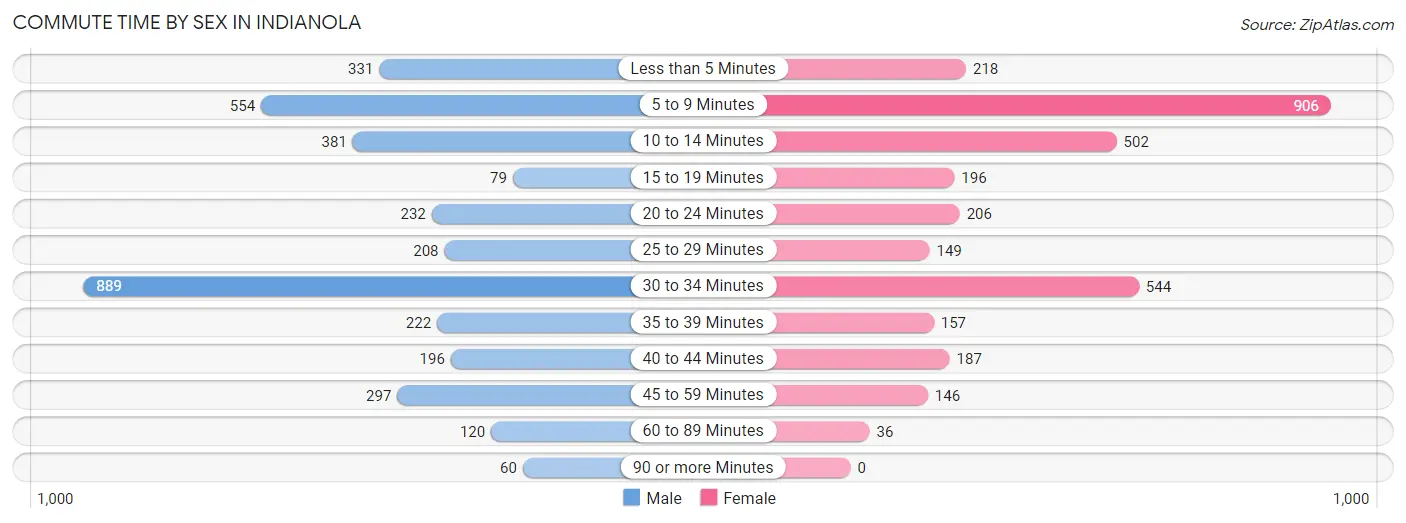
| Commute Time | Male | Female |
| Less than 5 Minutes | 331 (9.3%) | 218 (6.7%) |
| 5 to 9 Minutes | 554 (15.5%) | 906 (27.9%) |
| 10 to 14 Minutes | 381 (10.7%) | 502 (15.5%) |
| 15 to 19 Minutes | 79 (2.2%) | 196 (6.0%) |
| 20 to 24 Minutes | 232 (6.5%) | 206 (6.3%) |
| 25 to 29 Minutes | 208 (5.8%) | 149 (4.6%) |
| 30 to 34 Minutes | 889 (24.9%) | 544 (16.8%) |
| 35 to 39 Minutes | 222 (6.2%) | 157 (4.8%) |
| 40 to 44 Minutes | 196 (5.5%) | 187 (5.8%) |
| 45 to 59 Minutes | 297 (8.3%) | 146 (4.5%) |
| 60 to 89 Minutes | 120 (3.4%) | 36 (1.1%) |
| 90 or more Minutes | 60 (1.7%) | 0 (0.0%) |
Time of Departure to Work by Sex in Indianola
The most frequent times of departure to work in Indianola are 7:00 AM to 7:29 AM (565, 15.8%) for males and 7:30 AM to 7:59 AM (615, 18.9%) for females.
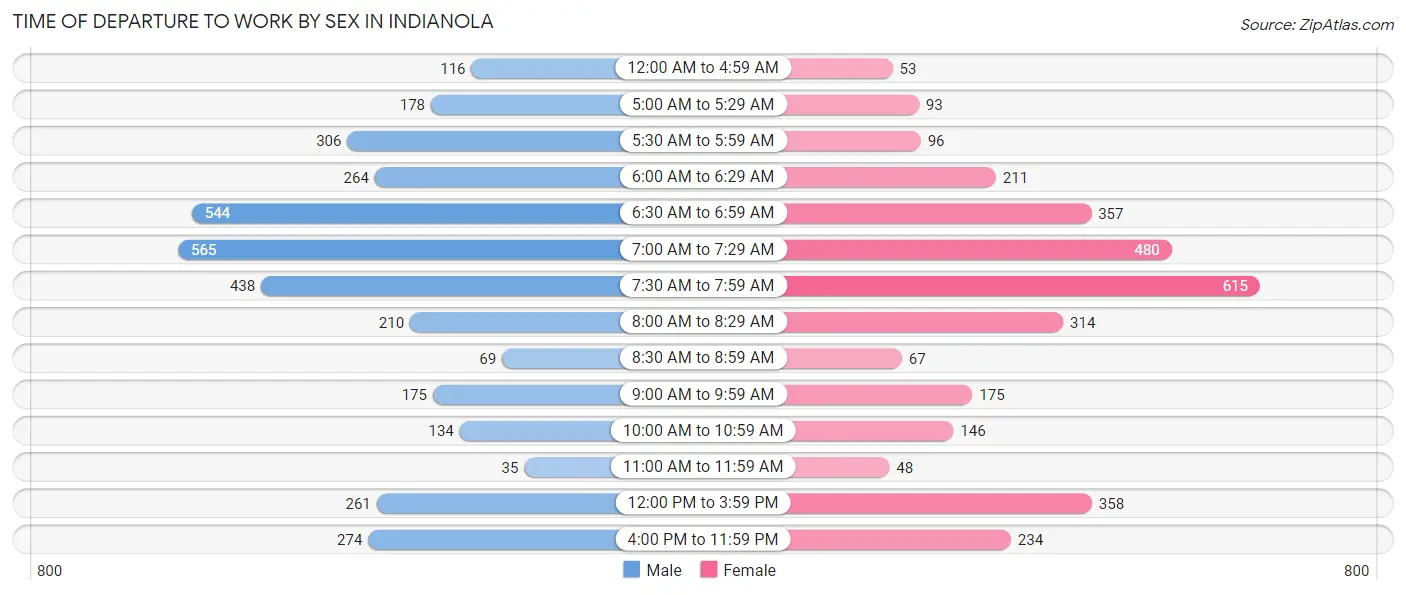
| Time of Departure | Male | Female |
| 12:00 AM to 4:59 AM | 116 (3.3%) | 53 (1.6%) |
| 5:00 AM to 5:29 AM | 178 (5.0%) | 93 (2.9%) |
| 5:30 AM to 5:59 AM | 306 (8.6%) | 96 (3.0%) |
| 6:00 AM to 6:29 AM | 264 (7.4%) | 211 (6.5%) |
| 6:30 AM to 6:59 AM | 544 (15.2%) | 357 (11.0%) |
| 7:00 AM to 7:29 AM | 565 (15.8%) | 480 (14.8%) |
| 7:30 AM to 7:59 AM | 438 (12.3%) | 615 (18.9%) |
| 8:00 AM to 8:29 AM | 210 (5.9%) | 314 (9.7%) |
| 8:30 AM to 8:59 AM | 69 (1.9%) | 67 (2.1%) |
| 9:00 AM to 9:59 AM | 175 (4.9%) | 175 (5.4%) |
| 10:00 AM to 10:59 AM | 134 (3.7%) | 146 (4.5%) |
| 11:00 AM to 11:59 AM | 35 (1.0%) | 48 (1.5%) |
| 12:00 PM to 3:59 PM | 261 (7.3%) | 358 (11.0%) |
| 4:00 PM to 11:59 PM | 274 (7.7%) | 234 (7.2%) |
| Total | 3,569 (100.0%) | 3,247 (100.0%) |
Housing Occupancy in Indianola
Occupancy by Ownership in Indianola
Of the total 5,944 dwellings in Indianola, owner-occupied units account for 3,969 (66.8%), while renter-occupied units make up 1,975 (33.2%).
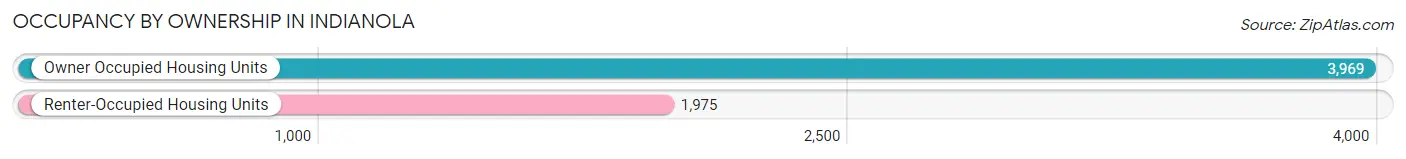
| Occupancy | # Housing Units | % Housing Units |
| Owner Occupied Housing Units | 3,969 | 66.8% |
| Renter-Occupied Housing Units | 1,975 | 33.2% |
| Total Occupied Housing Units | 5,944 | 100.0% |
Occupancy by Household Size in Indianola
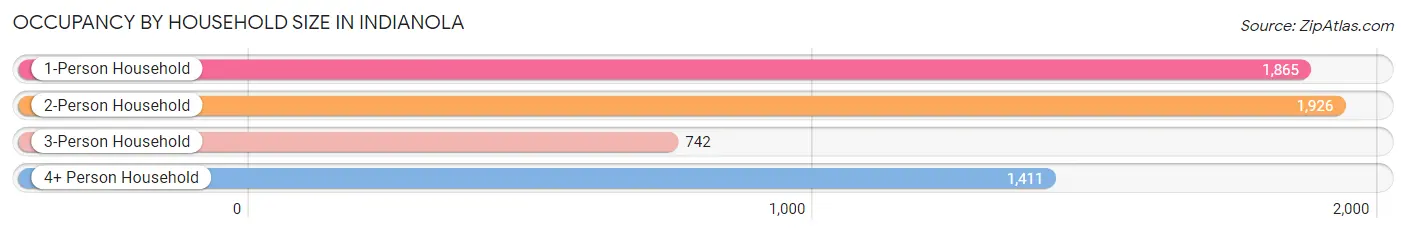
| Household Size | # Housing Units | % Housing Units |
| 1-Person Household | 1,865 | 31.4% |
| 2-Person Household | 1,926 | 32.4% |
| 3-Person Household | 742 | 12.5% |
| 4+ Person Household | 1,411 | 23.7% |
| Total Housing Units | 5,944 | 100.0% |
Occupancy by Ownership by Household Size in Indianola
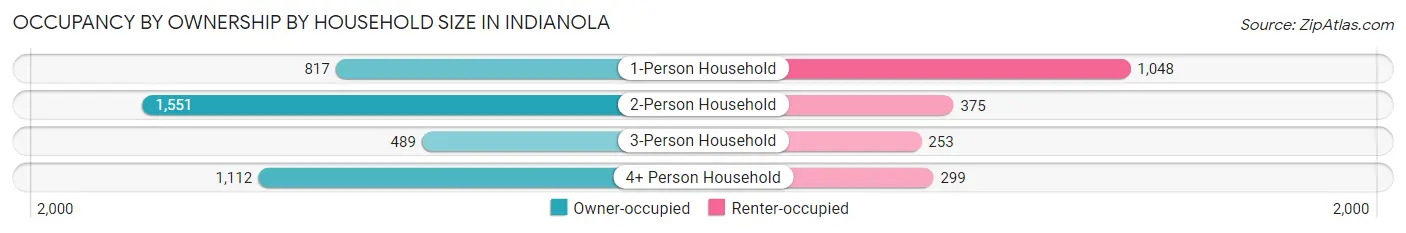
| Household Size | Owner-occupied | Renter-occupied |
| 1-Person Household | 817 (43.8%) | 1,048 (56.2%) |
| 2-Person Household | 1,551 (80.5%) | 375 (19.5%) |
| 3-Person Household | 489 (65.9%) | 253 (34.1%) |
| 4+ Person Household | 1,112 (78.8%) | 299 (21.2%) |
| Total Housing Units | 3,969 (66.8%) | 1,975 (33.2%) |
Occupancy by Educational Attainment in Indianola
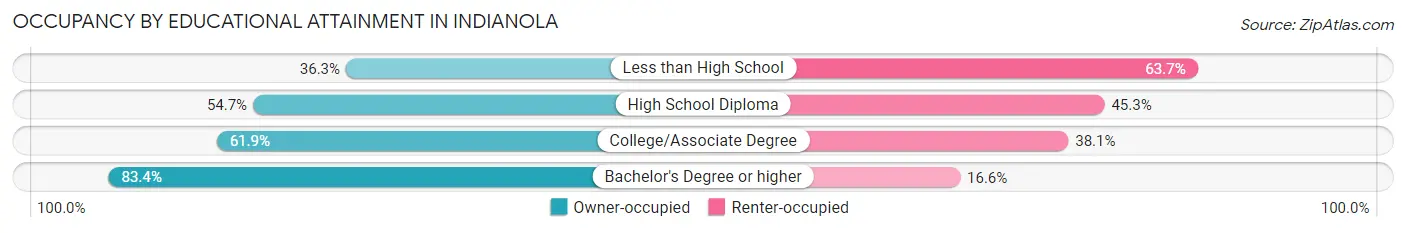
| Household Size | Owner-occupied | Renter-occupied |
| Less than High School | 53 (36.3%) | 93 (63.7%) |
| High School Diploma | 850 (54.7%) | 703 (45.3%) |
| College/Associate Degree | 1,363 (61.9%) | 839 (38.1%) |
| Bachelor's Degree or higher | 1,703 (83.4%) | 340 (16.6%) |
Occupancy by Age of Householder in Indianola
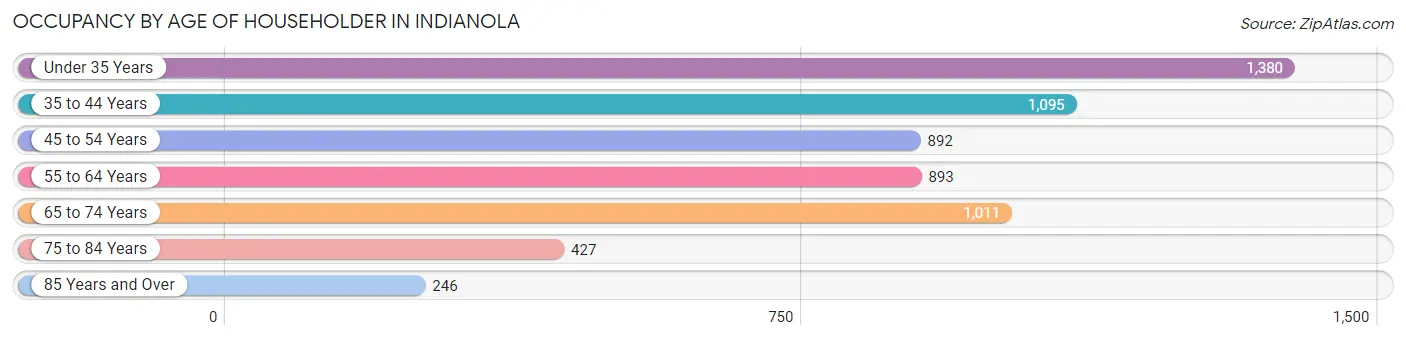
| Age Bracket | # Households | % Households |
| Under 35 Years | 1,380 | 23.2% |
| 35 to 44 Years | 1,095 | 18.4% |
| 45 to 54 Years | 892 | 15.0% |
| 55 to 64 Years | 893 | 15.0% |
| 65 to 74 Years | 1,011 | 17.0% |
| 75 to 84 Years | 427 | 7.2% |
| 85 Years and Over | 246 | 4.1% |
| Total | 5,944 | 100.0% |
Housing Finances in Indianola
Median Income by Occupancy in Indianola
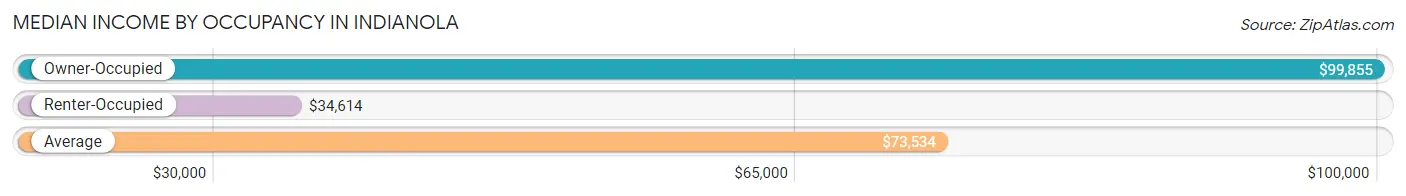
| Occupancy Type | # Households | Median Income |
| Owner-Occupied | 3,969 (66.8%) | $99,855 |
| Renter-Occupied | 1,975 (33.2%) | $34,614 |
| Average | 5,944 (100.0%) | $73,534 |
Occupancy by Householder Income Bracket in Indianola
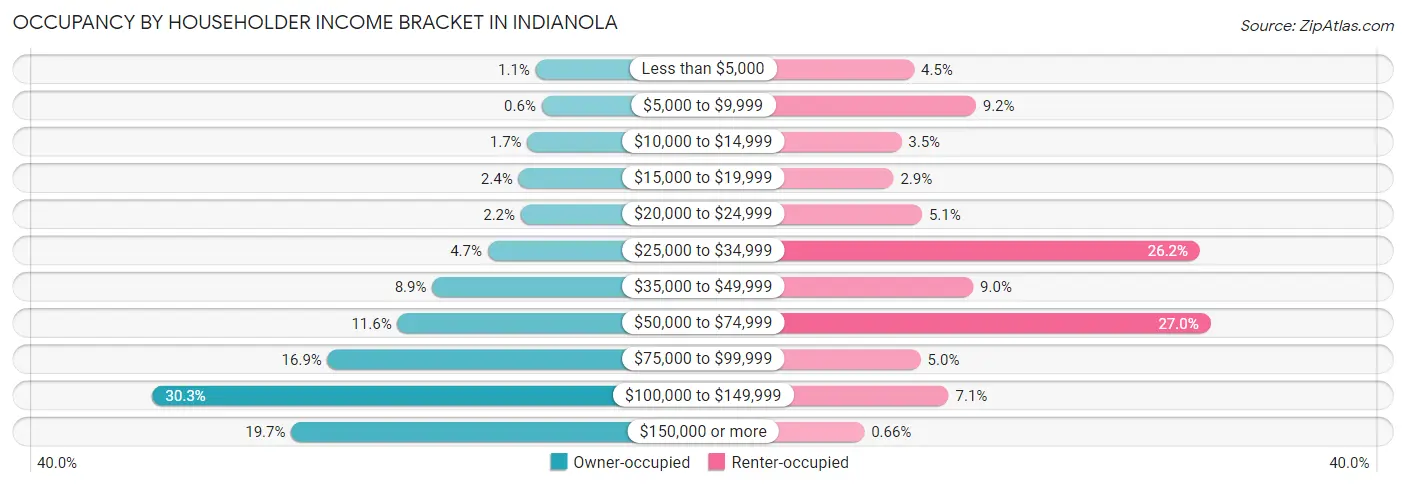
| Income Bracket | Owner-occupied | Renter-occupied |
| Less than $5,000 | 42 (1.1%) | 88 (4.5%) |
| $5,000 to $9,999 | 24 (0.6%) | 181 (9.2%) |
| $10,000 to $14,999 | 67 (1.7%) | 69 (3.5%) |
| $15,000 to $19,999 | 94 (2.4%) | 57 (2.9%) |
| $20,000 to $24,999 | 87 (2.2%) | 100 (5.1%) |
| $25,000 to $34,999 | 187 (4.7%) | 518 (26.2%) |
| $35,000 to $49,999 | 355 (8.9%) | 177 (9.0%) |
| $50,000 to $74,999 | 460 (11.6%) | 534 (27.0%) |
| $75,000 to $99,999 | 671 (16.9%) | 98 (5.0%) |
| $100,000 to $149,999 | 1,201 (30.3%) | 140 (7.1%) |
| $150,000 or more | 781 (19.7%) | 13 (0.7%) |
| Total | 3,969 (100.0%) | 1,975 (100.0%) |
Monthly Housing Cost Tiers in Indianola
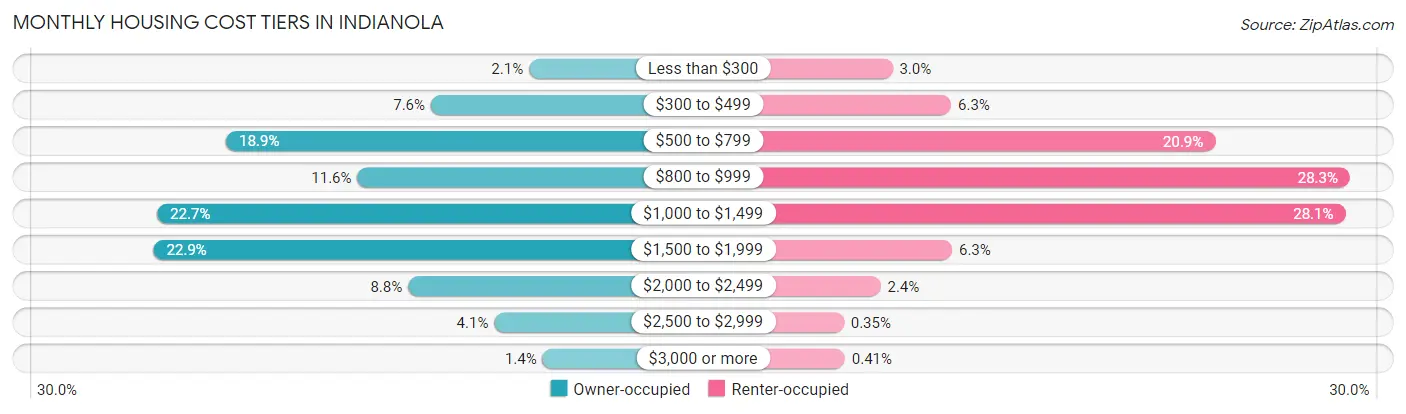
| Monthly Cost | Owner-occupied | Renter-occupied |
| Less than $300 | 85 (2.1%) | 60 (3.0%) |
| $300 to $499 | 300 (7.6%) | 124 (6.3%) |
| $500 to $799 | 749 (18.9%) | 412 (20.9%) |
| $800 to $999 | 461 (11.6%) | 559 (28.3%) |
| $1,000 to $1,499 | 900 (22.7%) | 554 (28.1%) |
| $1,500 to $1,999 | 908 (22.9%) | 125 (6.3%) |
| $2,000 to $2,499 | 350 (8.8%) | 47 (2.4%) |
| $2,500 to $2,999 | 161 (4.1%) | 7 (0.4%) |
| $3,000 or more | 55 (1.4%) | 8 (0.4%) |
| Total | 3,969 (100.0%) | 1,975 (100.0%) |
Physical Housing Characteristics in Indianola
Housing Structures in Indianola
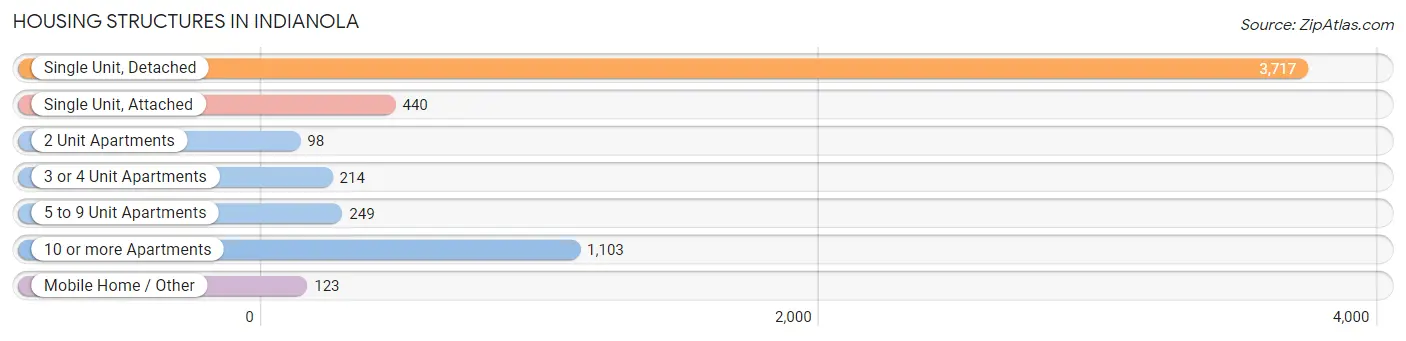
| Structure Type | # Housing Units | % Housing Units |
| Single Unit, Detached | 3,717 | 62.5% |
| Single Unit, Attached | 440 | 7.4% |
| 2 Unit Apartments | 98 | 1.7% |
| 3 or 4 Unit Apartments | 214 | 3.6% |
| 5 to 9 Unit Apartments | 249 | 4.2% |
| 10 or more Apartments | 1,103 | 18.6% |
| Mobile Home / Other | 123 | 2.1% |
| Total | 5,944 | 100.0% |
Housing Structures by Occupancy in Indianola
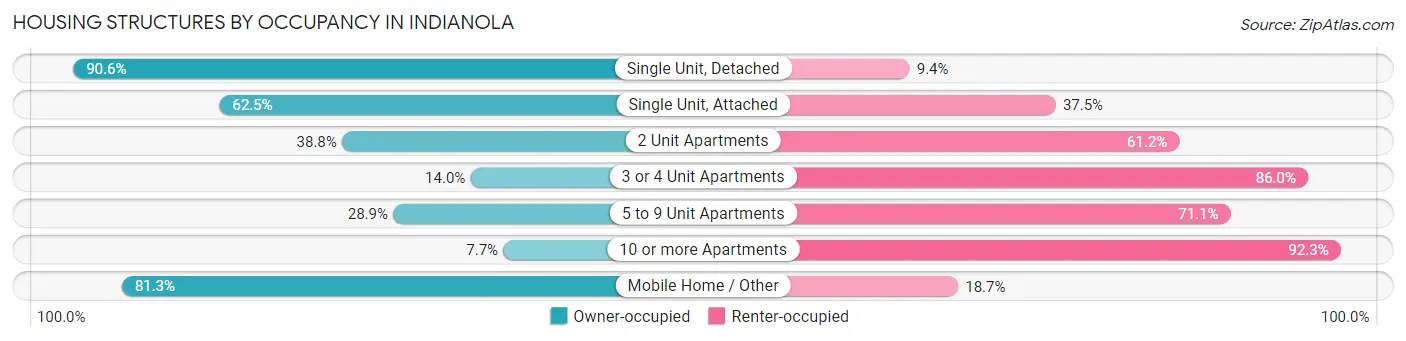
| Structure Type | Owner-occupied | Renter-occupied |
| Single Unit, Detached | 3,369 (90.6%) | 348 (9.4%) |
| Single Unit, Attached | 275 (62.5%) | 165 (37.5%) |
| 2 Unit Apartments | 38 (38.8%) | 60 (61.2%) |
| 3 or 4 Unit Apartments | 30 (14.0%) | 184 (86.0%) |
| 5 to 9 Unit Apartments | 72 (28.9%) | 177 (71.1%) |
| 10 or more Apartments | 85 (7.7%) | 1,018 (92.3%) |
| Mobile Home / Other | 100 (81.3%) | 23 (18.7%) |
| Total | 3,969 (66.8%) | 1,975 (33.2%) |
Housing Structures by Number of Rooms in Indianola
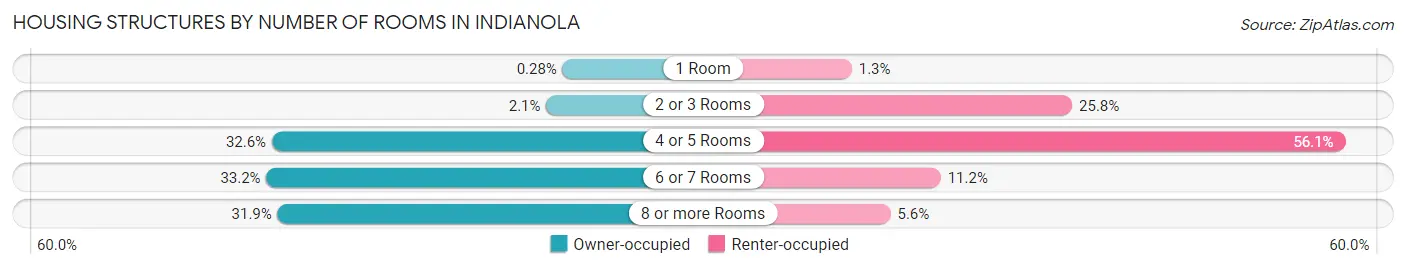
| Number of Rooms | Owner-occupied | Renter-occupied |
| 1 Room | 11 (0.3%) | 26 (1.3%) |
| 2 or 3 Rooms | 83 (2.1%) | 509 (25.8%) |
| 4 or 5 Rooms | 1,292 (32.6%) | 1,108 (56.1%) |
| 6 or 7 Rooms | 1,316 (33.2%) | 221 (11.2%) |
| 8 or more Rooms | 1,267 (31.9%) | 111 (5.6%) |
| Total | 3,969 (100.0%) | 1,975 (100.0%) |
Housing Structure by Heating Type in Indianola
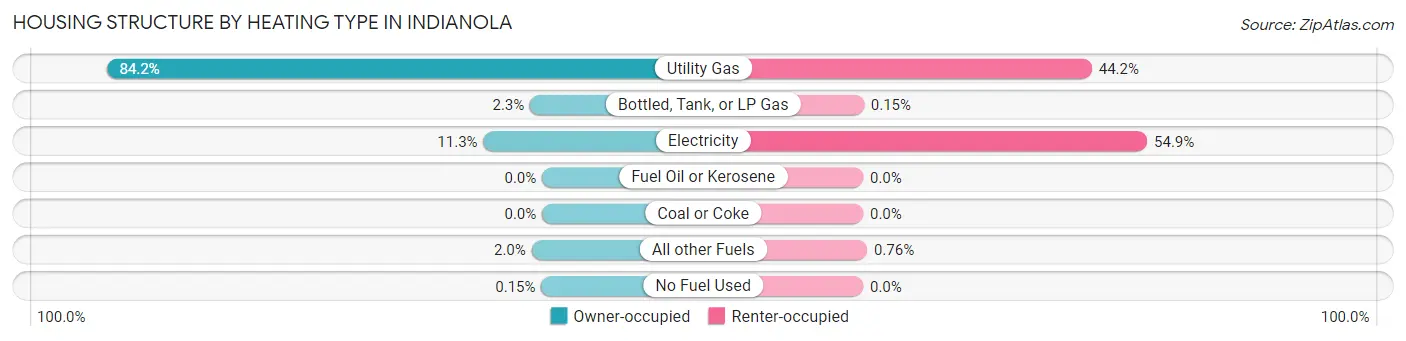
| Heating Type | Owner-occupied | Renter-occupied |
| Utility Gas | 3,341 (84.2%) | 873 (44.2%) |
| Bottled, Tank, or LP Gas | 92 (2.3%) | 3 (0.2%) |
| Electricity | 450 (11.3%) | 1,084 (54.9%) |
| Fuel Oil or Kerosene | 0 (0.0%) | 0 (0.0%) |
| Coal or Coke | 0 (0.0%) | 0 (0.0%) |
| All other Fuels | 80 (2.0%) | 15 (0.8%) |
| No Fuel Used | 6 (0.2%) | 0 (0.0%) |
| Total | 3,969 (100.0%) | 1,975 (100.0%) |
Household Vehicle Usage in Indianola
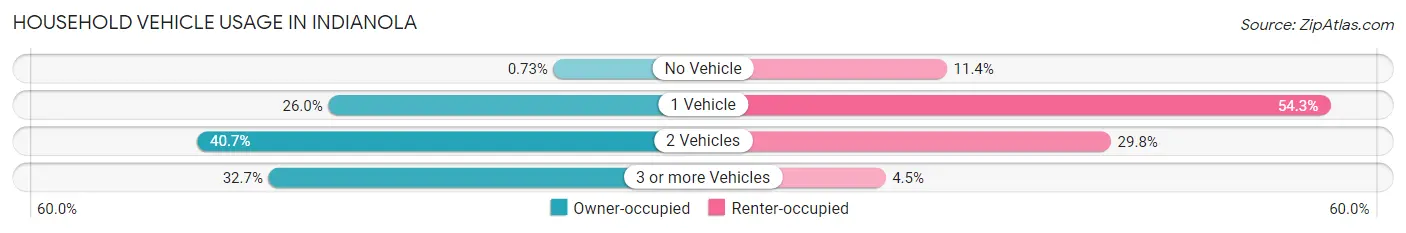
| Vehicles per Household | Owner-occupied | Renter-occupied |
| No Vehicle | 29 (0.7%) | 225 (11.4%) |
| 1 Vehicle | 1,030 (26.0%) | 1,073 (54.3%) |
| 2 Vehicles | 1,614 (40.7%) | 588 (29.8%) |
| 3 or more Vehicles | 1,296 (32.7%) | 89 (4.5%) |
| Total | 3,969 (100.0%) | 1,975 (100.0%) |
Real Estate & Mortgages in Indianola
Real Estate and Mortgage Overview in Indianola
| Characteristic | Without Mortgage | With Mortgage |
| Housing Units | 1,265 | 2,704 |
| Median Property Value | $208,400 | $205,000 |
| Median Household Income | $72,596 | $605 |
| Monthly Housing Costs | $606 | $43 |
| Real Estate Taxes | $3,489 | $44 |
Property Value by Mortgage Status in Indianola
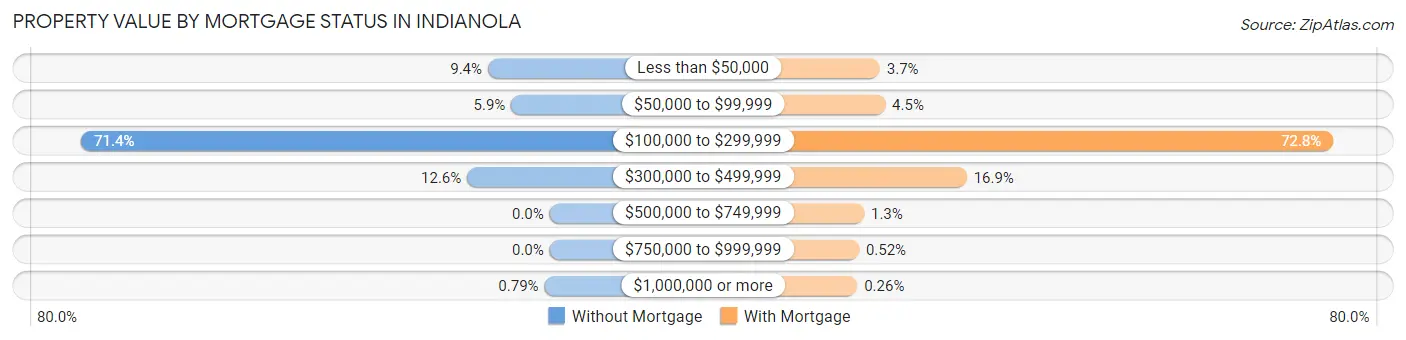
| Property Value | Without Mortgage | With Mortgage |
| Less than $50,000 | 119 (9.4%) | 100 (3.7%) |
| $50,000 to $99,999 | 74 (5.9%) | 122 (4.5%) |
| $100,000 to $299,999 | 903 (71.4%) | 1,968 (72.8%) |
| $300,000 to $499,999 | 159 (12.6%) | 458 (16.9%) |
| $500,000 to $749,999 | 0 (0.0%) | 35 (1.3%) |
| $750,000 to $999,999 | 0 (0.0%) | 14 (0.5%) |
| $1,000,000 or more | 10 (0.8%) | 7 (0.3%) |
| Total | 1,265 (100.0%) | 2,704 (100.0%) |
Household Income by Mortgage Status in Indianola
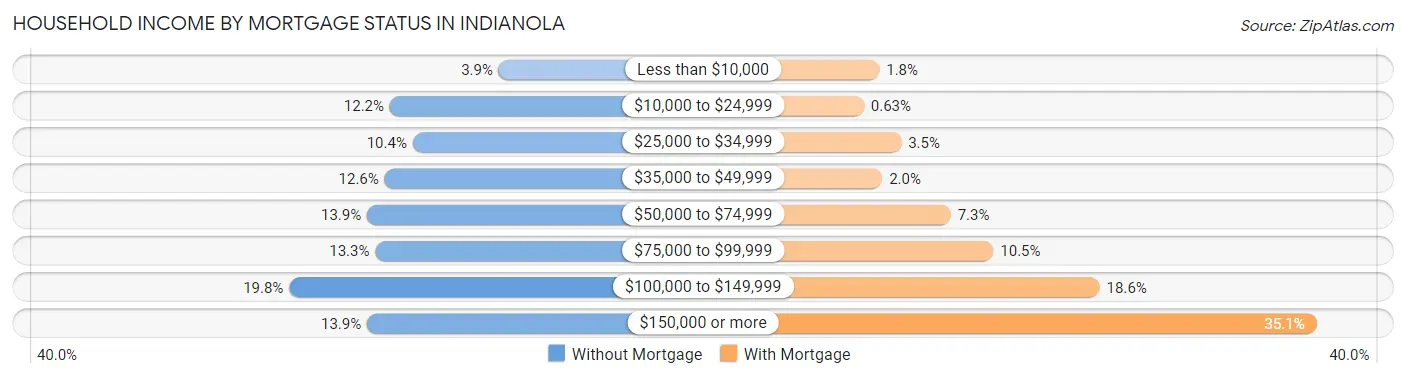
| Household Income | Without Mortgage | With Mortgage |
| Less than $10,000 | 49 (3.9%) | 49 (1.8%) |
| $10,000 to $24,999 | 154 (12.2%) | 17 (0.6%) |
| $25,000 to $34,999 | 132 (10.4%) | 94 (3.5%) |
| $35,000 to $49,999 | 159 (12.6%) | 55 (2.0%) |
| $50,000 to $74,999 | 176 (13.9%) | 196 (7.2%) |
| $75,000 to $99,999 | 168 (13.3%) | 284 (10.5%) |
| $100,000 to $149,999 | 251 (19.8%) | 503 (18.6%) |
| $150,000 or more | 176 (13.9%) | 950 (35.1%) |
| Total | 1,265 (100.0%) | 2,704 (100.0%) |
Property Value to Household Income Ratio in Indianola
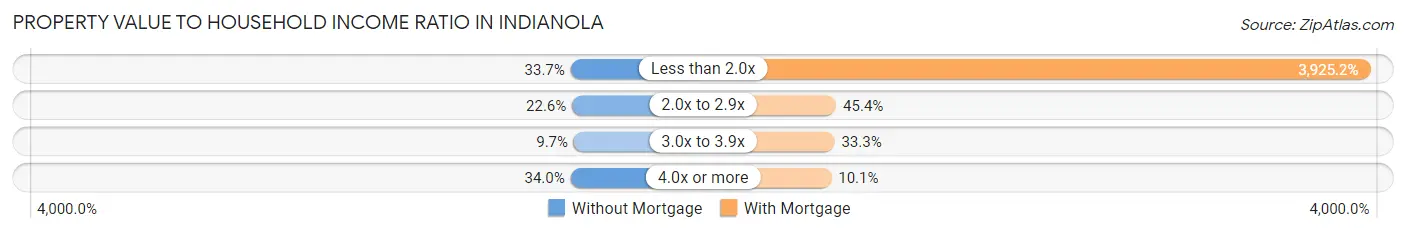
| Value-to-Income Ratio | Without Mortgage | With Mortgage |
| Less than 2.0x | 426 (33.7%) | 106,136 (3,925.2%) |
| 2.0x to 2.9x | 286 (22.6%) | 1,227 (45.4%) |
| 3.0x to 3.9x | 123 (9.7%) | 900 (33.3%) |
| 4.0x or more | 430 (34.0%) | 272 (10.1%) |
| Total | 1,265 (100.0%) | 2,704 (100.0%) |
Real Estate Taxes by Mortgage Status in Indianola
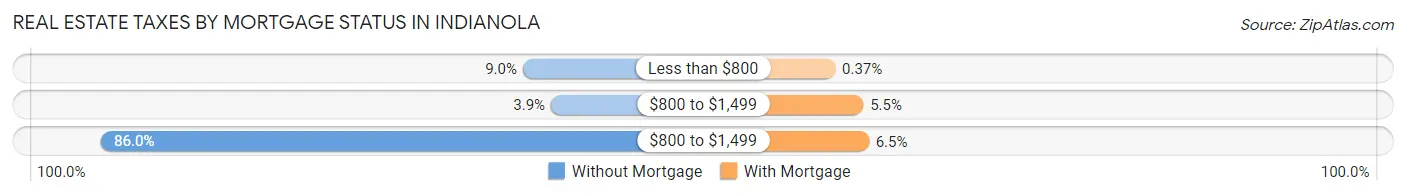
| Property Taxes | Without Mortgage | With Mortgage |
| Less than $800 | 114 (9.0%) | 10 (0.4%) |
| $800 to $1,499 | 49 (3.9%) | 149 (5.5%) |
| $800 to $1,499 | 1,088 (86.0%) | 176 (6.5%) |
| Total | 1,265 (100.0%) | 2,704 (100.0%) |
Health & Disability in Indianola
Health Insurance Coverage by Age in Indianola
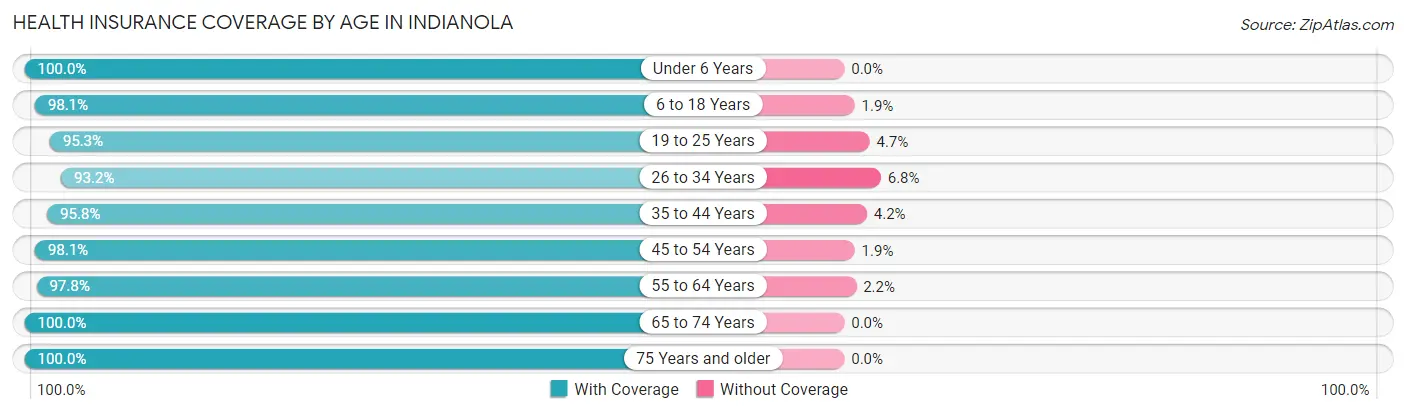
| Age Bracket | With Coverage | Without Coverage |
| Under 6 Years | 1,170 (100.0%) | 0 (0.0%) |
| 6 to 18 Years | 3,060 (98.1%) | 60 (1.9%) |
| 19 to 25 Years | 1,861 (95.3%) | 92 (4.7%) |
| 26 to 34 Years | 1,618 (93.2%) | 118 (6.8%) |
| 35 to 44 Years | 2,023 (95.8%) | 89 (4.2%) |
| 45 to 54 Years | 1,471 (98.1%) | 29 (1.9%) |
| 55 to 64 Years | 1,454 (97.8%) | 33 (2.2%) |
| 65 to 74 Years | 1,528 (100.0%) | 0 (0.0%) |
| 75 Years and older | 882 (100.0%) | 0 (0.0%) |
| Total | 15,067 (97.3%) | 421 (2.7%) |
Health Insurance Coverage by Citizenship Status in Indianola
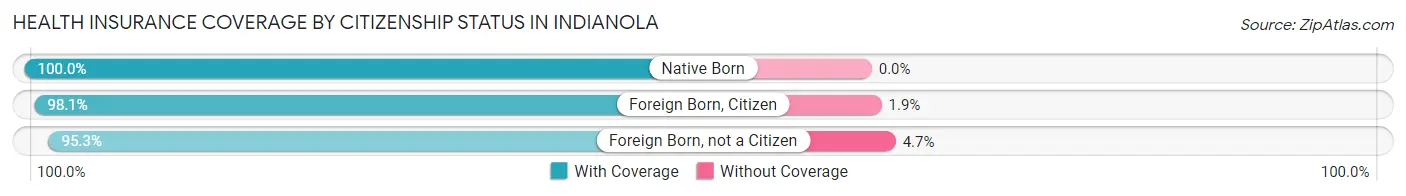
| Citizenship Status | With Coverage | Without Coverage |
| Native Born | 1,170 (100.0%) | 0 (0.0%) |
| Foreign Born, Citizen | 3,060 (98.1%) | 60 (1.9%) |
| Foreign Born, not a Citizen | 1,861 (95.3%) | 92 (4.7%) |
Health Insurance Coverage by Household Income in Indianola
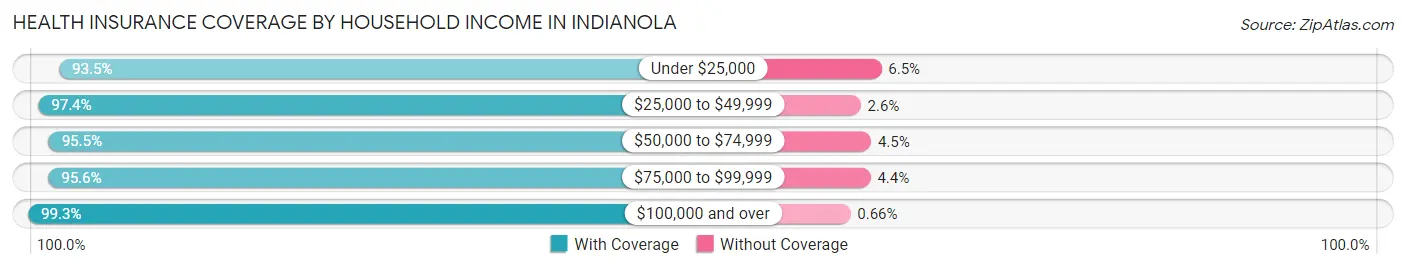
| Household Income | With Coverage | Without Coverage |
| Under $25,000 | 1,155 (93.5%) | 80 (6.5%) |
| $25,000 to $49,999 | 1,881 (97.4%) | 50 (2.6%) |
| $50,000 to $74,999 | 1,983 (95.5%) | 94 (4.5%) |
| $75,000 to $99,999 | 2,025 (95.6%) | 94 (4.4%) |
| $100,000 and over | 6,944 (99.3%) | 46 (0.7%) |
Public vs Private Health Insurance Coverage by Age in Indianola
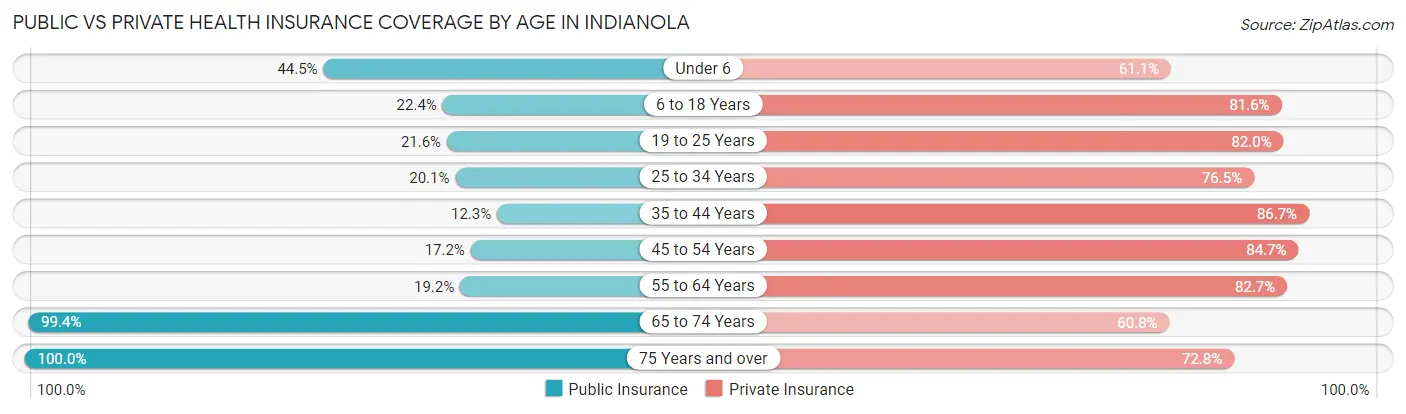
| Age Bracket | Public Insurance | Private Insurance |
| Under 6 | 521 (44.5%) | 715 (61.1%) |
| 6 to 18 Years | 699 (22.4%) | 2,546 (81.6%) |
| 19 to 25 Years | 422 (21.6%) | 1,601 (82.0%) |
| 25 to 34 Years | 348 (20.1%) | 1,328 (76.5%) |
| 35 to 44 Years | 260 (12.3%) | 1,831 (86.7%) |
| 45 to 54 Years | 258 (17.2%) | 1,271 (84.7%) |
| 55 to 64 Years | 285 (19.2%) | 1,229 (82.7%) |
| 65 to 74 Years | 1,518 (99.4%) | 929 (60.8%) |
| 75 Years and over | 882 (100.0%) | 642 (72.8%) |
| Total | 5,193 (33.5%) | 12,092 (78.1%) |
Disability Status by Sex by Age in Indianola
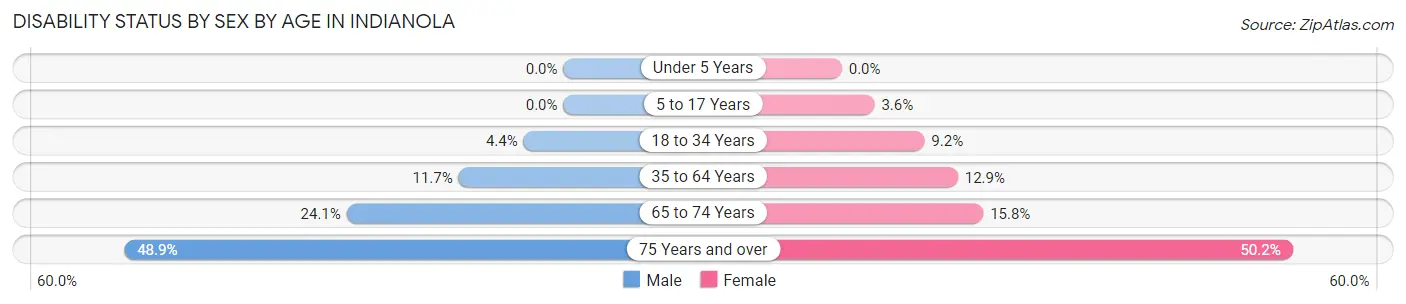
| Age Bracket | Male | Female |
| Under 5 Years | 0 (0.0%) | 0 (0.0%) |
| 5 to 17 Years | 0 (0.0%) | 51 (3.6%) |
| 18 to 34 Years | 86 (4.4%) | 209 (9.2%) |
| 35 to 64 Years | 298 (11.7%) | 329 (12.9%) |
| 65 to 74 Years | 162 (24.1%) | 135 (15.8%) |
| 75 Years and over | 177 (48.9%) | 261 (50.2%) |
Disability Class by Sex by Age in Indianola
Disability Class: Hearing Difficulty
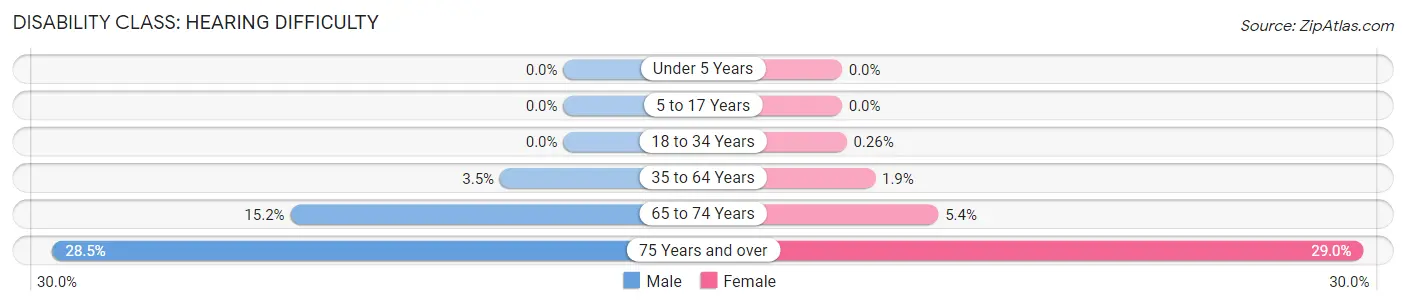
| Age Bracket | Male | Female |
| Under 5 Years | 0 (0.0%) | 0 (0.0%) |
| 5 to 17 Years | 0 (0.0%) | 0 (0.0%) |
| 18 to 34 Years | 0 (0.0%) | 6 (0.3%) |
| 35 to 64 Years | 90 (3.5%) | 47 (1.8%) |
| 65 to 74 Years | 102 (15.2%) | 46 (5.4%) |
| 75 Years and over | 103 (28.4%) | 151 (29.0%) |
Disability Class: Vision Difficulty
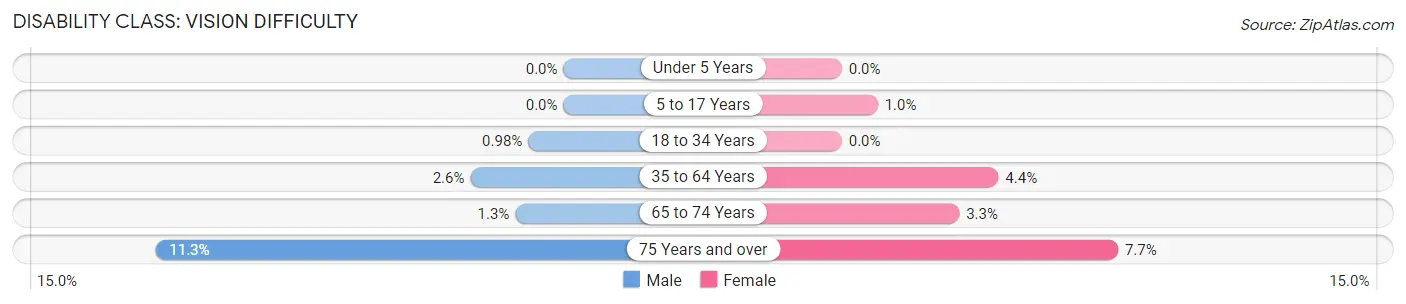
| Age Bracket | Male | Female |
| Under 5 Years | 0 (0.0%) | 0 (0.0%) |
| 5 to 17 Years | 0 (0.0%) | 14 (1.0%) |
| 18 to 34 Years | 19 (1.0%) | 0 (0.0%) |
| 35 to 64 Years | 66 (2.6%) | 111 (4.4%) |
| 65 to 74 Years | 9 (1.3%) | 28 (3.3%) |
| 75 Years and over | 41 (11.3%) | 40 (7.7%) |
Disability Class: Cognitive Difficulty
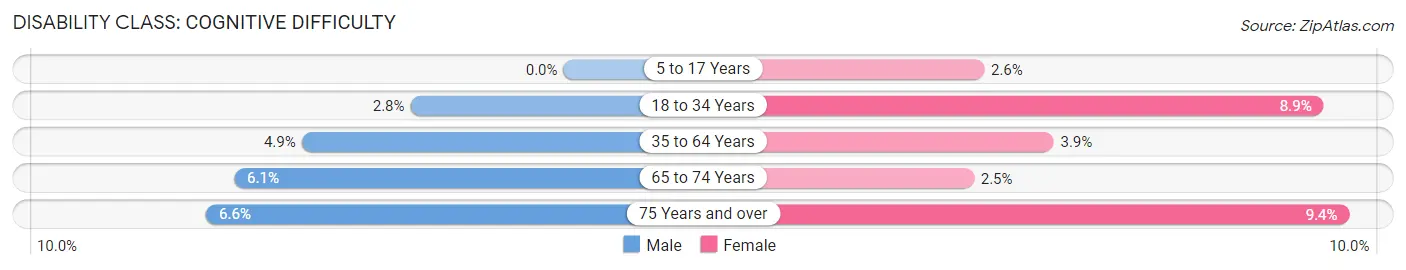
| Age Bracket | Male | Female |
| 5 to 17 Years | 0 (0.0%) | 37 (2.6%) |
| 18 to 34 Years | 55 (2.8%) | 203 (8.9%) |
| 35 to 64 Years | 124 (4.9%) | 100 (3.9%) |
| 65 to 74 Years | 41 (6.1%) | 21 (2.5%) |
| 75 Years and over | 24 (6.6%) | 49 (9.4%) |
Disability Class: Ambulatory Difficulty
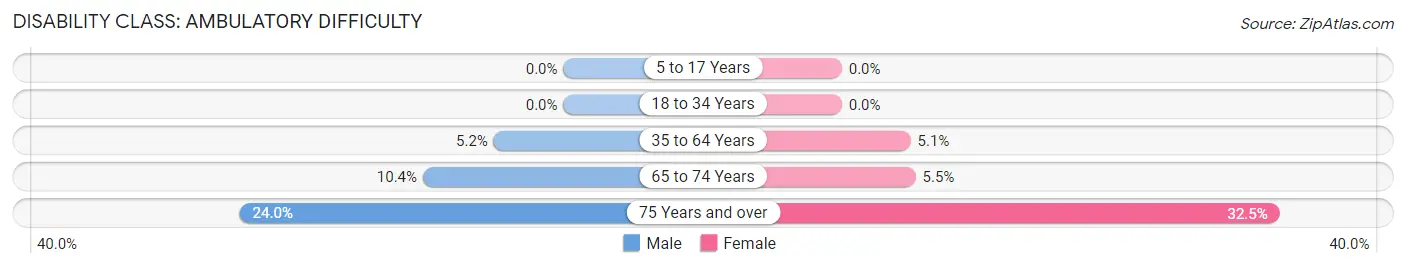
| Age Bracket | Male | Female |
| 5 to 17 Years | 0 (0.0%) | 0 (0.0%) |
| 18 to 34 Years | 0 (0.0%) | 0 (0.0%) |
| 35 to 64 Years | 132 (5.2%) | 130 (5.1%) |
| 65 to 74 Years | 70 (10.4%) | 47 (5.5%) |
| 75 Years and over | 87 (24.0%) | 169 (32.5%) |
Disability Class: Self-Care Difficulty
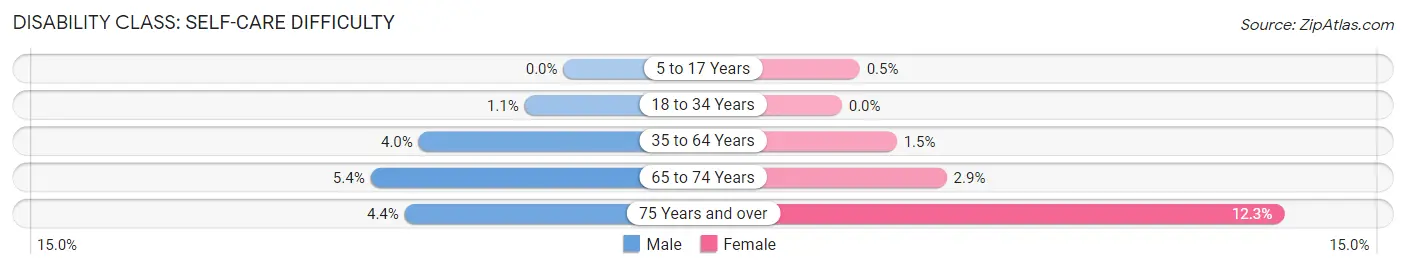
| Age Bracket | Male | Female |
| 5 to 17 Years | 0 (0.0%) | 7 (0.5%) |
| 18 to 34 Years | 21 (1.1%) | 0 (0.0%) |
| 35 to 64 Years | 103 (4.0%) | 39 (1.5%) |
| 65 to 74 Years | 36 (5.4%) | 25 (2.9%) |
| 75 Years and over | 16 (4.4%) | 64 (12.3%) |
Technology Access in Indianola
Computing Device Access in Indianola
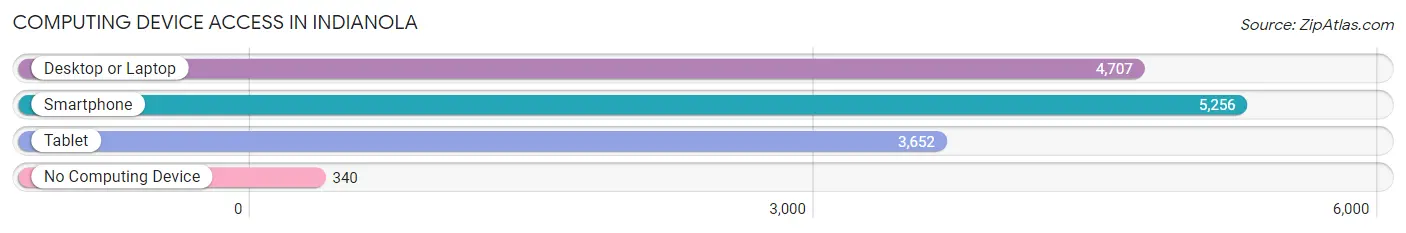
| Device Type | # Households | % Households |
| Desktop or Laptop | 4,707 | 79.2% |
| Smartphone | 5,256 | 88.4% |
| Tablet | 3,652 | 61.4% |
| No Computing Device | 340 | 5.7% |
| Total | 5,944 | 100.0% |
Internet Access in Indianola
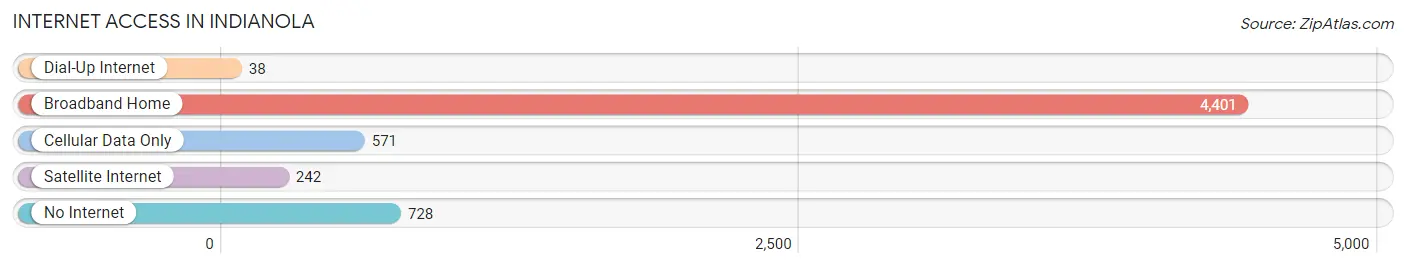
| Internet Type | # Households | % Households |
| Dial-Up Internet | 38 | 0.6% |
| Broadband Home | 4,401 | 74.0% |
| Cellular Data Only | 571 | 9.6% |
| Satellite Internet | 242 | 4.1% |
| No Internet | 728 | 12.2% |
| Total | 5,944 | 100.0% |
Indianola Summary
Introduction
Indianola is a city located in Warren County, Iowa, United States. It is part of the Des Moines–West Des Moines Metropolitan Statistical Area. The population was 14,782 at the 2010 census, an increase of nearly 5% from the 2000 census. Indianola is home to Simpson College, a private four-year liberal arts college.
History
The area that is now Indianola was first settled in 1849 by John F. Irvin and his family. The town was named after the Native American tribe of the same name. The first post office was established in 1851 and the town was officially incorporated in 1853.
Indianola was a major stop on the Underground Railroad, with many slaves escaping to freedom in the north. The town was also the site of the first public school in Warren County, established in 1855.
In the late 19th century, Indianola was a major center for the production of broom corn. The town was also home to a large number of factories, including a canning factory, a flour mill, a furniture factory, and a brickyard.
Geography
Indianola is located at 41°22′17″N 93°35′2″W (41.3714, -93.5839). According to the United States Census Bureau, the city has a total area of 8.45 square miles (21.86 km2), of which 8.43 square miles (21.81 km2) is land and 0.02 square miles (0.05 km2) is water.
Economy
Indianola’s economy is largely based on agriculture and manufacturing. The city is home to a number of agricultural businesses, including seed companies, grain elevators, and livestock feed mills. The city is also home to a number of manufacturing companies, including a plastics manufacturer, a metal fabrication company, and a printing company.
Demographics
As of the 2010 census, there were 14,782 people, 5,845 households, and 3,717 families residing in the city. The population density was 1,749.2 people per square mile (675.2/km2). There were 6,093 housing units at an average density of 722.2 per square mile (279.2/km2). The racial makeup of the city was 92.2% White, 3.3% African American, 0.3% Native American, 1.2% Asian, 0.1% Pacific Islander, 1.3% from other races, and 1.6% from two or more races. Hispanic or Latino of any race were 3.7% of the population.
Conclusion
Indianola is a city located in Warren County, Iowa, United States. It is part of the Des Moines–West Des Moines Metropolitan Statistical Area. The population was 14,782 at the 2010 census, an increase of nearly 5% from the 2000 census. Indianola is home to Simpson College, a private four-year liberal arts college. The city’s economy is largely based on agriculture and manufacturing, and the population is largely white with a small percentage of African Americans, Native Americans, Asians, and other races.
Common Questions
What is Per Capita Income in Indianola?
Per Capita income in Indianola is $34,577.
What is the Median Family Income in Indianola?
Median Family Income in Indianola is $95,694.
What is the Median Household income in Indianola?
Median Household Income in Indianola is $73,534.
What is Income or Wage Gap in Indianola?
Income or Wage Gap in Indianola is 42.6%.
Women in Indianola earn 57.4 cents for every dollar earned by a man.
What is Family Income Deficit in Indianola?
Family Income Deficit in Indianola is $11,961.
Families that are below poverty line in Indianola earn $11,961 less on average than the poverty threshold level.
What is Inequality or Gini Index in Indianola?
Inequality or Gini Index in Indianola is 0.41.
What is the Total Population of Indianola?
Total Population of Indianola is 15,845.
What is the Total Male Population of Indianola?
Total Male Population of Indianola is 7,617.
What is the Total Female Population of Indianola?
Total Female Population of Indianola is 8,228.
What is the Ratio of Males per 100 Females in Indianola?
There are 92.57 Males per 100 Females in Indianola.
What is the Ratio of Females per 100 Males in Indianola?
There are 108.02 Females per 100 Males in Indianola.
What is the Median Population Age in Indianola?
Median Population Age in Indianola is 34.7 Years.
What is the Average Family Size in Indianola
Average Family Size in Indianola is 3.0 People.
What is the Average Household Size in Indianola
Average Household Size in Indianola is 2.4 People.
How Large is the Labor Force in Indianola?
There are 8,136 People in the Labor Forcein in Indianola.
What is the Percentage of People in the Labor Force in Indianola?
65.1% of People are in the Labor Force in Indianola.
What is the Unemployment Rate in Indianola?
Unemployment Rate in Indianola is 3.9%.