Dubuque, IA Map & Demographics
Dubuque Map
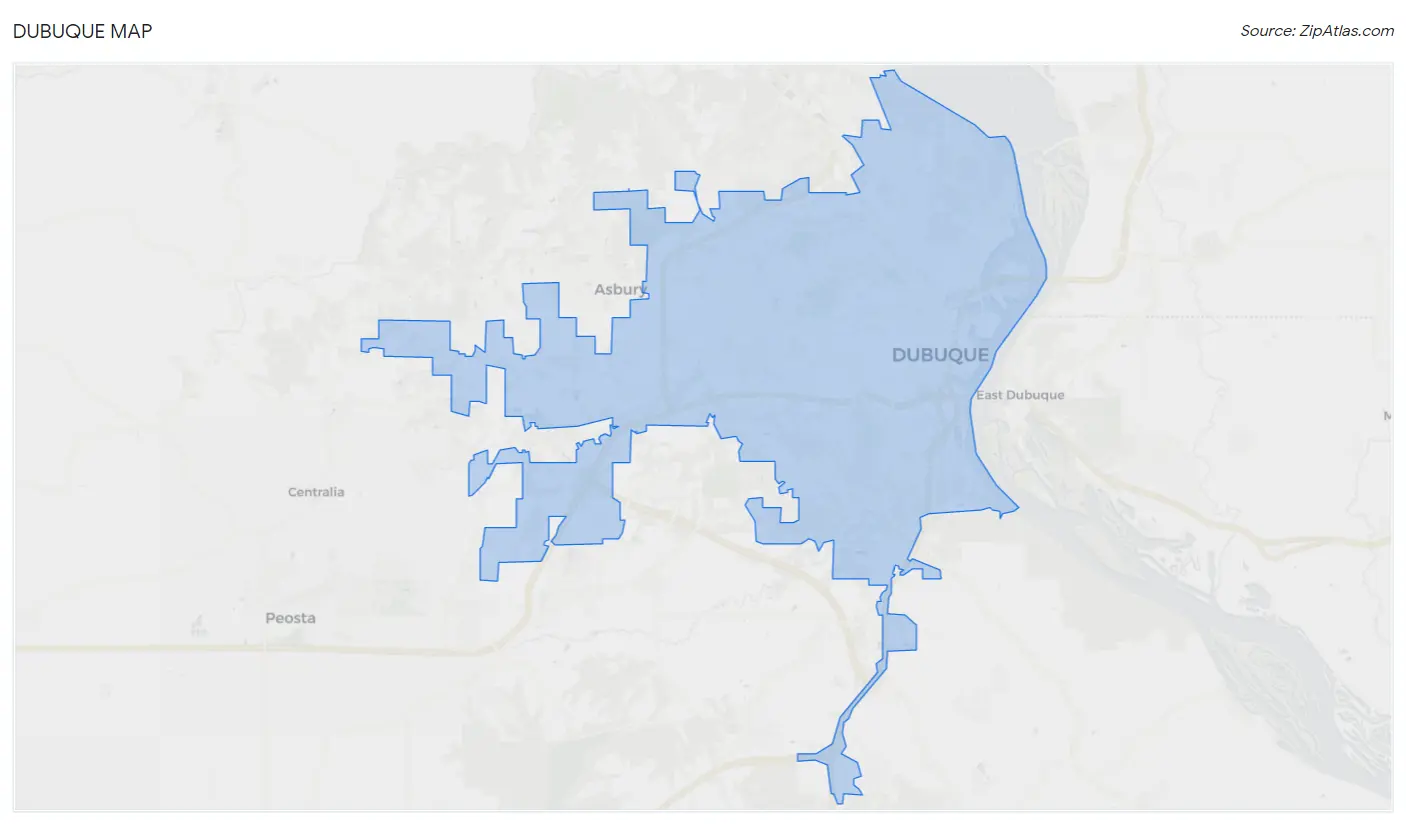
Dubuque Overview
$35,691
PER CAPITA INCOME
$83,093
AVG FAMILY INCOME
$63,520
AVG HOUSEHOLD INCOME
30.9%
WAGE / INCOME GAP [ % ]
69.1¢/ $1
WAGE / INCOME GAP [ $ ]
$9,195
FAMILY INCOME DEFICIT
0.45
INEQUALITY / GINI INDEX
59,315
TOTAL POPULATION
28,948
MALE POPULATION
30,367
FEMALE POPULATION
95.33
MALES / 100 FEMALES
104.90
FEMALES / 100 MALES
37.9
MEDIAN AGE
2.9
AVG FAMILY SIZE
2.2
AVG HOUSEHOLD SIZE
32,035
LABOR FORCE [ PEOPLE ]
64.9%
PERCENT IN LABOR FORCE
5.0%
UNEMPLOYMENT RATE
Dubuque Area Codes
Income in Dubuque
Income Overview in Dubuque
Per Capita Income in Dubuque is $35,691, while median incomes of families and households are $83,093 and $63,520 respectively.
| Characteristic | Number | Measure |
| Per Capita Income | 59,315 | $35,691 |
| Median Family Income | 14,172 | $83,093 |
| Mean Family Income | 14,172 | $104,937 |
| Median Household Income | 25,198 | $63,520 |
| Mean Household Income | 25,198 | $83,629 |
| Income Deficit | 14,172 | $9,195 |
| Wage / Income Gap (%) | 59,315 | 30.89% |
| Wage / Income Gap ($) | 59,315 | 69.11¢ per $1 |
| Gini / Inequality Index | 59,315 | 0.45 |
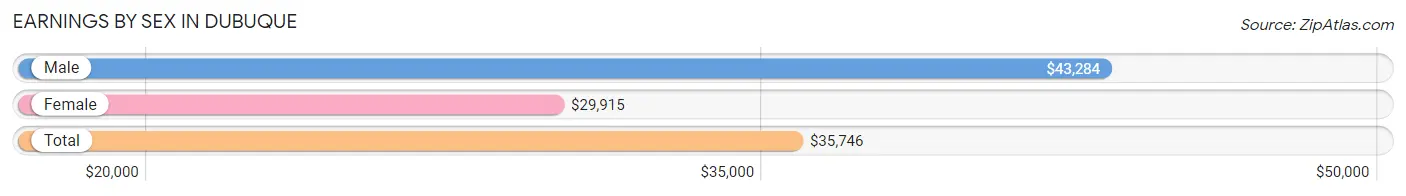
Earnings by Sex in Dubuque
Average Earnings in Dubuque are $35,746, $43,284 for men and $29,915 for women, a difference of 30.9%.
| Sex | Number | Average Earnings |
| Male | 17,561 (51.1%) | $43,284 |
| Female | 16,809 (48.9%) | $29,915 |
| Total | 34,370 (100.0%) | $35,746 |
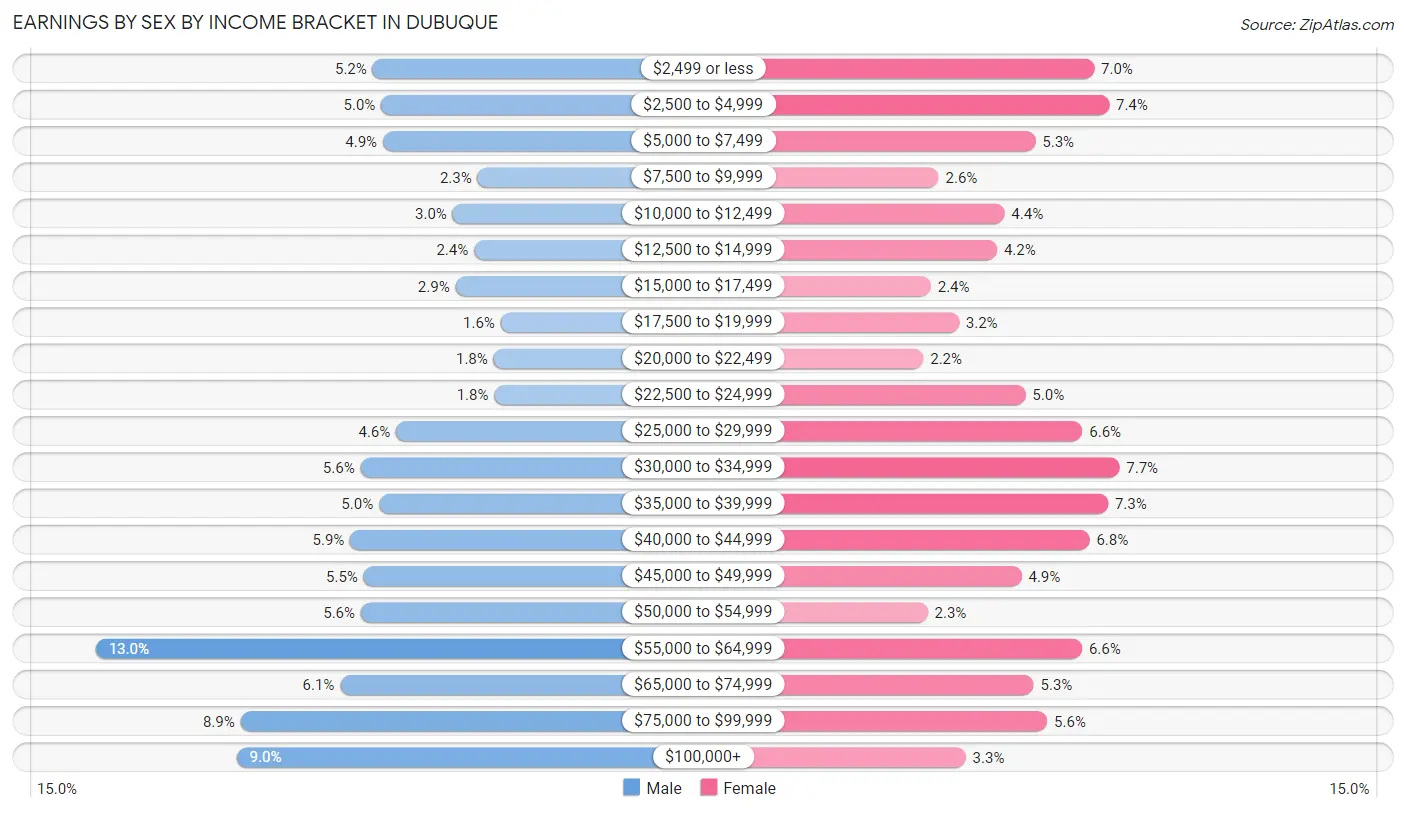
Earnings by Sex by Income Bracket in Dubuque
The most common earnings brackets in Dubuque are $55,000 to $64,999 for men (2,283 | 13.0%) and $30,000 to $34,999 for women (1,288 | 7.7%).
| Income | Male | Female |
| $2,499 or less | 916 (5.2%) | 1,168 (7.0%) |
| $2,500 to $4,999 | 875 (5.0%) | 1,239 (7.4%) |
| $5,000 to $7,499 | 866 (4.9%) | 891 (5.3%) |
| $7,500 to $9,999 | 398 (2.3%) | 433 (2.6%) |
| $10,000 to $12,499 | 522 (3.0%) | 745 (4.4%) |
| $12,500 to $14,999 | 417 (2.4%) | 710 (4.2%) |
| $15,000 to $17,499 | 507 (2.9%) | 396 (2.4%) |
| $17,500 to $19,999 | 285 (1.6%) | 530 (3.2%) |
| $20,000 to $22,499 | 319 (1.8%) | 362 (2.1%) |
| $22,500 to $24,999 | 316 (1.8%) | 844 (5.0%) |
| $25,000 to $29,999 | 801 (4.6%) | 1,112 (6.6%) |
| $30,000 to $34,999 | 976 (5.6%) | 1,288 (7.7%) |
| $35,000 to $39,999 | 885 (5.0%) | 1,234 (7.3%) |
| $40,000 to $44,999 | 1,027 (5.9%) | 1,146 (6.8%) |
| $45,000 to $49,999 | 961 (5.5%) | 826 (4.9%) |
| $50,000 to $54,999 | 974 (5.6%) | 382 (2.3%) |
| $55,000 to $64,999 | 2,283 (13.0%) | 1,111 (6.6%) |
| $65,000 to $74,999 | 1,076 (6.1%) | 883 (5.2%) |
| $75,000 to $99,999 | 1,569 (8.9%) | 947 (5.6%) |
| $100,000+ | 1,588 (9.0%) | 562 (3.3%) |
| Total | 17,561 (100.0%) | 16,809 (100.0%) |
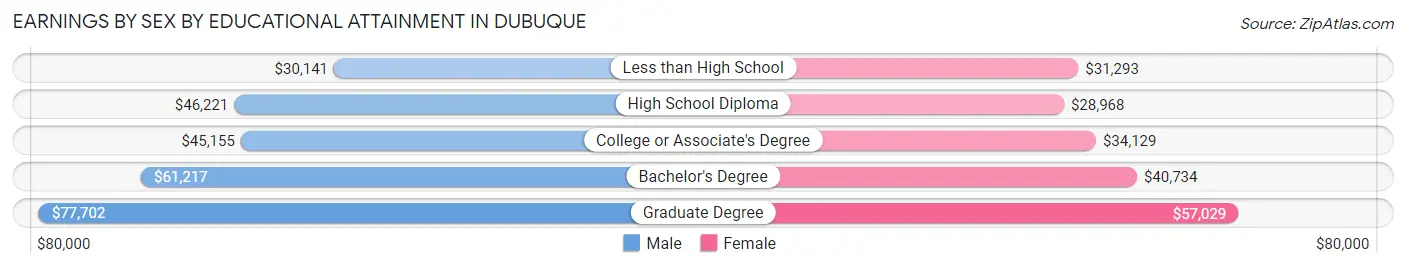
Earnings by Sex by Educational Attainment in Dubuque
Average earnings in Dubuque are $51,332 for men and $35,733 for women, a difference of 30.4%. Men with an educational attainment of graduate degree enjoy the highest average annual earnings of $77,702, while those with less than high school education earn the least with $30,141. Women with an educational attainment of graduate degree earn the most with the average annual earnings of $57,029, while those with high school diploma education have the smallest earnings of $28,968.
| Educational Attainment | Male Income | Female Income |
| Less than High School | $30,141 | $31,293 |
| High School Diploma | $46,221 | $28,968 |
| College or Associate's Degree | $45,155 | $34,129 |
| Bachelor's Degree | $61,217 | $40,734 |
| Graduate Degree | $77,702 | $57,029 |
| Total | $51,332 | $35,733 |
Family Income in Dubuque
Family Income Brackets in Dubuque
According to the Dubuque family income data, there are 3,004 families falling into the $100,000 to $149,999 income range, which is the most common income bracket and makes up 21.2% of all families. Conversely, the less than $10,000 income bracket is the least frequent group with only 298 families (2.1%) belonging to this category.
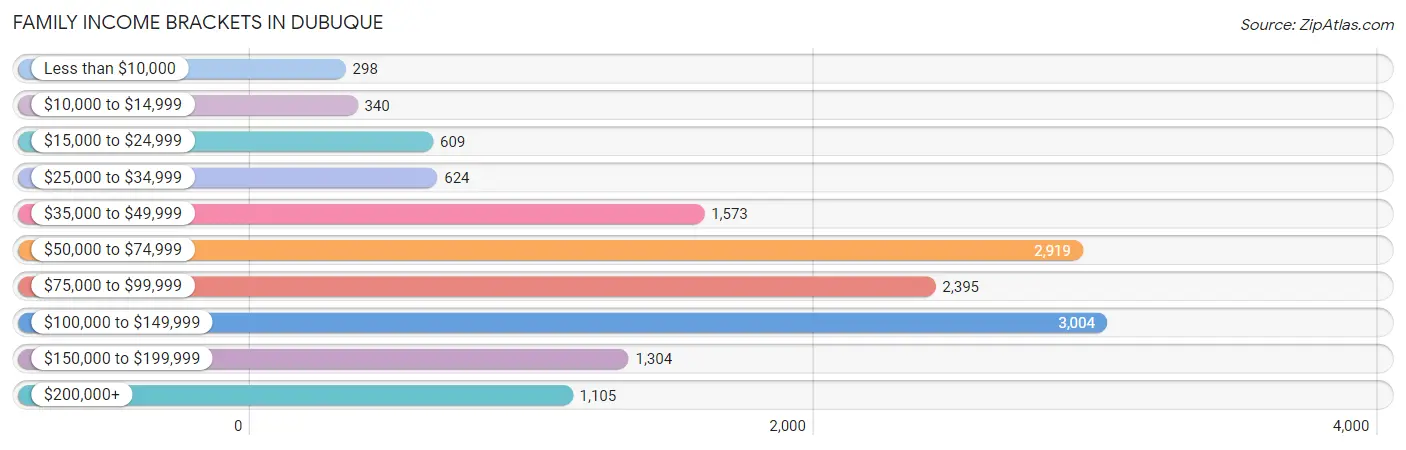
| Income Bracket | # Families | % Families |
| Less than $10,000 | 298 | 2.1% |
| $10,000 to $14,999 | 340 | 2.4% |
| $15,000 to $24,999 | 609 | 4.3% |
| $25,000 to $34,999 | 624 | 4.4% |
| $35,000 to $49,999 | 1,573 | 11.1% |
| $50,000 to $74,999 | 2,919 | 20.6% |
| $75,000 to $99,999 | 2,395 | 16.9% |
| $100,000 to $149,999 | 3,004 | 21.2% |
| $150,000 to $199,999 | 1,304 | 9.2% |
| $200,000+ | 1,105 | 7.8% |
Family Income by Famaliy Size in Dubuque
6-person families (317 | 2.2%) account for the highest median family income in Dubuque with $108,482 per family, while 2-person families (7,800 | 55.0%) have the highest median income of $35,852 per family member.
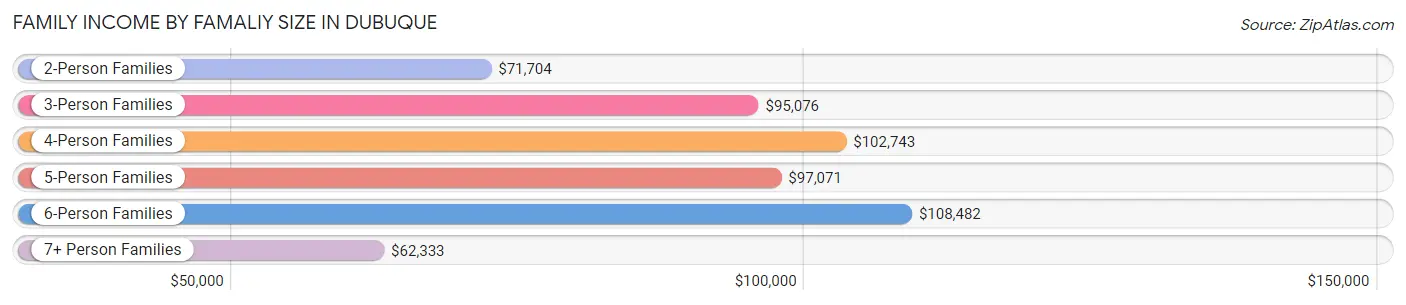
| Income Bracket | # Families | Median Income |
| 2-Person Families | 7,800 (55.0%) | $71,704 |
| 3-Person Families | 2,846 (20.1%) | $95,076 |
| 4-Person Families | 2,163 (15.3%) | $102,743 |
| 5-Person Families | 868 (6.1%) | $97,071 |
| 6-Person Families | 317 (2.2%) | $108,482 |
| 7+ Person Families | 178 (1.3%) | $62,333 |
| Total | 14,172 (100.0%) | $83,093 |
Family Income by Number of Earners in Dubuque
The median family income in Dubuque is $83,093, with families comprising 3+ earners (1,712) having the highest median family income of $127,614, while families with no earners (2,118) have the lowest median family income of $55,920, accounting for 12.1% and 14.9% of families, respectively.
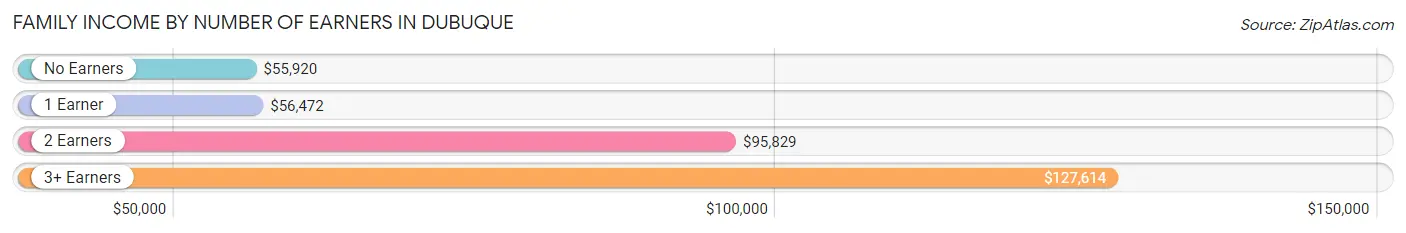
| Number of Earners | # Families | Median Income |
| No Earners | 2,118 (14.9%) | $55,920 |
| 1 Earner | 4,154 (29.3%) | $56,472 |
| 2 Earners | 6,188 (43.7%) | $95,829 |
| 3+ Earners | 1,712 (12.1%) | $127,614 |
| Total | 14,172 (100.0%) | $83,093 |
Household Income in Dubuque
Household Income Brackets in Dubuque
With 4,788 households falling in the category, the $50,000 to $74,999 income range is the most frequent in Dubuque, accounting for 19.0% of all households. In contrast, only 1,033 households (4.1%) fall into the $10,000 to $14,999 income bracket, making it the least populous group.
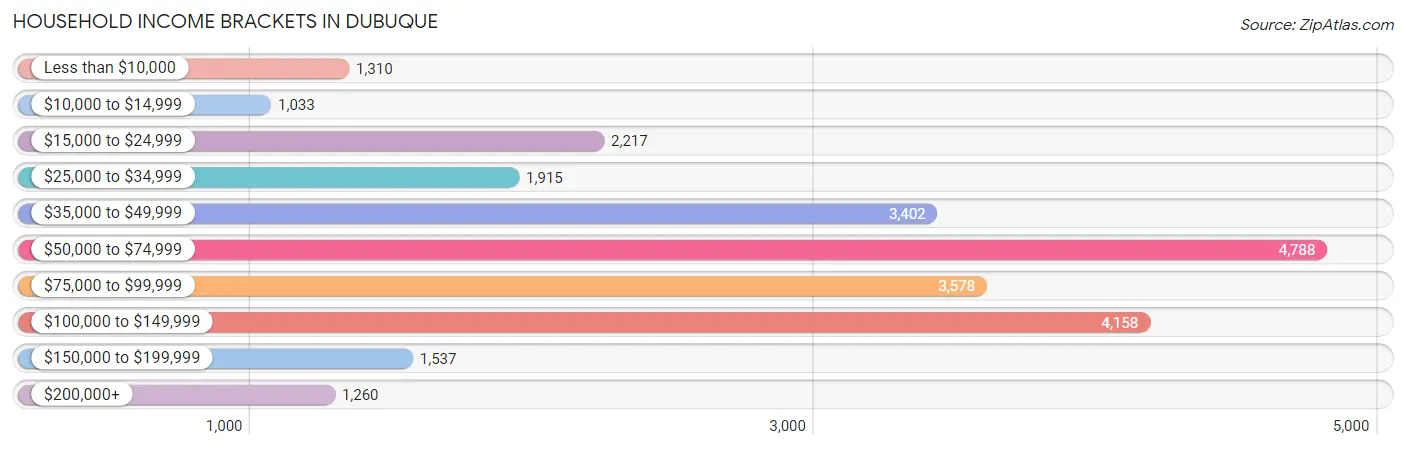
| Income Bracket | # Households | % Households |
| Less than $10,000 | 1,310 | 5.2% |
| $10,000 to $14,999 | 1,033 | 4.1% |
| $15,000 to $24,999 | 2,217 | 8.8% |
| $25,000 to $34,999 | 1,915 | 7.6% |
| $35,000 to $49,999 | 3,402 | 13.5% |
| $50,000 to $74,999 | 4,788 | 19.0% |
| $75,000 to $99,999 | 3,578 | 14.2% |
| $100,000 to $149,999 | 4,158 | 16.5% |
| $150,000 to $199,999 | 1,537 | 6.1% |
| $200,000+ | 1,260 | 5.0% |
Household Income by Householder Age in Dubuque
The median household income in Dubuque is $63,520, with the highest median household income of $82,782 found in the 45 to 64 years age bracket for the primary householder. A total of 7,810 households (31.0%) fall into this category. Meanwhile, the 15 to 24 years age bracket for the primary householder has the lowest median household income of $34,239, with 2,022 households (8.0%) in this group.
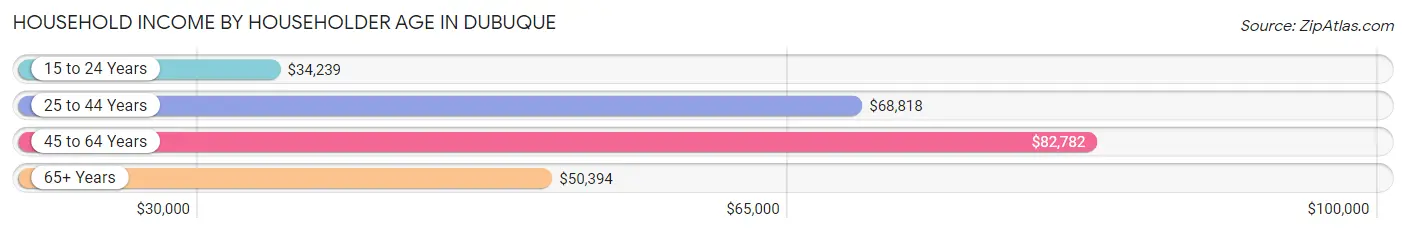
| Income Bracket | # Households | Median Income |
| 15 to 24 Years | 2,022 (8.0%) | $34,239 |
| 25 to 44 Years | 7,940 (31.5%) | $68,818 |
| 45 to 64 Years | 7,810 (31.0%) | $82,782 |
| 65+ Years | 7,426 (29.5%) | $50,394 |
| Total | 25,198 (100.0%) | $63,520 |
Poverty in Dubuque
Income Below Poverty by Sex and Age in Dubuque
With 10.9% poverty level for males and 15.0% for females among the residents of Dubuque, 12 to 14 year old males and 18 to 24 year old females are the most vulnerable to poverty, with 230 males (29.5%) and 931 females (32.9%) in their respective age groups living below the poverty level.
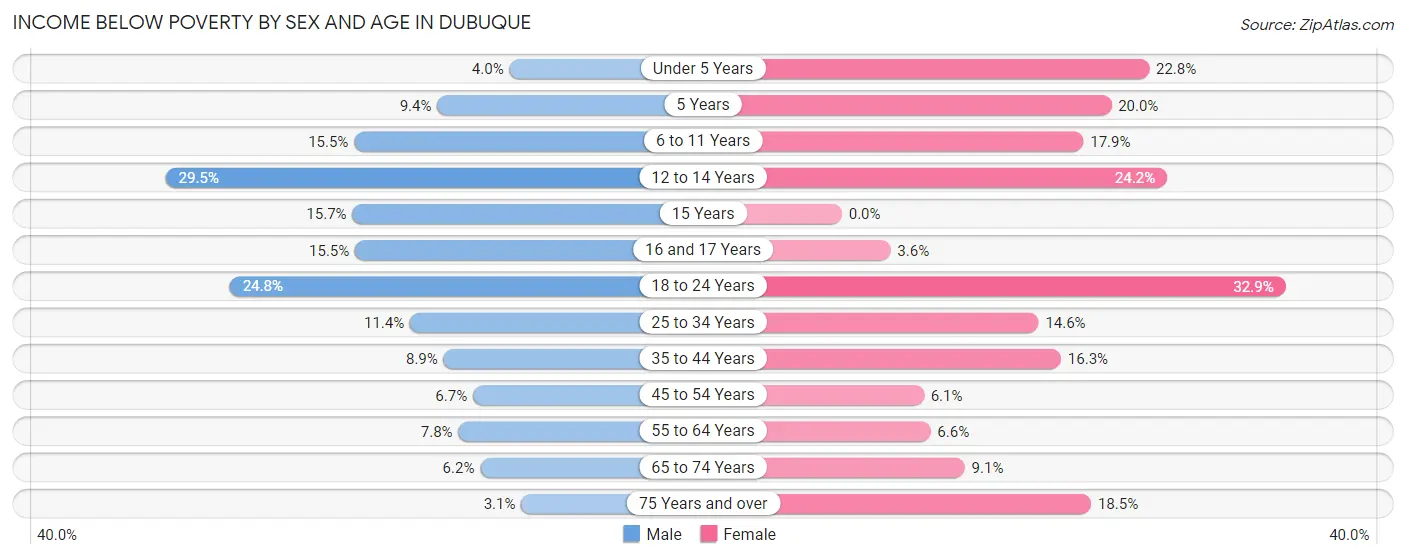
| Age Bracket | Male | Female |
| Under 5 Years | 63 (4.0%) | 403 (22.8%) |
| 5 Years | 32 (9.4%) | 51 (20.0%) |
| 6 to 11 Years | 288 (15.5%) | 319 (17.9%) |
| 12 to 14 Years | 230 (29.5%) | 228 (24.1%) |
| 15 Years | 31 (15.7%) | 0 (0.0%) |
| 16 and 17 Years | 107 (15.5%) | 33 (3.6%) |
| 18 to 24 Years | 706 (24.8%) | 931 (32.9%) |
| 25 to 34 Years | 466 (11.4%) | 560 (14.6%) |
| 35 to 44 Years | 306 (8.9%) | 473 (16.3%) |
| 45 to 54 Years | 192 (6.7%) | 181 (6.1%) |
| 55 to 64 Years | 283 (7.8%) | 252 (6.6%) |
| 65 to 74 Years | 181 (6.2%) | 301 (9.1%) |
| 75 Years and over | 57 (3.1%) | 606 (18.5%) |
| Total | 2,942 (10.9%) | 4,338 (15.0%) |
Income Above Poverty by Sex and Age in Dubuque
According to the poverty statistics in Dubuque, males aged 75 years and over and females aged 15 years are the age groups that are most secure financially, with 96.9% of males and 100.0% of females in these age groups living above the poverty line.
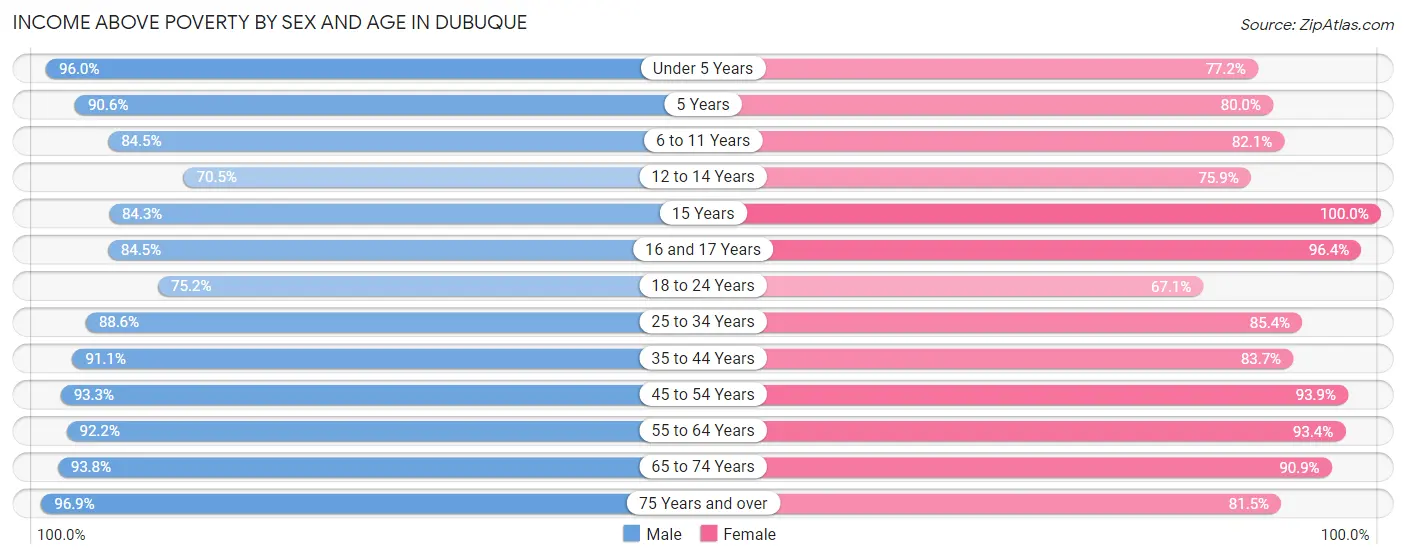
| Age Bracket | Male | Female |
| Under 5 Years | 1,513 (96.0%) | 1,364 (77.2%) |
| 5 Years | 310 (90.6%) | 204 (80.0%) |
| 6 to 11 Years | 1,567 (84.5%) | 1,460 (82.1%) |
| 12 to 14 Years | 549 (70.5%) | 716 (75.8%) |
| 15 Years | 167 (84.3%) | 300 (100.0%) |
| 16 and 17 Years | 585 (84.5%) | 882 (96.4%) |
| 18 to 24 Years | 2,144 (75.2%) | 1,895 (67.1%) |
| 25 to 34 Years | 3,630 (88.6%) | 3,275 (85.4%) |
| 35 to 44 Years | 3,137 (91.1%) | 2,434 (83.7%) |
| 45 to 54 Years | 2,670 (93.3%) | 2,795 (93.9%) |
| 55 to 64 Years | 3,352 (92.2%) | 3,577 (93.4%) |
| 65 to 74 Years | 2,752 (93.8%) | 2,999 (90.9%) |
| 75 Years and over | 1,769 (96.9%) | 2,670 (81.5%) |
| Total | 24,145 (89.1%) | 24,571 (85.0%) |
Income Below Poverty Among Married-Couple Families in Dubuque
The poverty statistics for married-couple families in Dubuque show that 1.9% or 197 of the total 10,596 families live below the poverty line. Families with 1 or 2 children have the highest poverty rate of 3.1%, comprising of 84 families. On the other hand, families with 5 or more children have the lowest poverty rate of 0.0%, which includes 0 families.
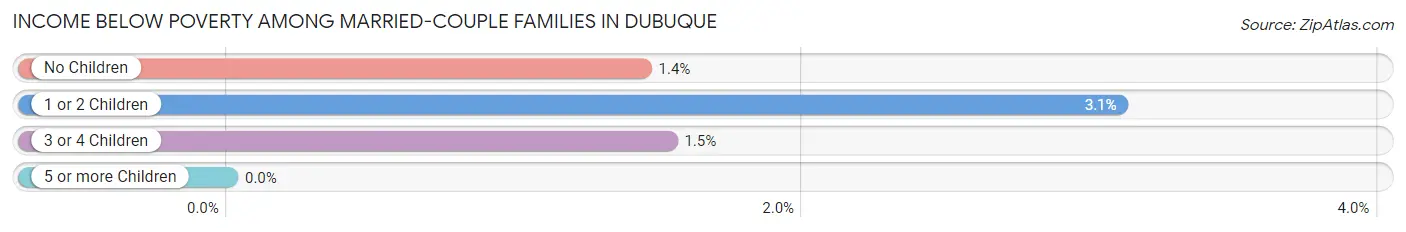
| Children | Above Poverty | Below Poverty |
| No Children | 6,899 (98.6%) | 101 (1.4%) |
| 1 or 2 Children | 2,627 (96.9%) | 84 (3.1%) |
| 3 or 4 Children | 773 (98.5%) | 12 (1.5%) |
| 5 or more Children | 100 (100.0%) | 0 (0.0%) |
| Total | 10,399 (98.1%) | 197 (1.9%) |
Income Below Poverty Among Single-Parent Households in Dubuque
According to the poverty data in Dubuque, 26.0% or 296 single-father households and 23.1% or 562 single-mother households are living below the poverty line. Among single-father households, those with 3 or 4 children have the highest poverty rate, with 24 households (60.0%) experiencing poverty. Likewise, among single-mother households, those with 3 or 4 children have the highest poverty rate, with 146 households (47.2%) falling below the poverty line.
| Children | Single Father | Single Mother |
| No Children | 148 (26.0%) | 83 (12.0%) |
| 1 or 2 Children | 124 (23.5%) | 333 (23.1%) |
| 3 or 4 Children | 24 (60.0%) | 146 (47.2%) |
| 5 or more Children | 0 (0.0%) | 0 (0.0%) |
| Total | 296 (26.0%) | 562 (23.1%) |
Income Below Poverty Among Married-Couple vs Single-Parent Households in Dubuque
The poverty data for Dubuque shows that 197 of the married-couple family households (1.9%) and 858 of the single-parent households (24.0%) are living below the poverty level. Within the married-couple family households, those with 1 or 2 children have the highest poverty rate, with 84 households (3.1%) falling below the poverty line. Among the single-parent households, those with 3 or 4 children have the highest poverty rate, with 170 household (48.7%) living below poverty.
| Children | Married-Couple Families | Single-Parent Households |
| No Children | 101 (1.4%) | 231 (18.3%) |
| 1 or 2 Children | 84 (3.1%) | 457 (23.2%) |
| 3 or 4 Children | 12 (1.5%) | 170 (48.7%) |
| 5 or more Children | 0 (0.0%) | 0 (0.0%) |
| Total | 197 (1.9%) | 858 (24.0%) |
Race in Dubuque
The most populous races in Dubuque are White / Caucasian (52,073 | 87.8%), Two or more Races (2,661 | 4.5%), and Black / African American (2,406 | 4.1%).
| Race | # Population | % Population |
| Asian | 933 | 1.6% |
| Black / African American | 2,406 | 4.1% |
| Hawaiian / Pacific | 670 | 1.1% |
| Hispanic or Latino | 1,685 | 2.8% |
| Native / Alaskan | 105 | 0.2% |
| White / Caucasian | 52,073 | 87.8% |
| Two or more Races | 2,661 | 4.5% |
| Some other Race | 467 | 0.8% |
| Total | 59,315 | 100.0% |
Ancestry in Dubuque
The most populous ancestries reported in Dubuque are German (25,395 | 42.8%), Irish (12,184 | 20.5%), English (3,897 | 6.6%), American (2,376 | 4.0%), and Norwegian (1,989 | 3.4%), together accounting for 77.3% of all Dubuque residents.
| Ancestry | # Population | % Population |
| African | 326 | 0.5% |
| American | 2,376 | 4.0% |
| Apache | 37 | 0.1% |
| Arab | 209 | 0.4% |
| Australian | 9 | 0.0% |
| Austrian | 110 | 0.2% |
| Belgian | 165 | 0.3% |
| Bhutanese | 121 | 0.2% |
| Blackfeet | 29 | 0.1% |
| Brazilian | 14 | 0.0% |
| British | 189 | 0.3% |
| Burmese | 65 | 0.1% |
| Canadian | 13 | 0.0% |
| Celtic | 9 | 0.0% |
| Central American | 192 | 0.3% |
| Cherokee | 40 | 0.1% |
| Chilean | 4 | 0.0% |
| Colombian | 18 | 0.0% |
| Croatian | 30 | 0.1% |
| Cuban | 16 | 0.0% |
| Czech | 375 | 0.6% |
| Czechoslovakian | 67 | 0.1% |
| Danish | 371 | 0.6% |
| Dominican | 21 | 0.0% |
| Dutch | 848 | 1.4% |
| Eastern European | 40 | 0.1% |
| Egyptian | 4 | 0.0% |
| English | 3,897 | 6.6% |
| European | 991 | 1.7% |
| Fijian | 619 | 1.0% |
| Finnish | 13 | 0.0% |
| French | 1,064 | 1.8% |
| French Canadian | 195 | 0.3% |
| German | 25,395 | 42.8% |
| German Russian | 4 | 0.0% |
| Ghanaian | 11 | 0.0% |
| Greek | 223 | 0.4% |
| Guamanian / Chamorro | 35 | 0.1% |
| Guatemalan | 168 | 0.3% |
| Haitian | 17 | 0.0% |
| Honduran | 24 | 0.0% |
| Hungarian | 61 | 0.1% |
| Indian (Asian) | 255 | 0.4% |
| Inupiat | 32 | 0.1% |
| Iranian | 57 | 0.1% |
| Iraqi | 17 | 0.0% |
| Irish | 12,184 | 20.5% |
| Israeli | 8 | 0.0% |
| Italian | 974 | 1.6% |
| Jamaican | 12 | 0.0% |
| Korean | 531 | 0.9% |
| Laotian | 19 | 0.0% |
| Lebanese | 63 | 0.1% |
| Liberian | 15 | 0.0% |
| Lithuanian | 35 | 0.1% |
| Luxembourger | 830 | 1.4% |
| Malaysian | 4 | 0.0% |
| Mexican | 1,106 | 1.9% |
| Moroccan | 1 | 0.0% |
| Native Hawaiian | 16 | 0.0% |
| Nigerian | 3 | 0.0% |
| Northern European | 67 | 0.1% |
| Norwegian | 1,989 | 3.4% |
| Pakistani | 93 | 0.2% |
| Peruvian | 43 | 0.1% |
| Polish | 842 | 1.4% |
| Portuguese | 8 | 0.0% |
| Puerto Rican | 99 | 0.2% |
| Romanian | 16 | 0.0% |
| Russian | 218 | 0.4% |
| Scandinavian | 109 | 0.2% |
| Scotch-Irish | 189 | 0.3% |
| Scottish | 527 | 0.9% |
| Serbian | 13 | 0.0% |
| Sioux | 13 | 0.0% |
| Slavic | 11 | 0.0% |
| Slovak | 79 | 0.1% |
| Slovene | 16 | 0.0% |
| Somali | 3 | 0.0% |
| South American | 122 | 0.2% |
| Spaniard | 77 | 0.1% |
| Spanish | 6 | 0.0% |
| Sri Lankan | 59 | 0.1% |
| Subsaharan African | 358 | 0.6% |
| Swedish | 929 | 1.6% |
| Swiss | 391 | 0.7% |
| Syrian | 2 | 0.0% |
| Thai | 78 | 0.1% |
| Ukrainian | 32 | 0.1% |
| Vietnamese | 43 | 0.1% |
| Welsh | 196 | 0.3% |
| Yugoslavian | 259 | 0.4% | View All 92 Rows |
Immigrants in Dubuque
The most numerous immigrant groups reported in Dubuque came from Asia (825 | 1.4%), Latin America (522 | 0.9%), Europe (509 | 0.9%), Central America (417 | 0.7%), and Oceania (394 | 0.7%), together accounting for 4.5% of all Dubuque residents.
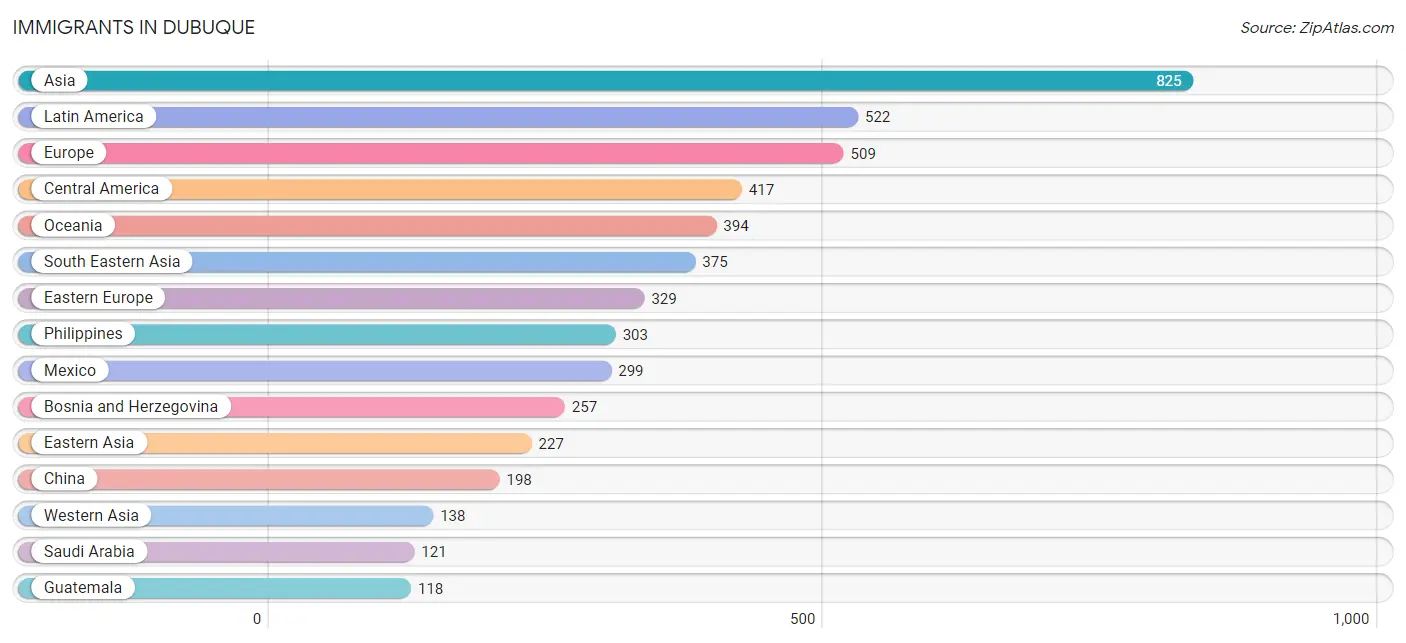
| Immigration Origin | # Population | % Population |
| Africa | 87 | 0.2% |
| Asia | 825 | 1.4% |
| Bangladesh | 24 | 0.0% |
| Belarus | 8 | 0.0% |
| Bosnia and Herzegovina | 257 | 0.4% |
| Canada | 34 | 0.1% |
| Caribbean | 28 | 0.1% |
| Central America | 417 | 0.7% |
| China | 198 | 0.3% |
| Colombia | 18 | 0.0% |
| Croatia | 7 | 0.0% |
| Cuba | 6 | 0.0% |
| Czechoslovakia | 18 | 0.0% |
| Dominican Republic | 5 | 0.0% |
| Eastern Africa | 4 | 0.0% |
| Eastern Asia | 227 | 0.4% |
| Eastern Europe | 329 | 0.5% |
| England | 34 | 0.1% |
| Eritrea | 4 | 0.0% |
| Europe | 509 | 0.9% |
| Germany | 30 | 0.1% |
| Ghana | 24 | 0.0% |
| Guatemala | 118 | 0.2% |
| Guyana | 7 | 0.0% |
| Haiti | 17 | 0.0% |
| India | 16 | 0.0% |
| Indonesia | 19 | 0.0% |
| Iran | 26 | 0.0% |
| Iraq | 17 | 0.0% |
| Ireland | 3 | 0.0% |
| Italy | 21 | 0.0% |
| Japan | 6 | 0.0% |
| Korea | 23 | 0.0% |
| Laos | 1 | 0.0% |
| Latin America | 522 | 0.9% |
| Liberia | 6 | 0.0% |
| Mexico | 299 | 0.5% |
| Morocco | 4 | 0.0% |
| Nepal | 19 | 0.0% |
| Northern Africa | 4 | 0.0% |
| Northern Europe | 55 | 0.1% |
| Oceania | 394 | 0.7% |
| Peru | 36 | 0.1% |
| Philippines | 303 | 0.5% |
| Poland | 8 | 0.0% |
| Romania | 6 | 0.0% |
| Russia | 16 | 0.0% |
| Saudi Arabia | 121 | 0.2% |
| Scotland | 9 | 0.0% |
| South America | 77 | 0.1% |
| South Central Asia | 85 | 0.1% |
| South Eastern Asia | 375 | 0.6% |
| Southern Europe | 77 | 0.1% |
| Spain | 56 | 0.1% |
| Sweden | 9 | 0.0% |
| Switzerland | 18 | 0.0% |
| Taiwan | 13 | 0.0% |
| Thailand | 7 | 0.0% |
| Ukraine | 9 | 0.0% |
| Venezuela | 16 | 0.0% |
| Vietnam | 45 | 0.1% |
| Western Africa | 30 | 0.1% |
| Western Asia | 138 | 0.2% |
| Western Europe | 48 | 0.1% | View All 64 Rows |
Sex and Age in Dubuque
Sex and Age in Dubuque
The most populous age groups in Dubuque are 20 to 24 Years (3,001 | 10.4%) for men and 20 to 24 Years (2,599 | 8.6%) for women.
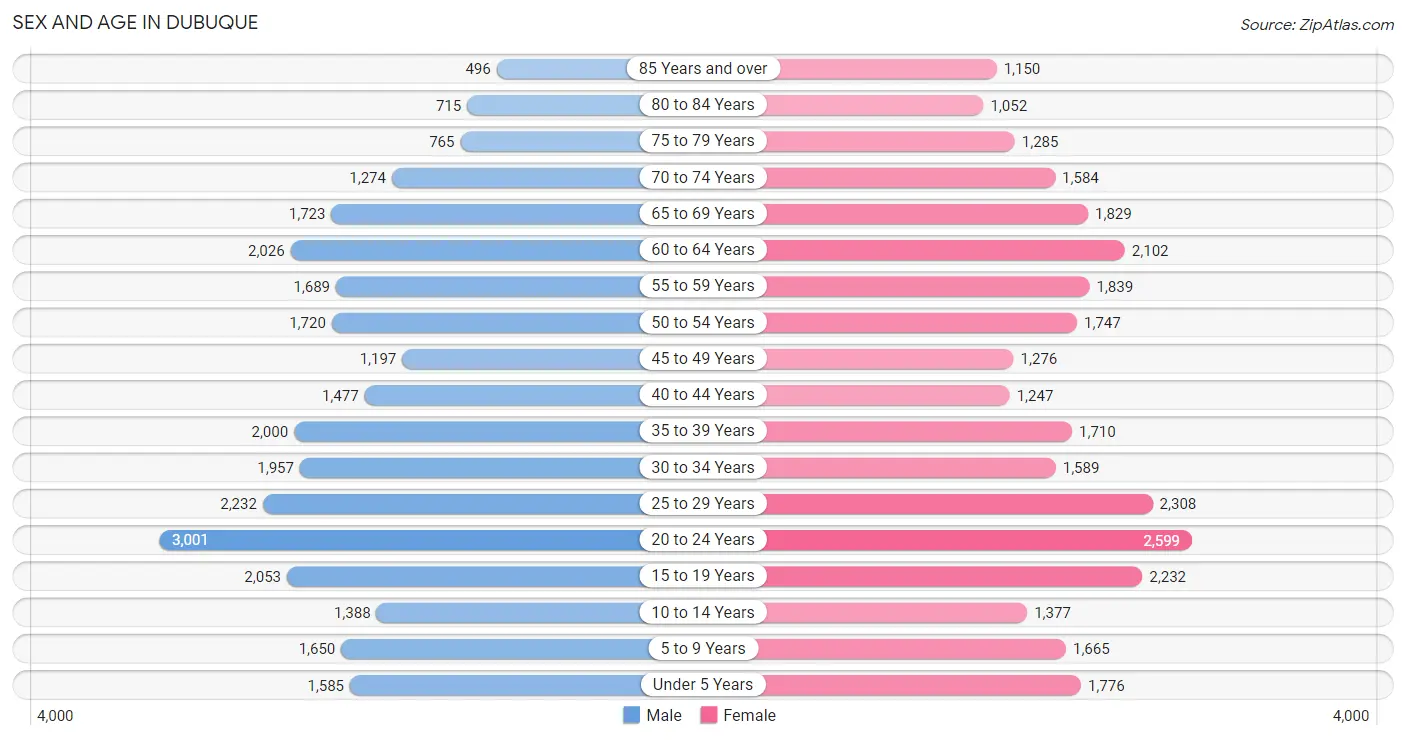
| Age Bracket | Male | Female |
| Under 5 Years | 1,585 (5.5%) | 1,776 (5.9%) |
| 5 to 9 Years | 1,650 (5.7%) | 1,665 (5.5%) |
| 10 to 14 Years | 1,388 (4.8%) | 1,377 (4.5%) |
| 15 to 19 Years | 2,053 (7.1%) | 2,232 (7.3%) |
| 20 to 24 Years | 3,001 (10.4%) | 2,599 (8.6%) |
| 25 to 29 Years | 2,232 (7.7%) | 2,308 (7.6%) |
| 30 to 34 Years | 1,957 (6.8%) | 1,589 (5.2%) |
| 35 to 39 Years | 2,000 (6.9%) | 1,710 (5.6%) |
| 40 to 44 Years | 1,477 (5.1%) | 1,247 (4.1%) |
| 45 to 49 Years | 1,197 (4.1%) | 1,276 (4.2%) |
| 50 to 54 Years | 1,720 (5.9%) | 1,747 (5.8%) |
| 55 to 59 Years | 1,689 (5.8%) | 1,839 (6.1%) |
| 60 to 64 Years | 2,026 (7.0%) | 2,102 (6.9%) |
| 65 to 69 Years | 1,723 (5.9%) | 1,829 (6.0%) |
| 70 to 74 Years | 1,274 (4.4%) | 1,584 (5.2%) |
| 75 to 79 Years | 765 (2.6%) | 1,285 (4.2%) |
| 80 to 84 Years | 715 (2.5%) | 1,052 (3.5%) |
| 85 Years and over | 496 (1.7%) | 1,150 (3.8%) |
| Total | 28,948 (100.0%) | 30,367 (100.0%) |
Families and Households in Dubuque
Median Family Size in Dubuque
The median family size in Dubuque is 2.87 persons per family, with single female/mother families (2,438 | 17.2%) accounting for the largest median family size of 2.95 persons per family. On the other hand, single male/father families (1,138 | 8.0%) represent the smallest median family size with 2.66 persons per family.
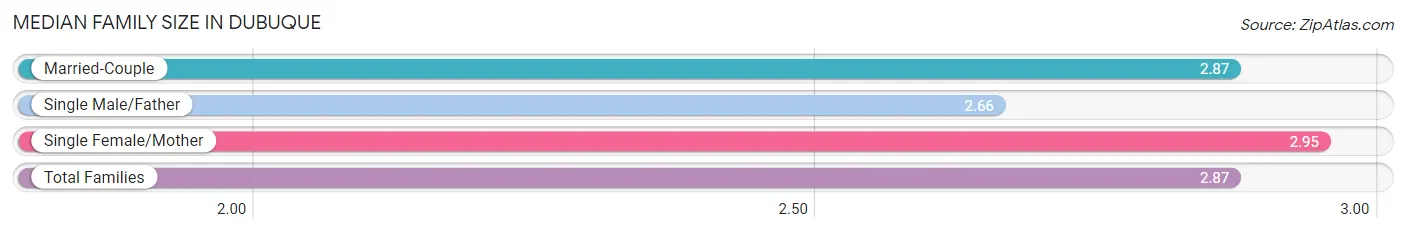
| Family Type | # Families | Family Size |
| Married-Couple | 10,596 (74.8%) | 2.87 |
| Single Male/Father | 1,138 (8.0%) | 2.66 |
| Single Female/Mother | 2,438 (17.2%) | 2.95 |
| Total Families | 14,172 (100.0%) | 2.87 |
Median Household Size in Dubuque
The median household size in Dubuque is 2.20 persons per household, with single female/mother households (2,438 | 9.7%) accounting for the largest median household size of 3.14 persons per household. non-family households (11,026 | 43.8%) represent the smallest median household size with 1.26 persons per household.
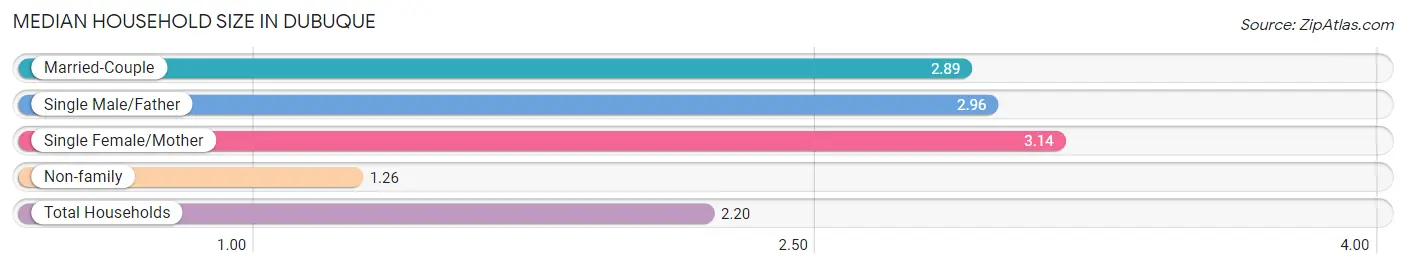
| Household Type | # Households | Household Size |
| Married-Couple | 10,596 (42.0%) | 2.89 |
| Single Male/Father | 1,138 (4.5%) | 2.96 |
| Single Female/Mother | 2,438 (9.7%) | 3.14 |
| Non-family | 11,026 (43.8%) | 1.26 |
| Total Households | 25,198 (100.0%) | 2.20 |
Household Size by Marriage Status in Dubuque
Out of a total of 25,198 households in Dubuque, 14,172 (56.2%) are family households, while 11,026 (43.8%) are nonfamily households. The most numerous type of family households are 2-person households, comprising 7,380, and the most common type of nonfamily households are 1-person households, comprising 8,790.
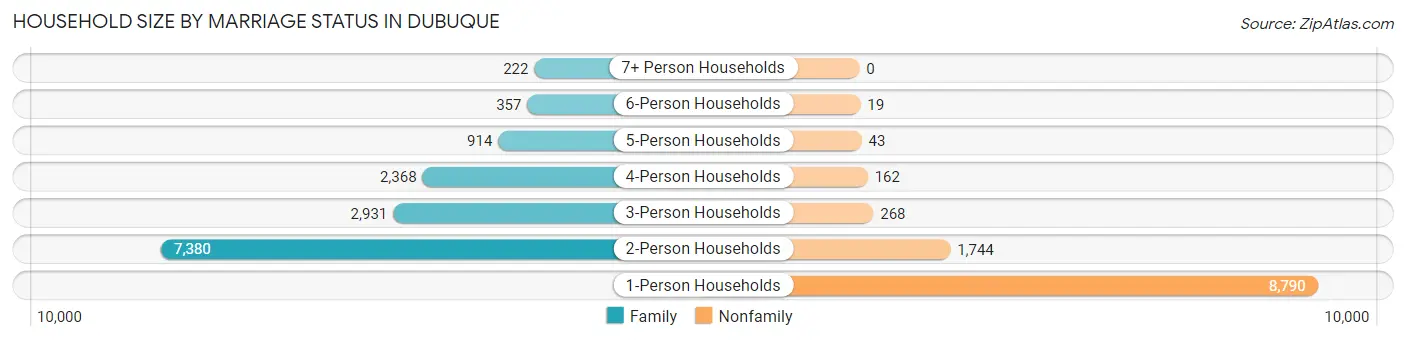
| Household Size | Family Households | Nonfamily Households |
| 1-Person Households | - | 8,790 (34.9%) |
| 2-Person Households | 7,380 (29.3%) | 1,744 (6.9%) |
| 3-Person Households | 2,931 (11.6%) | 268 (1.1%) |
| 4-Person Households | 2,368 (9.4%) | 162 (0.6%) |
| 5-Person Households | 914 (3.6%) | 43 (0.2%) |
| 6-Person Households | 357 (1.4%) | 19 (0.1%) |
| 7+ Person Households | 222 (0.9%) | 0 (0.0%) |
| Total | 14,172 (56.2%) | 11,026 (43.8%) |
Female Fertility in Dubuque
Fertility by Age in Dubuque
Average fertility rate in Dubuque is 50.0 births per 1,000 women. Women in the age bracket of 20 to 34 years have the highest fertility rate with 80.0 births per 1,000 women. Women in the age bracket of 20 to 34 years acount for 78.8% of all women with births.
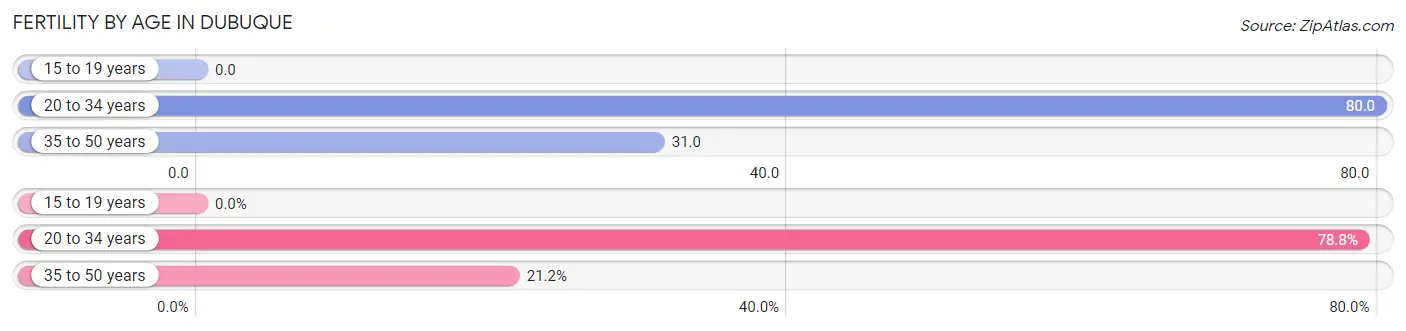
| Age Bracket | Women with Births | Births / 1,000 Women |
| 15 to 19 years | 0 (0.0%) | 0.0 |
| 20 to 34 years | 518 (78.8%) | 80.0 |
| 35 to 50 years | 139 (21.2%) | 31.0 |
| Total | 657 (100.0%) | 50.0 |
Fertility by Age by Marriage Status in Dubuque
71.4% of women with births (657) in Dubuque are married. The highest percentage of unmarried women with births falls into 20 to 34 years age bracket with 36.3% of them unmarried at the time of birth, while the lowest percentage of unmarried women with births belong to 35 to 50 years age bracket with 0.0% of them unmarried.
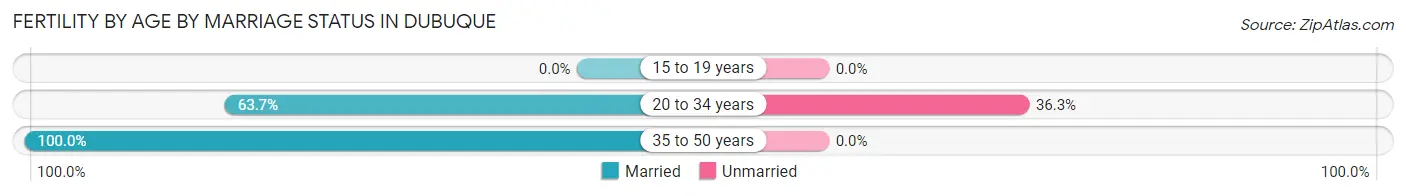
| Age Bracket | Married | Unmarried |
| 15 to 19 years | 0 (0.0%) | 0 (0.0%) |
| 20 to 34 years | 330 (63.7%) | 188 (36.3%) |
| 35 to 50 years | 139 (100.0%) | 0 (0.0%) |
| Total | 469 (71.4%) | 188 (28.6%) |
Fertility by Education in Dubuque
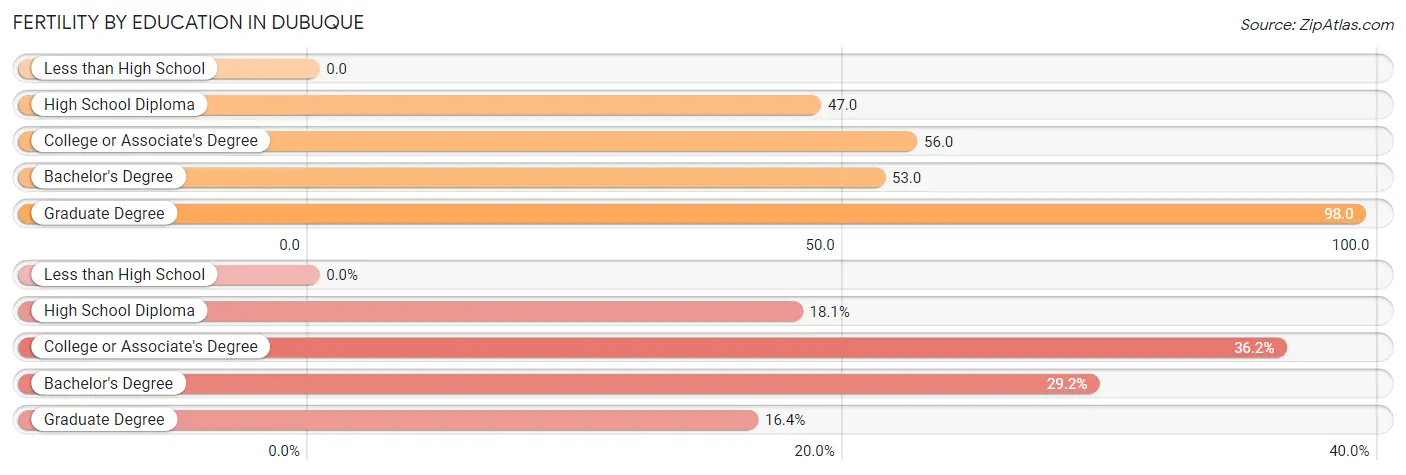
| Educational Attainment | Women with Births | Births / 1,000 Women |
| Less than High School | 0 (0.0%) | 0.0 |
| High School Diploma | 119 (18.1%) | 47.0 |
| College or Associate's Degree | 238 (36.2%) | 56.0 |
| Bachelor's Degree | 192 (29.2%) | 53.0 |
| Graduate Degree | 108 (16.4%) | 98.0 |
| Total | 657 (100.0%) | 50.0 |
Fertility by Education by Marriage Status in Dubuque
28.6% of women with births in Dubuque are unmarried. Women with the educational attainment of bachelor's degree are most likely to be married with 100.0% of them married at childbirth, while women with the educational attainment of high school diploma are least likely to be married with 79.0% of them unmarried at childbirth.
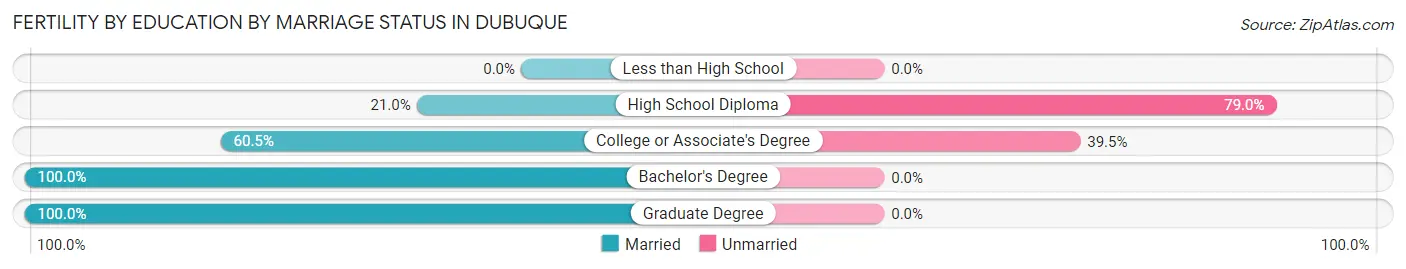
| Educational Attainment | Married | Unmarried |
| Less than High School | 0 (0.0%) | 0 (0.0%) |
| High School Diploma | 25 (21.0%) | 94 (79.0%) |
| College or Associate's Degree | 144 (60.5%) | 94 (39.5%) |
| Bachelor's Degree | 192 (100.0%) | 0 (0.0%) |
| Graduate Degree | 108 (100.0%) | 0 (0.0%) |
| Total | 469 (71.4%) | 188 (28.6%) |
Employment Characteristics in Dubuque
Employment by Class of Employer in Dubuque
Among the 29,924 employed individuals in Dubuque, private company employees (21,192 | 70.8%), not-for-profit organizations (3,878 | 13.0%), and local government employees (2,063 | 6.9%) make up the most common classes of employment.
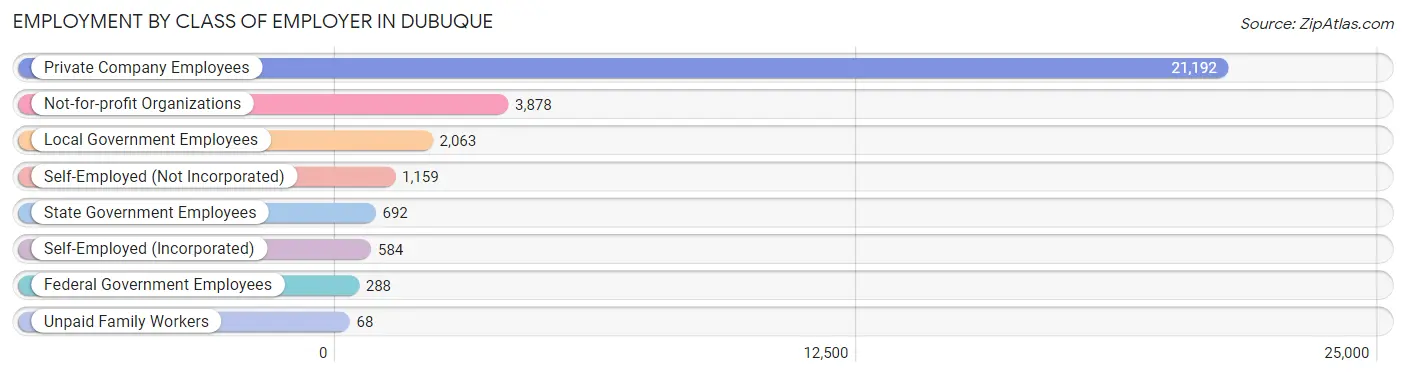
| Employer Class | # Employees | % Employees |
| Private Company Employees | 21,192 | 70.8% |
| Self-Employed (Incorporated) | 584 | 1.9% |
| Self-Employed (Not Incorporated) | 1,159 | 3.9% |
| Not-for-profit Organizations | 3,878 | 13.0% |
| Local Government Employees | 2,063 | 6.9% |
| State Government Employees | 692 | 2.3% |
| Federal Government Employees | 288 | 1.0% |
| Unpaid Family Workers | 68 | 0.2% |
| Total | 29,924 | 100.0% |
Employment Status by Age in Dubuque
According to the labor force statistics for Dubuque, out of the total population over 16 years of age (49,360), 64.9% or 32,035 individuals are in the labor force, with 5.0% or 1,602 of them unemployed. The age group with the highest labor force participation rate is 30 to 34 years, with 89.8% or 3,184 individuals in the labor force. Within the labor force, the 35 to 44 years age range has the highest percentage of unemployed individuals, with 11.9% or 688 of them being unemployed.
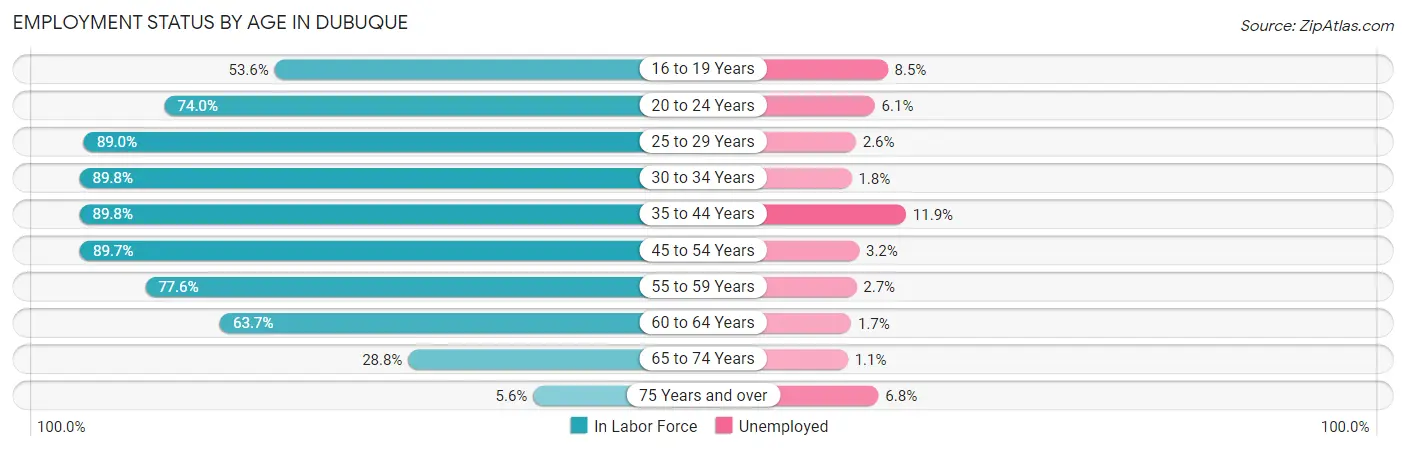
| Age Bracket | In Labor Force | Unemployed |
| 16 to 19 Years | 2,021 (53.6%) | 172 (8.5%) |
| 20 to 24 Years | 4,144 (74.0%) | 253 (6.1%) |
| 25 to 29 Years | 4,041 (89.0%) | 105 (2.6%) |
| 30 to 34 Years | 3,184 (89.8%) | 57 (1.8%) |
| 35 to 44 Years | 5,778 (89.8%) | 688 (11.9%) |
| 45 to 54 Years | 5,328 (89.7%) | 170 (3.2%) |
| 55 to 59 Years | 2,738 (77.6%) | 74 (2.7%) |
| 60 to 64 Years | 2,630 (63.7%) | 45 (1.7%) |
| 65 to 74 Years | 1,846 (28.8%) | 20 (1.1%) |
| 75 Years and over | 306 (5.6%) | 21 (6.8%) |
| Total | 32,035 (64.9%) | 1,602 (5.0%) |
Employment Status by Educational Attainment in Dubuque
According to labor force statistics for Dubuque, 84.3% of individuals (23,702) out of the total population between 25 and 64 years of age (28,116) are in the labor force, with 4.8% or 1,138 of them being unemployed. The group with the highest labor force participation rate are those with the educational attainment of bachelor's degree or higher, with 88.8% or 8,591 individuals in the labor force. Within the labor force, individuals with college / associate degree education have the highest percentage of unemployment, with 7.5% or 566 of them being unemployed.
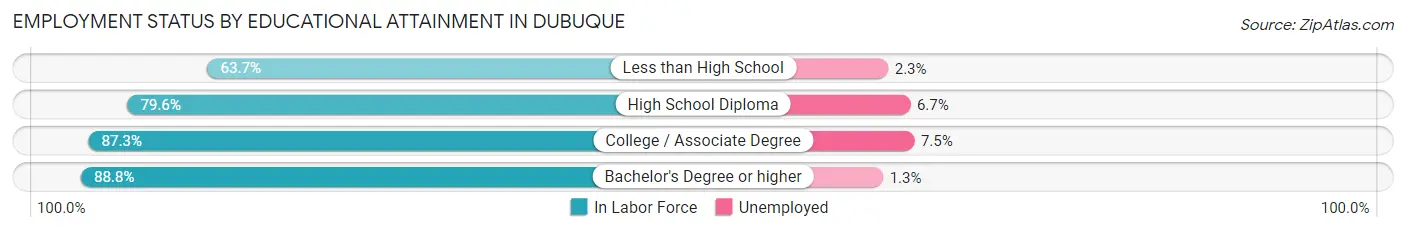
| Educational Attainment | In Labor Force | Unemployed |
| Less than High School | 987 (63.7%) | 36 (2.3%) |
| High School Diploma | 6,561 (79.6%) | 552 (6.7%) |
| College / Associate Degree | 7,551 (87.3%) | 649 (7.5%) |
| Bachelor's Degree or higher | 8,591 (88.8%) | 126 (1.3%) |
| Total | 23,702 (84.3%) | 1,350 (4.8%) |
Employment Occupations by Sex in Dubuque
Management, Business, Science and Arts Occupations
The most common Management, Business, Science and Arts occupations in Dubuque are Community & Social Service (3,202 | 10.5%), Management (2,600 | 8.6%), Education Instruction & Library (1,933 | 6.4%), Health Diagnosing & Treating (1,869 | 6.1%), and Business & Financial (1,692 | 5.6%).
Management, Business, Science and Arts Occupations by Sex
Within the Management, Business, Science and Arts occupations in Dubuque, the most male-oriented occupations are Architecture & Engineering (89.8%), Computers, Engineering & Science (79.6%), and Computers & Mathematics (74.4%), while the most female-oriented occupations are Education, Arts & Media (78.6%), Health Diagnosing & Treating (78.3%), and Health Technologists (76.4%).
| Occupation | Male | Female |
| Management | 1,615 (62.1%) | 985 (37.9%) |
| Business & Financial | 727 (43.0%) | 965 (57.0%) |
| Computers, Engineering & Science | 1,330 (79.6%) | 340 (20.4%) |
| Computers & Mathematics | 612 (74.4%) | 211 (25.6%) |
| Architecture & Engineering | 634 (89.8%) | 72 (10.2%) |
| Life, Physical & Social Science | 84 (59.6%) | 57 (40.4%) |
| Community & Social Service | 955 (29.8%) | 2,247 (70.2%) |
| Education, Arts & Media | 96 (21.4%) | 352 (78.6%) |
| Legal Services & Support | 71 (43.8%) | 91 (56.2%) |
| Education Instruction & Library | 524 (27.1%) | 1,409 (72.9%) |
| Arts, Media & Entertainment | 264 (40.1%) | 395 (59.9%) |
| Health Diagnosing & Treating | 405 (21.7%) | 1,464 (78.3%) |
| Health Technologists | 305 (23.6%) | 987 (76.4%) |
| Total (Category) | 5,032 (45.6%) | 6,001 (54.4%) |
| Total (Overall) | 15,152 (49.8%) | 15,252 (50.2%) |
Services Occupations
The most common Services occupations in Dubuque are Food Preparation & Serving (1,787 | 5.9%), Personal Care & Service (1,208 | 4.0%), Healthcare Support (1,183 | 3.9%), Cleaning & Maintenance (747 | 2.5%), and Security & Protection (542 | 1.8%).
Services Occupations by Sex
Within the Services occupations in Dubuque, the most male-oriented occupations are Firefighting & Prevention (81.4%), Security & Protection (74.4%), and Law Enforcement (65.8%), while the most female-oriented occupations are Healthcare Support (92.3%), Personal Care & Service (76.4%), and Food Preparation & Serving (58.0%).
| Occupation | Male | Female |
| Healthcare Support | 91 (7.7%) | 1,092 (92.3%) |
| Security & Protection | 403 (74.4%) | 139 (25.7%) |
| Firefighting & Prevention | 241 (81.4%) | 55 (18.6%) |
| Law Enforcement | 162 (65.8%) | 84 (34.2%) |
| Food Preparation & Serving | 751 (42.0%) | 1,036 (58.0%) |
| Cleaning & Maintenance | 437 (58.5%) | 310 (41.5%) |
| Personal Care & Service | 285 (23.6%) | 923 (76.4%) |
| Total (Category) | 1,967 (36.0%) | 3,500 (64.0%) |
| Total (Overall) | 15,152 (49.8%) | 15,252 (50.2%) |
Sales and Office Occupations
The most common Sales and Office occupations in Dubuque are Office & Administration (3,698 | 12.2%), and Sales & Related (2,817 | 9.3%).

Sales and Office Occupations by Sex
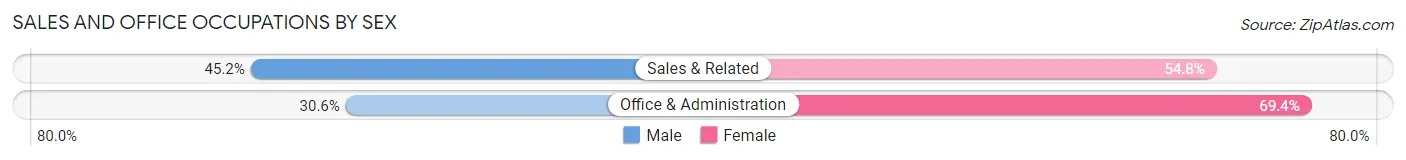
| Occupation | Male | Female |
| Sales & Related | 1,274 (45.2%) | 1,543 (54.8%) |
| Office & Administration | 1,132 (30.6%) | 2,566 (69.4%) |
| Total (Category) | 2,406 (36.9%) | 4,109 (63.1%) |
| Total (Overall) | 15,152 (49.8%) | 15,252 (50.2%) |
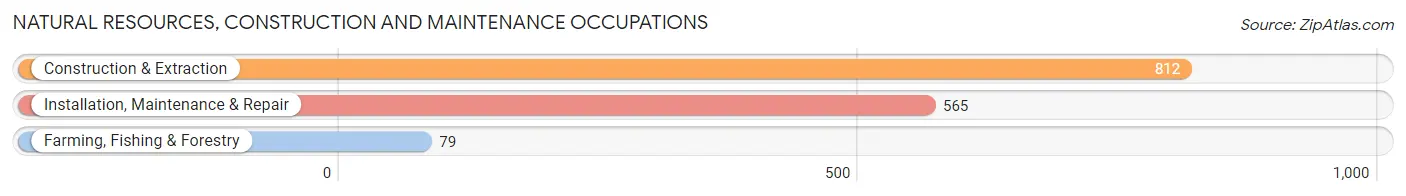
Natural Resources, Construction and Maintenance Occupations
The most common Natural Resources, Construction and Maintenance occupations in Dubuque are Construction & Extraction (812 | 2.7%), Installation, Maintenance & Repair (565 | 1.9%), and Farming, Fishing & Forestry (79 | 0.3%).
Natural Resources, Construction and Maintenance Occupations by Sex
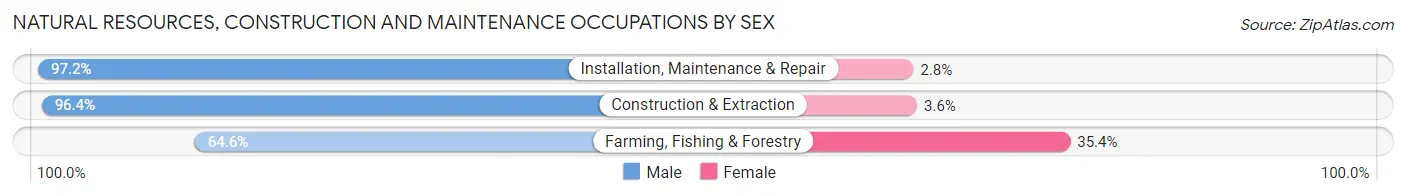
| Occupation | Male | Female |
| Farming, Fishing & Forestry | 51 (64.6%) | 28 (35.4%) |
| Construction & Extraction | 783 (96.4%) | 29 (3.6%) |
| Installation, Maintenance & Repair | 549 (97.2%) | 16 (2.8%) |
| Total (Category) | 1,383 (95.0%) | 73 (5.0%) |
| Total (Overall) | 15,152 (49.8%) | 15,252 (50.2%) |
Production, Transportation and Moving Occupations
The most common Production, Transportation and Moving occupations in Dubuque are Production (2,949 | 9.7%), Material Moving (1,754 | 5.8%), and Transportation (1,230 | 4.1%).
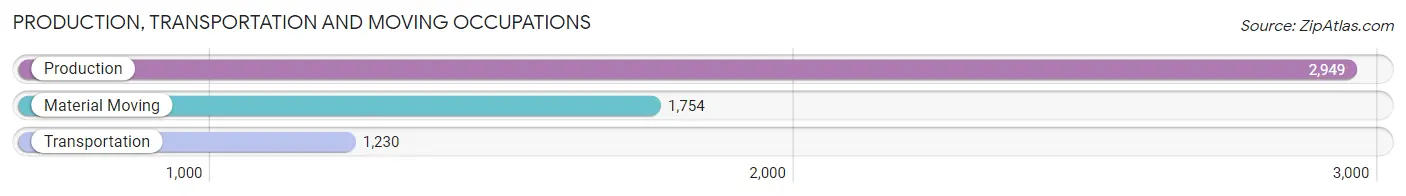
Production, Transportation and Moving Occupations by Sex
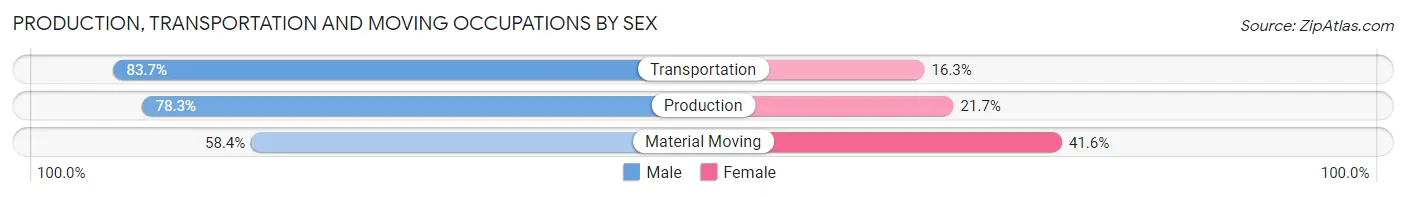
| Occupation | Male | Female |
| Production | 2,310 (78.3%) | 639 (21.7%) |
| Transportation | 1,029 (83.7%) | 201 (16.3%) |
| Material Moving | 1,025 (58.4%) | 729 (41.6%) |
| Total (Category) | 4,364 (73.6%) | 1,569 (26.5%) |
| Total (Overall) | 15,152 (49.8%) | 15,252 (50.2%) |
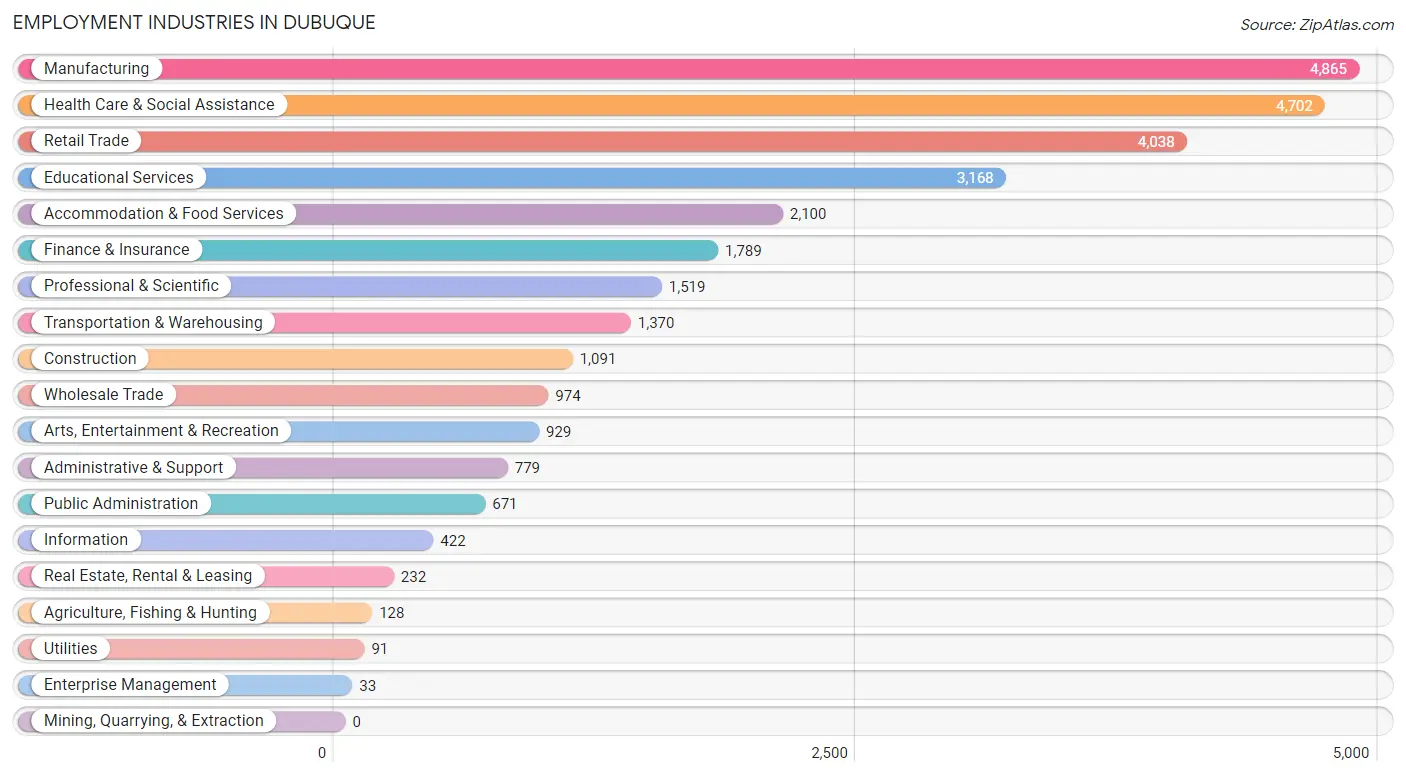
Employment Industries by Sex in Dubuque
Employment Industries in Dubuque
The major employment industries in Dubuque include Manufacturing (4,865 | 16.0%), Health Care & Social Assistance (4,702 | 15.5%), Retail Trade (4,038 | 13.3%), Educational Services (3,168 | 10.4%), and Accommodation & Food Services (2,100 | 6.9%).
Employment Industries by Sex in Dubuque
The Dubuque industries that see more men than women are Construction (91.2%), Utilities (85.7%), and Enterprise Management (81.8%), whereas the industries that tend to have a higher number of women are Health Care & Social Assistance (80.6%), Educational Services (64.8%), and Arts, Entertainment & Recreation (62.6%).
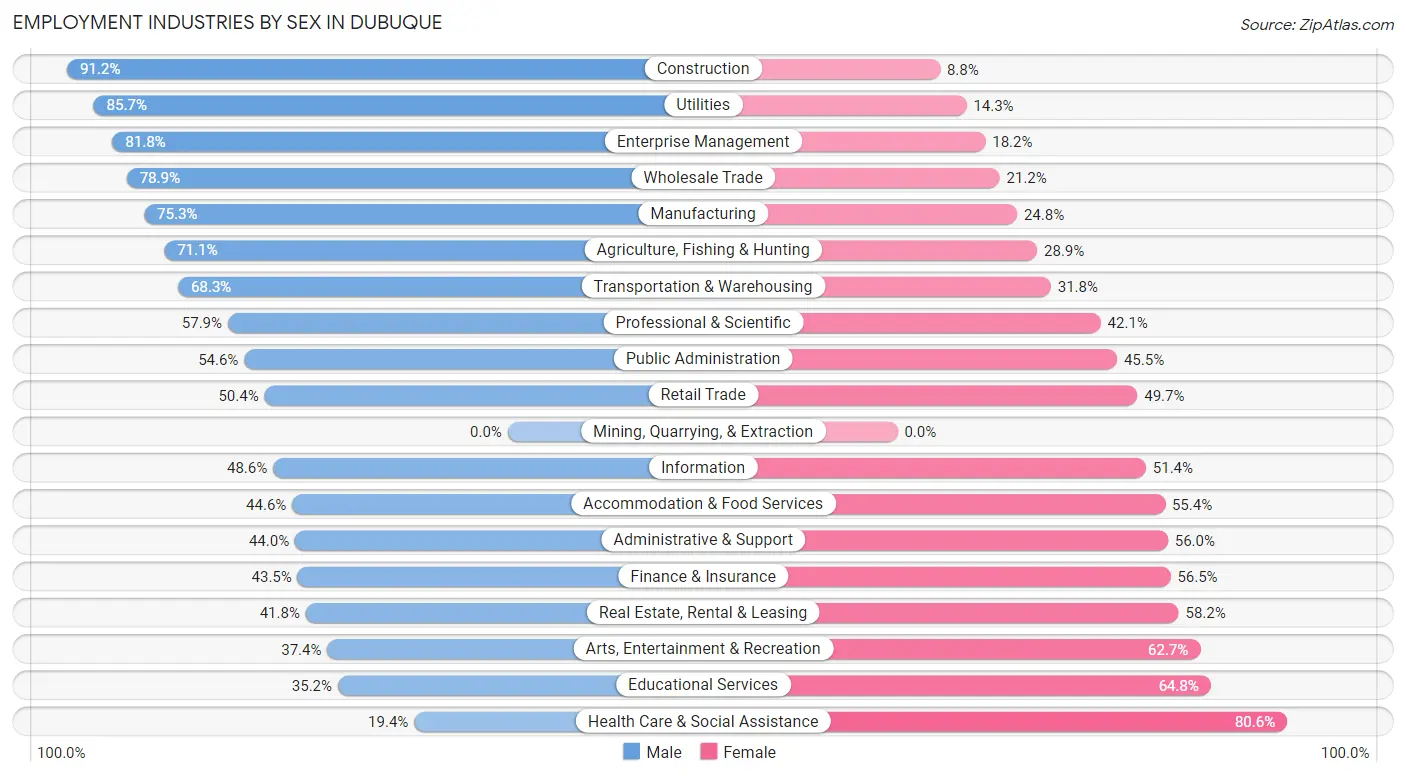
| Industry | Male | Female |
| Agriculture, Fishing & Hunting | 91 (71.1%) | 37 (28.9%) |
| Mining, Quarrying, & Extraction | 0 (0.0%) | 0 (0.0%) |
| Construction | 995 (91.2%) | 96 (8.8%) |
| Manufacturing | 3,661 (75.2%) | 1,204 (24.7%) |
| Wholesale Trade | 768 (78.8%) | 206 (21.1%) |
| Retail Trade | 2,033 (50.3%) | 2,005 (49.6%) |
| Transportation & Warehousing | 935 (68.2%) | 435 (31.8%) |
| Utilities | 78 (85.7%) | 13 (14.3%) |
| Information | 205 (48.6%) | 217 (51.4%) |
| Finance & Insurance | 778 (43.5%) | 1,011 (56.5%) |
| Real Estate, Rental & Leasing | 97 (41.8%) | 135 (58.2%) |
| Professional & Scientific | 880 (57.9%) | 639 (42.1%) |
| Enterprise Management | 27 (81.8%) | 6 (18.2%) |
| Administrative & Support | 343 (44.0%) | 436 (56.0%) |
| Educational Services | 1,114 (35.2%) | 2,054 (64.8%) |
| Health Care & Social Assistance | 911 (19.4%) | 3,791 (80.6%) |
| Arts, Entertainment & Recreation | 347 (37.3%) | 582 (62.6%) |
| Accommodation & Food Services | 937 (44.6%) | 1,163 (55.4%) |
| Public Administration | 366 (54.5%) | 305 (45.5%) |
| Total | 15,152 (49.8%) | 15,252 (50.2%) |
Education in Dubuque
School Enrollment in Dubuque
The most common levels of schooling among the 14,397 students in Dubuque are college / undergraduate (4,150 | 28.8%), high school (2,806 | 19.5%), and elementary school (2,430 | 16.9%).
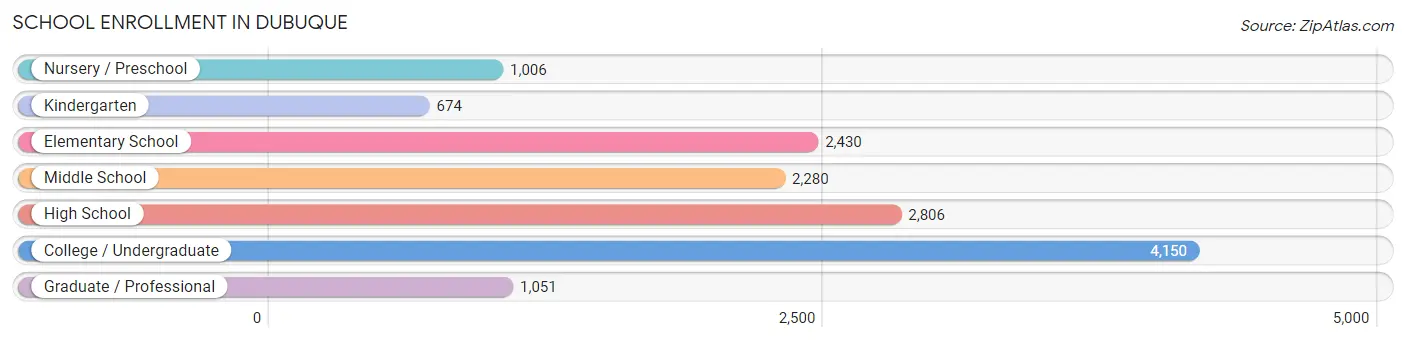
| School Level | # Students | % Students |
| Nursery / Preschool | 1,006 | 7.0% |
| Kindergarten | 674 | 4.7% |
| Elementary School | 2,430 | 16.9% |
| Middle School | 2,280 | 15.8% |
| High School | 2,806 | 19.5% |
| College / Undergraduate | 4,150 | 28.8% |
| Graduate / Professional | 1,051 | 7.3% |
| Total | 14,397 | 100.0% |
School Enrollment by Age by Funding Source in Dubuque
Out of a total of 14,397 students who are enrolled in schools in Dubuque, 5,255 (36.5%) attend a private institution, while the remaining 9,142 (63.5%) are enrolled in public schools. The age group of 20 to 24 year olds has the highest likelihood of being enrolled in private schools, with 1,934 (68.7% in the age bracket) enrolled. Conversely, the age group of 15 to 17 year olds has the lowest likelihood of being enrolled in a private school, with 1,869 (90.7% in the age bracket) attending a public institution.
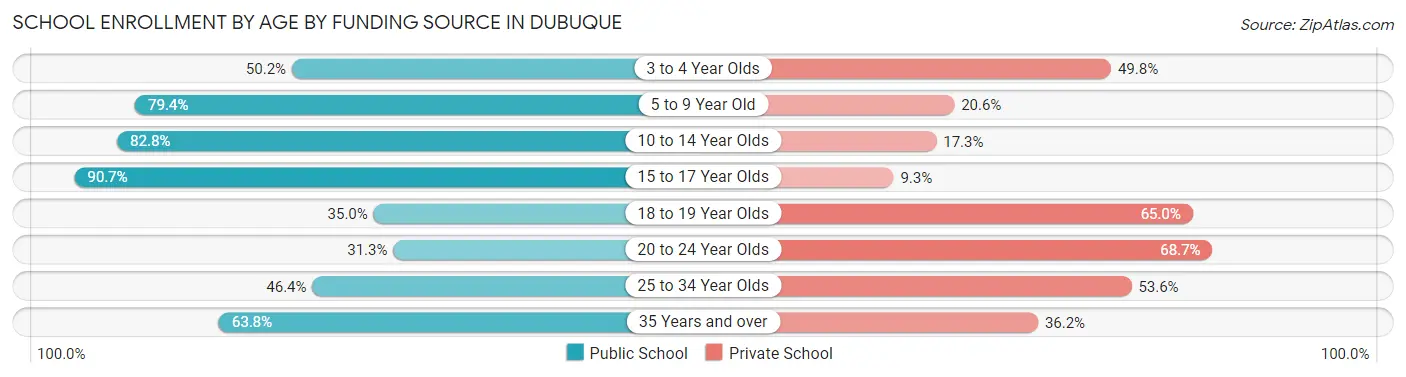
| Age Bracket | Public School | Private School |
| 3 to 4 Year Olds | 367 (50.2%) | 364 (49.8%) |
| 5 to 9 Year Old | 2,530 (79.4%) | 656 (20.6%) |
| 10 to 14 Year Olds | 2,288 (82.8%) | 477 (17.2%) |
| 15 to 17 Year Olds | 1,869 (90.7%) | 191 (9.3%) |
| 18 to 19 Year Olds | 556 (35.0%) | 1,033 (65.0%) |
| 20 to 24 Year Olds | 882 (31.3%) | 1,934 (68.7%) |
| 25 to 34 Year Olds | 412 (46.4%) | 476 (53.6%) |
| 35 Years and over | 231 (63.8%) | 131 (36.2%) |
| Total | 9,142 (63.5%) | 5,255 (36.5%) |
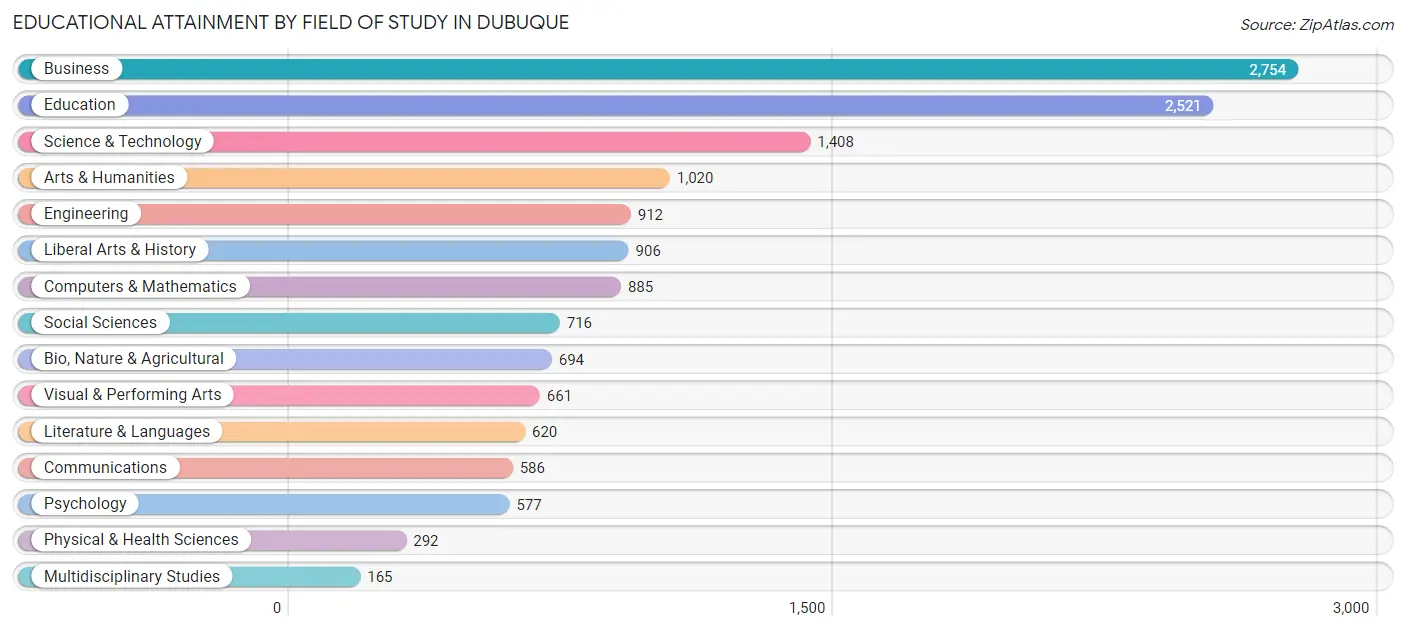
Educational Attainment by Field of Study in Dubuque
Business (2,754 | 18.7%), education (2,521 | 17.1%), science & technology (1,408 | 9.6%), arts & humanities (1,020 | 6.9%), and engineering (912 | 6.2%) are the most common fields of study among 14,717 individuals in Dubuque who have obtained a bachelor's degree or higher.
| Field of Study | # Graduates | % Graduates |
| Computers & Mathematics | 885 | 6.0% |
| Bio, Nature & Agricultural | 694 | 4.7% |
| Physical & Health Sciences | 292 | 2.0% |
| Psychology | 577 | 3.9% |
| Social Sciences | 716 | 4.9% |
| Engineering | 912 | 6.2% |
| Multidisciplinary Studies | 165 | 1.1% |
| Science & Technology | 1,408 | 9.6% |
| Business | 2,754 | 18.7% |
| Education | 2,521 | 17.1% |
| Literature & Languages | 620 | 4.2% |
| Liberal Arts & History | 906 | 6.2% |
| Visual & Performing Arts | 661 | 4.5% |
| Communications | 586 | 4.0% |
| Arts & Humanities | 1,020 | 6.9% |
| Total | 14,717 | 100.0% |
Transportation & Commute in Dubuque
Vehicle Availability by Sex in Dubuque
The most prevalent vehicle ownership categories in Dubuque are males with 2 vehicles (6,898, accounting for 47.8%) and females with 2 vehicles (6,291, making up 47.4%).
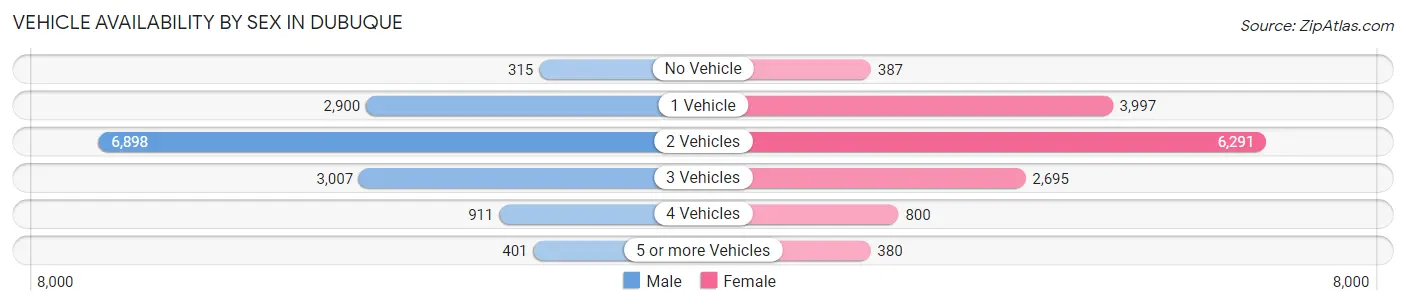
| Vehicles Available | Male | Female |
| No Vehicle | 315 (2.2%) | 387 (2.7%) |
| 1 Vehicle | 2,900 (20.1%) | 3,997 (27.5%) |
| 2 Vehicles | 6,898 (47.8%) | 6,291 (43.2%) |
| 3 Vehicles | 3,007 (20.8%) | 2,695 (18.5%) |
| 4 Vehicles | 911 (6.3%) | 800 (5.5%) |
| 5 or more Vehicles | 401 (2.8%) | 380 (2.6%) |
| Total | 14,432 (100.0%) | 14,550 (100.0%) |
Commute Time in Dubuque
The most frequently occuring commute durations in Dubuque are 10 to 14 minutes (8,169 commuters, 30.1%), 15 to 19 minutes (6,233 commuters, 23.0%), and 5 to 9 minutes (6,120 commuters, 22.6%).
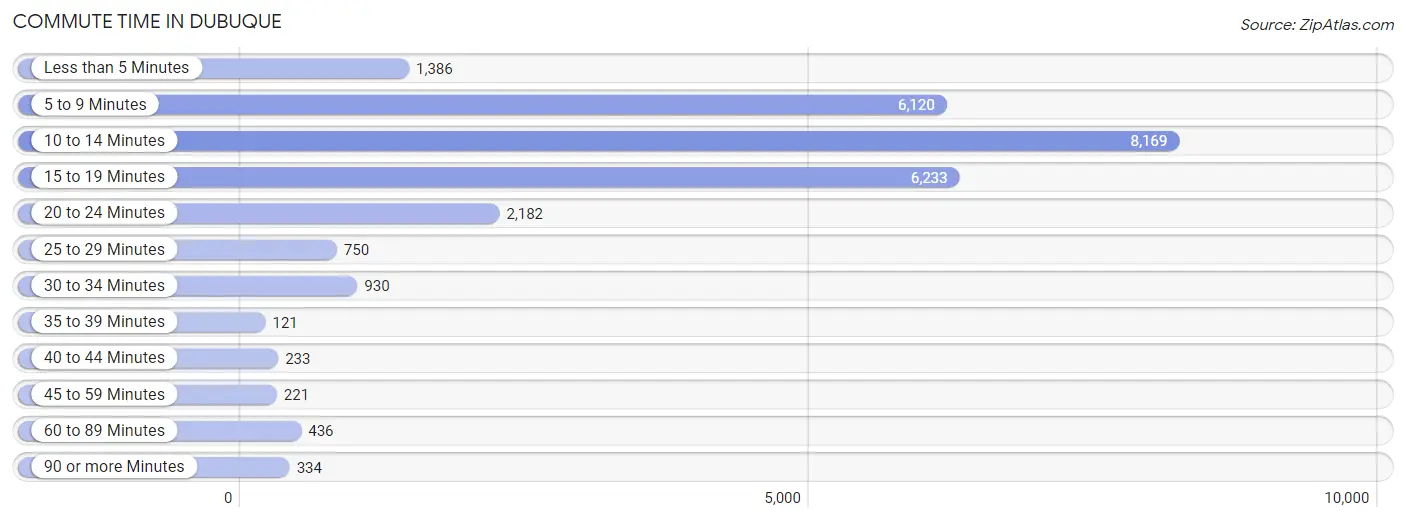
| Commute Time | # Commuters | % Commuters |
| Less than 5 Minutes | 1,386 | 5.1% |
| 5 to 9 Minutes | 6,120 | 22.6% |
| 10 to 14 Minutes | 8,169 | 30.1% |
| 15 to 19 Minutes | 6,233 | 23.0% |
| 20 to 24 Minutes | 2,182 | 8.1% |
| 25 to 29 Minutes | 750 | 2.8% |
| 30 to 34 Minutes | 930 | 3.4% |
| 35 to 39 Minutes | 121 | 0.4% |
| 40 to 44 Minutes | 233 | 0.9% |
| 45 to 59 Minutes | 221 | 0.8% |
| 60 to 89 Minutes | 436 | 1.6% |
| 90 or more Minutes | 334 | 1.2% |
Commute Time by Sex in Dubuque
The most common commute times in Dubuque are 10 to 14 minutes (4,003 commuters, 29.4%) for males and 10 to 14 minutes (4,166 commuters, 30.9%) for females.
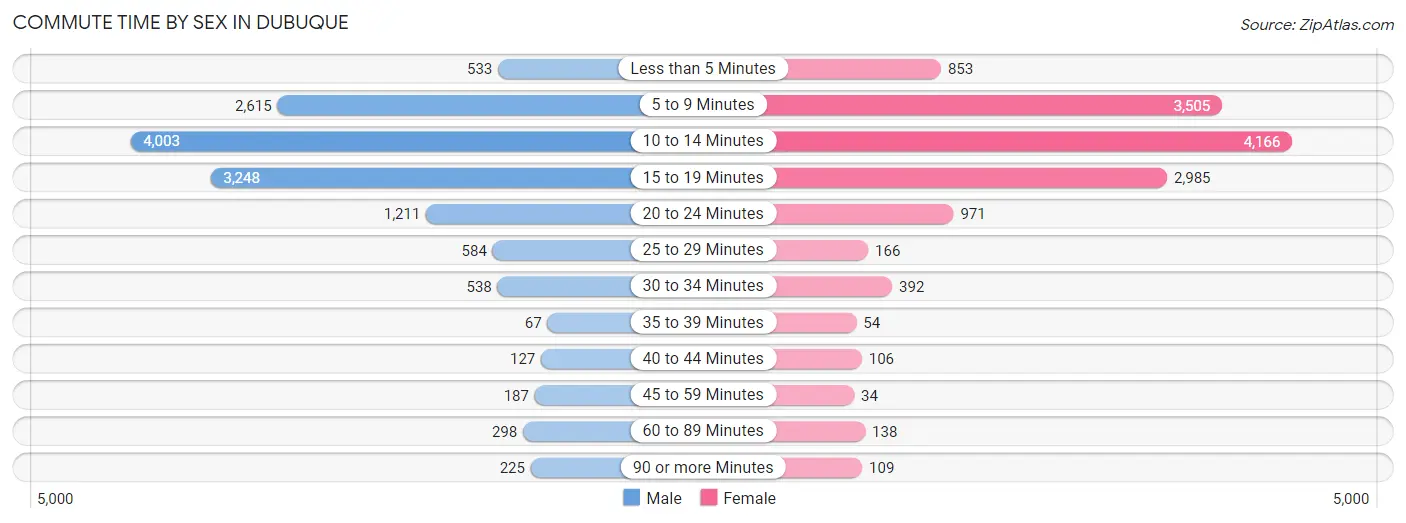
| Commute Time | Male | Female |
| Less than 5 Minutes | 533 (3.9%) | 853 (6.3%) |
| 5 to 9 Minutes | 2,615 (19.2%) | 3,505 (26.0%) |
| 10 to 14 Minutes | 4,003 (29.4%) | 4,166 (30.9%) |
| 15 to 19 Minutes | 3,248 (23.8%) | 2,985 (22.2%) |
| 20 to 24 Minutes | 1,211 (8.9%) | 971 (7.2%) |
| 25 to 29 Minutes | 584 (4.3%) | 166 (1.2%) |
| 30 to 34 Minutes | 538 (4.0%) | 392 (2.9%) |
| 35 to 39 Minutes | 67 (0.5%) | 54 (0.4%) |
| 40 to 44 Minutes | 127 (0.9%) | 106 (0.8%) |
| 45 to 59 Minutes | 187 (1.4%) | 34 (0.3%) |
| 60 to 89 Minutes | 298 (2.2%) | 138 (1.0%) |
| 90 or more Minutes | 225 (1.7%) | 109 (0.8%) |
Time of Departure to Work by Sex in Dubuque
The most frequent times of departure to work in Dubuque are 6:30 AM to 6:59 AM (1,780, 13.1%) for males and 7:30 AM to 7:59 AM (2,526, 18.7%) for females.
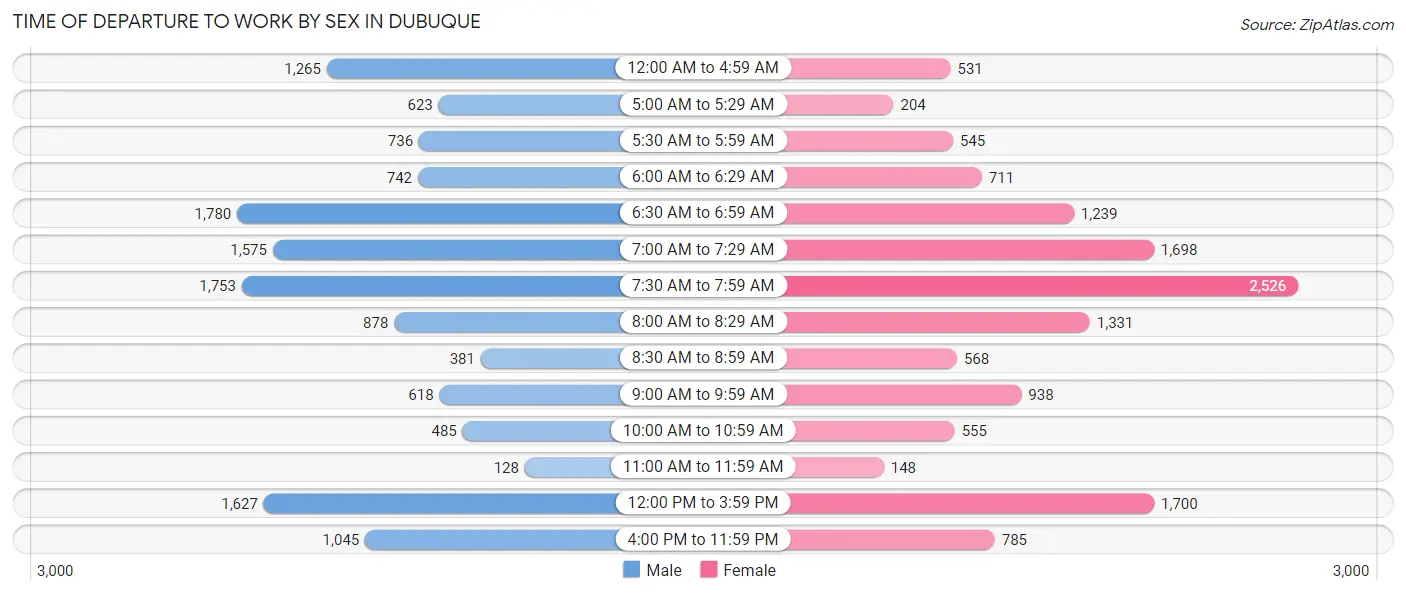
| Time of Departure | Male | Female |
| 12:00 AM to 4:59 AM | 1,265 (9.3%) | 531 (3.9%) |
| 5:00 AM to 5:29 AM | 623 (4.6%) | 204 (1.5%) |
| 5:30 AM to 5:59 AM | 736 (5.4%) | 545 (4.0%) |
| 6:00 AM to 6:29 AM | 742 (5.4%) | 711 (5.3%) |
| 6:30 AM to 6:59 AM | 1,780 (13.1%) | 1,239 (9.2%) |
| 7:00 AM to 7:29 AM | 1,575 (11.6%) | 1,698 (12.6%) |
| 7:30 AM to 7:59 AM | 1,753 (12.9%) | 2,526 (18.7%) |
| 8:00 AM to 8:29 AM | 878 (6.4%) | 1,331 (9.9%) |
| 8:30 AM to 8:59 AM | 381 (2.8%) | 568 (4.2%) |
| 9:00 AM to 9:59 AM | 618 (4.5%) | 938 (7.0%) |
| 10:00 AM to 10:59 AM | 485 (3.6%) | 555 (4.1%) |
| 11:00 AM to 11:59 AM | 128 (0.9%) | 148 (1.1%) |
| 12:00 PM to 3:59 PM | 1,627 (11.9%) | 1,700 (12.6%) |
| 4:00 PM to 11:59 PM | 1,045 (7.7%) | 785 (5.8%) |
| Total | 13,636 (100.0%) | 13,479 (100.0%) |
Housing Occupancy in Dubuque
Occupancy by Ownership in Dubuque
Of the total 25,198 dwellings in Dubuque, owner-occupied units account for 16,321 (64.8%), while renter-occupied units make up 8,877 (35.2%).
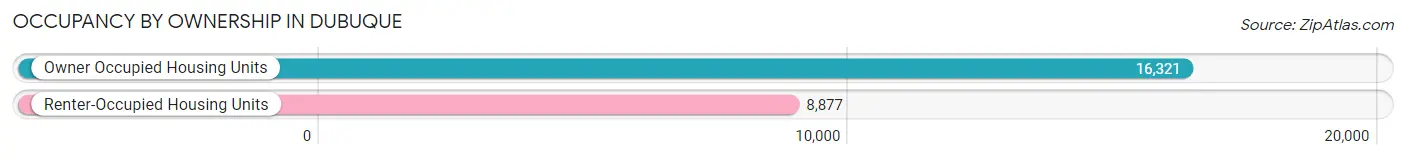
| Occupancy | # Housing Units | % Housing Units |
| Owner Occupied Housing Units | 16,321 | 64.8% |
| Renter-Occupied Housing Units | 8,877 | 35.2% |
| Total Occupied Housing Units | 25,198 | 100.0% |
Occupancy by Household Size in Dubuque
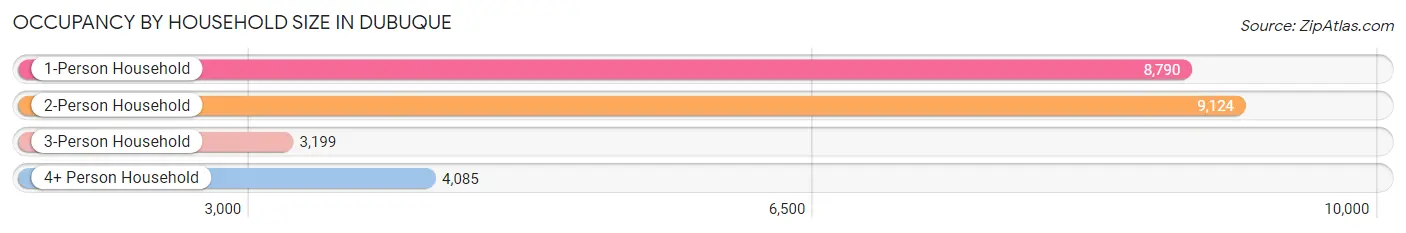
| Household Size | # Housing Units | % Housing Units |
| 1-Person Household | 8,790 | 34.9% |
| 2-Person Household | 9,124 | 36.2% |
| 3-Person Household | 3,199 | 12.7% |
| 4+ Person Household | 4,085 | 16.2% |
| Total Housing Units | 25,198 | 100.0% |
Occupancy by Ownership by Household Size in Dubuque
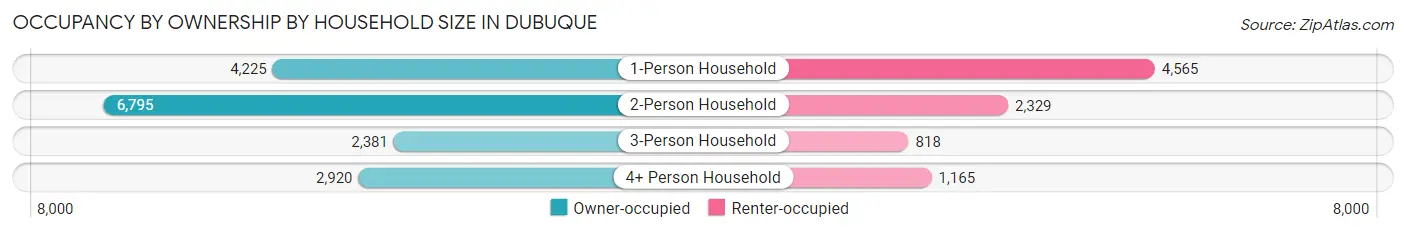
| Household Size | Owner-occupied | Renter-occupied |
| 1-Person Household | 4,225 (48.1%) | 4,565 (51.9%) |
| 2-Person Household | 6,795 (74.5%) | 2,329 (25.5%) |
| 3-Person Household | 2,381 (74.4%) | 818 (25.6%) |
| 4+ Person Household | 2,920 (71.5%) | 1,165 (28.5%) |
| Total Housing Units | 16,321 (64.8%) | 8,877 (35.2%) |
Occupancy by Educational Attainment in Dubuque
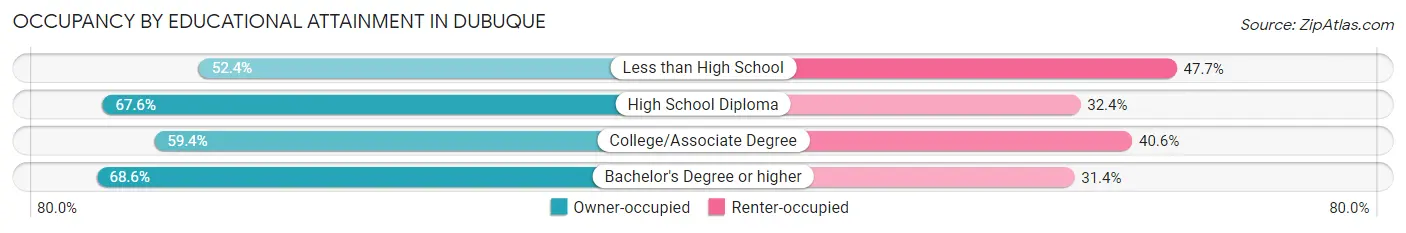
| Household Size | Owner-occupied | Renter-occupied |
| Less than High School | 723 (52.3%) | 658 (47.6%) |
| High School Diploma | 5,052 (67.6%) | 2,419 (32.4%) |
| College/Associate Degree | 4,298 (59.4%) | 2,937 (40.6%) |
| Bachelor's Degree or higher | 6,248 (68.6%) | 2,863 (31.4%) |
Occupancy by Age of Householder in Dubuque
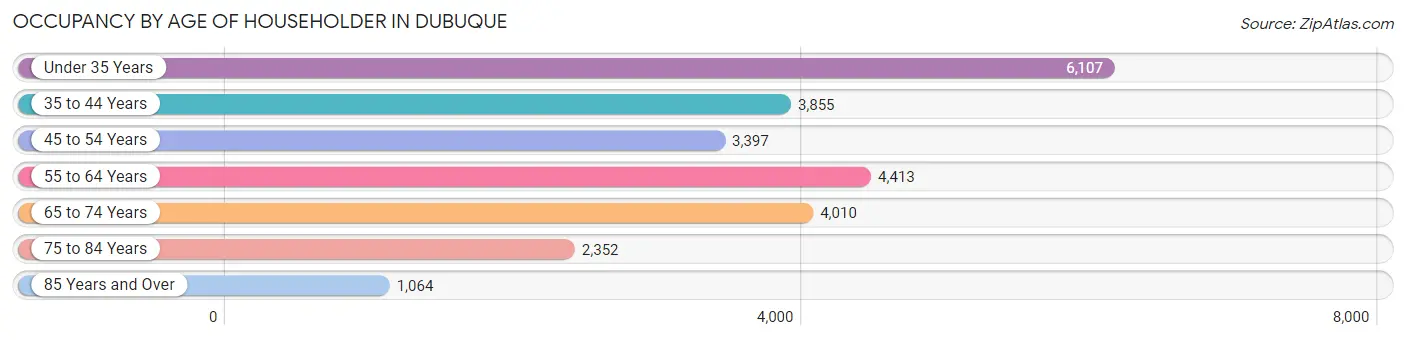
| Age Bracket | # Households | % Households |
| Under 35 Years | 6,107 | 24.2% |
| 35 to 44 Years | 3,855 | 15.3% |
| 45 to 54 Years | 3,397 | 13.5% |
| 55 to 64 Years | 4,413 | 17.5% |
| 65 to 74 Years | 4,010 | 15.9% |
| 75 to 84 Years | 2,352 | 9.3% |
| 85 Years and Over | 1,064 | 4.2% |
| Total | 25,198 | 100.0% |
Housing Finances in Dubuque
Median Income by Occupancy in Dubuque
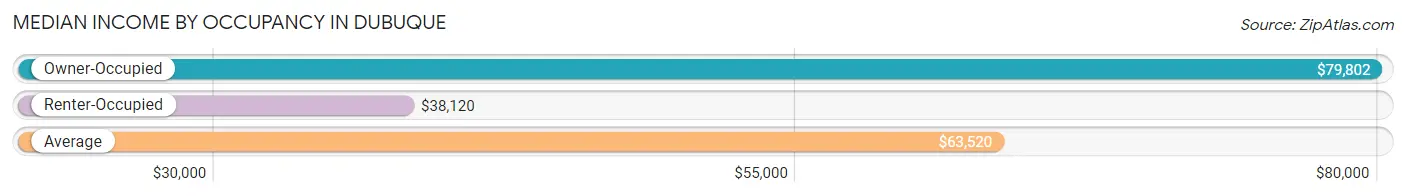
| Occupancy Type | # Households | Median Income |
| Owner-Occupied | 16,321 (64.8%) | $79,802 |
| Renter-Occupied | 8,877 (35.2%) | $38,120 |
| Average | 25,198 (100.0%) | $63,520 |
Occupancy by Householder Income Bracket in Dubuque
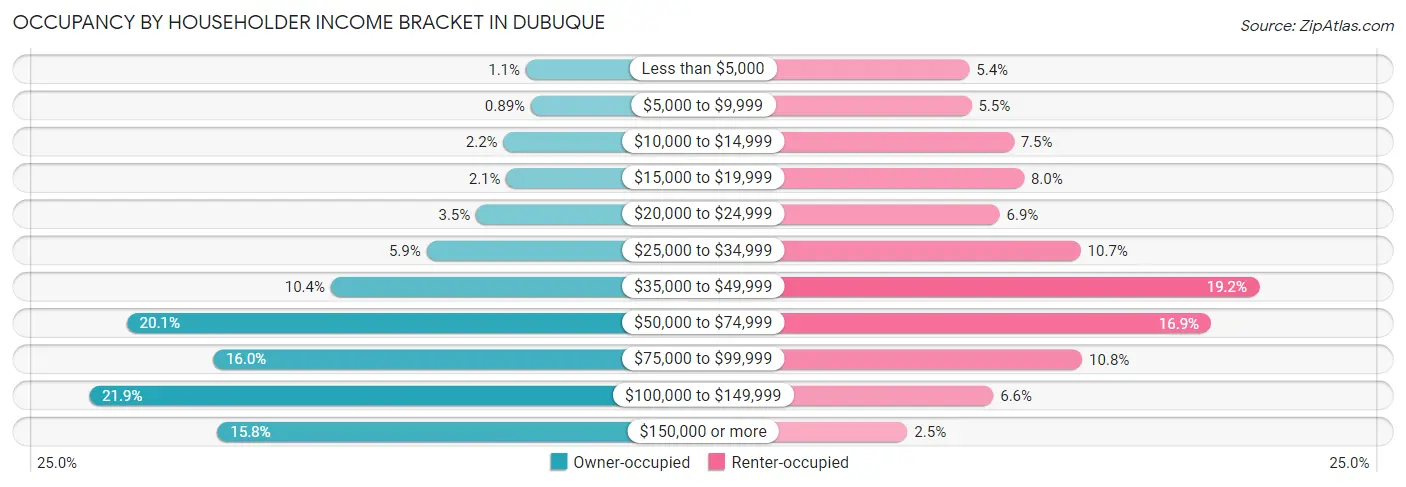
| Income Bracket | Owner-occupied | Renter-occupied |
| Less than $5,000 | 184 (1.1%) | 481 (5.4%) |
| $5,000 to $9,999 | 146 (0.9%) | 490 (5.5%) |
| $10,000 to $14,999 | 359 (2.2%) | 668 (7.5%) |
| $15,000 to $19,999 | 337 (2.1%) | 712 (8.0%) |
| $20,000 to $24,999 | 572 (3.5%) | 609 (6.9%) |
| $25,000 to $34,999 | 957 (5.9%) | 952 (10.7%) |
| $35,000 to $49,999 | 1,701 (10.4%) | 1,704 (19.2%) |
| $50,000 to $74,999 | 3,287 (20.1%) | 1,502 (16.9%) |
| $75,000 to $99,999 | 2,617 (16.0%) | 958 (10.8%) |
| $100,000 to $149,999 | 3,579 (21.9%) | 582 (6.6%) |
| $150,000 or more | 2,582 (15.8%) | 219 (2.5%) |
| Total | 16,321 (100.0%) | 8,877 (100.0%) |
Monthly Housing Cost Tiers in Dubuque
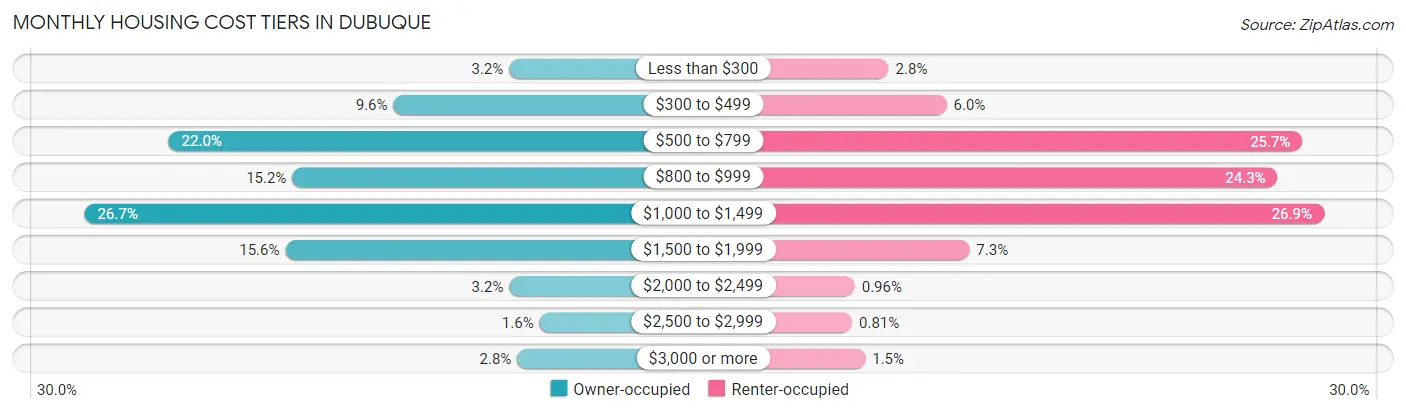
| Monthly Cost | Owner-occupied | Renter-occupied |
| Less than $300 | 528 (3.2%) | 251 (2.8%) |
| $300 to $499 | 1,572 (9.6%) | 535 (6.0%) |
| $500 to $799 | 3,597 (22.0%) | 2,279 (25.7%) |
| $800 to $999 | 2,484 (15.2%) | 2,157 (24.3%) |
| $1,000 to $1,499 | 4,356 (26.7%) | 2,384 (26.9%) |
| $1,500 to $1,999 | 2,546 (15.6%) | 647 (7.3%) |
| $2,000 to $2,499 | 527 (3.2%) | 85 (1.0%) |
| $2,500 to $2,999 | 255 (1.6%) | 72 (0.8%) |
| $3,000 or more | 456 (2.8%) | 137 (1.5%) |
| Total | 16,321 (100.0%) | 8,877 (100.0%) |
Physical Housing Characteristics in Dubuque
Housing Structures in Dubuque
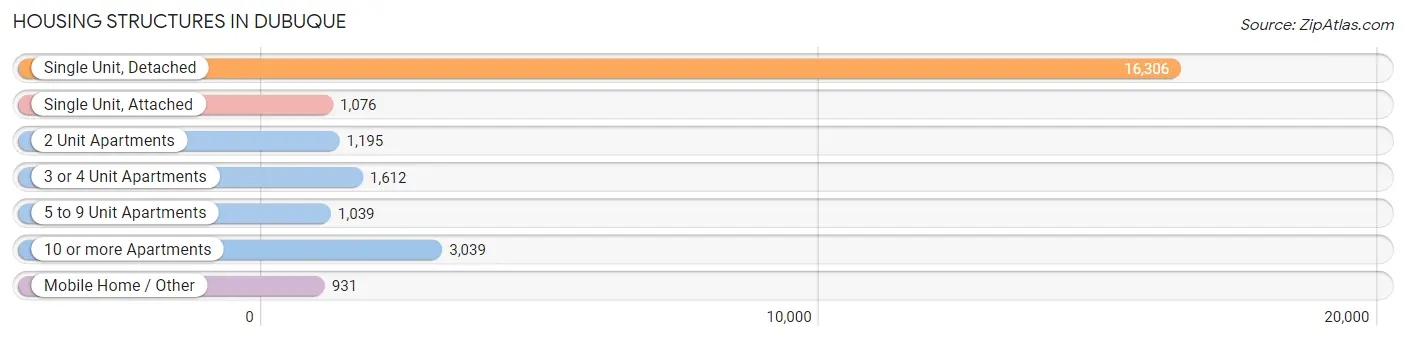
| Structure Type | # Housing Units | % Housing Units |
| Single Unit, Detached | 16,306 | 64.7% |
| Single Unit, Attached | 1,076 | 4.3% |
| 2 Unit Apartments | 1,195 | 4.7% |
| 3 or 4 Unit Apartments | 1,612 | 6.4% |
| 5 to 9 Unit Apartments | 1,039 | 4.1% |
| 10 or more Apartments | 3,039 | 12.1% |
| Mobile Home / Other | 931 | 3.7% |
| Total | 25,198 | 100.0% |
Housing Structures by Occupancy in Dubuque
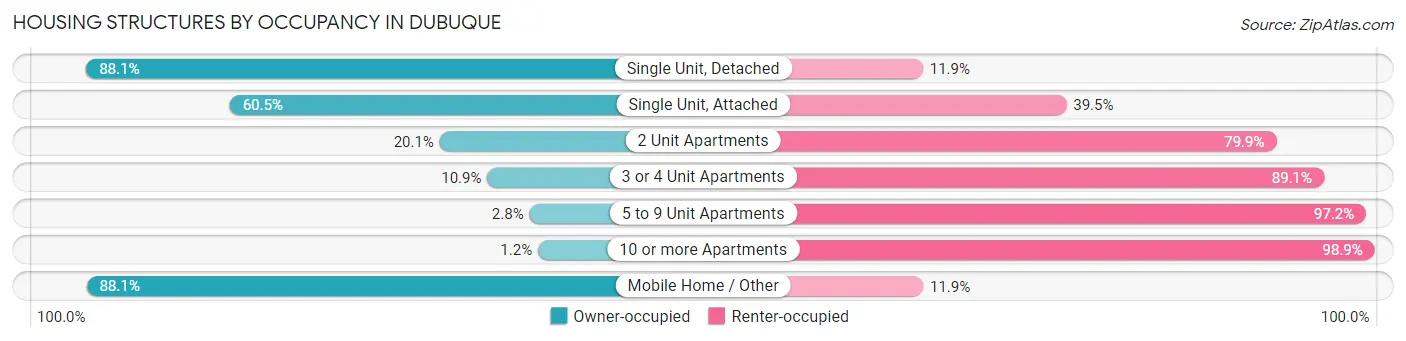
| Structure Type | Owner-occupied | Renter-occupied |
| Single Unit, Detached | 14,370 (88.1%) | 1,936 (11.9%) |
| Single Unit, Attached | 651 (60.5%) | 425 (39.5%) |
| 2 Unit Apartments | 240 (20.1%) | 955 (79.9%) |
| 3 or 4 Unit Apartments | 176 (10.9%) | 1,436 (89.1%) |
| 5 to 9 Unit Apartments | 29 (2.8%) | 1,010 (97.2%) |
| 10 or more Apartments | 35 (1.1%) | 3,004 (98.9%) |
| Mobile Home / Other | 820 (88.1%) | 111 (11.9%) |
| Total | 16,321 (64.8%) | 8,877 (35.2%) |
Housing Structures by Number of Rooms in Dubuque
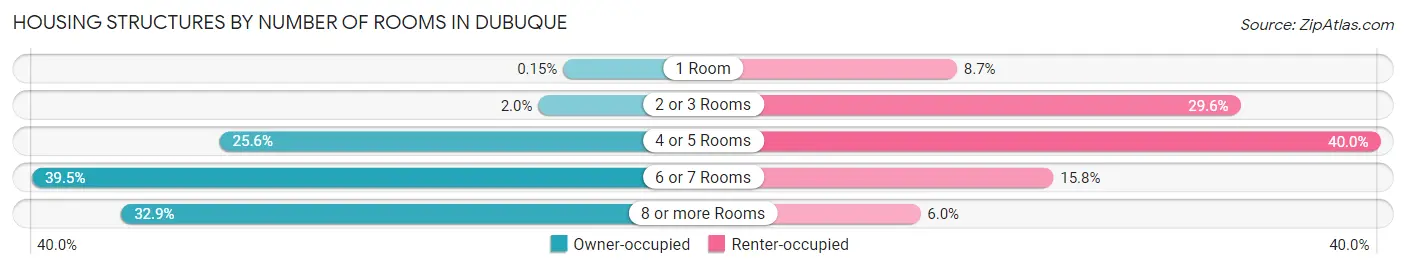
| Number of Rooms | Owner-occupied | Renter-occupied |
| 1 Room | 24 (0.2%) | 768 (8.6%) |
| 2 or 3 Rooms | 324 (2.0%) | 2,630 (29.6%) |
| 4 or 5 Rooms | 4,173 (25.6%) | 3,549 (40.0%) |
| 6 or 7 Rooms | 6,438 (39.5%) | 1,402 (15.8%) |
| 8 or more Rooms | 5,362 (32.9%) | 528 (5.9%) |
| Total | 16,321 (100.0%) | 8,877 (100.0%) |
Housing Structure by Heating Type in Dubuque
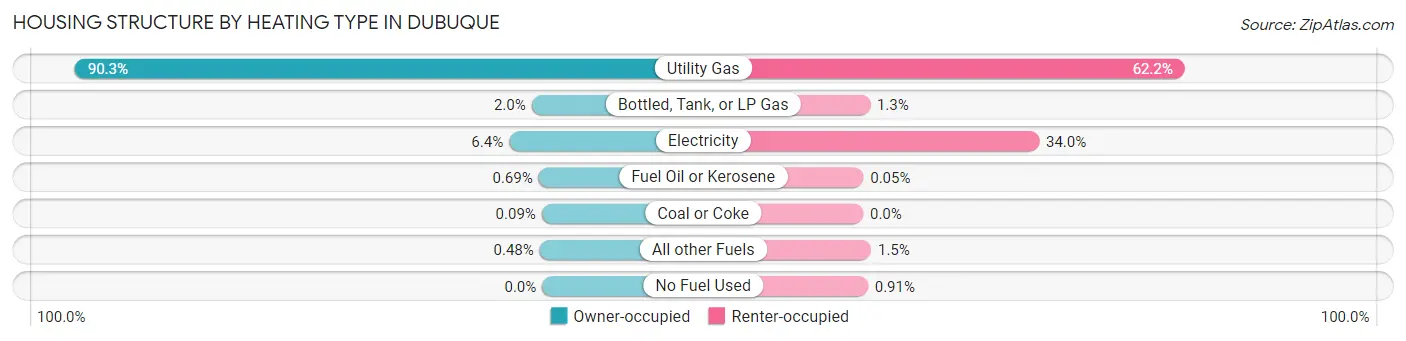
| Heating Type | Owner-occupied | Renter-occupied |
| Utility Gas | 14,738 (90.3%) | 5,518 (62.2%) |
| Bottled, Tank, or LP Gas | 333 (2.0%) | 118 (1.3%) |
| Electricity | 1,044 (6.4%) | 3,019 (34.0%) |
| Fuel Oil or Kerosene | 113 (0.7%) | 4 (0.1%) |
| Coal or Coke | 14 (0.1%) | 0 (0.0%) |
| All other Fuels | 79 (0.5%) | 137 (1.5%) |
| No Fuel Used | 0 (0.0%) | 81 (0.9%) |
| Total | 16,321 (100.0%) | 8,877 (100.0%) |
Household Vehicle Usage in Dubuque
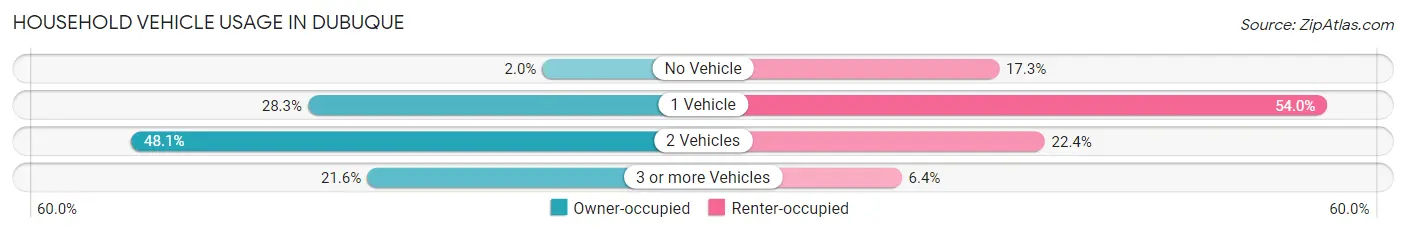
| Vehicles per Household | Owner-occupied | Renter-occupied |
| No Vehicle | 330 (2.0%) | 1,532 (17.3%) |
| 1 Vehicle | 4,615 (28.3%) | 4,795 (54.0%) |
| 2 Vehicles | 7,844 (48.1%) | 1,986 (22.4%) |
| 3 or more Vehicles | 3,532 (21.6%) | 564 (6.4%) |
| Total | 16,321 (100.0%) | 8,877 (100.0%) |
Real Estate & Mortgages in Dubuque
Real Estate and Mortgage Overview in Dubuque
| Characteristic | Without Mortgage | With Mortgage |
| Housing Units | 6,241 | 10,080 |
| Median Property Value | $174,400 | $179,400 |
| Median Household Income | $64,181 | $1,796 |
| Monthly Housing Costs | $598 | $441 |
| Real Estate Taxes | $2,623 | $180 |
Property Value by Mortgage Status in Dubuque
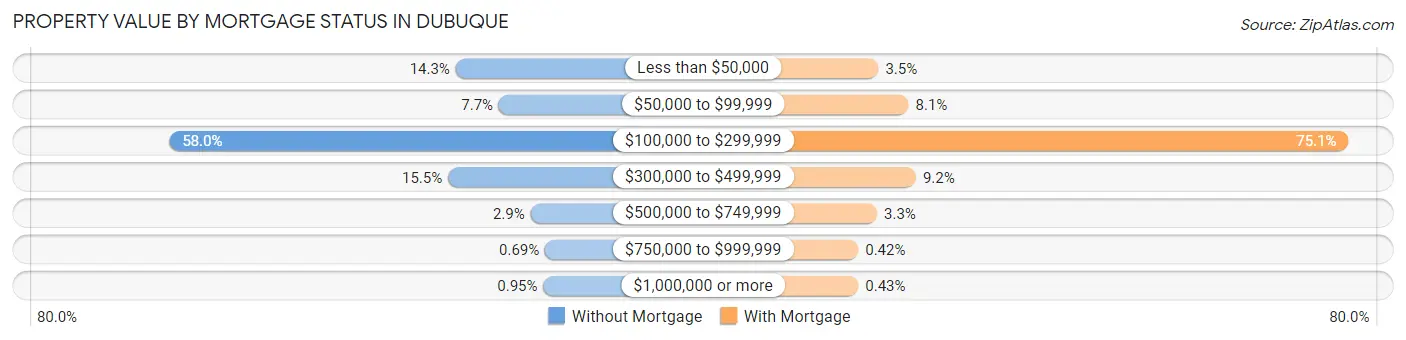
| Property Value | Without Mortgage | With Mortgage |
| Less than $50,000 | 893 (14.3%) | 352 (3.5%) |
| $50,000 to $99,999 | 482 (7.7%) | 814 (8.1%) |
| $100,000 to $299,999 | 3,617 (58.0%) | 7,570 (75.1%) |
| $300,000 to $499,999 | 966 (15.5%) | 928 (9.2%) |
| $500,000 to $749,999 | 181 (2.9%) | 331 (3.3%) |
| $750,000 to $999,999 | 43 (0.7%) | 42 (0.4%) |
| $1,000,000 or more | 59 (0.9%) | 43 (0.4%) |
| Total | 6,241 (100.0%) | 10,080 (100.0%) |
Household Income by Mortgage Status in Dubuque
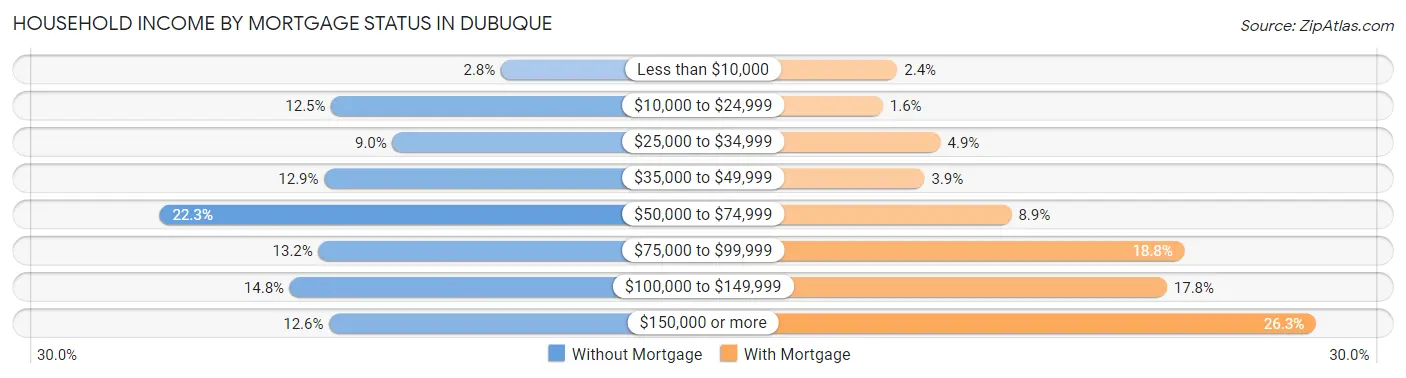
| Household Income | Without Mortgage | With Mortgage |
| Less than $10,000 | 173 (2.8%) | 241 (2.4%) |
| $10,000 to $24,999 | 778 (12.5%) | 157 (1.6%) |
| $25,000 to $34,999 | 560 (9.0%) | 490 (4.9%) |
| $35,000 to $49,999 | 803 (12.9%) | 397 (3.9%) |
| $50,000 to $74,999 | 1,391 (22.3%) | 898 (8.9%) |
| $75,000 to $99,999 | 824 (13.2%) | 1,896 (18.8%) |
| $100,000 to $149,999 | 926 (14.8%) | 1,793 (17.8%) |
| $150,000 or more | 786 (12.6%) | 2,653 (26.3%) |
| Total | 6,241 (100.0%) | 10,080 (100.0%) |
Property Value to Household Income Ratio in Dubuque
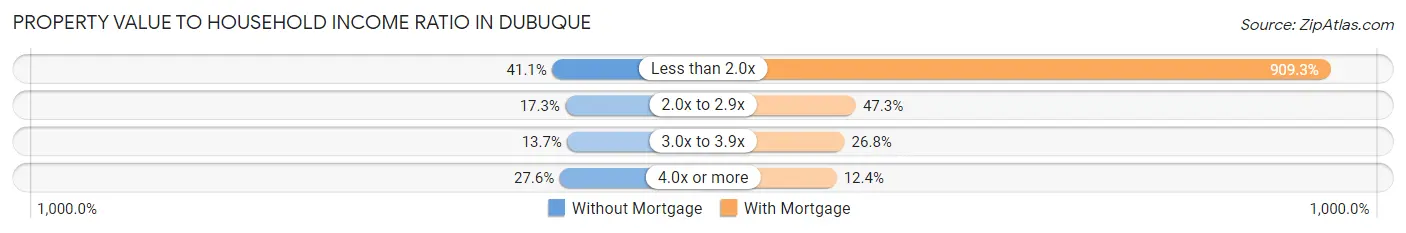
| Value-to-Income Ratio | Without Mortgage | With Mortgage |
| Less than 2.0x | 2,564 (41.1%) | 91,659 (909.3%) |
| 2.0x to 2.9x | 1,079 (17.3%) | 4,772 (47.3%) |
| 3.0x to 3.9x | 854 (13.7%) | 2,697 (26.8%) |
| 4.0x or more | 1,722 (27.6%) | 1,248 (12.4%) |
| Total | 6,241 (100.0%) | 10,080 (100.0%) |
Real Estate Taxes by Mortgage Status in Dubuque
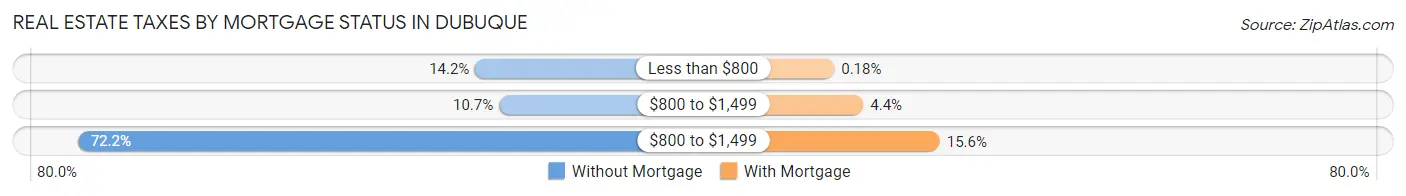
| Property Taxes | Without Mortgage | With Mortgage |
| Less than $800 | 884 (14.2%) | 18 (0.2%) |
| $800 to $1,499 | 666 (10.7%) | 447 (4.4%) |
| $800 to $1,499 | 4,508 (72.2%) | 1,572 (15.6%) |
| Total | 6,241 (100.0%) | 10,080 (100.0%) |
Health & Disability in Dubuque
Health Insurance Coverage by Age in Dubuque
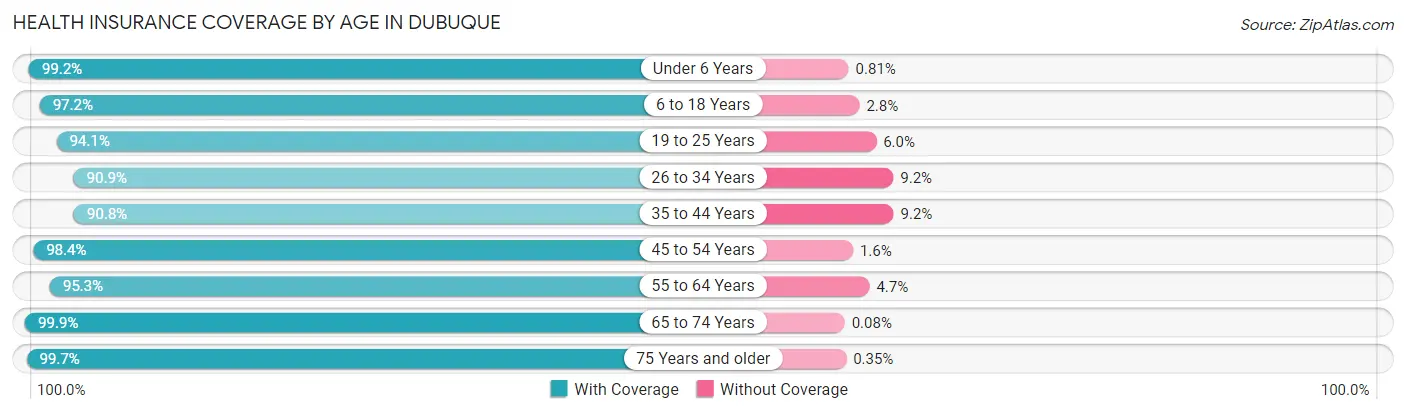
| Age Bracket | With Coverage | Without Coverage |
| Under 6 Years | 3,926 (99.2%) | 32 (0.8%) |
| 6 to 18 Years | 8,354 (97.2%) | 243 (2.8%) |
| 19 to 25 Years | 7,271 (94.1%) | 460 (5.9%) |
| 26 to 34 Years | 6,278 (90.8%) | 632 (9.1%) |
| 35 to 44 Years | 5,766 (90.8%) | 584 (9.2%) |
| 45 to 54 Years | 5,744 (98.4%) | 94 (1.6%) |
| 55 to 64 Years | 7,113 (95.3%) | 351 (4.7%) |
| 65 to 74 Years | 6,228 (99.9%) | 5 (0.1%) |
| 75 Years and older | 5,084 (99.7%) | 18 (0.4%) |
| Total | 55,764 (95.8%) | 2,419 (4.2%) |
Health Insurance Coverage by Citizenship Status in Dubuque
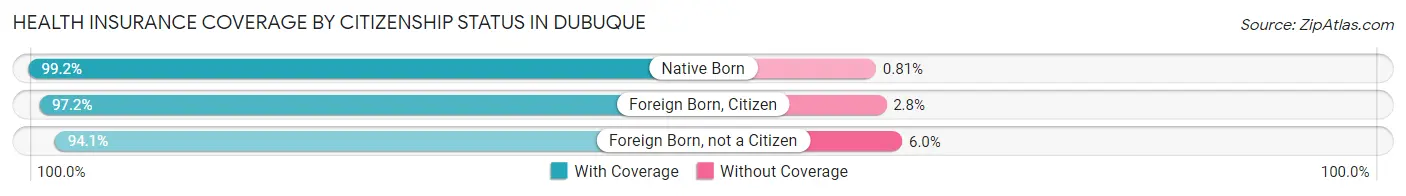
| Citizenship Status | With Coverage | Without Coverage |
| Native Born | 3,926 (99.2%) | 32 (0.8%) |
| Foreign Born, Citizen | 8,354 (97.2%) | 243 (2.8%) |
| Foreign Born, not a Citizen | 7,271 (94.1%) | 460 (5.9%) |
Health Insurance Coverage by Household Income in Dubuque
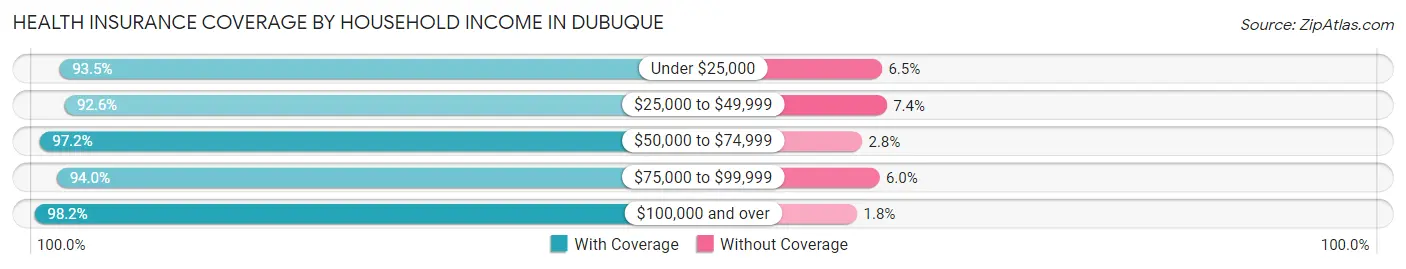
| Household Income | With Coverage | Without Coverage |
| Under $25,000 | 6,783 (93.5%) | 471 (6.5%) |
| $25,000 to $49,999 | 8,627 (92.6%) | 687 (7.4%) |
| $50,000 to $74,999 | 9,843 (97.2%) | 279 (2.8%) |
| $75,000 to $99,999 | 8,327 (94.0%) | 534 (6.0%) |
| $100,000 and over | 19,556 (98.2%) | 365 (1.8%) |
Public vs Private Health Insurance Coverage by Age in Dubuque
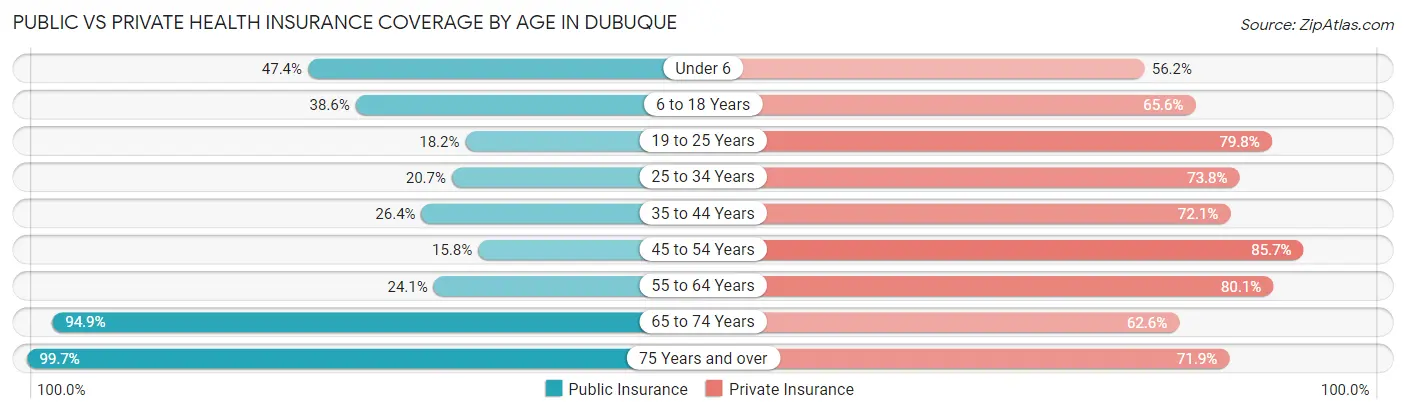
| Age Bracket | Public Insurance | Private Insurance |
| Under 6 | 1,877 (47.4%) | 2,226 (56.2%) |
| 6 to 18 Years | 3,315 (38.6%) | 5,640 (65.6%) |
| 19 to 25 Years | 1,407 (18.2%) | 6,167 (79.8%) |
| 25 to 34 Years | 1,431 (20.7%) | 5,098 (73.8%) |
| 35 to 44 Years | 1,673 (26.4%) | 4,577 (72.1%) |
| 45 to 54 Years | 925 (15.8%) | 5,002 (85.7%) |
| 55 to 64 Years | 1,798 (24.1%) | 5,976 (80.1%) |
| 65 to 74 Years | 5,912 (94.9%) | 3,901 (62.6%) |
| 75 Years and over | 5,084 (99.7%) | 3,668 (71.9%) |
| Total | 23,422 (40.3%) | 42,255 (72.6%) |
Disability Status by Sex by Age in Dubuque
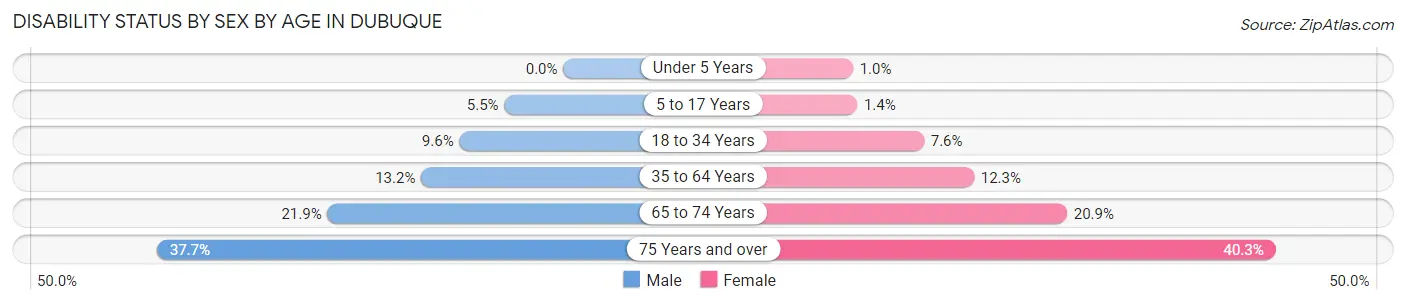
| Age Bracket | Male | Female |
| Under 5 Years | 0 (0.0%) | 18 (1.0%) |
| 5 to 17 Years | 214 (5.5%) | 60 (1.4%) |
| 18 to 34 Years | 788 (9.6%) | 570 (7.6%) |
| 35 to 64 Years | 1,311 (13.2%) | 1,190 (12.2%) |
| 65 to 74 Years | 642 (21.9%) | 689 (20.9%) |
| 75 Years and over | 689 (37.7%) | 1,319 (40.3%) |
Disability Class by Sex by Age in Dubuque
Disability Class: Hearing Difficulty
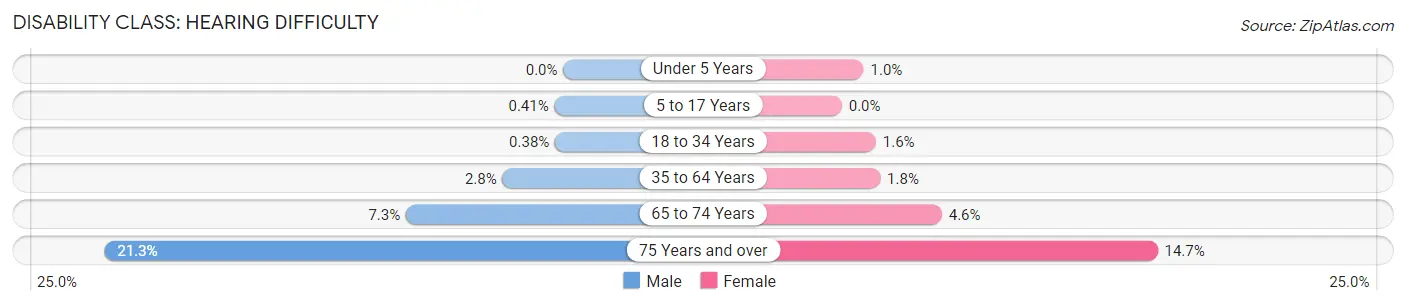
| Age Bracket | Male | Female |
| Under 5 Years | 0 (0.0%) | 18 (1.0%) |
| 5 to 17 Years | 16 (0.4%) | 0 (0.0%) |
| 18 to 34 Years | 31 (0.4%) | 118 (1.6%) |
| 35 to 64 Years | 280 (2.8%) | 173 (1.8%) |
| 65 to 74 Years | 214 (7.3%) | 153 (4.6%) |
| 75 Years and over | 389 (21.3%) | 480 (14.6%) |
Disability Class: Vision Difficulty
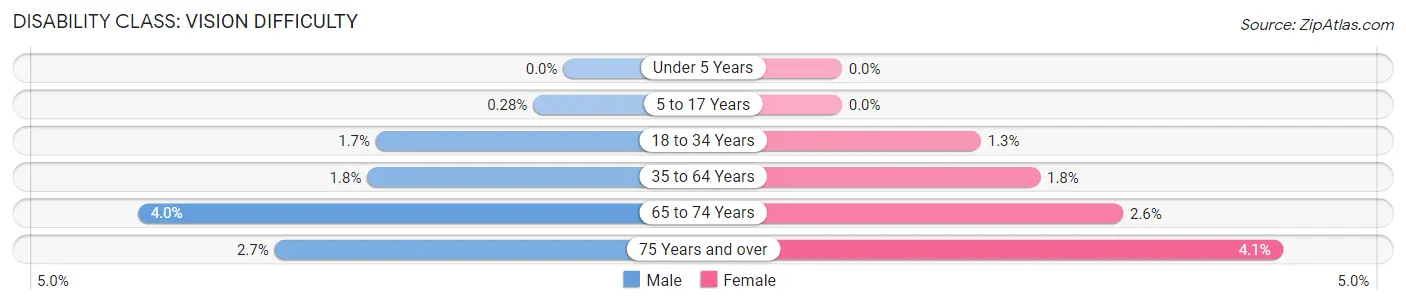
| Age Bracket | Male | Female |
| Under 5 Years | 0 (0.0%) | 0 (0.0%) |
| 5 to 17 Years | 11 (0.3%) | 0 (0.0%) |
| 18 to 34 Years | 142 (1.7%) | 97 (1.3%) |
| 35 to 64 Years | 181 (1.8%) | 179 (1.8%) |
| 65 to 74 Years | 116 (4.0%) | 86 (2.6%) |
| 75 Years and over | 49 (2.7%) | 134 (4.1%) |
Disability Class: Cognitive Difficulty
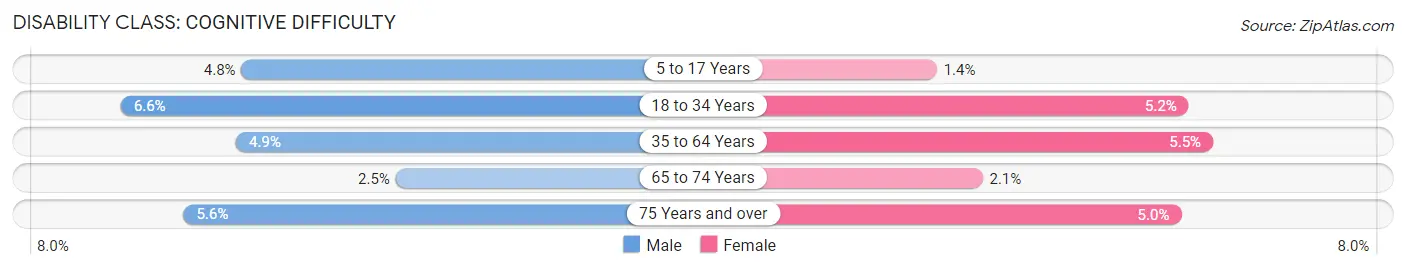
| Age Bracket | Male | Female |
| 5 to 17 Years | 187 (4.8%) | 60 (1.4%) |
| 18 to 34 Years | 537 (6.6%) | 386 (5.1%) |
| 35 to 64 Years | 483 (4.9%) | 535 (5.5%) |
| 65 to 74 Years | 73 (2.5%) | 69 (2.1%) |
| 75 Years and over | 103 (5.6%) | 165 (5.0%) |
Disability Class: Ambulatory Difficulty
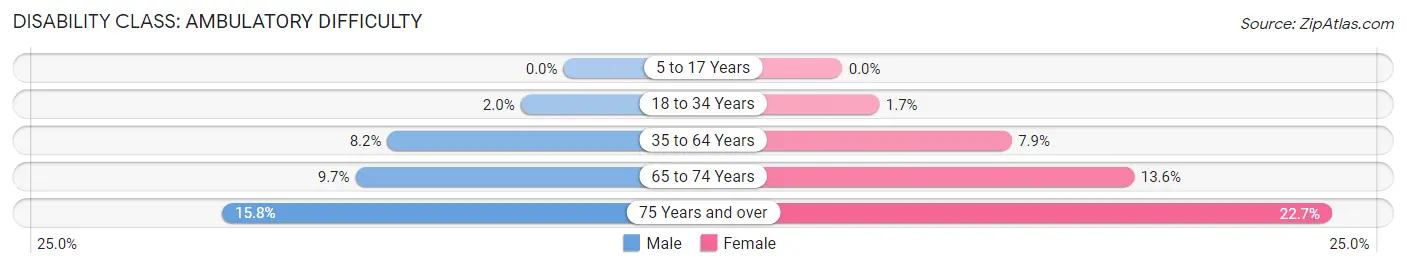
| Age Bracket | Male | Female |
| 5 to 17 Years | 0 (0.0%) | 0 (0.0%) |
| 18 to 34 Years | 163 (2.0%) | 129 (1.7%) |
| 35 to 64 Years | 812 (8.2%) | 763 (7.9%) |
| 65 to 74 Years | 283 (9.7%) | 447 (13.6%) |
| 75 Years and over | 289 (15.8%) | 745 (22.7%) |
Disability Class: Self-Care Difficulty
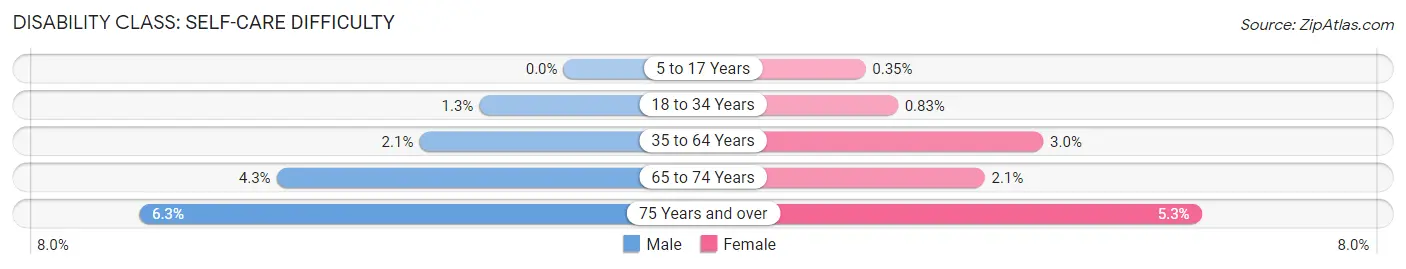
| Age Bracket | Male | Female |
| 5 to 17 Years | 0 (0.0%) | 15 (0.4%) |
| 18 to 34 Years | 102 (1.3%) | 62 (0.8%) |
| 35 to 64 Years | 213 (2.1%) | 290 (3.0%) |
| 65 to 74 Years | 125 (4.3%) | 70 (2.1%) |
| 75 Years and over | 115 (6.3%) | 175 (5.3%) |
Technology Access in Dubuque
Computing Device Access in Dubuque
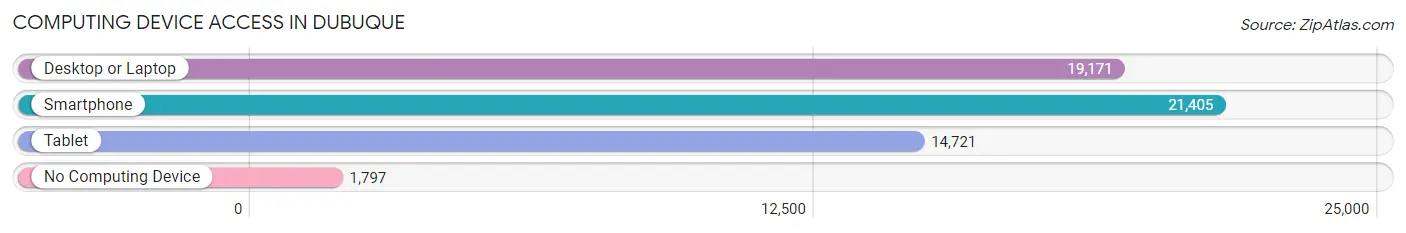
| Device Type | # Households | % Households |
| Desktop or Laptop | 19,171 | 76.1% |
| Smartphone | 21,405 | 85.0% |
| Tablet | 14,721 | 58.4% |
| No Computing Device | 1,797 | 7.1% |
| Total | 25,198 | 100.0% |
Internet Access in Dubuque
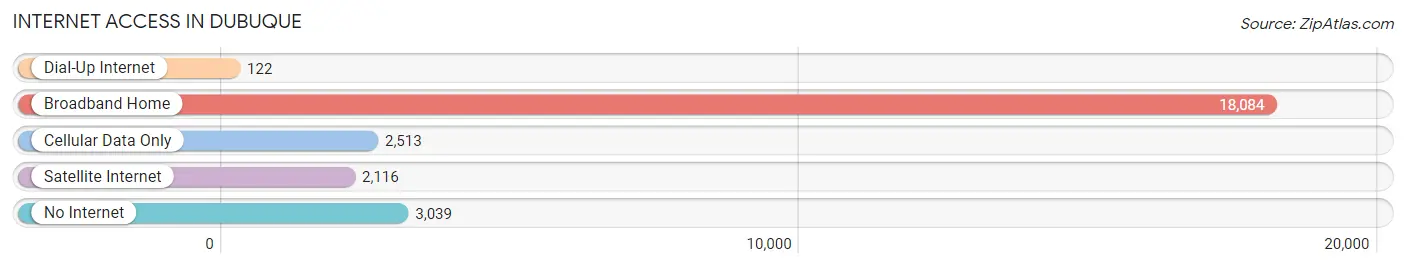
| Internet Type | # Households | % Households |
| Dial-Up Internet | 122 | 0.5% |
| Broadband Home | 18,084 | 71.8% |
| Cellular Data Only | 2,513 | 10.0% |
| Satellite Internet | 2,116 | 8.4% |
| No Internet | 3,039 | 12.1% |
| Total | 25,198 | 100.0% |
Dubuque Summary
Dubuque, Iowa is a city located in the northeastern corner of the state, along the Mississippi River. It is the county seat of Dubuque County and the tenth largest city in Iowa. Dubuque has a population of approximately 58,000 people and is the principal city of the Dubuque Metropolitan Statistical Area, which includes all of Dubuque County and the surrounding counties.
History
The area that is now Dubuque was first settled by Europeans in the late 1700s. The first permanent settlement was established in 1788 by Julien Dubuque, a French-Canadian fur trader. The city was named after him and was incorporated in 1837.
Dubuque quickly became an important port city, as it was located at the head of navigation on the Mississippi River. It was also a major center for the lead mining industry, which was a major source of income for the city.
In the late 1800s, Dubuque was a major center for the lumber industry, as well as a hub for the railroad industry. The city was also home to several large manufacturing companies, including the Dubuque Packing Company, which was the largest pork packing plant in the world at the time.
Geography
Dubuque is located in the northeastern corner of Iowa, along the Mississippi River. It is bordered by the states of Wisconsin and Illinois. The city is situated on a series of bluffs overlooking the river, and is surrounded by rolling hills and valleys.
The city has a total area of 28.2 square miles, of which 27.7 square miles is land and 0.5 square miles is water. The city is located at an elevation of 745 feet above sea level.
Economy
Dubuque’s economy is largely based on manufacturing, healthcare, education, and tourism. The city is home to several large manufacturing companies, including John Deere, Hormel Foods, and the Dubuque Packing Company.
The city is also home to several healthcare facilities, including MercyOne Dubuque Medical Center, Finley Hospital, and the Dubuque Specialty Hospital.
Education is also an important part of the city’s economy, as it is home to the University of Dubuque, Clarke University, and Loras College.
Tourism is also an important part of the city’s economy, as it is home to several attractions, including the National Mississippi River Museum and Aquarium, the Dubuque Arboretum and Botanical Gardens, and the Dubuque County Historical Society.
Demographics
As of the 2010 census, the population of Dubuque was 57,637. The racial makeup of the city was 90.2% White, 4.2% African American, 0.5% Native American, 1.7% Asian, 0.1% Pacific Islander, 1.3% from other races, and 2.0% from two or more races. Hispanic or Latino of any race were 3.7% of the population.
The median income for a household in the city was $45,945, and the median income for a family was $56,945. The per capita income for the city was $25,945. About 8.2% of families and 11.2% of the population were below the poverty line, including 16.2% of those under age 18 and 6.2% of those age 65 or over.
Common Questions
What is Per Capita Income in Dubuque?
Per Capita income in Dubuque is $35,691.
What is the Median Family Income in Dubuque?
Median Family Income in Dubuque is $83,093.
What is the Median Household income in Dubuque?
Median Household Income in Dubuque is $63,520.
What is Income or Wage Gap in Dubuque?
Income or Wage Gap in Dubuque is 30.9%.
Women in Dubuque earn 69.1 cents for every dollar earned by a man.
What is Family Income Deficit in Dubuque?
Family Income Deficit in Dubuque is $9,195.
Families that are below poverty line in Dubuque earn $9,195 less on average than the poverty threshold level.
What is Inequality or Gini Index in Dubuque?
Inequality or Gini Index in Dubuque is 0.45.
What is the Total Population of Dubuque?
Total Population of Dubuque is 59,315.
What is the Total Male Population of Dubuque?
Total Male Population of Dubuque is 28,948.
What is the Total Female Population of Dubuque?
Total Female Population of Dubuque is 30,367.
What is the Ratio of Males per 100 Females in Dubuque?
There are 95.33 Males per 100 Females in Dubuque.
What is the Ratio of Females per 100 Males in Dubuque?
There are 104.90 Females per 100 Males in Dubuque.
What is the Median Population Age in Dubuque?
Median Population Age in Dubuque is 37.9 Years.
What is the Average Family Size in Dubuque
Average Family Size in Dubuque is 2.9 People.
What is the Average Household Size in Dubuque
Average Household Size in Dubuque is 2.2 People.
How Large is the Labor Force in Dubuque?
There are 32,035 People in the Labor Forcein in Dubuque.
What is the Percentage of People in the Labor Force in Dubuque?
64.9% of People are in the Labor Force in Dubuque.
What is the Unemployment Rate in Dubuque?
Unemployment Rate in Dubuque is 5.0%.