West Des Moines, IA Map & Demographics
West Des Moines Map
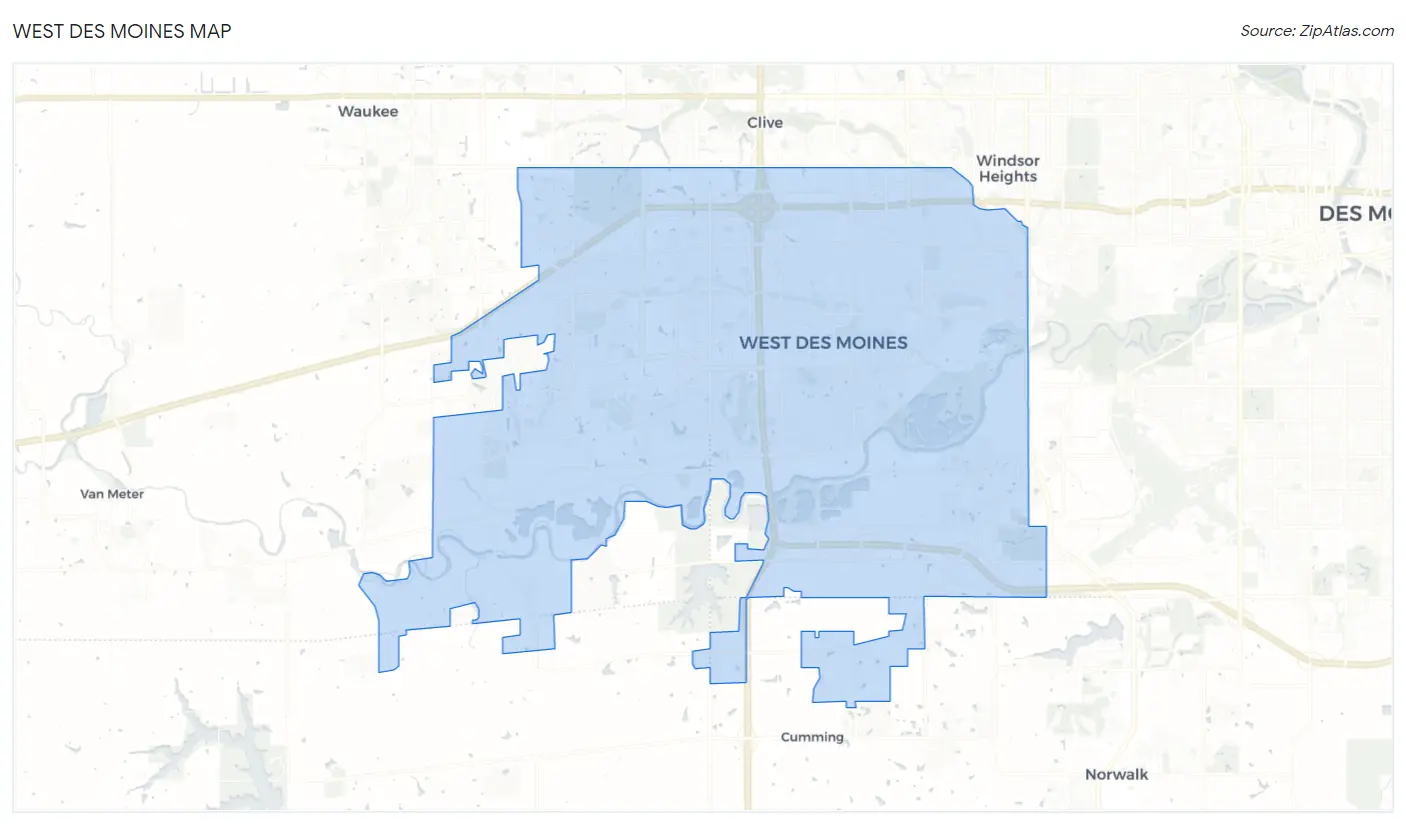
West Des Moines Overview
$53,803
PER CAPITA INCOME
$114,800
AVG FAMILY INCOME
$82,345
AVG HOUSEHOLD INCOME
28.8%
WAGE / INCOME GAP [ % ]
71.2¢/ $1
WAGE / INCOME GAP [ $ ]
$10,752
FAMILY INCOME DEFICIT
0.46
INEQUALITY / GINI INDEX
68,744
TOTAL POPULATION
34,404
MALE POPULATION
34,340
FEMALE POPULATION
100.19
MALES / 100 FEMALES
99.81
FEMALES / 100 MALES
36.2
MEDIAN AGE
3.0
AVG FAMILY SIZE
2.2
AVG HOUSEHOLD SIZE
41,408
LABOR FORCE [ PEOPLE ]
74.1%
PERCENT IN LABOR FORCE
2.8%
UNEMPLOYMENT RATE
West Des Moines Area Codes
Income in West Des Moines
Income Overview in West Des Moines
Per Capita Income in West Des Moines is $53,803, while median incomes of families and households are $114,800 and $82,345 respectively.
| Characteristic | Number | Measure |
| Per Capita Income | 68,744 | $53,803 |
| Median Family Income | 16,714 | $114,800 |
| Mean Family Income | 16,714 | $149,616 |
| Median Household Income | 31,307 | $82,345 |
| Mean Household Income | 31,307 | $116,857 |
| Income Deficit | 16,714 | $10,752 |
| Wage / Income Gap (%) | 68,744 | 28.83% |
| Wage / Income Gap ($) | 68,744 | 71.17¢ per $1 |
| Gini / Inequality Index | 68,744 | 0.46 |
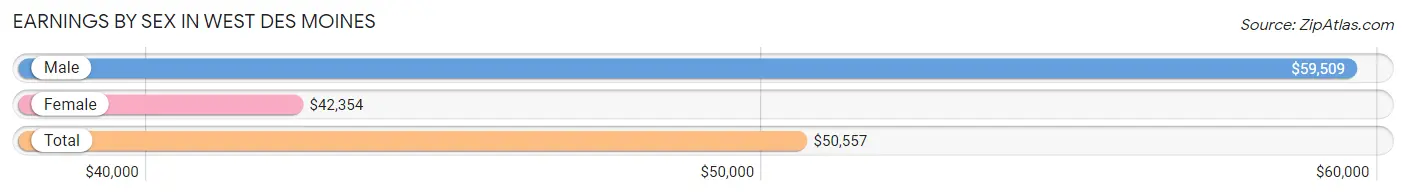
Earnings by Sex in West Des Moines
Average Earnings in West Des Moines are $50,557, $59,509 for men and $42,354 for women, a difference of 28.8%.
| Sex | Number | Average Earnings |
| Male | 23,180 (53.7%) | $59,509 |
| Female | 19,990 (46.3%) | $42,354 |
| Total | 43,170 (100.0%) | $50,557 |
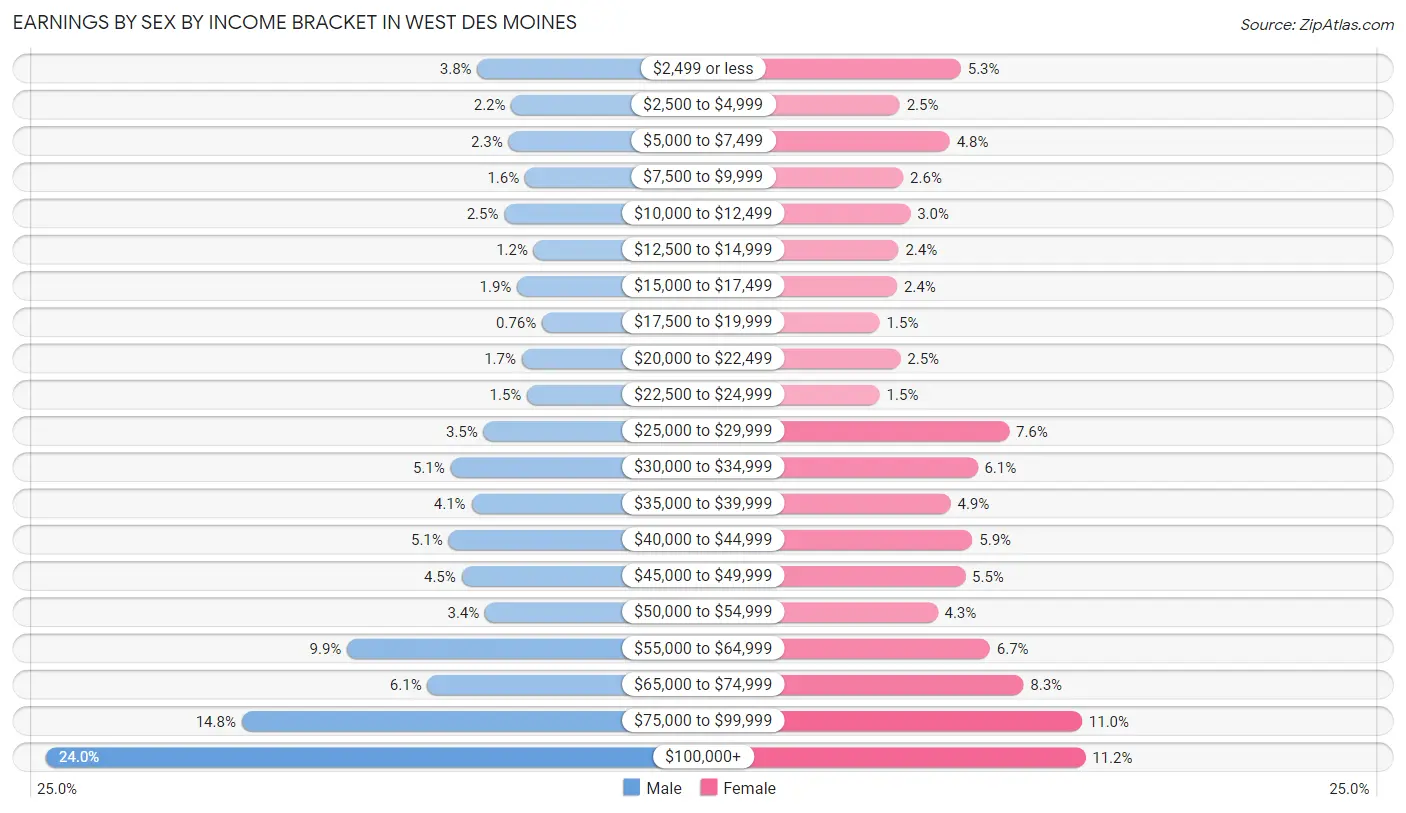
Earnings by Sex by Income Bracket in West Des Moines
The most common earnings brackets in West Des Moines are $100,000+ for men (5,563 | 24.0%) and $100,000+ for women (2,232 | 11.2%).
| Income | Male | Female |
| $2,499 or less | 878 (3.8%) | 1,068 (5.3%) |
| $2,500 to $4,999 | 511 (2.2%) | 496 (2.5%) |
| $5,000 to $7,499 | 540 (2.3%) | 963 (4.8%) |
| $7,500 to $9,999 | 362 (1.6%) | 527 (2.6%) |
| $10,000 to $12,499 | 586 (2.5%) | 593 (3.0%) |
| $12,500 to $14,999 | 267 (1.1%) | 483 (2.4%) |
| $15,000 to $17,499 | 448 (1.9%) | 470 (2.4%) |
| $17,500 to $19,999 | 177 (0.8%) | 308 (1.5%) |
| $20,000 to $22,499 | 396 (1.7%) | 501 (2.5%) |
| $22,500 to $24,999 | 338 (1.5%) | 308 (1.5%) |
| $25,000 to $29,999 | 812 (3.5%) | 1,519 (7.6%) |
| $30,000 to $34,999 | 1,171 (5.1%) | 1,224 (6.1%) |
| $35,000 to $39,999 | 944 (4.1%) | 972 (4.9%) |
| $40,000 to $44,999 | 1,191 (5.1%) | 1,176 (5.9%) |
| $45,000 to $49,999 | 1,050 (4.5%) | 1,107 (5.5%) |
| $50,000 to $54,999 | 794 (3.4%) | 850 (4.3%) |
| $55,000 to $64,999 | 2,293 (9.9%) | 1,340 (6.7%) |
| $65,000 to $74,999 | 1,422 (6.1%) | 1,653 (8.3%) |
| $75,000 to $99,999 | 3,437 (14.8%) | 2,200 (11.0%) |
| $100,000+ | 5,563 (24.0%) | 2,232 (11.2%) |
| Total | 23,180 (100.0%) | 19,990 (100.0%) |
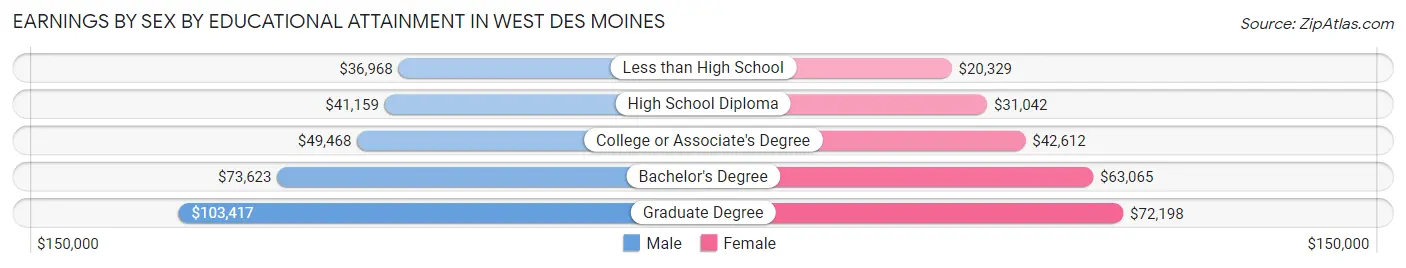
Earnings by Sex by Educational Attainment in West Des Moines
Average earnings in West Des Moines are $64,233 for men and $48,531 for women, a difference of 24.4%. Men with an educational attainment of graduate degree enjoy the highest average annual earnings of $103,417, while those with less than high school education earn the least with $36,968. Women with an educational attainment of graduate degree earn the most with the average annual earnings of $72,198, while those with less than high school education have the smallest earnings of $20,329.
| Educational Attainment | Male Income | Female Income |
| Less than High School | $36,968 | $20,329 |
| High School Diploma | $41,159 | $31,042 |
| College or Associate's Degree | $49,468 | $42,612 |
| Bachelor's Degree | $73,623 | $63,065 |
| Graduate Degree | $103,417 | $72,198 |
| Total | $64,233 | $48,531 |
Family Income in West Des Moines
Family Income Brackets in West Des Moines
According to the West Des Moines family income data, there are 3,543 families falling into the $200,000+ income range, which is the most common income bracket and makes up 21.2% of all families. Conversely, the less than $10,000 income bracket is the least frequent group with only 301 families (1.8%) belonging to this category.
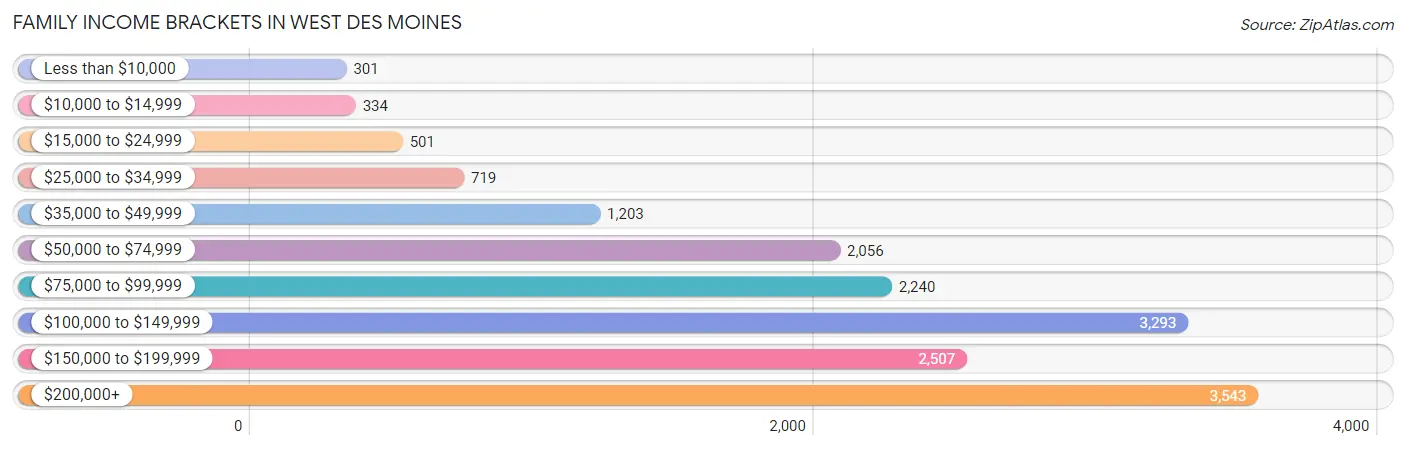
| Income Bracket | # Families | % Families |
| Less than $10,000 | 301 | 1.8% |
| $10,000 to $14,999 | 334 | 2.0% |
| $15,000 to $24,999 | 501 | 3.0% |
| $25,000 to $34,999 | 719 | 4.3% |
| $35,000 to $49,999 | 1,203 | 7.2% |
| $50,000 to $74,999 | 2,056 | 12.3% |
| $75,000 to $99,999 | 2,240 | 13.4% |
| $100,000 to $149,999 | 3,293 | 19.7% |
| $150,000 to $199,999 | 2,507 | 15.0% |
| $200,000+ | 3,543 | 21.2% |
Family Income by Famaliy Size in West Des Moines
4-person families (3,159 | 18.9%) account for the highest median family income in West Des Moines with $152,888 per family, while 2-person families (8,270 | 49.5%) have the highest median income of $45,051 per family member.
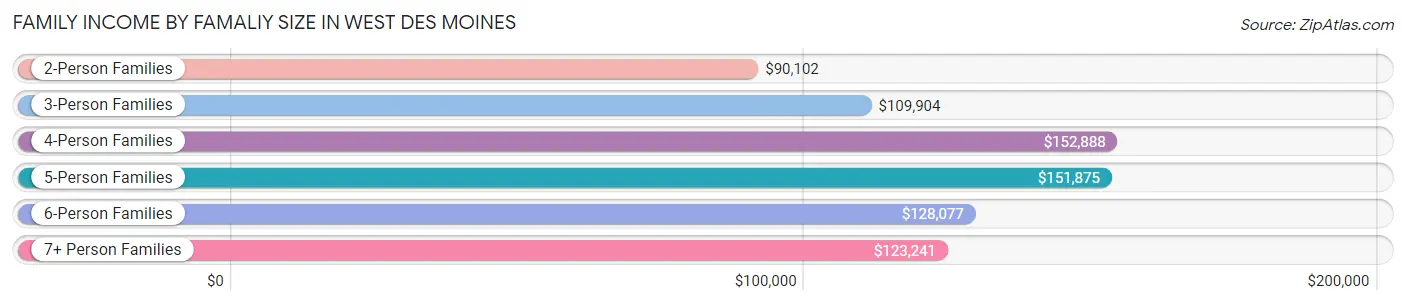
| Income Bracket | # Families | Median Income |
| 2-Person Families | 8,270 (49.5%) | $90,102 |
| 3-Person Families | 3,579 (21.4%) | $109,904 |
| 4-Person Families | 3,159 (18.9%) | $152,888 |
| 5-Person Families | 1,230 (7.4%) | $151,875 |
| 6-Person Families | 320 (1.9%) | $128,077 |
| 7+ Person Families | 156 (0.9%) | $123,241 |
| Total | 16,714 (100.0%) | $114,800 |
Family Income by Number of Earners in West Des Moines
The median family income in West Des Moines is $114,800, with families comprising 3+ earners (1,844) having the highest median family income of $182,455, while families with no earners (2,202) have the lowest median family income of $65,764, accounting for 11.0% and 13.2% of families, respectively.
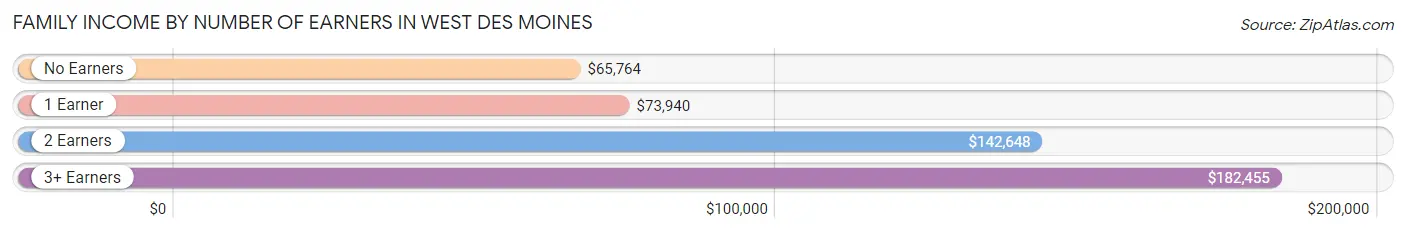
| Number of Earners | # Families | Median Income |
| No Earners | 2,202 (13.2%) | $65,764 |
| 1 Earner | 4,520 (27.0%) | $73,940 |
| 2 Earners | 8,148 (48.7%) | $142,648 |
| 3+ Earners | 1,844 (11.0%) | $182,455 |
| Total | 16,714 (100.0%) | $114,800 |
Household Income in West Des Moines
Household Income Brackets in West Des Moines
With 5,197 households falling in the category, the $100,000 to $149,999 income range is the most frequent in West Des Moines, accounting for 16.6% of all households. In contrast, only 595 households (1.9%) fall into the $10,000 to $14,999 income bracket, making it the least populous group.
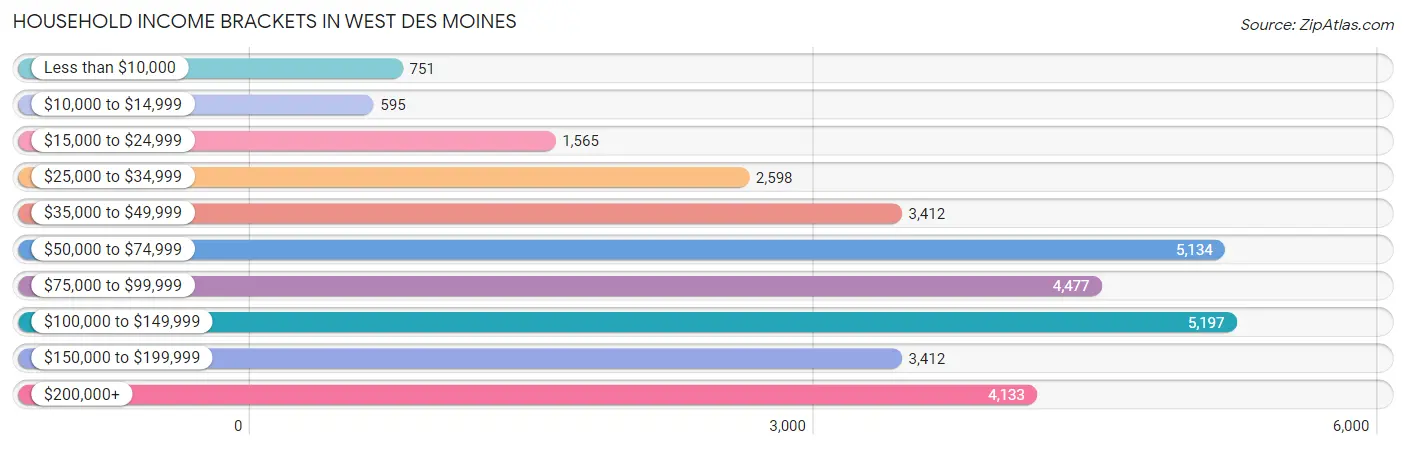
| Income Bracket | # Households | % Households |
| Less than $10,000 | 751 | 2.4% |
| $10,000 to $14,999 | 595 | 1.9% |
| $15,000 to $24,999 | 1,565 | 5.0% |
| $25,000 to $34,999 | 2,598 | 8.3% |
| $35,000 to $49,999 | 3,412 | 10.9% |
| $50,000 to $74,999 | 5,134 | 16.4% |
| $75,000 to $99,999 | 4,477 | 14.3% |
| $100,000 to $149,999 | 5,197 | 16.6% |
| $150,000 to $199,999 | 3,412 | 10.9% |
| $200,000+ | 4,133 | 13.2% |
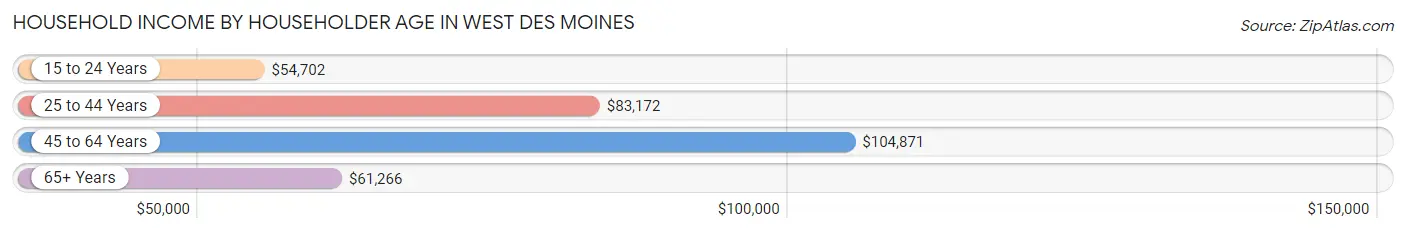
Household Income by Householder Age in West Des Moines
The median household income in West Des Moines is $82,345, with the highest median household income of $104,871 found in the 45 to 64 years age bracket for the primary householder. A total of 10,160 households (32.5%) fall into this category. Meanwhile, the 15 to 24 years age bracket for the primary householder has the lowest median household income of $54,702, with 2,436 households (7.8%) in this group.
| Income Bracket | # Households | Median Income |
| 15 to 24 Years | 2,436 (7.8%) | $54,702 |
| 25 to 44 Years | 12,404 (39.6%) | $83,172 |
| 45 to 64 Years | 10,160 (32.5%) | $104,871 |
| 65+ Years | 6,307 (20.2%) | $61,266 |
| Total | 31,307 (100.0%) | $82,345 |
Poverty in West Des Moines
Income Below Poverty by Sex and Age in West Des Moines
With 6.8% poverty level for males and 8.3% for females among the residents of West Des Moines, 6 to 11 year old males and 5 year old females are the most vulnerable to poverty, with 318 males (11.6%) and 127 females (38.3%) in their respective age groups living below the poverty level.
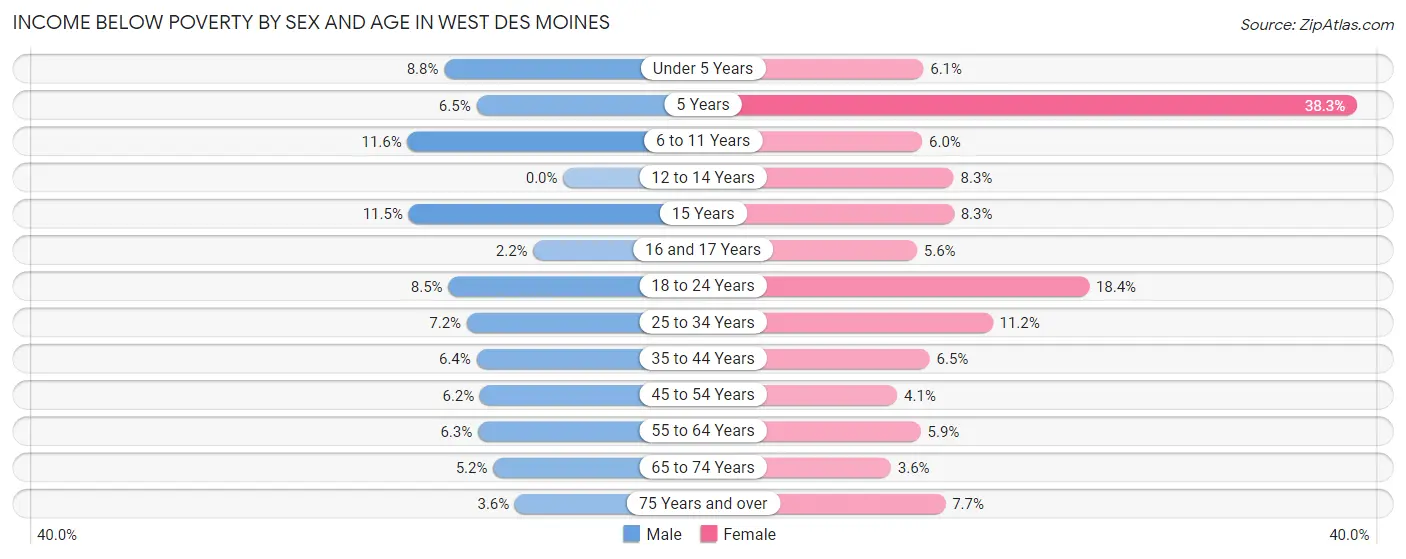
| Age Bracket | Male | Female |
| Under 5 Years | 180 (8.8%) | 114 (6.0%) |
| 5 Years | 28 (6.5%) | 127 (38.3%) |
| 6 to 11 Years | 318 (11.6%) | 130 (6.0%) |
| 12 to 14 Years | 0 (0.0%) | 113 (8.3%) |
| 15 Years | 45 (11.5%) | 30 (8.3%) |
| 16 and 17 Years | 17 (2.2%) | 50 (5.6%) |
| 18 to 24 Years | 224 (8.5%) | 635 (18.3%) |
| 25 to 34 Years | 491 (7.2%) | 637 (11.2%) |
| 35 to 44 Years | 308 (6.4%) | 300 (6.5%) |
| 45 to 54 Years | 249 (6.2%) | 175 (4.1%) |
| 55 to 64 Years | 277 (6.3%) | 214 (5.9%) |
| 65 to 74 Years | 133 (5.2%) | 109 (3.6%) |
| 75 Years and over | 56 (3.6%) | 187 (7.7%) |
| Total | 2,326 (6.8%) | 2,821 (8.3%) |
Income Above Poverty by Sex and Age in West Des Moines
According to the poverty statistics in West Des Moines, males aged 12 to 14 years and females aged 65 to 74 years are the age groups that are most secure financially, with 100.0% of males and 96.4% of females in these age groups living above the poverty line.
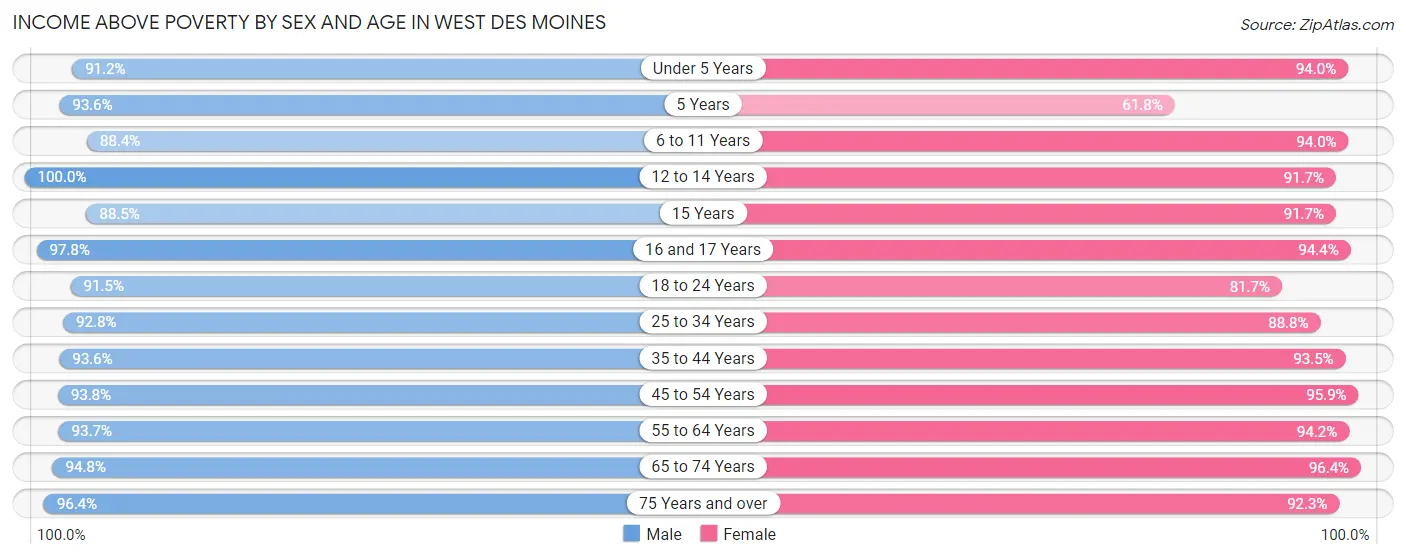
| Age Bracket | Male | Female |
| Under 5 Years | 1,856 (91.2%) | 1,770 (94.0%) |
| 5 Years | 406 (93.5%) | 205 (61.8%) |
| 6 to 11 Years | 2,430 (88.4%) | 2,053 (94.0%) |
| 12 to 14 Years | 1,028 (100.0%) | 1,248 (91.7%) |
| 15 Years | 347 (88.5%) | 331 (91.7%) |
| 16 and 17 Years | 749 (97.8%) | 847 (94.4%) |
| 18 to 24 Years | 2,402 (91.5%) | 2,825 (81.7%) |
| 25 to 34 Years | 6,367 (92.8%) | 5,057 (88.8%) |
| 35 to 44 Years | 4,476 (93.6%) | 4,298 (93.5%) |
| 45 to 54 Years | 3,778 (93.8%) | 4,088 (95.9%) |
| 55 to 64 Years | 4,097 (93.7%) | 3,446 (94.2%) |
| 65 to 74 Years | 2,427 (94.8%) | 2,889 (96.4%) |
| 75 Years and over | 1,510 (96.4%) | 2,248 (92.3%) |
| Total | 31,873 (93.2%) | 31,305 (91.7%) |
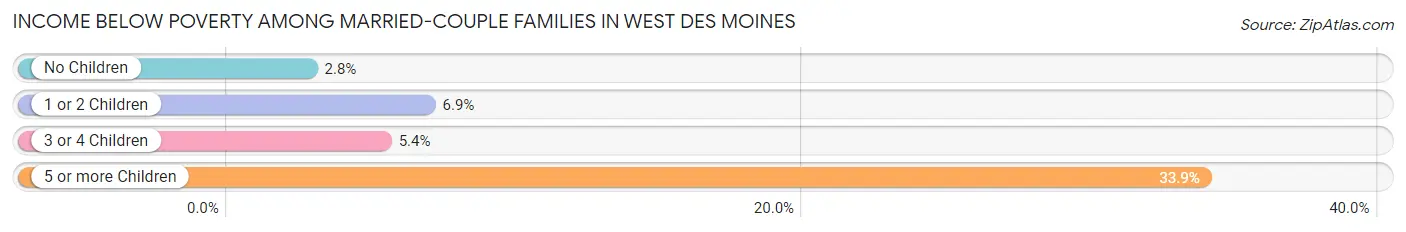
Income Below Poverty Among Married-Couple Families in West Des Moines
The poverty statistics for married-couple families in West Des Moines show that 4.7% or 603 of the total 12,934 families live below the poverty line. Families with 5 or more children have the highest poverty rate of 33.9%, comprising of 20 families. On the other hand, families with no children have the lowest poverty rate of 2.8%, which includes 191 families.
| Children | Above Poverty | Below Poverty |
| No Children | 6,692 (97.2%) | 191 (2.8%) |
| 1 or 2 Children | 4,344 (93.1%) | 321 (6.9%) |
| 3 or 4 Children | 1,256 (94.7%) | 71 (5.3%) |
| 5 or more Children | 39 (66.1%) | 20 (33.9%) |
| Total | 12,331 (95.3%) | 603 (4.7%) |
Income Below Poverty Among Single-Parent Households in West Des Moines
According to the poverty data in West Des Moines, 5.0% or 67 single-father households and 14.6% or 358 single-mother households are living below the poverty line. Among single-father households, those with 1 or 2 children have the highest poverty rate, with 40 households (6.9%) experiencing poverty. Likewise, among single-mother households, those with 1 or 2 children have the highest poverty rate, with 262 households (20.7%) falling below the poverty line.
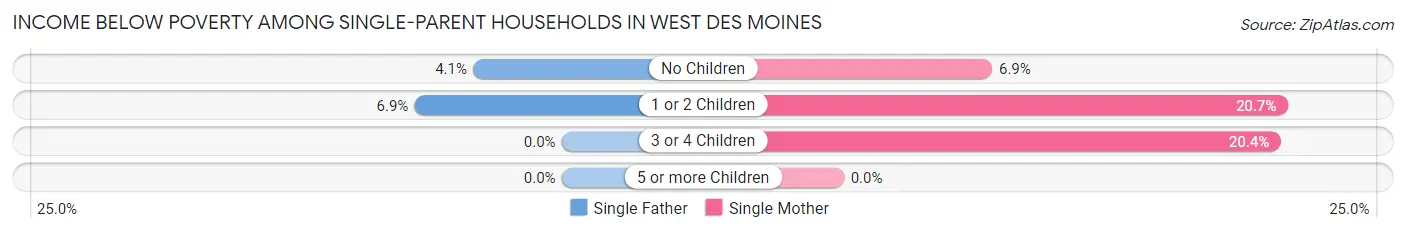
| Children | Single Father | Single Mother |
| No Children | 27 (4.1%) | 74 (6.9%) |
| 1 or 2 Children | 40 (6.9%) | 262 (20.7%) |
| 3 or 4 Children | 0 (0.0%) | 22 (20.4%) |
| 5 or more Children | 0 (0.0%) | 0 (0.0%) |
| Total | 67 (5.0%) | 358 (14.6%) |
Income Below Poverty Among Married-Couple vs Single-Parent Households in West Des Moines
The poverty data for West Des Moines shows that 603 of the married-couple family households (4.7%) and 425 of the single-parent households (11.2%) are living below the poverty level. Within the married-couple family households, those with 5 or more children have the highest poverty rate, with 20 households (33.9%) falling below the poverty line. Among the single-parent households, those with 1 or 2 children have the highest poverty rate, with 302 household (16.3%) living below poverty.
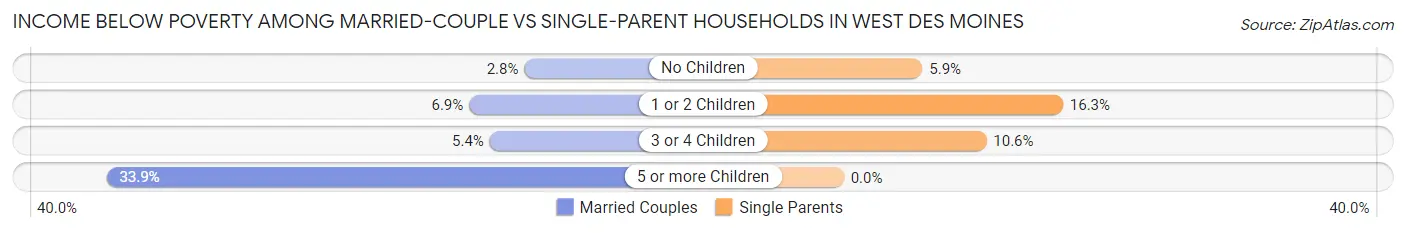
| Children | Married-Couple Families | Single-Parent Households |
| No Children | 191 (2.8%) | 101 (5.9%) |
| 1 or 2 Children | 321 (6.9%) | 302 (16.3%) |
| 3 or 4 Children | 71 (5.3%) | 22 (10.6%) |
| 5 or more Children | 20 (33.9%) | 0 (0.0%) |
| Total | 603 (4.7%) | 425 (11.2%) |
Race in West Des Moines
The most populous races in West Des Moines are White / Caucasian (56,018 | 81.5%), Two or more Races (4,344 | 6.3%), and Asian (4,226 | 6.1%).
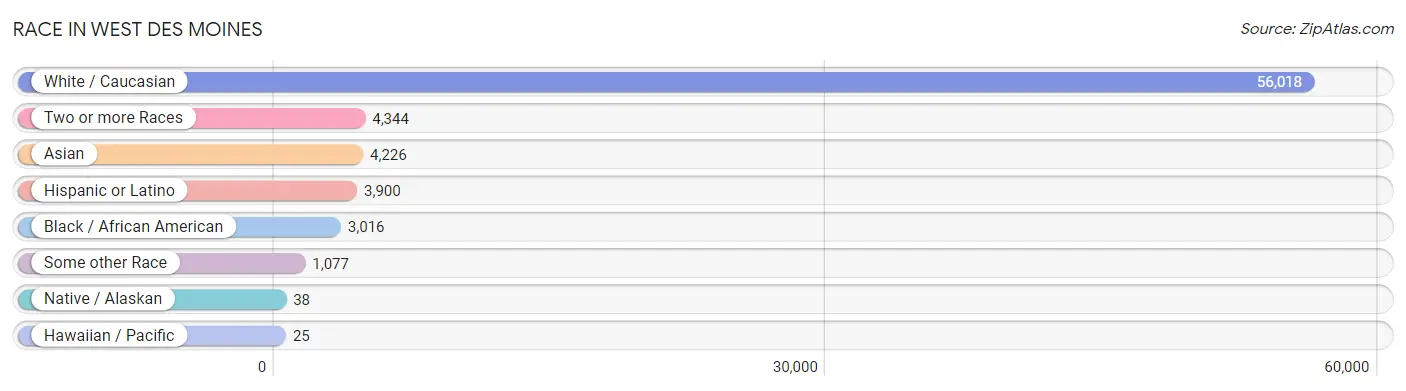
| Race | # Population | % Population |
| Asian | 4,226 | 6.1% |
| Black / African American | 3,016 | 4.4% |
| Hawaiian / Pacific | 25 | 0.0% |
| Hispanic or Latino | 3,900 | 5.7% |
| Native / Alaskan | 38 | 0.1% |
| White / Caucasian | 56,018 | 81.5% |
| Two or more Races | 4,344 | 6.3% |
| Some other Race | 1,077 | 1.6% |
| Total | 68,744 | 100.0% |
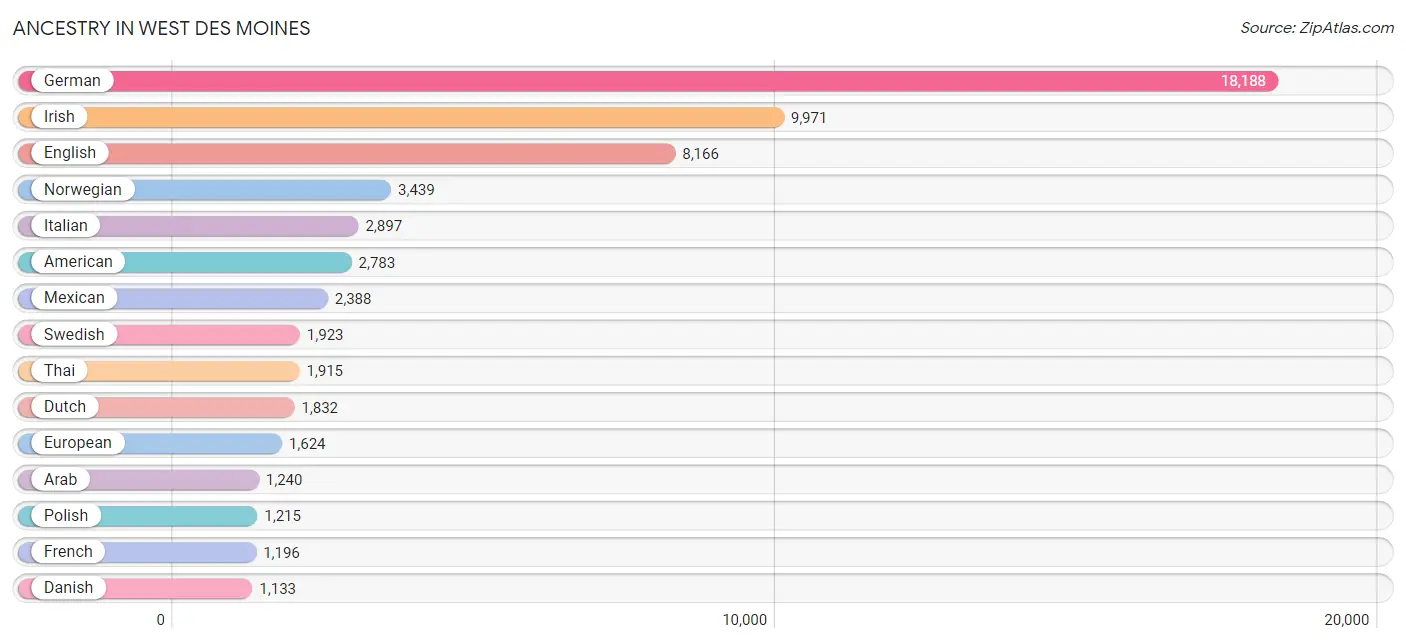
Ancestry in West Des Moines
The most populous ancestries reported in West Des Moines are German (18,188 | 26.5%), Irish (9,971 | 14.5%), English (8,166 | 11.9%), Norwegian (3,439 | 5.0%), and Italian (2,897 | 4.2%), together accounting for 62.1% of all West Des Moines residents.
| Ancestry | # Population | % Population |
| Afghan | 298 | 0.4% |
| African | 267 | 0.4% |
| Alaska Native | 1 | 0.0% |
| American | 2,783 | 4.1% |
| Arab | 1,240 | 1.8% |
| Argentinean | 30 | 0.0% |
| Armenian | 18 | 0.0% |
| Australian | 15 | 0.0% |
| Austrian | 113 | 0.2% |
| Bangladeshi | 11 | 0.0% |
| Basque | 12 | 0.0% |
| Belgian | 48 | 0.1% |
| Bhutanese | 105 | 0.2% |
| Blackfeet | 1 | 0.0% |
| Brazilian | 34 | 0.1% |
| British | 537 | 0.8% |
| Bulgarian | 8 | 0.0% |
| Burmese | 659 | 1.0% |
| Cajun | 17 | 0.0% |
| Canadian | 116 | 0.2% |
| Central American | 294 | 0.4% |
| Cherokee | 25 | 0.0% |
| Chippewa | 14 | 0.0% |
| Choctaw | 11 | 0.0% |
| Colombian | 160 | 0.2% |
| Comanche | 76 | 0.1% |
| Croatian | 53 | 0.1% |
| Cuban | 133 | 0.2% |
| Czech | 590 | 0.9% |
| Czechoslovakian | 166 | 0.2% |
| Danish | 1,133 | 1.7% |
| Dutch | 1,832 | 2.7% |
| Eastern European | 174 | 0.3% |
| Ecuadorian | 136 | 0.2% |
| Egyptian | 251 | 0.4% |
| English | 8,166 | 11.9% |
| Ethiopian | 150 | 0.2% |
| European | 1,624 | 2.4% |
| Finnish | 168 | 0.2% |
| French | 1,196 | 1.7% |
| French American Indian | 5 | 0.0% |
| French Canadian | 128 | 0.2% |
| German | 18,188 | 26.5% |
| Ghanaian | 11 | 0.0% |
| Greek | 47 | 0.1% |
| Guatemalan | 23 | 0.0% |
| Honduran | 187 | 0.3% |
| Hungarian | 32 | 0.1% |
| Indian (Asian) | 673 | 1.0% |
| Iraqi | 537 | 0.8% |
| Irish | 9,971 | 14.5% |
| Italian | 2,897 | 4.2% |
| Japanese | 251 | 0.4% |
| Jordanian | 9 | 0.0% |
| Kenyan | 19 | 0.0% |
| Korean | 598 | 0.9% |
| Laotian | 32 | 0.1% |
| Lebanese | 113 | 0.2% |
| Liberian | 45 | 0.1% |
| Lithuanian | 102 | 0.2% |
| Luxembourger | 77 | 0.1% |
| Macedonian | 73 | 0.1% |
| Malaysian | 461 | 0.7% |
| Mexican | 2,388 | 3.5% |
| Mongolian | 68 | 0.1% |
| Moroccan | 127 | 0.2% |
| Native Hawaiian | 25 | 0.0% |
| Nicaraguan | 20 | 0.0% |
| Nigerian | 91 | 0.1% |
| Northern European | 166 | 0.2% |
| Norwegian | 3,439 | 5.0% |
| Pakistani | 25 | 0.0% |
| Palestinian | 59 | 0.1% |
| Panamanian | 2 | 0.0% |
| Pennsylvania German | 16 | 0.0% |
| Peruvian | 177 | 0.3% |
| Polish | 1,215 | 1.8% |
| Portuguese | 363 | 0.5% |
| Puerto Rican | 200 | 0.3% |
| Romanian | 144 | 0.2% |
| Russian | 414 | 0.6% |
| Salvadoran | 62 | 0.1% |
| Scandinavian | 569 | 0.8% |
| Scotch-Irish | 666 | 1.0% |
| Scottish | 1,092 | 1.6% |
| Sierra Leonean | 13 | 0.0% |
| Sioux | 38 | 0.1% |
| Slavic | 4 | 0.0% |
| Slovak | 66 | 0.1% |
| Somali | 215 | 0.3% |
| South American | 571 | 0.8% |
| Spaniard | 47 | 0.1% |
| Spanish | 93 | 0.1% |
| Sri Lankan | 649 | 0.9% |
| Subsaharan African | 1,124 | 1.6% |
| Sudanese | 346 | 0.5% |
| Swedish | 1,923 | 2.8% |
| Swiss | 210 | 0.3% |
| Thai | 1,915 | 2.8% |
| Ukrainian | 73 | 0.1% |
| Venezuelan | 68 | 0.1% |
| Welsh | 539 | 0.8% |
| Yugoslavian | 580 | 0.8% | View All 103 Rows |
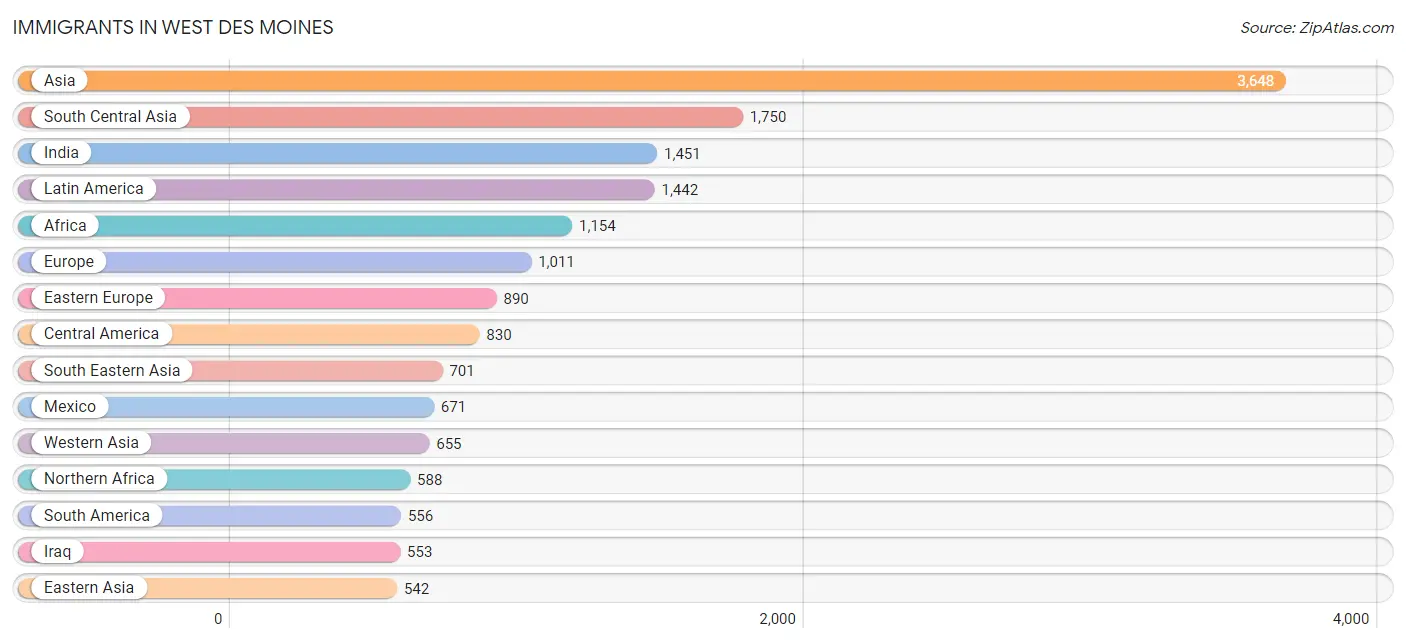
Immigrants in West Des Moines
The most numerous immigrant groups reported in West Des Moines came from Asia (3,648 | 5.3%), South Central Asia (1,750 | 2.5%), India (1,451 | 2.1%), Latin America (1,442 | 2.1%), and Africa (1,154 | 1.7%), together accounting for 13.8% of all West Des Moines residents.
| Immigration Origin | # Population | % Population |
| Afghanistan | 190 | 0.3% |
| Africa | 1,154 | 1.7% |
| Asia | 3,648 | 5.3% |
| Australia | 19 | 0.0% |
| Azores | 2 | 0.0% |
| Belarus | 10 | 0.0% |
| Bosnia and Herzegovina | 515 | 0.7% |
| Brazil | 214 | 0.3% |
| Bulgaria | 8 | 0.0% |
| Cameroon | 12 | 0.0% |
| Canada | 156 | 0.2% |
| Caribbean | 56 | 0.1% |
| Central America | 830 | 1.2% |
| China | 150 | 0.2% |
| Colombia | 202 | 0.3% |
| Cuba | 54 | 0.1% |
| Eastern Africa | 256 | 0.4% |
| Eastern Asia | 542 | 0.8% |
| Eastern Europe | 890 | 1.3% |
| Ecuador | 42 | 0.1% |
| Egypt | 251 | 0.4% |
| El Salvador | 38 | 0.1% |
| England | 16 | 0.0% |
| Ethiopia | 58 | 0.1% |
| Europe | 1,011 | 1.5% |
| Germany | 61 | 0.1% |
| Ghana | 25 | 0.0% |
| Guatemala | 23 | 0.0% |
| Honduras | 98 | 0.1% |
| Hungary | 14 | 0.0% |
| India | 1,451 | 2.1% |
| Indonesia | 32 | 0.1% |
| Iraq | 553 | 0.8% |
| Italy | 14 | 0.0% |
| Jamaica | 2 | 0.0% |
| Japan | 9 | 0.0% |
| Jordan | 30 | 0.0% |
| Kenya | 43 | 0.1% |
| Korea | 383 | 0.6% |
| Kuwait | 32 | 0.1% |
| Laos | 148 | 0.2% |
| Latin America | 1,442 | 2.1% |
| Latvia | 19 | 0.0% |
| Lebanon | 15 | 0.0% |
| Liberia | 54 | 0.1% |
| Malaysia | 68 | 0.1% |
| Mexico | 671 | 1.0% |
| Middle Africa | 32 | 0.1% |
| Moldova | 60 | 0.1% |
| Morocco | 85 | 0.1% |
| Nepal | 85 | 0.1% |
| Nigeria | 62 | 0.1% |
| Northern Africa | 588 | 0.9% |
| Northern Europe | 44 | 0.1% |
| Oceania | 19 | 0.0% |
| Pakistan | 24 | 0.0% |
| Peru | 78 | 0.1% |
| Philippines | 99 | 0.1% |
| Poland | 48 | 0.1% |
| Portugal | 2 | 0.0% |
| Russia | 132 | 0.2% |
| Saudi Arabia | 12 | 0.0% |
| Somalia | 123 | 0.2% |
| South America | 556 | 0.8% |
| South Central Asia | 1,750 | 2.5% |
| South Eastern Asia | 701 | 1.0% |
| Southern Europe | 16 | 0.0% |
| Sudan | 203 | 0.3% |
| Thailand | 3 | 0.0% |
| Uganda | 7 | 0.0% |
| Ukraine | 68 | 0.1% |
| Venezuela | 20 | 0.0% |
| Vietnam | 351 | 0.5% |
| Western Africa | 246 | 0.4% |
| Western Asia | 655 | 0.9% |
| Western Europe | 61 | 0.1% |
| Zaire | 20 | 0.0% | View All 77 Rows |
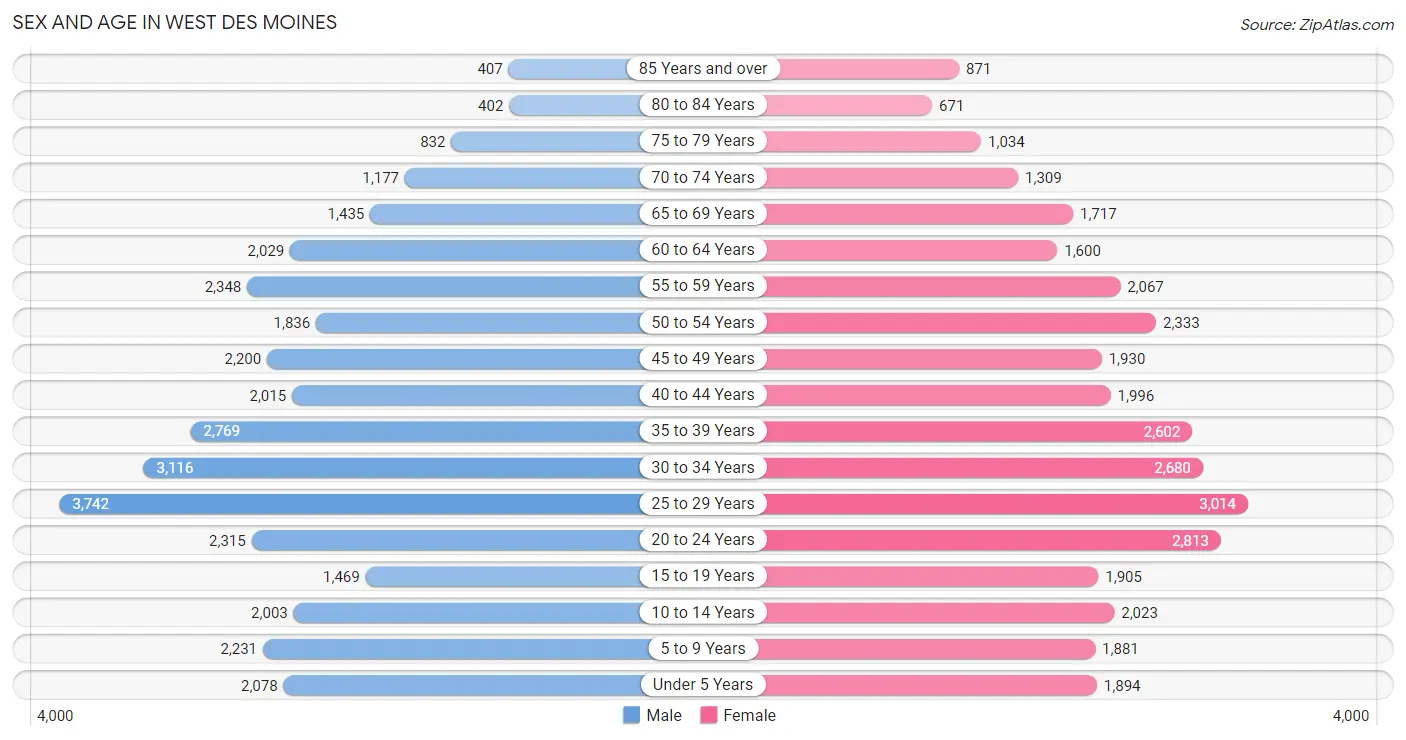
Sex and Age in West Des Moines
Sex and Age in West Des Moines
The most populous age groups in West Des Moines are 25 to 29 Years (3,742 | 10.9%) for men and 25 to 29 Years (3,014 | 8.8%) for women.
| Age Bracket | Male | Female |
| Under 5 Years | 2,078 (6.0%) | 1,894 (5.5%) |
| 5 to 9 Years | 2,231 (6.5%) | 1,881 (5.5%) |
| 10 to 14 Years | 2,003 (5.8%) | 2,023 (5.9%) |
| 15 to 19 Years | 1,469 (4.3%) | 1,905 (5.6%) |
| 20 to 24 Years | 2,315 (6.7%) | 2,813 (8.2%) |
| 25 to 29 Years | 3,742 (10.9%) | 3,014 (8.8%) |
| 30 to 34 Years | 3,116 (9.1%) | 2,680 (7.8%) |
| 35 to 39 Years | 2,769 (8.1%) | 2,602 (7.6%) |
| 40 to 44 Years | 2,015 (5.9%) | 1,996 (5.8%) |
| 45 to 49 Years | 2,200 (6.4%) | 1,930 (5.6%) |
| 50 to 54 Years | 1,836 (5.3%) | 2,333 (6.8%) |
| 55 to 59 Years | 2,348 (6.8%) | 2,067 (6.0%) |
| 60 to 64 Years | 2,029 (5.9%) | 1,600 (4.7%) |
| 65 to 69 Years | 1,435 (4.2%) | 1,717 (5.0%) |
| 70 to 74 Years | 1,177 (3.4%) | 1,309 (3.8%) |
| 75 to 79 Years | 832 (2.4%) | 1,034 (3.0%) |
| 80 to 84 Years | 402 (1.2%) | 671 (1.9%) |
| 85 Years and over | 407 (1.2%) | 871 (2.5%) |
| Total | 34,404 (100.0%) | 34,340 (100.0%) |
Families and Households in West Des Moines
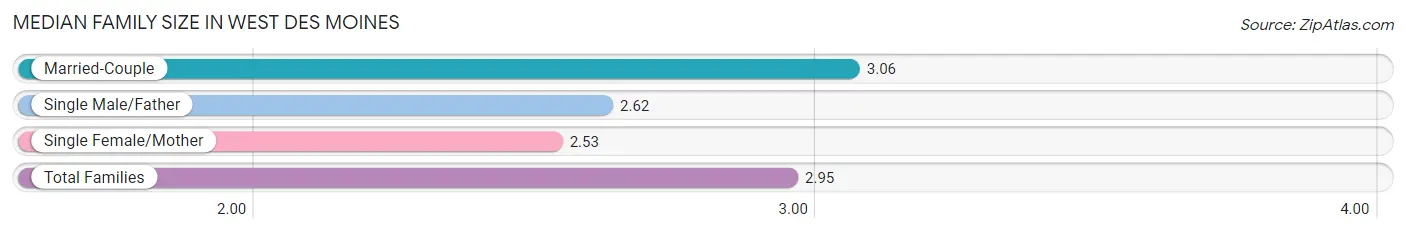
Median Family Size in West Des Moines
The median family size in West Des Moines is 2.95 persons per family, with married-couple families (12,934 | 77.4%) accounting for the largest median family size of 3.06 persons per family. On the other hand, single female/mother families (2,445 | 14.6%) represent the smallest median family size with 2.53 persons per family.
| Family Type | # Families | Family Size |
| Married-Couple | 12,934 (77.4%) | 3.06 |
| Single Male/Father | 1,335 (8.0%) | 2.62 |
| Single Female/Mother | 2,445 (14.6%) | 2.53 |
| Total Families | 16,714 (100.0%) | 2.95 |
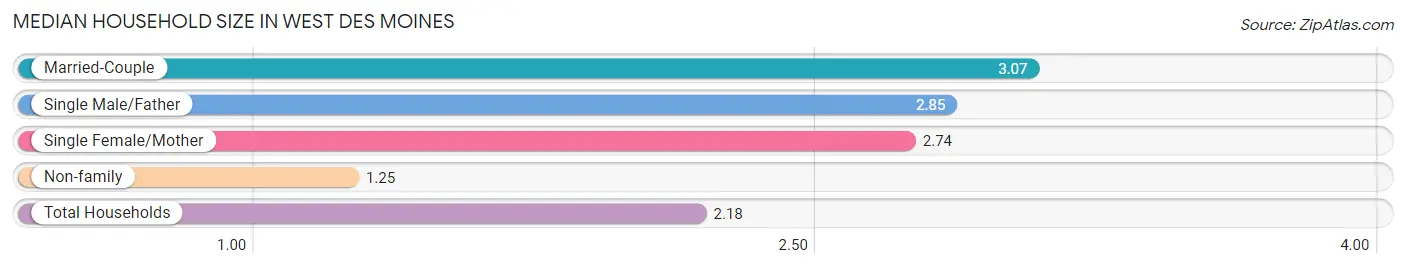
Median Household Size in West Des Moines
The median household size in West Des Moines is 2.18 persons per household, with married-couple households (12,934 | 41.3%) accounting for the largest median household size of 3.07 persons per household. non-family households (14,593 | 46.6%) represent the smallest median household size with 1.25 persons per household.
| Household Type | # Households | Household Size |
| Married-Couple | 12,934 (41.3%) | 3.07 |
| Single Male/Father | 1,335 (4.3%) | 2.85 |
| Single Female/Mother | 2,445 (7.8%) | 2.74 |
| Non-family | 14,593 (46.6%) | 1.25 |
| Total Households | 31,307 (100.0%) | 2.18 |
Household Size by Marriage Status in West Des Moines
Out of a total of 31,307 households in West Des Moines, 16,714 (53.4%) are family households, while 14,593 (46.6%) are nonfamily households. The most numerous type of family households are 2-person households, comprising 7,813, and the most common type of nonfamily households are 1-person households, comprising 11,289.
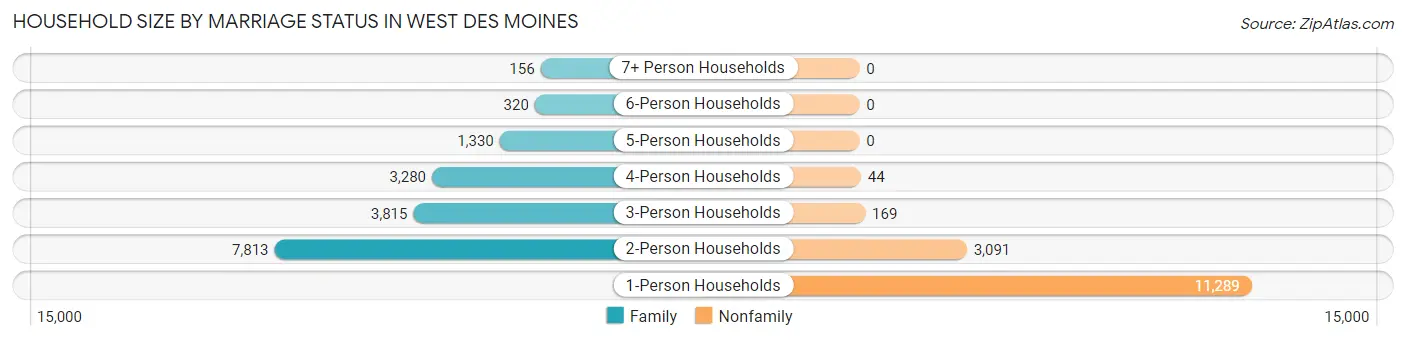
| Household Size | Family Households | Nonfamily Households |
| 1-Person Households | - | 11,289 (36.1%) |
| 2-Person Households | 7,813 (25.0%) | 3,091 (9.9%) |
| 3-Person Households | 3,815 (12.2%) | 169 (0.5%) |
| 4-Person Households | 3,280 (10.5%) | 44 (0.1%) |
| 5-Person Households | 1,330 (4.3%) | 0 (0.0%) |
| 6-Person Households | 320 (1.0%) | 0 (0.0%) |
| 7+ Person Households | 156 (0.5%) | 0 (0.0%) |
| Total | 16,714 (53.4%) | 14,593 (46.6%) |
Female Fertility in West Des Moines
Fertility by Age in West Des Moines
Average fertility rate in West Des Moines is 39.0 births per 1,000 women. Women in the age bracket of 20 to 34 years have the highest fertility rate with 72.0 births per 1,000 women. Women in the age bracket of 20 to 34 years acount for 88.5% of all women with births.
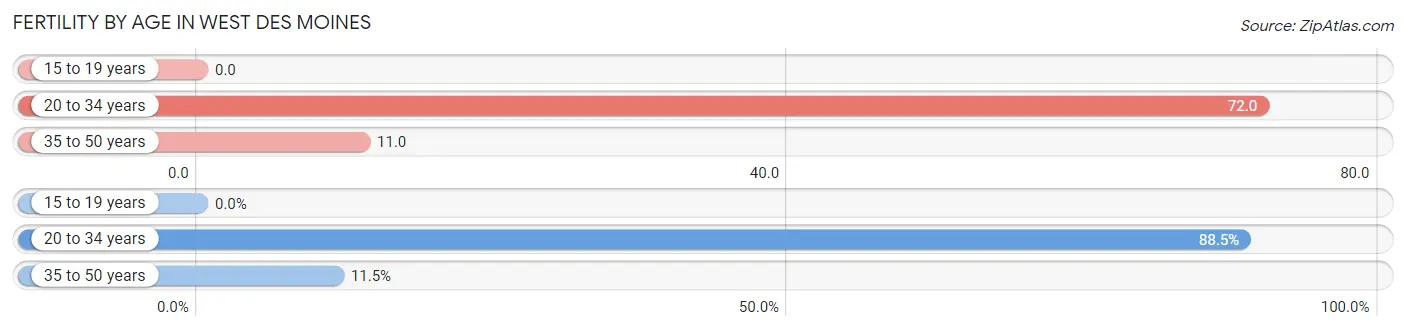
| Age Bracket | Women with Births | Births / 1,000 Women |
| 15 to 19 years | 0 (0.0%) | 0.0 |
| 20 to 34 years | 614 (88.5%) | 72.0 |
| 35 to 50 years | 80 (11.5%) | 11.0 |
| Total | 694 (100.0%) | 39.0 |
Fertility by Age by Marriage Status in West Des Moines
84.4% of women with births (694) in West Des Moines are married. The highest percentage of unmarried women with births falls into 20 to 34 years age bracket with 17.6% of them unmarried at the time of birth, while the lowest percentage of unmarried women with births belong to 35 to 50 years age bracket with 0.0% of them unmarried.

| Age Bracket | Married | Unmarried |
| 15 to 19 years | 0 (0.0%) | 0 (0.0%) |
| 20 to 34 years | 506 (82.4%) | 108 (17.6%) |
| 35 to 50 years | 80 (100.0%) | 0 (0.0%) |
| Total | 586 (84.4%) | 108 (15.6%) |
Fertility by Education in West Des Moines
Average fertility rate in West Des Moines is 39.0 births per 1,000 women. Women with the education attainment of bachelor's degree have the highest fertility rate of 45.0 births per 1,000 women, while women with the education attainment of high school diploma have the lowest fertility at 31.0 births per 1,000 women. Women with the education attainment of bachelor's degree represent 40.4% of all women with births.
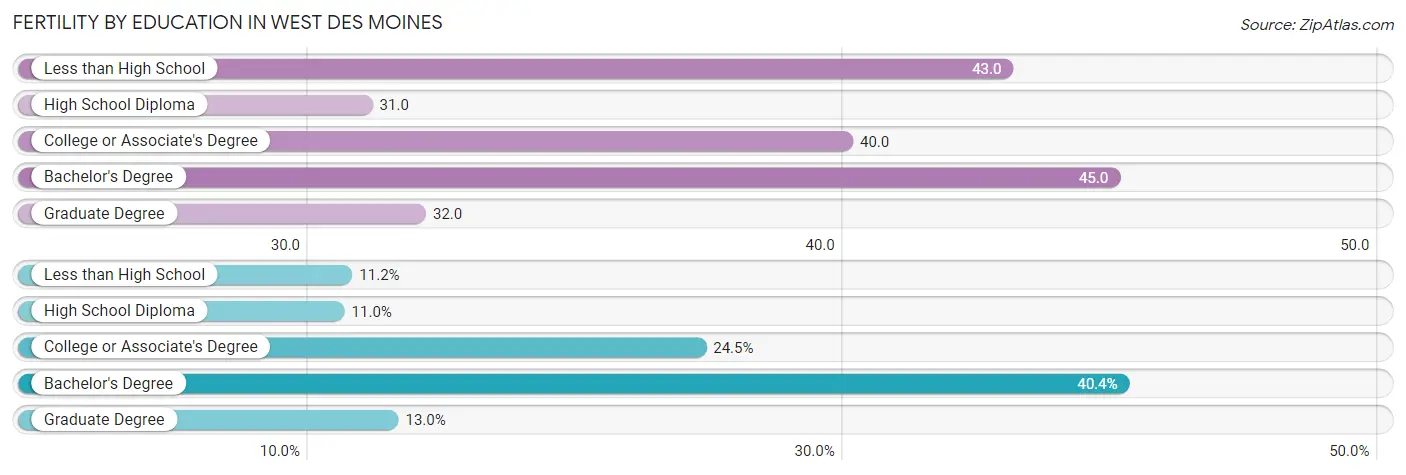
| Educational Attainment | Women with Births | Births / 1,000 Women |
| Less than High School | 78 (11.2%) | 43.0 |
| High School Diploma | 76 (11.0%) | 31.0 |
| College or Associate's Degree | 170 (24.5%) | 40.0 |
| Bachelor's Degree | 280 (40.4%) | 45.0 |
| Graduate Degree | 90 (13.0%) | 32.0 |
| Total | 694 (100.0%) | 39.0 |
Fertility by Education by Marriage Status in West Des Moines
15.6% of women with births in West Des Moines are unmarried. Women with the educational attainment of less than high school are most likely to be married with 100.0% of them married at childbirth, while women with the educational attainment of college or associate's degree are least likely to be married with 44.7% of them unmarried at childbirth.
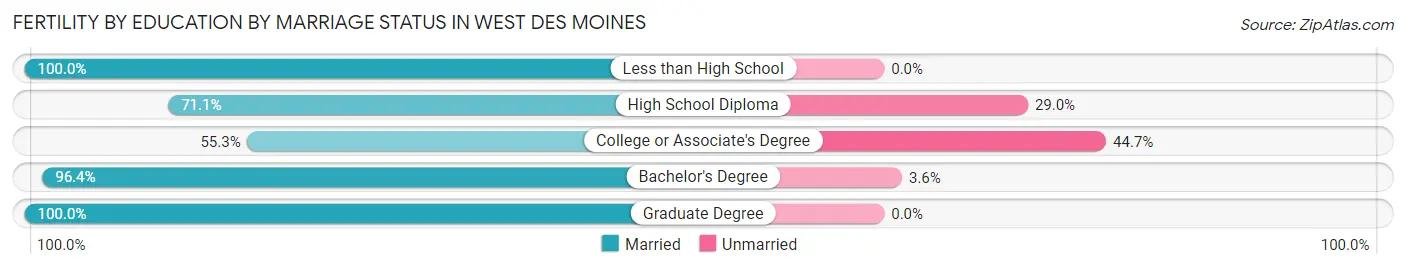
| Educational Attainment | Married | Unmarried |
| Less than High School | 78 (100.0%) | 0 (0.0%) |
| High School Diploma | 54 (71.1%) | 22 (28.9%) |
| College or Associate's Degree | 94 (55.3%) | 76 (44.7%) |
| Bachelor's Degree | 270 (96.4%) | 10 (3.6%) |
| Graduate Degree | 90 (100.0%) | 0 (0.0%) |
| Total | 586 (84.4%) | 108 (15.6%) |
Employment Characteristics in West Des Moines
Employment by Class of Employer in West Des Moines
Among the 39,479 employed individuals in West Des Moines, private company employees (28,324 | 71.7%), not-for-profit organizations (3,641 | 9.2%), and local government employees (2,338 | 5.9%) make up the most common classes of employment.
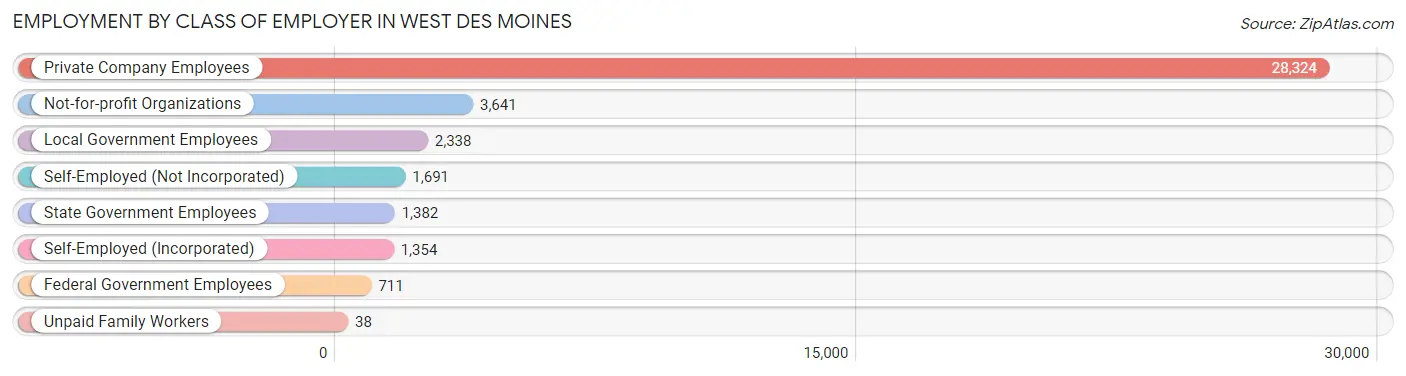
| Employer Class | # Employees | % Employees |
| Private Company Employees | 28,324 | 71.7% |
| Self-Employed (Incorporated) | 1,354 | 3.4% |
| Self-Employed (Not Incorporated) | 1,691 | 4.3% |
| Not-for-profit Organizations | 3,641 | 9.2% |
| Local Government Employees | 2,338 | 5.9% |
| State Government Employees | 1,382 | 3.5% |
| Federal Government Employees | 711 | 1.8% |
| Unpaid Family Workers | 38 | 0.1% |
| Total | 39,479 | 100.0% |
Employment Status by Age in West Des Moines
According to the labor force statistics for West Des Moines, out of the total population over 16 years of age (55,881), 74.1% or 41,408 individuals are in the labor force, with 2.8% or 1,159 of them unemployed. The age group with the highest labor force participation rate is 25 to 29 years, with 93.7% or 6,330 individuals in the labor force. Within the labor force, the 16 to 19 years age range has the highest percentage of unemployed individuals, with 7.4% or 107 of them being unemployed.
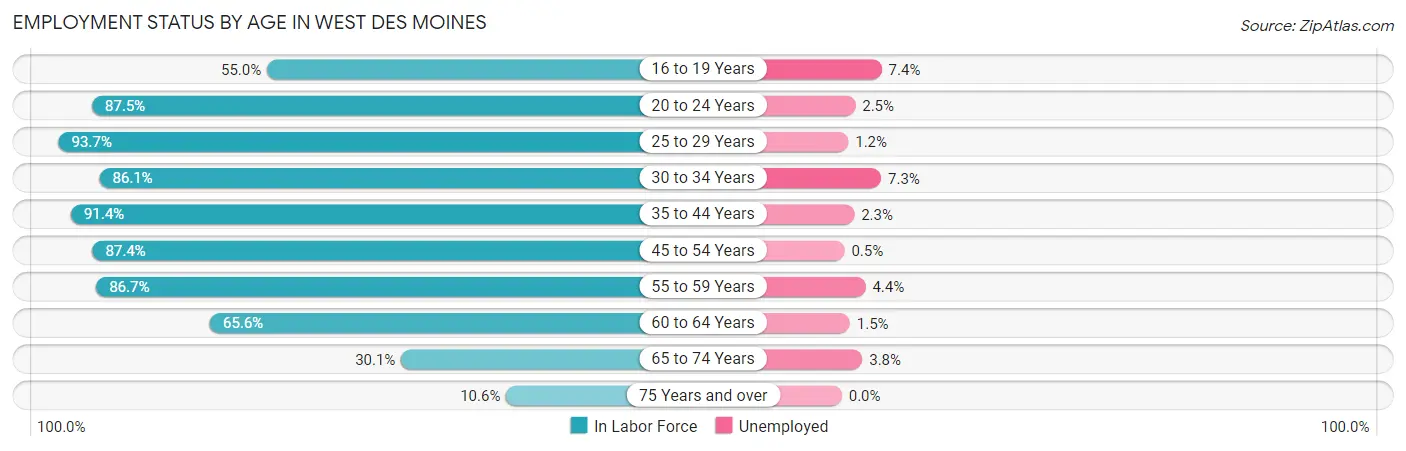
| Age Bracket | In Labor Force | Unemployed |
| 16 to 19 Years | 1,442 (55.0%) | 107 (7.4%) |
| 20 to 24 Years | 4,487 (87.5%) | 112 (2.5%) |
| 25 to 29 Years | 6,330 (93.7%) | 76 (1.2%) |
| 30 to 34 Years | 4,990 (86.1%) | 364 (7.3%) |
| 35 to 44 Years | 8,575 (91.4%) | 197 (2.3%) |
| 45 to 54 Years | 7,253 (87.4%) | 36 (0.5%) |
| 55 to 59 Years | 3,828 (86.7%) | 168 (4.4%) |
| 60 to 64 Years | 2,381 (65.6%) | 36 (1.5%) |
| 65 to 74 Years | 1,697 (30.1%) | 64 (3.8%) |
| 75 Years and over | 447 (10.6%) | 0 (0.0%) |
| Total | 41,408 (74.1%) | 1,159 (2.8%) |
Employment Status by Educational Attainment in West Des Moines
According to labor force statistics for West Des Moines, 87.1% of individuals (33,339) out of the total population between 25 and 64 years of age (38,277) are in the labor force, with 2.6% or 867 of them being unemployed. The group with the highest labor force participation rate are those with the educational attainment of bachelor's degree or higher, with 89.6% or 19,270 individuals in the labor force. Within the labor force, individuals with less than high school education have the highest percentage of unemployment, with 8.9% or 78 of them being unemployed.
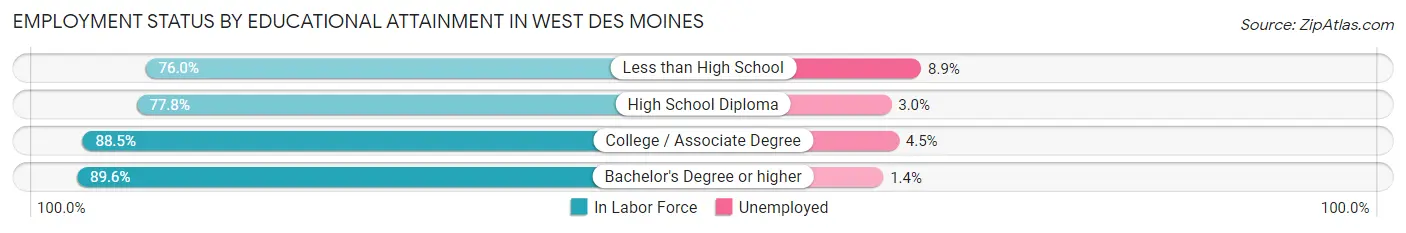
| Educational Attainment | In Labor Force | Unemployed |
| Less than High School | 872 (76.0%) | 102 (8.9%) |
| High School Diploma | 4,540 (77.8%) | 175 (3.0%) |
| College / Associate Degree | 8,662 (88.5%) | 440 (4.5%) |
| Bachelor's Degree or higher | 19,270 (89.6%) | 301 (1.4%) |
| Total | 33,339 (87.1%) | 995 (2.6%) |
Employment Occupations by Sex in West Des Moines
Management, Business, Science and Arts Occupations
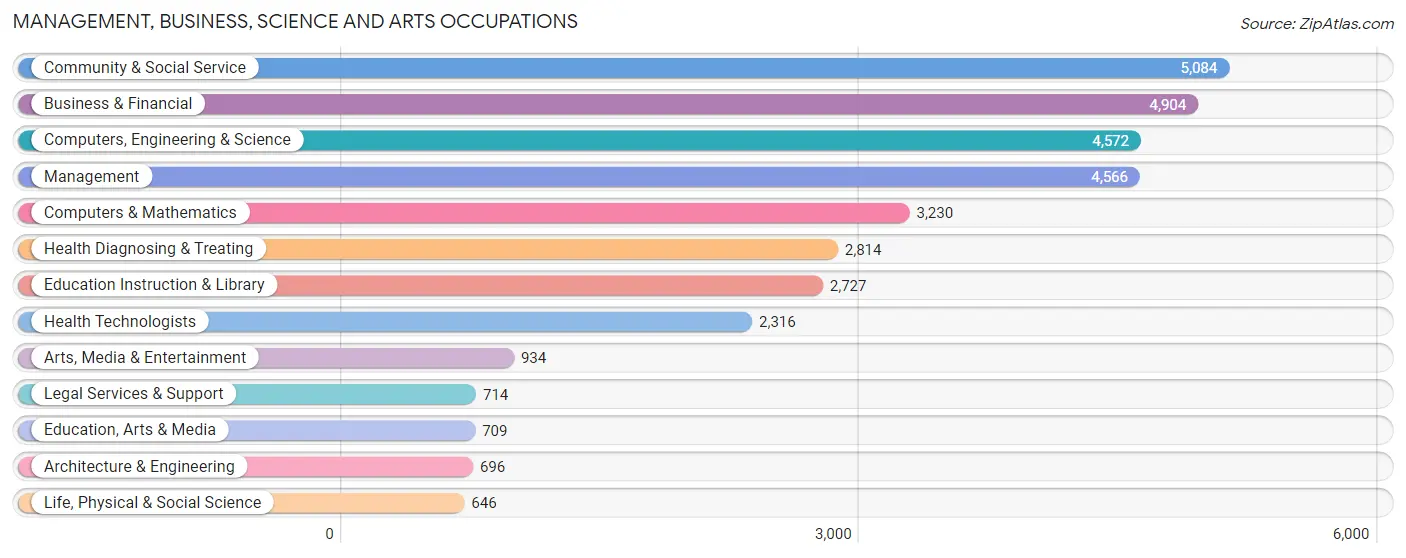
The most common Management, Business, Science and Arts occupations in West Des Moines are Community & Social Service (5,084 | 12.6%), Business & Financial (4,904 | 12.2%), Computers, Engineering & Science (4,572 | 11.4%), Management (4,566 | 11.4%), and Computers & Mathematics (3,230 | 8.0%).
Management, Business, Science and Arts Occupations by Sex
Within the Management, Business, Science and Arts occupations in West Des Moines, the most male-oriented occupations are Architecture & Engineering (93.8%), Legal Services & Support (83.2%), and Computers, Engineering & Science (70.9%), while the most female-oriented occupations are Education Instruction & Library (72.2%), Arts, Media & Entertainment (66.1%), and Health Diagnosing & Treating (66.0%).
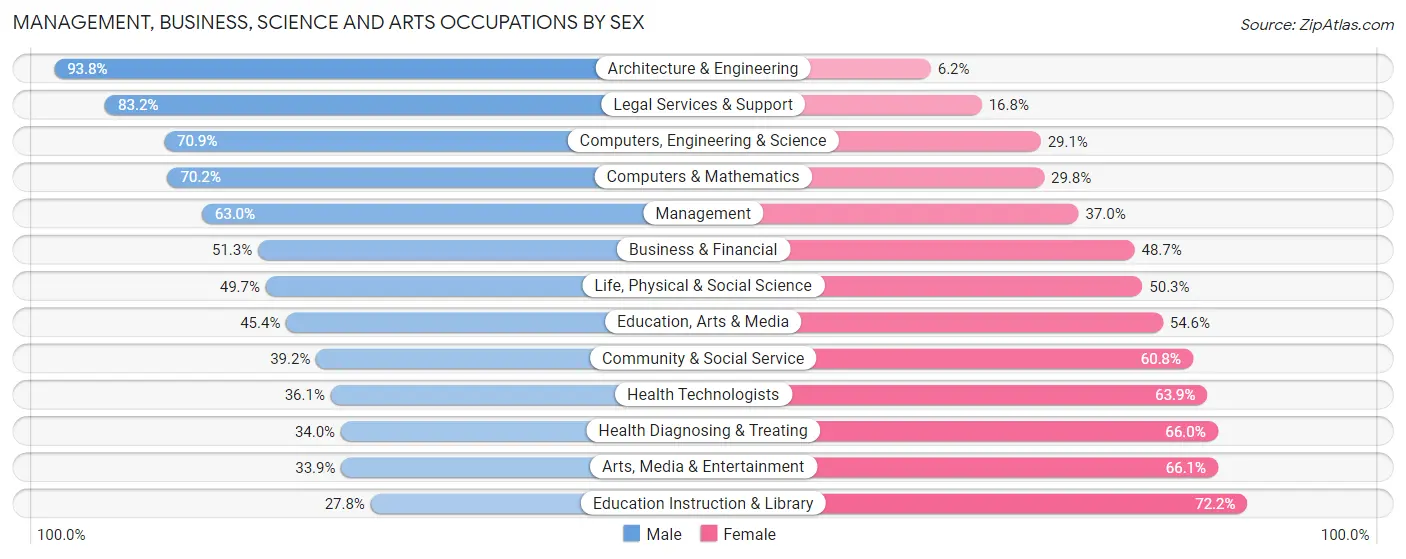
| Occupation | Male | Female |
| Management | 2,877 (63.0%) | 1,689 (37.0%) |
| Business & Financial | 2,516 (51.3%) | 2,388 (48.7%) |
| Computers, Engineering & Science | 3,241 (70.9%) | 1,331 (29.1%) |
| Computers & Mathematics | 2,267 (70.2%) | 963 (29.8%) |
| Architecture & Engineering | 653 (93.8%) | 43 (6.2%) |
| Life, Physical & Social Science | 321 (49.7%) | 325 (50.3%) |
| Community & Social Service | 1,991 (39.2%) | 3,093 (60.8%) |
| Education, Arts & Media | 322 (45.4%) | 387 (54.6%) |
| Legal Services & Support | 594 (83.2%) | 120 (16.8%) |
| Education Instruction & Library | 758 (27.8%) | 1,969 (72.2%) |
| Arts, Media & Entertainment | 317 (33.9%) | 617 (66.1%) |
| Health Diagnosing & Treating | 957 (34.0%) | 1,857 (66.0%) |
| Health Technologists | 837 (36.1%) | 1,479 (63.9%) |
| Total (Category) | 11,582 (52.8%) | 10,358 (47.2%) |
| Total (Overall) | 21,611 (53.7%) | 18,612 (46.3%) |
Services Occupations
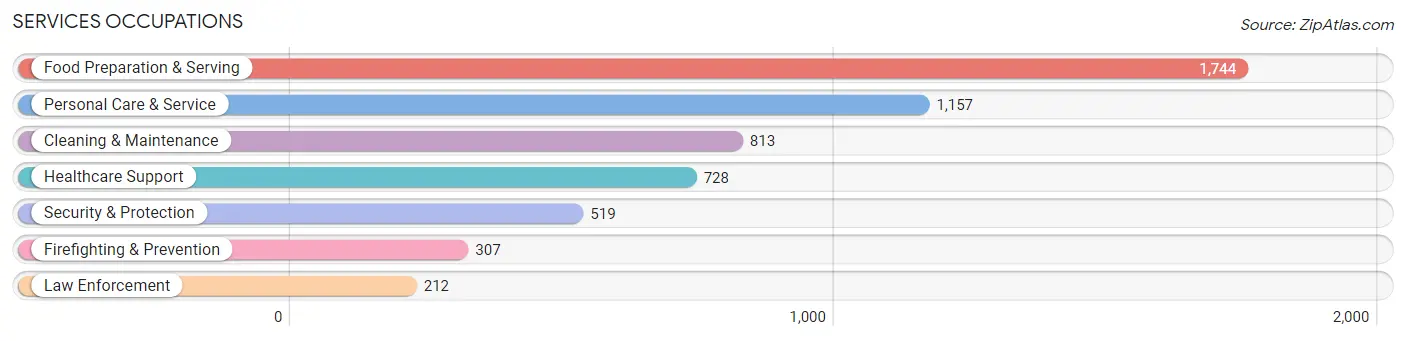
The most common Services occupations in West Des Moines are Food Preparation & Serving (1,744 | 4.3%), Personal Care & Service (1,157 | 2.9%), Cleaning & Maintenance (813 | 2.0%), Healthcare Support (728 | 1.8%), and Security & Protection (519 | 1.3%).
Services Occupations by Sex
Within the Services occupations in West Des Moines, the most male-oriented occupations are Firefighting & Prevention (100.0%), Security & Protection (79.2%), and Law Enforcement (49.1%), while the most female-oriented occupations are Healthcare Support (92.7%), Personal Care & Service (73.7%), and Cleaning & Maintenance (58.8%).
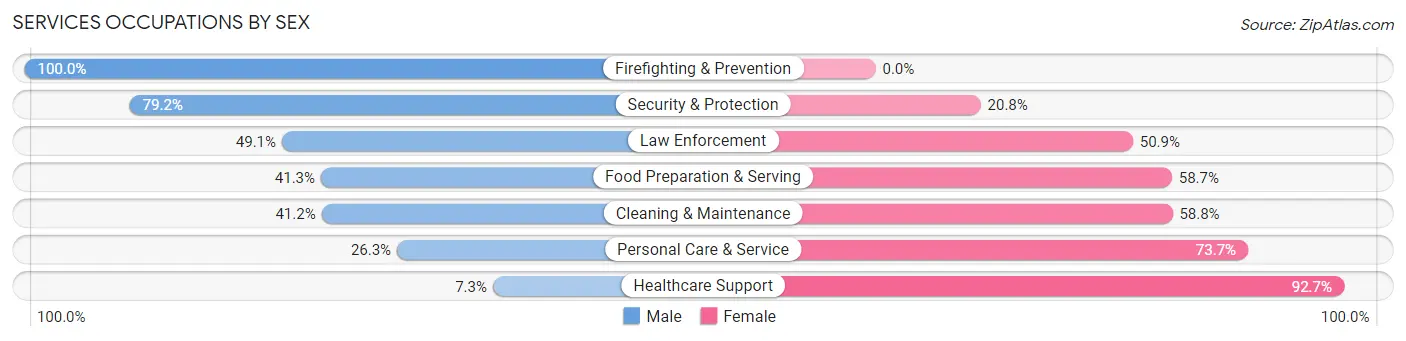
| Occupation | Male | Female |
| Healthcare Support | 53 (7.3%) | 675 (92.7%) |
| Security & Protection | 411 (79.2%) | 108 (20.8%) |
| Firefighting & Prevention | 307 (100.0%) | 0 (0.0%) |
| Law Enforcement | 104 (49.1%) | 108 (50.9%) |
| Food Preparation & Serving | 721 (41.3%) | 1,023 (58.7%) |
| Cleaning & Maintenance | 335 (41.2%) | 478 (58.8%) |
| Personal Care & Service | 304 (26.3%) | 853 (73.7%) |
| Total (Category) | 1,824 (36.8%) | 3,137 (63.2%) |
| Total (Overall) | 21,611 (53.7%) | 18,612 (46.3%) |
Sales and Office Occupations
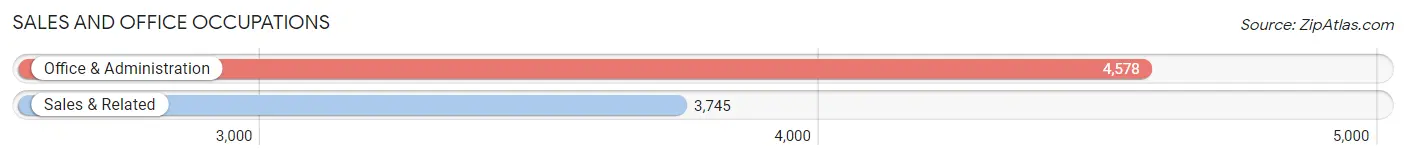
The most common Sales and Office occupations in West Des Moines are Office & Administration (4,578 | 11.4%), and Sales & Related (3,745 | 9.3%).
Sales and Office Occupations by Sex
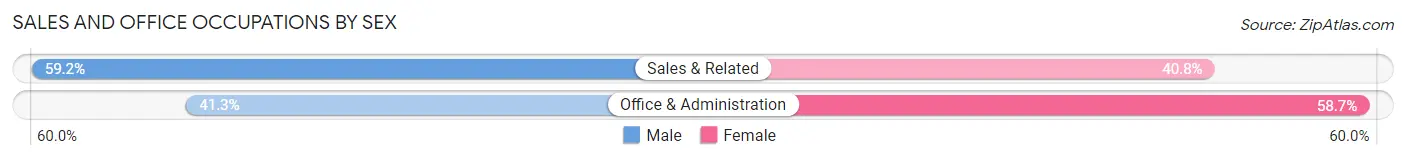
| Occupation | Male | Female |
| Sales & Related | 2,216 (59.2%) | 1,529 (40.8%) |
| Office & Administration | 1,892 (41.3%) | 2,686 (58.7%) |
| Total (Category) | 4,108 (49.4%) | 4,215 (50.6%) |
| Total (Overall) | 21,611 (53.7%) | 18,612 (46.3%) |
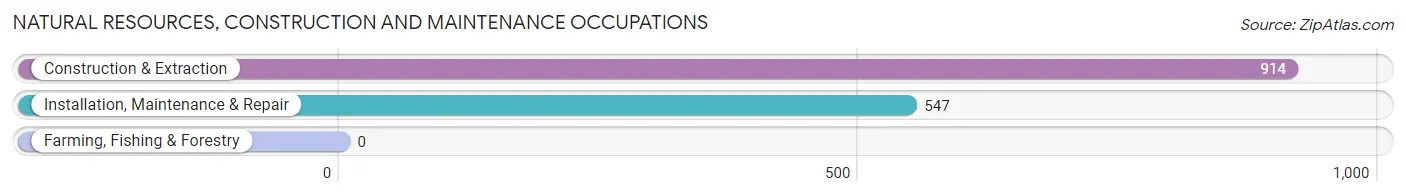
Natural Resources, Construction and Maintenance Occupations
The most common Natural Resources, Construction and Maintenance occupations in West Des Moines are Construction & Extraction (914 | 2.3%), and Installation, Maintenance & Repair (547 | 1.4%).
Natural Resources, Construction and Maintenance Occupations by Sex
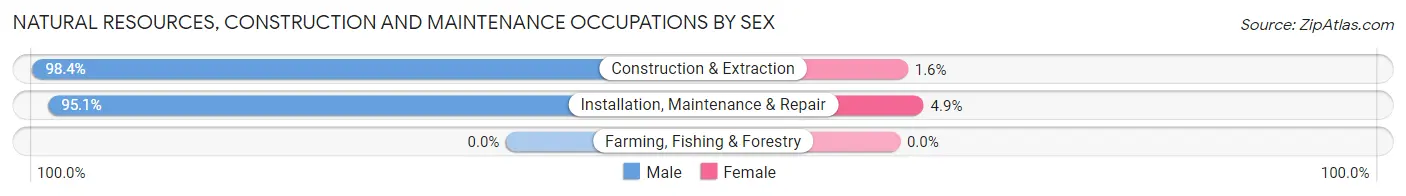
| Occupation | Male | Female |
| Farming, Fishing & Forestry | 0 (0.0%) | 0 (0.0%) |
| Construction & Extraction | 899 (98.4%) | 15 (1.6%) |
| Installation, Maintenance & Repair | 520 (95.1%) | 27 (4.9%) |
| Total (Category) | 1,419 (97.1%) | 42 (2.9%) |
| Total (Overall) | 21,611 (53.7%) | 18,612 (46.3%) |
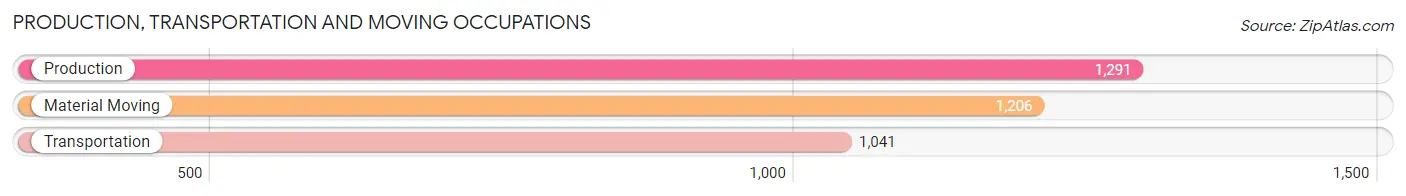
Production, Transportation and Moving Occupations
The most common Production, Transportation and Moving occupations in West Des Moines are Production (1,291 | 3.2%), Material Moving (1,206 | 3.0%), and Transportation (1,041 | 2.6%).
Production, Transportation and Moving Occupations by Sex
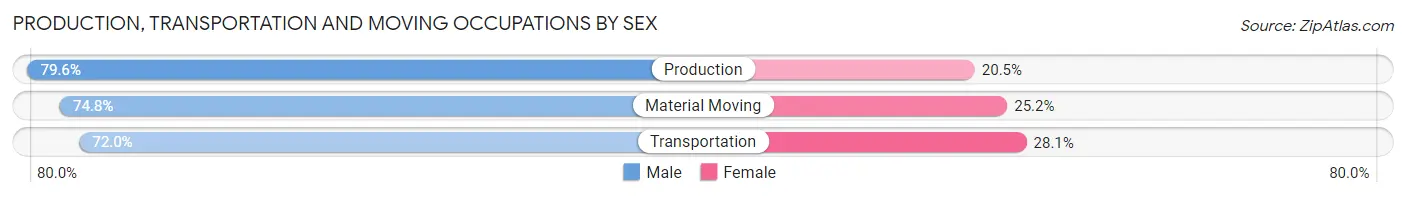
| Occupation | Male | Female |
| Production | 1,027 (79.5%) | 264 (20.4%) |
| Transportation | 749 (72.0%) | 292 (28.1%) |
| Material Moving | 902 (74.8%) | 304 (25.2%) |
| Total (Category) | 2,678 (75.7%) | 860 (24.3%) |
| Total (Overall) | 21,611 (53.7%) | 18,612 (46.3%) |
Employment Industries by Sex in West Des Moines
Employment Industries in West Des Moines
The major employment industries in West Des Moines include Finance & Insurance (7,682 | 19.1%), Health Care & Social Assistance (4,758 | 11.8%), Retail Trade (4,183 | 10.4%), Professional & Scientific (3,951 | 9.8%), and Educational Services (3,447 | 8.6%).
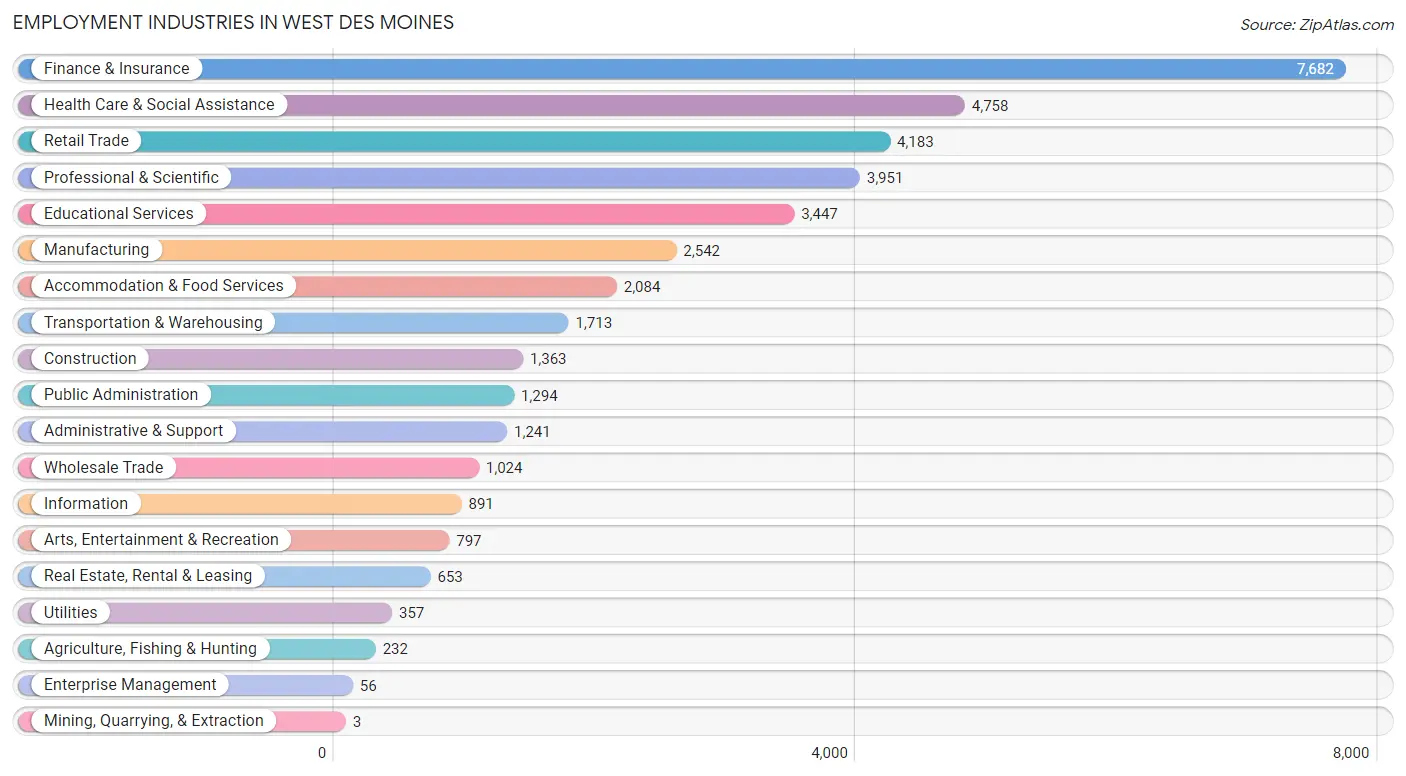
Employment Industries by Sex in West Des Moines
The West Des Moines industries that see more men than women are Construction (87.7%), Wholesale Trade (81.5%), and Utilities (79.5%), whereas the industries that tend to have a higher number of women are Mining, Quarrying, & Extraction (100.0%), Educational Services (72.8%), and Health Care & Social Assistance (69.4%).
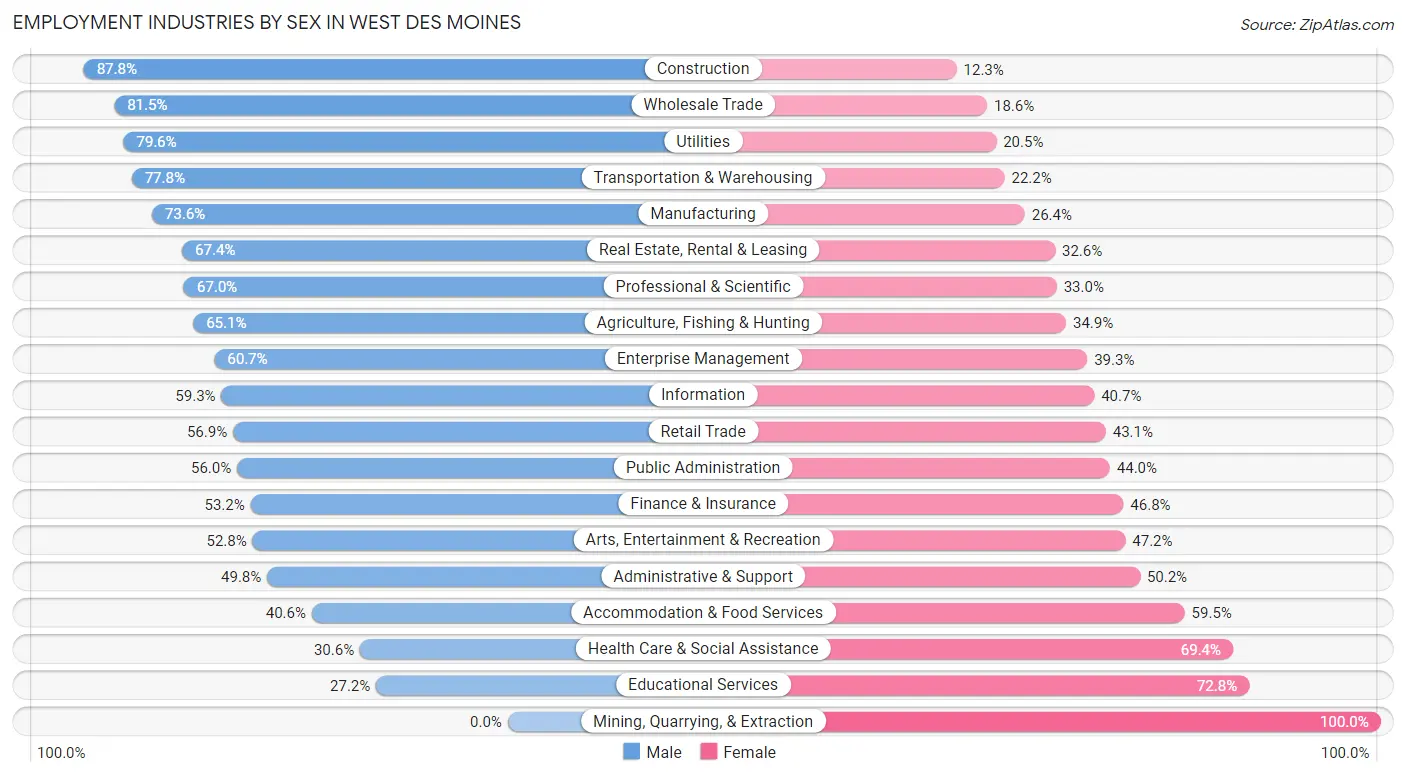
| Industry | Male | Female |
| Agriculture, Fishing & Hunting | 151 (65.1%) | 81 (34.9%) |
| Mining, Quarrying, & Extraction | 0 (0.0%) | 3 (100.0%) |
| Construction | 1,196 (87.7%) | 167 (12.2%) |
| Manufacturing | 1,872 (73.6%) | 670 (26.4%) |
| Wholesale Trade | 834 (81.5%) | 190 (18.5%) |
| Retail Trade | 2,379 (56.9%) | 1,804 (43.1%) |
| Transportation & Warehousing | 1,333 (77.8%) | 380 (22.2%) |
| Utilities | 284 (79.5%) | 73 (20.4%) |
| Information | 528 (59.3%) | 363 (40.7%) |
| Finance & Insurance | 4,089 (53.2%) | 3,593 (46.8%) |
| Real Estate, Rental & Leasing | 440 (67.4%) | 213 (32.6%) |
| Professional & Scientific | 2,648 (67.0%) | 1,303 (33.0%) |
| Enterprise Management | 34 (60.7%) | 22 (39.3%) |
| Administrative & Support | 618 (49.8%) | 623 (50.2%) |
| Educational Services | 939 (27.2%) | 2,508 (72.8%) |
| Health Care & Social Assistance | 1,455 (30.6%) | 3,303 (69.4%) |
| Arts, Entertainment & Recreation | 421 (52.8%) | 376 (47.2%) |
| Accommodation & Food Services | 845 (40.6%) | 1,239 (59.5%) |
| Public Administration | 725 (56.0%) | 569 (44.0%) |
| Total | 21,611 (53.7%) | 18,612 (46.3%) |
Education in West Des Moines
School Enrollment in West Des Moines
The most common levels of schooling among the 15,455 students in West Des Moines are middle school (3,260 | 21.1%), elementary school (3,239 | 21.0%), and high school (3,226 | 20.9%).
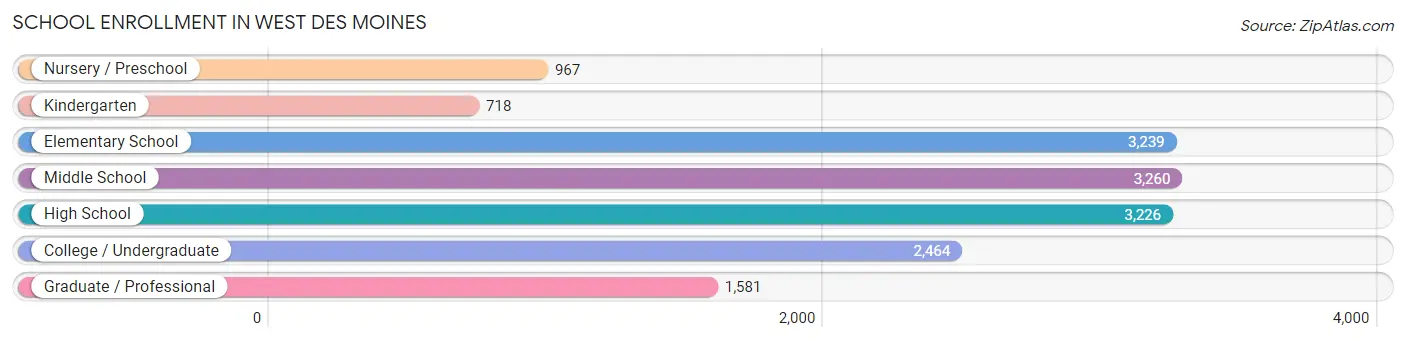
| School Level | # Students | % Students |
| Nursery / Preschool | 967 | 6.3% |
| Kindergarten | 718 | 4.6% |
| Elementary School | 3,239 | 21.0% |
| Middle School | 3,260 | 21.1% |
| High School | 3,226 | 20.9% |
| College / Undergraduate | 2,464 | 15.9% |
| Graduate / Professional | 1,581 | 10.2% |
| Total | 15,455 | 100.0% |
School Enrollment by Age by Funding Source in West Des Moines
Out of a total of 15,455 students who are enrolled in schools in West Des Moines, 2,998 (19.4%) attend a private institution, while the remaining 12,457 (80.6%) are enrolled in public schools. The age group of 20 to 24 year olds has the highest likelihood of being enrolled in private schools, with 756 (45.8% in the age bracket) enrolled. Conversely, the age group of 5 to 9 year old has the lowest likelihood of being enrolled in a private school, with 3,524 (91.4% in the age bracket) attending a public institution.
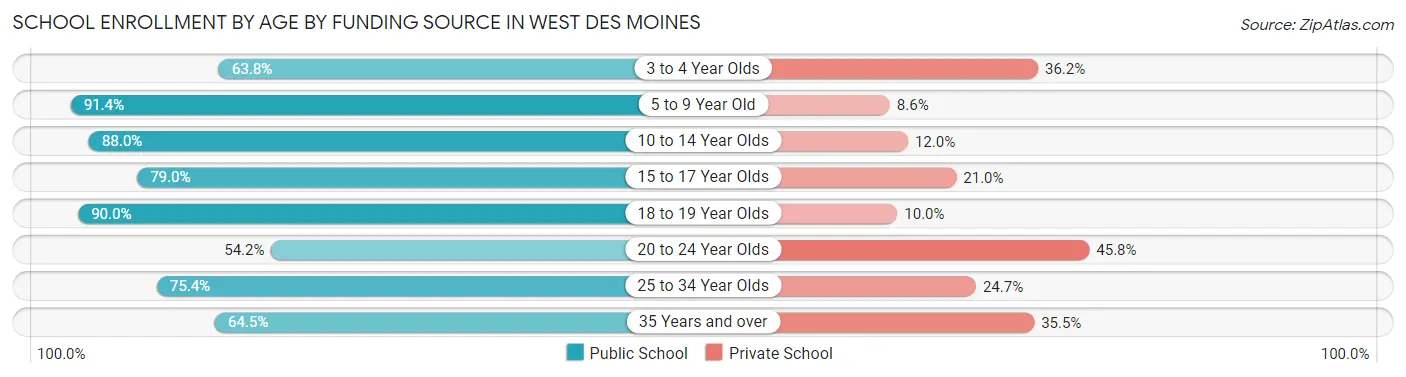
| Age Bracket | Public School | Private School |
| 3 to 4 Year Olds | 497 (63.8%) | 282 (36.2%) |
| 5 to 9 Year Old | 3,524 (91.4%) | 332 (8.6%) |
| 10 to 14 Year Olds | 3,512 (88.0%) | 478 (12.0%) |
| 15 to 17 Year Olds | 1,901 (79.0%) | 505 (21.0%) |
| 18 to 19 Year Olds | 702 (90.0%) | 78 (10.0%) |
| 20 to 24 Year Olds | 896 (54.2%) | 756 (45.8%) |
| 25 to 34 Year Olds | 966 (75.3%) | 316 (24.6%) |
| 35 Years and over | 458 (64.5%) | 252 (35.5%) |
| Total | 12,457 (80.6%) | 2,998 (19.4%) |
Educational Attainment by Field of Study in West Des Moines
Business (7,170 | 25.0%), education (2,967 | 10.4%), science & technology (2,226 | 7.8%), social sciences (1,939 | 6.8%), and arts & humanities (1,898 | 6.6%) are the most common fields of study among 28,630 individuals in West Des Moines who have obtained a bachelor's degree or higher.
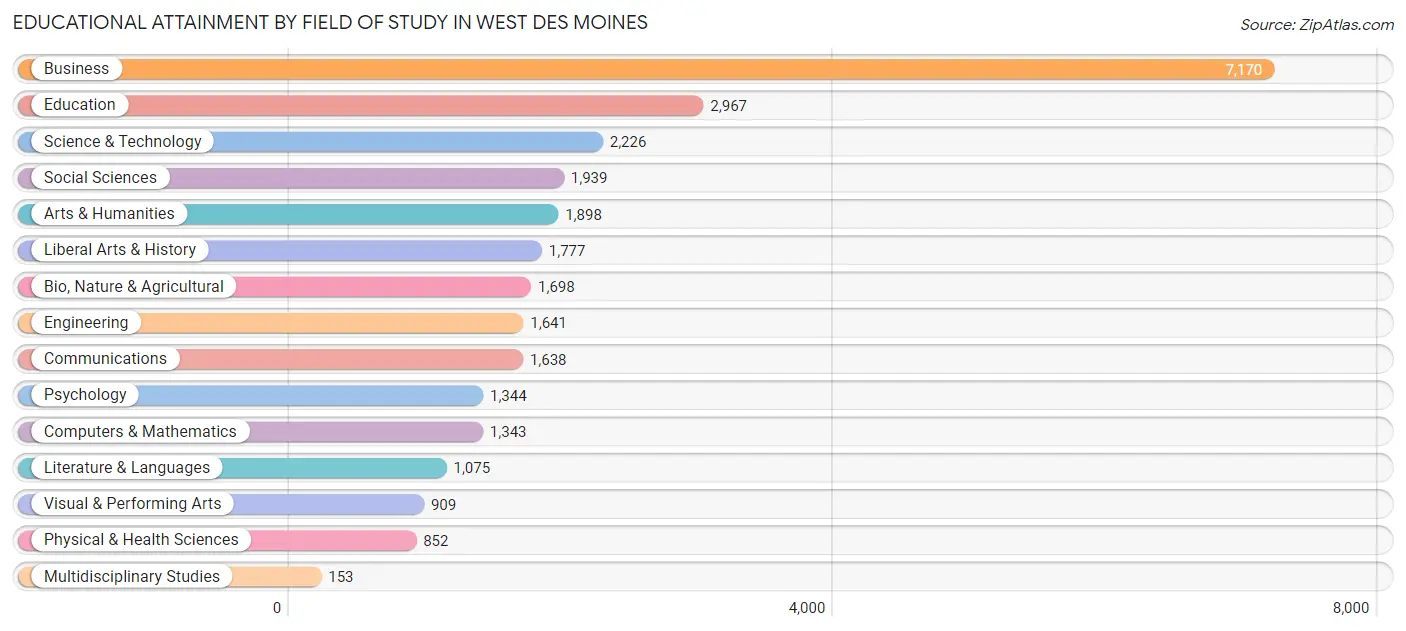
| Field of Study | # Graduates | % Graduates |
| Computers & Mathematics | 1,343 | 4.7% |
| Bio, Nature & Agricultural | 1,698 | 5.9% |
| Physical & Health Sciences | 852 | 3.0% |
| Psychology | 1,344 | 4.7% |
| Social Sciences | 1,939 | 6.8% |
| Engineering | 1,641 | 5.7% |
| Multidisciplinary Studies | 153 | 0.5% |
| Science & Technology | 2,226 | 7.8% |
| Business | 7,170 | 25.0% |
| Education | 2,967 | 10.4% |
| Literature & Languages | 1,075 | 3.7% |
| Liberal Arts & History | 1,777 | 6.2% |
| Visual & Performing Arts | 909 | 3.2% |
| Communications | 1,638 | 5.7% |
| Arts & Humanities | 1,898 | 6.6% |
| Total | 28,630 | 100.0% |
Transportation & Commute in West Des Moines
Vehicle Availability by Sex in West Des Moines
The most prevalent vehicle ownership categories in West Des Moines are males with 2 vehicles (9,970, accounting for 46.9%) and females with 2 vehicles (9,001, making up 54.8%).
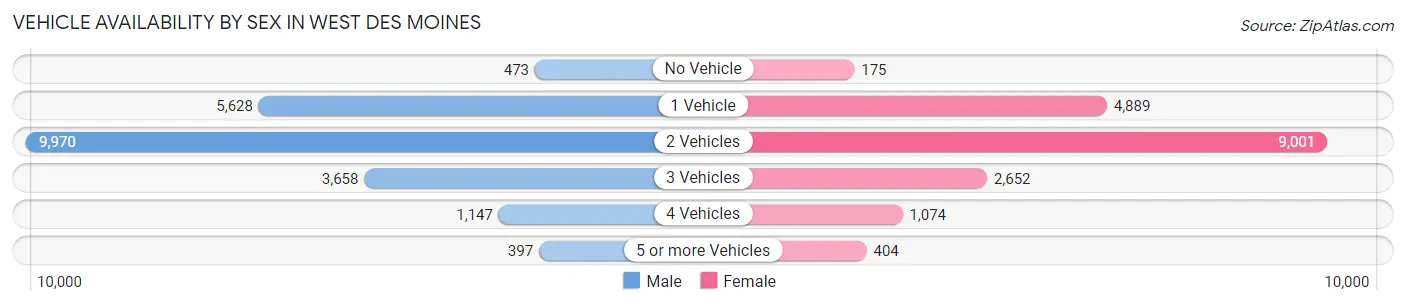
| Vehicles Available | Male | Female |
| No Vehicle | 473 (2.2%) | 175 (1.0%) |
| 1 Vehicle | 5,628 (26.5%) | 4,889 (26.9%) |
| 2 Vehicles | 9,970 (46.9%) | 9,001 (49.5%) |
| 3 Vehicles | 3,658 (17.2%) | 2,652 (14.6%) |
| 4 Vehicles | 1,147 (5.4%) | 1,074 (5.9%) |
| 5 or more Vehicles | 397 (1.9%) | 404 (2.2%) |
| Total | 21,273 (100.0%) | 18,195 (100.0%) |
Commute Time in West Des Moines
The most frequently occuring commute durations in West Des Moines are 15 to 19 minutes (8,511 commuters, 25.1%), 20 to 24 minutes (6,983 commuters, 20.6%), and 10 to 14 minutes (6,868 commuters, 20.3%).
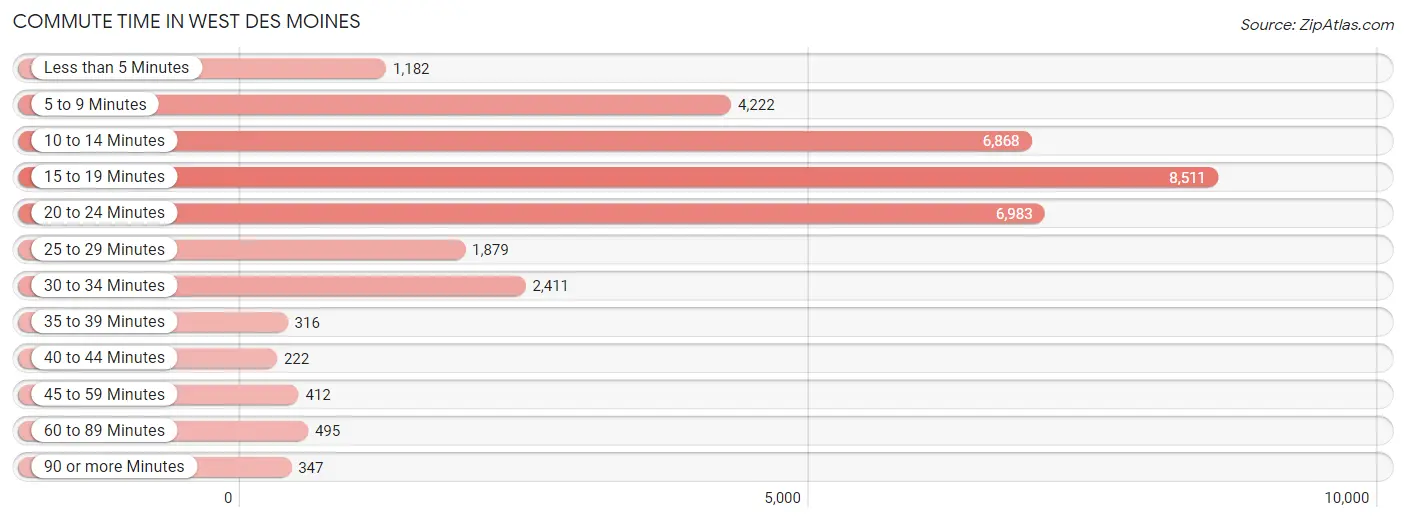
| Commute Time | # Commuters | % Commuters |
| Less than 5 Minutes | 1,182 | 3.5% |
| 5 to 9 Minutes | 4,222 | 12.5% |
| 10 to 14 Minutes | 6,868 | 20.3% |
| 15 to 19 Minutes | 8,511 | 25.1% |
| 20 to 24 Minutes | 6,983 | 20.6% |
| 25 to 29 Minutes | 1,879 | 5.6% |
| 30 to 34 Minutes | 2,411 | 7.1% |
| 35 to 39 Minutes | 316 | 0.9% |
| 40 to 44 Minutes | 222 | 0.7% |
| 45 to 59 Minutes | 412 | 1.2% |
| 60 to 89 Minutes | 495 | 1.5% |
| 90 or more Minutes | 347 | 1.0% |
Commute Time by Sex in West Des Moines
The most common commute times in West Des Moines are 15 to 19 minutes (4,497 commuters, 24.0%) for males and 15 to 19 minutes (4,014 commuters, 26.6%) for females.
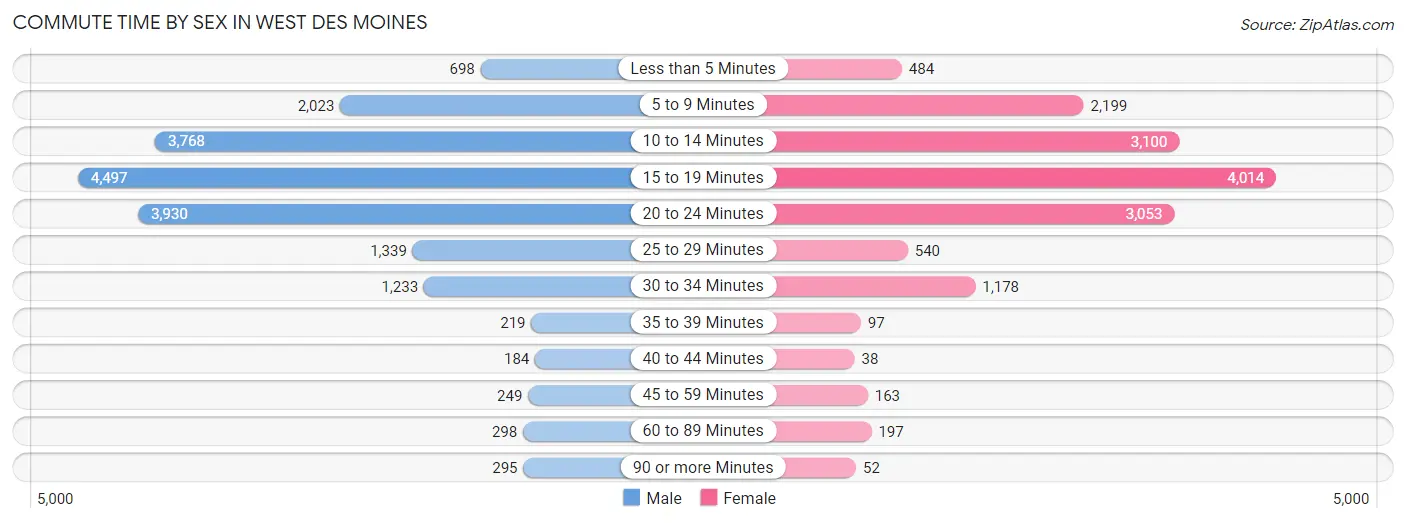
| Commute Time | Male | Female |
| Less than 5 Minutes | 698 (3.7%) | 484 (3.2%) |
| 5 to 9 Minutes | 2,023 (10.8%) | 2,199 (14.5%) |
| 10 to 14 Minutes | 3,768 (20.1%) | 3,100 (20.5%) |
| 15 to 19 Minutes | 4,497 (24.0%) | 4,014 (26.6%) |
| 20 to 24 Minutes | 3,930 (21.0%) | 3,053 (20.2%) |
| 25 to 29 Minutes | 1,339 (7.1%) | 540 (3.6%) |
| 30 to 34 Minutes | 1,233 (6.6%) | 1,178 (7.8%) |
| 35 to 39 Minutes | 219 (1.2%) | 97 (0.6%) |
| 40 to 44 Minutes | 184 (1.0%) | 38 (0.3%) |
| 45 to 59 Minutes | 249 (1.3%) | 163 (1.1%) |
| 60 to 89 Minutes | 298 (1.6%) | 197 (1.3%) |
| 90 or more Minutes | 295 (1.6%) | 52 (0.3%) |
Time of Departure to Work by Sex in West Des Moines
The most frequent times of departure to work in West Des Moines are 7:30 AM to 7:59 AM (3,618, 19.3%) for males and 7:00 AM to 7:29 AM (2,578, 17.1%) for females.
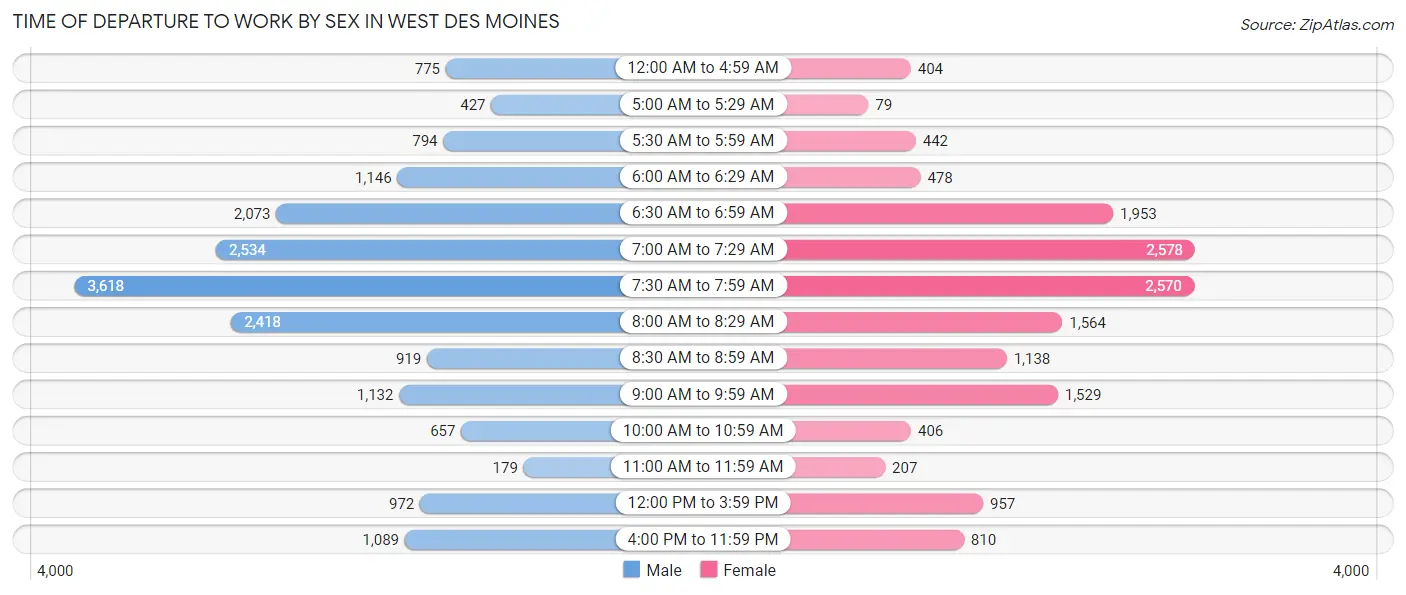
| Time of Departure | Male | Female |
| 12:00 AM to 4:59 AM | 775 (4.1%) | 404 (2.7%) |
| 5:00 AM to 5:29 AM | 427 (2.3%) | 79 (0.5%) |
| 5:30 AM to 5:59 AM | 794 (4.2%) | 442 (2.9%) |
| 6:00 AM to 6:29 AM | 1,146 (6.1%) | 478 (3.2%) |
| 6:30 AM to 6:59 AM | 2,073 (11.1%) | 1,953 (12.9%) |
| 7:00 AM to 7:29 AM | 2,534 (13.5%) | 2,578 (17.1%) |
| 7:30 AM to 7:59 AM | 3,618 (19.3%) | 2,570 (17.0%) |
| 8:00 AM to 8:29 AM | 2,418 (12.9%) | 1,564 (10.3%) |
| 8:30 AM to 8:59 AM | 919 (4.9%) | 1,138 (7.5%) |
| 9:00 AM to 9:59 AM | 1,132 (6.0%) | 1,529 (10.1%) |
| 10:00 AM to 10:59 AM | 657 (3.5%) | 406 (2.7%) |
| 11:00 AM to 11:59 AM | 179 (1.0%) | 207 (1.4%) |
| 12:00 PM to 3:59 PM | 972 (5.2%) | 957 (6.3%) |
| 4:00 PM to 11:59 PM | 1,089 (5.8%) | 810 (5.4%) |
| Total | 18,733 (100.0%) | 15,115 (100.0%) |
Housing Occupancy in West Des Moines
Occupancy by Ownership in West Des Moines
Of the total 31,307 dwellings in West Des Moines, owner-occupied units account for 18,197 (58.1%), while renter-occupied units make up 13,110 (41.9%).
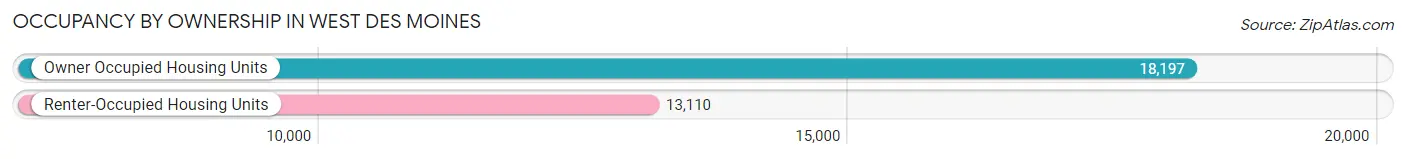
| Occupancy | # Housing Units | % Housing Units |
| Owner Occupied Housing Units | 18,197 | 58.1% |
| Renter-Occupied Housing Units | 13,110 | 41.9% |
| Total Occupied Housing Units | 31,307 | 100.0% |
Occupancy by Household Size in West Des Moines
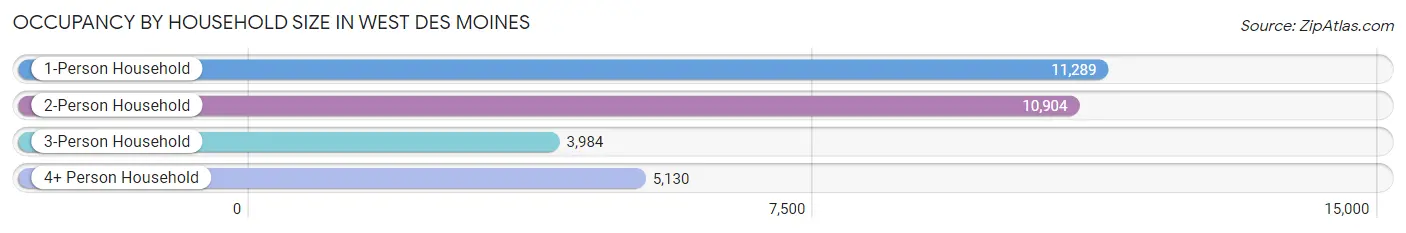
| Household Size | # Housing Units | % Housing Units |
| 1-Person Household | 11,289 | 36.1% |
| 2-Person Household | 10,904 | 34.8% |
| 3-Person Household | 3,984 | 12.7% |
| 4+ Person Household | 5,130 | 16.4% |
| Total Housing Units | 31,307 | 100.0% |
Occupancy by Ownership by Household Size in West Des Moines
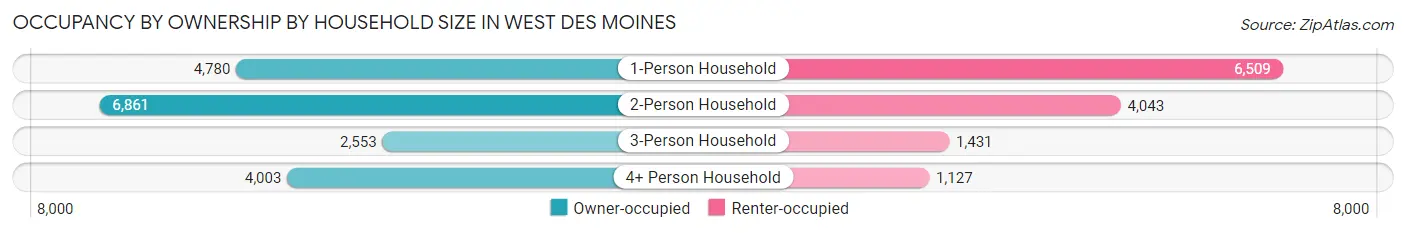
| Household Size | Owner-occupied | Renter-occupied |
| 1-Person Household | 4,780 (42.3%) | 6,509 (57.7%) |
| 2-Person Household | 6,861 (62.9%) | 4,043 (37.1%) |
| 3-Person Household | 2,553 (64.1%) | 1,431 (35.9%) |
| 4+ Person Household | 4,003 (78.0%) | 1,127 (22.0%) |
| Total Housing Units | 18,197 (58.1%) | 13,110 (41.9%) |
Occupancy by Educational Attainment in West Des Moines
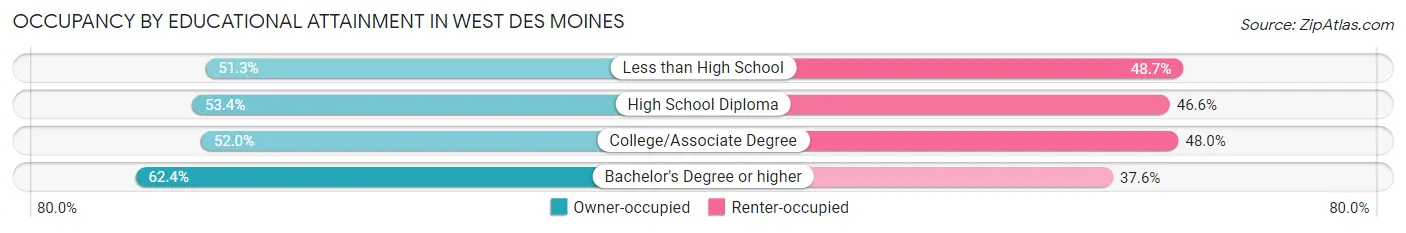
| Household Size | Owner-occupied | Renter-occupied |
| Less than High School | 445 (51.3%) | 422 (48.7%) |
| High School Diploma | 2,217 (53.4%) | 1,932 (46.6%) |
| College/Associate Degree | 4,384 (52.0%) | 4,041 (48.0%) |
| Bachelor's Degree or higher | 11,151 (62.4%) | 6,715 (37.6%) |
Occupancy by Age of Householder in West Des Moines
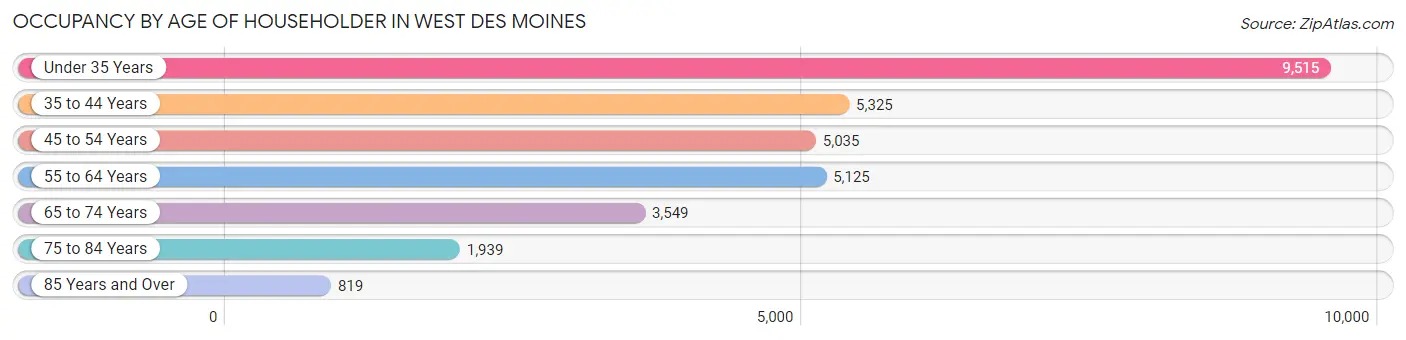
| Age Bracket | # Households | % Households |
| Under 35 Years | 9,515 | 30.4% |
| 35 to 44 Years | 5,325 | 17.0% |
| 45 to 54 Years | 5,035 | 16.1% |
| 55 to 64 Years | 5,125 | 16.4% |
| 65 to 74 Years | 3,549 | 11.3% |
| 75 to 84 Years | 1,939 | 6.2% |
| 85 Years and Over | 819 | 2.6% |
| Total | 31,307 | 100.0% |
Housing Finances in West Des Moines
Median Income by Occupancy in West Des Moines
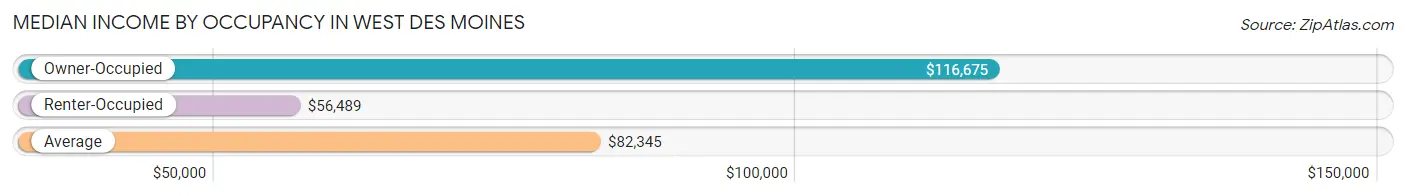
| Occupancy Type | # Households | Median Income |
| Owner-Occupied | 18,197 (58.1%) | $116,675 |
| Renter-Occupied | 13,110 (41.9%) | $56,489 |
| Average | 31,307 (100.0%) | $82,345 |
Occupancy by Householder Income Bracket in West Des Moines
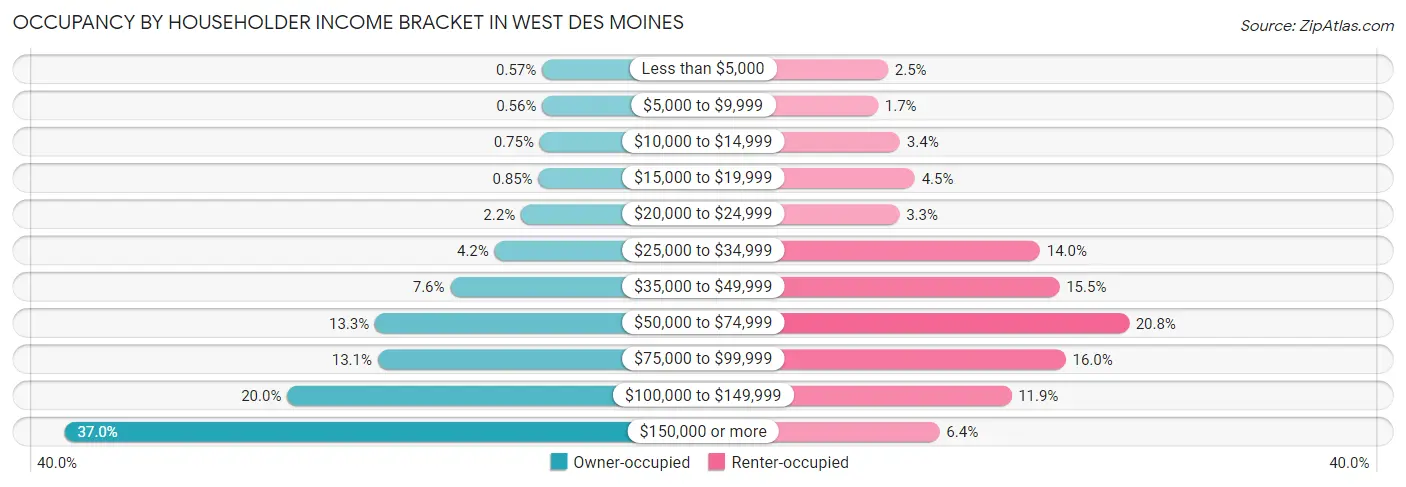
| Income Bracket | Owner-occupied | Renter-occupied |
| Less than $5,000 | 103 (0.6%) | 323 (2.5%) |
| $5,000 to $9,999 | 101 (0.6%) | 223 (1.7%) |
| $10,000 to $14,999 | 137 (0.7%) | 443 (3.4%) |
| $15,000 to $19,999 | 154 (0.9%) | 591 (4.5%) |
| $20,000 to $24,999 | 397 (2.2%) | 437 (3.3%) |
| $25,000 to $34,999 | 763 (4.2%) | 1,840 (14.0%) |
| $35,000 to $49,999 | 1,376 (7.6%) | 2,035 (15.5%) |
| $50,000 to $74,999 | 2,421 (13.3%) | 2,728 (20.8%) |
| $75,000 to $99,999 | 2,382 (13.1%) | 2,097 (16.0%) |
| $100,000 to $149,999 | 3,638 (20.0%) | 1,555 (11.9%) |
| $150,000 or more | 6,725 (37.0%) | 838 (6.4%) |
| Total | 18,197 (100.0%) | 13,110 (100.0%) |
Monthly Housing Cost Tiers in West Des Moines
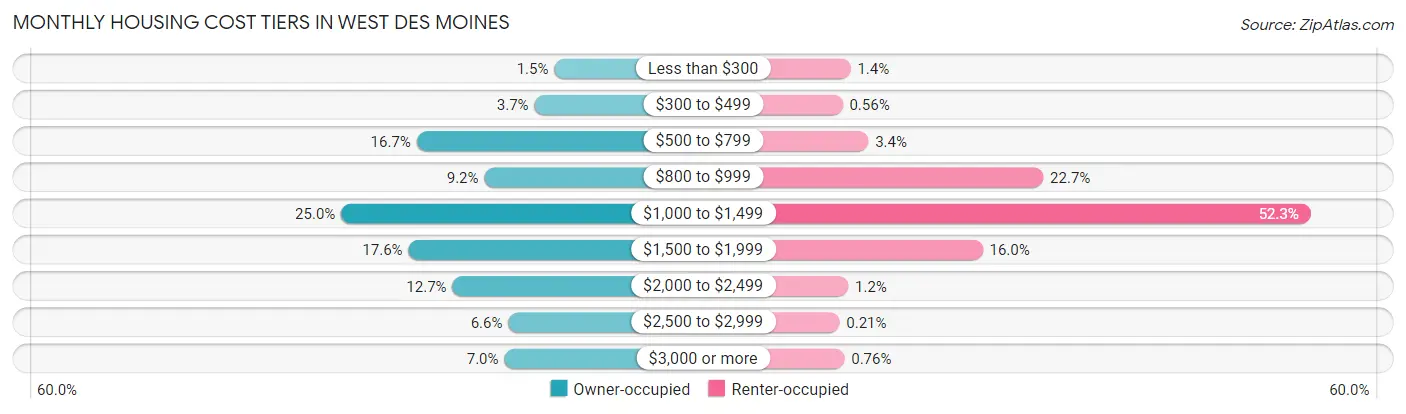
| Monthly Cost | Owner-occupied | Renter-occupied |
| Less than $300 | 269 (1.5%) | 189 (1.4%) |
| $300 to $499 | 670 (3.7%) | 73 (0.6%) |
| $500 to $799 | 3,037 (16.7%) | 446 (3.4%) |
| $800 to $999 | 1,676 (9.2%) | 2,980 (22.7%) |
| $1,000 to $1,499 | 4,555 (25.0%) | 6,854 (52.3%) |
| $1,500 to $1,999 | 3,202 (17.6%) | 2,102 (16.0%) |
| $2,000 to $2,499 | 2,319 (12.7%) | 155 (1.2%) |
| $2,500 to $2,999 | 1,196 (6.6%) | 28 (0.2%) |
| $3,000 or more | 1,273 (7.0%) | 99 (0.8%) |
| Total | 18,197 (100.0%) | 13,110 (100.0%) |
Physical Housing Characteristics in West Des Moines
Housing Structures in West Des Moines
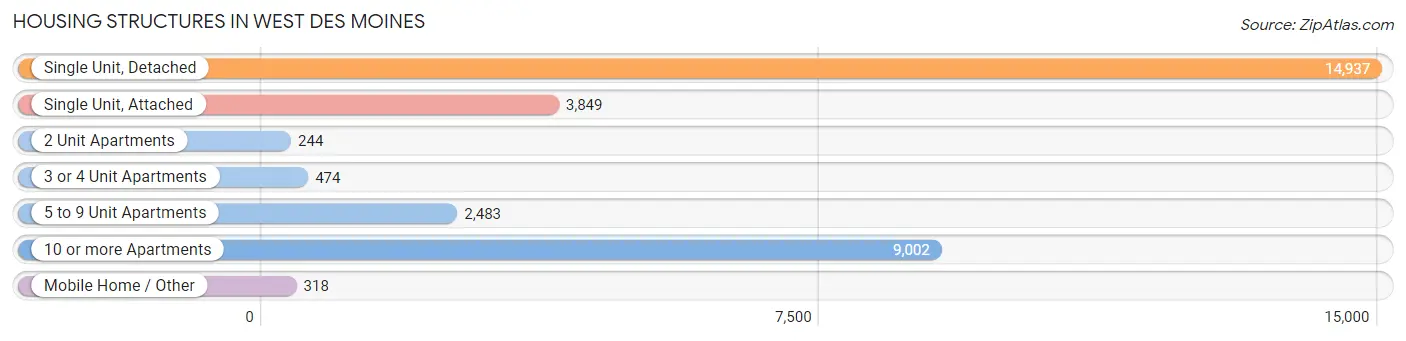
| Structure Type | # Housing Units | % Housing Units |
| Single Unit, Detached | 14,937 | 47.7% |
| Single Unit, Attached | 3,849 | 12.3% |
| 2 Unit Apartments | 244 | 0.8% |
| 3 or 4 Unit Apartments | 474 | 1.5% |
| 5 to 9 Unit Apartments | 2,483 | 7.9% |
| 10 or more Apartments | 9,002 | 28.7% |
| Mobile Home / Other | 318 | 1.0% |
| Total | 31,307 | 100.0% |
Housing Structures by Occupancy in West Des Moines
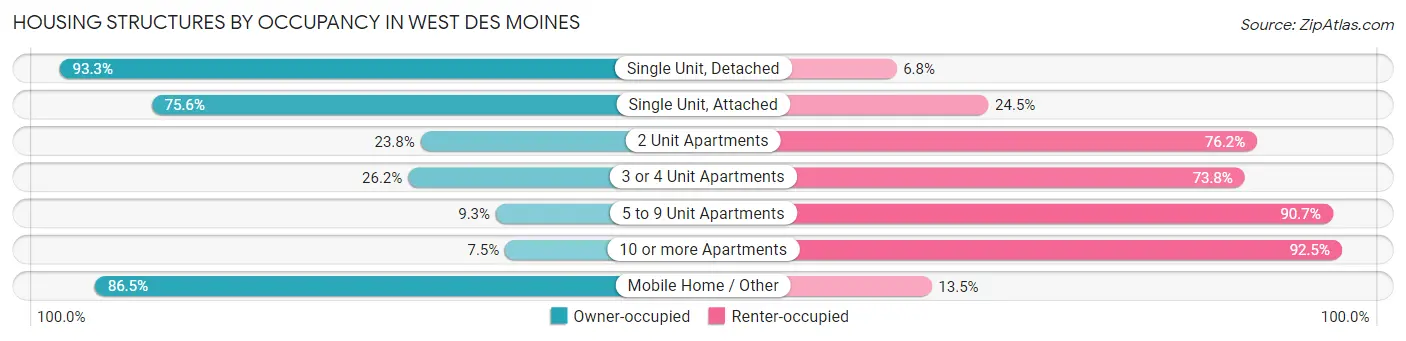
| Structure Type | Owner-occupied | Renter-occupied |
| Single Unit, Detached | 13,929 (93.2%) | 1,008 (6.8%) |
| Single Unit, Attached | 2,908 (75.5%) | 941 (24.4%) |
| 2 Unit Apartments | 58 (23.8%) | 186 (76.2%) |
| 3 or 4 Unit Apartments | 124 (26.2%) | 350 (73.8%) |
| 5 to 9 Unit Apartments | 230 (9.3%) | 2,253 (90.7%) |
| 10 or more Apartments | 673 (7.5%) | 8,329 (92.5%) |
| Mobile Home / Other | 275 (86.5%) | 43 (13.5%) |
| Total | 18,197 (58.1%) | 13,110 (41.9%) |
Housing Structures by Number of Rooms in West Des Moines
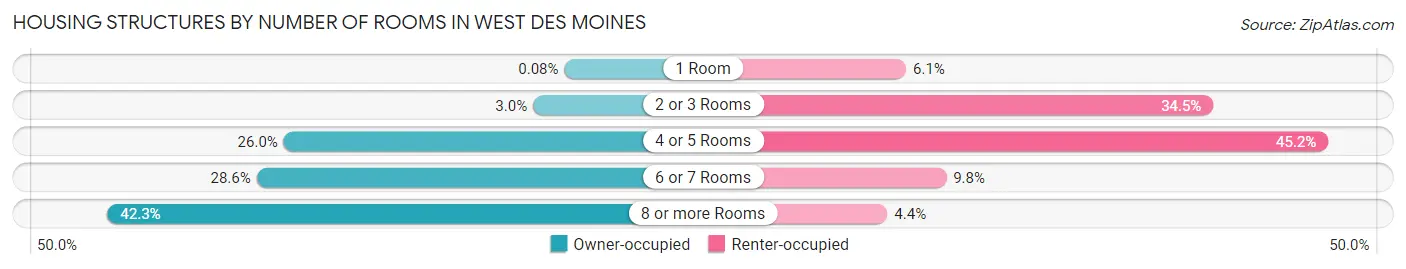
| Number of Rooms | Owner-occupied | Renter-occupied |
| 1 Room | 15 (0.1%) | 802 (6.1%) |
| 2 or 3 Rooms | 543 (3.0%) | 4,525 (34.5%) |
| 4 or 5 Rooms | 4,739 (26.0%) | 5,919 (45.2%) |
| 6 or 7 Rooms | 5,195 (28.5%) | 1,289 (9.8%) |
| 8 or more Rooms | 7,705 (42.3%) | 575 (4.4%) |
| Total | 18,197 (100.0%) | 13,110 (100.0%) |
Housing Structure by Heating Type in West Des Moines
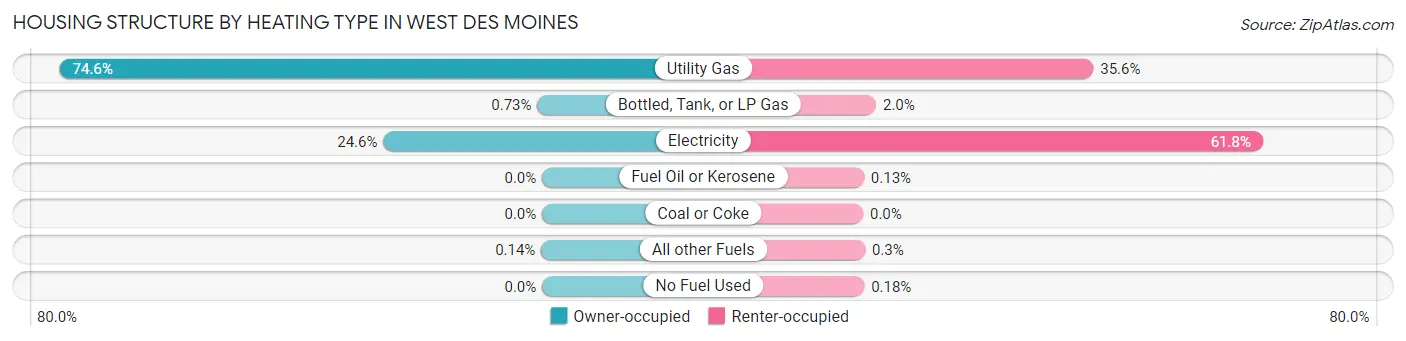
| Heating Type | Owner-occupied | Renter-occupied |
| Utility Gas | 13,572 (74.6%) | 4,667 (35.6%) |
| Bottled, Tank, or LP Gas | 133 (0.7%) | 263 (2.0%) |
| Electricity | 4,467 (24.5%) | 8,100 (61.8%) |
| Fuel Oil or Kerosene | 0 (0.0%) | 17 (0.1%) |
| Coal or Coke | 0 (0.0%) | 0 (0.0%) |
| All other Fuels | 25 (0.1%) | 39 (0.3%) |
| No Fuel Used | 0 (0.0%) | 24 (0.2%) |
| Total | 18,197 (100.0%) | 13,110 (100.0%) |
Household Vehicle Usage in West Des Moines
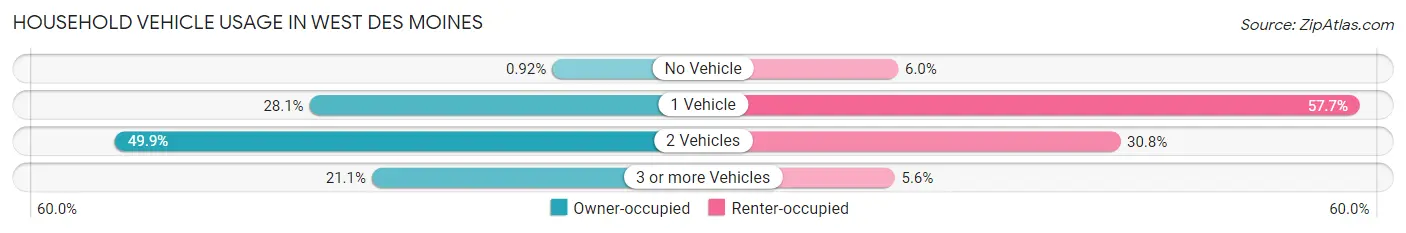
| Vehicles per Household | Owner-occupied | Renter-occupied |
| No Vehicle | 167 (0.9%) | 780 (5.9%) |
| 1 Vehicle | 5,112 (28.1%) | 7,560 (57.7%) |
| 2 Vehicles | 9,077 (49.9%) | 4,041 (30.8%) |
| 3 or more Vehicles | 3,841 (21.1%) | 729 (5.6%) |
| Total | 18,197 (100.0%) | 13,110 (100.0%) |
Real Estate & Mortgages in West Des Moines
Real Estate and Mortgage Overview in West Des Moines
| Characteristic | Without Mortgage | With Mortgage |
| Housing Units | 5,635 | 12,562 |
| Median Property Value | $268,300 | $265,900 |
| Median Household Income | $93,196 | $4,986 |
| Monthly Housing Costs | $722 | $1,247 |
| Real Estate Taxes | $4,455 | $243 |
Property Value by Mortgage Status in West Des Moines
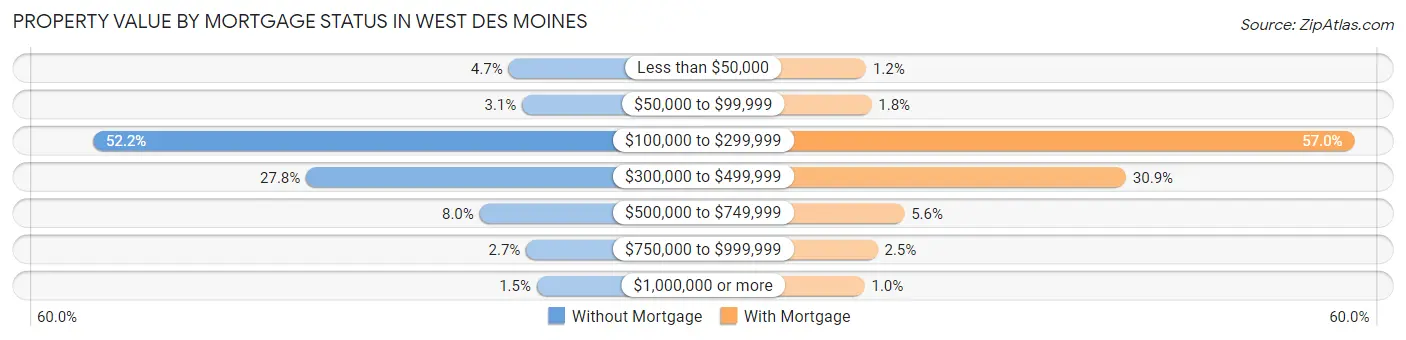
| Property Value | Without Mortgage | With Mortgage |
| Less than $50,000 | 265 (4.7%) | 149 (1.2%) |
| $50,000 to $99,999 | 177 (3.1%) | 227 (1.8%) |
| $100,000 to $299,999 | 2,941 (52.2%) | 7,161 (57.0%) |
| $300,000 to $499,999 | 1,568 (27.8%) | 3,882 (30.9%) |
| $500,000 to $749,999 | 451 (8.0%) | 698 (5.6%) |
| $750,000 to $999,999 | 151 (2.7%) | 315 (2.5%) |
| $1,000,000 or more | 82 (1.5%) | 130 (1.0%) |
| Total | 5,635 (100.0%) | 12,562 (100.0%) |
Household Income by Mortgage Status in West Des Moines
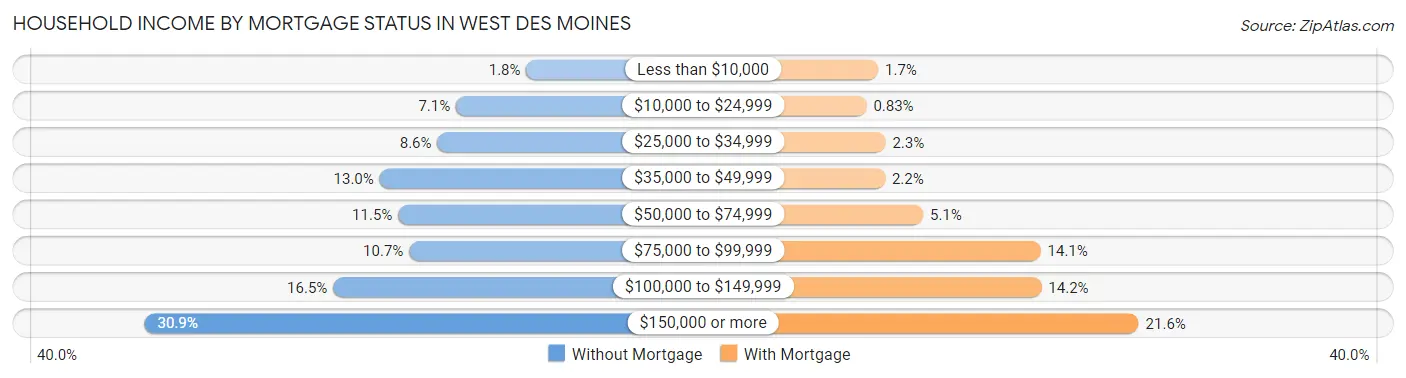
| Household Income | Without Mortgage | With Mortgage |
| Less than $10,000 | 100 (1.8%) | 216 (1.7%) |
| $10,000 to $24,999 | 402 (7.1%) | 104 (0.8%) |
| $25,000 to $34,999 | 482 (8.6%) | 286 (2.3%) |
| $35,000 to $49,999 | 730 (13.0%) | 281 (2.2%) |
| $50,000 to $74,999 | 650 (11.5%) | 646 (5.1%) |
| $75,000 to $99,999 | 603 (10.7%) | 1,771 (14.1%) |
| $100,000 to $149,999 | 929 (16.5%) | 1,779 (14.2%) |
| $150,000 or more | 1,739 (30.9%) | 2,709 (21.6%) |
| Total | 5,635 (100.0%) | 12,562 (100.0%) |
Property Value to Household Income Ratio in West Des Moines
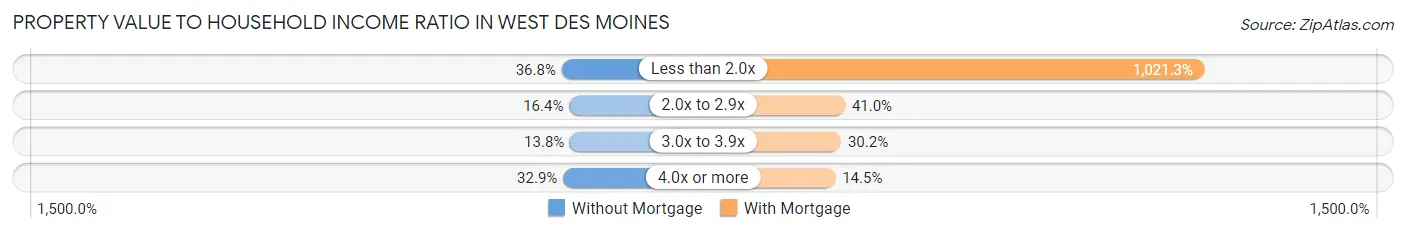
| Value-to-Income Ratio | Without Mortgage | With Mortgage |
| Less than 2.0x | 2,073 (36.8%) | 128,296 (1,021.3%) |
| 2.0x to 2.9x | 923 (16.4%) | 5,145 (41.0%) |
| 3.0x to 3.9x | 779 (13.8%) | 3,788 (30.1%) |
| 4.0x or more | 1,852 (32.9%) | 1,823 (14.5%) |
| Total | 5,635 (100.0%) | 12,562 (100.0%) |
Real Estate Taxes by Mortgage Status in West Des Moines
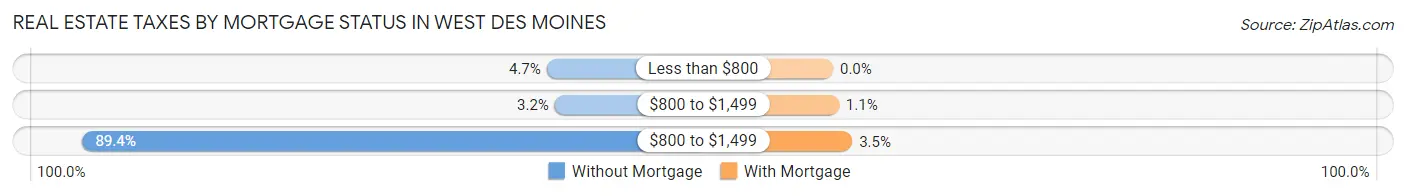
| Property Taxes | Without Mortgage | With Mortgage |
| Less than $800 | 262 (4.6%) | 0 (0.0%) |
| $800 to $1,499 | 179 (3.2%) | 134 (1.1%) |
| $800 to $1,499 | 5,039 (89.4%) | 440 (3.5%) |
| Total | 5,635 (100.0%) | 12,562 (100.0%) |
Health & Disability in West Des Moines
Health Insurance Coverage by Age in West Des Moines
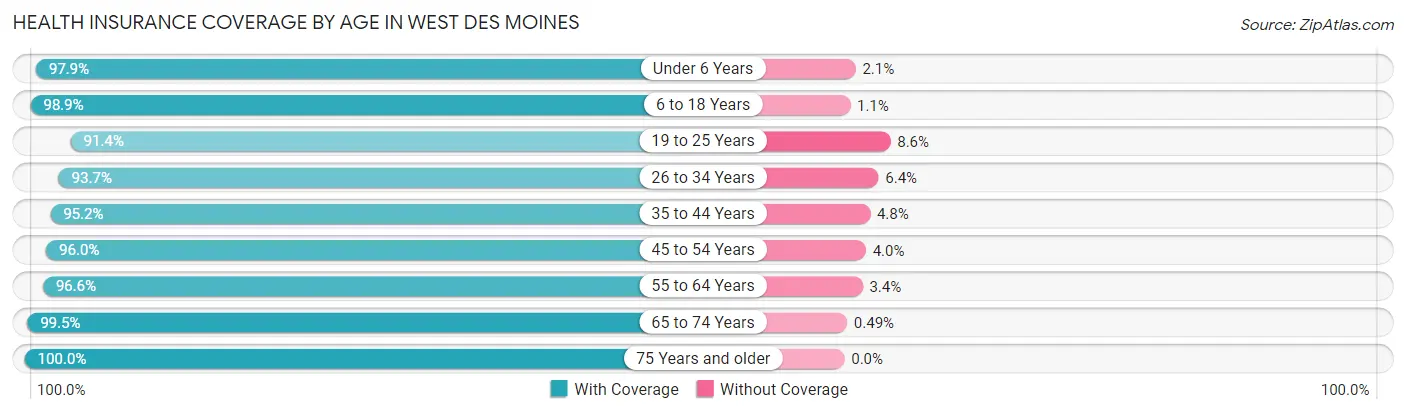
| Age Bracket | With Coverage | Without Coverage |
| Under 6 Years | 4,639 (97.9%) | 99 (2.1%) |
| 6 to 18 Years | 10,191 (98.9%) | 110 (1.1%) |
| 19 to 25 Years | 5,977 (91.4%) | 561 (8.6%) |
| 26 to 34 Years | 10,823 (93.6%) | 734 (6.4%) |
| 35 to 44 Years | 8,919 (95.2%) | 448 (4.8%) |
| 45 to 54 Years | 7,958 (96.0%) | 332 (4.0%) |
| 55 to 64 Years | 7,762 (96.6%) | 272 (3.4%) |
| 65 to 74 Years | 5,531 (99.5%) | 27 (0.5%) |
| 75 Years and older | 4,001 (100.0%) | 0 (0.0%) |
| Total | 65,801 (96.2%) | 2,583 (3.8%) |
Health Insurance Coverage by Citizenship Status in West Des Moines
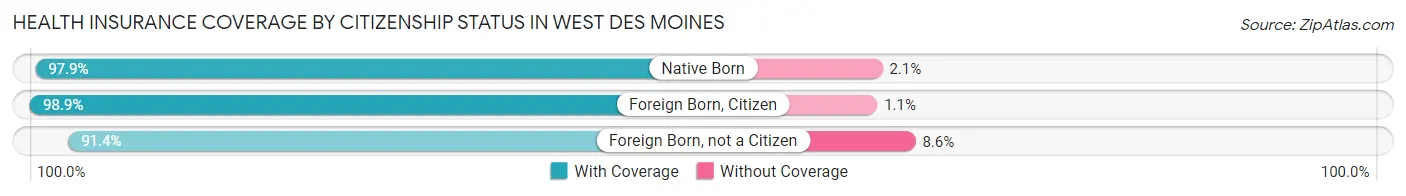
| Citizenship Status | With Coverage | Without Coverage |
| Native Born | 4,639 (97.9%) | 99 (2.1%) |
| Foreign Born, Citizen | 10,191 (98.9%) | 110 (1.1%) |
| Foreign Born, not a Citizen | 5,977 (91.4%) | 561 (8.6%) |
Health Insurance Coverage by Household Income in West Des Moines
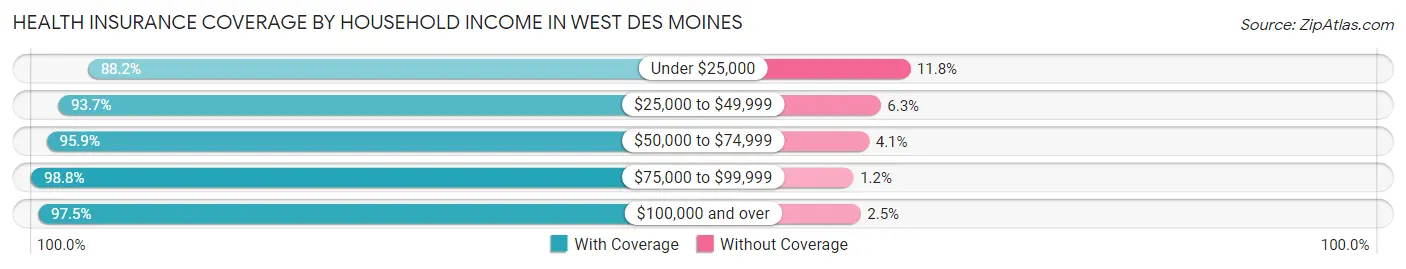
| Household Income | With Coverage | Without Coverage |
| Under $25,000 | 4,254 (88.2%) | 571 (11.8%) |
| $25,000 to $49,999 | 8,815 (93.7%) | 591 (6.3%) |
| $50,000 to $74,999 | 9,094 (95.9%) | 391 (4.1%) |
| $75,000 to $99,999 | 8,969 (98.8%) | 110 (1.2%) |
| $100,000 and over | 34,624 (97.5%) | 903 (2.5%) |
Public vs Private Health Insurance Coverage by Age in West Des Moines
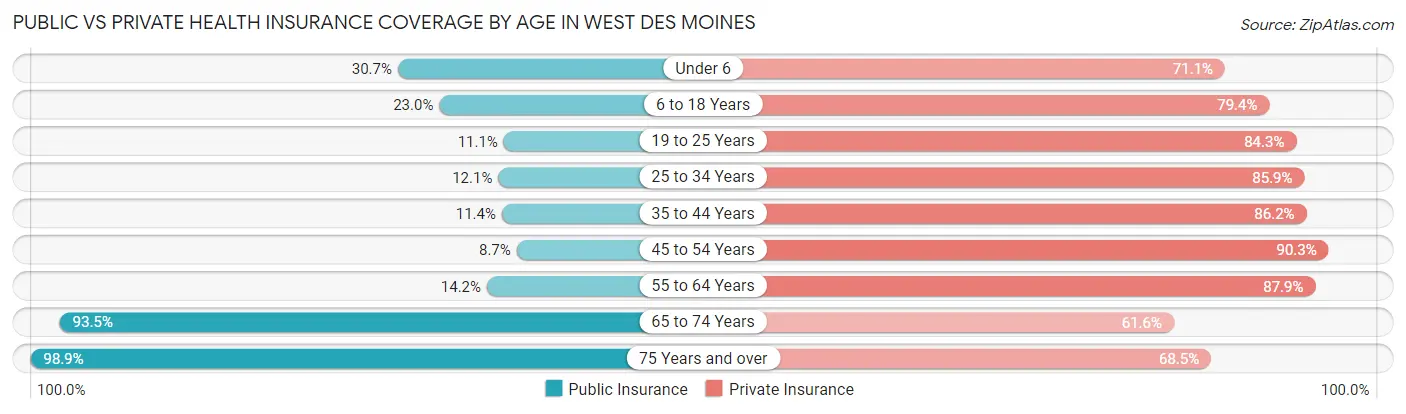
| Age Bracket | Public Insurance | Private Insurance |
| Under 6 | 1,456 (30.7%) | 3,369 (71.1%) |
| 6 to 18 Years | 2,373 (23.0%) | 8,174 (79.3%) |
| 19 to 25 Years | 724 (11.1%) | 5,514 (84.3%) |
| 25 to 34 Years | 1,397 (12.1%) | 9,922 (85.9%) |
| 35 to 44 Years | 1,070 (11.4%) | 8,077 (86.2%) |
| 45 to 54 Years | 719 (8.7%) | 7,489 (90.3%) |
| 55 to 64 Years | 1,141 (14.2%) | 7,060 (87.9%) |
| 65 to 74 Years | 5,196 (93.5%) | 3,425 (61.6%) |
| 75 Years and over | 3,958 (98.9%) | 2,742 (68.5%) |
| Total | 18,034 (26.4%) | 55,772 (81.6%) |
Disability Status by Sex by Age in West Des Moines
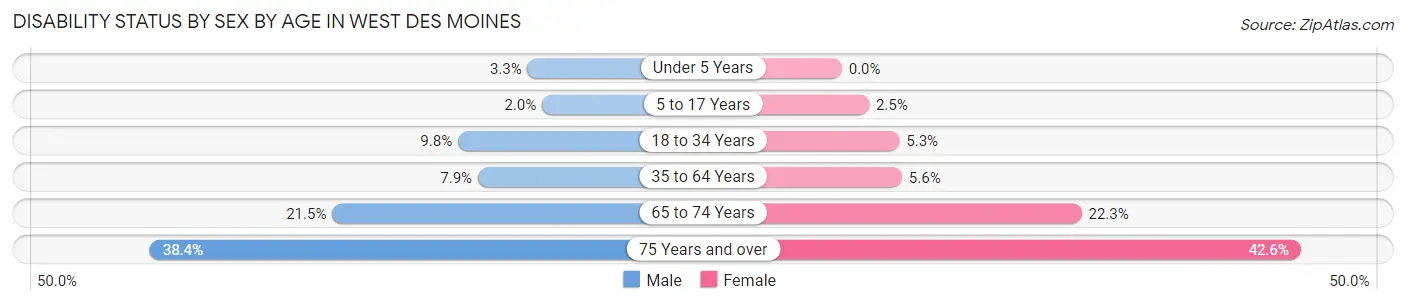
| Age Bracket | Male | Female |
| Under 5 Years | 69 (3.3%) | 0 (0.0%) |
| 5 to 17 Years | 106 (2.0%) | 130 (2.5%) |
| 18 to 34 Years | 925 (9.8%) | 489 (5.3%) |
| 35 to 64 Years | 1,044 (7.9%) | 699 (5.6%) |
| 65 to 74 Years | 549 (21.4%) | 667 (22.3%) |
| 75 Years and over | 601 (38.4%) | 1,037 (42.6%) |
Disability Class by Sex by Age in West Des Moines
Disability Class: Hearing Difficulty
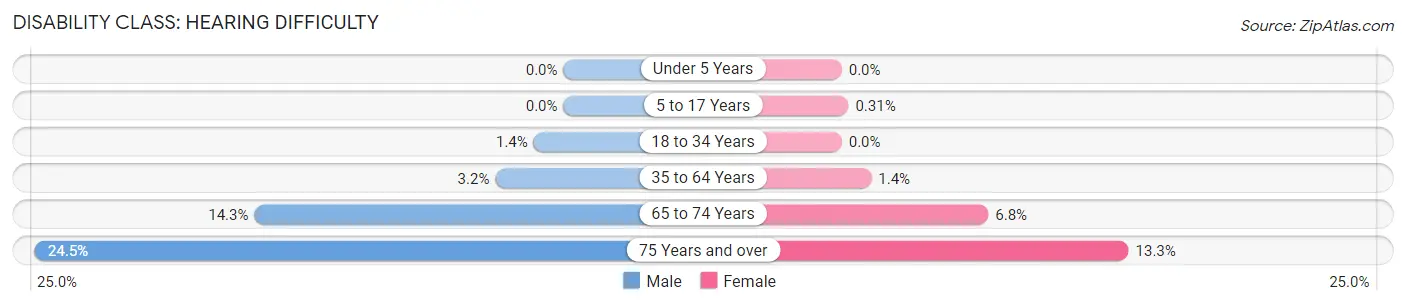
| Age Bracket | Male | Female |
| Under 5 Years | 0 (0.0%) | 0 (0.0%) |
| 5 to 17 Years | 0 (0.0%) | 16 (0.3%) |
| 18 to 34 Years | 130 (1.4%) | 0 (0.0%) |
| 35 to 64 Years | 416 (3.2%) | 171 (1.4%) |
| 65 to 74 Years | 367 (14.3%) | 204 (6.8%) |
| 75 Years and over | 384 (24.5%) | 324 (13.3%) |
Disability Class: Vision Difficulty
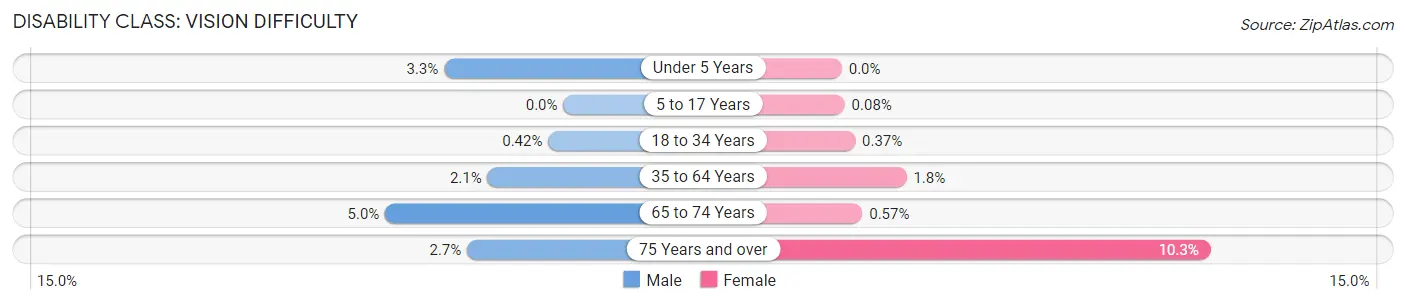
| Age Bracket | Male | Female |
| Under 5 Years | 69 (3.3%) | 0 (0.0%) |
| 5 to 17 Years | 0 (0.0%) | 4 (0.1%) |
| 18 to 34 Years | 40 (0.4%) | 34 (0.4%) |
| 35 to 64 Years | 278 (2.1%) | 225 (1.8%) |
| 65 to 74 Years | 127 (5.0%) | 17 (0.6%) |
| 75 Years and over | 42 (2.7%) | 250 (10.3%) |
Disability Class: Cognitive Difficulty
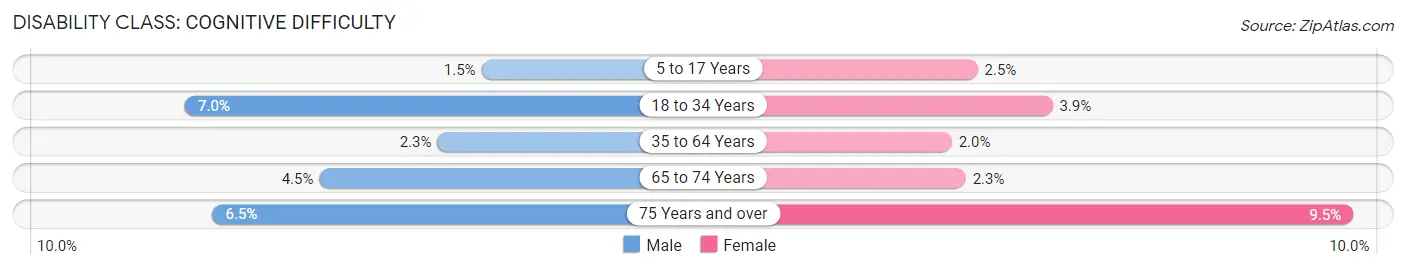
| Age Bracket | Male | Female |
| 5 to 17 Years | 82 (1.5%) | 130 (2.5%) |
| 18 to 34 Years | 664 (7.0%) | 358 (3.9%) |
| 35 to 64 Years | 308 (2.3%) | 255 (2.0%) |
| 65 to 74 Years | 116 (4.5%) | 69 (2.3%) |
| 75 Years and over | 102 (6.5%) | 231 (9.5%) |
Disability Class: Ambulatory Difficulty
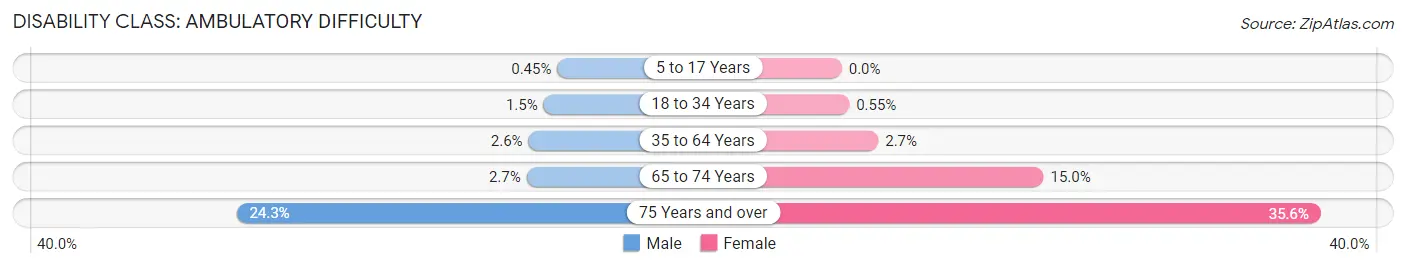
| Age Bracket | Male | Female |
| 5 to 17 Years | 24 (0.4%) | 0 (0.0%) |
| 18 to 34 Years | 139 (1.5%) | 50 (0.5%) |
| 35 to 64 Years | 341 (2.6%) | 339 (2.7%) |
| 65 to 74 Years | 70 (2.7%) | 449 (15.0%) |
| 75 Years and over | 380 (24.3%) | 866 (35.6%) |
Disability Class: Self-Care Difficulty
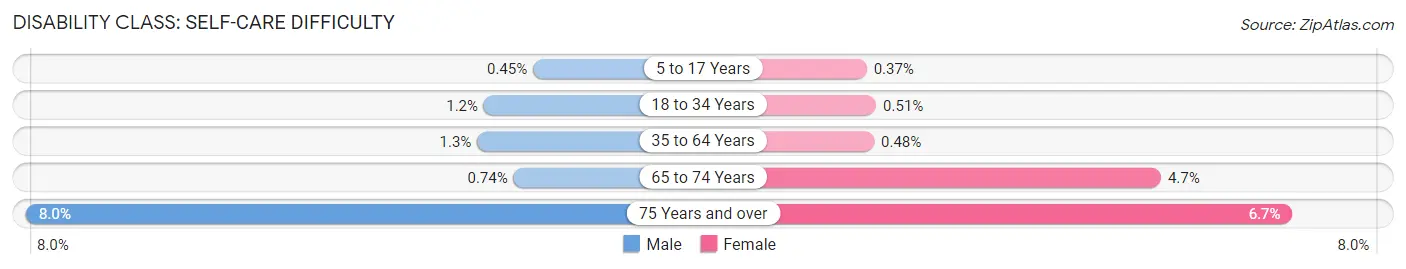
| Age Bracket | Male | Female |
| 5 to 17 Years | 24 (0.4%) | 19 (0.4%) |
| 18 to 34 Years | 112 (1.2%) | 47 (0.5%) |
| 35 to 64 Years | 169 (1.3%) | 60 (0.5%) |
| 65 to 74 Years | 19 (0.7%) | 142 (4.7%) |
| 75 Years and over | 125 (8.0%) | 163 (6.7%) |
Technology Access in West Des Moines
Computing Device Access in West Des Moines
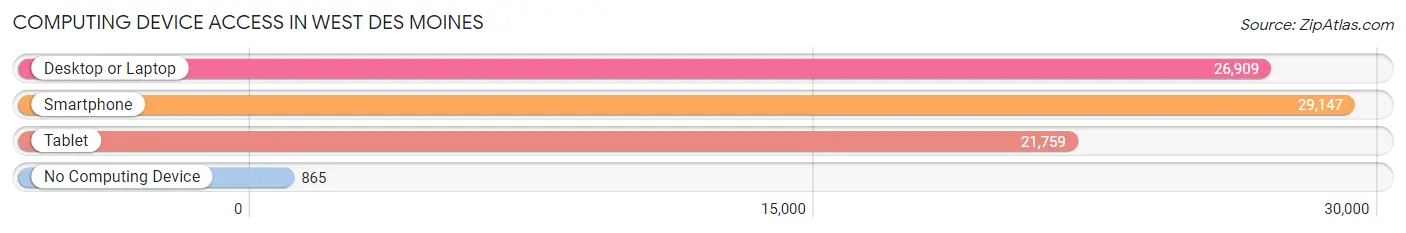
| Device Type | # Households | % Households |
| Desktop or Laptop | 26,909 | 86.0% |
| Smartphone | 29,147 | 93.1% |
| Tablet | 21,759 | 69.5% |
| No Computing Device | 865 | 2.8% |
| Total | 31,307 | 100.0% |
Internet Access in West Des Moines
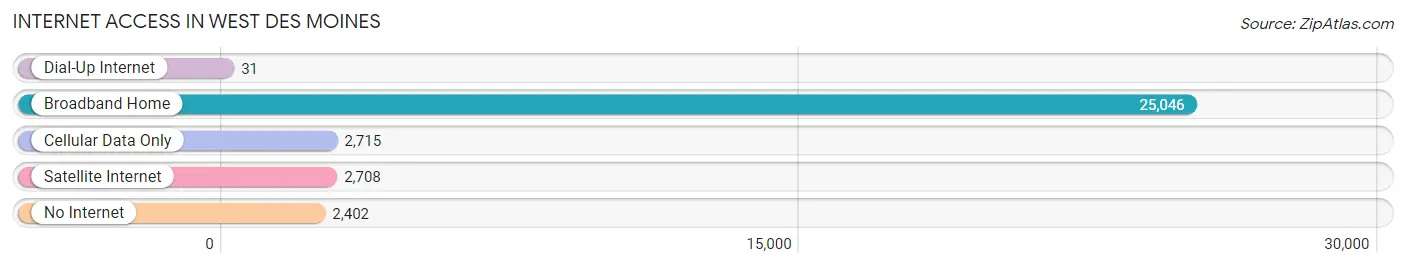
| Internet Type | # Households | % Households |
| Dial-Up Internet | 31 | 0.1% |
| Broadband Home | 25,046 | 80.0% |
| Cellular Data Only | 2,715 | 8.7% |
| Satellite Internet | 2,708 | 8.6% |
| No Internet | 2,402 | 7.7% |
| Total | 31,307 | 100.0% |
West Des Moines Summary
West Des Moines, Iowa is a city located in the state of Iowa in the United States. It is the second largest city in the state and is located in the Des Moines metropolitan area. The city is located in the western part of the state, just west of the Des Moines River. The city has a population of approximately 60,000 people and is the tenth largest city in the state.
Geography
West Des Moines is located in the western part of the state of Iowa, just west of the Des Moines River. The city is located in the Des Moines metropolitan area and is bordered by the cities of Clive, Urbandale, and Windsor Heights. The city is located in the Des Moines-West Des Moines Metropolitan Statistical Area, which is part of the larger Des Moines-Ames-West Des Moines Combined Statistical Area. The city is located in the Central Time Zone and has a total area of 28.3 square miles.
History
West Des Moines was founded in 1845 by settlers from the east. The city was originally known as Valley Junction and was a small farming community. In the late 19th century, the city began to grow and develop as a railroad hub. The city was officially incorporated in 1893 and was renamed West Des Moines in 1902. The city continued to grow and develop throughout the 20th century and is now a major commercial and residential center in the state.
Economy
West Des Moines is a major economic center in the state of Iowa. The city is home to a number of major employers, including Wells Fargo, Hy-Vee, and Principal Financial Group. The city is also home to a number of retail and entertainment venues, including Jordan Creek Town Center and Valley West Mall. The city is also home to a number of corporate headquarters, including the headquarters of the Principal Financial Group and the headquarters of the Meredith Corporation.
Demographics
West Des Moines has a population of approximately 60,000 people. The city has a median household income of $68,000 and a median home value of $220,000. The city is predominantly white, with a population that is 79.3% white, 8.2% Hispanic or Latino, 5.3% African American, and 4.2% Asian. The city also has a large population of foreign-born residents, with a population that is 8.3% foreign-born. The city also has a large population of college-educated residents, with a population that is 44.3% college-educated.
Conclusion
West Des Moines, Iowa is a major city in the state of Iowa. The city is located in the western part of the state, just west of the Des Moines River. The city has a population of approximately 60,000 people and is the tenth largest city in the state. The city is a major economic center in the state and is home to a number of major employers, including Wells Fargo, Hy-Vee, and Principal Financial Group. The city is predominantly white, with a population that is 79.3% white, 8.2% Hispanic or Latino, 5.3% African American, and 4.2% Asian. The city also has a large population of foreign-born residents, with a population that is 8.3% foreign-born. The city also has a large population of college-educated residents, with a population that is 44.3% college-educated.
Common Questions
What is Per Capita Income in West Des Moines?
Per Capita income in West Des Moines is $53,803.
What is the Median Family Income in West Des Moines?
Median Family Income in West Des Moines is $114,800.
What is the Median Household income in West Des Moines?
Median Household Income in West Des Moines is $82,345.
What is Income or Wage Gap in West Des Moines?
Income or Wage Gap in West Des Moines is 28.8%.
Women in West Des Moines earn 71.2 cents for every dollar earned by a man.
What is Family Income Deficit in West Des Moines?
Family Income Deficit in West Des Moines is $10,752.
Families that are below poverty line in West Des Moines earn $10,752 less on average than the poverty threshold level.
What is Inequality or Gini Index in West Des Moines?
Inequality or Gini Index in West Des Moines is 0.46.
What is the Total Population of West Des Moines?
Total Population of West Des Moines is 68,744.
What is the Total Male Population of West Des Moines?
Total Male Population of West Des Moines is 34,404.
What is the Total Female Population of West Des Moines?
Total Female Population of West Des Moines is 34,340.
What is the Ratio of Males per 100 Females in West Des Moines?
There are 100.19 Males per 100 Females in West Des Moines.
What is the Ratio of Females per 100 Males in West Des Moines?
There are 99.81 Females per 100 Males in West Des Moines.
What is the Median Population Age in West Des Moines?
Median Population Age in West Des Moines is 36.2 Years.
What is the Average Family Size in West Des Moines
Average Family Size in West Des Moines is 3.0 People.
What is the Average Household Size in West Des Moines
Average Household Size in West Des Moines is 2.2 People.
How Large is the Labor Force in West Des Moines?
There are 41,408 People in the Labor Forcein in West Des Moines.
What is the Percentage of People in the Labor Force in West Des Moines?
74.1% of People are in the Labor Force in West Des Moines.
What is the Unemployment Rate in West Des Moines?
Unemployment Rate in West Des Moines is 2.8%.