Story County, IA Map & Demographics
Story County Map
Story County Overview
$35,704
PER CAPITA INCOME
$109,432
AVG FAMILY INCOME
$66,197
AVG HOUSEHOLD INCOME
26.6%
WAGE / INCOME GAP [ % ]
73.4¢/ $1
WAGE / INCOME GAP [ $ ]
$9,423
FAMILY INCOME DEFICIT
0.48
INEQUALITY / GINI INDEX
98,573
TOTAL POPULATION
51,726
MALE POPULATION
46,847
FEMALE POPULATION
110.41
MALES / 100 FEMALES
90.57
FEMALES / 100 MALES
26.5
MEDIAN AGE
2.9
AVG FAMILY SIZE
2.2
AVG HOUSEHOLD SIZE
56,440
LABOR FORCE [ PEOPLE ]
66.7%
PERCENT IN LABOR FORCE
5.6%
UNEMPLOYMENT RATE
Income in Story County
Income Overview in Story County
Per Capita Income in Story County is $35,704, while median incomes of families and households are $109,432 and $66,197 respectively.
| Characteristic | Number | Measure |
| Per Capita Income | 98,573 | $35,704 |
| Median Family Income | 18,783 | $109,432 |
| Mean Family Income | 18,783 | $131,451 |
| Median Household Income | 38,412 | $66,197 |
| Mean Household Income | 38,412 | $89,244 |
| Income Deficit | 18,783 | $9,423 |
| Wage / Income Gap (%) | 98,573 | 26.63% |
| Wage / Income Gap ($) | 98,573 | 73.37¢ per $1 |
| Gini / Inequality Index | 98,573 | 0.48 |
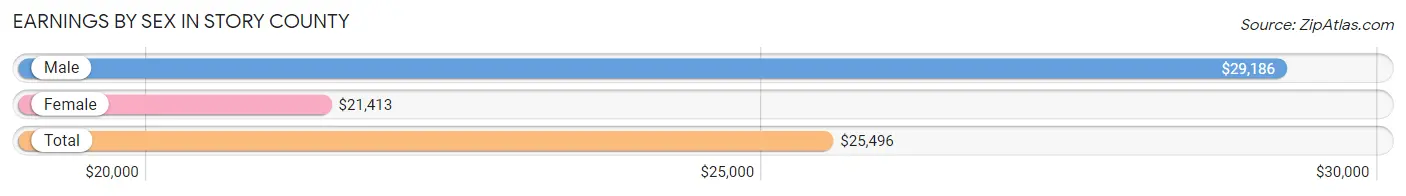
Earnings by Sex in Story County
Average Earnings in Story County are $25,496, $29,186 for men and $21,413 for women, a difference of 26.6%.
| Sex | Number | Average Earnings |
| Male | 36,416 (55.0%) | $29,186 |
| Female | 29,841 (45.0%) | $21,413 |
| Total | 66,257 (100.0%) | $25,496 |
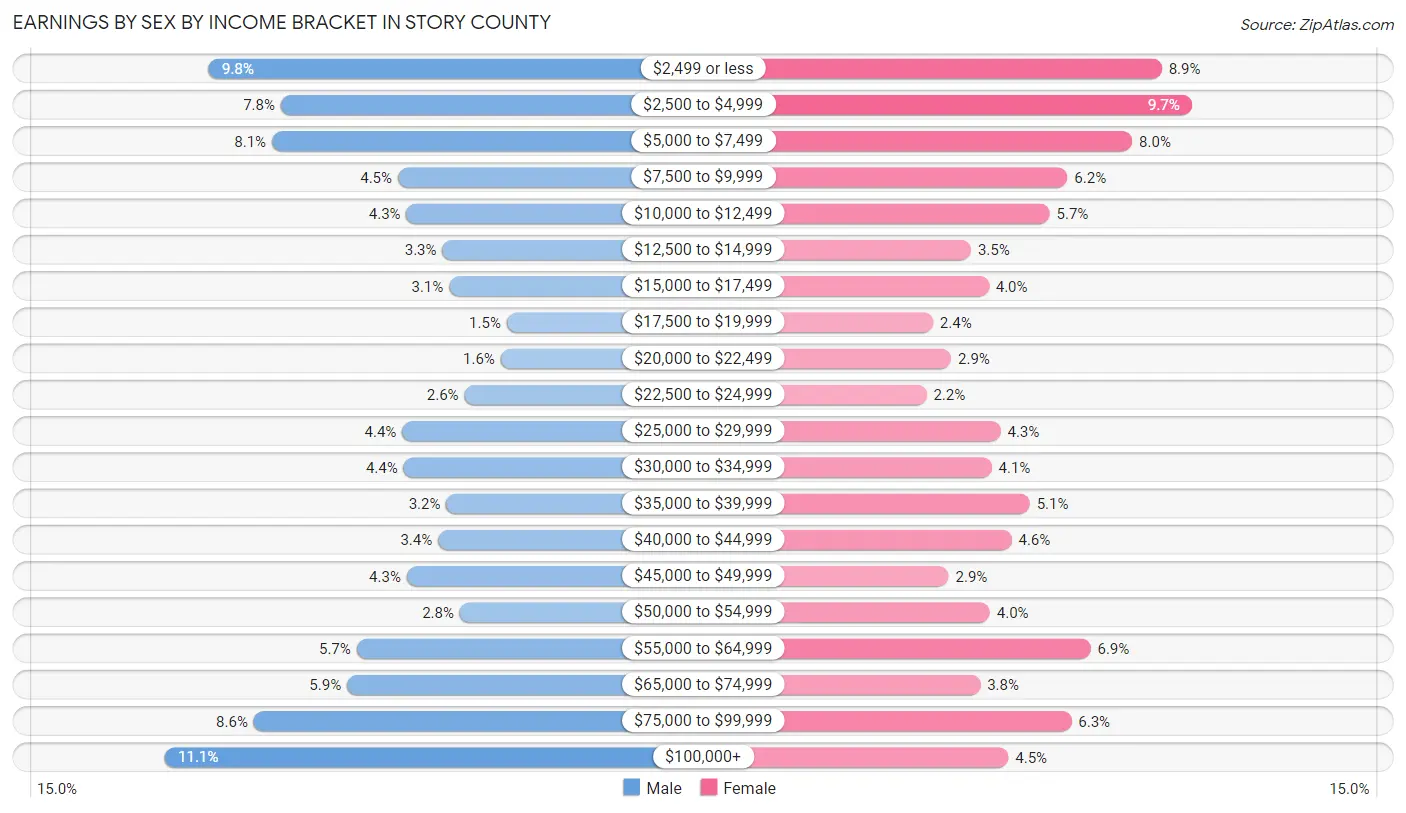
Earnings by Sex by Income Bracket in Story County
The most common earnings brackets in Story County are $100,000+ for men (4,024 | 11.1%) and $2,500 to $4,999 for women (2,891 | 9.7%).
| Income | Male | Female |
| $2,499 or less | 3,575 (9.8%) | 2,642 (8.8%) |
| $2,500 to $4,999 | 2,842 (7.8%) | 2,891 (9.7%) |
| $5,000 to $7,499 | 2,932 (8.1%) | 2,392 (8.0%) |
| $7,500 to $9,999 | 1,643 (4.5%) | 1,849 (6.2%) |
| $10,000 to $12,499 | 1,555 (4.3%) | 1,700 (5.7%) |
| $12,500 to $14,999 | 1,186 (3.3%) | 1,040 (3.5%) |
| $15,000 to $17,499 | 1,117 (3.1%) | 1,191 (4.0%) |
| $17,500 to $19,999 | 527 (1.5%) | 722 (2.4%) |
| $20,000 to $22,499 | 589 (1.6%) | 873 (2.9%) |
| $22,500 to $24,999 | 961 (2.6%) | 668 (2.2%) |
| $25,000 to $29,999 | 1,600 (4.4%) | 1,288 (4.3%) |
| $30,000 to $34,999 | 1,583 (4.3%) | 1,214 (4.1%) |
| $35,000 to $39,999 | 1,146 (3.2%) | 1,535 (5.1%) |
| $40,000 to $44,999 | 1,232 (3.4%) | 1,382 (4.6%) |
| $45,000 to $49,999 | 1,552 (4.3%) | 853 (2.9%) |
| $50,000 to $54,999 | 1,009 (2.8%) | 1,200 (4.0%) |
| $55,000 to $64,999 | 2,064 (5.7%) | 2,044 (6.9%) |
| $65,000 to $74,999 | 2,162 (5.9%) | 1,118 (3.7%) |
| $75,000 to $99,999 | 3,117 (8.6%) | 1,883 (6.3%) |
| $100,000+ | 4,024 (11.1%) | 1,356 (4.5%) |
| Total | 36,416 (100.0%) | 29,841 (100.0%) |
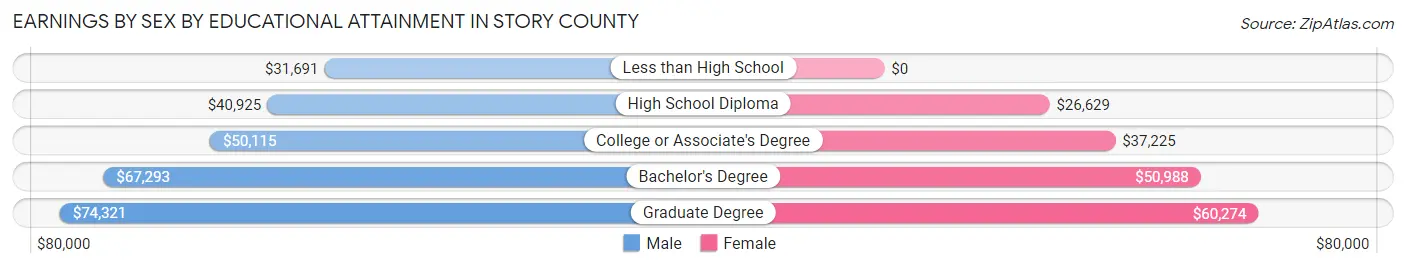
Earnings by Sex by Educational Attainment in Story County
Average earnings in Story County are $57,672 for men and $43,487 for women, a difference of 24.6%. Men with an educational attainment of graduate degree enjoy the highest average annual earnings of $74,321, while those with less than high school education earn the least with $31,691. Women with an educational attainment of graduate degree earn the most with the average annual earnings of $60,274, while those with high school diploma education have the smallest earnings of $26,629.
| Educational Attainment | Male Income | Female Income |
| Less than High School | $31,691 | $0 |
| High School Diploma | $40,925 | $26,629 |
| College or Associate's Degree | $50,115 | $37,225 |
| Bachelor's Degree | $67,293 | $50,988 |
| Graduate Degree | $74,321 | $60,274 |
| Total | $57,672 | $43,487 |
Family Income in Story County
Family Income Brackets in Story County
According to the Story County family income data, there are 4,771 families falling into the $100,000 to $149,999 income range, which is the most common income bracket and makes up 25.4% of all families. Conversely, the $10,000 to $14,999 income bracket is the least frequent group with only 319 families (1.7%) belonging to this category.
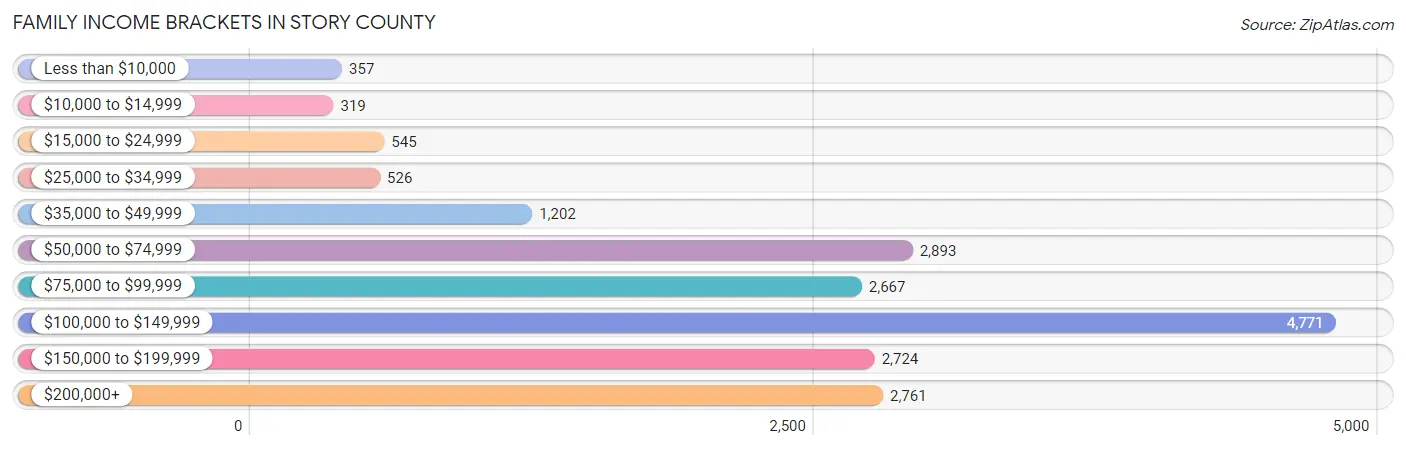
| Income Bracket | # Families | % Families |
| Less than $10,000 | 357 | 1.9% |
| $10,000 to $14,999 | 319 | 1.7% |
| $15,000 to $24,999 | 545 | 2.9% |
| $25,000 to $34,999 | 526 | 2.8% |
| $35,000 to $49,999 | 1,202 | 6.4% |
| $50,000 to $74,999 | 2,893 | 15.4% |
| $75,000 to $99,999 | 2,667 | 14.2% |
| $100,000 to $149,999 | 4,771 | 25.4% |
| $150,000 to $199,999 | 2,724 | 14.5% |
| $200,000+ | 2,761 | 14.7% |
Family Income by Famaliy Size in Story County
4-person families (3,217 | 17.1%) account for the highest median family income in Story County with $141,179 per family, while 2-person families (9,998 | 53.2%) have the highest median income of $47,967 per family member.
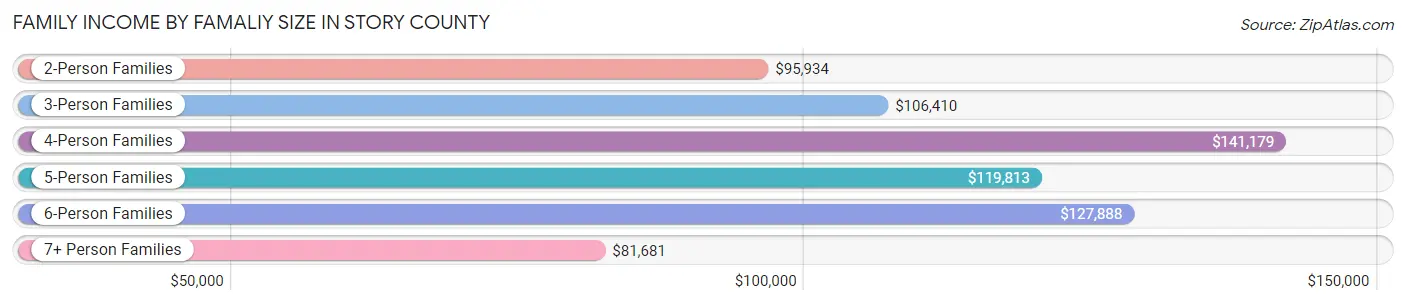
| Income Bracket | # Families | Median Income |
| 2-Person Families | 9,998 (53.2%) | $95,934 |
| 3-Person Families | 3,628 (19.3%) | $106,410 |
| 4-Person Families | 3,217 (17.1%) | $141,179 |
| 5-Person Families | 1,368 (7.3%) | $119,813 |
| 6-Person Families | 461 (2.5%) | $127,888 |
| 7+ Person Families | 111 (0.6%) | $81,681 |
| Total | 18,783 (100.0%) | $109,432 |
Family Income by Number of Earners in Story County
The median family income in Story County is $109,432, with families comprising 3+ earners (1,841) having the highest median family income of $160,604, while families with no earners (2,593) have the lowest median family income of $69,933, accounting for 9.8% and 13.8% of families, respectively.
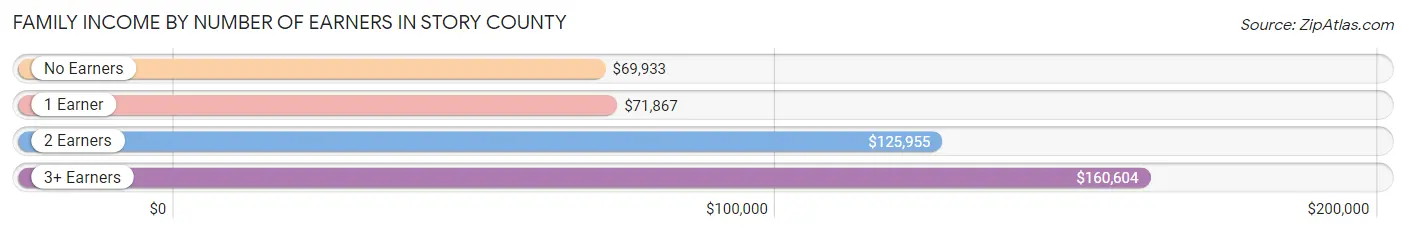
| Number of Earners | # Families | Median Income |
| No Earners | 2,593 (13.8%) | $69,933 |
| 1 Earner | 4,724 (25.2%) | $71,867 |
| 2 Earners | 9,625 (51.2%) | $125,955 |
| 3+ Earners | 1,841 (9.8%) | $160,604 |
| Total | 18,783 (100.0%) | $109,432 |
Household Income in Story County
Household Income Brackets in Story County
With 7,068 households falling in the category, the $50,000 to $74,999 income range is the most frequent in Story County, accounting for 18.4% of all households. In contrast, only 1,844 households (4.8%) fall into the $10,000 to $14,999 income bracket, making it the least populous group.
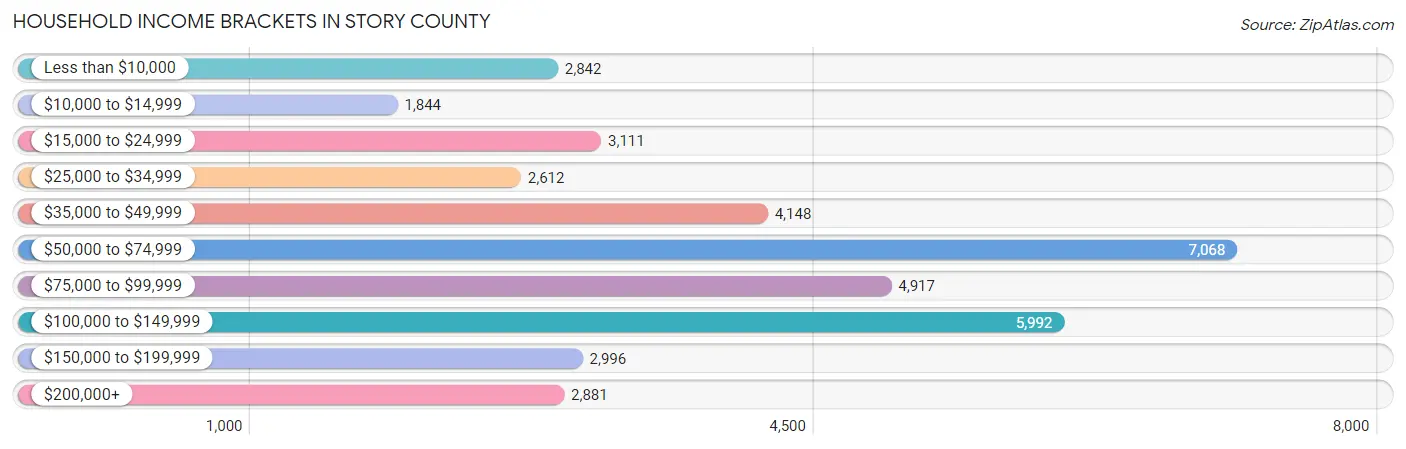
| Income Bracket | # Households | % Households |
| Less than $10,000 | 2,842 | 7.4% |
| $10,000 to $14,999 | 1,844 | 4.8% |
| $15,000 to $24,999 | 3,111 | 8.1% |
| $25,000 to $34,999 | 2,612 | 6.8% |
| $35,000 to $49,999 | 4,148 | 10.8% |
| $50,000 to $74,999 | 7,068 | 18.4% |
| $75,000 to $99,999 | 4,917 | 12.8% |
| $100,000 to $149,999 | 5,992 | 15.6% |
| $150,000 to $199,999 | 2,996 | 7.8% |
| $200,000+ | 2,881 | 7.5% |
Household Income by Householder Age in Story County
The median household income in Story County is $66,197, with the highest median household income of $99,588 found in the 45 to 64 years age bracket for the primary householder. A total of 10,026 households (26.1%) fall into this category. Meanwhile, the 15 to 24 years age bracket for the primary householder has the lowest median household income of $27,450, with 7,647 households (19.9%) in this group.
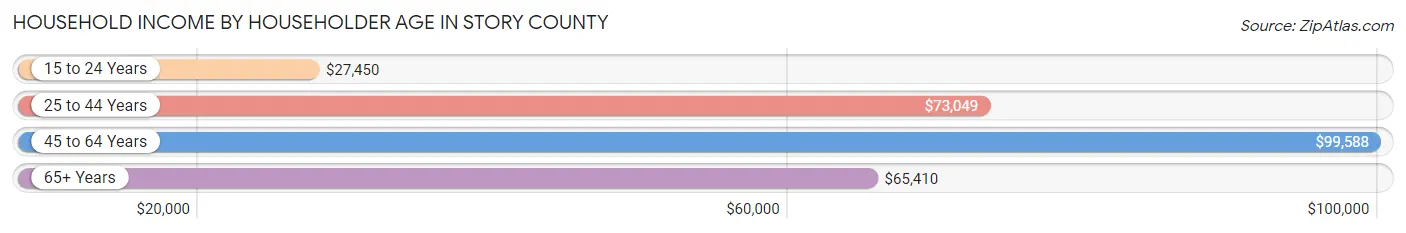
| Income Bracket | # Households | Median Income |
| 15 to 24 Years | 7,647 (19.9%) | $27,450 |
| 25 to 44 Years | 12,690 (33.0%) | $73,049 |
| 45 to 64 Years | 10,026 (26.1%) | $99,588 |
| 65+ Years | 8,049 (20.9%) | $65,410 |
| Total | 38,412 (100.0%) | $66,197 |
Poverty in Story County
Income Below Poverty by Sex and Age in Story County
With 20.6% poverty level for males and 18.5% for females among the residents of Story County, 18 to 24 year old males and 18 to 24 year old females are the most vulnerable to poverty, with 6,715 males (60.6%) and 4,919 females (56.7%) in their respective age groups living below the poverty level.
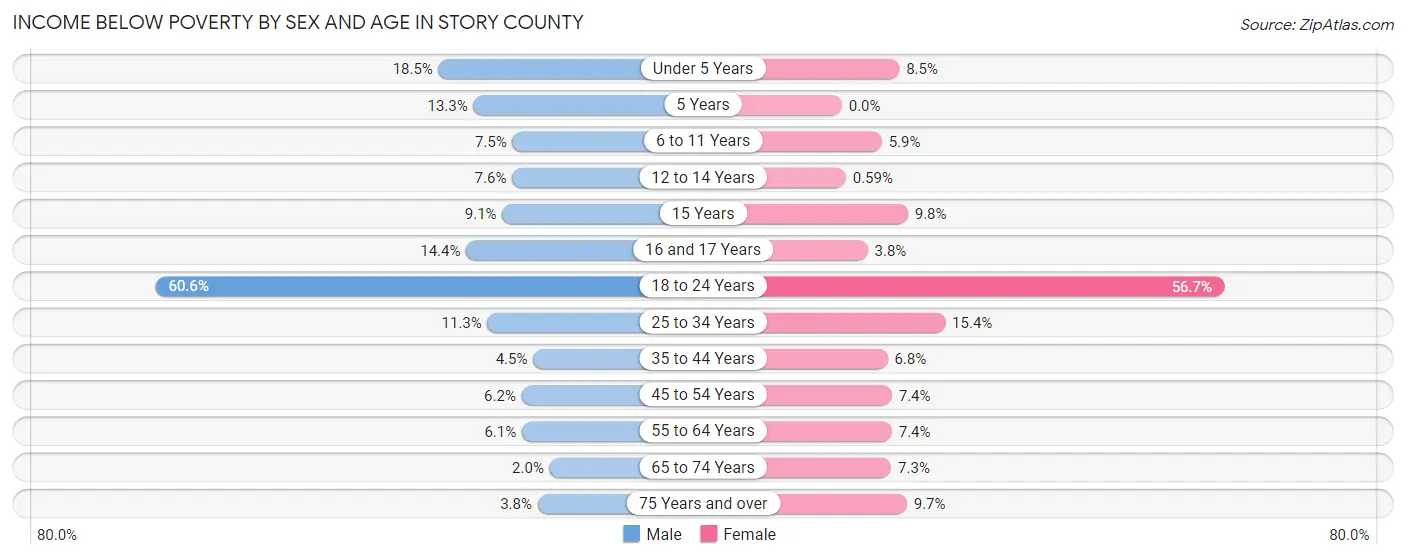
| Age Bracket | Male | Female |
| Under 5 Years | 374 (18.5%) | 175 (8.5%) |
| 5 Years | 66 (13.3%) | 0 (0.0%) |
| 6 to 11 Years | 199 (7.5%) | 163 (5.9%) |
| 12 to 14 Years | 108 (7.6%) | 6 (0.6%) |
| 15 Years | 39 (9.0%) | 34 (9.8%) |
| 16 and 17 Years | 129 (14.4%) | 34 (3.8%) |
| 18 to 24 Years | 6,715 (60.6%) | 4,919 (56.7%) |
| 25 to 34 Years | 784 (11.3%) | 821 (15.3%) |
| 35 to 44 Years | 232 (4.5%) | 315 (6.8%) |
| 45 to 54 Years | 253 (6.2%) | 287 (7.4%) |
| 55 to 64 Years | 272 (6.1%) | 332 (7.4%) |
| 65 to 74 Years | 70 (2.0%) | 272 (7.3%) |
| 75 Years and over | 78 (3.8%) | 276 (9.7%) |
| Total | 9,319 (20.6%) | 7,634 (18.5%) |
Income Above Poverty by Sex and Age in Story County
According to the poverty statistics in Story County, males aged 65 to 74 years and females aged 5 years are the age groups that are most secure financially, with 98.0% of males and 100.0% of females in these age groups living above the poverty line.
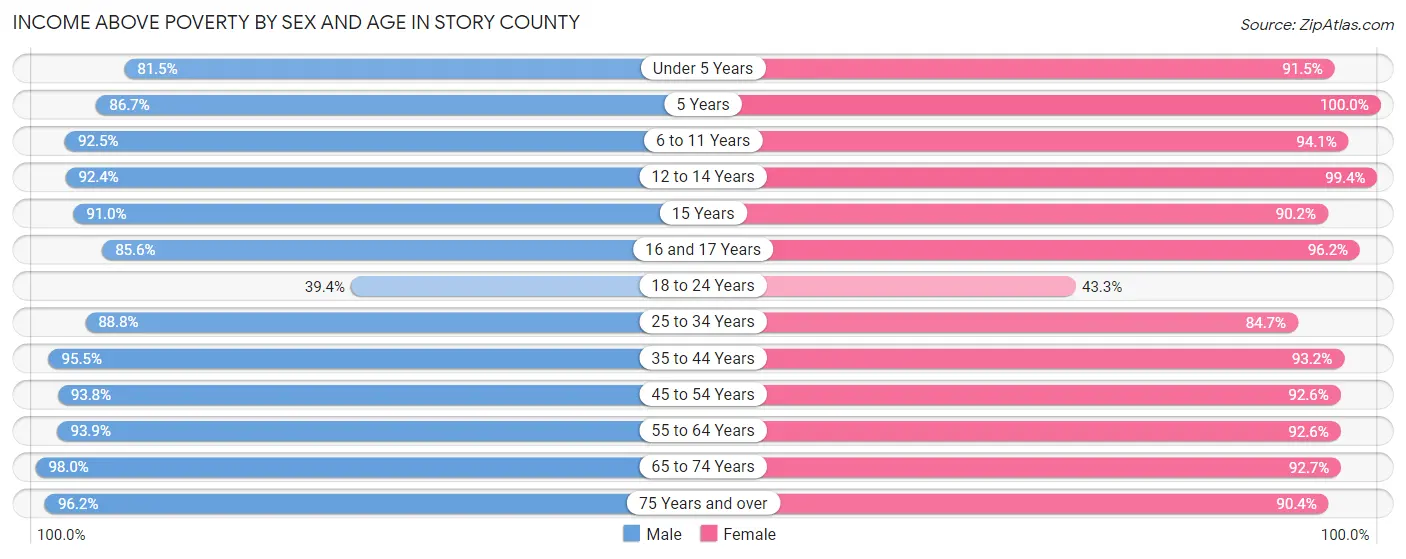
| Age Bracket | Male | Female |
| Under 5 Years | 1,646 (81.5%) | 1,876 (91.5%) |
| 5 Years | 429 (86.7%) | 535 (100.0%) |
| 6 to 11 Years | 2,444 (92.5%) | 2,584 (94.1%) |
| 12 to 14 Years | 1,315 (92.4%) | 1,014 (99.4%) |
| 15 Years | 392 (90.9%) | 313 (90.2%) |
| 16 and 17 Years | 766 (85.6%) | 854 (96.2%) |
| 18 to 24 Years | 4,374 (39.4%) | 3,755 (43.3%) |
| 25 to 34 Years | 6,183 (88.7%) | 4,529 (84.7%) |
| 35 to 44 Years | 4,970 (95.5%) | 4,322 (93.2%) |
| 45 to 54 Years | 3,843 (93.8%) | 3,581 (92.6%) |
| 55 to 64 Years | 4,162 (93.9%) | 4,143 (92.6%) |
| 65 to 74 Years | 3,395 (98.0%) | 3,439 (92.7%) |
| 75 Years and over | 1,982 (96.2%) | 2,584 (90.3%) |
| Total | 35,901 (79.4%) | 33,529 (81.5%) |
Income Below Poverty Among Married-Couple Families in Story County
The poverty statistics for married-couple families in Story County show that 2.1% or 325 of the total 15,548 families live below the poverty line. Families with 5 or more children have the highest poverty rate of 6.3%, comprising of 6 families. On the other hand, families with 3 or 4 children have the lowest poverty rate of 1.8%, which includes 25 families.
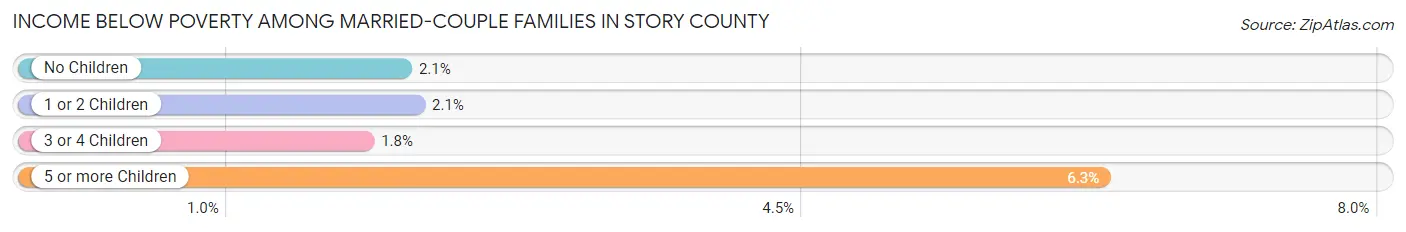
| Children | Above Poverty | Below Poverty |
| No Children | 8,988 (97.9%) | 189 (2.1%) |
| 1 or 2 Children | 4,807 (97.9%) | 105 (2.1%) |
| 3 or 4 Children | 1,339 (98.2%) | 25 (1.8%) |
| 5 or more Children | 89 (93.7%) | 6 (6.3%) |
| Total | 15,223 (97.9%) | 325 (2.1%) |
Income Below Poverty Among Single-Parent Households in Story County
According to the poverty data in Story County, 13.2% or 140 single-father households and 29.3% or 637 single-mother households are living below the poverty line. Among single-father households, those with 3 or 4 children have the highest poverty rate, with 3 households (25.0%) experiencing poverty. Likewise, among single-mother households, those with 3 or 4 children have the highest poverty rate, with 79 households (58.1%) falling below the poverty line.
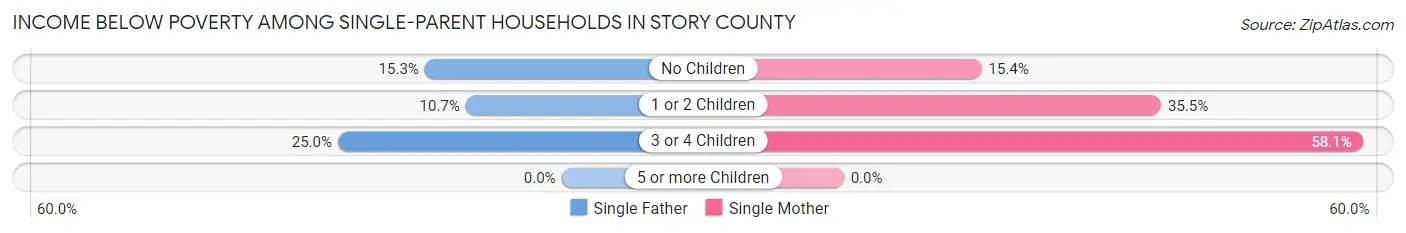
| Children | Single Father | Single Mother |
| No Children | 83 (15.3%) | 127 (15.4%) |
| 1 or 2 Children | 54 (10.7%) | 431 (35.5%) |
| 3 or 4 Children | 3 (25.0%) | 79 (58.1%) |
| 5 or more Children | 0 (0.0%) | 0 (0.0%) |
| Total | 140 (13.2%) | 637 (29.3%) |
Income Below Poverty Among Married-Couple vs Single-Parent Households in Story County
The poverty data for Story County shows that 325 of the married-couple family households (2.1%) and 777 of the single-parent households (24.0%) are living below the poverty level. Within the married-couple family households, those with 5 or more children have the highest poverty rate, with 6 households (6.3%) falling below the poverty line. Among the single-parent households, those with 3 or 4 children have the highest poverty rate, with 82 household (55.4%) living below poverty.
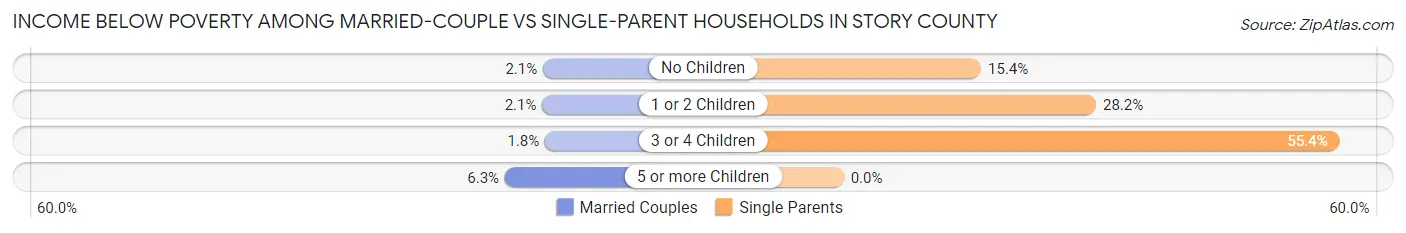
| Children | Married-Couple Families | Single-Parent Households |
| No Children | 189 (2.1%) | 210 (15.4%) |
| 1 or 2 Children | 105 (2.1%) | 485 (28.2%) |
| 3 or 4 Children | 25 (1.8%) | 82 (55.4%) |
| 5 or more Children | 6 (6.3%) | 0 (0.0%) |
| Total | 325 (2.1%) | 777 (24.0%) |
Race in Story County
The most populous races in Story County are White / Caucasian (82,650 | 83.9%), Asian (7,179 | 7.3%), and Two or more Races (4,605 | 4.7%).
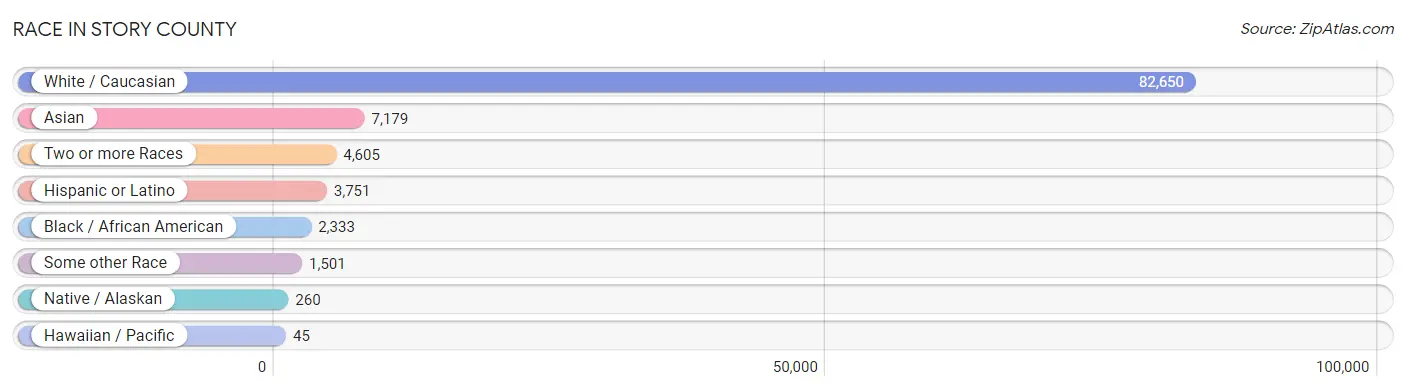
| Race | # Population | % Population |
| Asian | 7,179 | 7.3% |
| Black / African American | 2,333 | 2.4% |
| Hawaiian / Pacific | 45 | 0.1% |
| Hispanic or Latino | 3,751 | 3.8% |
| Native / Alaskan | 260 | 0.3% |
| White / Caucasian | 82,650 | 83.9% |
| Two or more Races | 4,605 | 4.7% |
| Some other Race | 1,501 | 1.5% |
| Total | 98,573 | 100.0% |
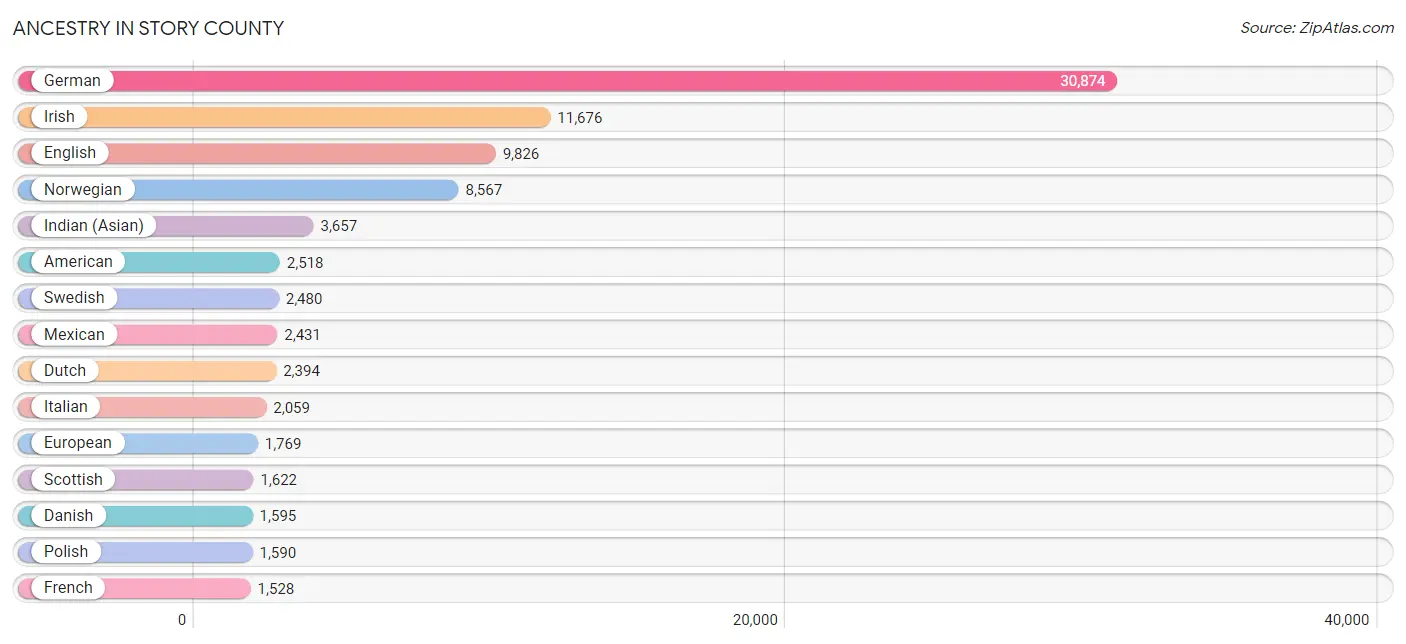
Ancestry in Story County
The most populous ancestries reported in Story County are German (30,874 | 31.3%), Irish (11,676 | 11.8%), English (9,826 | 10.0%), Norwegian (8,567 | 8.7%), and Indian (Asian) (3,657 | 3.7%), together accounting for 65.5% of all Story County residents.
| Ancestry | # Population | % Population |
| African | 396 | 0.4% |
| American | 2,518 | 2.5% |
| Arab | 221 | 0.2% |
| Argentinean | 26 | 0.0% |
| Armenian | 30 | 0.0% |
| Australian | 13 | 0.0% |
| Austrian | 287 | 0.3% |
| Bahamian | 6 | 0.0% |
| Bangladeshi | 61 | 0.1% |
| Barbadian | 17 | 0.0% |
| Belgian | 388 | 0.4% |
| Bhutanese | 338 | 0.3% |
| Blackfeet | 22 | 0.0% |
| Bolivian | 10 | 0.0% |
| Brazilian | 411 | 0.4% |
| British | 1,065 | 1.1% |
| Bulgarian | 33 | 0.0% |
| Burmese | 1,120 | 1.1% |
| Cambodian | 78 | 0.1% |
| Canadian | 202 | 0.2% |
| Central American | 283 | 0.3% |
| Central American Indian | 36 | 0.0% |
| Cherokee | 217 | 0.2% |
| Chickasaw | 7 | 0.0% |
| Chilean | 10 | 0.0% |
| Chippewa | 15 | 0.0% |
| Choctaw | 5 | 0.0% |
| Colombian | 23 | 0.0% |
| Comanche | 11 | 0.0% |
| Costa Rican | 13 | 0.0% |
| Cree | 6 | 0.0% |
| Creek | 1 | 0.0% |
| Croatian | 85 | 0.1% |
| Cuban | 45 | 0.1% |
| Cypriot | 20 | 0.0% |
| Czech | 984 | 1.0% |
| Czechoslovakian | 249 | 0.3% |
| Danish | 1,595 | 1.6% |
| Dutch | 2,394 | 2.4% |
| Eastern European | 138 | 0.1% |
| Ecuadorian | 3 | 0.0% |
| Egyptian | 7 | 0.0% |
| English | 9,826 | 10.0% |
| European | 1,769 | 1.8% |
| Filipino | 11 | 0.0% |
| Finnish | 126 | 0.1% |
| French | 1,528 | 1.5% |
| French American Indian | 3 | 0.0% |
| French Canadian | 190 | 0.2% |
| German | 30,874 | 31.3% |
| Ghanaian | 8 | 0.0% |
| Greek | 123 | 0.1% |
| Guamanian / Chamorro | 16 | 0.0% |
| Guatemalan | 142 | 0.1% |
| Honduran | 44 | 0.0% |
| Hopi | 4 | 0.0% |
| Hungarian | 178 | 0.2% |
| Icelander | 6 | 0.0% |
| Indian (Asian) | 3,657 | 3.7% |
| Inupiat | 8 | 0.0% |
| Iranian | 367 | 0.4% |
| Irish | 11,676 | 11.8% |
| Iroquois | 62 | 0.1% |
| Israeli | 16 | 0.0% |
| Italian | 2,059 | 2.1% |
| Jamaican | 11 | 0.0% |
| Kenyan | 11 | 0.0% |
| Korean | 811 | 0.8% |
| Laotian | 93 | 0.1% |
| Latvian | 9 | 0.0% |
| Lebanese | 96 | 0.1% |
| Lithuanian | 115 | 0.1% |
| Luxembourger | 67 | 0.1% |
| Malaysian | 144 | 0.2% |
| Mexican | 2,431 | 2.5% |
| Mexican American Indian | 36 | 0.0% |
| Mongolian | 174 | 0.2% |
| Native Hawaiian | 52 | 0.1% |
| Navajo | 4 | 0.0% |
| Nigerian | 116 | 0.1% |
| Northern European | 395 | 0.4% |
| Norwegian | 8,567 | 8.7% |
| Pakistani | 69 | 0.1% |
| Palestinian | 19 | 0.0% |
| Panamanian | 37 | 0.0% |
| Pennsylvania German | 37 | 0.0% |
| Peruvian | 63 | 0.1% |
| Polish | 1,590 | 1.6% |
| Portuguese | 30 | 0.0% |
| Puerto Rican | 169 | 0.2% |
| Romanian | 130 | 0.1% |
| Russian | 324 | 0.3% |
| Salvadoran | 47 | 0.1% |
| Scandinavian | 1,146 | 1.2% |
| Scotch-Irish | 701 | 0.7% |
| Scottish | 1,622 | 1.7% |
| Serbian | 24 | 0.0% |
| Sioux | 65 | 0.1% |
| Slavic | 45 | 0.1% |
| Slovak | 31 | 0.0% |
| Slovene | 31 | 0.0% |
| Somali | 38 | 0.0% |
| South African | 16 | 0.0% |
| South American | 268 | 0.3% |
| South American Indian | 7 | 0.0% |
| Spaniard | 85 | 0.1% |
| Spanish | 97 | 0.1% |
| Sri Lankan | 683 | 0.7% |
| Subsaharan African | 1,013 | 1.0% |
| Sudanese | 311 | 0.3% |
| Swedish | 2,480 | 2.5% |
| Swiss | 588 | 0.6% |
| Thai | 1,079 | 1.1% |
| Tlingit-Haida | 3 | 0.0% |
| Tongan | 12 | 0.0% |
| Turkish | 73 | 0.1% |
| Ugandan | 34 | 0.0% |
| Ukrainian | 100 | 0.1% |
| Uruguayan | 19 | 0.0% |
| Venezuelan | 111 | 0.1% |
| Vietnamese | 189 | 0.2% |
| Welsh | 667 | 0.7% |
| Yaqui | 30 | 0.0% |
| Yugoslavian | 9 | 0.0% | View All 124 Rows |
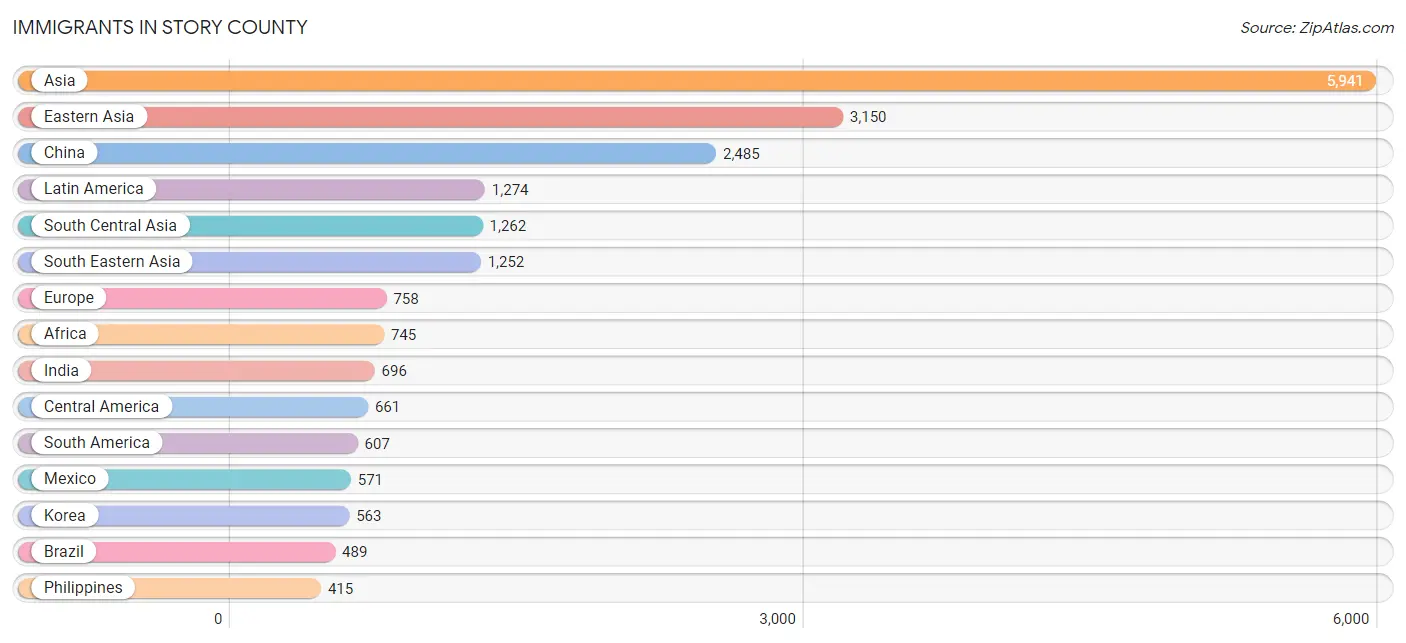
Immigrants in Story County
The most numerous immigrant groups reported in Story County came from Asia (5,941 | 6.0%), Eastern Asia (3,150 | 3.2%), China (2,485 | 2.5%), Latin America (1,274 | 1.3%), and South Central Asia (1,262 | 1.3%), together accounting for 14.3% of all Story County residents.
| Immigration Origin | # Population | % Population |
| Africa | 745 | 0.8% |
| Argentina | 9 | 0.0% |
| Asia | 5,941 | 6.0% |
| Bahamas | 6 | 0.0% |
| Bangladesh | 179 | 0.2% |
| Brazil | 489 | 0.5% |
| Bulgaria | 33 | 0.0% |
| Canada | 157 | 0.2% |
| Caribbean | 6 | 0.0% |
| Central America | 661 | 0.7% |
| Chile | 5 | 0.0% |
| China | 2,485 | 2.5% |
| Colombia | 23 | 0.0% |
| Denmark | 5 | 0.0% |
| Eastern Africa | 322 | 0.3% |
| Eastern Asia | 3,150 | 3.2% |
| Eastern Europe | 275 | 0.3% |
| Egypt | 42 | 0.0% |
| El Salvador | 11 | 0.0% |
| England | 34 | 0.0% |
| Ethiopia | 130 | 0.1% |
| Europe | 758 | 0.8% |
| France | 17 | 0.0% |
| Germany | 199 | 0.2% |
| Ghana | 6 | 0.0% |
| Guatemala | 59 | 0.1% |
| Guyana | 3 | 0.0% |
| Honduras | 20 | 0.0% |
| Hong Kong | 44 | 0.0% |
| Hungary | 17 | 0.0% |
| India | 696 | 0.7% |
| Indonesia | 171 | 0.2% |
| Iran | 244 | 0.3% |
| Iraq | 86 | 0.1% |
| Ireland | 9 | 0.0% |
| Italy | 52 | 0.1% |
| Japan | 24 | 0.0% |
| Kazakhstan | 21 | 0.0% |
| Kenya | 28 | 0.0% |
| Korea | 563 | 0.6% |
| Laos | 60 | 0.1% |
| Latin America | 1,274 | 1.3% |
| Latvia | 20 | 0.0% |
| Lebanon | 81 | 0.1% |
| Lithuania | 5 | 0.0% |
| Malaysia | 209 | 0.2% |
| Mexico | 571 | 0.6% |
| Morocco | 9 | 0.0% |
| Nepal | 73 | 0.1% |
| Netherlands | 30 | 0.0% |
| Nigeria | 131 | 0.1% |
| Northern Africa | 196 | 0.2% |
| Northern Europe | 144 | 0.2% |
| Norway | 33 | 0.0% |
| Pakistan | 42 | 0.0% |
| Peru | 9 | 0.0% |
| Philippines | 415 | 0.4% |
| Romania | 88 | 0.1% |
| Russia | 59 | 0.1% |
| Saudi Arabia | 25 | 0.0% |
| Scotland | 3 | 0.0% |
| Senegal | 30 | 0.0% |
| Singapore | 55 | 0.1% |
| Somalia | 16 | 0.0% |
| South Africa | 34 | 0.0% |
| South America | 607 | 0.6% |
| South Central Asia | 1,262 | 1.3% |
| South Eastern Asia | 1,252 | 1.3% |
| Southern Europe | 93 | 0.1% |
| Spain | 41 | 0.0% |
| Sri Lanka | 7 | 0.0% |
| Sudan | 145 | 0.2% |
| Sweden | 13 | 0.0% |
| Taiwan | 141 | 0.1% |
| Thailand | 32 | 0.0% |
| Turkey | 65 | 0.1% |
| Uganda | 63 | 0.1% |
| Ukraine | 38 | 0.0% |
| Uruguay | 19 | 0.0% |
| Venezuela | 47 | 0.1% |
| Vietnam | 310 | 0.3% |
| Western Africa | 170 | 0.2% |
| Western Asia | 277 | 0.3% |
| Western Europe | 246 | 0.3% | View All 84 Rows |
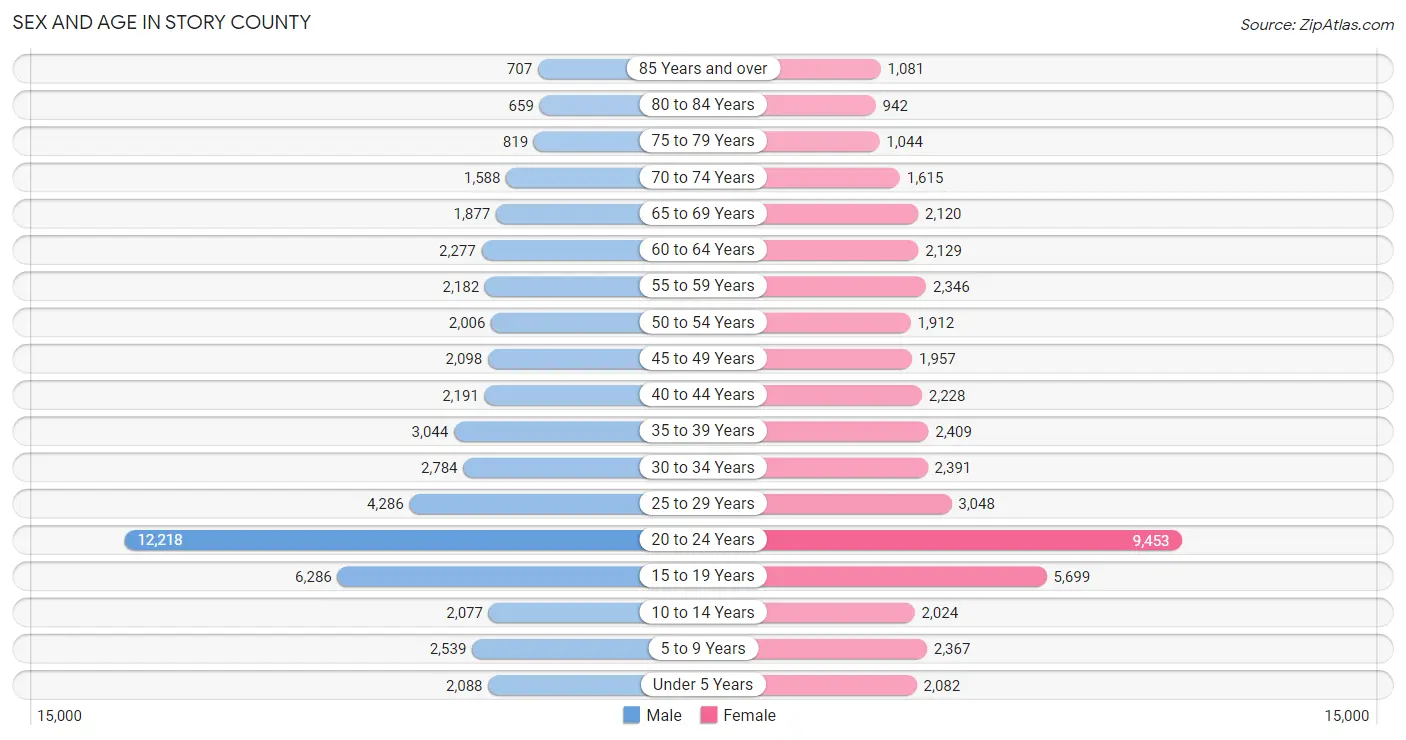
Sex and Age in Story County
Sex and Age in Story County
The most populous age groups in Story County are 20 to 24 Years (12,218 | 23.6%) for men and 20 to 24 Years (9,453 | 20.2%) for women.
| Age Bracket | Male | Female |
| Under 5 Years | 2,088 (4.0%) | 2,082 (4.4%) |
| 5 to 9 Years | 2,539 (4.9%) | 2,367 (5.1%) |
| 10 to 14 Years | 2,077 (4.0%) | 2,024 (4.3%) |
| 15 to 19 Years | 6,286 (12.1%) | 5,699 (12.2%) |
| 20 to 24 Years | 12,218 (23.6%) | 9,453 (20.2%) |
| 25 to 29 Years | 4,286 (8.3%) | 3,048 (6.5%) |
| 30 to 34 Years | 2,784 (5.4%) | 2,391 (5.1%) |
| 35 to 39 Years | 3,044 (5.9%) | 2,409 (5.1%) |
| 40 to 44 Years | 2,191 (4.2%) | 2,228 (4.8%) |
| 45 to 49 Years | 2,098 (4.1%) | 1,957 (4.2%) |
| 50 to 54 Years | 2,006 (3.9%) | 1,912 (4.1%) |
| 55 to 59 Years | 2,182 (4.2%) | 2,346 (5.0%) |
| 60 to 64 Years | 2,277 (4.4%) | 2,129 (4.5%) |
| 65 to 69 Years | 1,877 (3.6%) | 2,120 (4.5%) |
| 70 to 74 Years | 1,588 (3.1%) | 1,615 (3.5%) |
| 75 to 79 Years | 819 (1.6%) | 1,044 (2.2%) |
| 80 to 84 Years | 659 (1.3%) | 942 (2.0%) |
| 85 Years and over | 707 (1.4%) | 1,081 (2.3%) |
| Total | 51,726 (100.0%) | 46,847 (100.0%) |
Families and Households in Story County
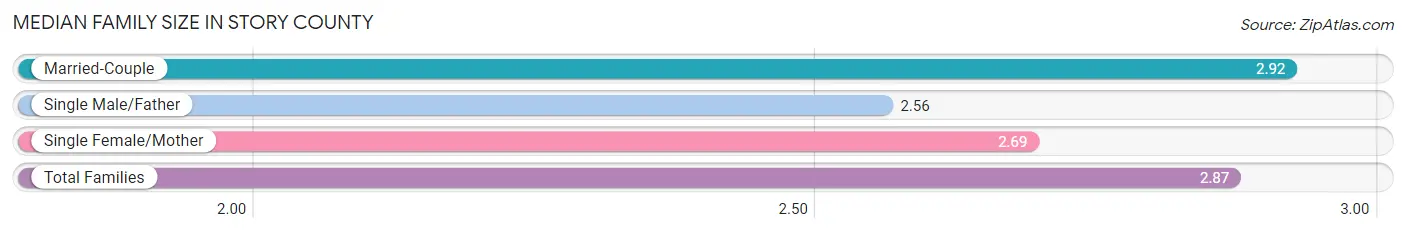
Median Family Size in Story County
The median family size in Story County is 2.87 persons per family, with married-couple families (15,548 | 82.8%) accounting for the largest median family size of 2.92 persons per family. On the other hand, single male/father families (1,059 | 5.6%) represent the smallest median family size with 2.56 persons per family.
| Family Type | # Families | Family Size |
| Married-Couple | 15,548 (82.8%) | 2.92 |
| Single Male/Father | 1,059 (5.6%) | 2.56 |
| Single Female/Mother | 2,176 (11.6%) | 2.69 |
| Total Families | 18,783 (100.0%) | 2.87 |
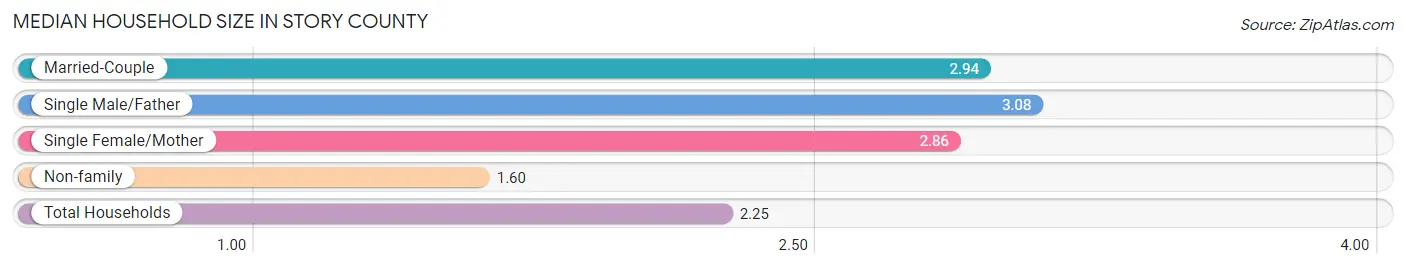
Median Household Size in Story County
The median household size in Story County is 2.25 persons per household, with single male/father households (1,059 | 2.8%) accounting for the largest median household size of 3.08 persons per household. non-family households (19,629 | 51.1%) represent the smallest median household size with 1.60 persons per household.
| Household Type | # Households | Household Size |
| Married-Couple | 15,548 (40.5%) | 2.94 |
| Single Male/Father | 1,059 (2.8%) | 3.08 |
| Single Female/Mother | 2,176 (5.7%) | 2.86 |
| Non-family | 19,629 (51.1%) | 1.60 |
| Total Households | 38,412 (100.0%) | 2.25 |
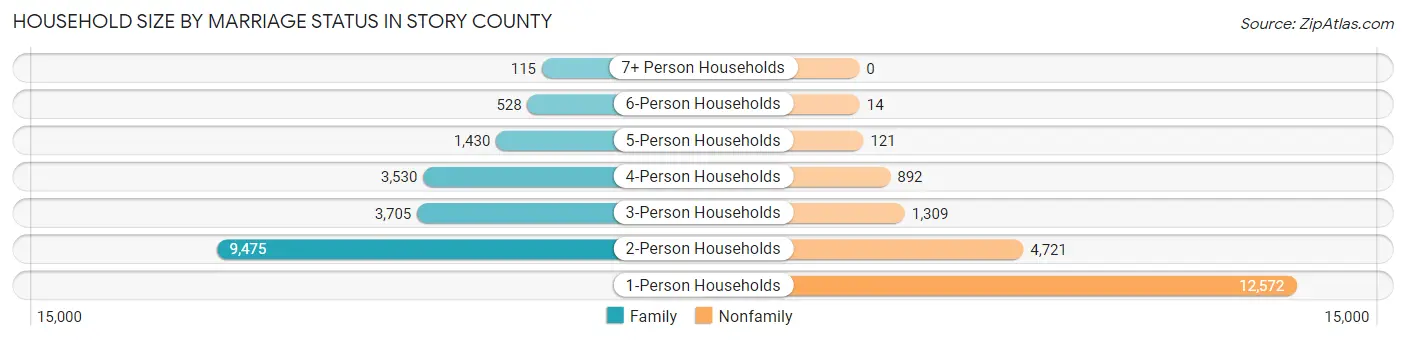
Household Size by Marriage Status in Story County
Out of a total of 38,412 households in Story County, 18,783 (48.9%) are family households, while 19,629 (51.1%) are nonfamily households. The most numerous type of family households are 2-person households, comprising 9,475, and the most common type of nonfamily households are 1-person households, comprising 12,572.
| Household Size | Family Households | Nonfamily Households |
| 1-Person Households | - | 12,572 (32.7%) |
| 2-Person Households | 9,475 (24.7%) | 4,721 (12.3%) |
| 3-Person Households | 3,705 (9.7%) | 1,309 (3.4%) |
| 4-Person Households | 3,530 (9.2%) | 892 (2.3%) |
| 5-Person Households | 1,430 (3.7%) | 121 (0.3%) |
| 6-Person Households | 528 (1.4%) | 14 (0.0%) |
| 7+ Person Households | 115 (0.3%) | 0 (0.0%) |
| Total | 18,783 (48.9%) | 19,629 (51.1%) |
Female Fertility in Story County
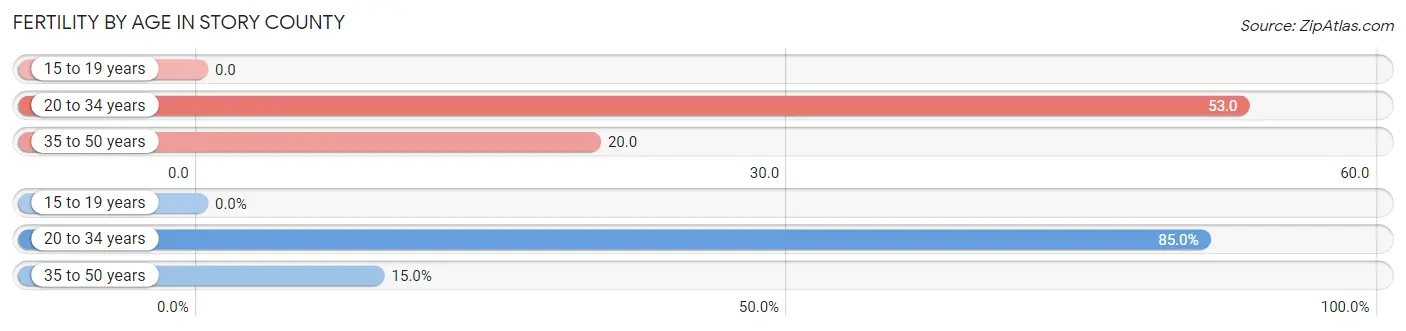
Fertility by Age in Story County
Average fertility rate in Story County is 34.0 births per 1,000 women. Women in the age bracket of 20 to 34 years have the highest fertility rate with 53.0 births per 1,000 women. Women in the age bracket of 20 to 34 years acount for 85.0% of all women with births.
| Age Bracket | Women with Births | Births / 1,000 Women |
| 15 to 19 years | 0 (0.0%) | 0.0 |
| 20 to 34 years | 789 (85.0%) | 53.0 |
| 35 to 50 years | 139 (15.0%) | 20.0 |
| Total | 928 (100.0%) | 34.0 |
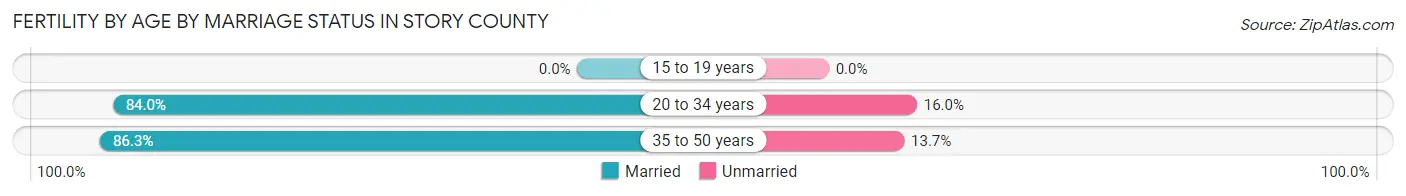
Fertility by Age by Marriage Status in Story County
84.4% of women with births (928) in Story County are married. The highest percentage of unmarried women with births falls into 20 to 34 years age bracket with 16.0% of them unmarried at the time of birth, while the lowest percentage of unmarried women with births belong to 35 to 50 years age bracket with 13.7% of them unmarried.
| Age Bracket | Married | Unmarried |
| 15 to 19 years | 0 (0.0%) | 0 (0.0%) |
| 20 to 34 years | 663 (84.0%) | 126 (16.0%) |
| 35 to 50 years | 120 (86.3%) | 19 (13.7%) |
| Total | 783 (84.4%) | 145 (15.6%) |
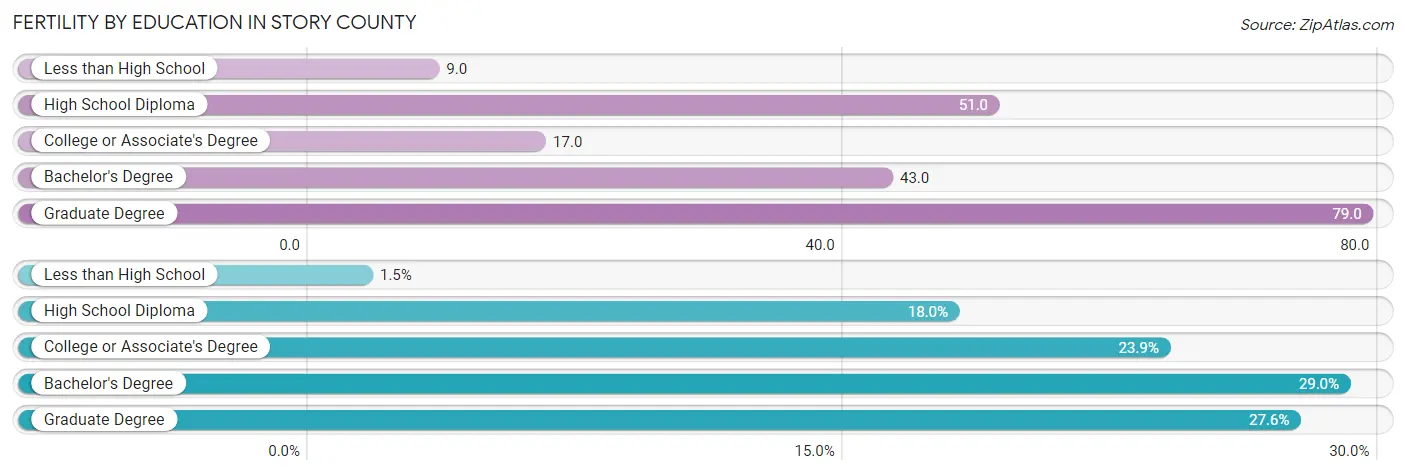
Fertility by Education in Story County
Average fertility rate in Story County is 34.0 births per 1,000 women. Women with the education attainment of graduate degree have the highest fertility rate of 79.0 births per 1,000 women, while women with the education attainment of less than high school have the lowest fertility at 9.0 births per 1,000 women. Women with the education attainment of bachelor's degree represent 29.0% of all women with births.
| Educational Attainment | Women with Births | Births / 1,000 Women |
| Less than High School | 14 (1.5%) | 9.0 |
| High School Diploma | 167 (18.0%) | 51.0 |
| College or Associate's Degree | 222 (23.9%) | 17.0 |
| Bachelor's Degree | 269 (29.0%) | 43.0 |
| Graduate Degree | 256 (27.6%) | 79.0 |
| Total | 928 (100.0%) | 34.0 |
Fertility by Education by Marriage Status in Story County
15.6% of women with births in Story County are unmarried. Women with the educational attainment of less than high school are most likely to be married with 100.0% of them married at childbirth, while women with the educational attainment of high school diploma are least likely to be married with 56.9% of them unmarried at childbirth.
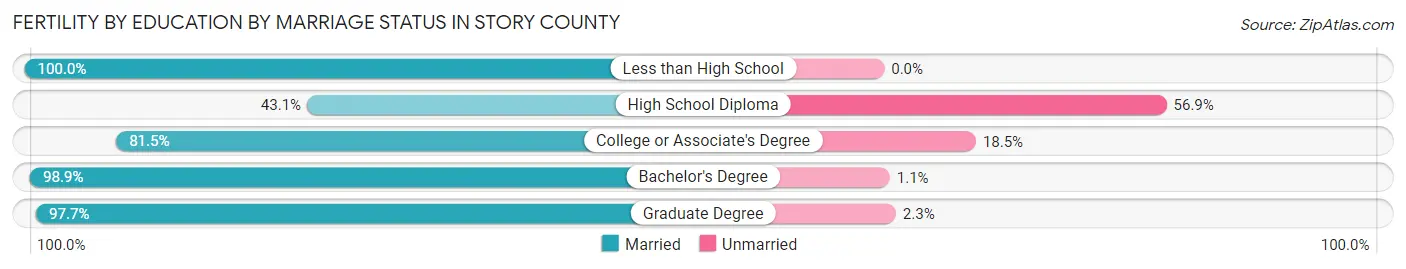
| Educational Attainment | Married | Unmarried |
| Less than High School | 14 (100.0%) | 0 (0.0%) |
| High School Diploma | 72 (43.1%) | 95 (56.9%) |
| College or Associate's Degree | 181 (81.5%) | 41 (18.5%) |
| Bachelor's Degree | 266 (98.9%) | 3 (1.1%) |
| Graduate Degree | 250 (97.7%) | 6 (2.3%) |
| Total | 783 (84.4%) | 145 (15.6%) |
Employment Characteristics in Story County
Employment by Class of Employer in Story County
Among the 51,376 employed individuals in Story County, private company employees (28,104 | 54.7%), state government employees (10,913 | 21.2%), and not-for-profit organizations (3,644 | 7.1%) make up the most common classes of employment.
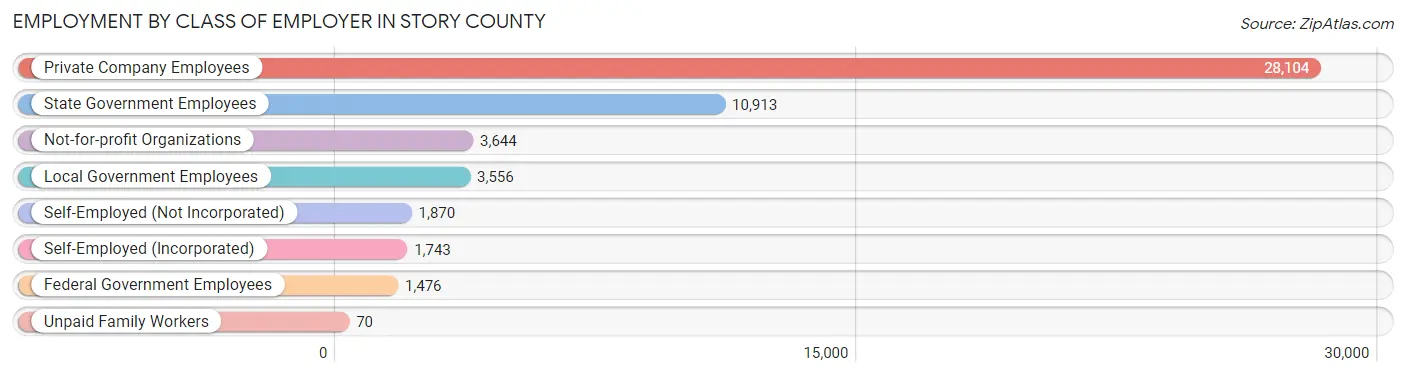
| Employer Class | # Employees | % Employees |
| Private Company Employees | 28,104 | 54.7% |
| Self-Employed (Incorporated) | 1,743 | 3.4% |
| Self-Employed (Not Incorporated) | 1,870 | 3.6% |
| Not-for-profit Organizations | 3,644 | 7.1% |
| Local Government Employees | 3,556 | 6.9% |
| State Government Employees | 10,913 | 21.2% |
| Federal Government Employees | 1,476 | 2.9% |
| Unpaid Family Workers | 70 | 0.1% |
| Total | 51,376 | 100.0% |
Employment Status by Age in Story County
According to the labor force statistics for Story County, out of the total population over 16 years of age (84,617), 66.7% or 56,440 individuals are in the labor force, with 5.6% or 3,161 of them unemployed. The age group with the highest labor force participation rate is 35 to 44 years, with 88.7% or 8,756 individuals in the labor force. Within the labor force, the 16 to 19 years age range has the highest percentage of unemployed individuals, with 11.3% or 612 of them being unemployed.
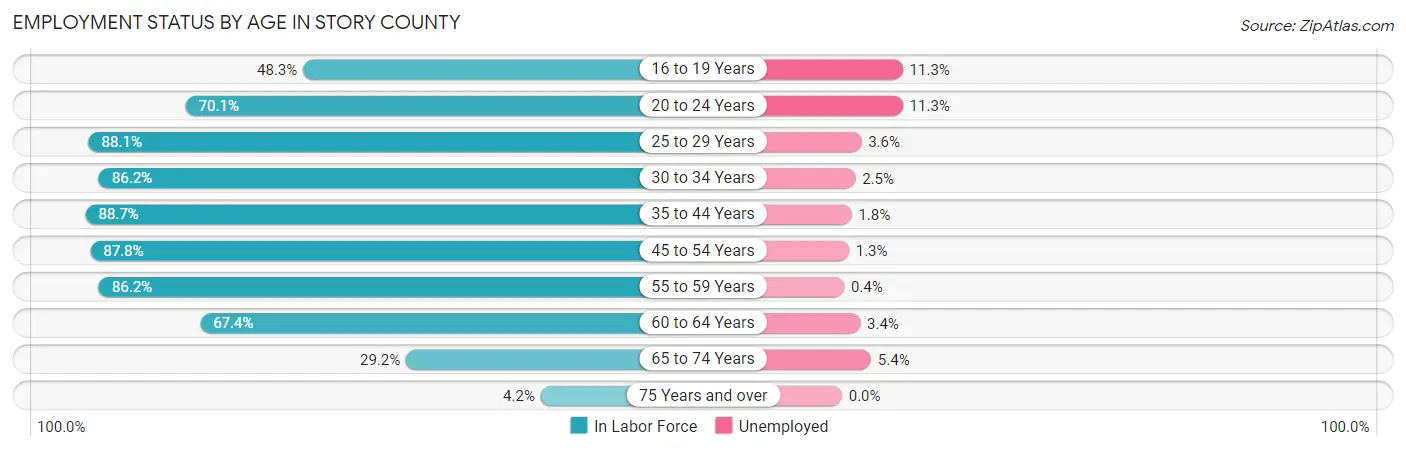
| Age Bracket | In Labor Force | Unemployed |
| 16 to 19 Years | 5,412 (48.3%) | 612 (11.3%) |
| 20 to 24 Years | 15,191 (70.1%) | 1,717 (11.3%) |
| 25 to 29 Years | 6,461 (88.1%) | 233 (3.6%) |
| 30 to 34 Years | 4,461 (86.2%) | 112 (2.5%) |
| 35 to 44 Years | 8,756 (88.7%) | 158 (1.8%) |
| 45 to 54 Years | 7,000 (87.8%) | 91 (1.3%) |
| 55 to 59 Years | 3,903 (86.2%) | 16 (0.4%) |
| 60 to 64 Years | 2,970 (67.4%) | 101 (3.4%) |
| 65 to 74 Years | 2,102 (29.2%) | 114 (5.4%) |
| 75 Years and over | 221 (4.2%) | 0 (0.0%) |
| Total | 56,440 (66.7%) | 3,161 (5.6%) |
Employment Status by Educational Attainment in Story County
According to labor force statistics for Story County, 85.4% of individuals (33,552) out of the total population between 25 and 64 years of age (39,288) are in the labor force, with 2.1% or 705 of them being unemployed. The group with the highest labor force participation rate are those with the educational attainment of bachelor's degree or higher, with 88.5% or 19,064 individuals in the labor force. Within the labor force, individuals with high school diploma education have the highest percentage of unemployment, with 4.9% or 204 of them being unemployed.
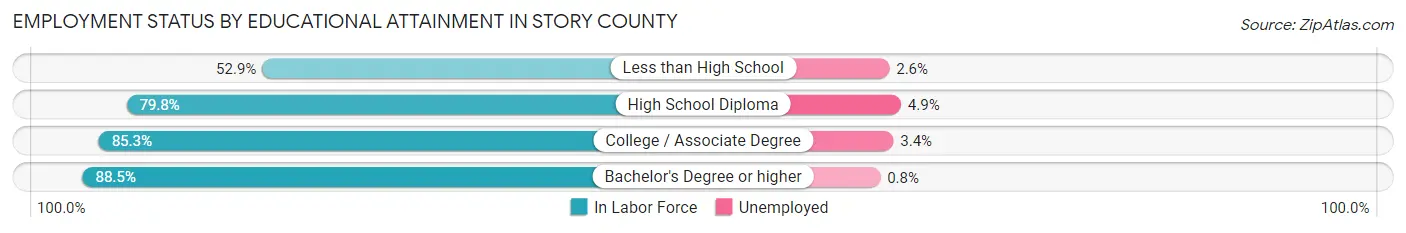
| Educational Attainment | In Labor Force | Unemployed |
| Less than High School | 605 (52.9%) | 30 (2.6%) |
| High School Diploma | 4,164 (79.8%) | 256 (4.9%) |
| College / Associate Degree | 9,712 (85.3%) | 387 (3.4%) |
| Bachelor's Degree or higher | 19,064 (88.5%) | 172 (0.8%) |
| Total | 33,552 (85.4%) | 825 (2.1%) |
Employment Occupations by Sex in Story County
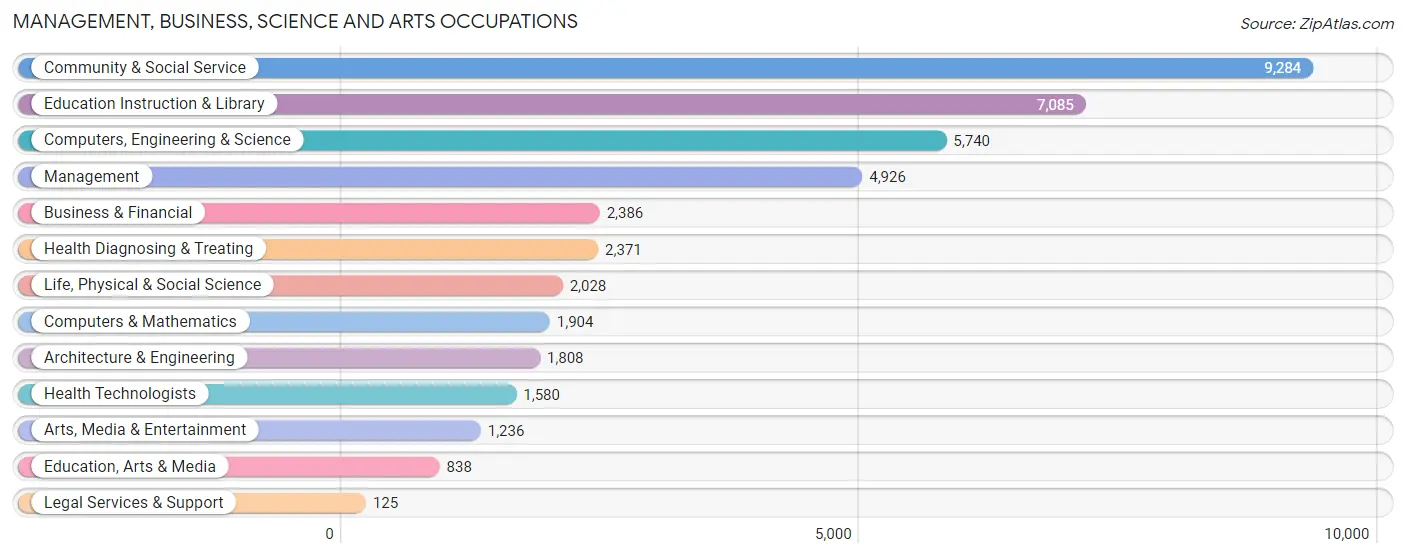
Management, Business, Science and Arts Occupations
The most common Management, Business, Science and Arts occupations in Story County are Community & Social Service (9,284 | 17.4%), Education Instruction & Library (7,085 | 13.3%), Computers, Engineering & Science (5,740 | 10.8%), Management (4,926 | 9.2%), and Business & Financial (2,386 | 4.5%).
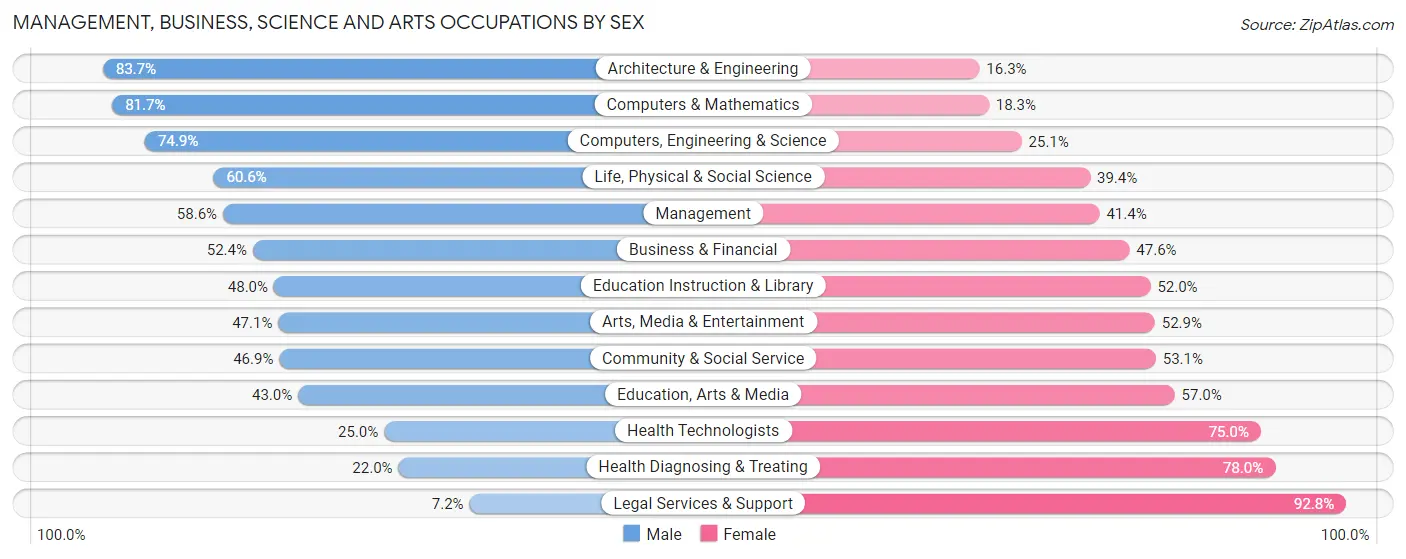
Management, Business, Science and Arts Occupations by Sex
Within the Management, Business, Science and Arts occupations in Story County, the most male-oriented occupations are Architecture & Engineering (83.7%), Computers & Mathematics (81.7%), and Computers, Engineering & Science (74.9%), while the most female-oriented occupations are Legal Services & Support (92.8%), Health Diagnosing & Treating (78.0%), and Health Technologists (75.0%).
| Occupation | Male | Female |
| Management | 2,888 (58.6%) | 2,038 (41.4%) |
| Business & Financial | 1,250 (52.4%) | 1,136 (47.6%) |
| Computers, Engineering & Science | 4,298 (74.9%) | 1,442 (25.1%) |
| Computers & Mathematics | 1,556 (81.7%) | 348 (18.3%) |
| Architecture & Engineering | 1,513 (83.7%) | 295 (16.3%) |
| Life, Physical & Social Science | 1,229 (60.6%) | 799 (39.4%) |
| Community & Social Service | 4,352 (46.9%) | 4,932 (53.1%) |
| Education, Arts & Media | 360 (43.0%) | 478 (57.0%) |
| Legal Services & Support | 9 (7.2%) | 116 (92.8%) |
| Education Instruction & Library | 3,401 (48.0%) | 3,684 (52.0%) |
| Arts, Media & Entertainment | 582 (47.1%) | 654 (52.9%) |
| Health Diagnosing & Treating | 522 (22.0%) | 1,849 (78.0%) |
| Health Technologists | 395 (25.0%) | 1,185 (75.0%) |
| Total (Category) | 13,310 (53.9%) | 11,397 (46.1%) |
| Total (Overall) | 28,708 (53.9%) | 24,551 (46.1%) |
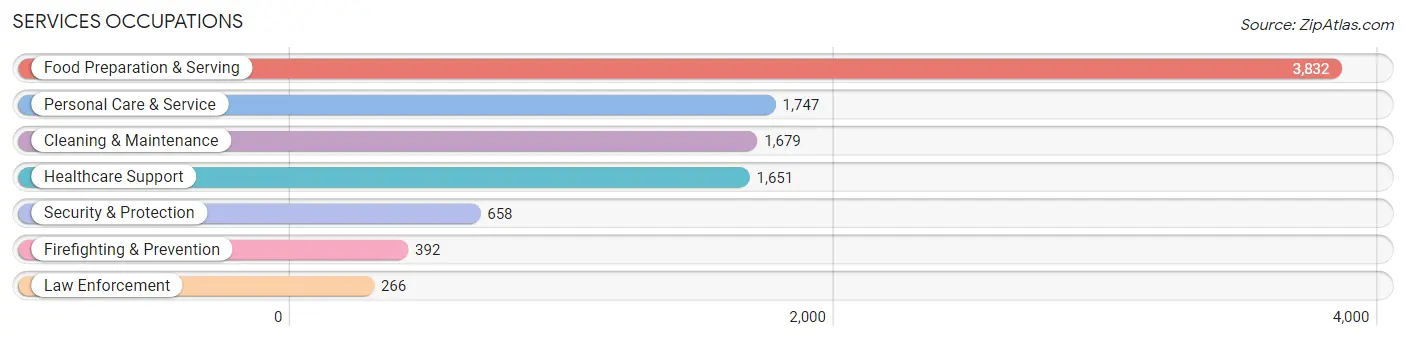
Services Occupations
The most common Services occupations in Story County are Food Preparation & Serving (3,832 | 7.2%), Personal Care & Service (1,747 | 3.3%), Cleaning & Maintenance (1,679 | 3.2%), Healthcare Support (1,651 | 3.1%), and Security & Protection (658 | 1.2%).
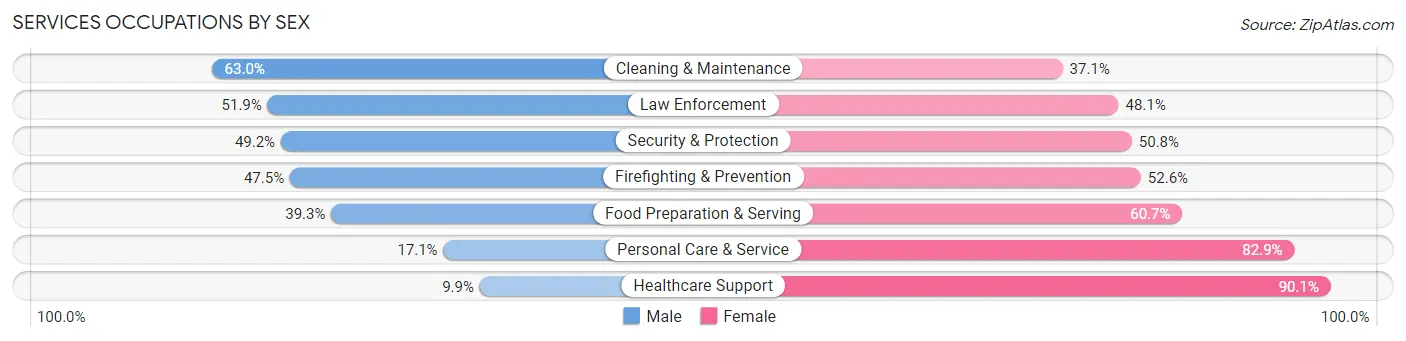
Services Occupations by Sex
Within the Services occupations in Story County, the most male-oriented occupations are Cleaning & Maintenance (62.9%), Law Enforcement (51.9%), and Security & Protection (49.2%), while the most female-oriented occupations are Healthcare Support (90.1%), Personal Care & Service (82.9%), and Food Preparation & Serving (60.7%).
| Occupation | Male | Female |
| Healthcare Support | 163 (9.9%) | 1,488 (90.1%) |
| Security & Protection | 324 (49.2%) | 334 (50.8%) |
| Firefighting & Prevention | 186 (47.4%) | 206 (52.5%) |
| Law Enforcement | 138 (51.9%) | 128 (48.1%) |
| Food Preparation & Serving | 1,505 (39.3%) | 2,327 (60.7%) |
| Cleaning & Maintenance | 1,057 (62.9%) | 622 (37.0%) |
| Personal Care & Service | 298 (17.1%) | 1,449 (82.9%) |
| Total (Category) | 3,347 (35.0%) | 6,220 (65.0%) |
| Total (Overall) | 28,708 (53.9%) | 24,551 (46.1%) |
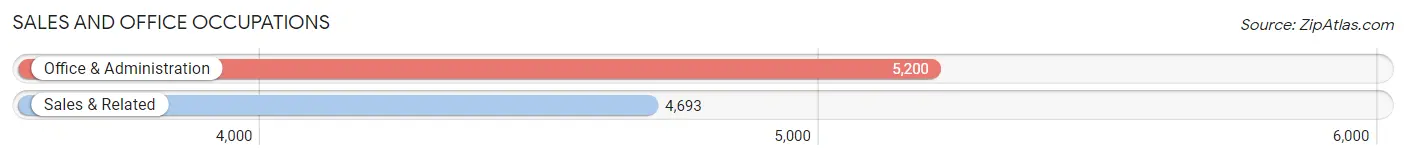
Sales and Office Occupations
The most common Sales and Office occupations in Story County are Office & Administration (5,200 | 9.8%), and Sales & Related (4,693 | 8.8%).
Sales and Office Occupations by Sex
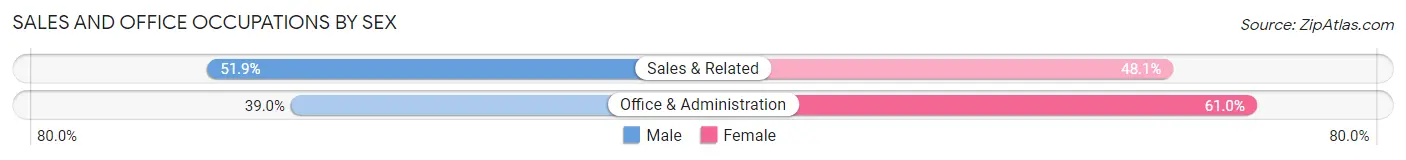
| Occupation | Male | Female |
| Sales & Related | 2,435 (51.9%) | 2,258 (48.1%) |
| Office & Administration | 2,030 (39.0%) | 3,170 (61.0%) |
| Total (Category) | 4,465 (45.1%) | 5,428 (54.9%) |
| Total (Overall) | 28,708 (53.9%) | 24,551 (46.1%) |
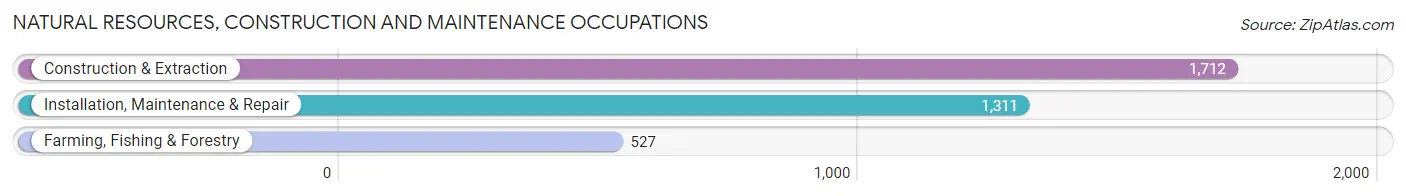
Natural Resources, Construction and Maintenance Occupations
The most common Natural Resources, Construction and Maintenance occupations in Story County are Construction & Extraction (1,712 | 3.2%), Installation, Maintenance & Repair (1,311 | 2.5%), and Farming, Fishing & Forestry (527 | 1.0%).
Natural Resources, Construction and Maintenance Occupations by Sex
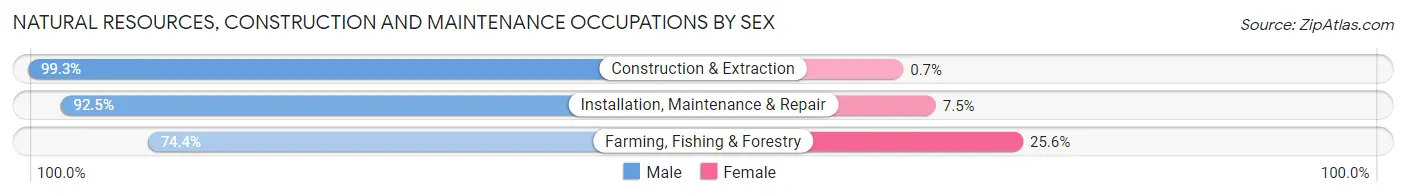
| Occupation | Male | Female |
| Farming, Fishing & Forestry | 392 (74.4%) | 135 (25.6%) |
| Construction & Extraction | 1,700 (99.3%) | 12 (0.7%) |
| Installation, Maintenance & Repair | 1,213 (92.5%) | 98 (7.5%) |
| Total (Category) | 3,305 (93.1%) | 245 (6.9%) |
| Total (Overall) | 28,708 (53.9%) | 24,551 (46.1%) |
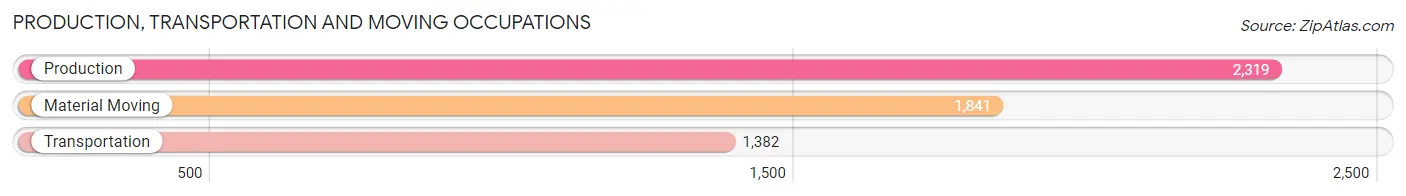
Production, Transportation and Moving Occupations
The most common Production, Transportation and Moving occupations in Story County are Production (2,319 | 4.3%), Material Moving (1,841 | 3.5%), and Transportation (1,382 | 2.6%).
Production, Transportation and Moving Occupations by Sex
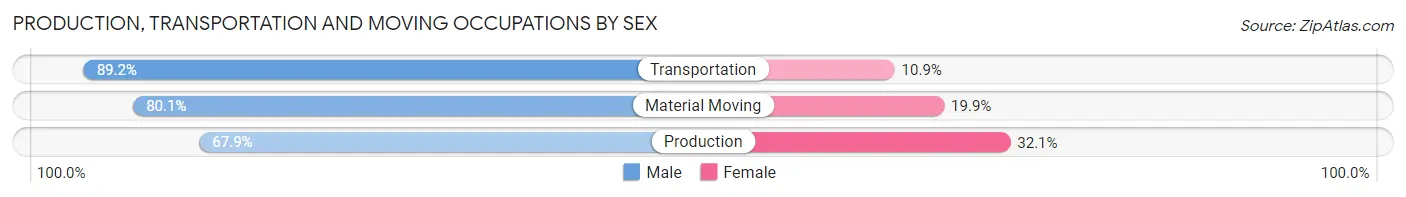
| Occupation | Male | Female |
| Production | 1,575 (67.9%) | 744 (32.1%) |
| Transportation | 1,232 (89.1%) | 150 (10.8%) |
| Material Moving | 1,474 (80.1%) | 367 (19.9%) |
| Total (Category) | 4,281 (77.2%) | 1,261 (22.8%) |
| Total (Overall) | 28,708 (53.9%) | 24,551 (46.1%) |
Employment Industries by Sex in Story County
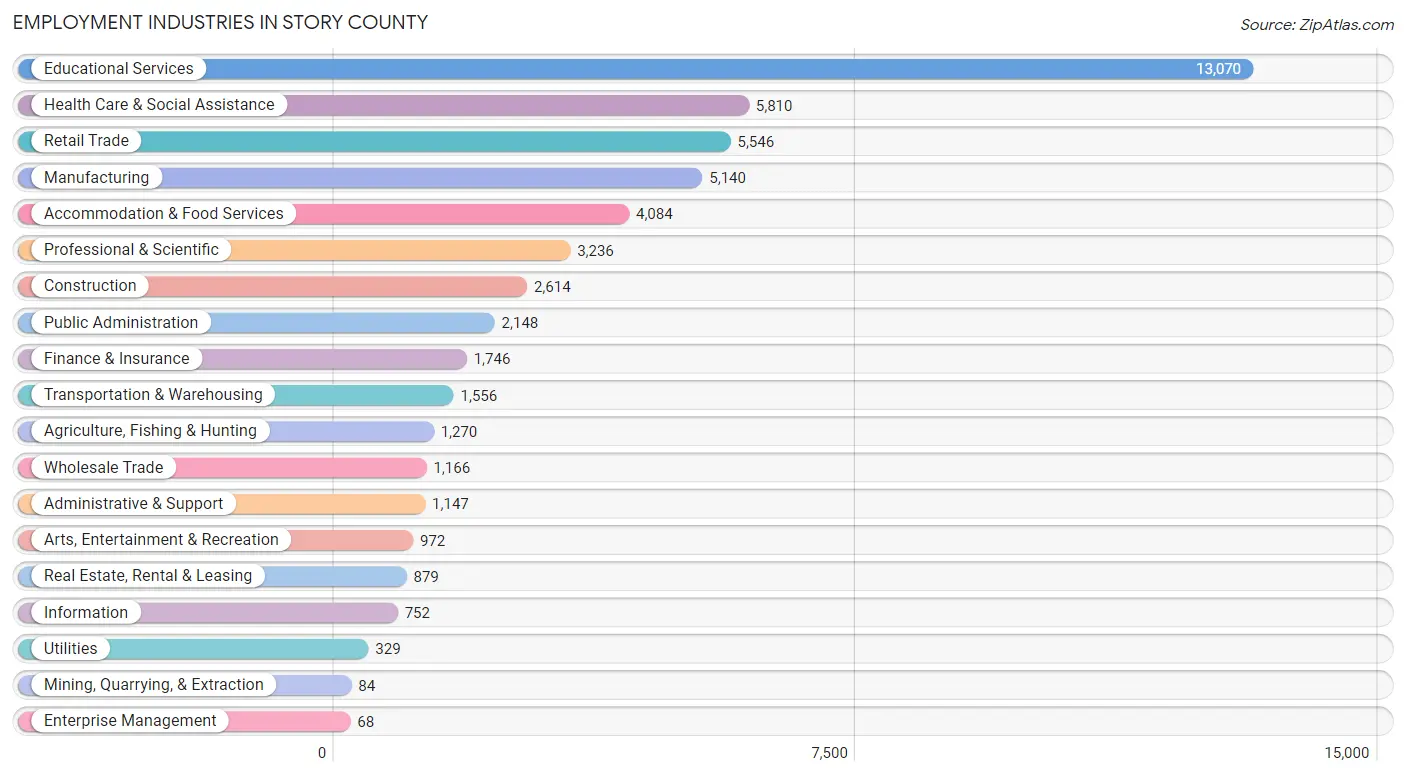
Employment Industries in Story County
The major employment industries in Story County include Educational Services (13,070 | 24.5%), Health Care & Social Assistance (5,810 | 10.9%), Retail Trade (5,546 | 10.4%), Manufacturing (5,140 | 9.7%), and Accommodation & Food Services (4,084 | 7.7%).
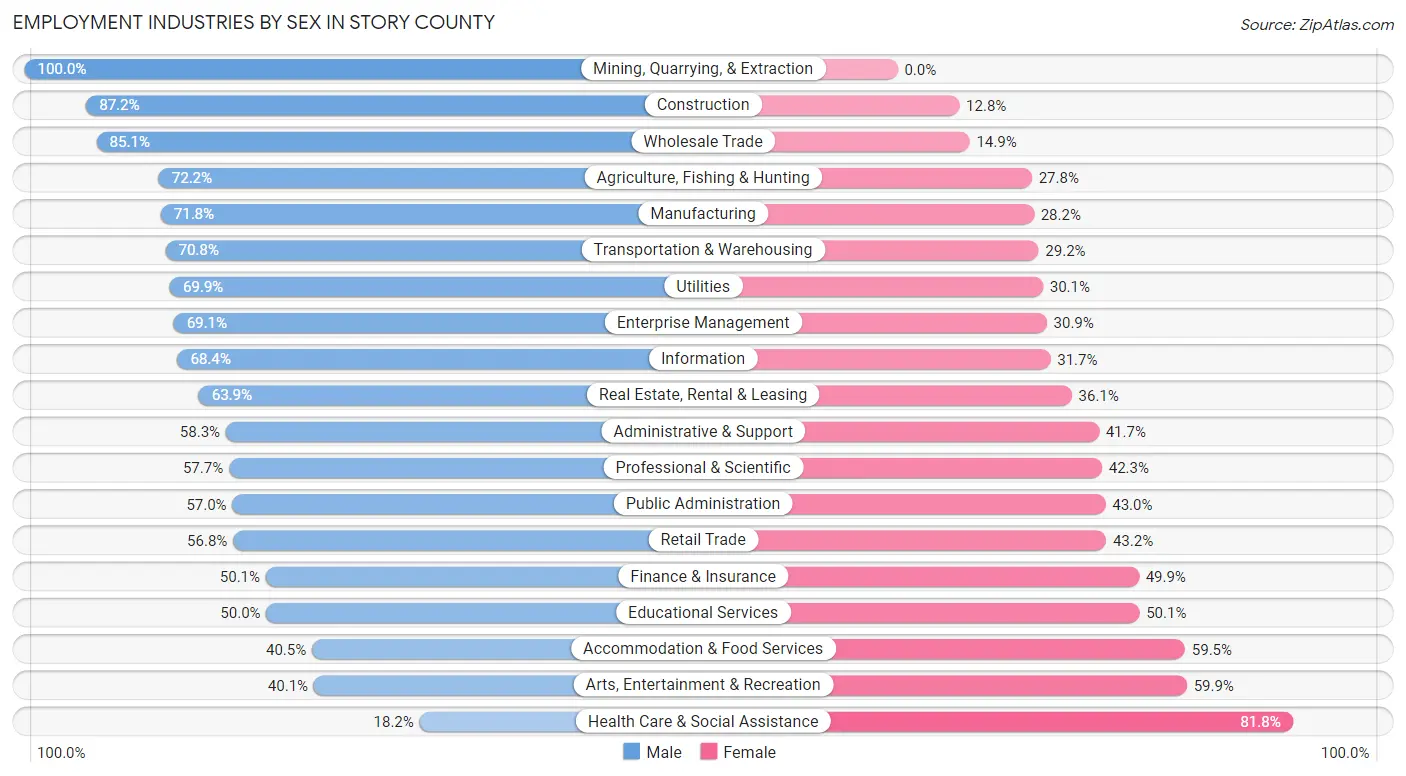
Employment Industries by Sex in Story County
The Story County industries that see more men than women are Mining, Quarrying, & Extraction (100.0%), Construction (87.2%), and Wholesale Trade (85.1%), whereas the industries that tend to have a higher number of women are Health Care & Social Assistance (81.8%), Arts, Entertainment & Recreation (59.9%), and Accommodation & Food Services (59.5%).
| Industry | Male | Female |
| Agriculture, Fishing & Hunting | 917 (72.2%) | 353 (27.8%) |
| Mining, Quarrying, & Extraction | 84 (100.0%) | 0 (0.0%) |
| Construction | 2,280 (87.2%) | 334 (12.8%) |
| Manufacturing | 3,690 (71.8%) | 1,450 (28.2%) |
| Wholesale Trade | 992 (85.1%) | 174 (14.9%) |
| Retail Trade | 3,152 (56.8%) | 2,394 (43.2%) |
| Transportation & Warehousing | 1,102 (70.8%) | 454 (29.2%) |
| Utilities | 230 (69.9%) | 99 (30.1%) |
| Information | 514 (68.3%) | 238 (31.7%) |
| Finance & Insurance | 874 (50.1%) | 872 (49.9%) |
| Real Estate, Rental & Leasing | 562 (63.9%) | 317 (36.1%) |
| Professional & Scientific | 1,867 (57.7%) | 1,369 (42.3%) |
| Enterprise Management | 47 (69.1%) | 21 (30.9%) |
| Administrative & Support | 669 (58.3%) | 478 (41.7%) |
| Educational Services | 6,528 (49.9%) | 6,542 (50.0%) |
| Health Care & Social Assistance | 1,060 (18.2%) | 4,750 (81.8%) |
| Arts, Entertainment & Recreation | 390 (40.1%) | 582 (59.9%) |
| Accommodation & Food Services | 1,654 (40.5%) | 2,430 (59.5%) |
| Public Administration | 1,224 (57.0%) | 924 (43.0%) |
| Total | 28,708 (53.9%) | 24,551 (46.1%) |
Education in Story County
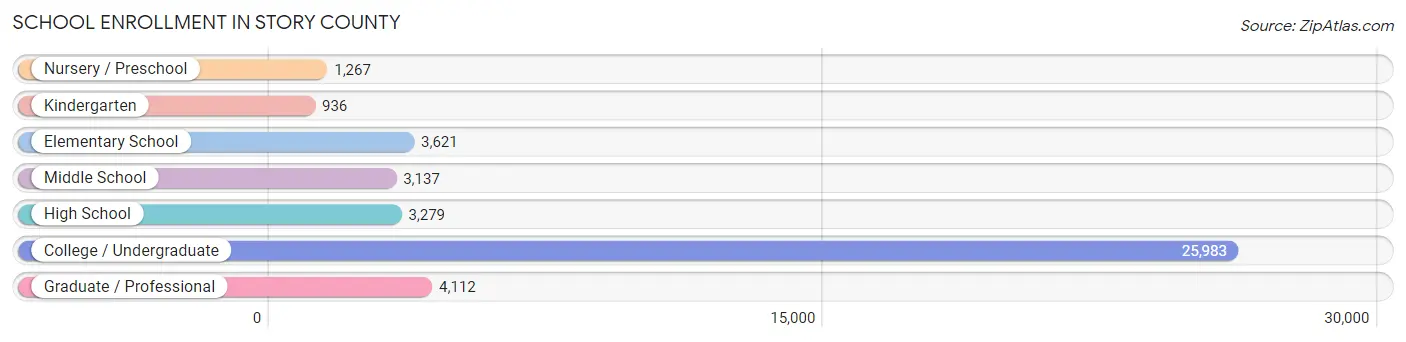
School Enrollment in Story County
The most common levels of schooling among the 42,335 students in Story County are college / undergraduate (25,983 | 61.4%), graduate / professional (4,112 | 9.7%), and elementary school (3,621 | 8.6%).
| School Level | # Students | % Students |
| Nursery / Preschool | 1,267 | 3.0% |
| Kindergarten | 936 | 2.2% |
| Elementary School | 3,621 | 8.6% |
| Middle School | 3,137 | 7.4% |
| High School | 3,279 | 7.7% |
| College / Undergraduate | 25,983 | 61.4% |
| Graduate / Professional | 4,112 | 9.7% |
| Total | 42,335 | 100.0% |
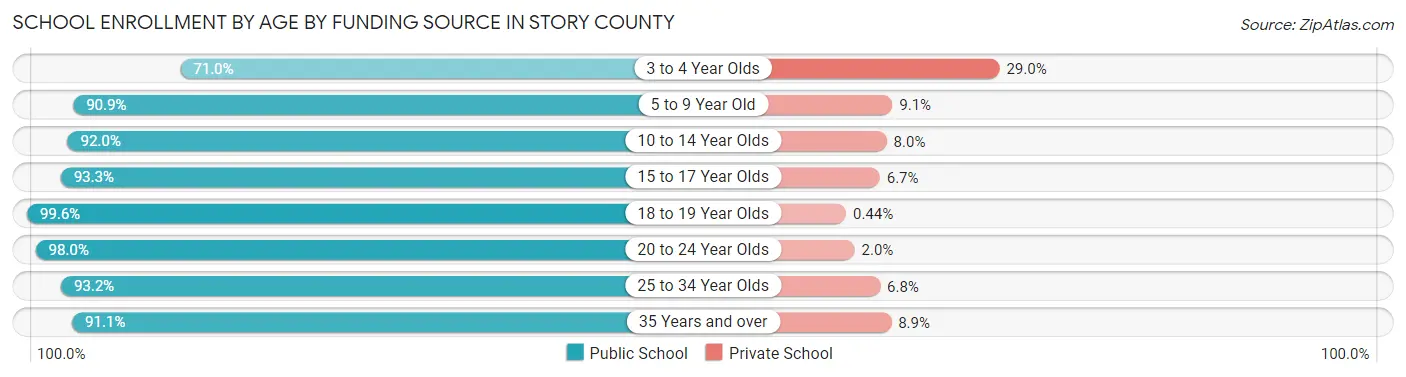
School Enrollment by Age by Funding Source in Story County
Out of a total of 42,335 students who are enrolled in schools in Story County, 1,778 (4.2%) attend a private institution, while the remaining 40,557 (95.8%) are enrolled in public schools. The age group of 3 to 4 year olds has the highest likelihood of being enrolled in private schools, with 175 (29.0% in the age bracket) enrolled. Conversely, the age group of 18 to 19 year olds has the lowest likelihood of being enrolled in a private school, with 9,095 (99.6% in the age bracket) attending a public institution.
| Age Bracket | Public School | Private School |
| 3 to 4 Year Olds | 428 (71.0%) | 175 (29.0%) |
| 5 to 9 Year Old | 4,298 (90.9%) | 428 (9.1%) |
| 10 to 14 Year Olds | 3,708 (92.0%) | 323 (8.0%) |
| 15 to 17 Year Olds | 2,368 (93.3%) | 171 (6.7%) |
| 18 to 19 Year Olds | 9,095 (99.6%) | 40 (0.4%) |
| 20 to 24 Year Olds | 16,633 (98.0%) | 347 (2.0%) |
| 25 to 34 Year Olds | 3,092 (93.2%) | 225 (6.8%) |
| 35 Years and over | 915 (91.1%) | 89 (8.9%) |
| Total | 40,557 (95.8%) | 1,778 (4.2%) |
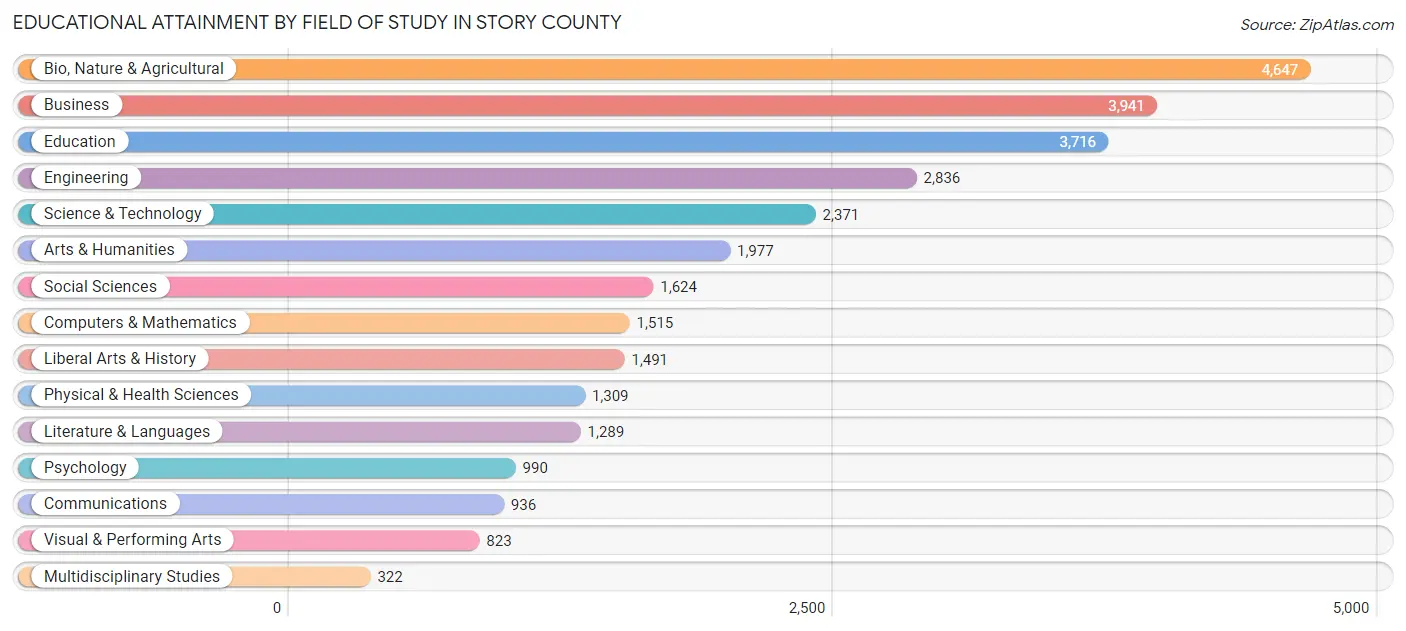
Educational Attainment by Field of Study in Story County
Bio, nature & agricultural (4,647 | 15.6%), business (3,941 | 13.2%), education (3,716 | 12.5%), engineering (2,836 | 9.5%), and science & technology (2,371 | 8.0%) are the most common fields of study among 29,787 individuals in Story County who have obtained a bachelor's degree or higher.
| Field of Study | # Graduates | % Graduates |
| Computers & Mathematics | 1,515 | 5.1% |
| Bio, Nature & Agricultural | 4,647 | 15.6% |
| Physical & Health Sciences | 1,309 | 4.4% |
| Psychology | 990 | 3.3% |
| Social Sciences | 1,624 | 5.4% |
| Engineering | 2,836 | 9.5% |
| Multidisciplinary Studies | 322 | 1.1% |
| Science & Technology | 2,371 | 8.0% |
| Business | 3,941 | 13.2% |
| Education | 3,716 | 12.5% |
| Literature & Languages | 1,289 | 4.3% |
| Liberal Arts & History | 1,491 | 5.0% |
| Visual & Performing Arts | 823 | 2.8% |
| Communications | 936 | 3.1% |
| Arts & Humanities | 1,977 | 6.6% |
| Total | 29,787 | 100.0% |
Transportation & Commute in Story County
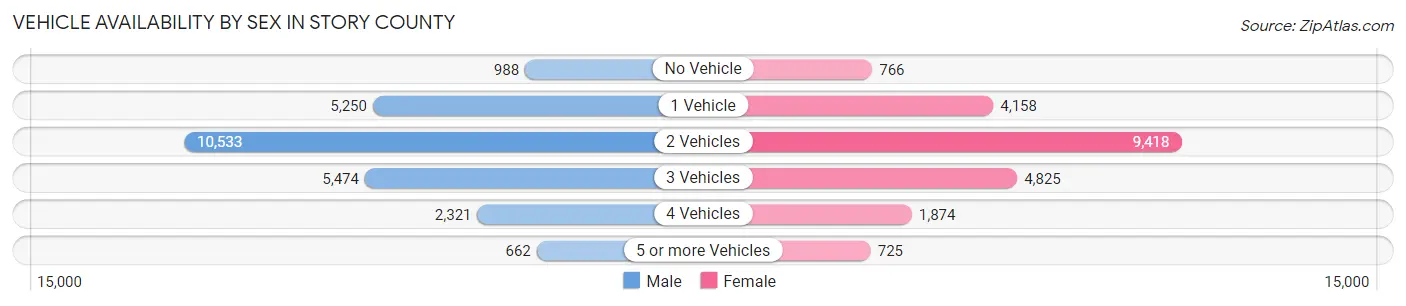
Vehicle Availability by Sex in Story County
The most prevalent vehicle ownership categories in Story County are males with 2 vehicles (10,533, accounting for 41.7%) and females with 2 vehicles (9,418, making up 48.4%).
| Vehicles Available | Male | Female |
| No Vehicle | 988 (3.9%) | 766 (3.5%) |
| 1 Vehicle | 5,250 (20.8%) | 4,158 (19.1%) |
| 2 Vehicles | 10,533 (41.7%) | 9,418 (43.3%) |
| 3 Vehicles | 5,474 (21.7%) | 4,825 (22.2%) |
| 4 Vehicles | 2,321 (9.2%) | 1,874 (8.6%) |
| 5 or more Vehicles | 662 (2.6%) | 725 (3.3%) |
| Total | 25,228 (100.0%) | 21,766 (100.0%) |
Commute Time in Story County
The most frequently occuring commute durations in Story County are 10 to 14 minutes (11,227 commuters, 24.3%), 15 to 19 minutes (8,782 commuters, 19.0%), and 5 to 9 minutes (8,579 commuters, 18.5%).
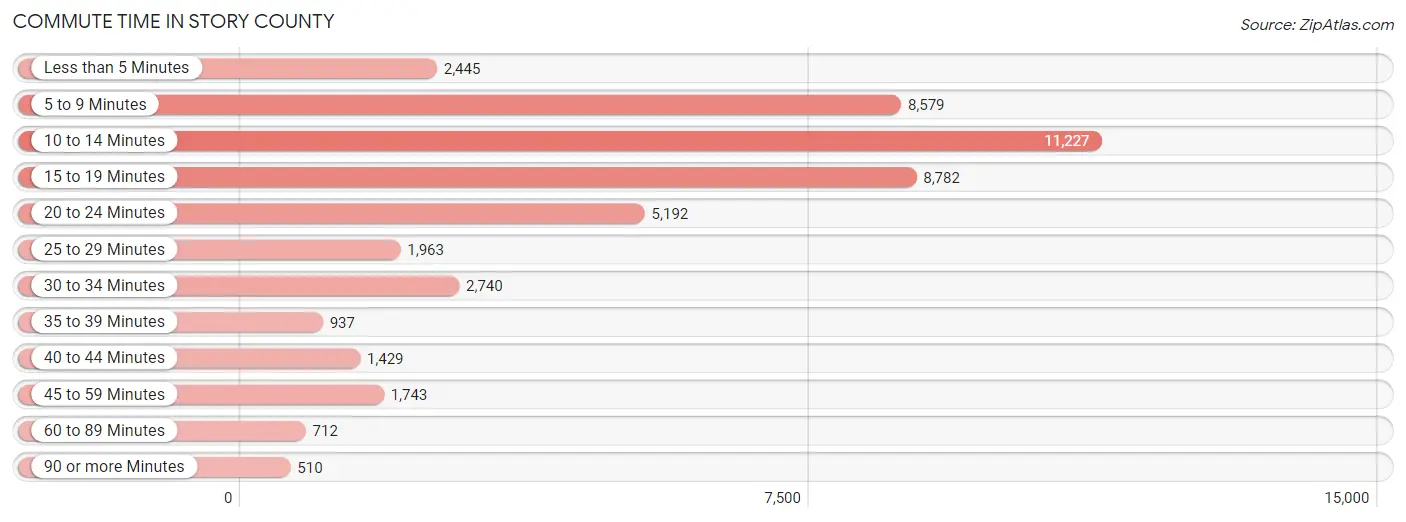
| Commute Time | # Commuters | % Commuters |
| Less than 5 Minutes | 2,445 | 5.3% |
| 5 to 9 Minutes | 8,579 | 18.5% |
| 10 to 14 Minutes | 11,227 | 24.3% |
| 15 to 19 Minutes | 8,782 | 19.0% |
| 20 to 24 Minutes | 5,192 | 11.2% |
| 25 to 29 Minutes | 1,963 | 4.2% |
| 30 to 34 Minutes | 2,740 | 5.9% |
| 35 to 39 Minutes | 937 | 2.0% |
| 40 to 44 Minutes | 1,429 | 3.1% |
| 45 to 59 Minutes | 1,743 | 3.8% |
| 60 to 89 Minutes | 712 | 1.5% |
| 90 or more Minutes | 510 | 1.1% |
Commute Time by Sex in Story County
The most common commute times in Story County are 10 to 14 minutes (6,702 commuters, 27.0%) for males and 10 to 14 minutes (4,525 commuters, 21.1%) for females.
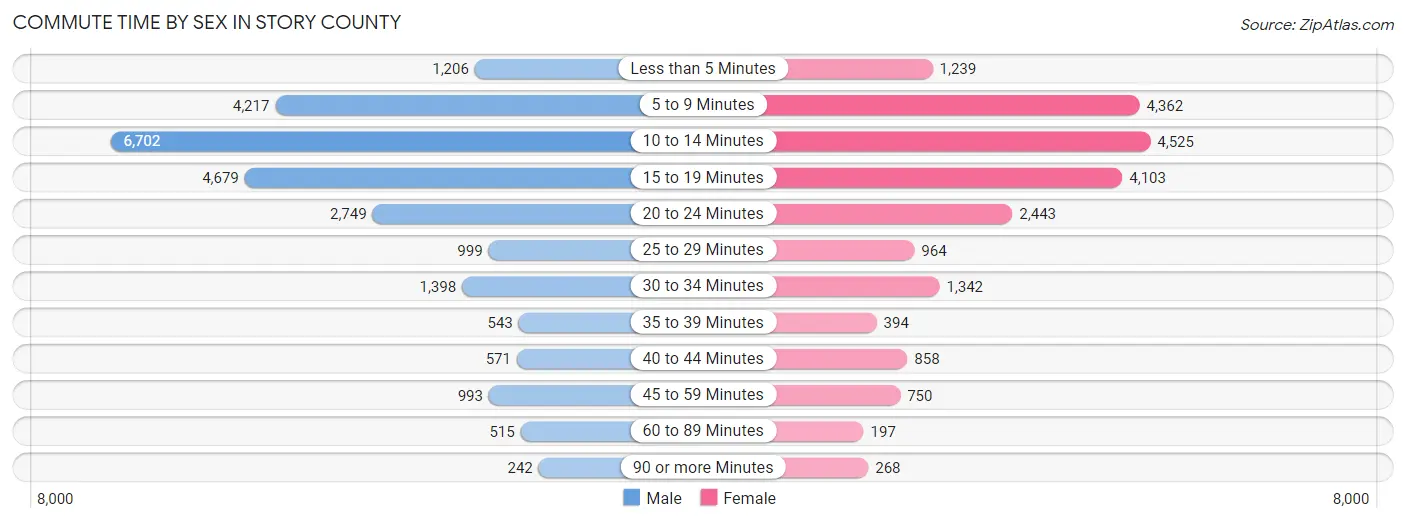
| Commute Time | Male | Female |
| Less than 5 Minutes | 1,206 (4.9%) | 1,239 (5.8%) |
| 5 to 9 Minutes | 4,217 (17.0%) | 4,362 (20.3%) |
| 10 to 14 Minutes | 6,702 (27.0%) | 4,525 (21.1%) |
| 15 to 19 Minutes | 4,679 (18.9%) | 4,103 (19.1%) |
| 20 to 24 Minutes | 2,749 (11.1%) | 2,443 (11.4%) |
| 25 to 29 Minutes | 999 (4.0%) | 964 (4.5%) |
| 30 to 34 Minutes | 1,398 (5.6%) | 1,342 (6.3%) |
| 35 to 39 Minutes | 543 (2.2%) | 394 (1.8%) |
| 40 to 44 Minutes | 571 (2.3%) | 858 (4.0%) |
| 45 to 59 Minutes | 993 (4.0%) | 750 (3.5%) |
| 60 to 89 Minutes | 515 (2.1%) | 197 (0.9%) |
| 90 or more Minutes | 242 (1.0%) | 268 (1.3%) |
Time of Departure to Work by Sex in Story County
The most frequent times of departure to work in Story County are 7:30 AM to 7:59 AM (4,007, 16.2%) for males and 7:30 AM to 7:59 AM (3,526, 16.4%) for females.
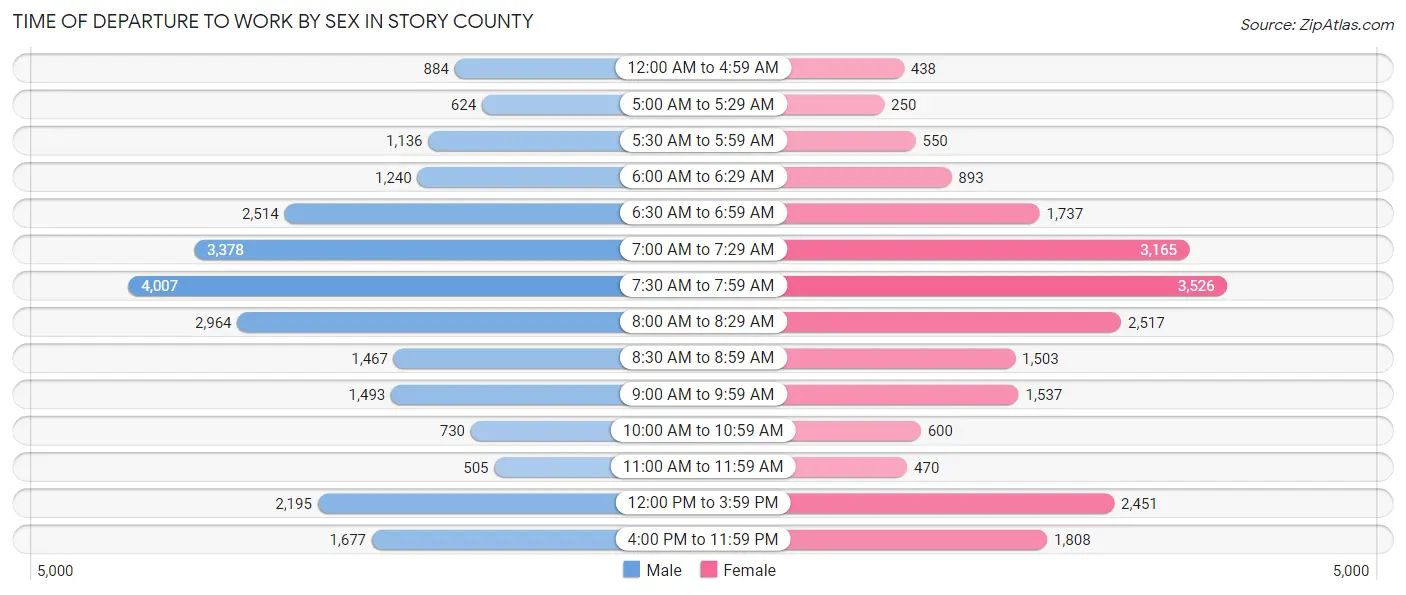
| Time of Departure | Male | Female |
| 12:00 AM to 4:59 AM | 884 (3.6%) | 438 (2.0%) |
| 5:00 AM to 5:29 AM | 624 (2.5%) | 250 (1.2%) |
| 5:30 AM to 5:59 AM | 1,136 (4.6%) | 550 (2.6%) |
| 6:00 AM to 6:29 AM | 1,240 (5.0%) | 893 (4.2%) |
| 6:30 AM to 6:59 AM | 2,514 (10.1%) | 1,737 (8.1%) |
| 7:00 AM to 7:29 AM | 3,378 (13.6%) | 3,165 (14.8%) |
| 7:30 AM to 7:59 AM | 4,007 (16.2%) | 3,526 (16.4%) |
| 8:00 AM to 8:29 AM | 2,964 (11.9%) | 2,517 (11.7%) |
| 8:30 AM to 8:59 AM | 1,467 (5.9%) | 1,503 (7.0%) |
| 9:00 AM to 9:59 AM | 1,493 (6.0%) | 1,537 (7.2%) |
| 10:00 AM to 10:59 AM | 730 (2.9%) | 600 (2.8%) |
| 11:00 AM to 11:59 AM | 505 (2.0%) | 470 (2.2%) |
| 12:00 PM to 3:59 PM | 2,195 (8.8%) | 2,451 (11.4%) |
| 4:00 PM to 11:59 PM | 1,677 (6.8%) | 1,808 (8.4%) |
| Total | 24,814 (100.0%) | 21,445 (100.0%) |
Housing Occupancy in Story County
Occupancy by Ownership in Story County
Of the total 38,412 dwellings in Story County, owner-occupied units account for 21,395 (55.7%), while renter-occupied units make up 17,017 (44.3%).
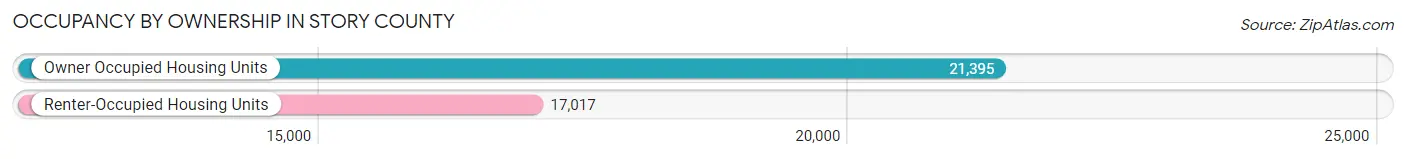
| Occupancy | # Housing Units | % Housing Units |
| Owner Occupied Housing Units | 21,395 | 55.7% |
| Renter-Occupied Housing Units | 17,017 | 44.3% |
| Total Occupied Housing Units | 38,412 | 100.0% |
Occupancy by Household Size in Story County
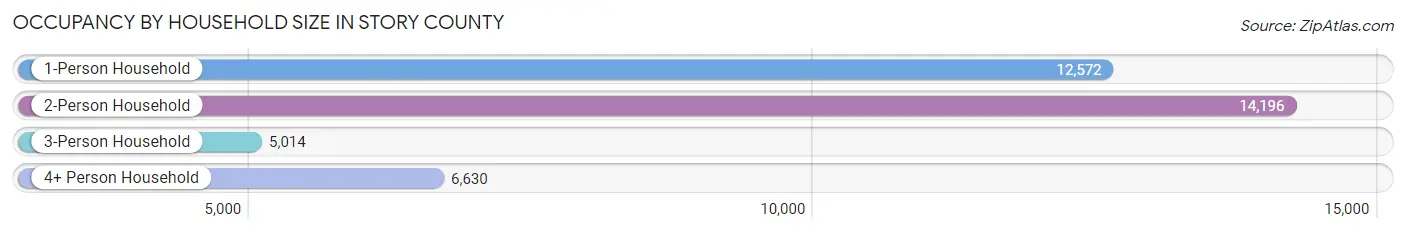
| Household Size | # Housing Units | % Housing Units |
| 1-Person Household | 12,572 | 32.7% |
| 2-Person Household | 14,196 | 37.0% |
| 3-Person Household | 5,014 | 13.1% |
| 4+ Person Household | 6,630 | 17.3% |
| Total Housing Units | 38,412 | 100.0% |
Occupancy by Ownership by Household Size in Story County
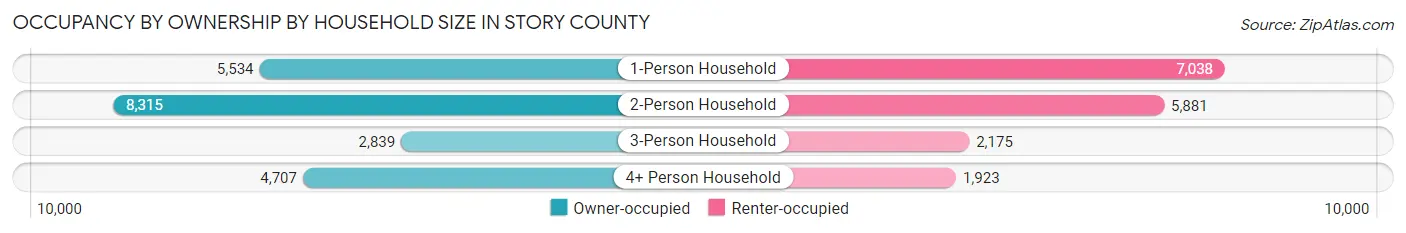
| Household Size | Owner-occupied | Renter-occupied |
| 1-Person Household | 5,534 (44.0%) | 7,038 (56.0%) |
| 2-Person Household | 8,315 (58.6%) | 5,881 (41.4%) |
| 3-Person Household | 2,839 (56.6%) | 2,175 (43.4%) |
| 4+ Person Household | 4,707 (71.0%) | 1,923 (29.0%) |
| Total Housing Units | 21,395 (55.7%) | 17,017 (44.3%) |
Occupancy by Educational Attainment in Story County
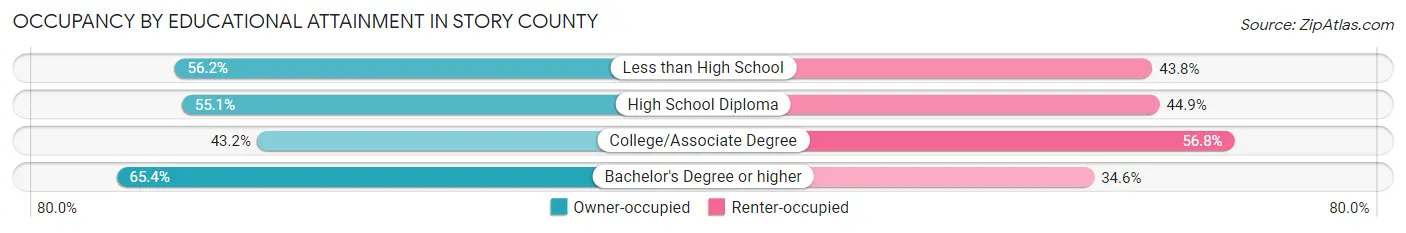
| Household Size | Owner-occupied | Renter-occupied |
| Less than High School | 313 (56.2%) | 244 (43.8%) |
| High School Diploma | 3,138 (55.1%) | 2,561 (44.9%) |
| College/Associate Degree | 6,000 (43.2%) | 7,896 (56.8%) |
| Bachelor's Degree or higher | 11,944 (65.4%) | 6,316 (34.6%) |
Occupancy by Age of Householder in Story County
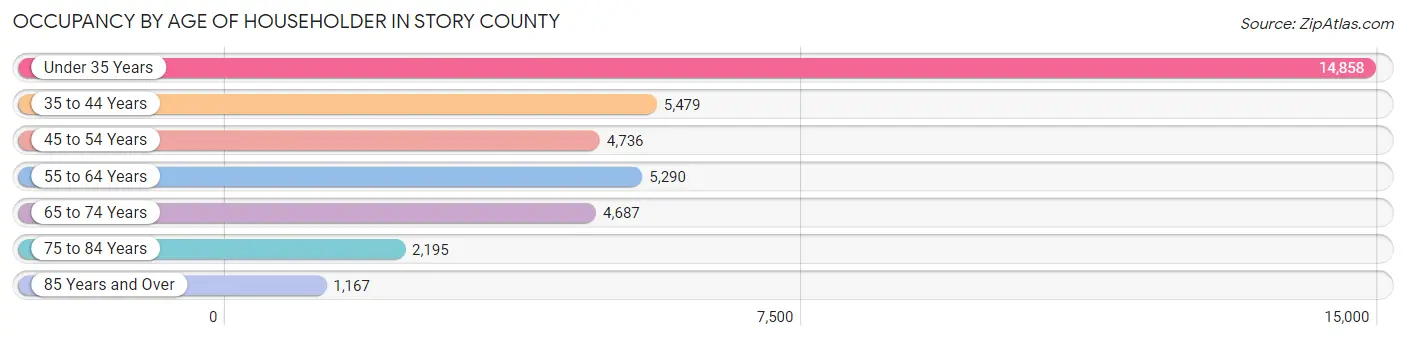
| Age Bracket | # Households | % Households |
| Under 35 Years | 14,858 | 38.7% |
| 35 to 44 Years | 5,479 | 14.3% |
| 45 to 54 Years | 4,736 | 12.3% |
| 55 to 64 Years | 5,290 | 13.8% |
| 65 to 74 Years | 4,687 | 12.2% |
| 75 to 84 Years | 2,195 | 5.7% |
| 85 Years and Over | 1,167 | 3.0% |
| Total | 38,412 | 100.0% |
Housing Finances in Story County
Median Income by Occupancy in Story County
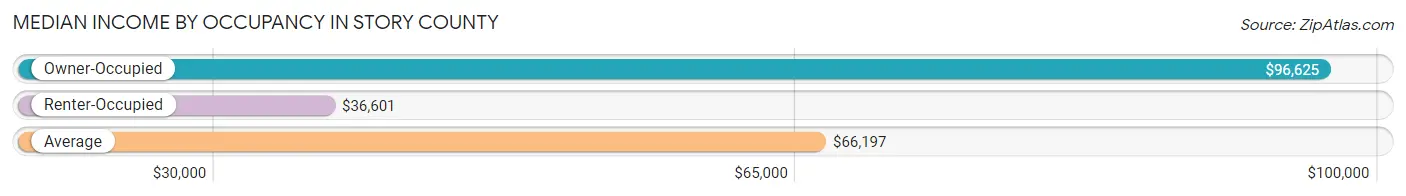
| Occupancy Type | # Households | Median Income |
| Owner-Occupied | 21,395 (55.7%) | $96,625 |
| Renter-Occupied | 17,017 (44.3%) | $36,601 |
| Average | 38,412 (100.0%) | $66,197 |
Occupancy by Householder Income Bracket in Story County
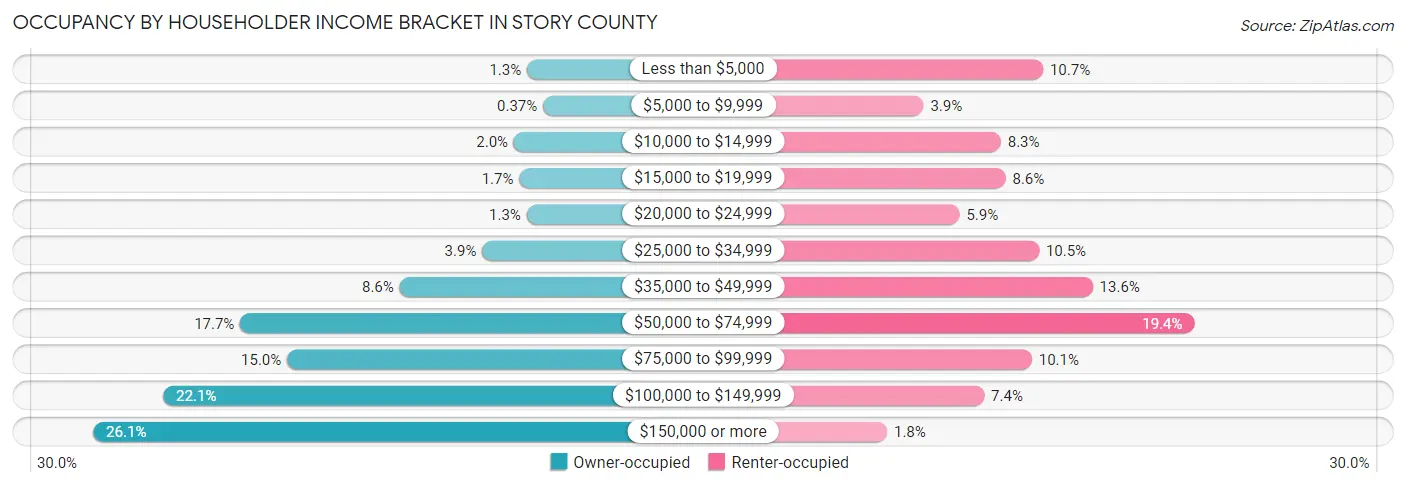
| Income Bracket | Owner-occupied | Renter-occupied |
| Less than $5,000 | 275 (1.3%) | 1,822 (10.7%) |
| $5,000 to $9,999 | 79 (0.4%) | 661 (3.9%) |
| $10,000 to $14,999 | 436 (2.0%) | 1,413 (8.3%) |
| $15,000 to $19,999 | 371 (1.7%) | 1,458 (8.6%) |
| $20,000 to $24,999 | 281 (1.3%) | 1,011 (5.9%) |
| $25,000 to $34,999 | 823 (3.8%) | 1,783 (10.5%) |
| $35,000 to $49,999 | 1,833 (8.6%) | 2,305 (13.6%) |
| $50,000 to $74,999 | 3,783 (17.7%) | 3,294 (19.4%) |
| $75,000 to $99,999 | 3,210 (15.0%) | 1,714 (10.1%) |
| $100,000 to $149,999 | 4,724 (22.1%) | 1,250 (7.3%) |
| $150,000 or more | 5,580 (26.1%) | 306 (1.8%) |
| Total | 21,395 (100.0%) | 17,017 (100.0%) |
Monthly Housing Cost Tiers in Story County
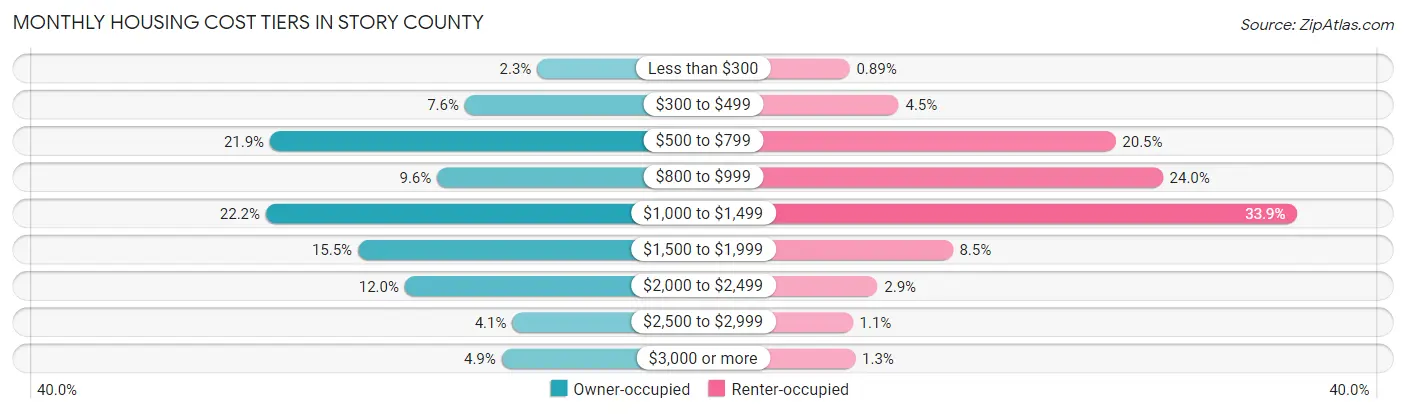
| Monthly Cost | Owner-occupied | Renter-occupied |
| Less than $300 | 482 (2.2%) | 152 (0.9%) |
| $300 to $499 | 1,621 (7.6%) | 765 (4.5%) |
| $500 to $799 | 4,691 (21.9%) | 3,483 (20.5%) |
| $800 to $999 | 2,058 (9.6%) | 4,075 (23.9%) |
| $1,000 to $1,499 | 4,756 (22.2%) | 5,763 (33.9%) |
| $1,500 to $1,999 | 3,305 (15.4%) | 1,442 (8.5%) |
| $2,000 to $2,499 | 2,568 (12.0%) | 500 (2.9%) |
| $2,500 to $2,999 | 872 (4.1%) | 191 (1.1%) |
| $3,000 or more | 1,042 (4.9%) | 222 (1.3%) |
| Total | 21,395 (100.0%) | 17,017 (100.0%) |
Physical Housing Characteristics in Story County
Housing Structures in Story County
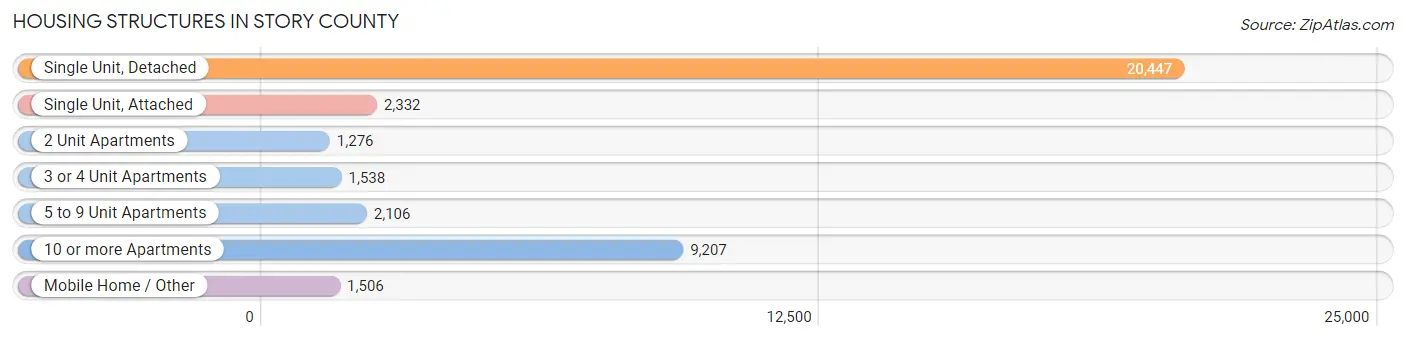
| Structure Type | # Housing Units | % Housing Units |
| Single Unit, Detached | 20,447 | 53.2% |
| Single Unit, Attached | 2,332 | 6.1% |
| 2 Unit Apartments | 1,276 | 3.3% |
| 3 or 4 Unit Apartments | 1,538 | 4.0% |
| 5 to 9 Unit Apartments | 2,106 | 5.5% |
| 10 or more Apartments | 9,207 | 24.0% |
| Mobile Home / Other | 1,506 | 3.9% |
| Total | 38,412 | 100.0% |
Housing Structures by Occupancy in Story County
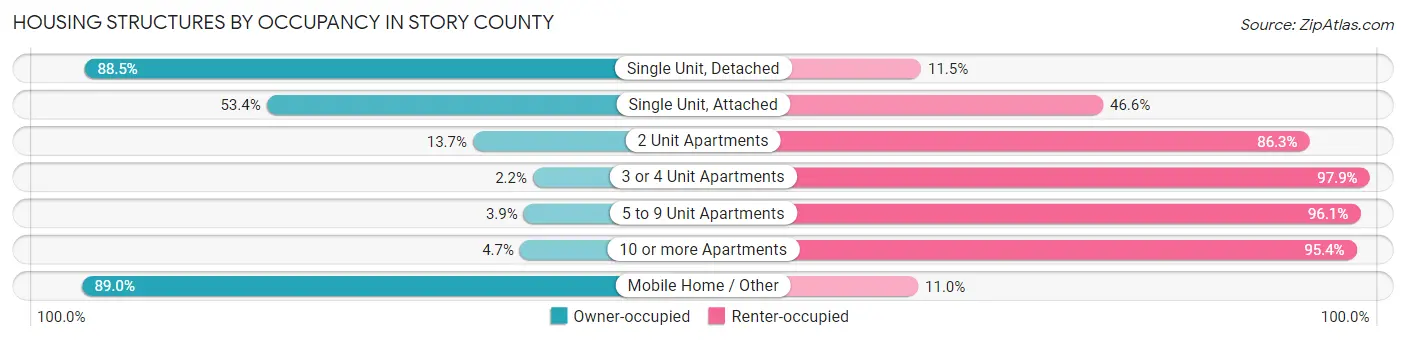
| Structure Type | Owner-occupied | Renter-occupied |
| Single Unit, Detached | 18,089 (88.5%) | 2,358 (11.5%) |
| Single Unit, Attached | 1,246 (53.4%) | 1,086 (46.6%) |
| 2 Unit Apartments | 175 (13.7%) | 1,101 (86.3%) |
| 3 or 4 Unit Apartments | 33 (2.1%) | 1,505 (97.9%) |
| 5 to 9 Unit Apartments | 83 (3.9%) | 2,023 (96.1%) |
| 10 or more Apartments | 428 (4.6%) | 8,779 (95.4%) |
| Mobile Home / Other | 1,341 (89.0%) | 165 (11.0%) |
| Total | 21,395 (55.7%) | 17,017 (44.3%) |
Housing Structures by Number of Rooms in Story County
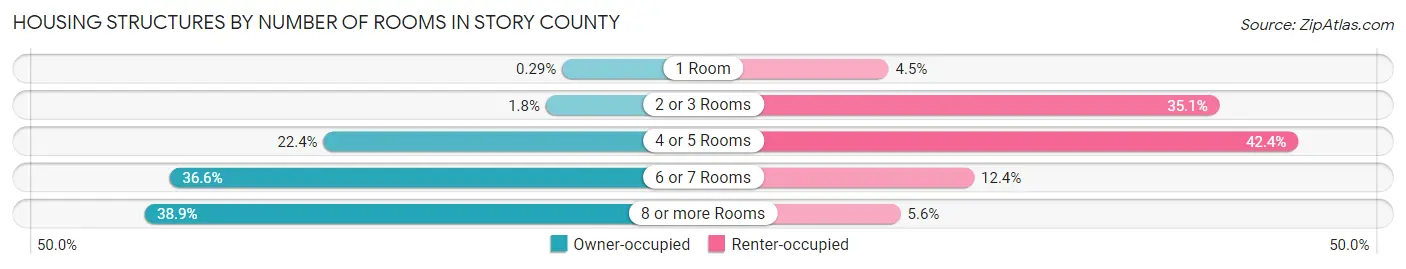
| Number of Rooms | Owner-occupied | Renter-occupied |
| 1 Room | 62 (0.3%) | 766 (4.5%) |
| 2 or 3 Rooms | 386 (1.8%) | 5,973 (35.1%) |
| 4 or 5 Rooms | 4,783 (22.4%) | 7,212 (42.4%) |
| 6 or 7 Rooms | 7,832 (36.6%) | 2,111 (12.4%) |
| 8 or more Rooms | 8,332 (38.9%) | 955 (5.6%) |
| Total | 21,395 (100.0%) | 17,017 (100.0%) |
Housing Structure by Heating Type in Story County
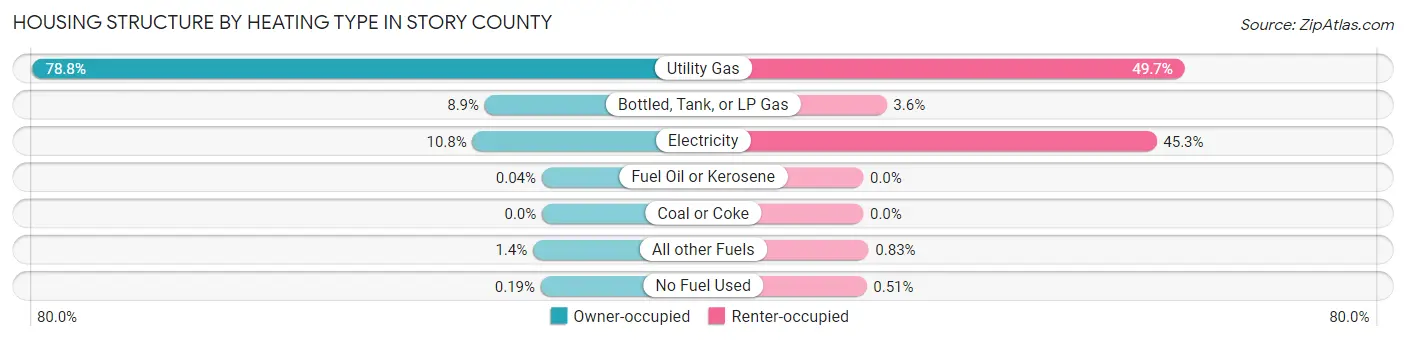
| Heating Type | Owner-occupied | Renter-occupied |
| Utility Gas | 16,851 (78.8%) | 8,459 (49.7%) |
| Bottled, Tank, or LP Gas | 1,894 (8.8%) | 614 (3.6%) |
| Electricity | 2,301 (10.7%) | 7,715 (45.3%) |
| Fuel Oil or Kerosene | 9 (0.0%) | 0 (0.0%) |
| Coal or Coke | 0 (0.0%) | 0 (0.0%) |
| All other Fuels | 299 (1.4%) | 142 (0.8%) |
| No Fuel Used | 41 (0.2%) | 87 (0.5%) |
| Total | 21,395 (100.0%) | 17,017 (100.0%) |
Household Vehicle Usage in Story County
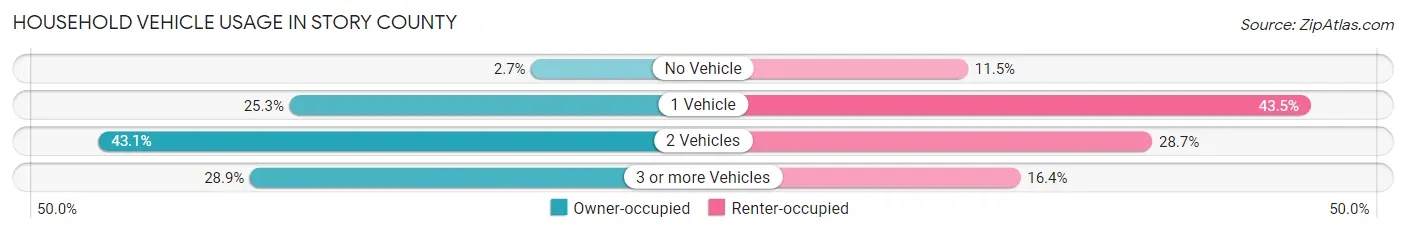
| Vehicles per Household | Owner-occupied | Renter-occupied |
| No Vehicle | 576 (2.7%) | 1,954 (11.5%) |
| 1 Vehicle | 5,402 (25.3%) | 7,400 (43.5%) |
| 2 Vehicles | 9,226 (43.1%) | 4,878 (28.7%) |
| 3 or more Vehicles | 6,191 (28.9%) | 2,785 (16.4%) |
| Total | 21,395 (100.0%) | 17,017 (100.0%) |
Real Estate & Mortgages in Story County
Real Estate and Mortgage Overview in Story County
| Characteristic | Without Mortgage | With Mortgage |
| Housing Units | 8,819 | 12,576 |
| Median Property Value | $215,600 | $237,500 |
| Median Household Income | $75,175 | $3,823 |
| Monthly Housing Costs | $649 | $1,033 |
| Real Estate Taxes | $3,259 | $256 |
Property Value by Mortgage Status in Story County
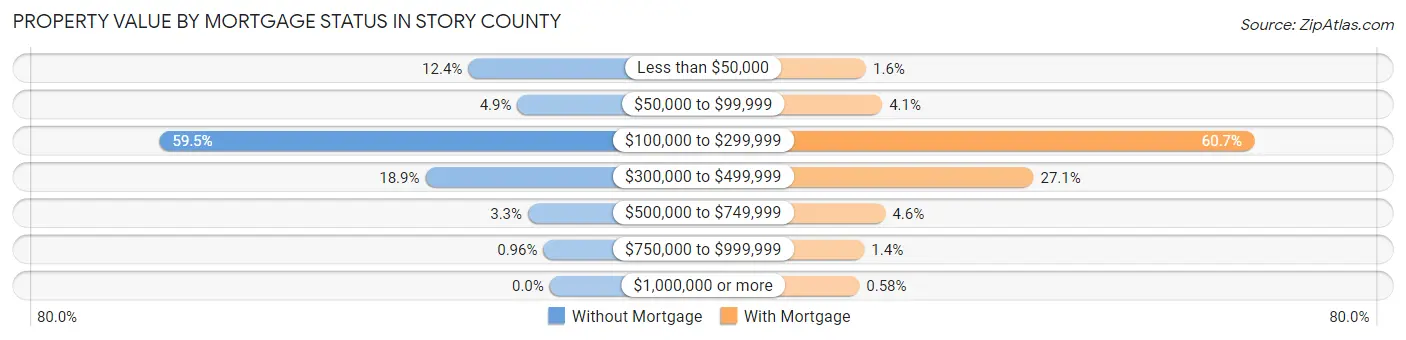
| Property Value | Without Mortgage | With Mortgage |
| Less than $50,000 | 1,094 (12.4%) | 203 (1.6%) |
| $50,000 to $99,999 | 434 (4.9%) | 512 (4.1%) |
| $100,000 to $299,999 | 5,244 (59.5%) | 7,632 (60.7%) |
| $300,000 to $499,999 | 1,670 (18.9%) | 3,412 (27.1%) |
| $500,000 to $749,999 | 292 (3.3%) | 574 (4.6%) |
| $750,000 to $999,999 | 85 (1.0%) | 170 (1.3%) |
| $1,000,000 or more | 0 (0.0%) | 73 (0.6%) |
| Total | 8,819 (100.0%) | 12,576 (100.0%) |
Household Income by Mortgage Status in Story County
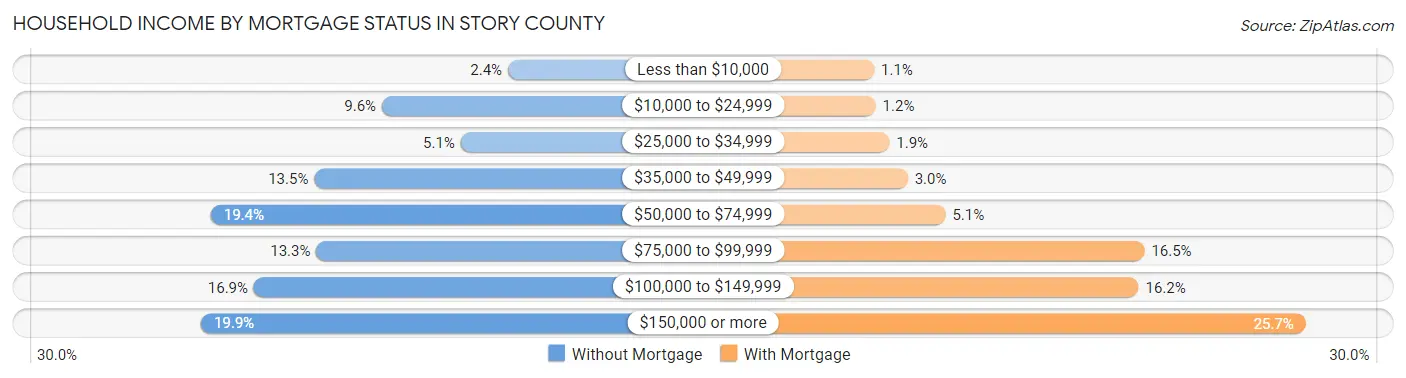
| Household Income | Without Mortgage | With Mortgage |
| Less than $10,000 | 210 (2.4%) | 133 (1.1%) |
| $10,000 to $24,999 | 845 (9.6%) | 144 (1.1%) |
| $25,000 to $34,999 | 448 (5.1%) | 243 (1.9%) |
| $35,000 to $49,999 | 1,186 (13.5%) | 375 (3.0%) |
| $50,000 to $74,999 | 1,707 (19.4%) | 647 (5.1%) |
| $75,000 to $99,999 | 1,176 (13.3%) | 2,076 (16.5%) |
| $100,000 to $149,999 | 1,490 (16.9%) | 2,034 (16.2%) |
| $150,000 or more | 1,757 (19.9%) | 3,234 (25.7%) |
| Total | 8,819 (100.0%) | 12,576 (100.0%) |
Property Value to Household Income Ratio in Story County
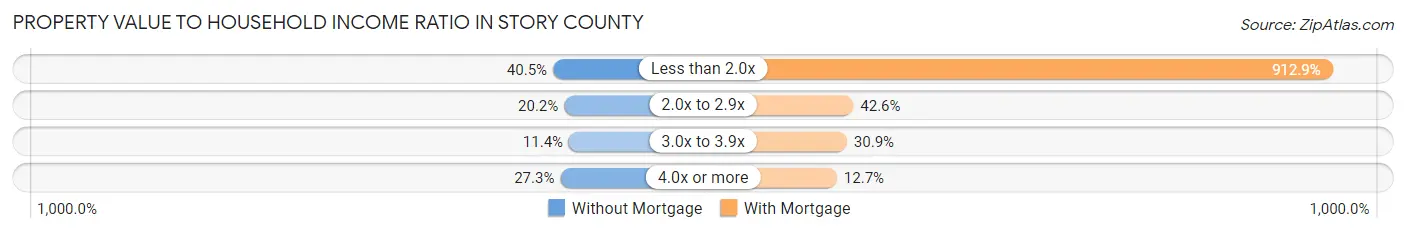
| Value-to-Income Ratio | Without Mortgage | With Mortgage |
| Less than 2.0x | 3,574 (40.5%) | 114,800 (912.9%) |
| 2.0x to 2.9x | 1,779 (20.2%) | 5,356 (42.6%) |
| 3.0x to 3.9x | 1,008 (11.4%) | 3,885 (30.9%) |
| 4.0x or more | 2,405 (27.3%) | 1,594 (12.7%) |
| Total | 8,819 (100.0%) | 12,576 (100.0%) |
Real Estate Taxes by Mortgage Status in Story County
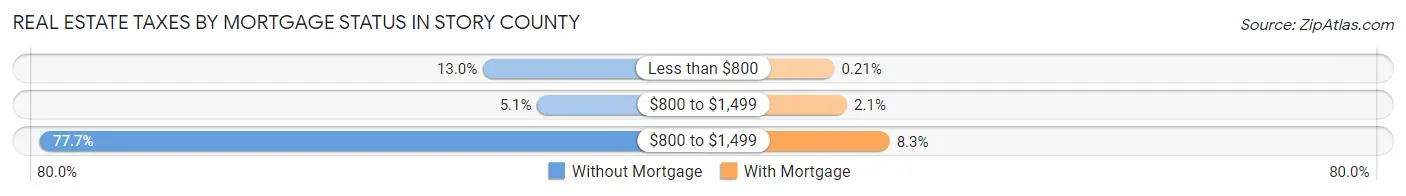
| Property Taxes | Without Mortgage | With Mortgage |
| Less than $800 | 1,148 (13.0%) | 27 (0.2%) |
| $800 to $1,499 | 448 (5.1%) | 259 (2.1%) |
| $800 to $1,499 | 6,854 (77.7%) | 1,041 (8.3%) |
| Total | 8,819 (100.0%) | 12,576 (100.0%) |
Health & Disability in Story County
Health Insurance Coverage by Age in Story County
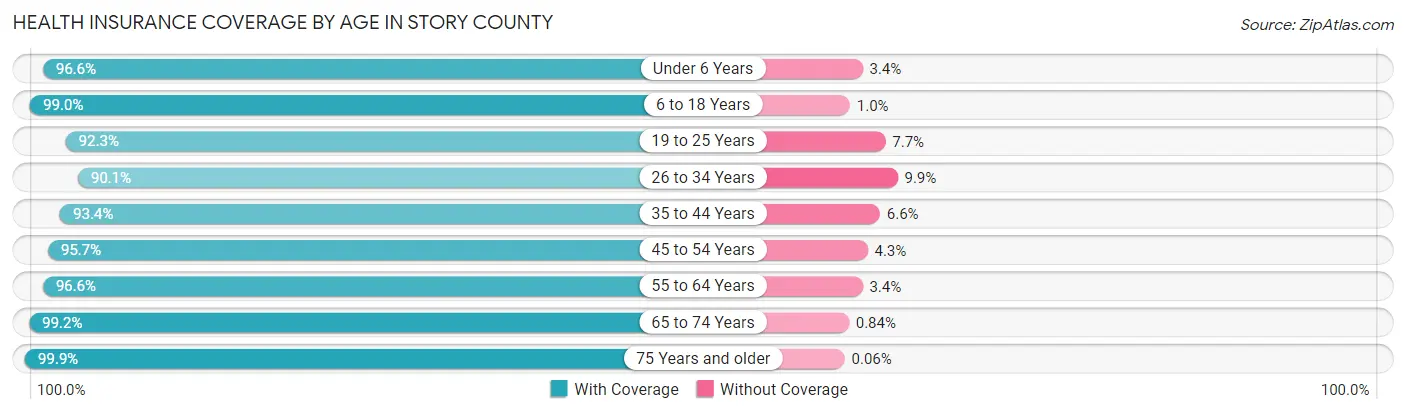
| Age Bracket | With Coverage | Without Coverage |
| Under 6 Years | 5,059 (96.6%) | 178 (3.4%) |
| 6 to 18 Years | 14,283 (99.0%) | 148 (1.0%) |
| 19 to 25 Years | 26,510 (92.3%) | 2,200 (7.7%) |
| 26 to 34 Years | 9,736 (90.1%) | 1,073 (9.9%) |
| 35 to 44 Years | 9,180 (93.4%) | 652 (6.6%) |
| 45 to 54 Years | 7,617 (95.7%) | 345 (4.3%) |
| 55 to 64 Years | 8,608 (96.6%) | 301 (3.4%) |
| 65 to 74 Years | 7,116 (99.2%) | 60 (0.8%) |
| 75 Years and older | 4,917 (99.9%) | 3 (0.1%) |
| Total | 93,026 (94.9%) | 4,960 (5.1%) |
Health Insurance Coverage by Citizenship Status in Story County
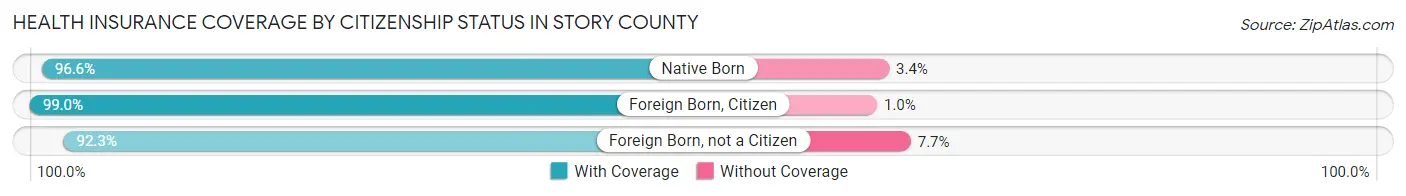
| Citizenship Status | With Coverage | Without Coverage |
| Native Born | 5,059 (96.6%) | 178 (3.4%) |
| Foreign Born, Citizen | 14,283 (99.0%) | 148 (1.0%) |
| Foreign Born, not a Citizen | 26,510 (92.3%) | 2,200 (7.7%) |
Health Insurance Coverage by Household Income in Story County
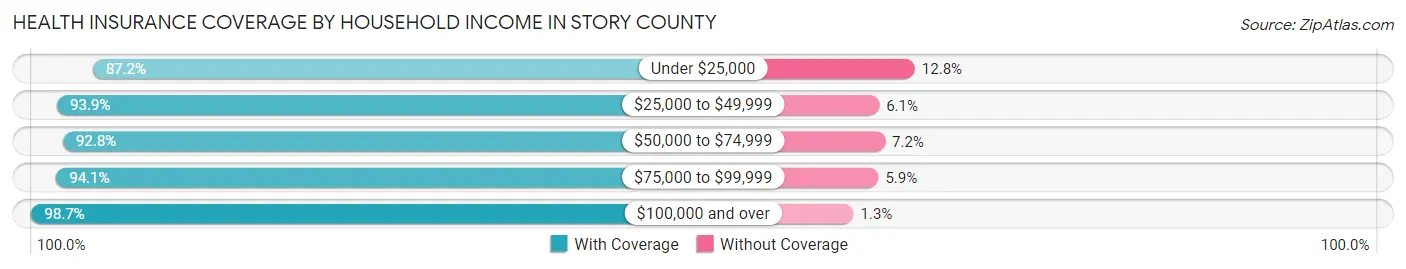
| Household Income | With Coverage | Without Coverage |
| Under $25,000 | 11,705 (87.2%) | 1,712 (12.8%) |
| $25,000 to $49,999 | 11,758 (93.9%) | 761 (6.1%) |
| $50,000 to $74,999 | 13,581 (92.8%) | 1,050 (7.2%) |
| $75,000 to $99,999 | 10,587 (94.1%) | 668 (5.9%) |
| $100,000 and over | 34,153 (98.7%) | 444 (1.3%) |
Public vs Private Health Insurance Coverage by Age in Story County

| Age Bracket | Public Insurance | Private Insurance |
| Under 6 | 1,393 (26.6%) | 3,870 (73.9%) |
| 6 to 18 Years | 2,435 (16.9%) | 12,360 (85.7%) |
| 19 to 25 Years | 1,527 (5.3%) | 25,257 (88.0%) |
| 25 to 34 Years | 1,315 (12.2%) | 8,637 (79.9%) |
| 35 to 44 Years | 740 (7.5%) | 8,730 (88.8%) |
| 45 to 54 Years | 731 (9.2%) | 7,011 (88.1%) |
| 55 to 64 Years | 1,199 (13.5%) | 7,714 (86.6%) |
| 65 to 74 Years | 6,761 (94.2%) | 5,350 (74.6%) |
| 75 Years and over | 4,866 (98.9%) | 3,762 (76.5%) |
| Total | 20,967 (21.4%) | 82,691 (84.4%) |
Disability Status by Sex by Age in Story County
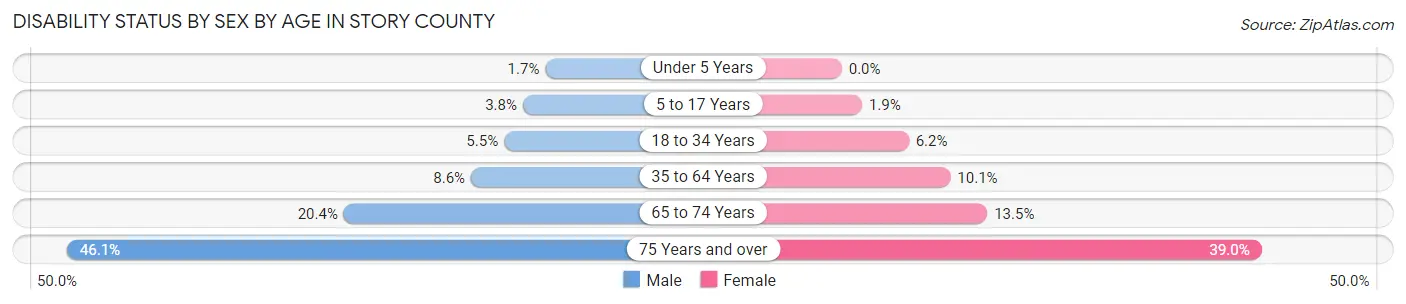
| Age Bracket | Male | Female |
| Under 5 Years | 35 (1.7%) | 0 (0.0%) |
| 5 to 17 Years | 223 (3.8%) | 106 (1.9%) |
| 18 to 34 Years | 1,333 (5.5%) | 1,195 (6.2%) |
| 35 to 64 Years | 1,177 (8.6%) | 1,309 (10.1%) |
| 65 to 74 Years | 706 (20.4%) | 501 (13.5%) |
| 75 Years and over | 949 (46.1%) | 1,114 (39.0%) |
Disability Class by Sex by Age in Story County
Disability Class: Hearing Difficulty
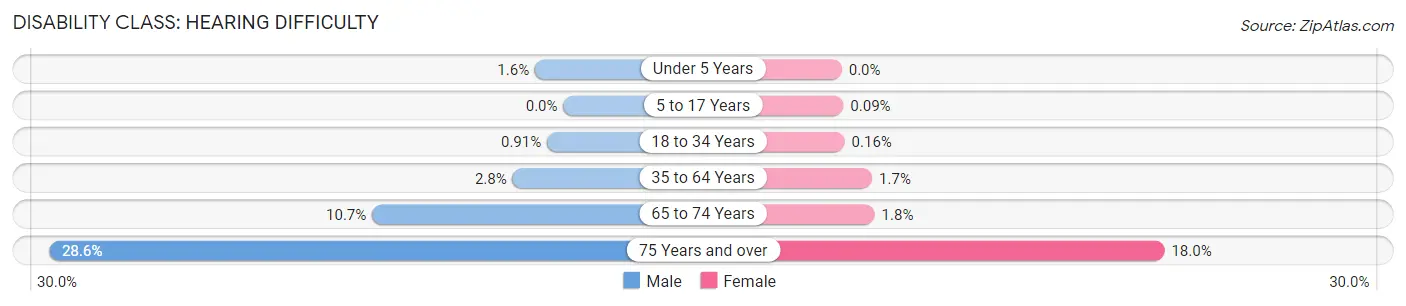
| Age Bracket | Male | Female |
| Under 5 Years | 33 (1.6%) | 0 (0.0%) |
| 5 to 17 Years | 0 (0.0%) | 5 (0.1%) |
| 18 to 34 Years | 220 (0.9%) | 30 (0.2%) |
| 35 to 64 Years | 389 (2.8%) | 219 (1.7%) |
| 65 to 74 Years | 369 (10.6%) | 68 (1.8%) |
| 75 Years and over | 590 (28.6%) | 514 (18.0%) |
Disability Class: Vision Difficulty
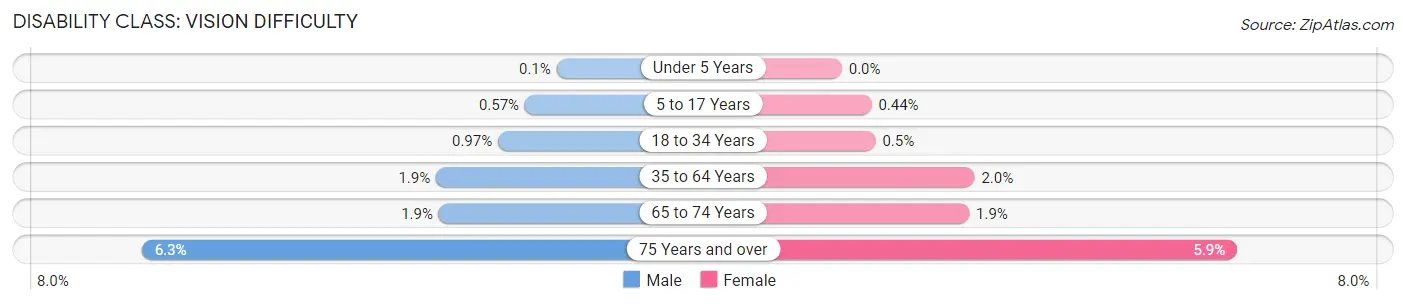
| Age Bracket | Male | Female |
| Under 5 Years | 2 (0.1%) | 0 (0.0%) |
| 5 to 17 Years | 34 (0.6%) | 25 (0.4%) |
| 18 to 34 Years | 234 (1.0%) | 97 (0.5%) |
| 35 to 64 Years | 260 (1.9%) | 256 (2.0%) |
| 65 to 74 Years | 64 (1.8%) | 70 (1.9%) |
| 75 Years and over | 129 (6.3%) | 168 (5.9%) |
Disability Class: Cognitive Difficulty
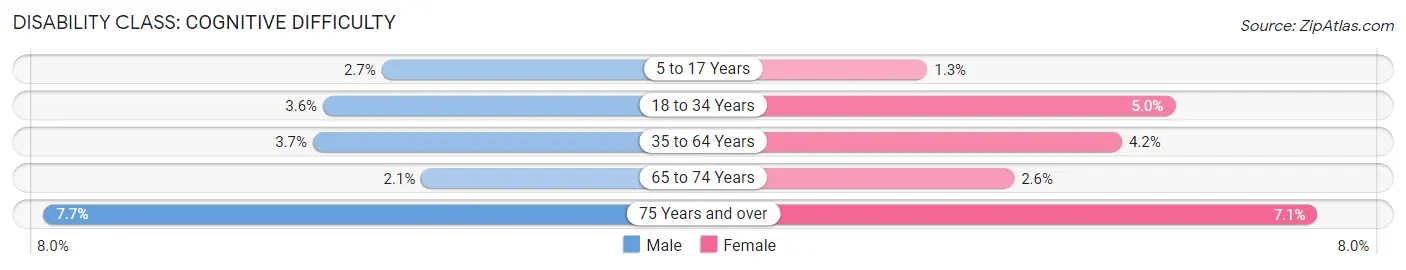
| Age Bracket | Male | Female |
| 5 to 17 Years | 160 (2.7%) | 72 (1.3%) |
| 18 to 34 Years | 862 (3.6%) | 953 (5.0%) |
| 35 to 64 Years | 511 (3.7%) | 540 (4.2%) |
| 65 to 74 Years | 73 (2.1%) | 95 (2.6%) |
| 75 Years and over | 159 (7.7%) | 202 (7.1%) |
Disability Class: Ambulatory Difficulty
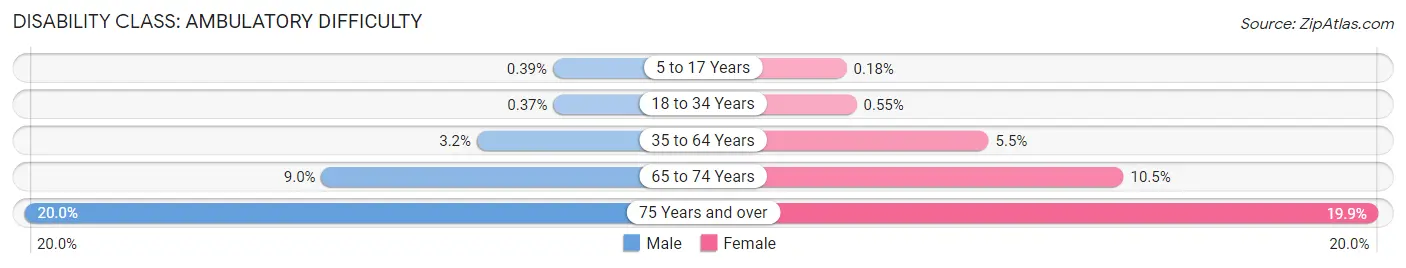
| Age Bracket | Male | Female |
| 5 to 17 Years | 23 (0.4%) | 10 (0.2%) |
| 18 to 34 Years | 89 (0.4%) | 106 (0.5%) |
| 35 to 64 Years | 441 (3.2%) | 707 (5.4%) |
| 65 to 74 Years | 311 (9.0%) | 388 (10.5%) |
| 75 Years and over | 412 (20.0%) | 570 (19.9%) |
Disability Class: Self-Care Difficulty
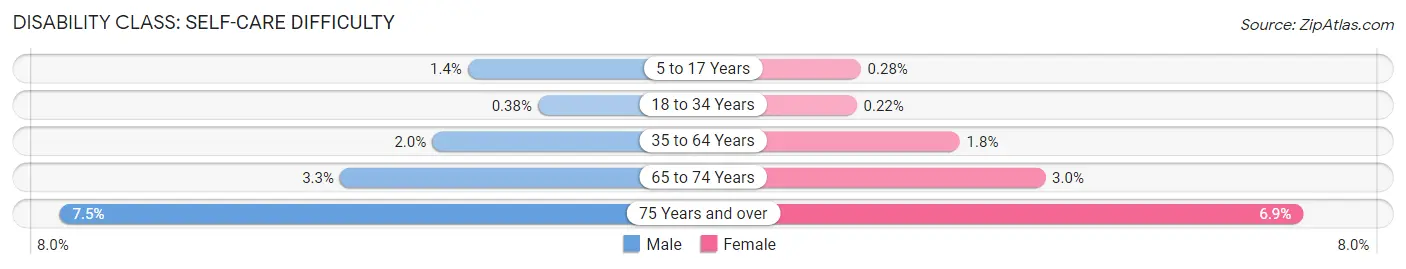
| Age Bracket | Male | Female |
| 5 to 17 Years | 84 (1.4%) | 16 (0.3%) |
| 18 to 34 Years | 92 (0.4%) | 42 (0.2%) |
| 35 to 64 Years | 268 (1.9%) | 227 (1.8%) |
| 65 to 74 Years | 115 (3.3%) | 112 (3.0%) |
| 75 Years and over | 154 (7.5%) | 196 (6.9%) |
Technology Access in Story County
Computing Device Access in Story County
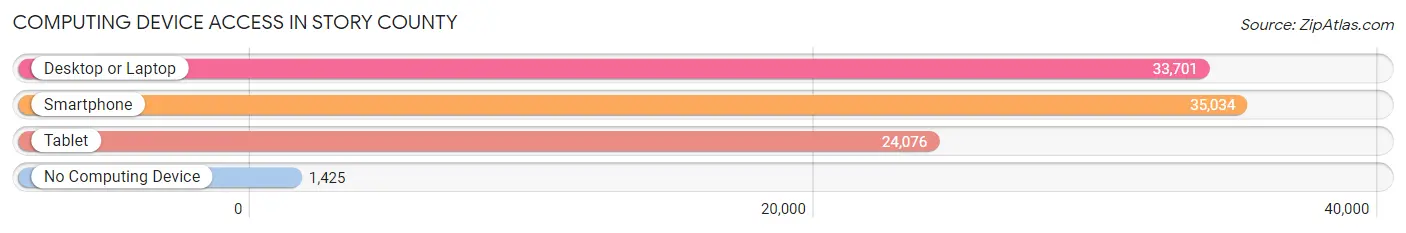
| Device Type | # Households | % Households |
| Desktop or Laptop | 33,701 | 87.7% |
| Smartphone | 35,034 | 91.2% |
| Tablet | 24,076 | 62.7% |
| No Computing Device | 1,425 | 3.7% |
| Total | 38,412 | 100.0% |
Internet Access in Story County
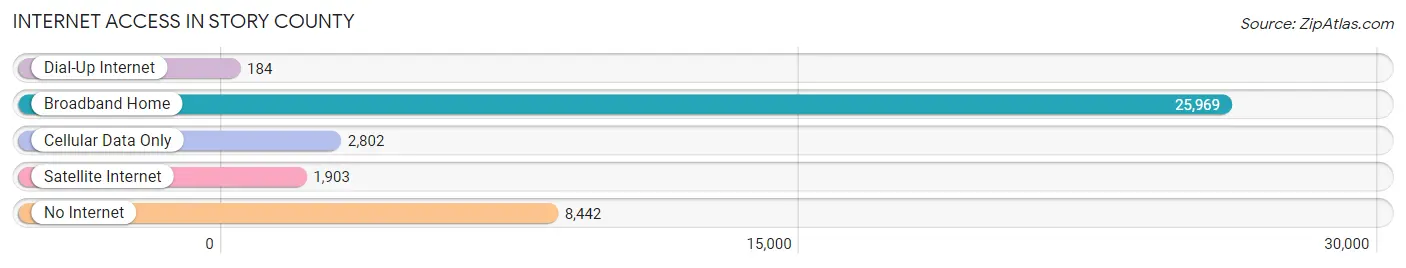
| Internet Type | # Households | % Households |
| Dial-Up Internet | 184 | 0.5% |
| Broadband Home | 25,969 | 67.6% |
| Cellular Data Only | 2,802 | 7.3% |
| Satellite Internet | 1,903 | 5.0% |
| No Internet | 8,442 | 22.0% |
| Total | 38,412 | 100.0% |
Story County Summary
History
Story County, Iowa is located in the central part of the state and is part of the Ames Metropolitan Statistical Area. The county was established in 1853 and was named after Joseph Story, a Supreme Court Justice. The county seat is Nevada, which was founded in 1855.
The first settlers in Story County were mostly of English and German descent. They were attracted to the area by the fertile soil and the abundance of timber. The first settlers built log cabins and cleared the land for farming. The first crops grown in the county were wheat, corn, and oats.
The county was an important part of the Underground Railroad, which helped slaves escape to freedom. The county was also home to several Civil War battles, including the Battle of Booneville in 1862.
The county experienced rapid growth in the late 19th and early 20th centuries. The population increased from 4,000 in 1880 to over 20,000 by 1910. This growth was due to the development of the railroads and the growth of the agricultural industry.
Geography
Story County is located in the central part of Iowa and is bordered by Boone, Hamilton, Hardin, Marshall, and Polk counties. The county covers an area of 576 square miles and is home to over 90,000 people.
The county is mostly flat with rolling hills in the east. The Des Moines River runs through the county and is a major source of water for the area. The county is also home to several lakes, including Big Creek Lake, Lake Laverne, and Lake Red Rock.
The county is home to several state parks, including Ledges State Park, Stephens State Forest, and Hickory Grove Park. The county is also home to several wildlife areas, including the Story County Wildlife Area and the Story County Conservation Board Wildlife Area.
Economy
Story County has a diverse economy that is driven by agriculture, manufacturing, and services. The county is home to several large employers, including Iowa State University, the Ames Community School District, and the Story County Medical Center.
Agriculture is the largest industry in the county, accounting for over $1 billion in annual revenue. The county is home to over 1,000 farms, which produce corn, soybeans, hay, and livestock.
Manufacturing is also an important part of the county’s economy. The county is home to several large manufacturers, including 3M, John Deere, and Siemens.
The county is also home to several service-based businesses, including health care, education, and retail. The county is home to several large retailers, including Walmart, Target, and Hy-Vee.
Demographics
As of the 2010 census, Story County had a population of 89,542. The population is spread out with a median age of 33.7 years. The racial makeup of the county is 90.2% White, 4.2% Hispanic or Latino, 2.3% Asian, 1.2% African American, and 0.9% Native American.
The median household income in the county is $54,945 and the median family income is $68,945. The per capita income in the county is $27,945. The poverty rate in the county is 8.3%.
Conclusion
Story County, Iowa is a diverse county with a rich history and a strong economy. The county is home to several large employers and is a major agricultural producer. The county is also home to several state parks and wildlife areas. The population of the county is diverse and the median household income is above the national average.
Common Questions
What is Per Capita Income in Story County?
Per Capita income in Story County is $35,704.
What is the Median Family Income in Story County?
Median Family Income in Story County is $109,432.
What is the Median Household income in Story County?
Median Household Income in Story County is $66,197.
What is Income or Wage Gap in Story County?
Income or Wage Gap in Story County is 26.6%.
Women in Story County earn 73.4 cents for every dollar earned by a man.
What is Family Income Deficit in Story County?
Family Income Deficit in Story County is $9,423.
Families that are below poverty line in Story County earn $9,423 less on average than the poverty threshold level.
What is Inequality or Gini Index in Story County?
Inequality or Gini Index in Story County is 0.48.
What is the Total Population of Story County?
Total Population of Story County is 98,573.
What is the Total Male Population of Story County?
Total Male Population of Story County is 51,726.
What is the Total Female Population of Story County?
Total Female Population of Story County is 46,847.
What is the Ratio of Males per 100 Females in Story County?
There are 110.41 Males per 100 Females in Story County.
What is the Ratio of Females per 100 Males in Story County?
There are 90.57 Females per 100 Males in Story County.
What is the Median Population Age in Story County?
Median Population Age in Story County is 26.5 Years.
What is the Average Family Size in Story County
Average Family Size in Story County is 2.9 People.
What is the Average Household Size in Story County
Average Household Size in Story County is 2.2 People.
How Large is the Labor Force in Story County?
There are 56,440 People in the Labor Forcein in Story County.
What is the Percentage of People in the Labor Force in Story County?
66.7% of People are in the Labor Force in Story County.
What is the Unemployment Rate in Story County?
Unemployment Rate in Story County is 5.6%.