Clinton County, IA Map & Demographics
Clinton County Map
Clinton County Overview
$33,979
PER CAPITA INCOME
$80,614
AVG FAMILY INCOME
$61,080
AVG HOUSEHOLD INCOME
36.5%
WAGE / INCOME GAP [ % ]
63.5¢/ $1
WAGE / INCOME GAP [ $ ]
$10,161
FAMILY INCOME DEFICIT
0.43
INEQUALITY / GINI INDEX
46,488
TOTAL POPULATION
22,930
MALE POPULATION
23,558
FEMALE POPULATION
97.33
MALES / 100 FEMALES
102.74
FEMALES / 100 MALES
42.5
MEDIAN AGE
3.0
AVG FAMILY SIZE
2.4
AVG HOUSEHOLD SIZE
22,689
LABOR FORCE [ PEOPLE ]
60.8%
PERCENT IN LABOR FORCE
4.4%
UNEMPLOYMENT RATE
Clinton County Area Codes
Income in Clinton County
Income Overview in Clinton County
Per Capita Income in Clinton County is $33,979, while median incomes of families and households are $80,614 and $61,080 respectively.
| Characteristic | Number | Measure |
| Per Capita Income | 46,488 | $33,979 |
| Median Family Income | 12,121 | $80,614 |
| Mean Family Income | 12,121 | $97,166 |
| Median Household Income | 19,174 | $61,080 |
| Mean Household Income | 19,174 | $80,620 |
| Income Deficit | 12,121 | $10,161 |
| Wage / Income Gap (%) | 46,488 | 36.52% |
| Wage / Income Gap ($) | 46,488 | 63.48¢ per $1 |
| Gini / Inequality Index | 46,488 | 0.43 |
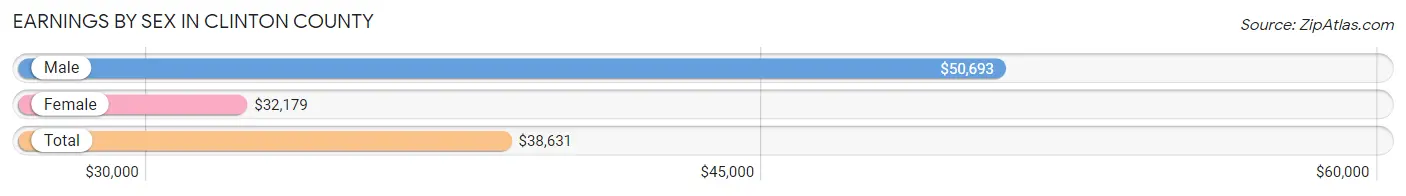
Earnings by Sex in Clinton County
Average Earnings in Clinton County are $38,631, $50,693 for men and $32,179 for women, a difference of 36.5%.
| Sex | Number | Average Earnings |
| Male | 11,780 (50.2%) | $50,693 |
| Female | 11,678 (49.8%) | $32,179 |
| Total | 23,458 (100.0%) | $38,631 |
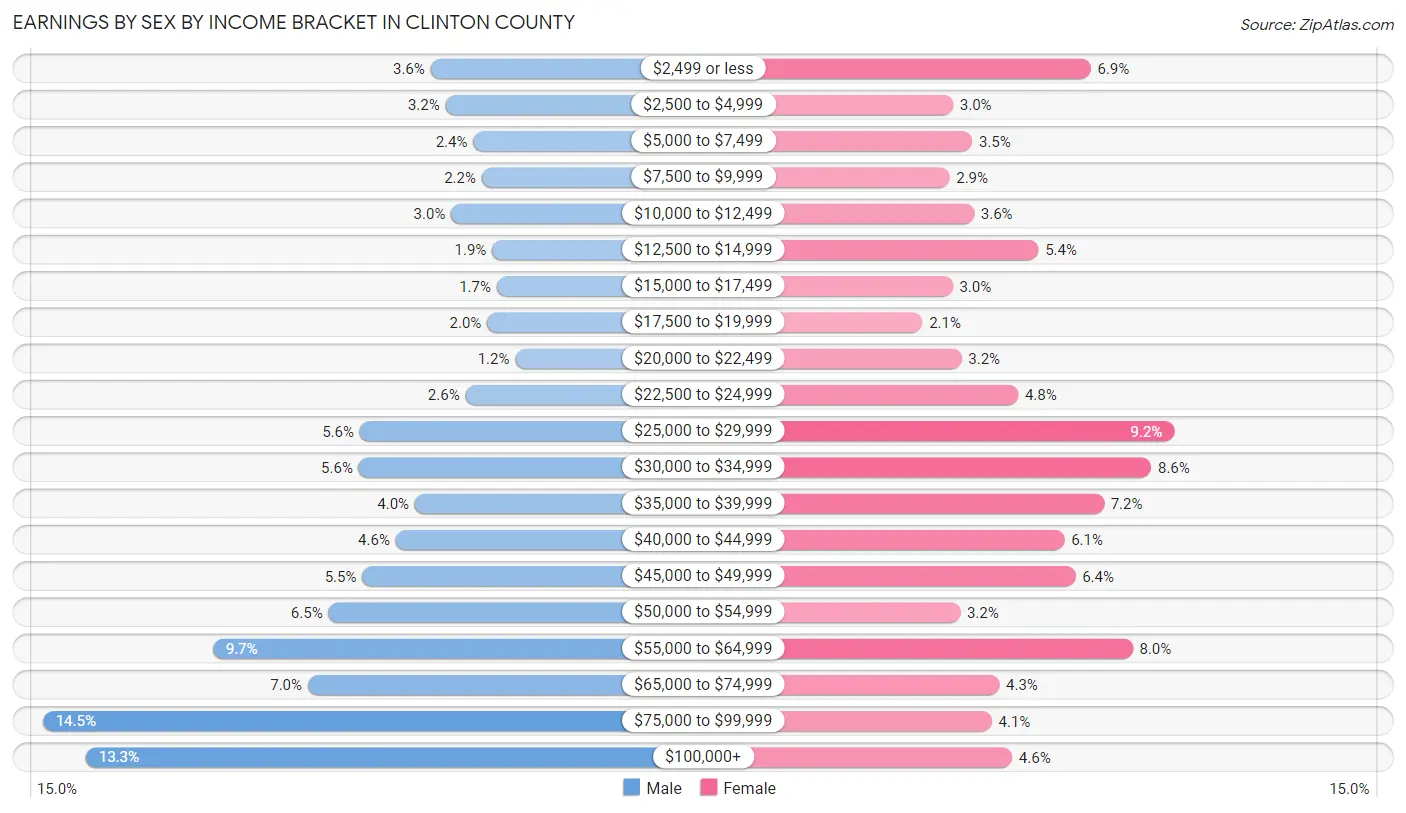
Earnings by Sex by Income Bracket in Clinton County
The most common earnings brackets in Clinton County are $75,000 to $99,999 for men (1,707 | 14.5%) and $25,000 to $29,999 for women (1,074 | 9.2%).
| Income | Male | Female |
| $2,499 or less | 423 (3.6%) | 800 (6.9%) |
| $2,500 to $4,999 | 374 (3.2%) | 348 (3.0%) |
| $5,000 to $7,499 | 281 (2.4%) | 411 (3.5%) |
| $7,500 to $9,999 | 253 (2.1%) | 336 (2.9%) |
| $10,000 to $12,499 | 354 (3.0%) | 417 (3.6%) |
| $12,500 to $14,999 | 219 (1.9%) | 628 (5.4%) |
| $15,000 to $17,499 | 204 (1.7%) | 347 (3.0%) |
| $17,500 to $19,999 | 236 (2.0%) | 248 (2.1%) |
| $20,000 to $22,499 | 143 (1.2%) | 376 (3.2%) |
| $22,500 to $24,999 | 308 (2.6%) | 562 (4.8%) |
| $25,000 to $29,999 | 657 (5.6%) | 1,074 (9.2%) |
| $30,000 to $34,999 | 661 (5.6%) | 998 (8.6%) |
| $35,000 to $39,999 | 475 (4.0%) | 843 (7.2%) |
| $40,000 to $44,999 | 538 (4.6%) | 714 (6.1%) |
| $45,000 to $49,999 | 649 (5.5%) | 750 (6.4%) |
| $50,000 to $54,999 | 761 (6.5%) | 371 (3.2%) |
| $55,000 to $64,999 | 1,144 (9.7%) | 938 (8.0%) |
| $65,000 to $74,999 | 829 (7.0%) | 500 (4.3%) |
| $75,000 to $99,999 | 1,707 (14.5%) | 475 (4.1%) |
| $100,000+ | 1,564 (13.3%) | 542 (4.6%) |
| Total | 11,780 (100.0%) | 11,678 (100.0%) |
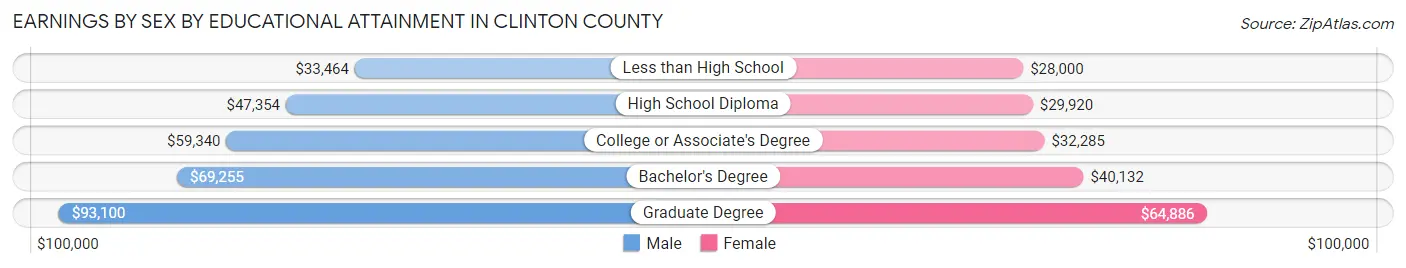
Earnings by Sex by Educational Attainment in Clinton County
Average earnings in Clinton County are $54,705 for men and $34,743 for women, a difference of 36.5%. Men with an educational attainment of graduate degree enjoy the highest average annual earnings of $93,100, while those with less than high school education earn the least with $33,464. Women with an educational attainment of graduate degree earn the most with the average annual earnings of $64,886, while those with less than high school education have the smallest earnings of $28,000.
| Educational Attainment | Male Income | Female Income |
| Less than High School | $33,464 | $28,000 |
| High School Diploma | $47,354 | $29,920 |
| College or Associate's Degree | $59,340 | $32,285 |
| Bachelor's Degree | $69,255 | $40,132 |
| Graduate Degree | $93,100 | $64,886 |
| Total | $54,705 | $34,743 |
Family Income in Clinton County
Family Income Brackets in Clinton County
According to the Clinton County family income data, there are 2,630 families falling into the $100,000 to $149,999 income range, which is the most common income bracket and makes up 21.7% of all families. Conversely, the less than $10,000 income bracket is the least frequent group with only 206 families (1.7%) belonging to this category.
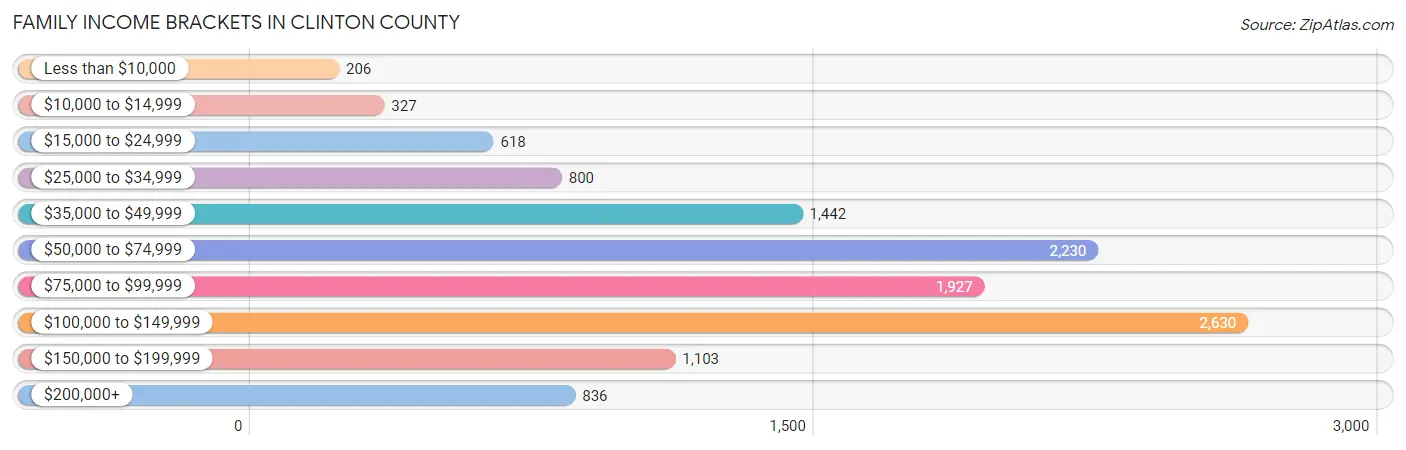
| Income Bracket | # Families | % Families |
| Less than $10,000 | 206 | 1.7% |
| $10,000 to $14,999 | 327 | 2.7% |
| $15,000 to $24,999 | 618 | 5.1% |
| $25,000 to $34,999 | 800 | 6.6% |
| $35,000 to $49,999 | 1,442 | 11.9% |
| $50,000 to $74,999 | 2,230 | 18.4% |
| $75,000 to $99,999 | 1,927 | 15.9% |
| $100,000 to $149,999 | 2,630 | 21.7% |
| $150,000 to $199,999 | 1,103 | 9.1% |
| $200,000+ | 836 | 6.9% |
Family Income by Famaliy Size in Clinton County
7+ person families (261 | 2.1%) account for the highest median family income in Clinton County with $197,614 per family, while 2-person families (7,028 | 58.0%) have the highest median income of $38,021 per family member.
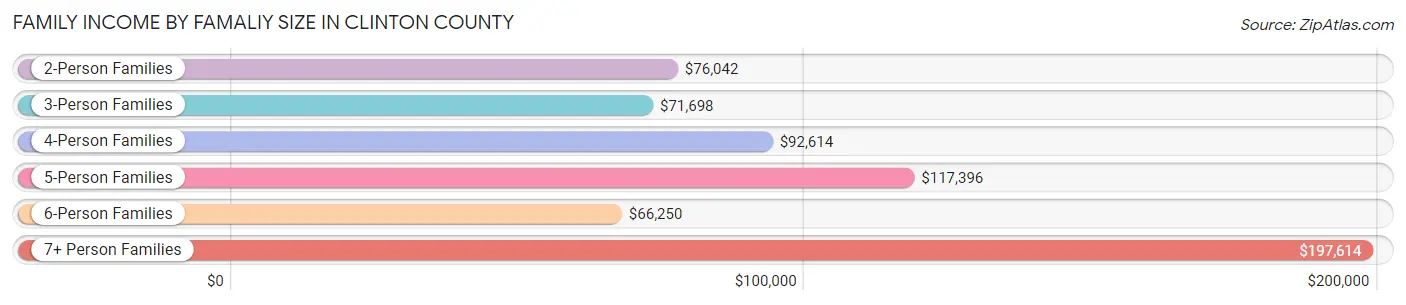
| Income Bracket | # Families | Median Income |
| 2-Person Families | 7,028 (58.0%) | $76,042 |
| 3-Person Families | 2,137 (17.6%) | $71,698 |
| 4-Person Families | 1,785 (14.7%) | $92,614 |
| 5-Person Families | 684 (5.6%) | $117,396 |
| 6-Person Families | 226 (1.9%) | $66,250 |
| 7+ Person Families | 261 (2.1%) | $197,614 |
| Total | 12,121 (100.0%) | $80,614 |
Family Income by Number of Earners in Clinton County
The median family income in Clinton County is $80,614, with families comprising 3+ earners (880) having the highest median family income of $123,333, while families with no earners (2,139) have the lowest median family income of $50,302, accounting for 7.3% and 17.6% of families, respectively.
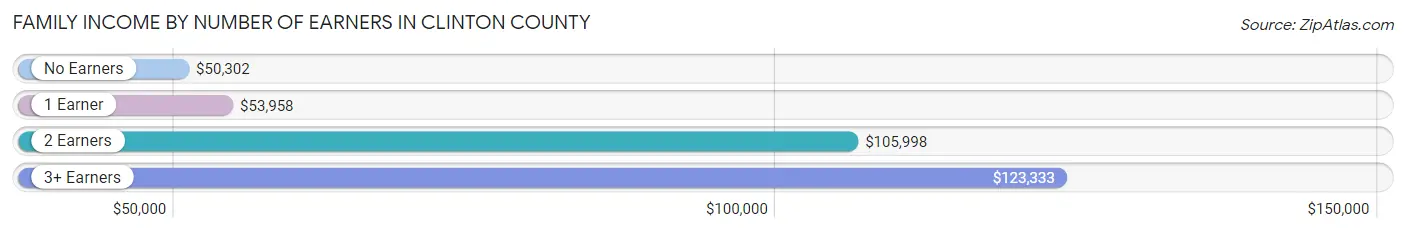
| Number of Earners | # Families | Median Income |
| No Earners | 2,139 (17.6%) | $50,302 |
| 1 Earner | 3,801 (31.4%) | $53,958 |
| 2 Earners | 5,301 (43.7%) | $105,998 |
| 3+ Earners | 880 (7.3%) | $123,333 |
| Total | 12,121 (100.0%) | $80,614 |
Household Income in Clinton County
Household Income Brackets in Clinton County
With 3,624 households falling in the category, the $50,000 to $74,999 income range is the most frequent in Clinton County, accounting for 18.9% of all households. In contrast, only 614 households (3.2%) fall into the less than $10,000 income bracket, making it the least populous group.
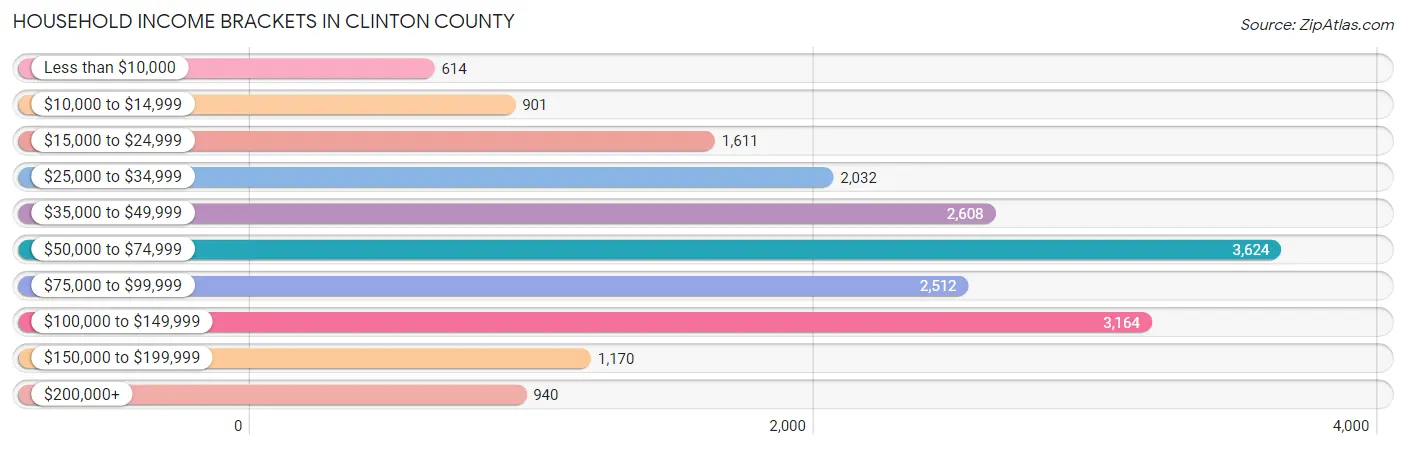
| Income Bracket | # Households | % Households |
| Less than $10,000 | 614 | 3.2% |
| $10,000 to $14,999 | 901 | 4.7% |
| $15,000 to $24,999 | 1,611 | 8.4% |
| $25,000 to $34,999 | 2,032 | 10.6% |
| $35,000 to $49,999 | 2,608 | 13.6% |
| $50,000 to $74,999 | 3,624 | 18.9% |
| $75,000 to $99,999 | 2,512 | 13.1% |
| $100,000 to $149,999 | 3,164 | 16.5% |
| $150,000 to $199,999 | 1,170 | 6.1% |
| $200,000+ | 940 | 4.9% |
Household Income by Householder Age in Clinton County
The median household income in Clinton County is $61,080, with the highest median household income of $75,560 found in the 45 to 64 years age bracket for the primary householder. A total of 7,247 households (37.8%) fall into this category. Meanwhile, the 15 to 24 years age bracket for the primary householder has the lowest median household income of $39,100, with 748 households (3.9%) in this group.
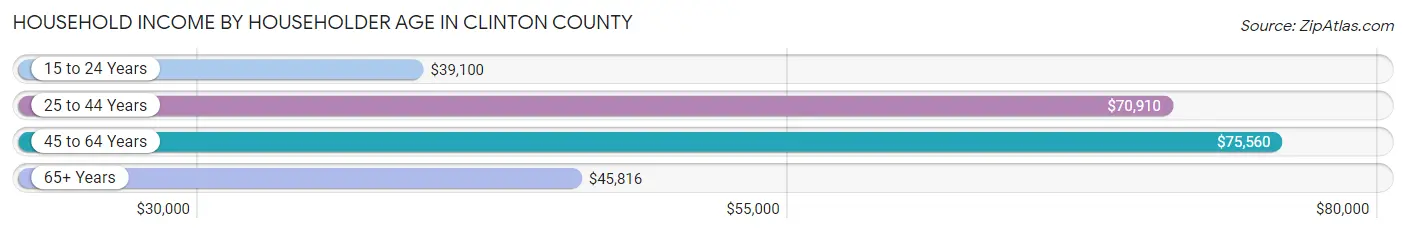
| Income Bracket | # Households | Median Income |
| 15 to 24 Years | 748 (3.9%) | $39,100 |
| 25 to 44 Years | 5,240 (27.3%) | $70,910 |
| 45 to 64 Years | 7,247 (37.8%) | $75,560 |
| 65+ Years | 5,939 (31.0%) | $45,816 |
| Total | 19,174 (100.0%) | $61,080 |
Poverty in Clinton County
Income Below Poverty by Sex and Age in Clinton County
With 10.5% poverty level for males and 14.3% for females among the residents of Clinton County, 5 year old males and 15 year old females are the most vulnerable to poverty, with 56 males (46.7%) and 61 females (30.5%) in their respective age groups living below the poverty level.
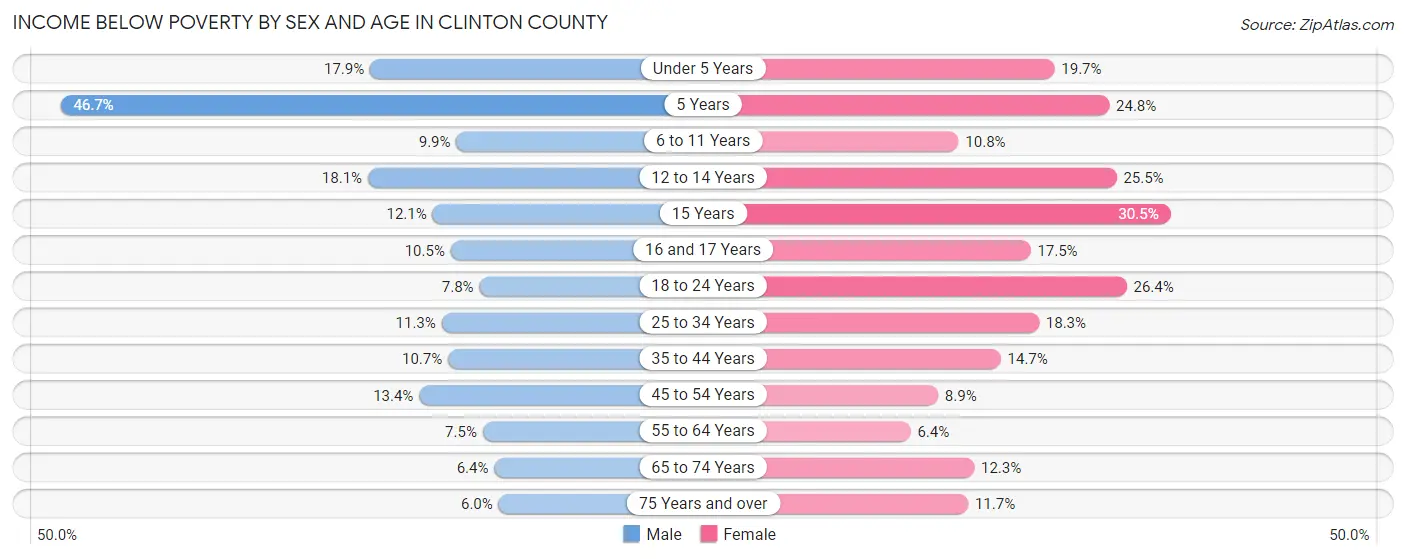
| Age Bracket | Male | Female |
| Under 5 Years | 234 (17.9%) | 244 (19.7%) |
| 5 Years | 56 (46.7%) | 67 (24.8%) |
| 6 to 11 Years | 169 (9.9%) | 171 (10.8%) |
| 12 to 14 Years | 193 (18.1%) | 249 (25.5%) |
| 15 Years | 38 (12.1%) | 61 (30.5%) |
| 16 and 17 Years | 65 (10.4%) | 118 (17.5%) |
| 18 to 24 Years | 135 (7.8%) | 461 (26.4%) |
| 25 to 34 Years | 281 (11.3%) | 497 (18.3%) |
| 35 to 44 Years | 290 (10.7%) | 385 (14.7%) |
| 45 to 54 Years | 390 (13.4%) | 245 (8.9%) |
| 55 to 64 Years | 257 (7.5%) | 228 (6.4%) |
| 65 to 74 Years | 163 (6.4%) | 321 (12.3%) |
| 75 Years and over | 98 (6.0%) | 233 (11.7%) |
| Total | 2,369 (10.5%) | 3,280 (14.3%) |
Income Above Poverty by Sex and Age in Clinton County
According to the poverty statistics in Clinton County, males aged 75 years and over and females aged 55 to 64 years are the age groups that are most secure financially, with 94.0% of males and 93.6% of females in these age groups living above the poverty line.
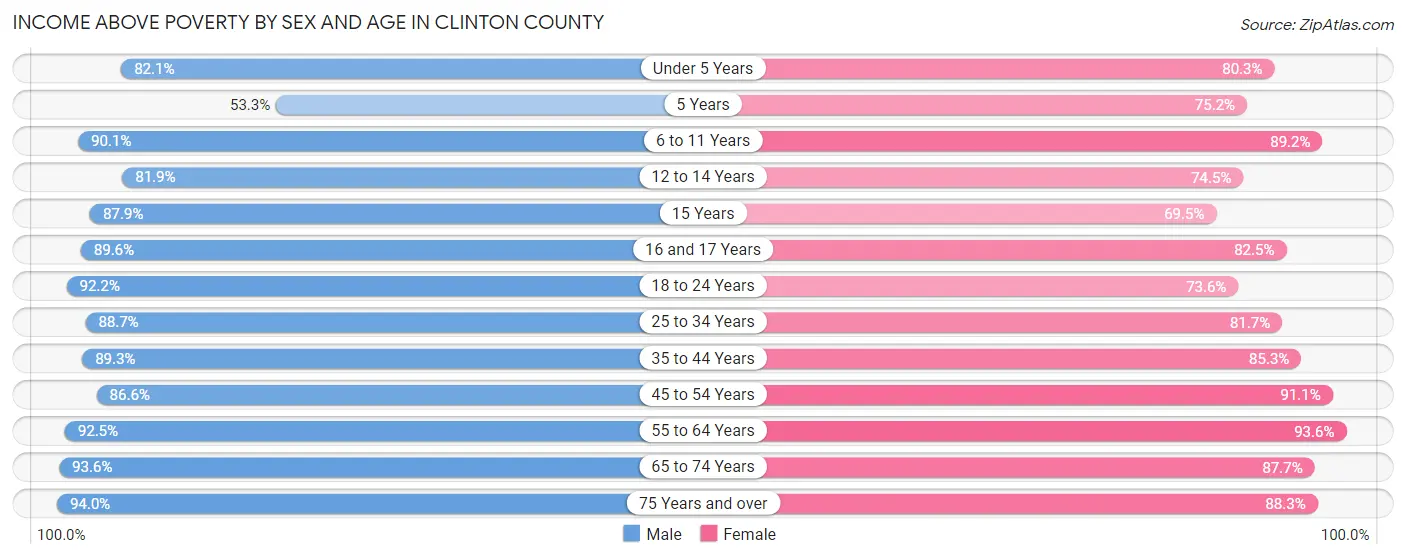
| Age Bracket | Male | Female |
| Under 5 Years | 1,070 (82.1%) | 993 (80.3%) |
| 5 Years | 64 (53.3%) | 203 (75.2%) |
| 6 to 11 Years | 1,533 (90.1%) | 1,410 (89.2%) |
| 12 to 14 Years | 871 (81.9%) | 728 (74.5%) |
| 15 Years | 275 (87.9%) | 139 (69.5%) |
| 16 and 17 Years | 557 (89.5%) | 556 (82.5%) |
| 18 to 24 Years | 1,598 (92.2%) | 1,283 (73.6%) |
| 25 to 34 Years | 2,205 (88.7%) | 2,220 (81.7%) |
| 35 to 44 Years | 2,421 (89.3%) | 2,227 (85.3%) |
| 45 to 54 Years | 2,525 (86.6%) | 2,502 (91.1%) |
| 55 to 64 Years | 3,177 (92.5%) | 3,354 (93.6%) |
| 65 to 74 Years | 2,381 (93.6%) | 2,296 (87.7%) |
| 75 Years and over | 1,532 (94.0%) | 1,756 (88.3%) |
| Total | 20,209 (89.5%) | 19,667 (85.7%) |
Income Below Poverty Among Married-Couple Families in Clinton County
The poverty statistics for married-couple families in Clinton County show that 2.5% or 223 of the total 9,036 families live below the poverty line. Families with 3 or 4 children have the highest poverty rate of 3.4%, comprising of 21 families. On the other hand, families with 5 or more children have the lowest poverty rate of 2.3%, which includes 3 families.
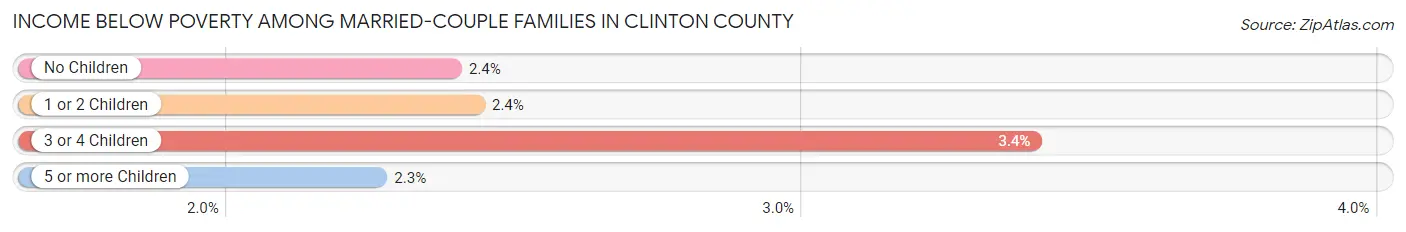
| Children | Above Poverty | Below Poverty |
| No Children | 6,000 (97.6%) | 147 (2.4%) |
| 1 or 2 Children | 2,087 (97.6%) | 52 (2.4%) |
| 3 or 4 Children | 596 (96.6%) | 21 (3.4%) |
| 5 or more Children | 130 (97.7%) | 3 (2.3%) |
| Total | 8,813 (97.5%) | 223 (2.5%) |
Income Below Poverty Among Single-Parent Households in Clinton County
According to the poverty data in Clinton County, 14.2% or 152 single-father households and 31.5% or 634 single-mother households are living below the poverty line. Among single-father households, those with 5 or more children have the highest poverty rate, with 30 households (100.0%) experiencing poverty. Likewise, among single-mother households, those with 5 or more children have the highest poverty rate, with 64 households (100.0%) falling below the poverty line.
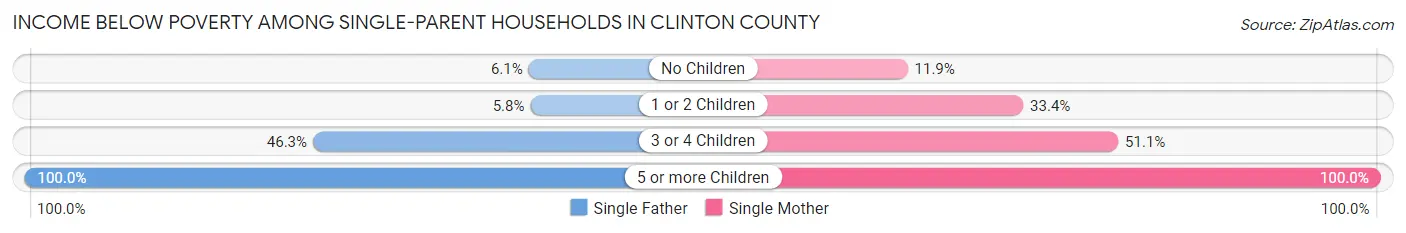
| Children | Single Father | Single Mother |
| No Children | 25 (6.1%) | 76 (11.9%) |
| 1 or 2 Children | 28 (5.8%) | 335 (33.4%) |
| 3 or 4 Children | 69 (46.3%) | 159 (51.1%) |
| 5 or more Children | 30 (100.0%) | 64 (100.0%) |
| Total | 152 (14.2%) | 634 (31.5%) |
Income Below Poverty Among Married-Couple vs Single-Parent Households in Clinton County
The poverty data for Clinton County shows that 223 of the married-couple family households (2.5%) and 786 of the single-parent households (25.5%) are living below the poverty level. Within the married-couple family households, those with 3 or 4 children have the highest poverty rate, with 21 households (3.4%) falling below the poverty line. Among the single-parent households, those with 5 or more children have the highest poverty rate, with 94 household (100.0%) living below poverty.
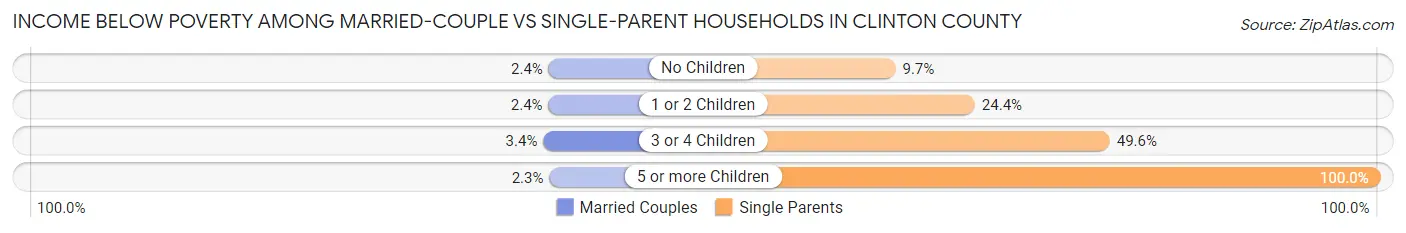
| Children | Married-Couple Families | Single-Parent Households |
| No Children | 147 (2.4%) | 101 (9.7%) |
| 1 or 2 Children | 52 (2.4%) | 363 (24.4%) |
| 3 or 4 Children | 21 (3.4%) | 228 (49.6%) |
| 5 or more Children | 3 (2.3%) | 94 (100.0%) |
| Total | 223 (2.5%) | 786 (25.5%) |
Race in Clinton County
The most populous races in Clinton County are White / Caucasian (42,575 | 91.6%), Two or more Races (1,823 | 3.9%), and Hispanic or Latino (1,591 | 3.4%).
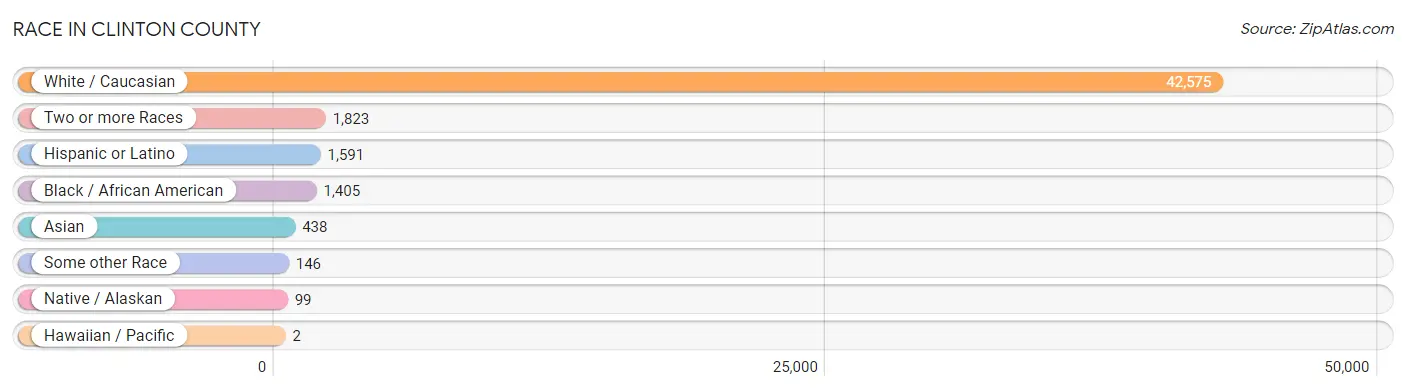
| Race | # Population | % Population |
| Asian | 438 | 0.9% |
| Black / African American | 1,405 | 3.0% |
| Hawaiian / Pacific | 2 | 0.0% |
| Hispanic or Latino | 1,591 | 3.4% |
| Native / Alaskan | 99 | 0.2% |
| White / Caucasian | 42,575 | 91.6% |
| Two or more Races | 1,823 | 3.9% |
| Some other Race | 146 | 0.3% |
| Total | 46,488 | 100.0% |
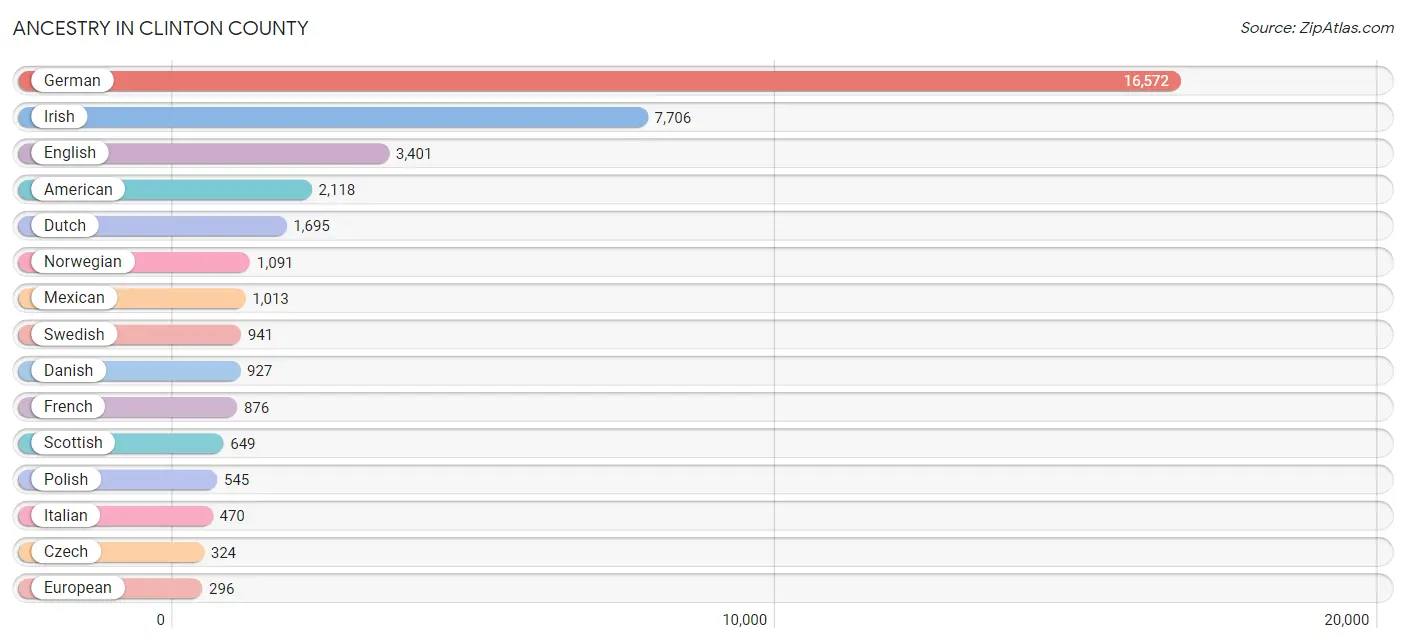
Ancestry in Clinton County
The most populous ancestries reported in Clinton County are German (16,572 | 35.6%), Irish (7,706 | 16.6%), English (3,401 | 7.3%), American (2,118 | 4.6%), and Dutch (1,695 | 3.6%), together accounting for 67.8% of all Clinton County residents.
| Ancestry | # Population | % Population |
| African | 3 | 0.0% |
| American | 2,118 | 4.6% |
| Apache | 10 | 0.0% |
| Arab | 186 | 0.4% |
| Austrian | 46 | 0.1% |
| Belgian | 198 | 0.4% |
| Bhutanese | 25 | 0.1% |
| Blackfeet | 67 | 0.1% |
| Brazilian | 8 | 0.0% |
| British | 150 | 0.3% |
| Bulgarian | 22 | 0.1% |
| Burmese | 68 | 0.2% |
| Canadian | 27 | 0.1% |
| Central American | 108 | 0.2% |
| Central American Indian | 4 | 0.0% |
| Cherokee | 58 | 0.1% |
| Chippewa | 2 | 0.0% |
| Choctaw | 32 | 0.1% |
| Costa Rican | 17 | 0.0% |
| Croatian | 11 | 0.0% |
| Cuban | 81 | 0.2% |
| Czech | 324 | 0.7% |
| Czechoslovakian | 20 | 0.0% |
| Danish | 927 | 2.0% |
| Dutch | 1,695 | 3.6% |
| Eastern European | 3 | 0.0% |
| Egyptian | 150 | 0.3% |
| English | 3,401 | 7.3% |
| European | 296 | 0.6% |
| Finnish | 20 | 0.0% |
| French | 876 | 1.9% |
| French Canadian | 128 | 0.3% |
| German | 16,572 | 35.6% |
| Greek | 26 | 0.1% |
| Guatemalan | 91 | 0.2% |
| Hungarian | 7 | 0.0% |
| Indian (Asian) | 119 | 0.3% |
| Iranian | 18 | 0.0% |
| Iraqi | 36 | 0.1% |
| Irish | 7,706 | 16.6% |
| Iroquois | 1 | 0.0% |
| Israeli | 50 | 0.1% |
| Italian | 470 | 1.0% |
| Kenyan | 2 | 0.0% |
| Korean | 26 | 0.1% |
| Lithuanian | 37 | 0.1% |
| Luxembourger | 53 | 0.1% |
| Malaysian | 134 | 0.3% |
| Menominee | 32 | 0.1% |
| Mexican | 1,013 | 2.2% |
| Mexican American Indian | 8 | 0.0% |
| Native Hawaiian | 15 | 0.0% |
| Norwegian | 1,091 | 2.4% |
| Pakistani | 18 | 0.0% |
| Pennsylvania German | 58 | 0.1% |
| Polish | 545 | 1.2% |
| Puerto Rican | 195 | 0.4% |
| Romanian | 41 | 0.1% |
| Russian | 153 | 0.3% |
| Samoan | 19 | 0.0% |
| Scandinavian | 42 | 0.1% |
| Scotch-Irish | 236 | 0.5% |
| Scottish | 649 | 1.4% |
| Serbian | 28 | 0.1% |
| Sioux | 27 | 0.1% |
| Slavic | 9 | 0.0% |
| Slovak | 3 | 0.0% |
| Spaniard | 98 | 0.2% |
| Spanish | 1 | 0.0% |
| Sri Lankan | 2 | 0.0% |
| Subsaharan African | 14 | 0.0% |
| Sudanese | 9 | 0.0% |
| Swedish | 941 | 2.0% |
| Swiss | 173 | 0.4% |
| Trinidadian and Tobagonian | 18 | 0.0% |
| Turkish | 10 | 0.0% |
| Ukrainian | 26 | 0.1% |
| Welsh | 137 | 0.3% |
| Yugoslavian | 2 | 0.0% | View All 79 Rows |
Immigrants in Clinton County
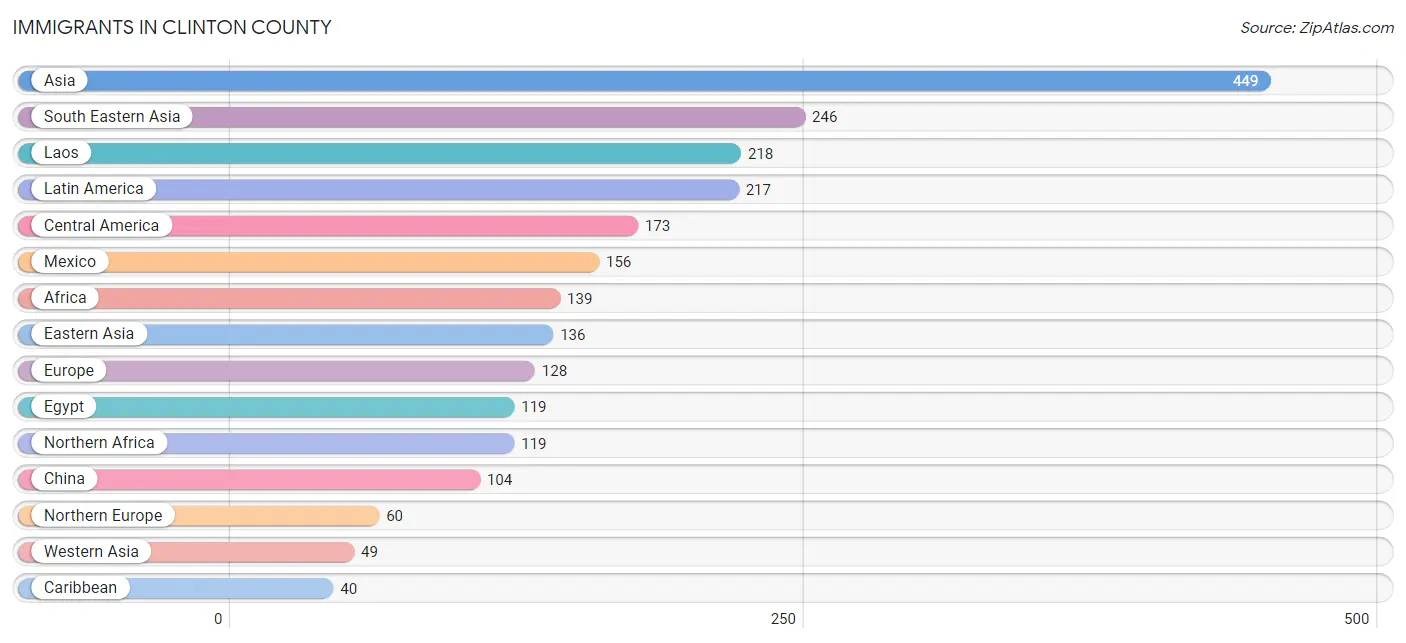
The most numerous immigrant groups reported in Clinton County came from Asia (449 | 1.0%), South Eastern Asia (246 | 0.5%), Laos (218 | 0.5%), Latin America (217 | 0.5%), and Central America (173 | 0.4%), together accounting for 2.8% of all Clinton County residents.
| Immigration Origin | # Population | % Population |
| Africa | 139 | 0.3% |
| Asia | 449 | 1.0% |
| Australia | 5 | 0.0% |
| Brazil | 4 | 0.0% |
| Bulgaria | 22 | 0.1% |
| Canada | 14 | 0.0% |
| Caribbean | 40 | 0.1% |
| Central America | 173 | 0.4% |
| China | 104 | 0.2% |
| Eastern Africa | 20 | 0.0% |
| Eastern Asia | 136 | 0.3% |
| Eastern Europe | 33 | 0.1% |
| Egypt | 119 | 0.3% |
| England | 27 | 0.1% |
| Eritrea | 20 | 0.0% |
| Europe | 128 | 0.3% |
| Germany | 27 | 0.1% |
| Guatemala | 17 | 0.0% |
| Iran | 18 | 0.0% |
| Ireland | 10 | 0.0% |
| Israel | 15 | 0.0% |
| Italy | 2 | 0.0% |
| Japan | 2 | 0.0% |
| Korea | 30 | 0.1% |
| Kuwait | 31 | 0.1% |
| Laos | 218 | 0.5% |
| Latin America | 217 | 0.5% |
| Mexico | 156 | 0.3% |
| Netherlands | 6 | 0.0% |
| Northern Africa | 119 | 0.3% |
| Northern Europe | 60 | 0.1% |
| Norway | 23 | 0.1% |
| Oceania | 5 | 0.0% |
| Philippines | 26 | 0.1% |
| Poland | 3 | 0.0% |
| Russia | 3 | 0.0% |
| South America | 4 | 0.0% |
| South Central Asia | 18 | 0.0% |
| South Eastern Asia | 246 | 0.5% |
| Southern Europe | 2 | 0.0% |
| Taiwan | 2 | 0.0% |
| Ukraine | 5 | 0.0% |
| Vietnam | 2 | 0.0% |
| Western Asia | 49 | 0.1% |
| Western Europe | 33 | 0.1% | View All 45 Rows |
Sex and Age in Clinton County
Sex and Age in Clinton County
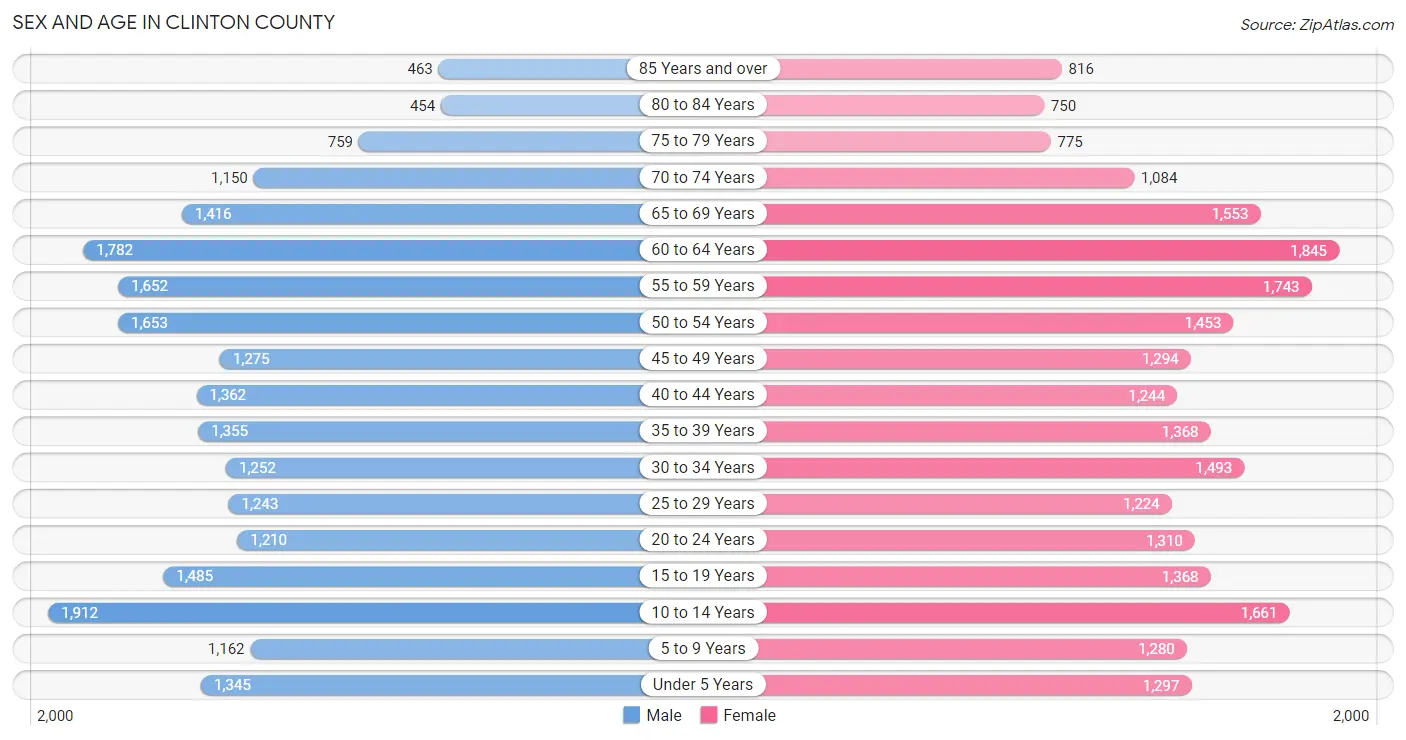
The most populous age groups in Clinton County are 10 to 14 Years (1,912 | 8.3%) for men and 60 to 64 Years (1,845 | 7.8%) for women.
| Age Bracket | Male | Female |
| Under 5 Years | 1,345 (5.9%) | 1,297 (5.5%) |
| 5 to 9 Years | 1,162 (5.1%) | 1,280 (5.4%) |
| 10 to 14 Years | 1,912 (8.3%) | 1,661 (7.0%) |
| 15 to 19 Years | 1,485 (6.5%) | 1,368 (5.8%) |
| 20 to 24 Years | 1,210 (5.3%) | 1,310 (5.6%) |
| 25 to 29 Years | 1,243 (5.4%) | 1,224 (5.2%) |
| 30 to 34 Years | 1,252 (5.5%) | 1,493 (6.3%) |
| 35 to 39 Years | 1,355 (5.9%) | 1,368 (5.8%) |
| 40 to 44 Years | 1,362 (5.9%) | 1,244 (5.3%) |
| 45 to 49 Years | 1,275 (5.6%) | 1,294 (5.5%) |
| 50 to 54 Years | 1,653 (7.2%) | 1,453 (6.2%) |
| 55 to 59 Years | 1,652 (7.2%) | 1,743 (7.4%) |
| 60 to 64 Years | 1,782 (7.8%) | 1,845 (7.8%) |
| 65 to 69 Years | 1,416 (6.2%) | 1,553 (6.6%) |
| 70 to 74 Years | 1,150 (5.0%) | 1,084 (4.6%) |
| 75 to 79 Years | 759 (3.3%) | 775 (3.3%) |
| 80 to 84 Years | 454 (2.0%) | 750 (3.2%) |
| 85 Years and over | 463 (2.0%) | 816 (3.5%) |
| Total | 22,930 (100.0%) | 23,558 (100.0%) |
Families and Households in Clinton County
Median Family Size in Clinton County
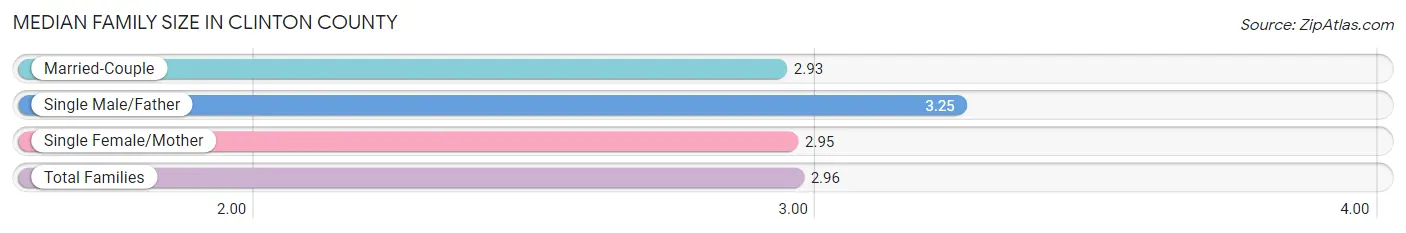
The median family size in Clinton County is 2.96 persons per family, with single male/father families (1,070 | 8.8%) accounting for the largest median family size of 3.25 persons per family. On the other hand, married-couple families (9,036 | 74.6%) represent the smallest median family size with 2.93 persons per family.
| Family Type | # Families | Family Size |
| Married-Couple | 9,036 (74.6%) | 2.93 |
| Single Male/Father | 1,070 (8.8%) | 3.25 |
| Single Female/Mother | 2,015 (16.6%) | 2.95 |
| Total Families | 12,121 (100.0%) | 2.96 |
Median Household Size in Clinton County
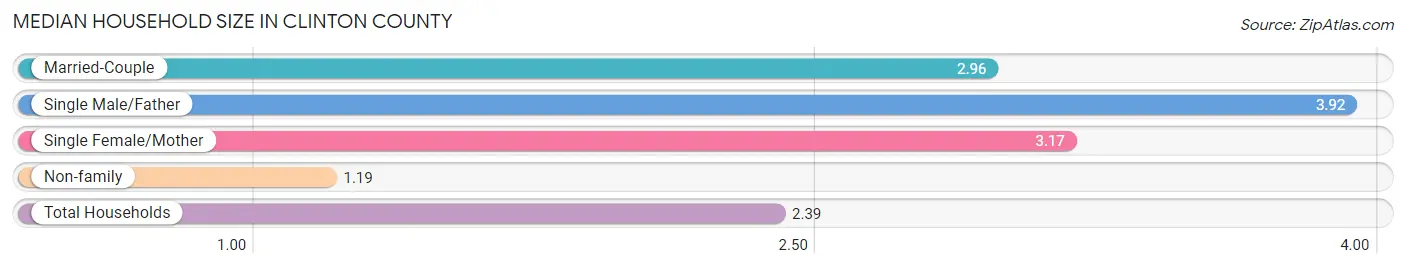
The median household size in Clinton County is 2.39 persons per household, with single male/father households (1,070 | 5.6%) accounting for the largest median household size of 3.92 persons per household. non-family households (7,053 | 36.8%) represent the smallest median household size with 1.19 persons per household.
| Household Type | # Households | Household Size |
| Married-Couple | 9,036 (47.1%) | 2.96 |
| Single Male/Father | 1,070 (5.6%) | 3.92 |
| Single Female/Mother | 2,015 (10.5%) | 3.17 |
| Non-family | 7,053 (36.8%) | 1.19 |
| Total Households | 19,174 (100.0%) | 2.39 |
Household Size by Marriage Status in Clinton County
Out of a total of 19,174 households in Clinton County, 12,121 (63.2%) are family households, while 7,053 (36.8%) are nonfamily households. The most numerous type of family households are 2-person households, comprising 6,514, and the most common type of nonfamily households are 1-person households, comprising 6,009.
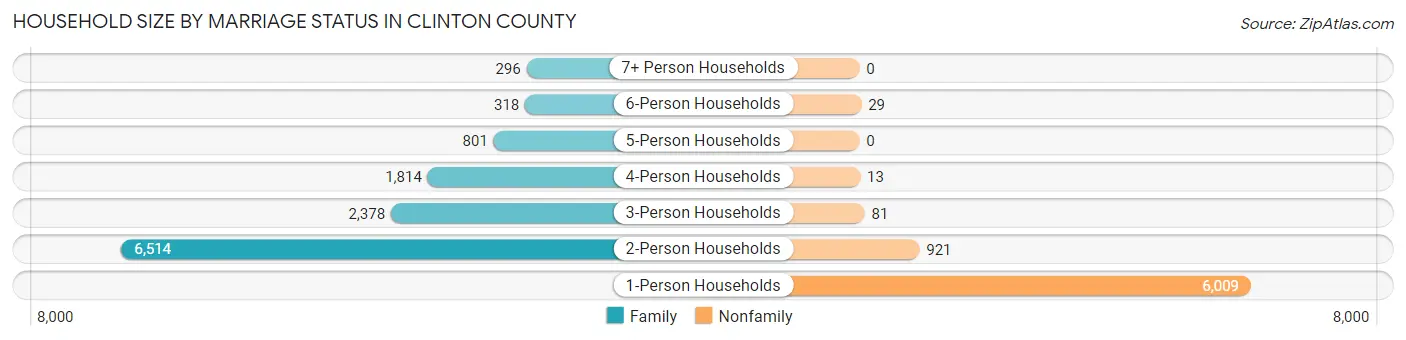
| Household Size | Family Households | Nonfamily Households |
| 1-Person Households | - | 6,009 (31.3%) |
| 2-Person Households | 6,514 (34.0%) | 921 (4.8%) |
| 3-Person Households | 2,378 (12.4%) | 81 (0.4%) |
| 4-Person Households | 1,814 (9.5%) | 13 (0.1%) |
| 5-Person Households | 801 (4.2%) | 0 (0.0%) |
| 6-Person Households | 318 (1.7%) | 29 (0.2%) |
| 7+ Person Households | 296 (1.5%) | 0 (0.0%) |
| Total | 12,121 (63.2%) | 7,053 (36.8%) |
Female Fertility in Clinton County
Fertility by Age in Clinton County
Average fertility rate in Clinton County is 68.0 births per 1,000 women. Women in the age bracket of 20 to 34 years have the highest fertility rate with 144.0 births per 1,000 women. Women in the age bracket of 20 to 34 years acount for 88.1% of all women with births.
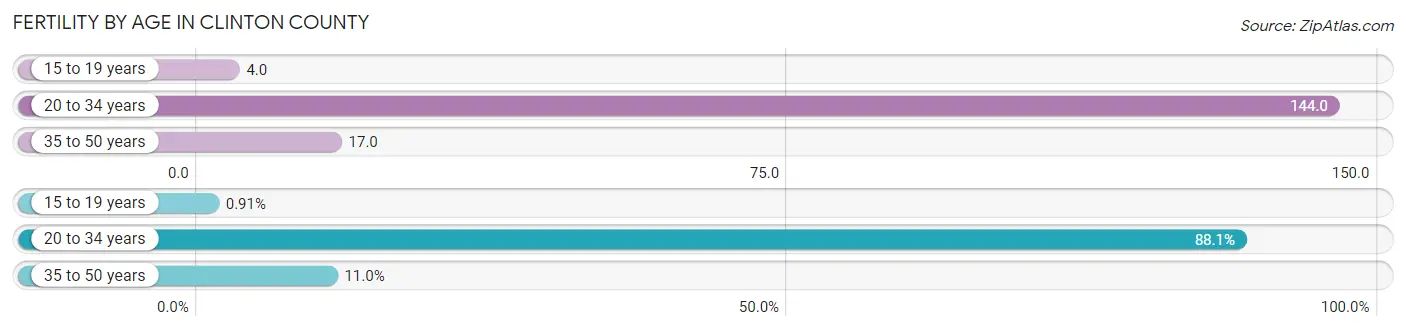
| Age Bracket | Women with Births | Births / 1,000 Women |
| 15 to 19 years | 6 (0.9%) | 4.0 |
| 20 to 34 years | 578 (88.1%) | 144.0 |
| 35 to 50 years | 72 (11.0%) | 17.0 |
| Total | 656 (100.0%) | 68.0 |
Fertility by Age by Marriage Status in Clinton County
61.1% of women with births (656) in Clinton County are married. The highest percentage of unmarried women with births falls into 35 to 50 years age bracket with 61.1% of them unmarried at the time of birth, while the lowest percentage of unmarried women with births belong to 15 to 19 years age bracket with 33.3% of them unmarried.
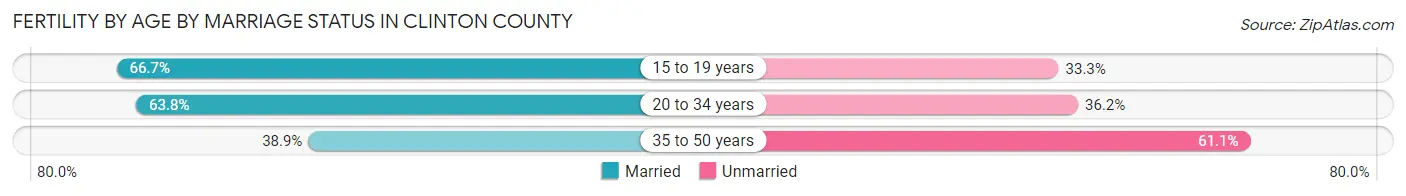
| Age Bracket | Married | Unmarried |
| 15 to 19 years | 4 (66.7%) | 2 (33.3%) |
| 20 to 34 years | 369 (63.8%) | 209 (36.2%) |
| 35 to 50 years | 28 (38.9%) | 44 (61.1%) |
| Total | 401 (61.1%) | 255 (38.9%) |
Fertility by Education in Clinton County
Average fertility rate in Clinton County is 68.0 births per 1,000 women. Women with the education attainment of high school diploma have the highest fertility rate of 108.0 births per 1,000 women, while women with the education attainment of graduate degree have the lowest fertility at 20.0 births per 1,000 women. Women with the education attainment of high school diploma represent 40.6% of all women with births.
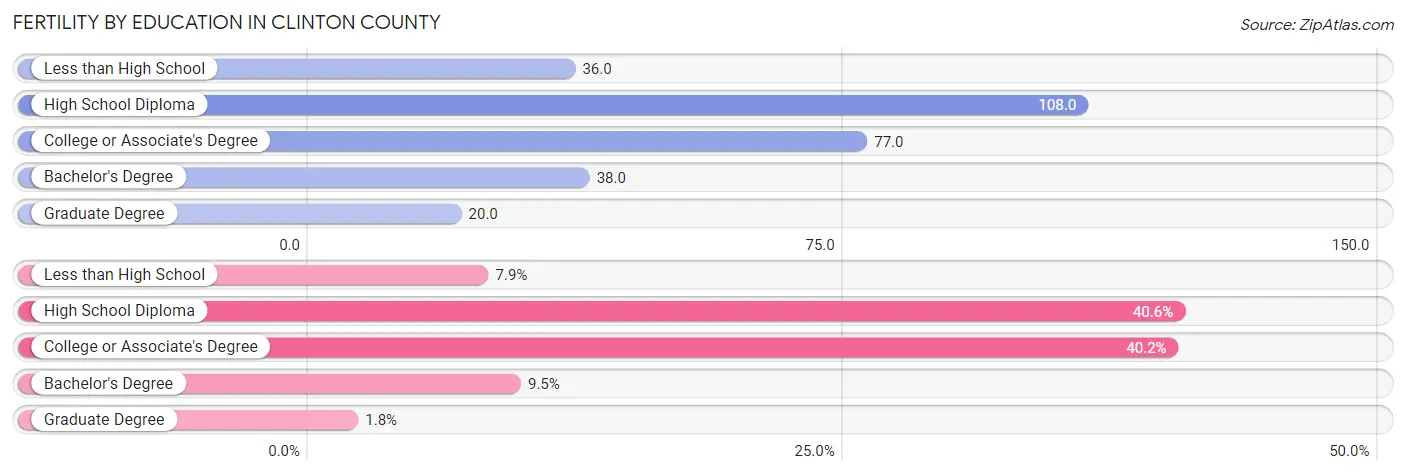
| Educational Attainment | Women with Births | Births / 1,000 Women |
| Less than High School | 52 (7.9%) | 36.0 |
| High School Diploma | 266 (40.6%) | 108.0 |
| College or Associate's Degree | 264 (40.2%) | 77.0 |
| Bachelor's Degree | 62 (9.5%) | 38.0 |
| Graduate Degree | 12 (1.8%) | 20.0 |
| Total | 656 (100.0%) | 68.0 |
Fertility by Education by Marriage Status in Clinton County
38.9% of women with births in Clinton County are unmarried. Women with the educational attainment of less than high school are most likely to be married with 100.0% of them married at childbirth, while women with the educational attainment of high school diploma are least likely to be married with 50.7% of them unmarried at childbirth.
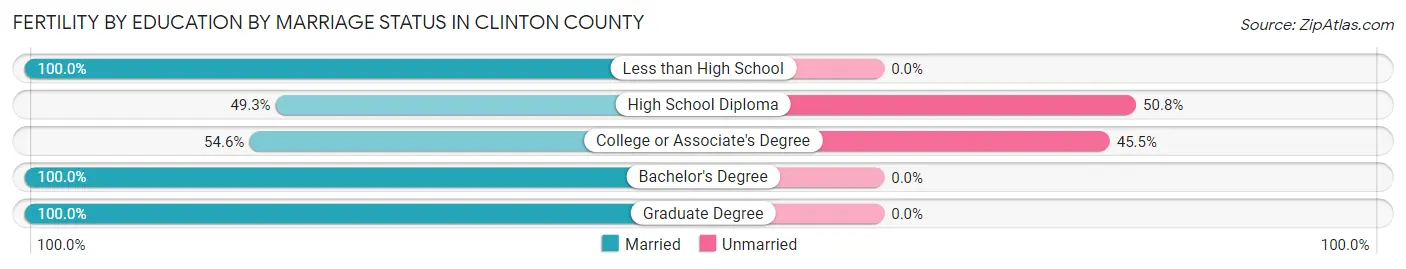
| Educational Attainment | Married | Unmarried |
| Less than High School | 52 (100.0%) | 0 (0.0%) |
| High School Diploma | 131 (49.2%) | 135 (50.7%) |
| College or Associate's Degree | 144 (54.5%) | 120 (45.5%) |
| Bachelor's Degree | 62 (100.0%) | 0 (0.0%) |
| Graduate Degree | 12 (100.0%) | 0 (0.0%) |
| Total | 401 (61.1%) | 255 (38.9%) |
Employment Characteristics in Clinton County
Employment by Class of Employer in Clinton County
Among the 21,251 employed individuals in Clinton County, private company employees (14,731 | 69.3%), not-for-profit organizations (1,783 | 8.4%), and local government employees (1,565 | 7.4%) make up the most common classes of employment.
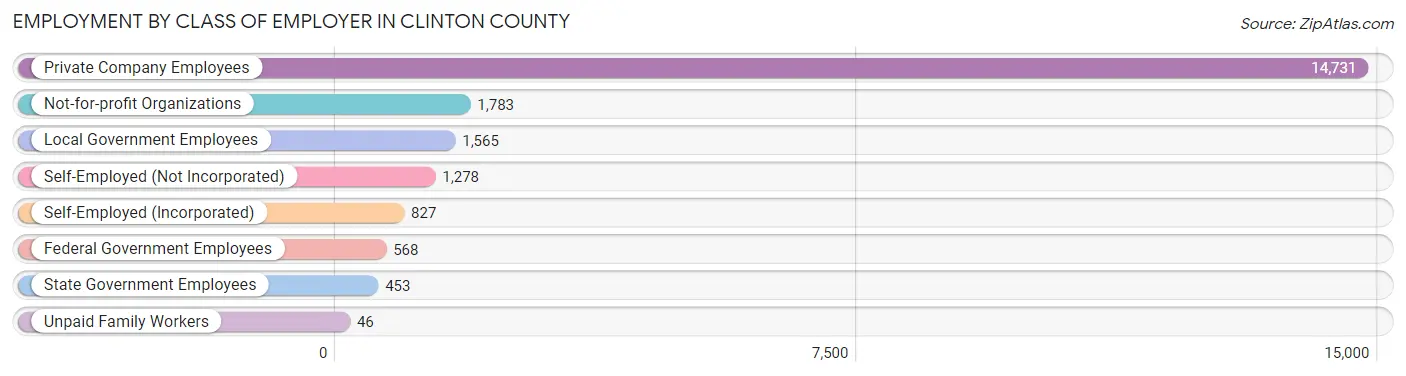
| Employer Class | # Employees | % Employees |
| Private Company Employees | 14,731 | 69.3% |
| Self-Employed (Incorporated) | 827 | 3.9% |
| Self-Employed (Not Incorporated) | 1,278 | 6.0% |
| Not-for-profit Organizations | 1,783 | 8.4% |
| Local Government Employees | 1,565 | 7.4% |
| State Government Employees | 453 | 2.1% |
| Federal Government Employees | 568 | 2.7% |
| Unpaid Family Workers | 46 | 0.2% |
| Total | 21,251 | 100.0% |
Employment Status by Age in Clinton County
According to the labor force statistics for Clinton County, out of the total population over 16 years of age (37,318), 60.8% or 22,689 individuals are in the labor force, with 4.4% or 998 of them unemployed. The age group with the highest labor force participation rate is 25 to 29 years, with 86.6% or 2,136 individuals in the labor force. Within the labor force, the 16 to 19 years age range has the highest percentage of unemployed individuals, with 13.6% or 110 of them being unemployed.
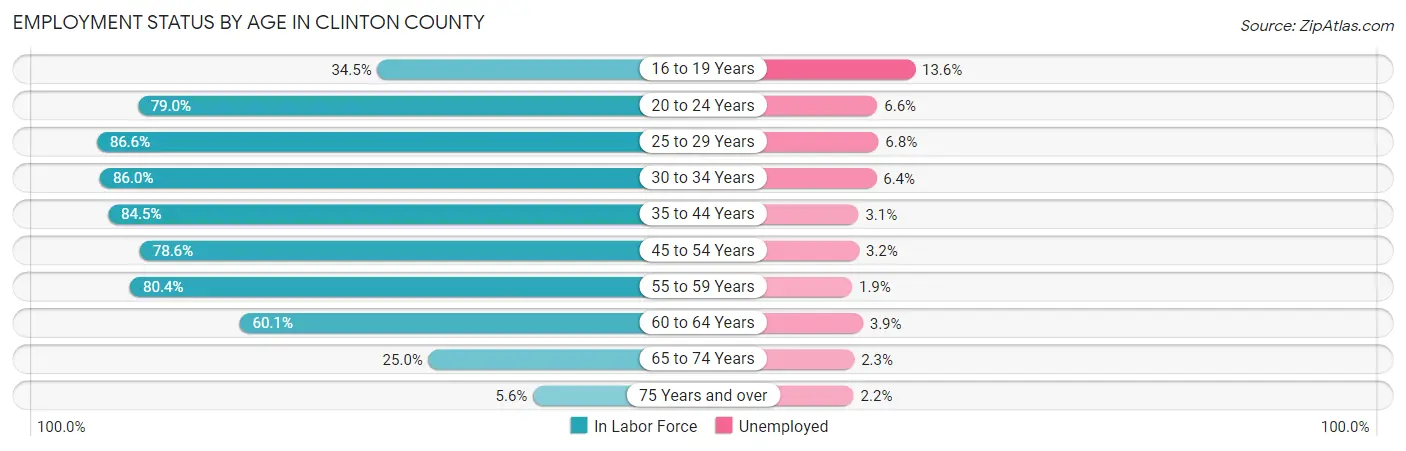
| Age Bracket | In Labor Force | Unemployed |
| 16 to 19 Years | 807 (34.5%) | 110 (13.6%) |
| 20 to 24 Years | 1,991 (79.0%) | 131 (6.6%) |
| 25 to 29 Years | 2,136 (86.6%) | 145 (6.8%) |
| 30 to 34 Years | 2,361 (86.0%) | 151 (6.4%) |
| 35 to 44 Years | 4,503 (84.5%) | 140 (3.1%) |
| 45 to 54 Years | 4,461 (78.6%) | 143 (3.2%) |
| 55 to 59 Years | 2,730 (80.4%) | 52 (1.9%) |
| 60 to 64 Years | 2,180 (60.1%) | 85 (3.9%) |
| 65 to 74 Years | 1,301 (25.0%) | 30 (2.3%) |
| 75 Years and over | 225 (5.6%) | 5 (2.2%) |
| Total | 22,689 (60.8%) | 998 (4.4%) |
Employment Status by Educational Attainment in Clinton County
According to labor force statistics for Clinton County, 79.1% of individuals (18,381) out of the total population between 25 and 64 years of age (23,238) are in the labor force, with 3.9% or 717 of them being unemployed. The group with the highest labor force participation rate are those with the educational attainment of bachelor's degree or higher, with 84.9% or 4,523 individuals in the labor force. Within the labor force, individuals with less than high school education have the highest percentage of unemployment, with 14.8% or 111 of them being unemployed.
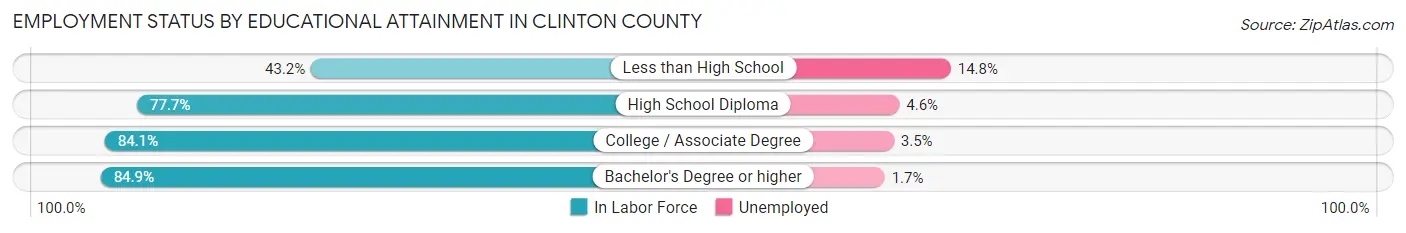
| Educational Attainment | In Labor Force | Unemployed |
| Less than High School | 748 (43.2%) | 256 (14.8%) |
| High School Diploma | 6,118 (77.7%) | 362 (4.6%) |
| College / Associate Degree | 6,985 (84.1%) | 291 (3.5%) |
| Bachelor's Degree or higher | 4,523 (84.9%) | 91 (1.7%) |
| Total | 18,381 (79.1%) | 906 (3.9%) |
Employment Occupations by Sex in Clinton County
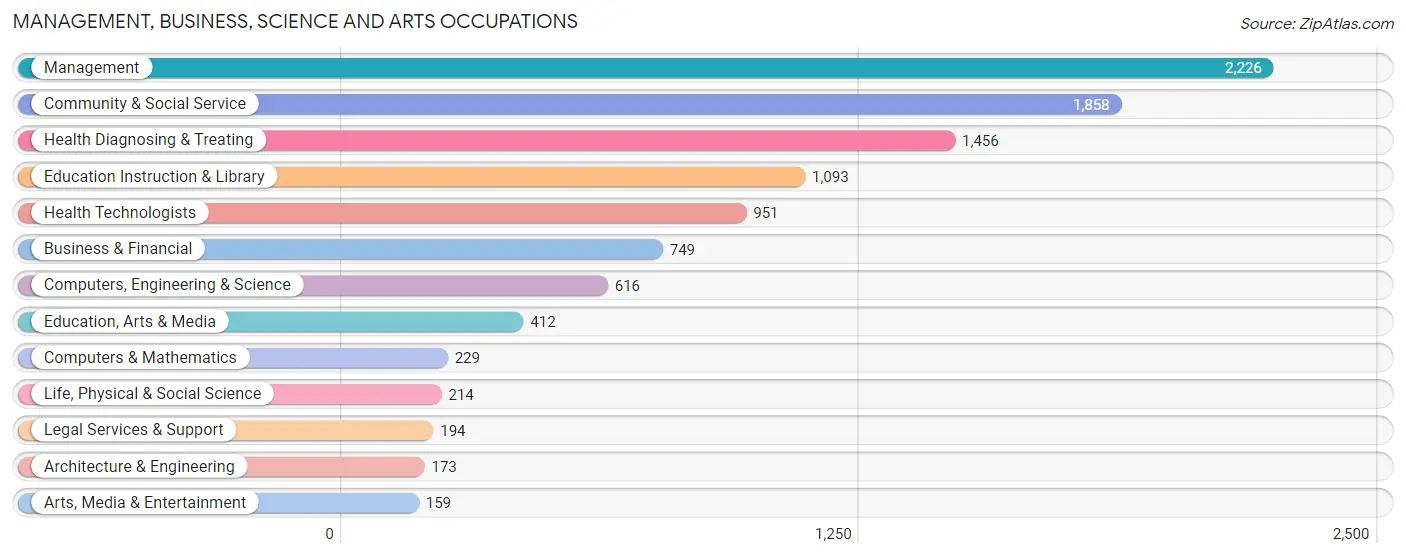
Management, Business, Science and Arts Occupations
The most common Management, Business, Science and Arts occupations in Clinton County are Management (2,226 | 10.3%), Community & Social Service (1,858 | 8.6%), Health Diagnosing & Treating (1,456 | 6.7%), Education Instruction & Library (1,093 | 5.1%), and Health Technologists (951 | 4.4%).
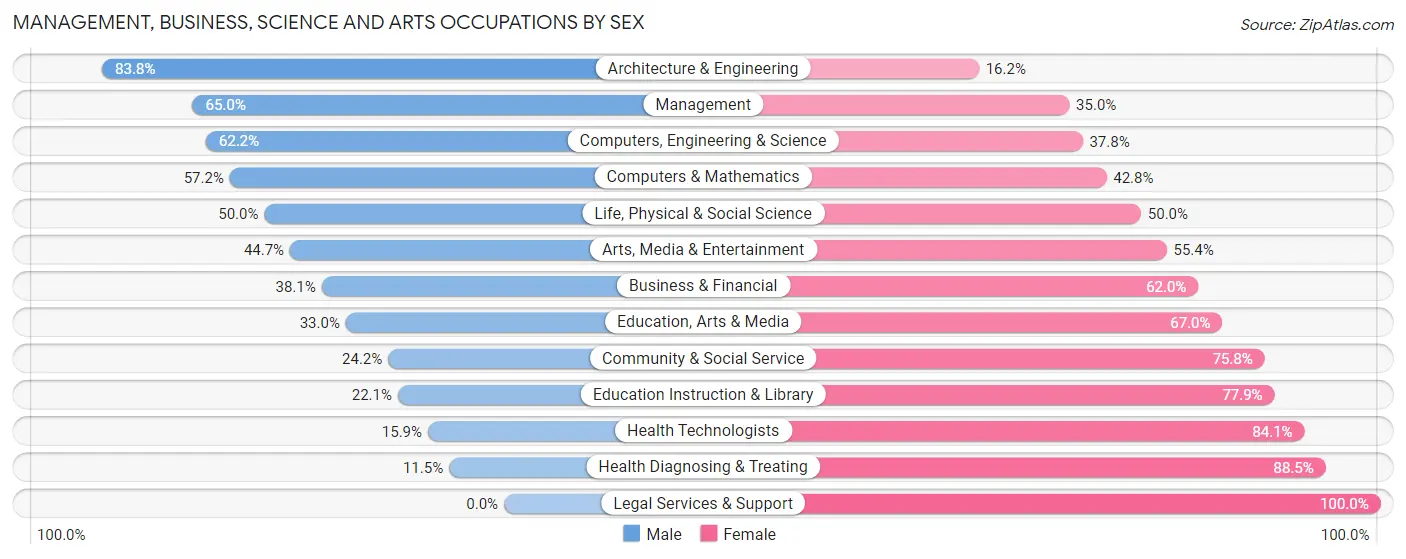
Management, Business, Science and Arts Occupations by Sex
Within the Management, Business, Science and Arts occupations in Clinton County, the most male-oriented occupations are Architecture & Engineering (83.8%), Management (65.0%), and Computers, Engineering & Science (62.2%), while the most female-oriented occupations are Legal Services & Support (100.0%), Health Diagnosing & Treating (88.5%), and Health Technologists (84.1%).
| Occupation | Male | Female |
| Management | 1,446 (65.0%) | 780 (35.0%) |
| Business & Financial | 285 (38.1%) | 464 (62.0%) |
| Computers, Engineering & Science | 383 (62.2%) | 233 (37.8%) |
| Computers & Mathematics | 131 (57.2%) | 98 (42.8%) |
| Architecture & Engineering | 145 (83.8%) | 28 (16.2%) |
| Life, Physical & Social Science | 107 (50.0%) | 107 (50.0%) |
| Community & Social Service | 449 (24.2%) | 1,409 (75.8%) |
| Education, Arts & Media | 136 (33.0%) | 276 (67.0%) |
| Legal Services & Support | 0 (0.0%) | 194 (100.0%) |
| Education Instruction & Library | 242 (22.1%) | 851 (77.9%) |
| Arts, Media & Entertainment | 71 (44.7%) | 88 (55.3%) |
| Health Diagnosing & Treating | 167 (11.5%) | 1,289 (88.5%) |
| Health Technologists | 151 (15.9%) | 800 (84.1%) |
| Total (Category) | 2,730 (39.5%) | 4,175 (60.5%) |
| Total (Overall) | 10,879 (50.3%) | 10,738 (49.7%) |
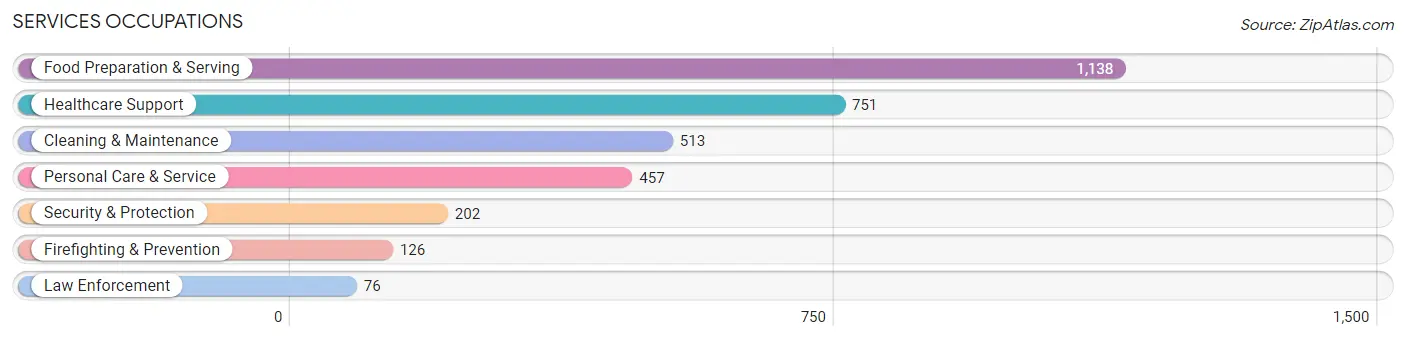
Services Occupations
The most common Services occupations in Clinton County are Food Preparation & Serving (1,138 | 5.3%), Healthcare Support (751 | 3.5%), Cleaning & Maintenance (513 | 2.4%), Personal Care & Service (457 | 2.1%), and Security & Protection (202 | 0.9%).
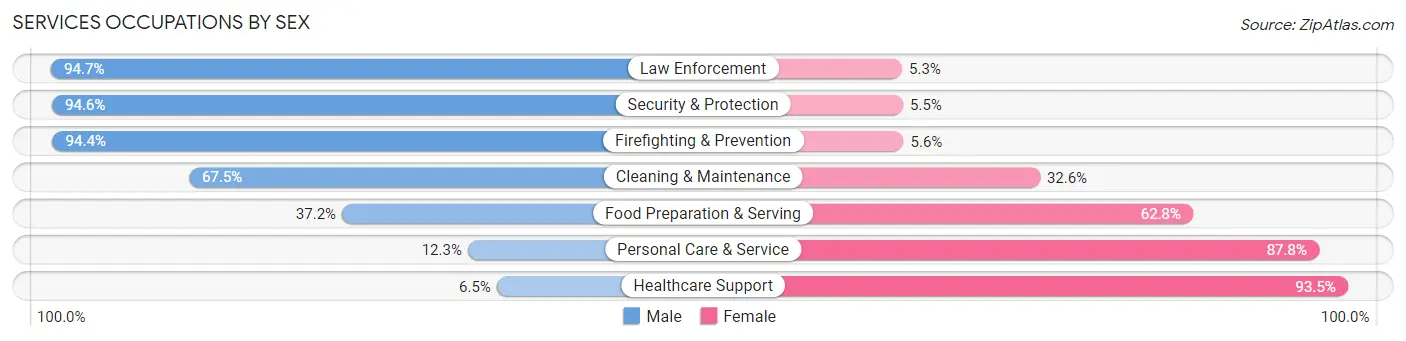
Services Occupations by Sex
Within the Services occupations in Clinton County, the most male-oriented occupations are Law Enforcement (94.7%), Security & Protection (94.6%), and Firefighting & Prevention (94.4%), while the most female-oriented occupations are Healthcare Support (93.5%), Personal Care & Service (87.7%), and Food Preparation & Serving (62.8%).
| Occupation | Male | Female |
| Healthcare Support | 49 (6.5%) | 702 (93.5%) |
| Security & Protection | 191 (94.6%) | 11 (5.4%) |
| Firefighting & Prevention | 119 (94.4%) | 7 (5.6%) |
| Law Enforcement | 72 (94.7%) | 4 (5.3%) |
| Food Preparation & Serving | 423 (37.2%) | 715 (62.8%) |
| Cleaning & Maintenance | 346 (67.4%) | 167 (32.6%) |
| Personal Care & Service | 56 (12.2%) | 401 (87.7%) |
| Total (Category) | 1,065 (34.8%) | 1,996 (65.2%) |
| Total (Overall) | 10,879 (50.3%) | 10,738 (49.7%) |
Sales and Office Occupations
The most common Sales and Office occupations in Clinton County are Office & Administration (2,711 | 12.5%), and Sales & Related (1,882 | 8.7%).
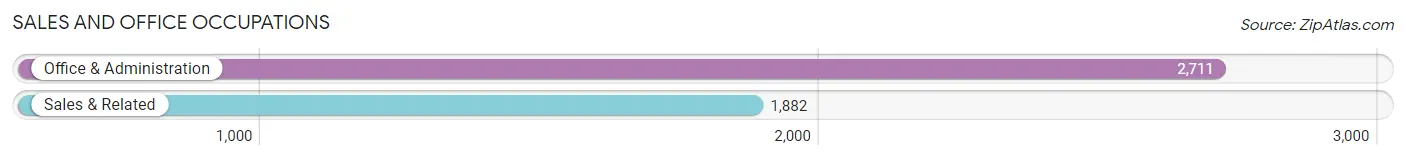
Sales and Office Occupations by Sex

| Occupation | Male | Female |
| Sales & Related | 732 (38.9%) | 1,150 (61.1%) |
| Office & Administration | 535 (19.7%) | 2,176 (80.3%) |
| Total (Category) | 1,267 (27.6%) | 3,326 (72.4%) |
| Total (Overall) | 10,879 (50.3%) | 10,738 (49.7%) |
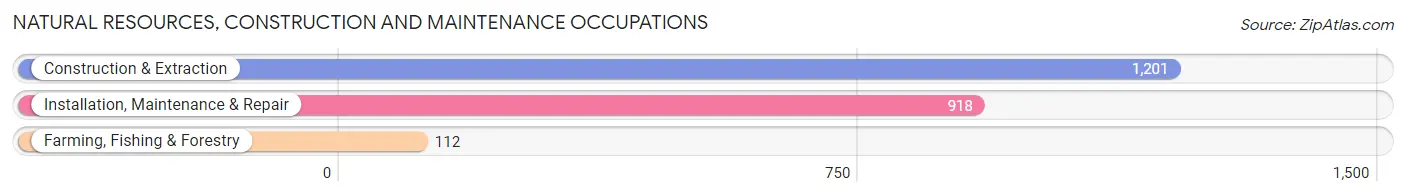
Natural Resources, Construction and Maintenance Occupations
The most common Natural Resources, Construction and Maintenance occupations in Clinton County are Construction & Extraction (1,201 | 5.6%), Installation, Maintenance & Repair (918 | 4.3%), and Farming, Fishing & Forestry (112 | 0.5%).
Natural Resources, Construction and Maintenance Occupations by Sex
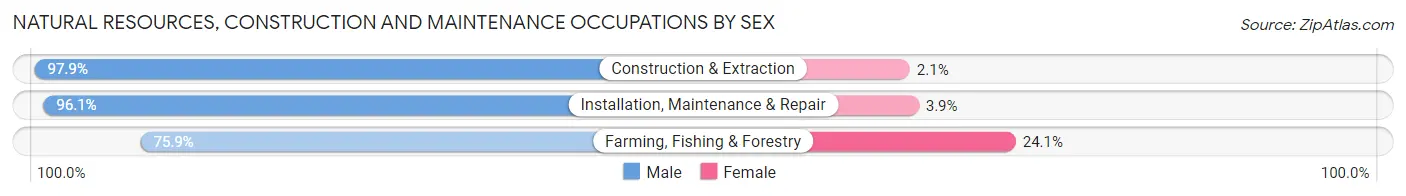
| Occupation | Male | Female |
| Farming, Fishing & Forestry | 85 (75.9%) | 27 (24.1%) |
| Construction & Extraction | 1,176 (97.9%) | 25 (2.1%) |
| Installation, Maintenance & Repair | 882 (96.1%) | 36 (3.9%) |
| Total (Category) | 2,143 (96.1%) | 88 (3.9%) |
| Total (Overall) | 10,879 (50.3%) | 10,738 (49.7%) |
Production, Transportation and Moving Occupations
The most common Production, Transportation and Moving occupations in Clinton County are Production (2,402 | 11.1%), Material Moving (1,412 | 6.5%), and Transportation (1,013 | 4.7%).
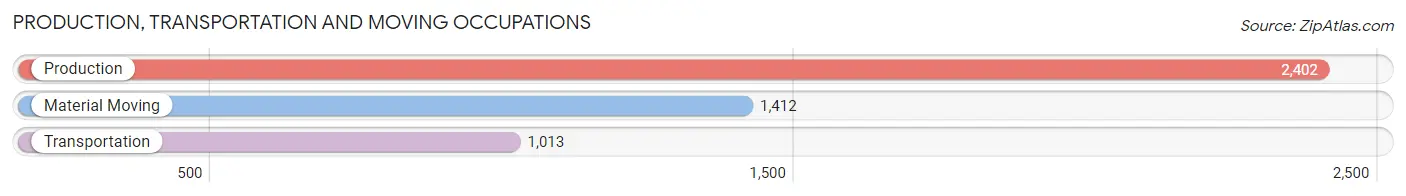
Production, Transportation and Moving Occupations by Sex
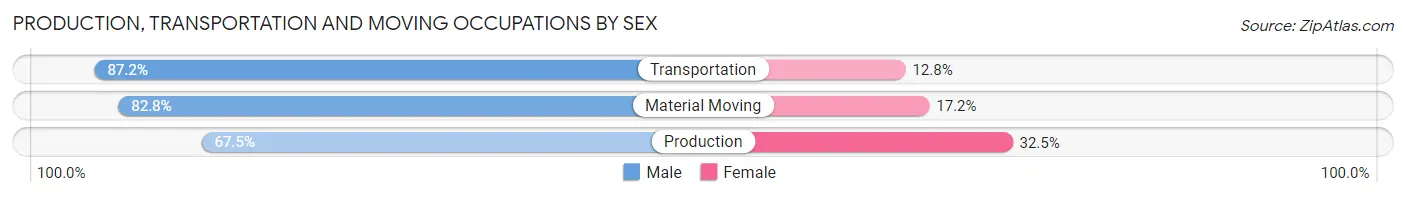
| Occupation | Male | Female |
| Production | 1,622 (67.5%) | 780 (32.5%) |
| Transportation | 883 (87.2%) | 130 (12.8%) |
| Material Moving | 1,169 (82.8%) | 243 (17.2%) |
| Total (Category) | 3,674 (76.1%) | 1,153 (23.9%) |
| Total (Overall) | 10,879 (50.3%) | 10,738 (49.7%) |
Employment Industries by Sex in Clinton County
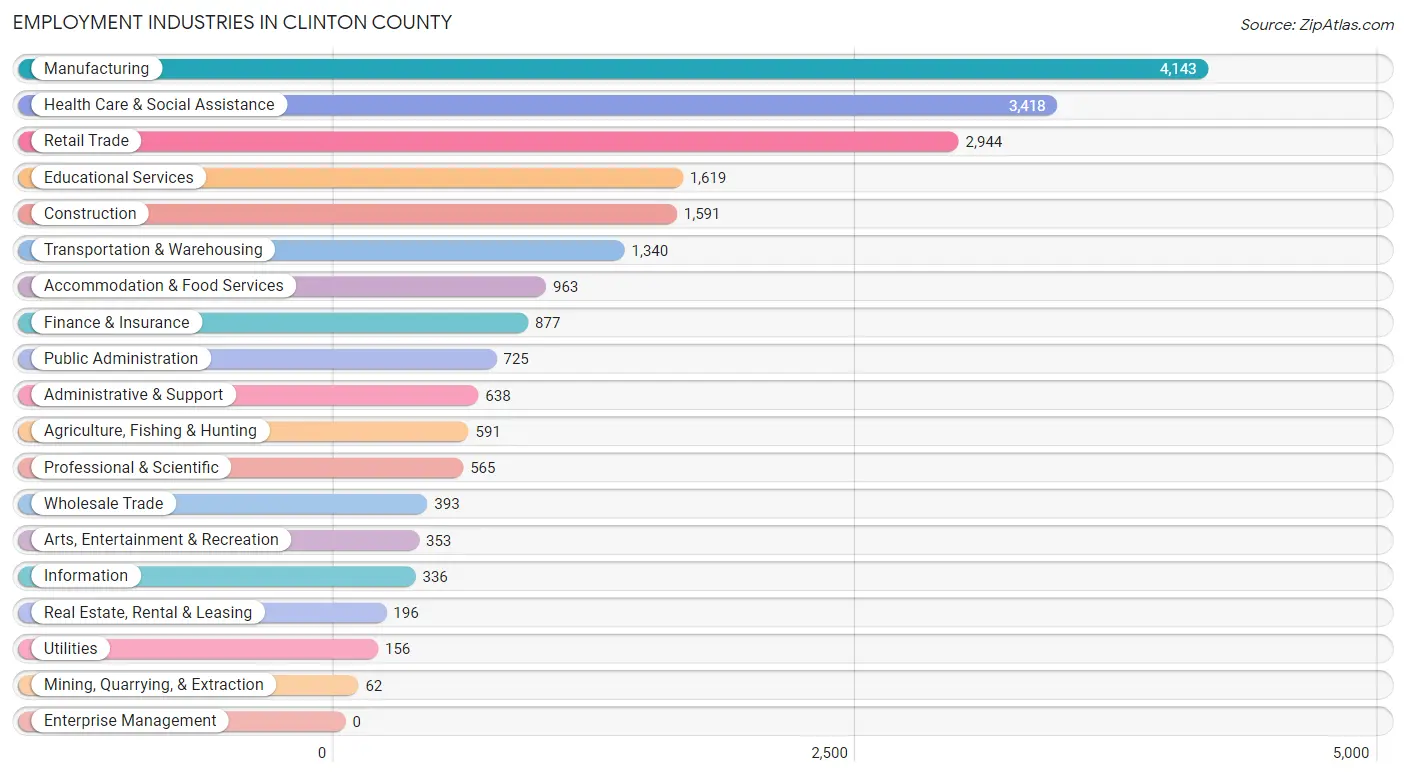
Employment Industries in Clinton County
The major employment industries in Clinton County include Manufacturing (4,143 | 19.2%), Health Care & Social Assistance (3,418 | 15.8%), Retail Trade (2,944 | 13.6%), Educational Services (1,619 | 7.5%), and Construction (1,591 | 7.4%).
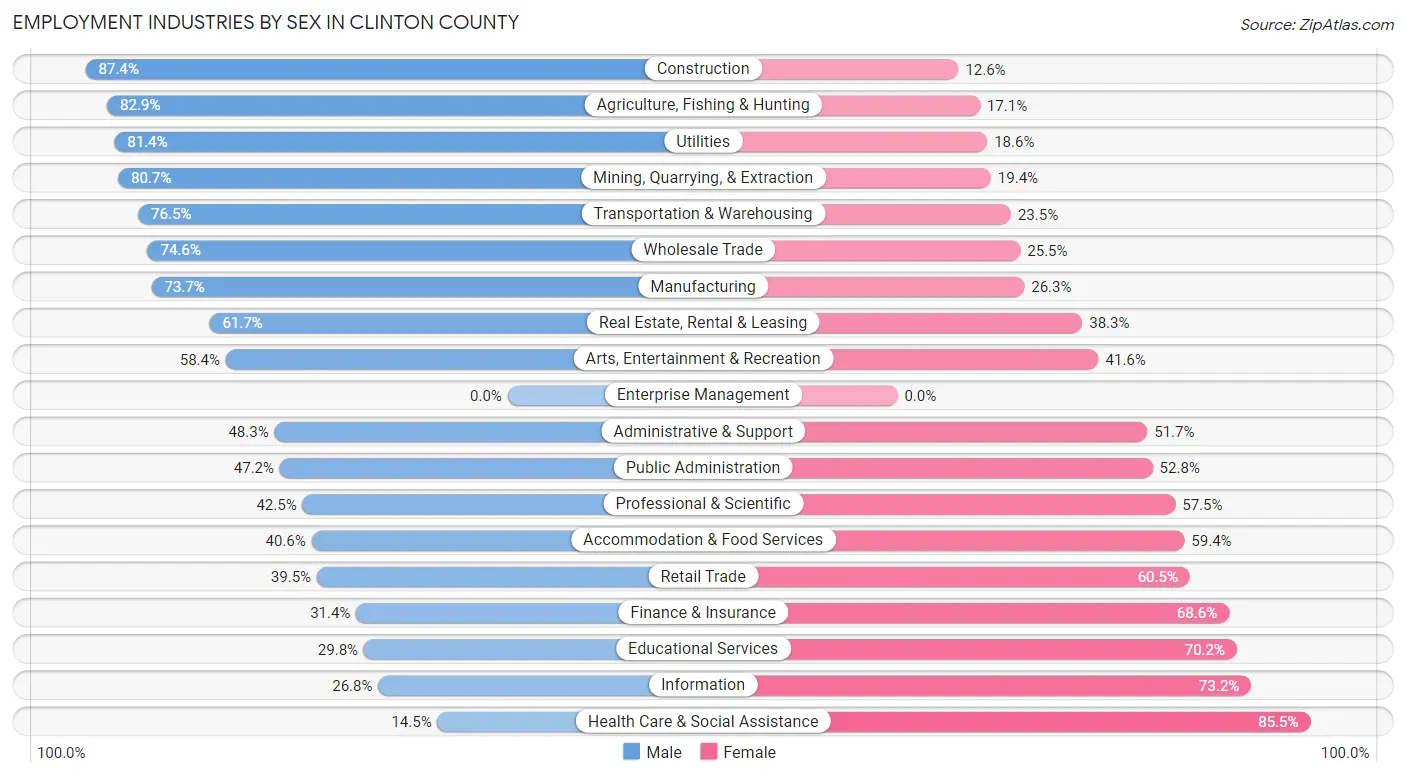
Employment Industries by Sex in Clinton County
The Clinton County industries that see more men than women are Construction (87.4%), Agriculture, Fishing & Hunting (82.9%), and Utilities (81.4%), whereas the industries that tend to have a higher number of women are Health Care & Social Assistance (85.5%), Information (73.2%), and Educational Services (70.2%).
| Industry | Male | Female |
| Agriculture, Fishing & Hunting | 490 (82.9%) | 101 (17.1%) |
| Mining, Quarrying, & Extraction | 50 (80.6%) | 12 (19.4%) |
| Construction | 1,390 (87.4%) | 201 (12.6%) |
| Manufacturing | 3,055 (73.7%) | 1,088 (26.3%) |
| Wholesale Trade | 293 (74.6%) | 100 (25.5%) |
| Retail Trade | 1,163 (39.5%) | 1,781 (60.5%) |
| Transportation & Warehousing | 1,025 (76.5%) | 315 (23.5%) |
| Utilities | 127 (81.4%) | 29 (18.6%) |
| Information | 90 (26.8%) | 246 (73.2%) |
| Finance & Insurance | 275 (31.4%) | 602 (68.6%) |
| Real Estate, Rental & Leasing | 121 (61.7%) | 75 (38.3%) |
| Professional & Scientific | 240 (42.5%) | 325 (57.5%) |
| Enterprise Management | 0 (0.0%) | 0 (0.0%) |
| Administrative & Support | 308 (48.3%) | 330 (51.7%) |
| Educational Services | 482 (29.8%) | 1,137 (70.2%) |
| Health Care & Social Assistance | 497 (14.5%) | 2,921 (85.5%) |
| Arts, Entertainment & Recreation | 206 (58.4%) | 147 (41.6%) |
| Accommodation & Food Services | 391 (40.6%) | 572 (59.4%) |
| Public Administration | 342 (47.2%) | 383 (52.8%) |
| Total | 10,879 (50.3%) | 10,738 (49.7%) |
Education in Clinton County
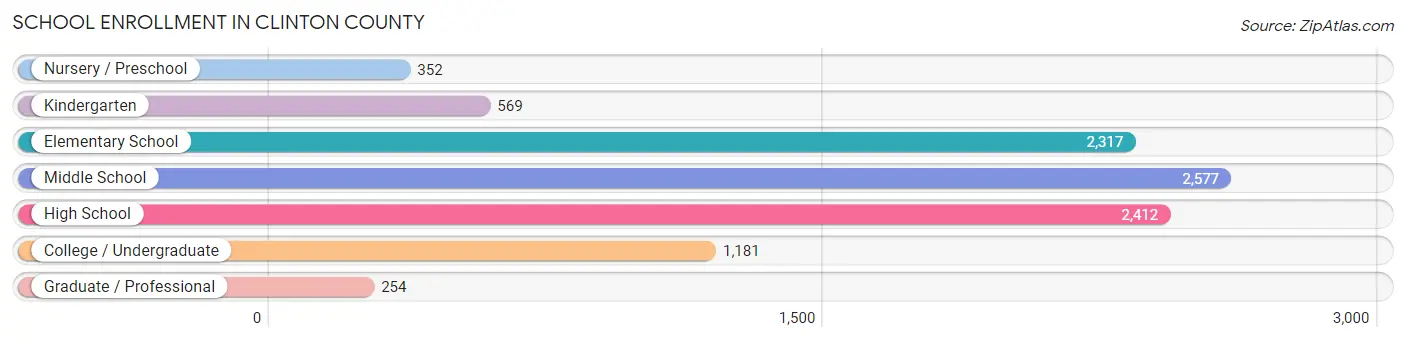
School Enrollment in Clinton County
The most common levels of schooling among the 9,662 students in Clinton County are middle school (2,577 | 26.7%), high school (2,412 | 25.0%), and elementary school (2,317 | 24.0%).
| School Level | # Students | % Students |
| Nursery / Preschool | 352 | 3.6% |
| Kindergarten | 569 | 5.9% |
| Elementary School | 2,317 | 24.0% |
| Middle School | 2,577 | 26.7% |
| High School | 2,412 | 25.0% |
| College / Undergraduate | 1,181 | 12.2% |
| Graduate / Professional | 254 | 2.6% |
| Total | 9,662 | 100.0% |
School Enrollment by Age by Funding Source in Clinton County
Out of a total of 9,662 students who are enrolled in schools in Clinton County, 792 (8.2%) attend a private institution, while the remaining 8,870 (91.8%) are enrolled in public schools. The age group of 35 years and over has the highest likelihood of being enrolled in private schools, with 75 (25.9% in the age bracket) enrolled. Conversely, the age group of 3 to 4 year olds has the lowest likelihood of being enrolled in a private school, with 225 (97.8% in the age bracket) attending a public institution.
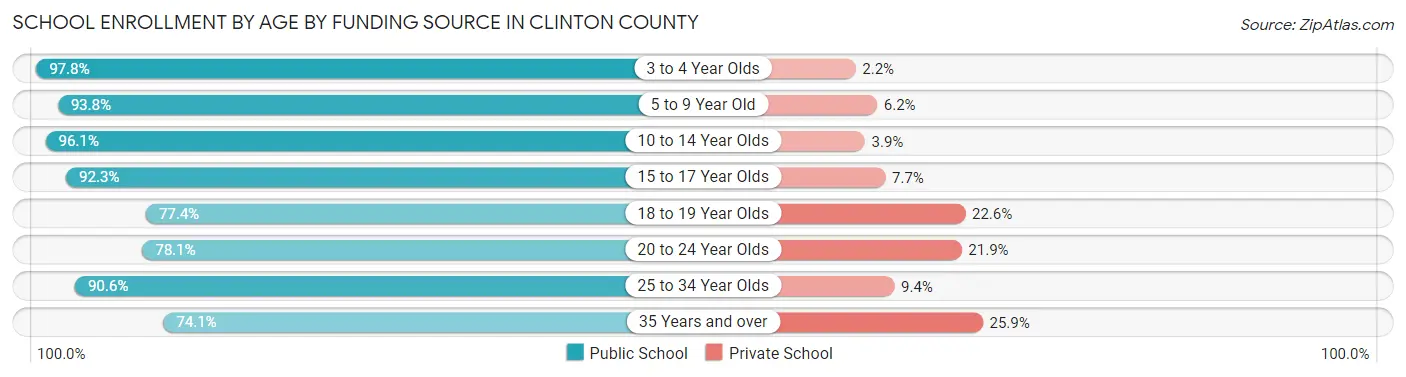
| Age Bracket | Public School | Private School |
| 3 to 4 Year Olds | 225 (97.8%) | 5 (2.2%) |
| 5 to 9 Year Old | 2,202 (93.8%) | 145 (6.2%) |
| 10 to 14 Year Olds | 3,423 (96.1%) | 139 (3.9%) |
| 15 to 17 Year Olds | 1,602 (92.3%) | 134 (7.7%) |
| 18 to 19 Year Olds | 623 (77.4%) | 182 (22.6%) |
| 20 to 24 Year Olds | 324 (78.1%) | 91 (21.9%) |
| 25 to 34 Year Olds | 251 (90.6%) | 26 (9.4%) |
| 35 Years and over | 215 (74.1%) | 75 (25.9%) |
| Total | 8,870 (91.8%) | 792 (8.2%) |
Educational Attainment by Field of Study in Clinton County
Education (1,704 | 22.1%), business (1,453 | 18.9%), bio, nature & agricultural (775 | 10.1%), science & technology (697 | 9.0%), and arts & humanities (525 | 6.8%) are the most common fields of study among 7,705 individuals in Clinton County who have obtained a bachelor's degree or higher.
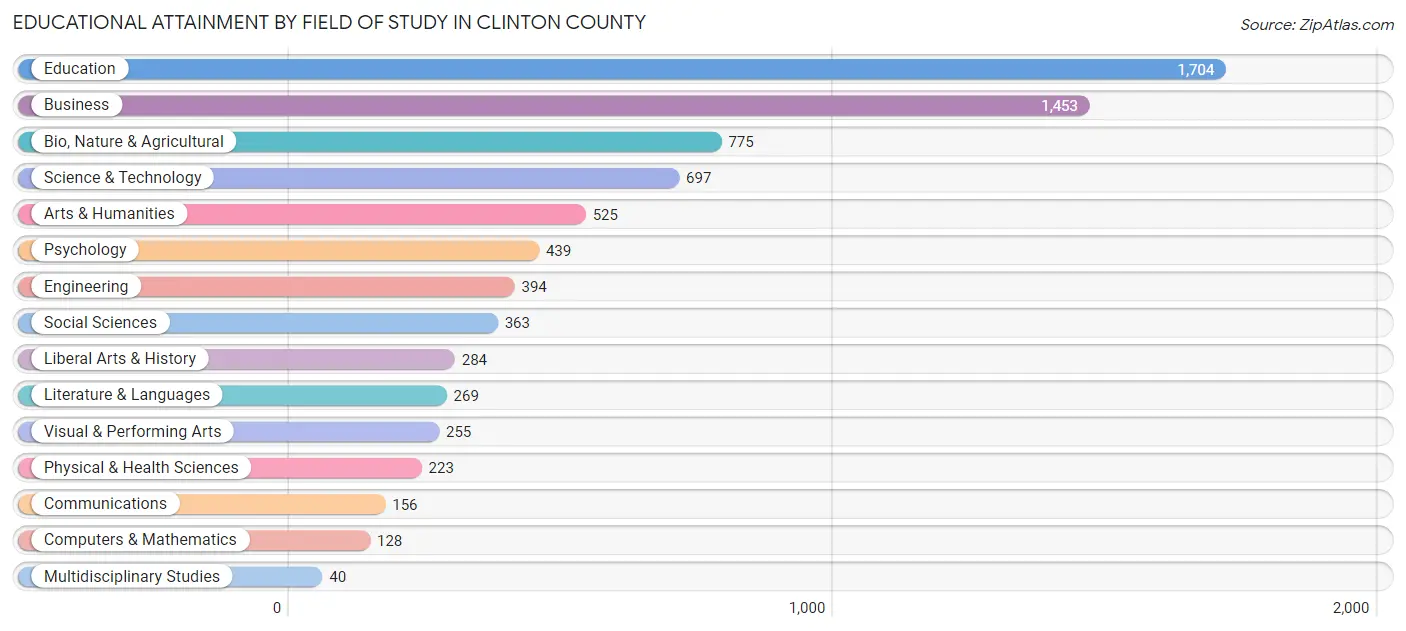
| Field of Study | # Graduates | % Graduates |
| Computers & Mathematics | 128 | 1.7% |
| Bio, Nature & Agricultural | 775 | 10.1% |
| Physical & Health Sciences | 223 | 2.9% |
| Psychology | 439 | 5.7% |
| Social Sciences | 363 | 4.7% |
| Engineering | 394 | 5.1% |
| Multidisciplinary Studies | 40 | 0.5% |
| Science & Technology | 697 | 9.0% |
| Business | 1,453 | 18.9% |
| Education | 1,704 | 22.1% |
| Literature & Languages | 269 | 3.5% |
| Liberal Arts & History | 284 | 3.7% |
| Visual & Performing Arts | 255 | 3.3% |
| Communications | 156 | 2.0% |
| Arts & Humanities | 525 | 6.8% |
| Total | 7,705 | 100.0% |
Transportation & Commute in Clinton County
Vehicle Availability by Sex in Clinton County
The most prevalent vehicle ownership categories in Clinton County are males with 2 vehicles (4,505, accounting for 41.8%) and females with 2 vehicles (3,887, making up 43.2%).
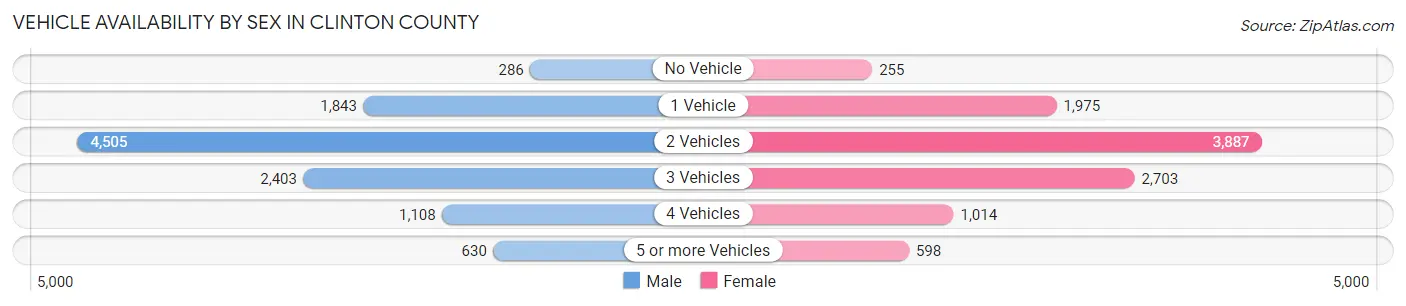
| Vehicles Available | Male | Female |
| No Vehicle | 286 (2.6%) | 255 (2.4%) |
| 1 Vehicle | 1,843 (17.1%) | 1,975 (18.9%) |
| 2 Vehicles | 4,505 (41.8%) | 3,887 (37.3%) |
| 3 Vehicles | 2,403 (22.3%) | 2,703 (25.9%) |
| 4 Vehicles | 1,108 (10.3%) | 1,014 (9.7%) |
| 5 or more Vehicles | 630 (5.9%) | 598 (5.7%) |
| Total | 10,775 (100.0%) | 10,432 (100.0%) |
Commute Time in Clinton County
The most frequently occuring commute durations in Clinton County are 5 to 9 minutes (4,207 commuters, 21.0%), 10 to 14 minutes (3,618 commuters, 18.1%), and 15 to 19 minutes (2,575 commuters, 12.9%).
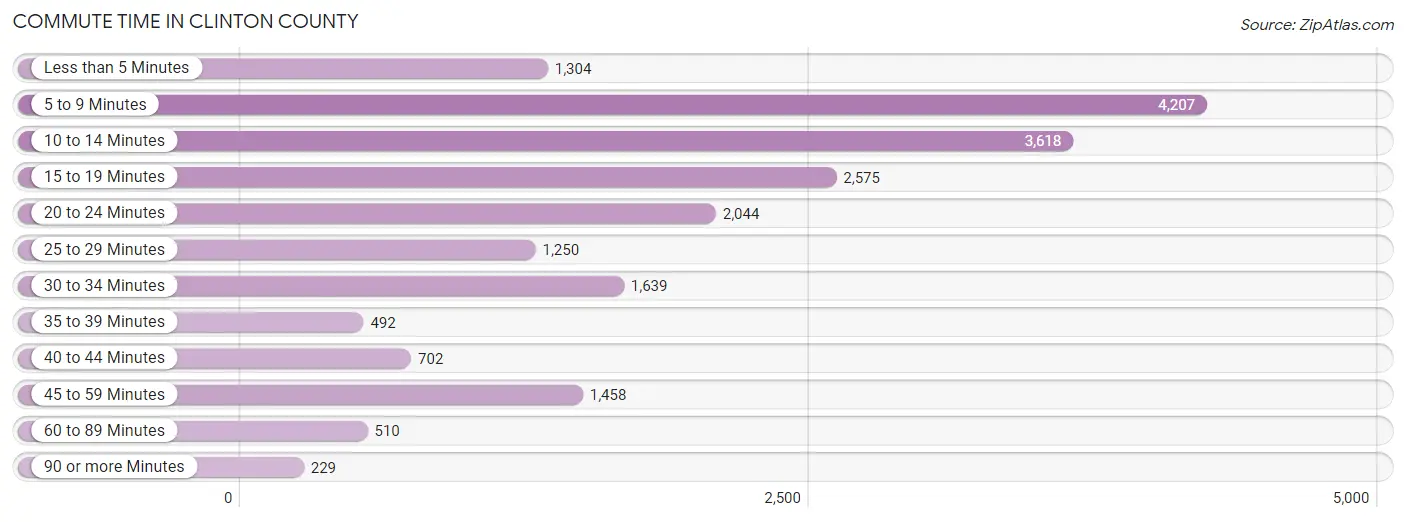
| Commute Time | # Commuters | % Commuters |
| Less than 5 Minutes | 1,304 | 6.5% |
| 5 to 9 Minutes | 4,207 | 21.0% |
| 10 to 14 Minutes | 3,618 | 18.1% |
| 15 to 19 Minutes | 2,575 | 12.9% |
| 20 to 24 Minutes | 2,044 | 10.2% |
| 25 to 29 Minutes | 1,250 | 6.2% |
| 30 to 34 Minutes | 1,639 | 8.2% |
| 35 to 39 Minutes | 492 | 2.5% |
| 40 to 44 Minutes | 702 | 3.5% |
| 45 to 59 Minutes | 1,458 | 7.3% |
| 60 to 89 Minutes | 510 | 2.5% |
| 90 or more Minutes | 229 | 1.1% |
Commute Time by Sex in Clinton County
The most common commute times in Clinton County are 5 to 9 minutes (1,997 commuters, 19.5%) for males and 5 to 9 minutes (2,210 commuters, 22.6%) for females.
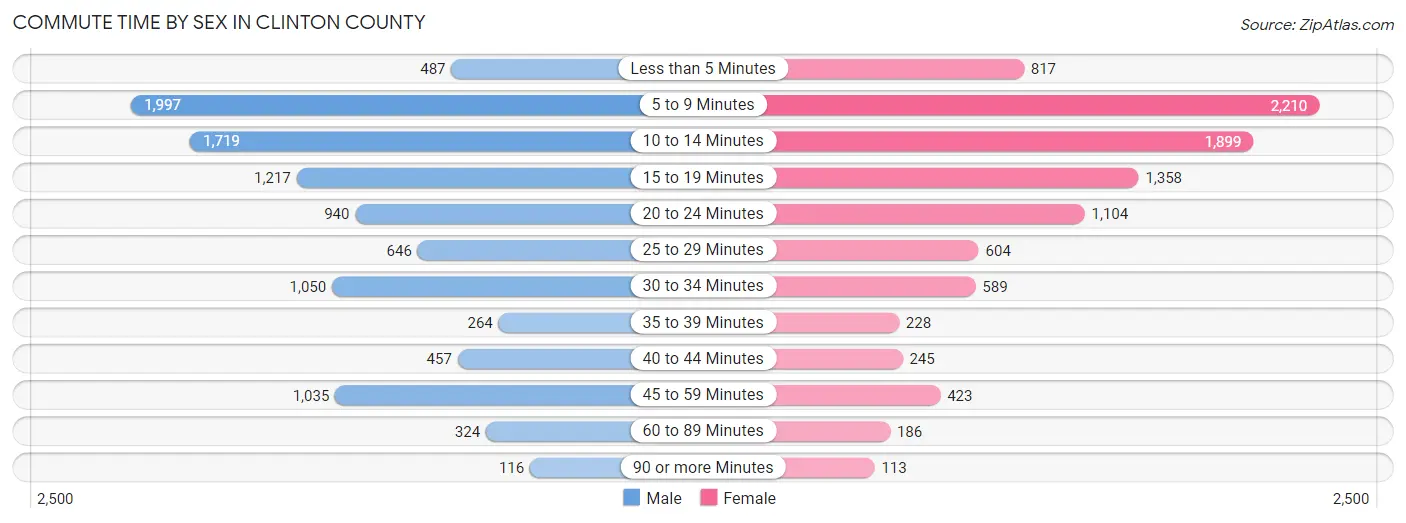
| Commute Time | Male | Female |
| Less than 5 Minutes | 487 (4.8%) | 817 (8.4%) |
| 5 to 9 Minutes | 1,997 (19.5%) | 2,210 (22.6%) |
| 10 to 14 Minutes | 1,719 (16.8%) | 1,899 (19.4%) |
| 15 to 19 Minutes | 1,217 (11.9%) | 1,358 (13.9%) |
| 20 to 24 Minutes | 940 (9.2%) | 1,104 (11.3%) |
| 25 to 29 Minutes | 646 (6.3%) | 604 (6.2%) |
| 30 to 34 Minutes | 1,050 (10.2%) | 589 (6.0%) |
| 35 to 39 Minutes | 264 (2.6%) | 228 (2.3%) |
| 40 to 44 Minutes | 457 (4.5%) | 245 (2.5%) |
| 45 to 59 Minutes | 1,035 (10.1%) | 423 (4.3%) |
| 60 to 89 Minutes | 324 (3.2%) | 186 (1.9%) |
| 90 or more Minutes | 116 (1.1%) | 113 (1.2%) |
Time of Departure to Work by Sex in Clinton County
The most frequent times of departure to work in Clinton County are 7:00 AM to 7:29 AM (1,319, 12.9%) for males and 7:30 AM to 7:59 AM (1,811, 18.5%) for females.
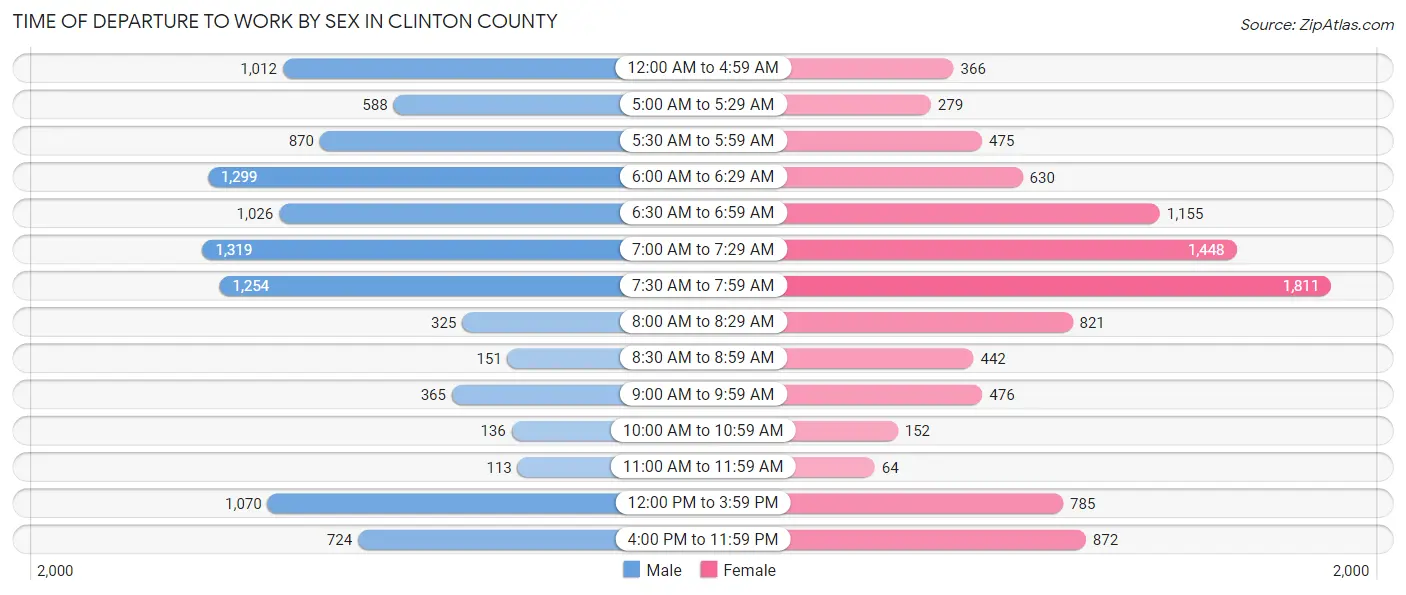
| Time of Departure | Male | Female |
| 12:00 AM to 4:59 AM | 1,012 (9.9%) | 366 (3.7%) |
| 5:00 AM to 5:29 AM | 588 (5.7%) | 279 (2.9%) |
| 5:30 AM to 5:59 AM | 870 (8.5%) | 475 (4.9%) |
| 6:00 AM to 6:29 AM | 1,299 (12.7%) | 630 (6.4%) |
| 6:30 AM to 6:59 AM | 1,026 (10.0%) | 1,155 (11.8%) |
| 7:00 AM to 7:29 AM | 1,319 (12.9%) | 1,448 (14.8%) |
| 7:30 AM to 7:59 AM | 1,254 (12.2%) | 1,811 (18.5%) |
| 8:00 AM to 8:29 AM | 325 (3.2%) | 821 (8.4%) |
| 8:30 AM to 8:59 AM | 151 (1.5%) | 442 (4.5%) |
| 9:00 AM to 9:59 AM | 365 (3.6%) | 476 (4.9%) |
| 10:00 AM to 10:59 AM | 136 (1.3%) | 152 (1.5%) |
| 11:00 AM to 11:59 AM | 113 (1.1%) | 64 (0.6%) |
| 12:00 PM to 3:59 PM | 1,070 (10.4%) | 785 (8.0%) |
| 4:00 PM to 11:59 PM | 724 (7.1%) | 872 (8.9%) |
| Total | 10,252 (100.0%) | 9,776 (100.0%) |
Housing Occupancy in Clinton County
Occupancy by Ownership in Clinton County
Of the total 19,174 dwellings in Clinton County, owner-occupied units account for 14,056 (73.3%), while renter-occupied units make up 5,118 (26.7%).
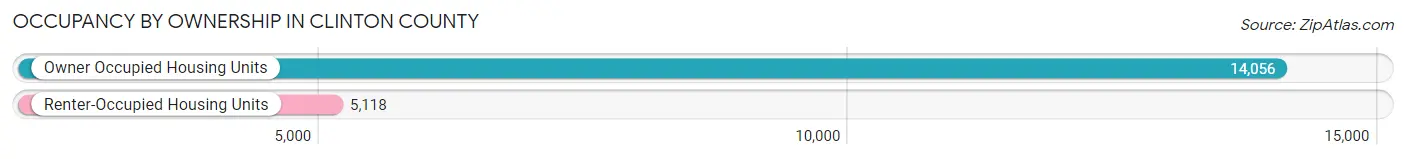
| Occupancy | # Housing Units | % Housing Units |
| Owner Occupied Housing Units | 14,056 | 73.3% |
| Renter-Occupied Housing Units | 5,118 | 26.7% |
| Total Occupied Housing Units | 19,174 | 100.0% |
Occupancy by Household Size in Clinton County
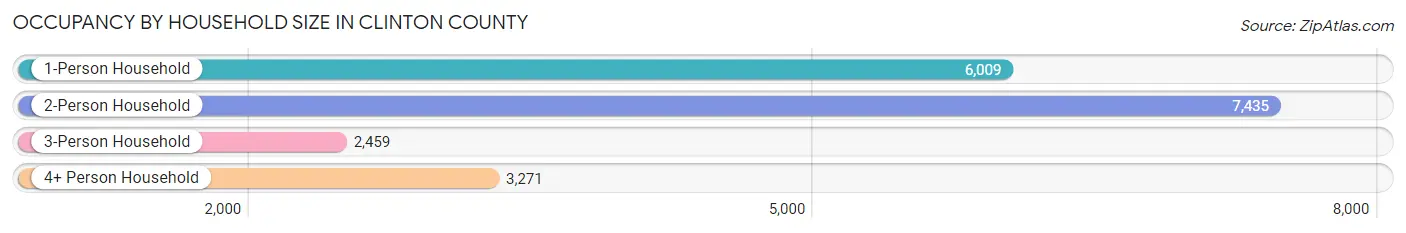
| Household Size | # Housing Units | % Housing Units |
| 1-Person Household | 6,009 | 31.3% |
| 2-Person Household | 7,435 | 38.8% |
| 3-Person Household | 2,459 | 12.8% |
| 4+ Person Household | 3,271 | 17.1% |
| Total Housing Units | 19,174 | 100.0% |
Occupancy by Ownership by Household Size in Clinton County
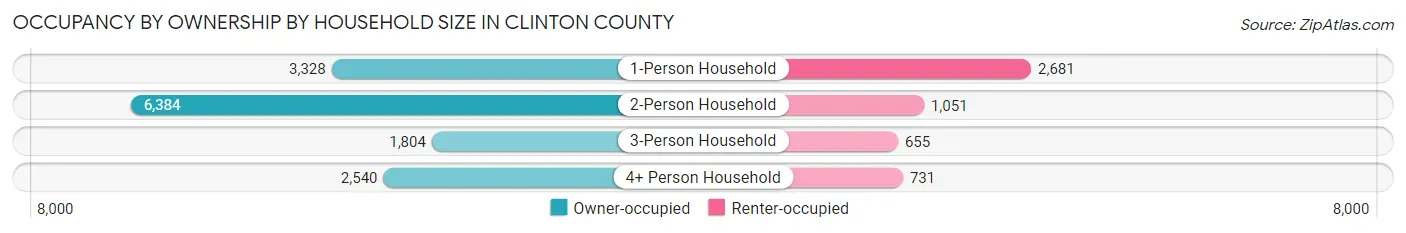
| Household Size | Owner-occupied | Renter-occupied |
| 1-Person Household | 3,328 (55.4%) | 2,681 (44.6%) |
| 2-Person Household | 6,384 (85.9%) | 1,051 (14.1%) |
| 3-Person Household | 1,804 (73.4%) | 655 (26.6%) |
| 4+ Person Household | 2,540 (77.6%) | 731 (22.4%) |
| Total Housing Units | 14,056 (73.3%) | 5,118 (26.7%) |
Occupancy by Educational Attainment in Clinton County
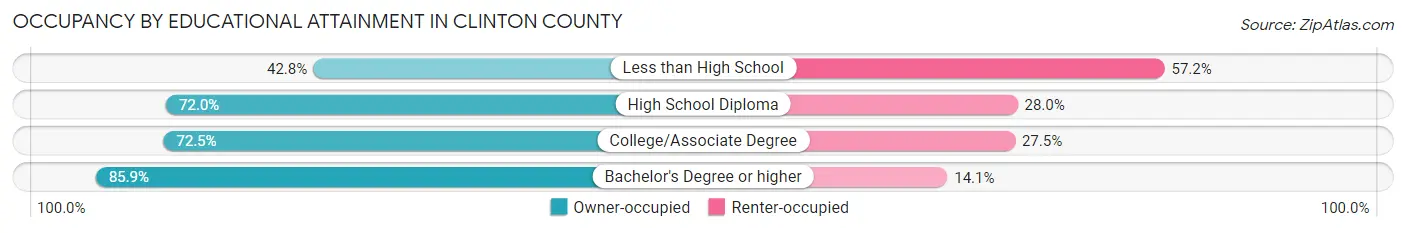
| Household Size | Owner-occupied | Renter-occupied |
| Less than High School | 534 (42.8%) | 713 (57.2%) |
| High School Diploma | 4,846 (72.0%) | 1,887 (28.0%) |
| College/Associate Degree | 5,076 (72.5%) | 1,927 (27.5%) |
| Bachelor's Degree or higher | 3,600 (85.9%) | 591 (14.1%) |
Occupancy by Age of Householder in Clinton County
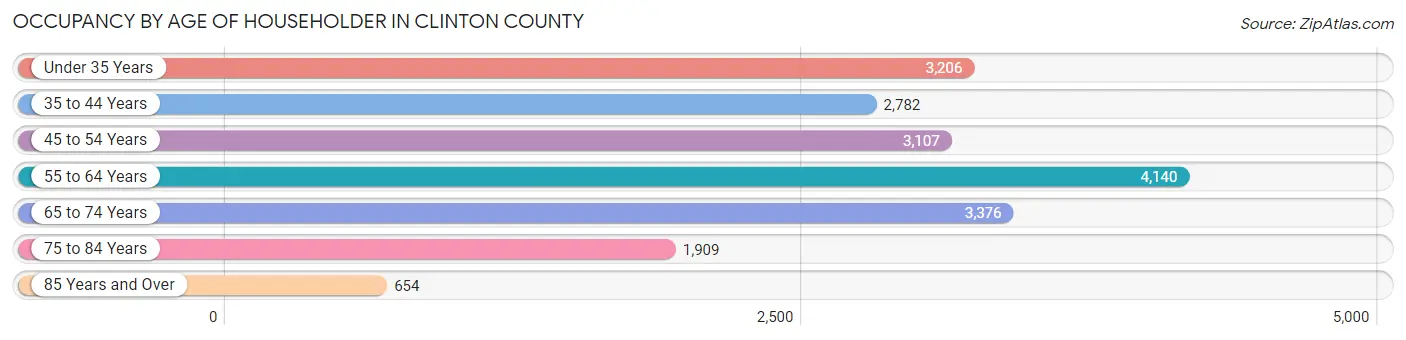
| Age Bracket | # Households | % Households |
| Under 35 Years | 3,206 | 16.7% |
| 35 to 44 Years | 2,782 | 14.5% |
| 45 to 54 Years | 3,107 | 16.2% |
| 55 to 64 Years | 4,140 | 21.6% |
| 65 to 74 Years | 3,376 | 17.6% |
| 75 to 84 Years | 1,909 | 10.0% |
| 85 Years and Over | 654 | 3.4% |
| Total | 19,174 | 100.0% |
Housing Finances in Clinton County
Median Income by Occupancy in Clinton County
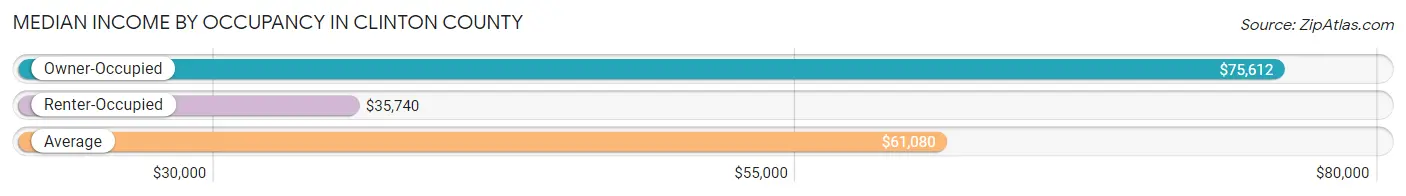
| Occupancy Type | # Households | Median Income |
| Owner-Occupied | 14,056 (73.3%) | $75,612 |
| Renter-Occupied | 5,118 (26.7%) | $35,740 |
| Average | 19,174 (100.0%) | $61,080 |
Occupancy by Householder Income Bracket in Clinton County
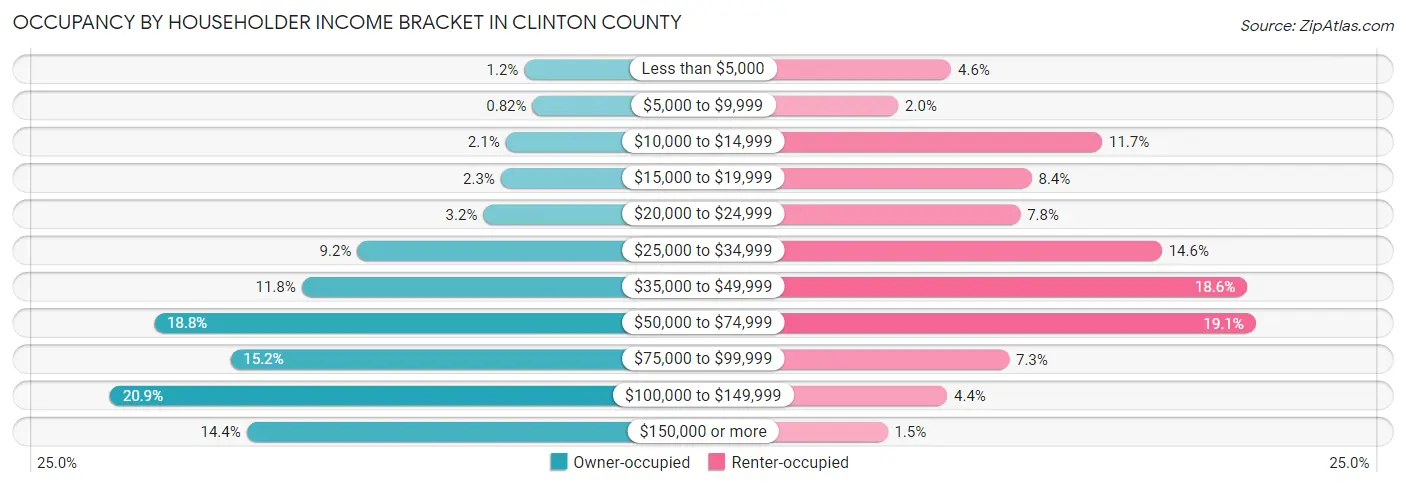
| Income Bracket | Owner-occupied | Renter-occupied |
| Less than $5,000 | 170 (1.2%) | 233 (4.5%) |
| $5,000 to $9,999 | 115 (0.8%) | 104 (2.0%) |
| $10,000 to $14,999 | 295 (2.1%) | 601 (11.7%) |
| $15,000 to $19,999 | 328 (2.3%) | 429 (8.4%) |
| $20,000 to $24,999 | 444 (3.2%) | 401 (7.8%) |
| $25,000 to $34,999 | 1,287 (9.2%) | 746 (14.6%) |
| $35,000 to $49,999 | 1,660 (11.8%) | 954 (18.6%) |
| $50,000 to $74,999 | 2,648 (18.8%) | 975 (19.1%) |
| $75,000 to $99,999 | 2,137 (15.2%) | 374 (7.3%) |
| $100,000 to $149,999 | 2,944 (20.9%) | 223 (4.4%) |
| $150,000 or more | 2,028 (14.4%) | 78 (1.5%) |
| Total | 14,056 (100.0%) | 5,118 (100.0%) |
Monthly Housing Cost Tiers in Clinton County
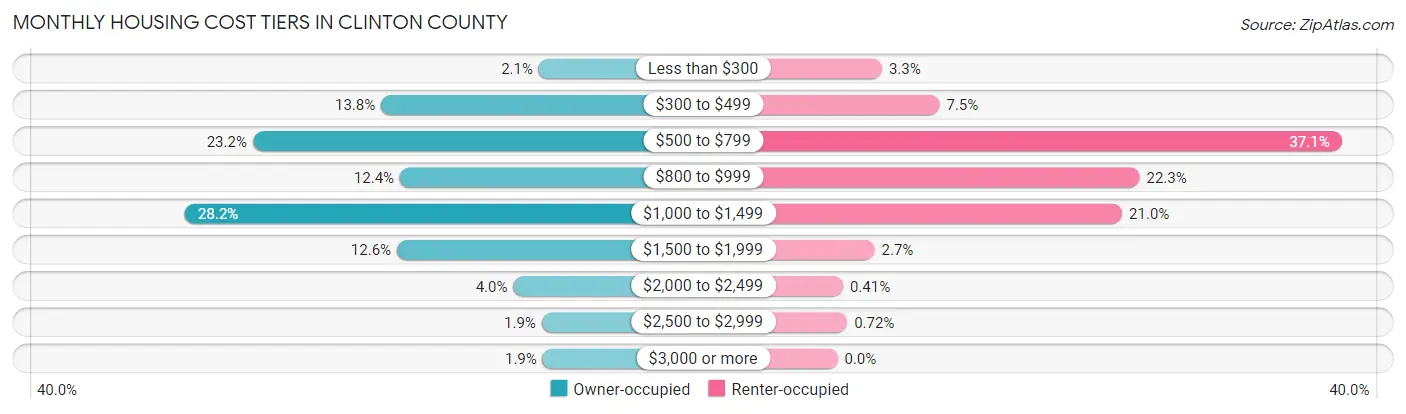
| Monthly Cost | Owner-occupied | Renter-occupied |
| Less than $300 | 300 (2.1%) | 168 (3.3%) |
| $300 to $499 | 1,933 (13.8%) | 385 (7.5%) |
| $500 to $799 | 3,261 (23.2%) | 1,900 (37.1%) |
| $800 to $999 | 1,738 (12.4%) | 1,139 (22.3%) |
| $1,000 to $1,499 | 3,962 (28.2%) | 1,073 (21.0%) |
| $1,500 to $1,999 | 1,768 (12.6%) | 140 (2.7%) |
| $2,000 to $2,499 | 564 (4.0%) | 21 (0.4%) |
| $2,500 to $2,999 | 270 (1.9%) | 37 (0.7%) |
| $3,000 or more | 260 (1.8%) | 0 (0.0%) |
| Total | 14,056 (100.0%) | 5,118 (100.0%) |
Physical Housing Characteristics in Clinton County
Housing Structures in Clinton County
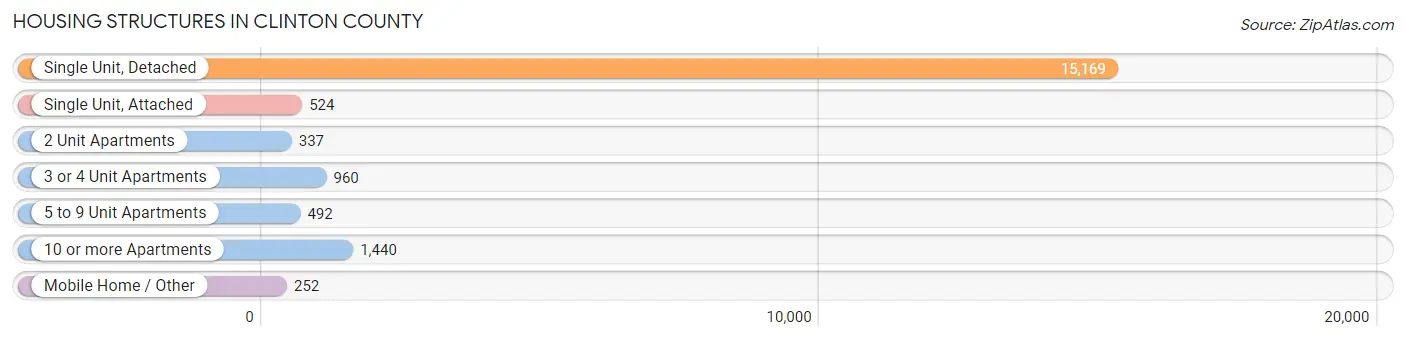
| Structure Type | # Housing Units | % Housing Units |
| Single Unit, Detached | 15,169 | 79.1% |
| Single Unit, Attached | 524 | 2.7% |
| 2 Unit Apartments | 337 | 1.8% |
| 3 or 4 Unit Apartments | 960 | 5.0% |
| 5 to 9 Unit Apartments | 492 | 2.6% |
| 10 or more Apartments | 1,440 | 7.5% |
| Mobile Home / Other | 252 | 1.3% |
| Total | 19,174 | 100.0% |
Housing Structures by Occupancy in Clinton County
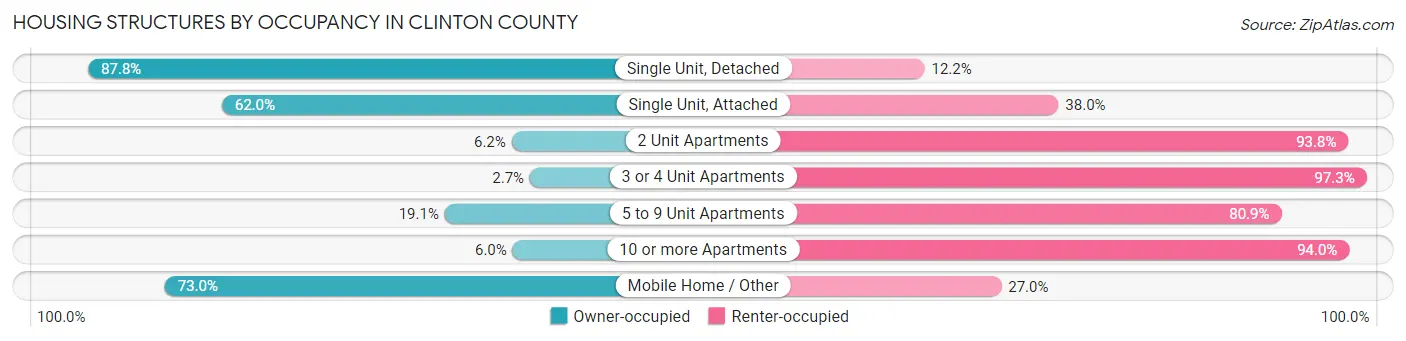
| Structure Type | Owner-occupied | Renter-occupied |
| Single Unit, Detached | 13,319 (87.8%) | 1,850 (12.2%) |
| Single Unit, Attached | 325 (62.0%) | 199 (38.0%) |
| 2 Unit Apartments | 21 (6.2%) | 316 (93.8%) |
| 3 or 4 Unit Apartments | 26 (2.7%) | 934 (97.3%) |
| 5 to 9 Unit Apartments | 94 (19.1%) | 398 (80.9%) |
| 10 or more Apartments | 87 (6.0%) | 1,353 (94.0%) |
| Mobile Home / Other | 184 (73.0%) | 68 (27.0%) |
| Total | 14,056 (73.3%) | 5,118 (26.7%) |
Housing Structures by Number of Rooms in Clinton County
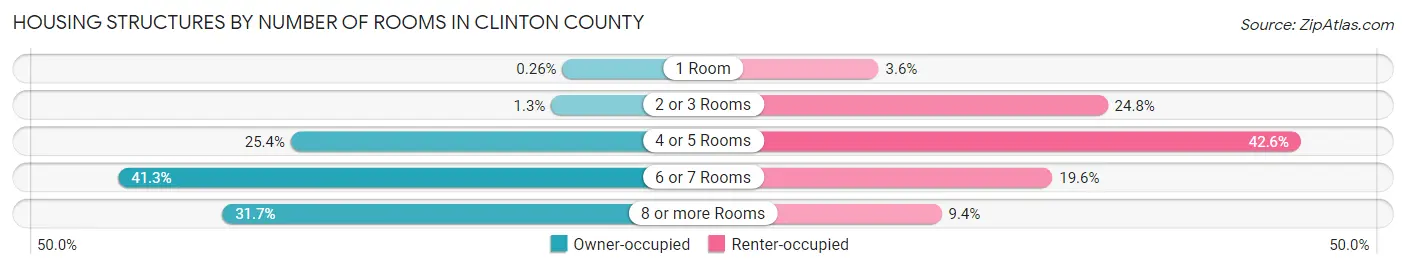
| Number of Rooms | Owner-occupied | Renter-occupied |
| 1 Room | 37 (0.3%) | 183 (3.6%) |
| 2 or 3 Rooms | 183 (1.3%) | 1,267 (24.8%) |
| 4 or 5 Rooms | 3,568 (25.4%) | 2,182 (42.6%) |
| 6 or 7 Rooms | 5,810 (41.3%) | 1,005 (19.6%) |
| 8 or more Rooms | 4,458 (31.7%) | 481 (9.4%) |
| Total | 14,056 (100.0%) | 5,118 (100.0%) |
Housing Structure by Heating Type in Clinton County
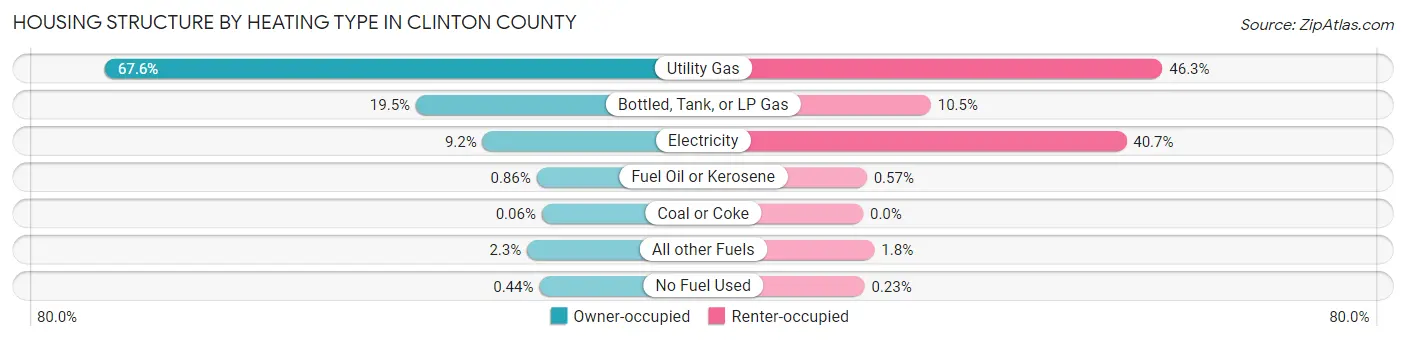
| Heating Type | Owner-occupied | Renter-occupied |
| Utility Gas | 9,499 (67.6%) | 2,368 (46.3%) |
| Bottled, Tank, or LP Gas | 2,743 (19.5%) | 536 (10.5%) |
| Electricity | 1,295 (9.2%) | 2,083 (40.7%) |
| Fuel Oil or Kerosene | 121 (0.9%) | 29 (0.6%) |
| Coal or Coke | 8 (0.1%) | 0 (0.0%) |
| All other Fuels | 328 (2.3%) | 90 (1.8%) |
| No Fuel Used | 62 (0.4%) | 12 (0.2%) |
| Total | 14,056 (100.0%) | 5,118 (100.0%) |
Household Vehicle Usage in Clinton County
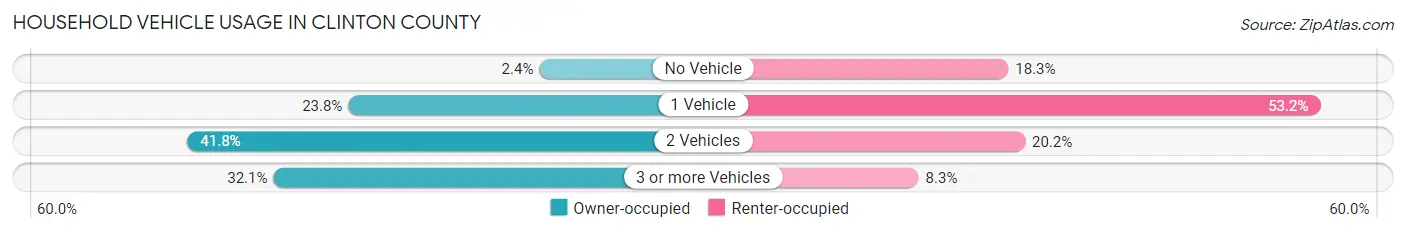
| Vehicles per Household | Owner-occupied | Renter-occupied |
| No Vehicle | 330 (2.4%) | 937 (18.3%) |
| 1 Vehicle | 3,338 (23.7%) | 2,725 (53.2%) |
| 2 Vehicles | 5,870 (41.8%) | 1,033 (20.2%) |
| 3 or more Vehicles | 4,518 (32.1%) | 423 (8.3%) |
| Total | 14,056 (100.0%) | 5,118 (100.0%) |
Real Estate & Mortgages in Clinton County
Real Estate and Mortgage Overview in Clinton County
| Characteristic | Without Mortgage | With Mortgage |
| Housing Units | 5,702 | 8,354 |
| Median Property Value | $137,100 | $150,400 |
| Median Household Income | $58,258 | $1,401 |
| Monthly Housing Costs | $557 | $252 |
| Real Estate Taxes | $2,224 | $188 |
Property Value by Mortgage Status in Clinton County
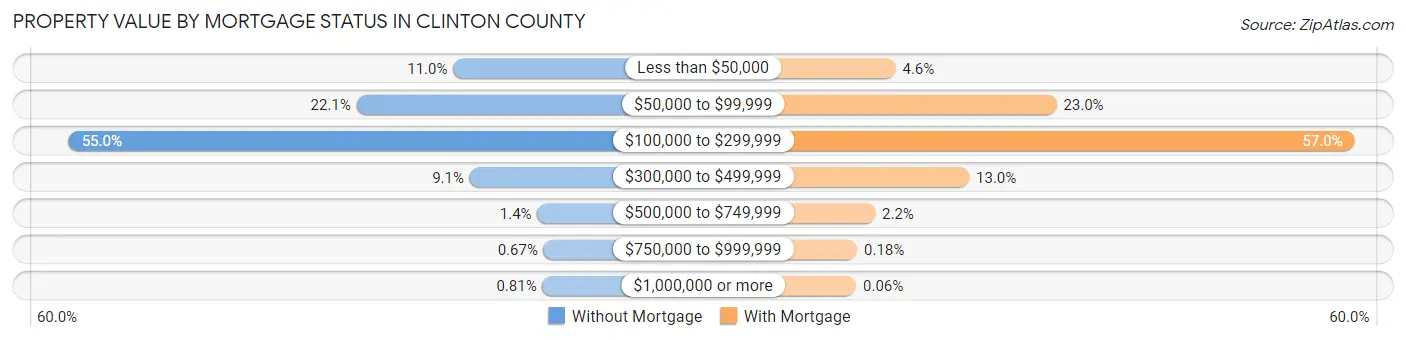
| Property Value | Without Mortgage | With Mortgage |
| Less than $50,000 | 628 (11.0%) | 382 (4.6%) |
| $50,000 to $99,999 | 1,258 (22.1%) | 1,918 (23.0%) |
| $100,000 to $299,999 | 3,133 (54.9%) | 4,764 (57.0%) |
| $300,000 to $499,999 | 520 (9.1%) | 1,084 (13.0%) |
| $500,000 to $749,999 | 79 (1.4%) | 186 (2.2%) |
| $750,000 to $999,999 | 38 (0.7%) | 15 (0.2%) |
| $1,000,000 or more | 46 (0.8%) | 5 (0.1%) |
| Total | 5,702 (100.0%) | 8,354 (100.0%) |
Household Income by Mortgage Status in Clinton County
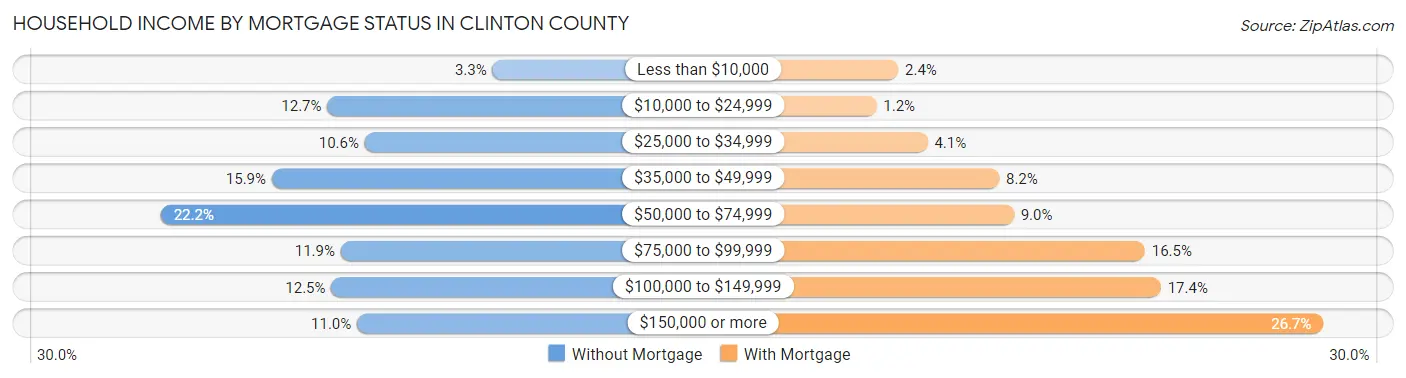
| Household Income | Without Mortgage | With Mortgage |
| Less than $10,000 | 186 (3.3%) | 203 (2.4%) |
| $10,000 to $24,999 | 724 (12.7%) | 99 (1.2%) |
| $25,000 to $34,999 | 602 (10.6%) | 343 (4.1%) |
| $35,000 to $49,999 | 905 (15.9%) | 685 (8.2%) |
| $50,000 to $74,999 | 1,267 (22.2%) | 755 (9.0%) |
| $75,000 to $99,999 | 680 (11.9%) | 1,381 (16.5%) |
| $100,000 to $149,999 | 711 (12.5%) | 1,457 (17.4%) |
| $150,000 or more | 627 (11.0%) | 2,233 (26.7%) |
| Total | 5,702 (100.0%) | 8,354 (100.0%) |
Property Value to Household Income Ratio in Clinton County
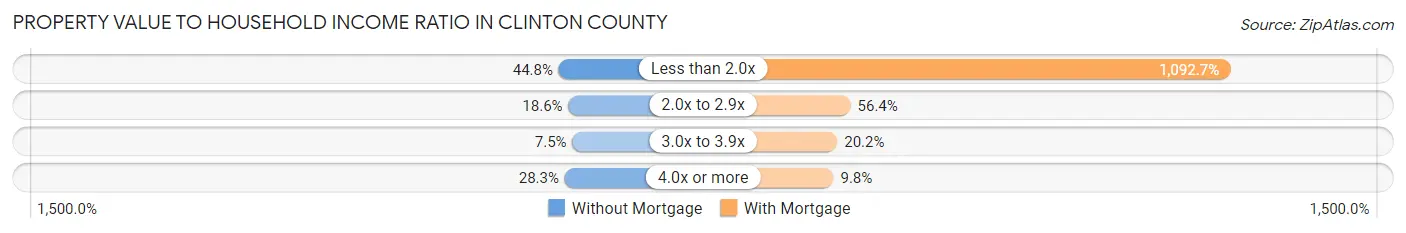
| Value-to-Income Ratio | Without Mortgage | With Mortgage |
| Less than 2.0x | 2,555 (44.8%) | 91,280 (1,092.7%) |
| 2.0x to 2.9x | 1,058 (18.5%) | 4,710 (56.4%) |
| 3.0x to 3.9x | 429 (7.5%) | 1,688 (20.2%) |
| 4.0x or more | 1,614 (28.3%) | 819 (9.8%) |
| Total | 5,702 (100.0%) | 8,354 (100.0%) |
Real Estate Taxes by Mortgage Status in Clinton County
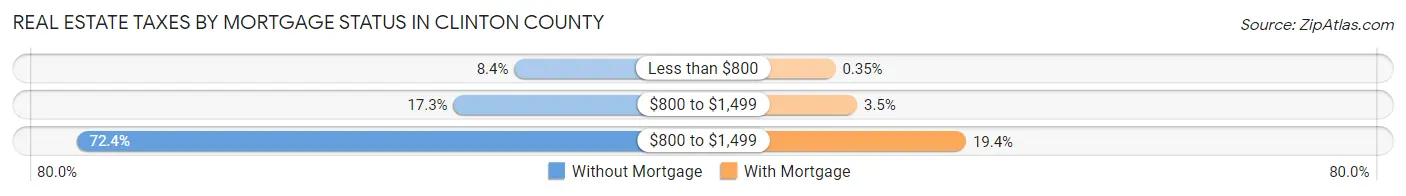
| Property Taxes | Without Mortgage | With Mortgage |
| Less than $800 | 481 (8.4%) | 29 (0.4%) |
| $800 to $1,499 | 989 (17.3%) | 293 (3.5%) |
| $800 to $1,499 | 4,129 (72.4%) | 1,622 (19.4%) |
| Total | 5,702 (100.0%) | 8,354 (100.0%) |
Health & Disability in Clinton County
Health Insurance Coverage by Age in Clinton County
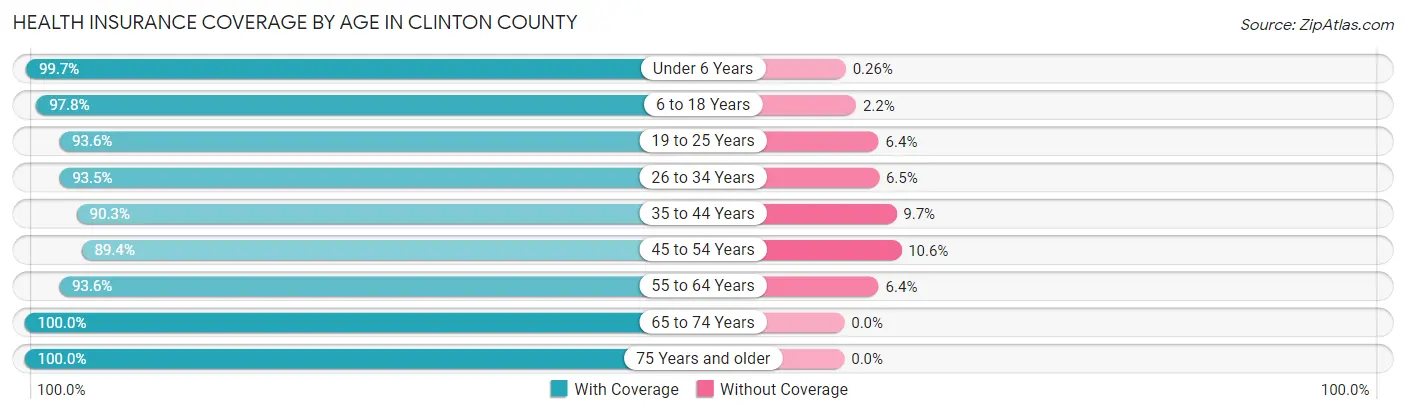
| Age Bracket | With Coverage | Without Coverage |
| Under 6 Years | 3,090 (99.7%) | 8 (0.3%) |
| 6 to 18 Years | 7,773 (97.8%) | 173 (2.2%) |
| 19 to 25 Years | 3,255 (93.6%) | 223 (6.4%) |
| 26 to 34 Years | 4,343 (93.5%) | 300 (6.5%) |
| 35 to 44 Years | 4,784 (90.3%) | 514 (9.7%) |
| 45 to 54 Years | 5,061 (89.4%) | 601 (10.6%) |
| 55 to 64 Years | 6,566 (93.6%) | 450 (6.4%) |
| 65 to 74 Years | 5,161 (100.0%) | 0 (0.0%) |
| 75 Years and older | 3,619 (100.0%) | 0 (0.0%) |
| Total | 43,652 (95.1%) | 2,269 (4.9%) |
Health Insurance Coverage by Citizenship Status in Clinton County
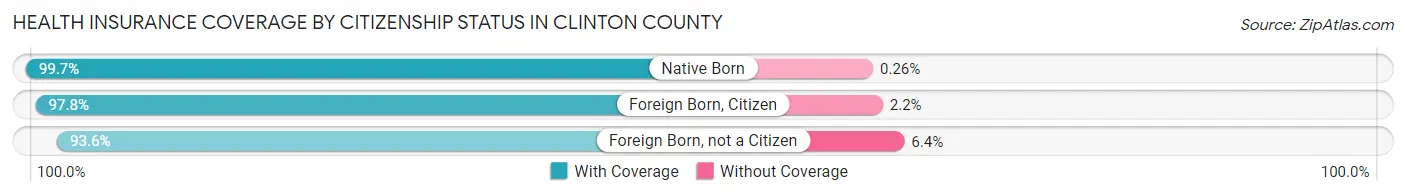
| Citizenship Status | With Coverage | Without Coverage |
| Native Born | 3,090 (99.7%) | 8 (0.3%) |
| Foreign Born, Citizen | 7,773 (97.8%) | 173 (2.2%) |
| Foreign Born, not a Citizen | 3,255 (93.6%) | 223 (6.4%) |
Health Insurance Coverage by Household Income in Clinton County
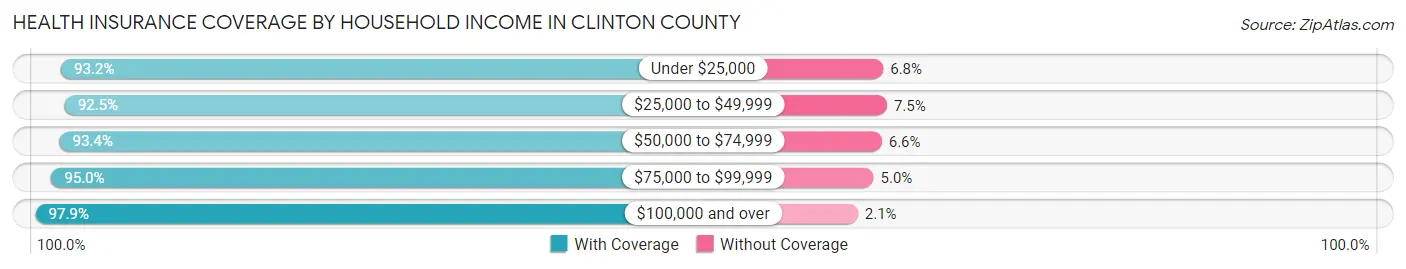
| Household Income | With Coverage | Without Coverage |
| Under $25,000 | 4,904 (93.2%) | 360 (6.8%) |
| $25,000 to $49,999 | 8,693 (92.5%) | 707 (7.5%) |
| $50,000 to $74,999 | 7,720 (93.4%) | 542 (6.6%) |
| $75,000 to $99,999 | 5,849 (95.0%) | 309 (5.0%) |
| $100,000 and over | 16,212 (97.9%) | 343 (2.1%) |
Public vs Private Health Insurance Coverage by Age in Clinton County
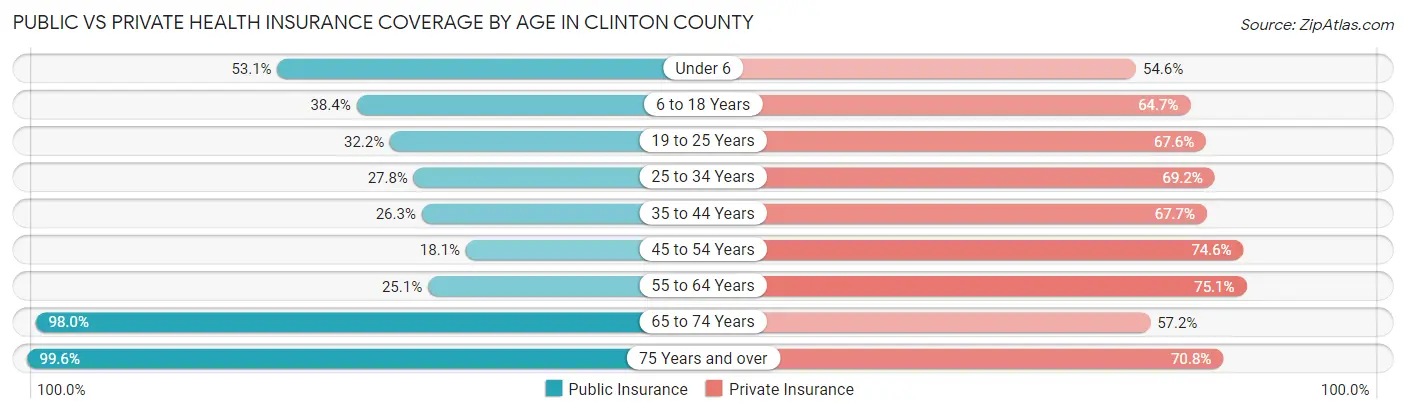
| Age Bracket | Public Insurance | Private Insurance |
| Under 6 | 1,644 (53.1%) | 1,692 (54.6%) |
| 6 to 18 Years | 3,051 (38.4%) | 5,138 (64.7%) |
| 19 to 25 Years | 1,119 (32.2%) | 2,351 (67.6%) |
| 25 to 34 Years | 1,290 (27.8%) | 3,213 (69.2%) |
| 35 to 44 Years | 1,393 (26.3%) | 3,589 (67.7%) |
| 45 to 54 Years | 1,024 (18.1%) | 4,221 (74.6%) |
| 55 to 64 Years | 1,763 (25.1%) | 5,267 (75.1%) |
| 65 to 74 Years | 5,056 (98.0%) | 2,954 (57.2%) |
| 75 Years and over | 3,606 (99.6%) | 2,562 (70.8%) |
| Total | 19,946 (43.4%) | 30,987 (67.5%) |
Disability Status by Sex by Age in Clinton County
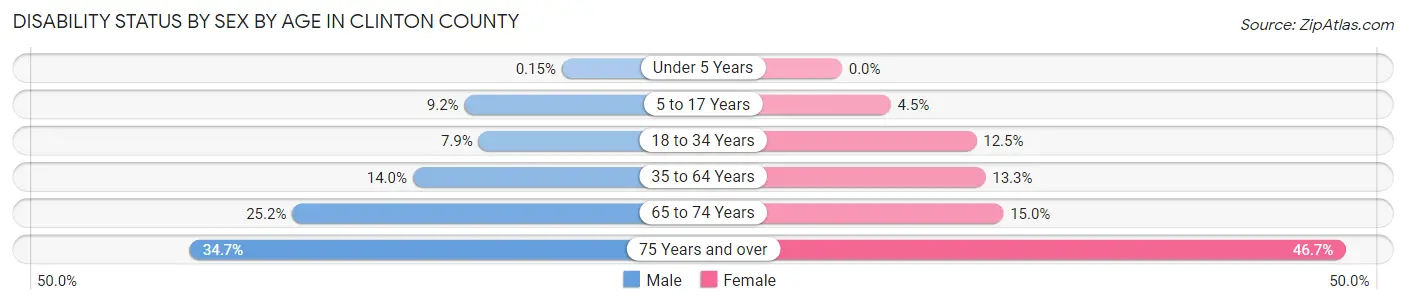
| Age Bracket | Male | Female |
| Under 5 Years | 2 (0.2%) | 0 (0.0%) |
| 5 to 17 Years | 368 (9.2%) | 173 (4.5%) |
| 18 to 34 Years | 329 (7.9%) | 564 (12.5%) |
| 35 to 64 Years | 1,262 (14.0%) | 1,191 (13.3%) |
| 65 to 74 Years | 640 (25.2%) | 392 (15.0%) |
| 75 Years and over | 565 (34.7%) | 929 (46.7%) |
Disability Class by Sex by Age in Clinton County
Disability Class: Hearing Difficulty
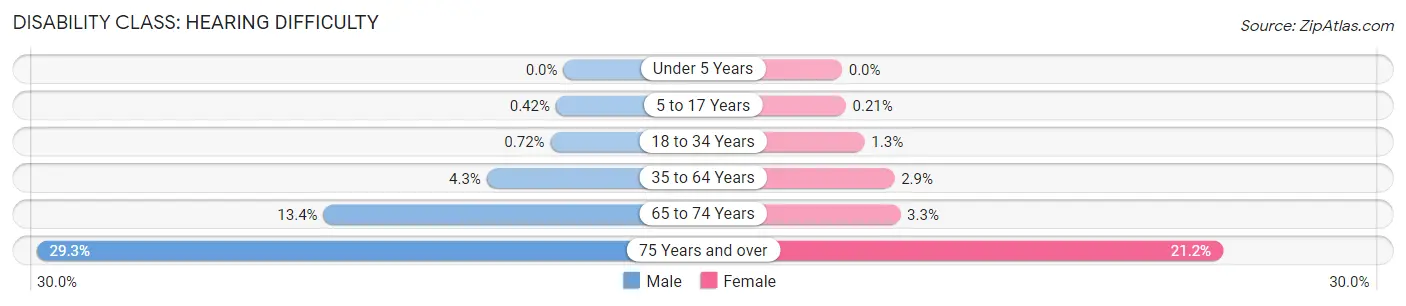
| Age Bracket | Male | Female |
| Under 5 Years | 0 (0.0%) | 0 (0.0%) |
| 5 to 17 Years | 17 (0.4%) | 8 (0.2%) |
| 18 to 34 Years | 30 (0.7%) | 57 (1.3%) |
| 35 to 64 Years | 386 (4.3%) | 261 (2.9%) |
| 65 to 74 Years | 340 (13.4%) | 85 (3.3%) |
| 75 Years and over | 478 (29.3%) | 422 (21.2%) |
Disability Class: Vision Difficulty
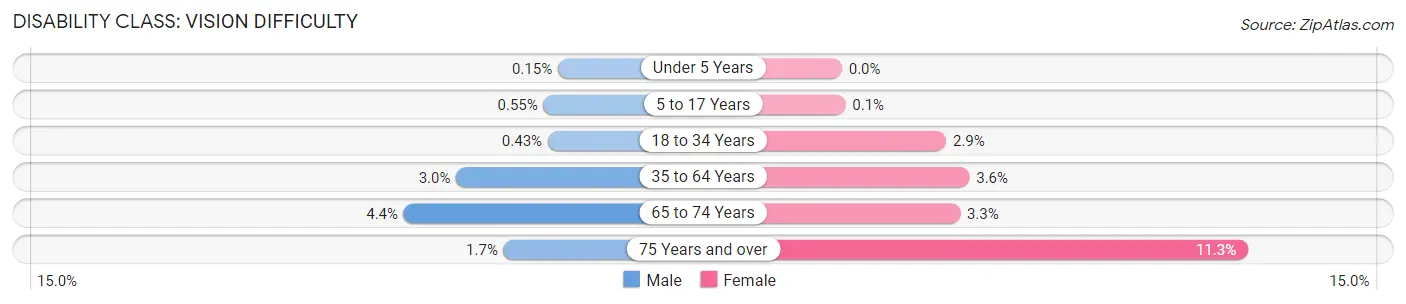
| Age Bracket | Male | Female |
| Under 5 Years | 2 (0.2%) | 0 (0.0%) |
| 5 to 17 Years | 22 (0.5%) | 4 (0.1%) |
| 18 to 34 Years | 18 (0.4%) | 131 (2.9%) |
| 35 to 64 Years | 269 (3.0%) | 317 (3.5%) |
| 65 to 74 Years | 113 (4.4%) | 86 (3.3%) |
| 75 Years and over | 27 (1.7%) | 225 (11.3%) |
Disability Class: Cognitive Difficulty
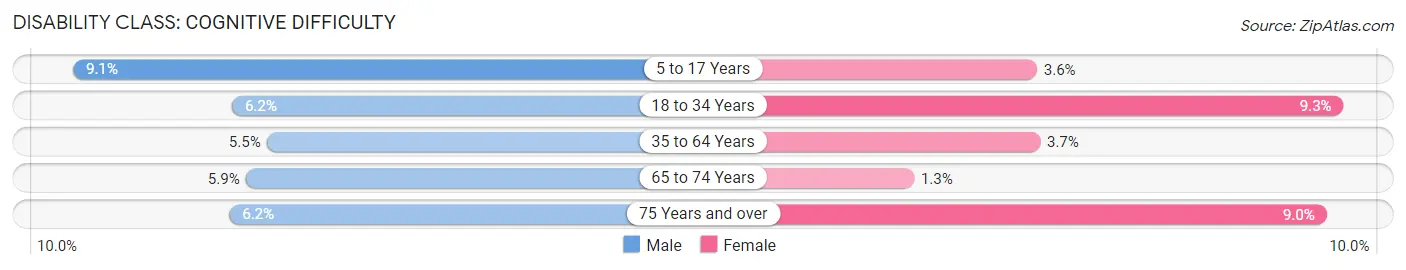
| Age Bracket | Male | Female |
| 5 to 17 Years | 365 (9.1%) | 138 (3.6%) |
| 18 to 34 Years | 257 (6.1%) | 421 (9.3%) |
| 35 to 64 Years | 498 (5.5%) | 329 (3.7%) |
| 65 to 74 Years | 150 (5.9%) | 35 (1.3%) |
| 75 Years and over | 101 (6.2%) | 179 (9.0%) |
Disability Class: Ambulatory Difficulty
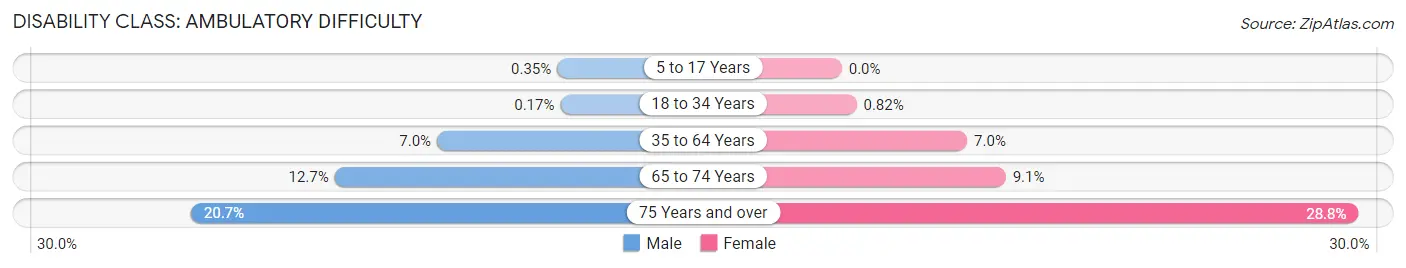
| Age Bracket | Male | Female |
| 5 to 17 Years | 14 (0.4%) | 0 (0.0%) |
| 18 to 34 Years | 7 (0.2%) | 37 (0.8%) |
| 35 to 64 Years | 636 (7.0%) | 624 (7.0%) |
| 65 to 74 Years | 324 (12.7%) | 239 (9.1%) |
| 75 Years and over | 338 (20.7%) | 572 (28.8%) |
Disability Class: Self-Care Difficulty
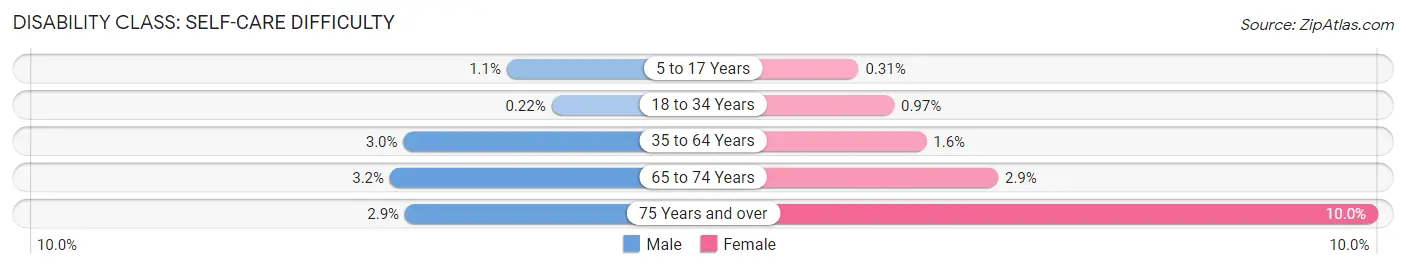
| Age Bracket | Male | Female |
| 5 to 17 Years | 42 (1.1%) | 12 (0.3%) |
| 18 to 34 Years | 9 (0.2%) | 44 (1.0%) |
| 35 to 64 Years | 268 (3.0%) | 140 (1.6%) |
| 65 to 74 Years | 82 (3.2%) | 76 (2.9%) |
| 75 Years and over | 48 (2.9%) | 198 (10.0%) |
Technology Access in Clinton County
Computing Device Access in Clinton County
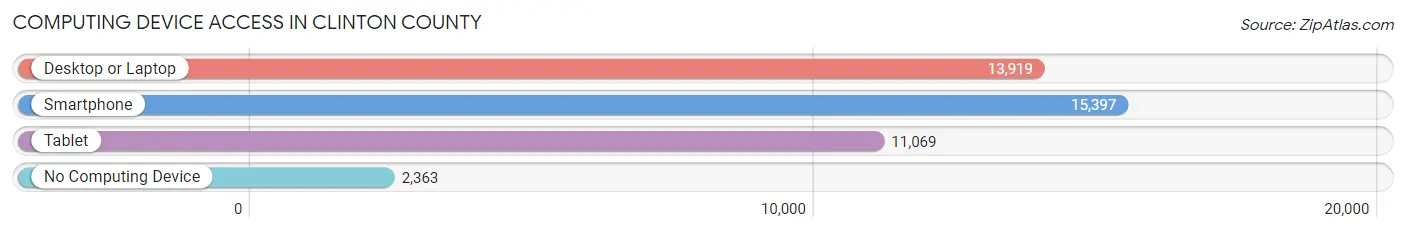
| Device Type | # Households | % Households |
| Desktop or Laptop | 13,919 | 72.6% |
| Smartphone | 15,397 | 80.3% |
| Tablet | 11,069 | 57.7% |
| No Computing Device | 2,363 | 12.3% |
| Total | 19,174 | 100.0% |
Internet Access in Clinton County
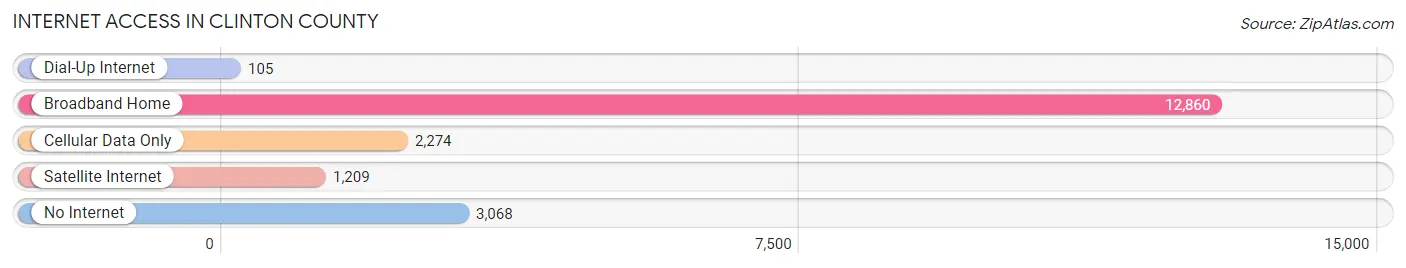
| Internet Type | # Households | % Households |
| Dial-Up Internet | 105 | 0.5% |
| Broadband Home | 12,860 | 67.1% |
| Cellular Data Only | 2,274 | 11.9% |
| Satellite Internet | 1,209 | 6.3% |
| No Internet | 3,068 | 16.0% |
| Total | 19,174 | 100.0% |
Clinton County Summary
County History
Clinton County, Iowa, is located in the eastern part of the state and is bordered by Scott, Muscatine, Cedar, and Jackson counties. The county was established in 1837 and was named after DeWitt Clinton, the seventh Governor of New York. The county seat is located in the city of Clinton, which was founded in 1835 and is the largest city in the county.
The first settlers in the area were mostly of English and German descent. The first settlers were attracted to the area due to its fertile soil and abundant natural resources. The first industry in the area was lumbering, which was followed by the development of the railroad in the late 1800s. This allowed for the growth of the agricultural industry, which is still a major part of the county’s economy today.
The county has a rich history of involvement in the Civil War. Many of the county’s residents served in the Union Army, and the county was home to several Civil War battles. The county also has a long history of involvement in politics, with several prominent politicians hailing from the area.
Geography
Clinton County is located in the eastern part of Iowa and is bordered by Scott, Muscatine, Cedar, and Jackson counties. The county covers an area of 545 square miles and is home to a population of over 49,000 people. The county is mostly rural, with the majority of the population living in the cities of Clinton and DeWitt.
The county is located in the Driftless Area, which is characterized by its rolling hills and valleys. The county is home to several rivers, including the Wapsipinicon, the Maquoketa, and the Mississippi. The county is also home to several lakes, including Lake Delhi and Lake Odessa.
Economy
The economy of Clinton County is largely based on agriculture and manufacturing. The county is home to several large agricultural operations, including hog farms, dairy farms, and grain farms. The county is also home to several large manufacturing companies, including John Deere, Tyson Foods, and Cargill.
The county is also home to several small businesses, including restaurants, retail stores, and service providers. The county is also home to several tourist attractions, including the Clinton County Historical Museum and the Clinton County Fairgrounds.
Demographics
As of the 2010 census, the population of Clinton County was 49,116. The population is mostly white (94.2%), with small percentages of African American (2.2%), Hispanic (1.7%), and Asian (1.1%) residents. The median household income in the county is $50,845, and the median home value is $128,400.
The county is home to several colleges and universities, including Ashford University, Clinton Community College, and the University of Iowa. The county is also home to several public schools, including the Clinton Community School District and the DeWitt Community School District.
Conclusion
Clinton County, Iowa, is a rural county located in the eastern part of the state. The county has a rich history of involvement in the Civil War and politics, and its economy is largely based on agriculture and manufacturing. The county is home to a population of over 49,000 people, and the median household income is $50,845. The county is home to several colleges and universities, as well as public schools.
Common Questions
What is Per Capita Income in Clinton County?
Per Capita income in Clinton County is $33,979.
What is the Median Family Income in Clinton County?
Median Family Income in Clinton County is $80,614.
What is the Median Household income in Clinton County?
Median Household Income in Clinton County is $61,080.
What is Income or Wage Gap in Clinton County?
Income or Wage Gap in Clinton County is 36.5%.
Women in Clinton County earn 63.5 cents for every dollar earned by a man.
What is Family Income Deficit in Clinton County?
Family Income Deficit in Clinton County is $10,161.
Families that are below poverty line in Clinton County earn $10,161 less on average than the poverty threshold level.
What is Inequality or Gini Index in Clinton County?
Inequality or Gini Index in Clinton County is 0.43.
What is the Total Population of Clinton County?
Total Population of Clinton County is 46,488.
What is the Total Male Population of Clinton County?
Total Male Population of Clinton County is 22,930.
What is the Total Female Population of Clinton County?
Total Female Population of Clinton County is 23,558.
What is the Ratio of Males per 100 Females in Clinton County?
There are 97.33 Males per 100 Females in Clinton County.
What is the Ratio of Females per 100 Males in Clinton County?
There are 102.74 Females per 100 Males in Clinton County.
What is the Median Population Age in Clinton County?
Median Population Age in Clinton County is 42.5 Years.
What is the Average Family Size in Clinton County
Average Family Size in Clinton County is 3.0 People.
What is the Average Household Size in Clinton County
Average Household Size in Clinton County is 2.4 People.
How Large is the Labor Force in Clinton County?
There are 22,689 People in the Labor Forcein in Clinton County.
What is the Percentage of People in the Labor Force in Clinton County?
60.8% of People are in the Labor Force in Clinton County.
What is the Unemployment Rate in Clinton County?
Unemployment Rate in Clinton County is 4.4%.