Polk County, IA Map & Demographics
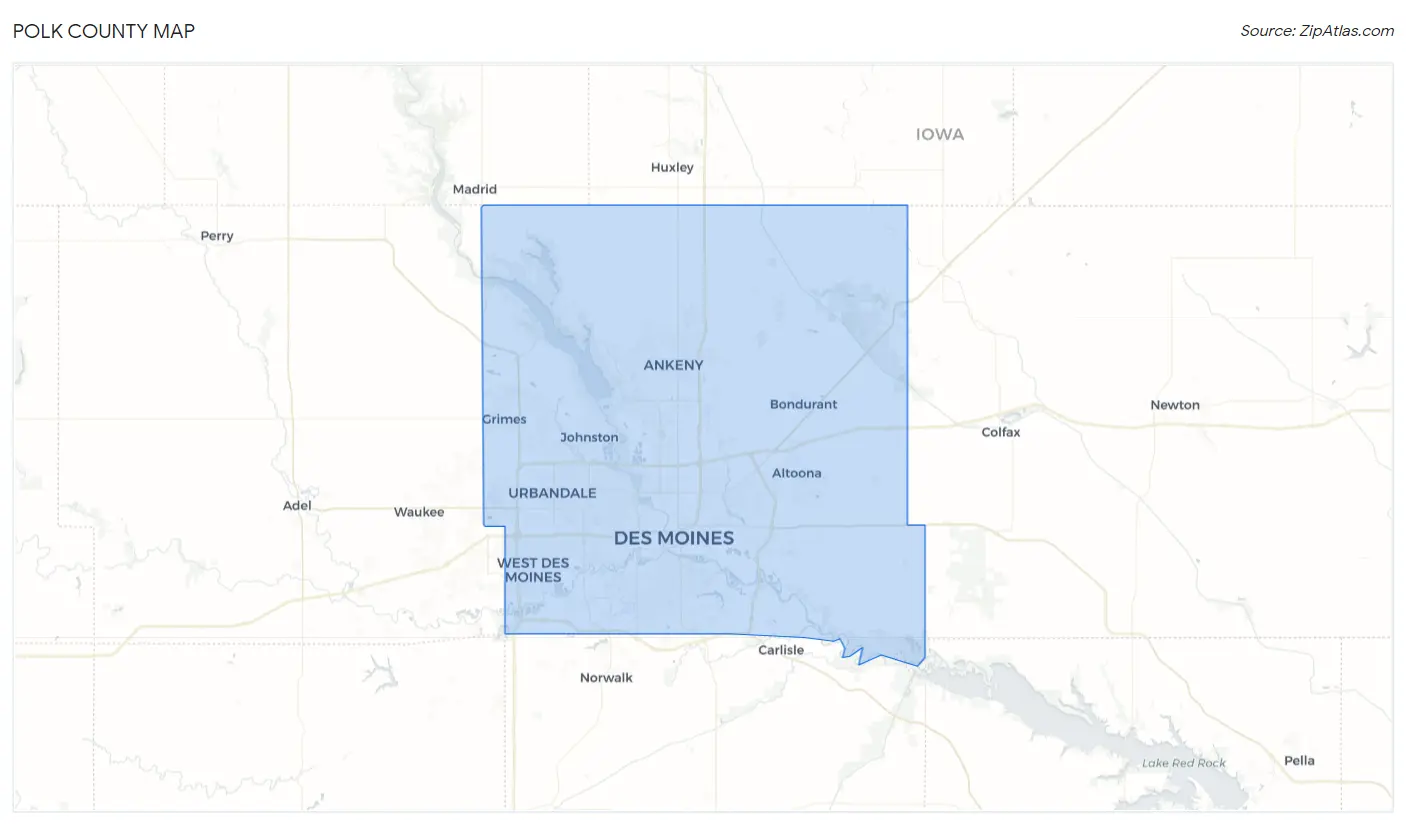
Polk County Map
Polk County Overview
$41,894
PER CAPITA INCOME
$99,161
AVG FAMILY INCOME
$78,827
AVG HOUSEHOLD INCOME
25.5%
WAGE / INCOME GAP [ % ]
74.5¢/ $1
WAGE / INCOME GAP [ $ ]
$11,234
FAMILY INCOME DEFICIT
0.43
INEQUALITY / GINI INDEX
493,378
TOTAL POPULATION
245,241
MALE POPULATION
248,137
FEMALE POPULATION
98.83
MALES / 100 FEMALES
101.18
FEMALES / 100 MALES
36.1
MEDIAN AGE
3.1
AVG FAMILY SIZE
2.4
AVG HOUSEHOLD SIZE
274,969
LABOR FORCE [ PEOPLE ]
71.1%
PERCENT IN LABOR FORCE
4.5%
UNEMPLOYMENT RATE
Polk County Area Codes
Income in Polk County
Income Overview in Polk County
Per Capita Income in Polk County is $41,894, while median incomes of families and households are $99,161 and $78,827 respectively.
| Characteristic | Number | Measure |
| Per Capita Income | 493,378 | $41,894 |
| Median Family Income | 121,906 | $99,161 |
| Mean Family Income | 121,906 | $122,574 |
| Median Household Income | 199,013 | $78,827 |
| Mean Household Income | 199,013 | $101,787 |
| Income Deficit | 121,906 | $11,234 |
| Wage / Income Gap (%) | 493,378 | 25.50% |
| Wage / Income Gap ($) | 493,378 | 74.50¢ per $1 |
| Gini / Inequality Index | 493,378 | 0.43 |
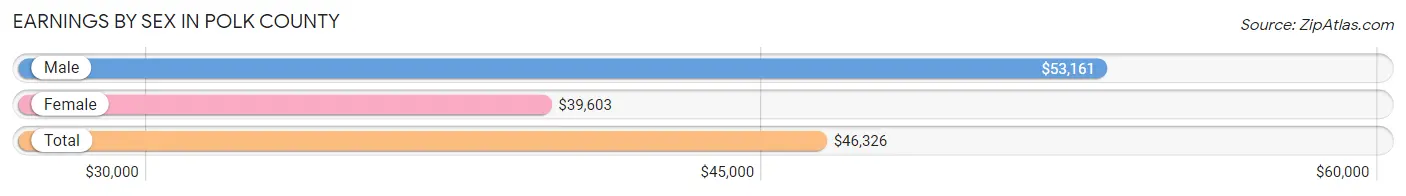
Earnings by Sex in Polk County
Average Earnings in Polk County are $46,326, $53,161 for men and $39,603 for women, a difference of 25.5%.
| Sex | Number | Average Earnings |
| Male | 150,620 (52.4%) | $53,161 |
| Female | 136,704 (47.6%) | $39,603 |
| Total | 287,324 (100.0%) | $46,326 |
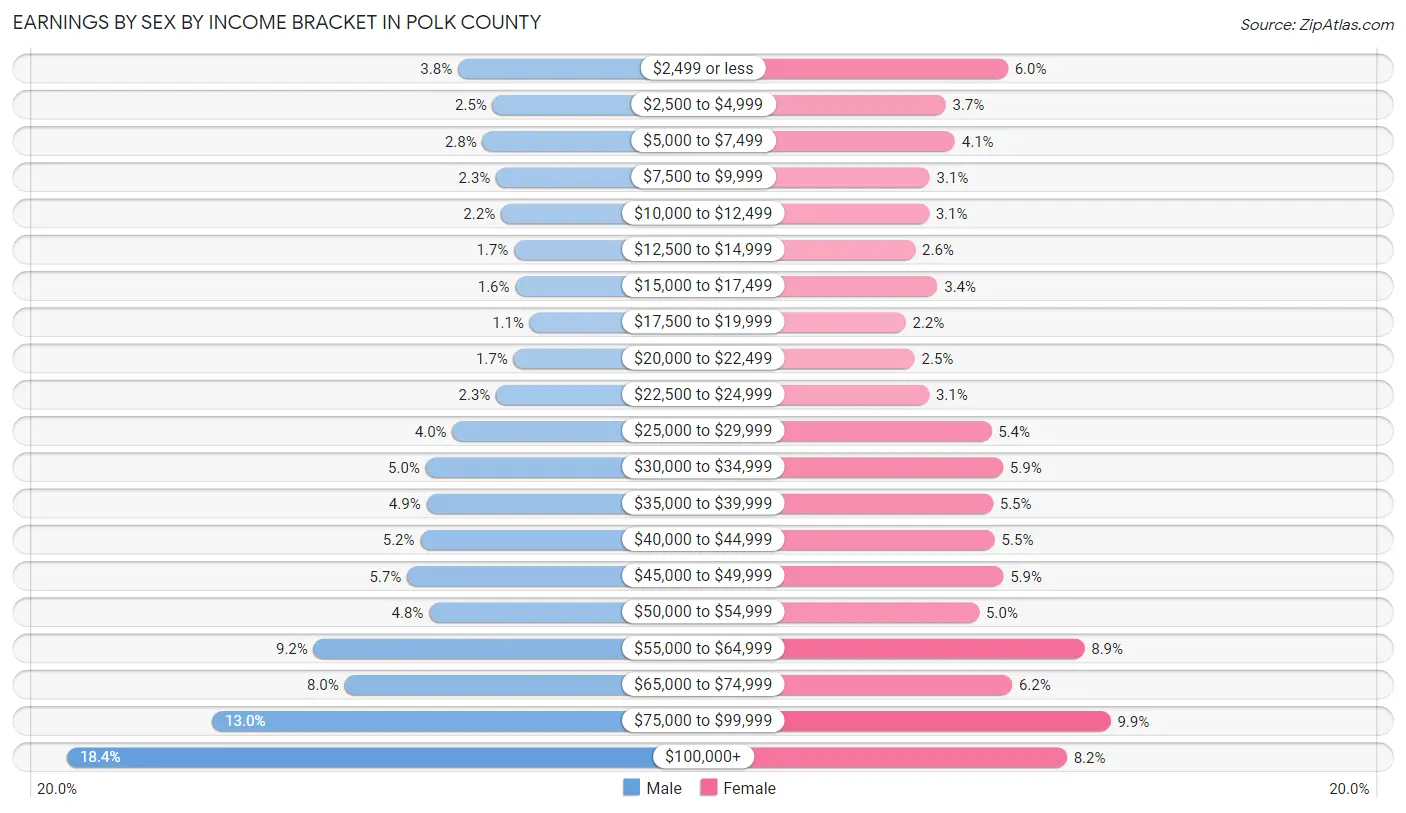
Earnings by Sex by Income Bracket in Polk County
The most common earnings brackets in Polk County are $100,000+ for men (27,730 | 18.4%) and $75,000 to $99,999 for women (13,500 | 9.9%).
| Income | Male | Female |
| $2,499 or less | 5,669 (3.8%) | 8,241 (6.0%) |
| $2,500 to $4,999 | 3,698 (2.5%) | 5,052 (3.7%) |
| $5,000 to $7,499 | 4,280 (2.8%) | 5,539 (4.1%) |
| $7,500 to $9,999 | 3,502 (2.3%) | 4,232 (3.1%) |
| $10,000 to $12,499 | 3,235 (2.1%) | 4,203 (3.1%) |
| $12,500 to $14,999 | 2,504 (1.7%) | 3,496 (2.6%) |
| $15,000 to $17,499 | 2,424 (1.6%) | 4,631 (3.4%) |
| $17,500 to $19,999 | 1,610 (1.1%) | 3,006 (2.2%) |
| $20,000 to $22,499 | 2,527 (1.7%) | 3,466 (2.5%) |
| $22,500 to $24,999 | 3,505 (2.3%) | 4,214 (3.1%) |
| $25,000 to $29,999 | 5,981 (4.0%) | 7,389 (5.4%) |
| $30,000 to $34,999 | 7,488 (5.0%) | 7,997 (5.9%) |
| $35,000 to $39,999 | 7,434 (4.9%) | 7,483 (5.5%) |
| $40,000 to $44,999 | 7,783 (5.2%) | 7,568 (5.5%) |
| $45,000 to $49,999 | 8,545 (5.7%) | 8,012 (5.9%) |
| $50,000 to $54,999 | 7,288 (4.8%) | 6,777 (5.0%) |
| $55,000 to $64,999 | 13,812 (9.2%) | 12,163 (8.9%) |
| $65,000 to $74,999 | 12,071 (8.0%) | 8,466 (6.2%) |
| $75,000 to $99,999 | 19,534 (13.0%) | 13,500 (9.9%) |
| $100,000+ | 27,730 (18.4%) | 11,269 (8.2%) |
| Total | 150,620 (100.0%) | 136,704 (100.0%) |
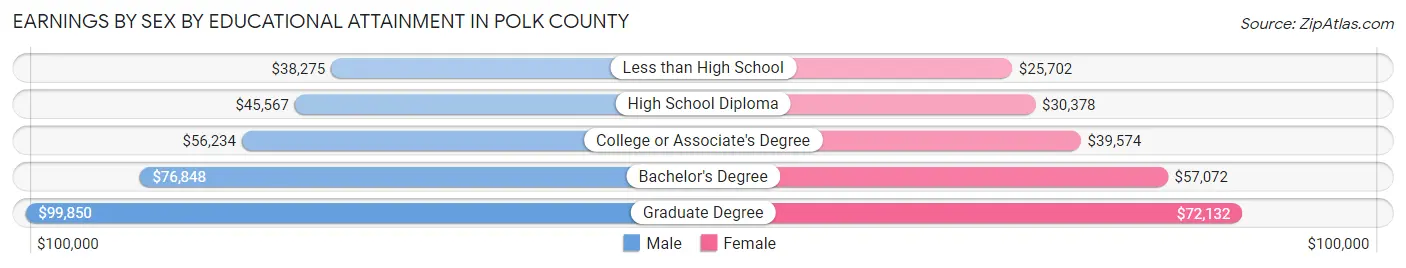
Earnings by Sex by Educational Attainment in Polk County
Average earnings in Polk County are $60,267 for men and $45,527 for women, a difference of 24.5%. Men with an educational attainment of graduate degree enjoy the highest average annual earnings of $99,850, while those with less than high school education earn the least with $38,275. Women with an educational attainment of graduate degree earn the most with the average annual earnings of $72,132, while those with less than high school education have the smallest earnings of $25,702.
| Educational Attainment | Male Income | Female Income |
| Less than High School | $38,275 | $25,702 |
| High School Diploma | $45,567 | $30,378 |
| College or Associate's Degree | $56,234 | $39,574 |
| Bachelor's Degree | $76,848 | $57,072 |
| Graduate Degree | $99,850 | $72,132 |
| Total | $60,267 | $45,527 |
Family Income in Polk County
Family Income Brackets in Polk County
According to the Polk County family income data, there are 28,160 families falling into the $100,000 to $149,999 income range, which is the most common income bracket and makes up 23.1% of all families. Conversely, the $10,000 to $14,999 income bracket is the least frequent group with only 1,950 families (1.6%) belonging to this category.
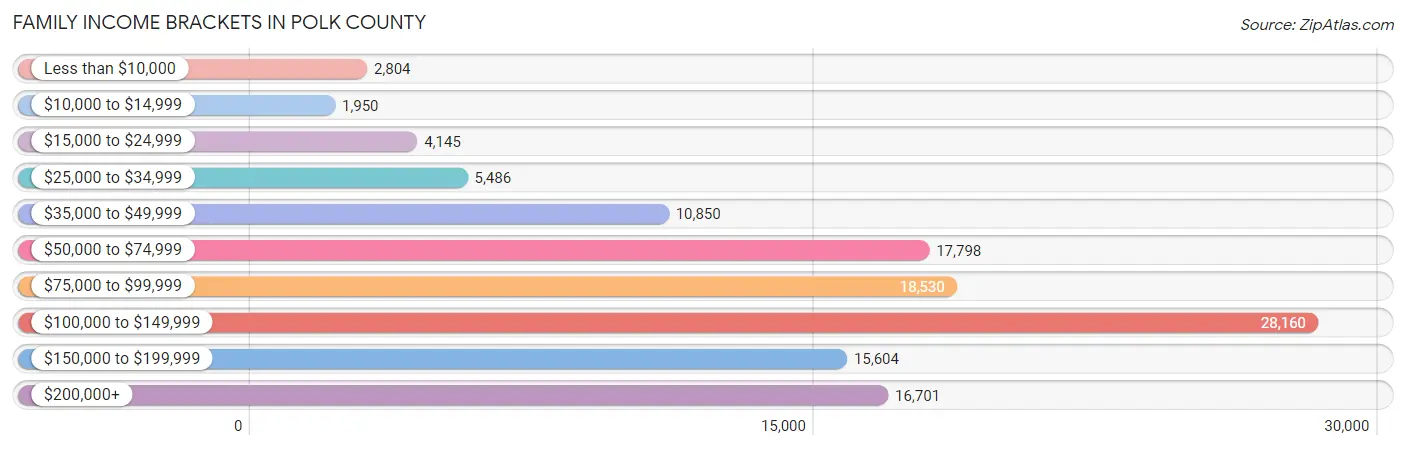
| Income Bracket | # Families | % Families |
| Less than $10,000 | 2,804 | 2.3% |
| $10,000 to $14,999 | 1,950 | 1.6% |
| $15,000 to $24,999 | 4,145 | 3.4% |
| $25,000 to $34,999 | 5,486 | 4.5% |
| $35,000 to $49,999 | 10,850 | 8.9% |
| $50,000 to $74,999 | 17,798 | 14.6% |
| $75,000 to $99,999 | 18,530 | 15.2% |
| $100,000 to $149,999 | 28,160 | 23.1% |
| $150,000 to $199,999 | 15,604 | 12.8% |
| $200,000+ | 16,701 | 13.7% |
Family Income by Famaliy Size in Polk County
4-person families (22,783 | 18.7%) account for the highest median family income in Polk County with $124,293 per family, while 2-person families (56,453 | 46.3%) have the highest median income of $44,396 per family member.
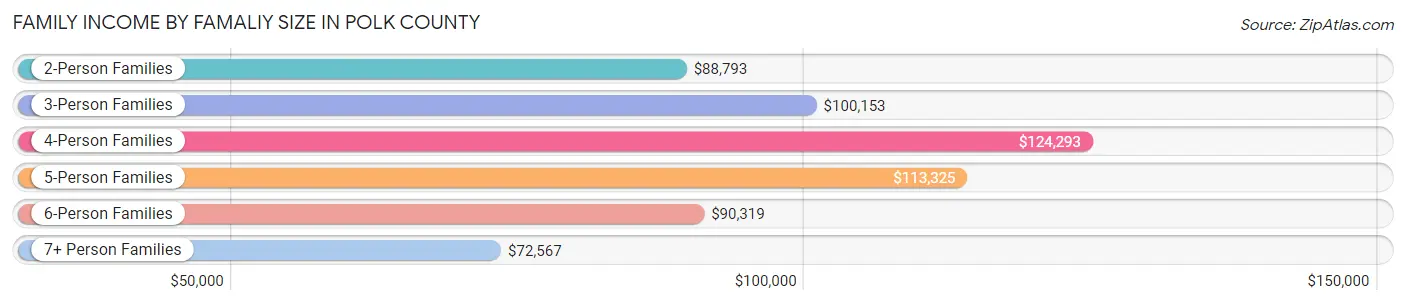
| Income Bracket | # Families | Median Income |
| 2-Person Families | 56,453 (46.3%) | $88,793 |
| 3-Person Families | 25,788 (21.1%) | $100,153 |
| 4-Person Families | 22,783 (18.7%) | $124,293 |
| 5-Person Families | 11,004 (9.0%) | $113,325 |
| 6-Person Families | 3,887 (3.2%) | $90,319 |
| 7+ Person Families | 1,991 (1.6%) | $72,567 |
| Total | 121,906 (100.0%) | $99,161 |
Family Income by Number of Earners in Polk County
The median family income in Polk County is $99,161, with families comprising 3+ earners (15,025) having the highest median family income of $150,533, while families with no earners (14,405) have the lowest median family income of $57,485, accounting for 12.3% and 11.8% of families, respectively.
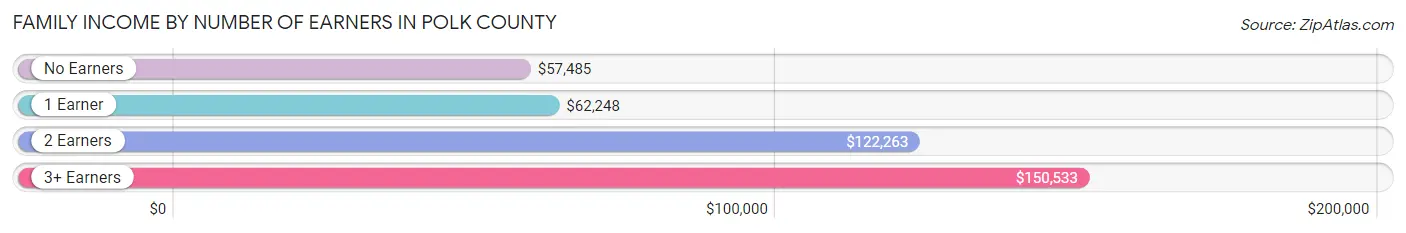
| Number of Earners | # Families | Median Income |
| No Earners | 14,405 (11.8%) | $57,485 |
| 1 Earner | 34,300 (28.1%) | $62,248 |
| 2 Earners | 58,176 (47.7%) | $122,263 |
| 3+ Earners | 15,025 (12.3%) | $150,533 |
| Total | 121,906 (100.0%) | $99,161 |
Household Income in Polk County
Household Income Brackets in Polk County
With 37,613 households falling in the category, the $100,000 to $149,999 income range is the most frequent in Polk County, accounting for 18.9% of all households. In contrast, only 5,771 households (2.9%) fall into the $10,000 to $14,999 income bracket, making it the least populous group.
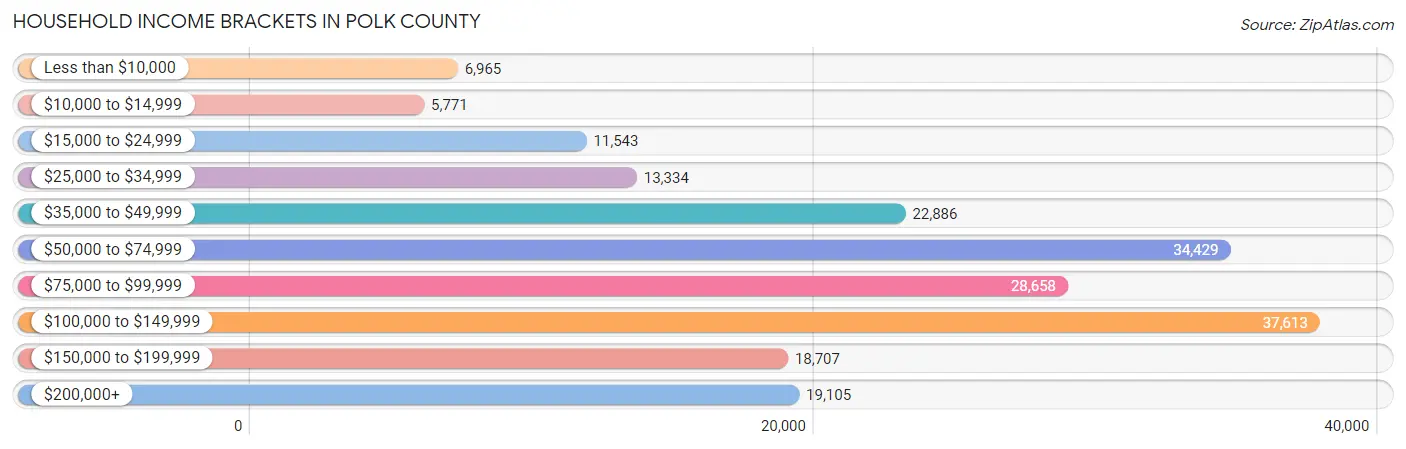
| Income Bracket | # Households | % Households |
| Less than $10,000 | 6,965 | 3.5% |
| $10,000 to $14,999 | 5,771 | 2.9% |
| $15,000 to $24,999 | 11,543 | 5.8% |
| $25,000 to $34,999 | 13,334 | 6.7% |
| $35,000 to $49,999 | 22,886 | 11.5% |
| $50,000 to $74,999 | 34,429 | 17.3% |
| $75,000 to $99,999 | 28,658 | 14.4% |
| $100,000 to $149,999 | 37,613 | 18.9% |
| $150,000 to $199,999 | 18,707 | 9.4% |
| $200,000+ | 19,105 | 9.6% |
Household Income by Householder Age in Polk County
The median household income in Polk County is $78,827, with the highest median household income of $96,504 found in the 45 to 64 years age bracket for the primary householder. A total of 68,981 households (34.7%) fall into this category. Meanwhile, the 15 to 24 years age bracket for the primary householder has the lowest median household income of $48,475, with 11,011 households (5.5%) in this group.
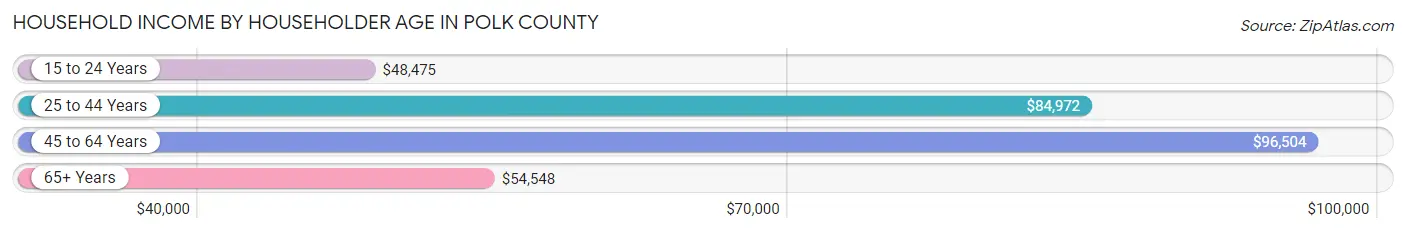
| Income Bracket | # Households | Median Income |
| 15 to 24 Years | 11,011 (5.5%) | $48,475 |
| 25 to 44 Years | 76,375 (38.4%) | $84,972 |
| 45 to 64 Years | 68,981 (34.7%) | $96,504 |
| 65+ Years | 42,646 (21.4%) | $54,548 |
| Total | 199,013 (100.0%) | $78,827 |
Poverty in Polk County
Income Below Poverty by Sex and Age in Polk County
With 9.7% poverty level for males and 11.0% for females among the residents of Polk County, under 5 year old males and 18 to 24 year old females are the most vulnerable to poverty, with 2,947 males (17.8%) and 4,351 females (21.0%) in their respective age groups living below the poverty level.
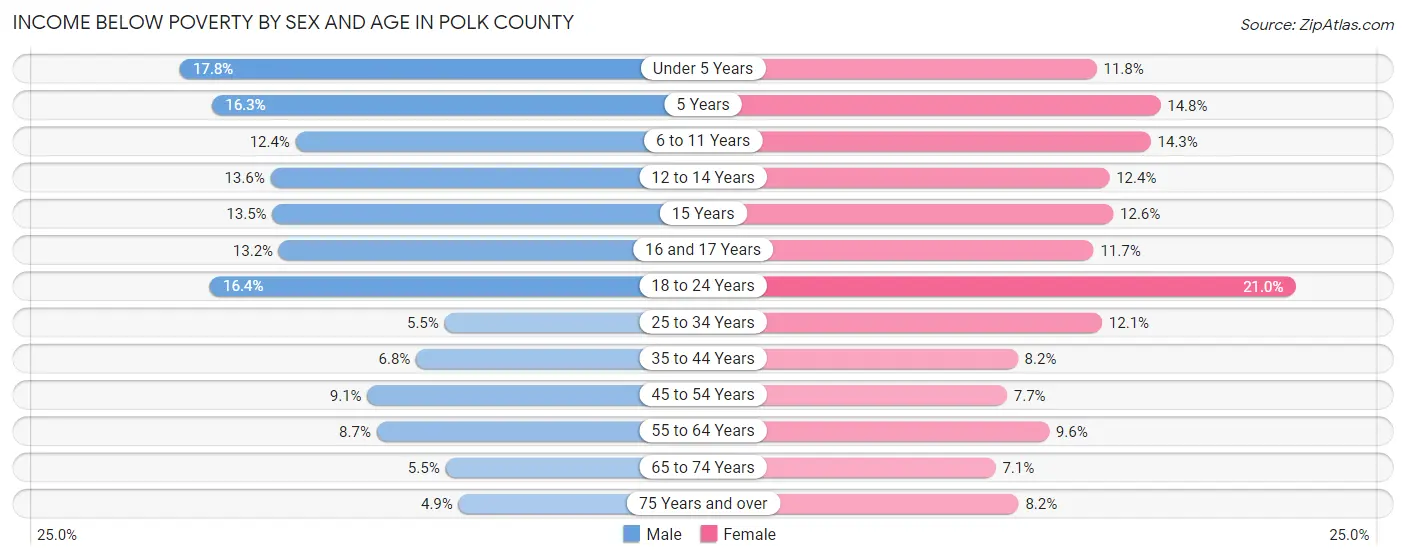
| Age Bracket | Male | Female |
| Under 5 Years | 2,947 (17.8%) | 1,888 (11.8%) |
| 5 Years | 551 (16.3%) | 474 (14.8%) |
| 6 to 11 Years | 2,514 (12.4%) | 2,821 (14.3%) |
| 12 to 14 Years | 1,400 (13.6%) | 1,217 (12.4%) |
| 15 Years | 426 (13.5%) | 358 (12.6%) |
| 16 and 17 Years | 913 (13.2%) | 816 (11.7%) |
| 18 to 24 Years | 3,308 (16.4%) | 4,351 (21.0%) |
| 25 to 34 Years | 2,085 (5.5%) | 4,389 (12.1%) |
| 35 to 44 Years | 2,404 (6.8%) | 2,729 (8.2%) |
| 45 to 54 Years | 2,755 (9.1%) | 2,245 (7.7%) |
| 55 to 64 Years | 2,445 (8.7%) | 2,807 (9.6%) |
| 65 to 74 Years | 1,036 (5.5%) | 1,524 (7.1%) |
| 75 Years and over | 475 (4.9%) | 1,194 (8.2%) |
| Total | 23,259 (9.7%) | 26,813 (11.0%) |
Income Above Poverty by Sex and Age in Polk County
According to the poverty statistics in Polk County, males aged 75 years and over and females aged 65 to 74 years are the age groups that are most secure financially, with 95.1% of males and 92.9% of females in these age groups living above the poverty line.
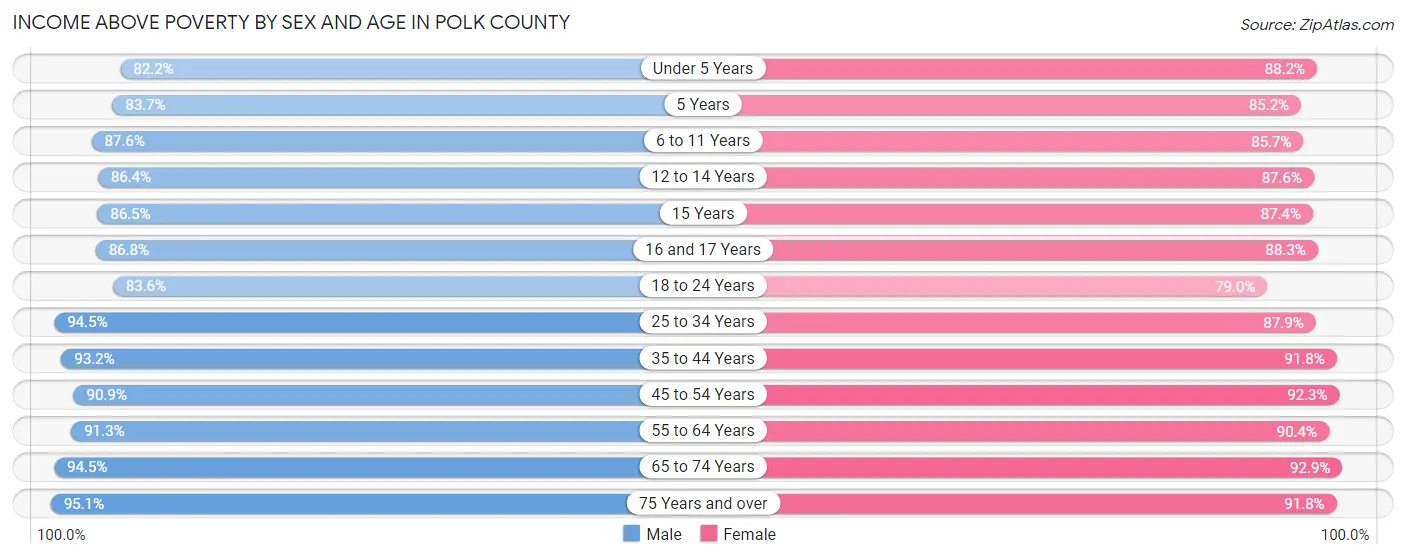
| Age Bracket | Male | Female |
| Under 5 Years | 13,618 (82.2%) | 14,089 (88.2%) |
| 5 Years | 2,832 (83.7%) | 2,733 (85.2%) |
| 6 to 11 Years | 17,728 (87.6%) | 16,864 (85.7%) |
| 12 to 14 Years | 8,901 (86.4%) | 8,591 (87.6%) |
| 15 Years | 2,729 (86.5%) | 2,486 (87.4%) |
| 16 and 17 Years | 6,005 (86.8%) | 6,172 (88.3%) |
| 18 to 24 Years | 16,879 (83.6%) | 16,327 (79.0%) |
| 25 to 34 Years | 35,751 (94.5%) | 31,969 (87.9%) |
| 35 to 44 Years | 32,801 (93.2%) | 30,717 (91.8%) |
| 45 to 54 Years | 27,567 (90.9%) | 27,064 (92.3%) |
| 55 to 64 Years | 25,786 (91.3%) | 26,403 (90.4%) |
| 65 to 74 Years | 17,911 (94.5%) | 19,860 (92.9%) |
| 75 Years and over | 9,292 (95.1%) | 13,361 (91.8%) |
| Total | 217,800 (90.3%) | 216,636 (89.0%) |
Income Below Poverty Among Married-Couple Families in Polk County
The poverty statistics for married-couple families in Polk County show that 3.4% or 3,066 of the total 91,042 families live below the poverty line. Families with 5 or more children have the highest poverty rate of 37.6%, comprising of 391 families. On the other hand, families with no children have the lowest poverty rate of 2.1%, which includes 1,062 families.
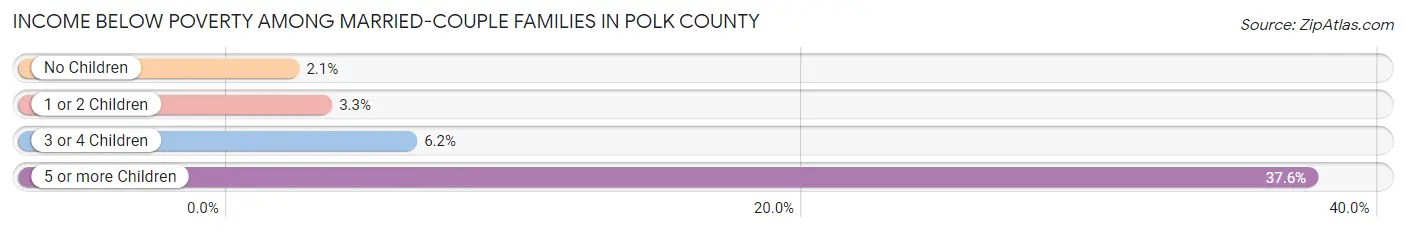
| Children | Above Poverty | Below Poverty |
| No Children | 48,468 (97.9%) | 1,062 (2.1%) |
| 1 or 2 Children | 29,770 (96.7%) | 1,008 (3.3%) |
| 3 or 4 Children | 9,089 (93.8%) | 605 (6.2%) |
| 5 or more Children | 649 (62.4%) | 391 (37.6%) |
| Total | 87,976 (96.6%) | 3,066 (3.4%) |
Income Below Poverty Among Single-Parent Households in Polk County
According to the poverty data in Polk County, 13.5% or 1,194 single-father households and 20.8% or 4,584 single-mother households are living below the poverty line. Among single-father households, those with 5 or more children have the highest poverty rate, with 16 households (100.0%) experiencing poverty. Likewise, among single-mother households, those with 5 or more children have the highest poverty rate, with 195 households (39.7%) falling below the poverty line.
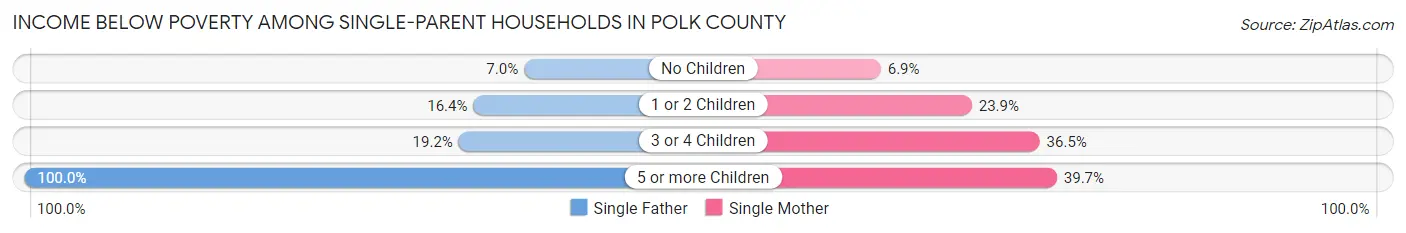
| Children | Single Father | Single Mother |
| No Children | 218 (7.0%) | 454 (6.9%) |
| 1 or 2 Children | 815 (16.4%) | 2,867 (23.9%) |
| 3 or 4 Children | 145 (19.2%) | 1,068 (36.5%) |
| 5 or more Children | 16 (100.0%) | 195 (39.7%) |
| Total | 1,194 (13.5%) | 4,584 (20.8%) |
Income Below Poverty Among Married-Couple vs Single-Parent Households in Polk County
The poverty data for Polk County shows that 3,066 of the married-couple family households (3.4%) and 5,778 of the single-parent households (18.7%) are living below the poverty level. Within the married-couple family households, those with 5 or more children have the highest poverty rate, with 391 households (37.6%) falling below the poverty line. Among the single-parent households, those with 5 or more children have the highest poverty rate, with 211 household (41.6%) living below poverty.
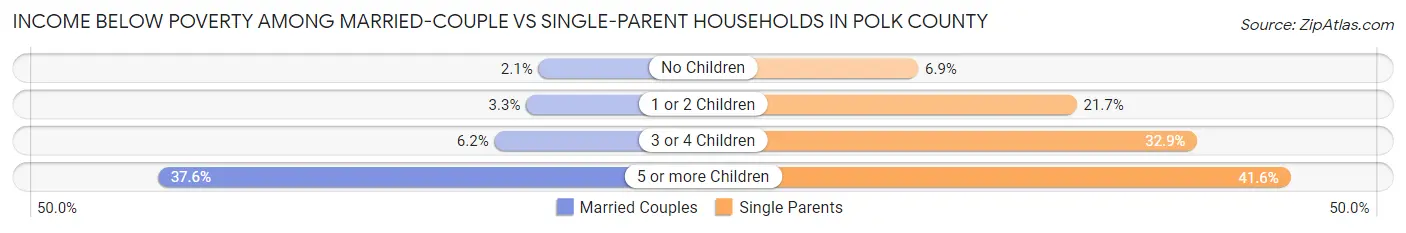
| Children | Married-Couple Families | Single-Parent Households |
| No Children | 1,062 (2.1%) | 672 (6.9%) |
| 1 or 2 Children | 1,008 (3.3%) | 3,682 (21.7%) |
| 3 or 4 Children | 605 (6.2%) | 1,213 (32.9%) |
| 5 or more Children | 391 (37.6%) | 211 (41.6%) |
| Total | 3,066 (3.4%) | 5,778 (18.7%) |
Race in Polk County
The most populous races in Polk County are White / Caucasian (393,717 | 79.8%), Hispanic or Latino (43,942 | 8.9%), and Black / African American (35,994 | 7.3%).
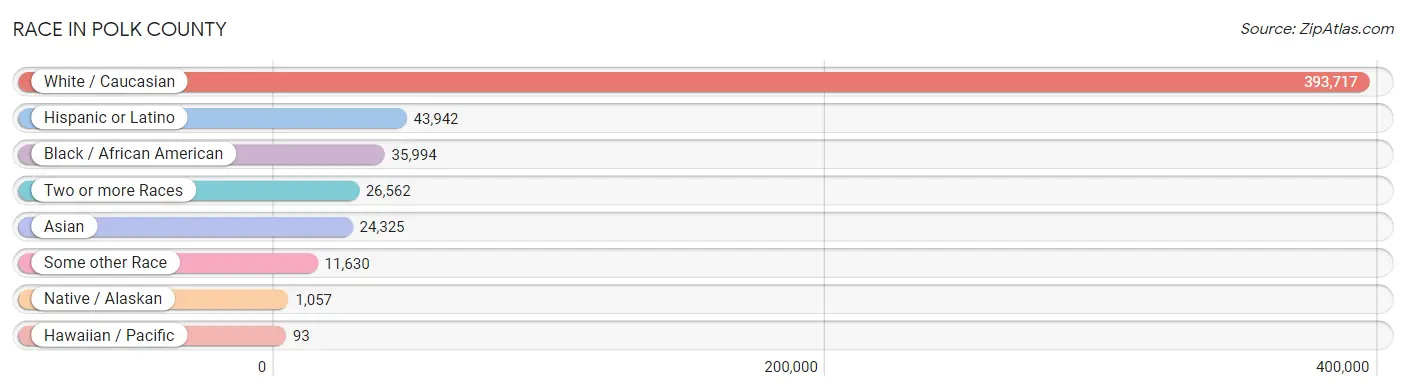
| Race | # Population | % Population |
| Asian | 24,325 | 4.9% |
| Black / African American | 35,994 | 7.3% |
| Hawaiian / Pacific | 93 | 0.0% |
| Hispanic or Latino | 43,942 | 8.9% |
| Native / Alaskan | 1,057 | 0.2% |
| White / Caucasian | 393,717 | 79.8% |
| Two or more Races | 26,562 | 5.4% |
| Some other Race | 11,630 | 2.4% |
| Total | 493,378 | 100.0% |
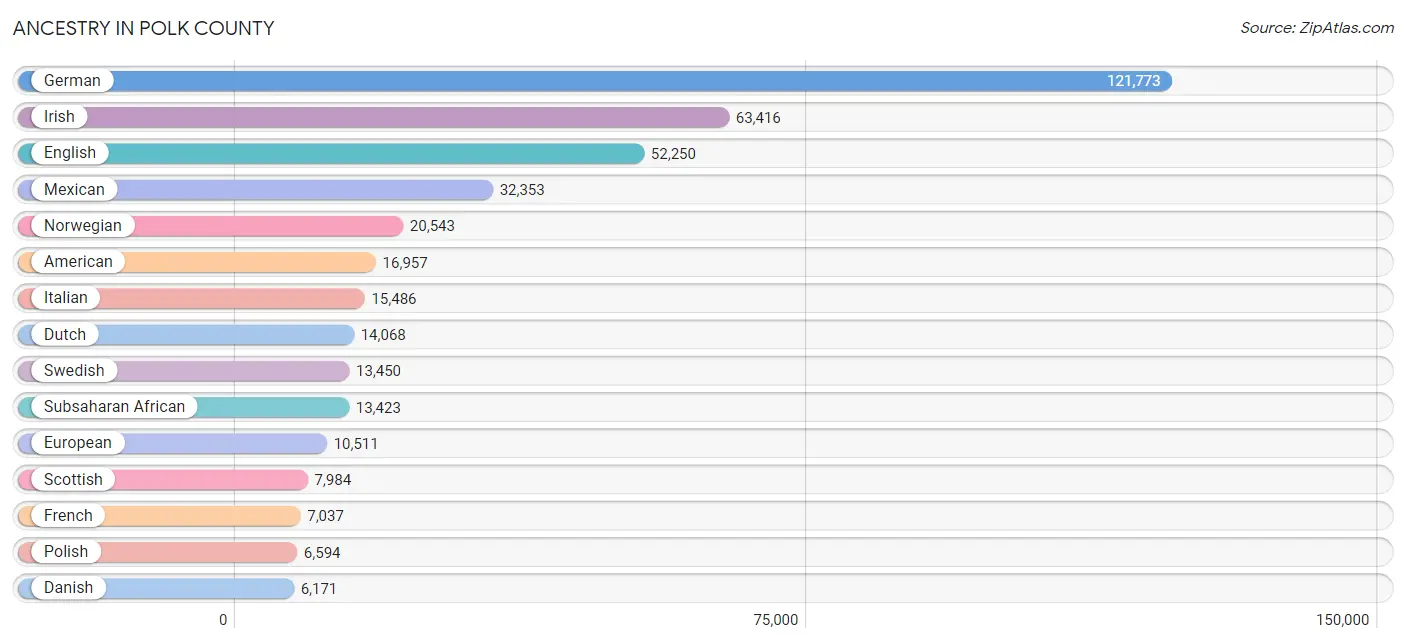
Ancestry in Polk County
The most populous ancestries reported in Polk County are German (121,773 | 24.7%), Irish (63,416 | 12.9%), English (52,250 | 10.6%), Mexican (32,353 | 6.6%), and Norwegian (20,543 | 4.2%), together accounting for 58.8% of all Polk County residents.
| Ancestry | # Population | % Population |
| Afghan | 530 | 0.1% |
| African | 2,930 | 0.6% |
| Alaska Native | 1 | 0.0% |
| Alaskan Athabascan | 14 | 0.0% |
| Albanian | 96 | 0.0% |
| American | 16,957 | 3.4% |
| Apache | 55 | 0.0% |
| Arab | 2,034 | 0.4% |
| Argentinean | 164 | 0.0% |
| Armenian | 16 | 0.0% |
| Assyrian / Chaldean / Syriac | 39 | 0.0% |
| Australian | 89 | 0.0% |
| Austrian | 898 | 0.2% |
| Bangladeshi | 211 | 0.0% |
| Basque | 12 | 0.0% |
| Belgian | 408 | 0.1% |
| Bhutanese | 498 | 0.1% |
| Blackfeet | 278 | 0.1% |
| Bolivian | 17 | 0.0% |
| Brazilian | 109 | 0.0% |
| British | 2,496 | 0.5% |
| Bulgarian | 56 | 0.0% |
| Burmese | 1,980 | 0.4% |
| Cajun | 17 | 0.0% |
| Canadian | 461 | 0.1% |
| Celtic | 38 | 0.0% |
| Central American | 5,708 | 1.2% |
| Central American Indian | 171 | 0.0% |
| Cherokee | 329 | 0.1% |
| Chilean | 59 | 0.0% |
| Chippewa | 49 | 0.0% |
| Choctaw | 210 | 0.0% |
| Colombian | 505 | 0.1% |
| Comanche | 52 | 0.0% |
| Costa Rican | 97 | 0.0% |
| Cree | 20 | 0.0% |
| Creek | 22 | 0.0% |
| Croatian | 1,257 | 0.3% |
| Cuban | 599 | 0.1% |
| Czech | 4,425 | 0.9% |
| Czechoslovakian | 478 | 0.1% |
| Danish | 6,171 | 1.3% |
| Dominican | 185 | 0.0% |
| Dutch | 14,068 | 2.9% |
| Eastern European | 1,055 | 0.2% |
| Ecuadorian | 343 | 0.1% |
| Egyptian | 393 | 0.1% |
| English | 52,250 | 10.6% |
| Ethiopian | 712 | 0.1% |
| European | 10,511 | 2.1% |
| Filipino | 85 | 0.0% |
| Finnish | 248 | 0.1% |
| French | 7,037 | 1.4% |
| French American Indian | 28 | 0.0% |
| French Canadian | 676 | 0.1% |
| German | 121,773 | 24.7% |
| German Russian | 21 | 0.0% |
| Ghanaian | 148 | 0.0% |
| Greek | 966 | 0.2% |
| Guamanian / Chamorro | 60 | 0.0% |
| Guatemalan | 1,307 | 0.3% |
| Haitian | 229 | 0.1% |
| Honduran | 773 | 0.2% |
| Houma | 4 | 0.0% |
| Hungarian | 843 | 0.2% |
| Icelander | 119 | 0.0% |
| Indian (Asian) | 2,676 | 0.5% |
| Indonesian | 3,890 | 0.8% |
| Iranian | 38 | 0.0% |
| Iraqi | 721 | 0.2% |
| Irish | 63,416 | 12.9% |
| Israeli | 14 | 0.0% |
| Italian | 15,486 | 3.1% |
| Jamaican | 552 | 0.1% |
| Japanese | 991 | 0.2% |
| Jordanian | 81 | 0.0% |
| Kenyan | 105 | 0.0% |
| Kiowa | 37 | 0.0% |
| Korean | 1,945 | 0.4% |
| Laotian | 28 | 0.0% |
| Latvian | 222 | 0.0% |
| Lebanese | 389 | 0.1% |
| Liberian | 2,991 | 0.6% |
| Lithuanian | 373 | 0.1% |
| Luxembourger | 629 | 0.1% |
| Macedonian | 20 | 0.0% |
| Malaysian | 3,002 | 0.6% |
| Maltese | 19 | 0.0% |
| Mexican | 32,353 | 6.6% |
| Mexican American Indian | 213 | 0.0% |
| Mongolian | 29 | 0.0% |
| Moroccan | 142 | 0.0% |
| Native Hawaiian | 194 | 0.0% |
| Navajo | 280 | 0.1% |
| New Zealander | 117 | 0.0% |
| Nicaraguan | 103 | 0.0% |
| Nigerian | 445 | 0.1% |
| Northern European | 1,447 | 0.3% |
| Norwegian | 20,543 | 4.2% |
| Osage | 3 | 0.0% |
| Ottawa | 4 | 0.0% |
| Pakistani | 1,087 | 0.2% |
| Palestinian | 6 | 0.0% |
| Panamanian | 200 | 0.0% |
| Pennsylvania German | 212 | 0.0% |
| Peruvian | 130 | 0.0% |
| Polish | 6,594 | 1.3% |
| Portuguese | 334 | 0.1% |
| Pueblo | 56 | 0.0% |
| Puerto Rican | 1,949 | 0.4% |
| Romanian | 179 | 0.0% |
| Russian | 1,840 | 0.4% |
| Salvadoran | 3,192 | 0.6% |
| Samoan | 7 | 0.0% |
| Scandinavian | 3,376 | 0.7% |
| Scotch-Irish | 4,098 | 0.8% |
| Scottish | 7,984 | 1.6% |
| Seminole | 2 | 0.0% |
| Senegalese | 106 | 0.0% |
| Serbian | 254 | 0.1% |
| Sierra Leonean | 3 | 0.0% |
| Sioux | 562 | 0.1% |
| Slavic | 194 | 0.0% |
| Slovak | 286 | 0.1% |
| Slovene | 105 | 0.0% |
| Somali | 1,358 | 0.3% |
| South African | 39 | 0.0% |
| South American | 1,402 | 0.3% |
| South American Indian | 7 | 0.0% |
| Spaniard | 562 | 0.1% |
| Spanish | 311 | 0.1% |
| Spanish American Indian | 21 | 0.0% |
| Sri Lankan | 4,019 | 0.8% |
| Subsaharan African | 13,423 | 2.7% |
| Sudanese | 3,328 | 0.7% |
| Swedish | 13,450 | 2.7% |
| Swiss | 1,320 | 0.3% |
| Syrian | 21 | 0.0% |
| Thai | 4,689 | 0.9% |
| Tongan | 25 | 0.0% |
| Trinidadian and Tobagonian | 15 | 0.0% |
| Turkish | 49 | 0.0% |
| Ugandan | 17 | 0.0% |
| Ukrainian | 518 | 0.1% |
| Uruguayan | 2 | 0.0% |
| Venezuelan | 182 | 0.0% |
| Welsh | 3,890 | 0.8% |
| West Indian | 32 | 0.0% |
| Yaqui | 36 | 0.0% |
| Yugoslavian | 3,581 | 0.7% | View All 150 Rows |
Immigrants in Polk County
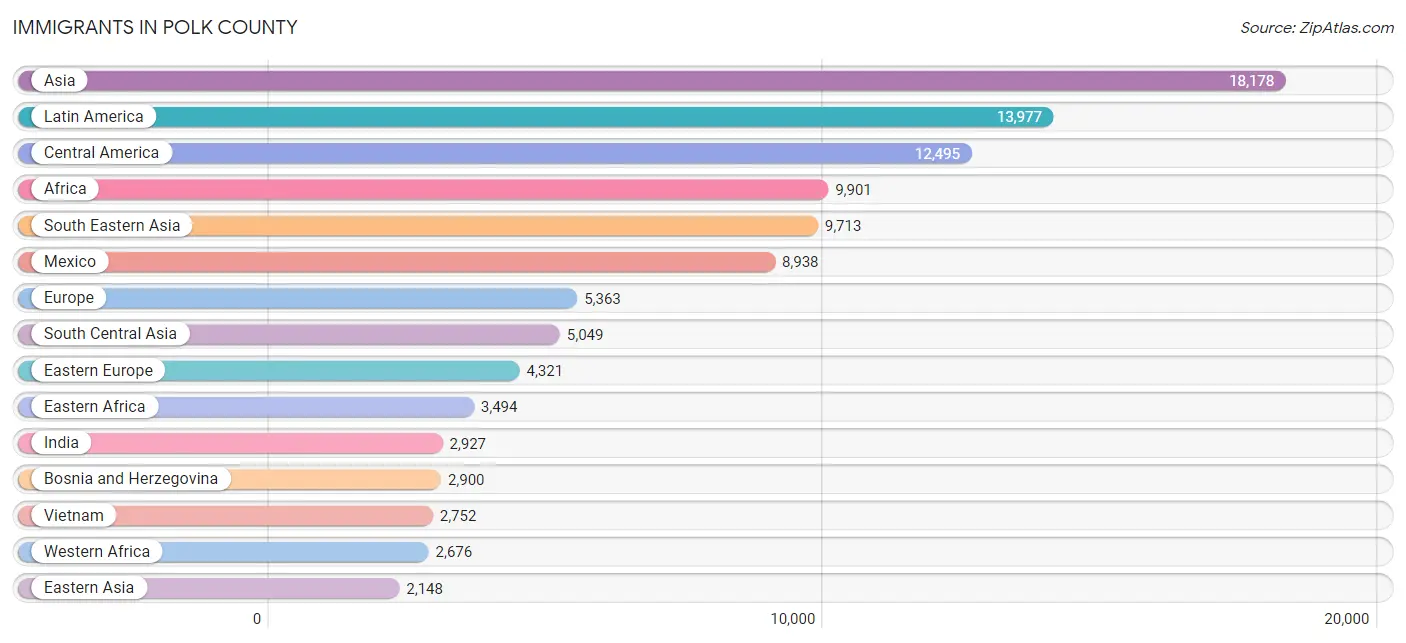
The most numerous immigrant groups reported in Polk County came from Asia (18,178 | 3.7%), Latin America (13,977 | 2.8%), Central America (12,495 | 2.5%), Africa (9,901 | 2.0%), and South Eastern Asia (9,713 | 2.0%), together accounting for 13.0% of all Polk County residents.
| Immigration Origin | # Population | % Population |
| Afghanistan | 399 | 0.1% |
| Africa | 9,901 | 2.0% |
| Argentina | 89 | 0.0% |
| Asia | 18,178 | 3.7% |
| Australia | 69 | 0.0% |
| Belarus | 42 | 0.0% |
| Belize | 15 | 0.0% |
| Bolivia | 5 | 0.0% |
| Bosnia and Herzegovina | 2,900 | 0.6% |
| Brazil | 146 | 0.0% |
| Bulgaria | 33 | 0.0% |
| Cambodia | 141 | 0.0% |
| Cameroon | 151 | 0.0% |
| Canada | 403 | 0.1% |
| Caribbean | 416 | 0.1% |
| Central America | 12,495 | 2.5% |
| Chile | 7 | 0.0% |
| China | 1,102 | 0.2% |
| Colombia | 407 | 0.1% |
| Congo | 745 | 0.2% |
| Costa Rica | 49 | 0.0% |
| Croatia | 189 | 0.0% |
| Cuba | 136 | 0.0% |
| Denmark | 11 | 0.0% |
| Dominican Republic | 138 | 0.0% |
| Eastern Africa | 3,494 | 0.7% |
| Eastern Asia | 2,148 | 0.4% |
| Eastern Europe | 4,321 | 0.9% |
| Ecuador | 138 | 0.0% |
| Egypt | 513 | 0.1% |
| El Salvador | 2,036 | 0.4% |
| England | 157 | 0.0% |
| Eritrea | 186 | 0.0% |
| Ethiopia | 402 | 0.1% |
| Europe | 5,363 | 1.1% |
| France | 15 | 0.0% |
| Germany | 305 | 0.1% |
| Ghana | 257 | 0.1% |
| Greece | 38 | 0.0% |
| Guatemala | 820 | 0.2% |
| Haiti | 67 | 0.0% |
| Honduras | 542 | 0.1% |
| Hong Kong | 21 | 0.0% |
| Hungary | 14 | 0.0% |
| India | 2,927 | 0.6% |
| Indonesia | 14 | 0.0% |
| Iraq | 715 | 0.1% |
| Ireland | 5 | 0.0% |
| Israel | 28 | 0.0% |
| Italy | 79 | 0.0% |
| Jamaica | 60 | 0.0% |
| Japan | 114 | 0.0% |
| Jordan | 96 | 0.0% |
| Kenya | 376 | 0.1% |
| Korea | 932 | 0.2% |
| Kuwait | 11 | 0.0% |
| Laos | 1,833 | 0.4% |
| Latin America | 13,977 | 2.8% |
| Latvia | 69 | 0.0% |
| Lebanon | 119 | 0.0% |
| Liberia | 1,692 | 0.3% |
| Malaysia | 236 | 0.1% |
| Mexico | 8,938 | 1.8% |
| Micronesia | 7 | 0.0% |
| Middle Africa | 1,246 | 0.3% |
| Morocco | 96 | 0.0% |
| Nepal | 403 | 0.1% |
| Netherlands | 37 | 0.0% |
| Nicaragua | 76 | 0.0% |
| Nigeria | 201 | 0.0% |
| Northern Africa | 2,023 | 0.4% |
| Northern Europe | 407 | 0.1% |
| Norway | 52 | 0.0% |
| Oceania | 97 | 0.0% |
| Pakistan | 95 | 0.0% |
| Panama | 6 | 0.0% |
| Peru | 34 | 0.0% |
| Philippines | 578 | 0.1% |
| Poland | 139 | 0.0% |
| Portugal | 10 | 0.0% |
| Romania | 31 | 0.0% |
| Russia | 446 | 0.1% |
| Saudi Arabia | 65 | 0.0% |
| Scotland | 16 | 0.0% |
| Senegal | 44 | 0.0% |
| Serbia | 13 | 0.0% |
| Sierra Leone | 82 | 0.0% |
| Somalia | 687 | 0.1% |
| South Africa | 124 | 0.0% |
| South America | 1,066 | 0.2% |
| South Central Asia | 5,049 | 1.0% |
| South Eastern Asia | 9,713 | 2.0% |
| Southern Europe | 271 | 0.1% |
| Spain | 125 | 0.0% |
| Sri Lanka | 231 | 0.1% |
| Sudan | 1,387 | 0.3% |
| Syria | 23 | 0.0% |
| Taiwan | 20 | 0.0% |
| Thailand | 1,689 | 0.3% |
| Trinidad and Tobago | 15 | 0.0% |
| Turkey | 55 | 0.0% |
| Uganda | 45 | 0.0% |
| Ukraine | 295 | 0.1% |
| Uruguay | 157 | 0.0% |
| Venezuela | 83 | 0.0% |
| Vietnam | 2,752 | 0.6% |
| Western Africa | 2,676 | 0.5% |
| Western Asia | 1,254 | 0.3% |
| Western Europe | 364 | 0.1% |
| Zaire | 267 | 0.1% |
| Zimbabwe | 47 | 0.0% | View All 111 Rows |
Sex and Age in Polk County
Sex and Age in Polk County
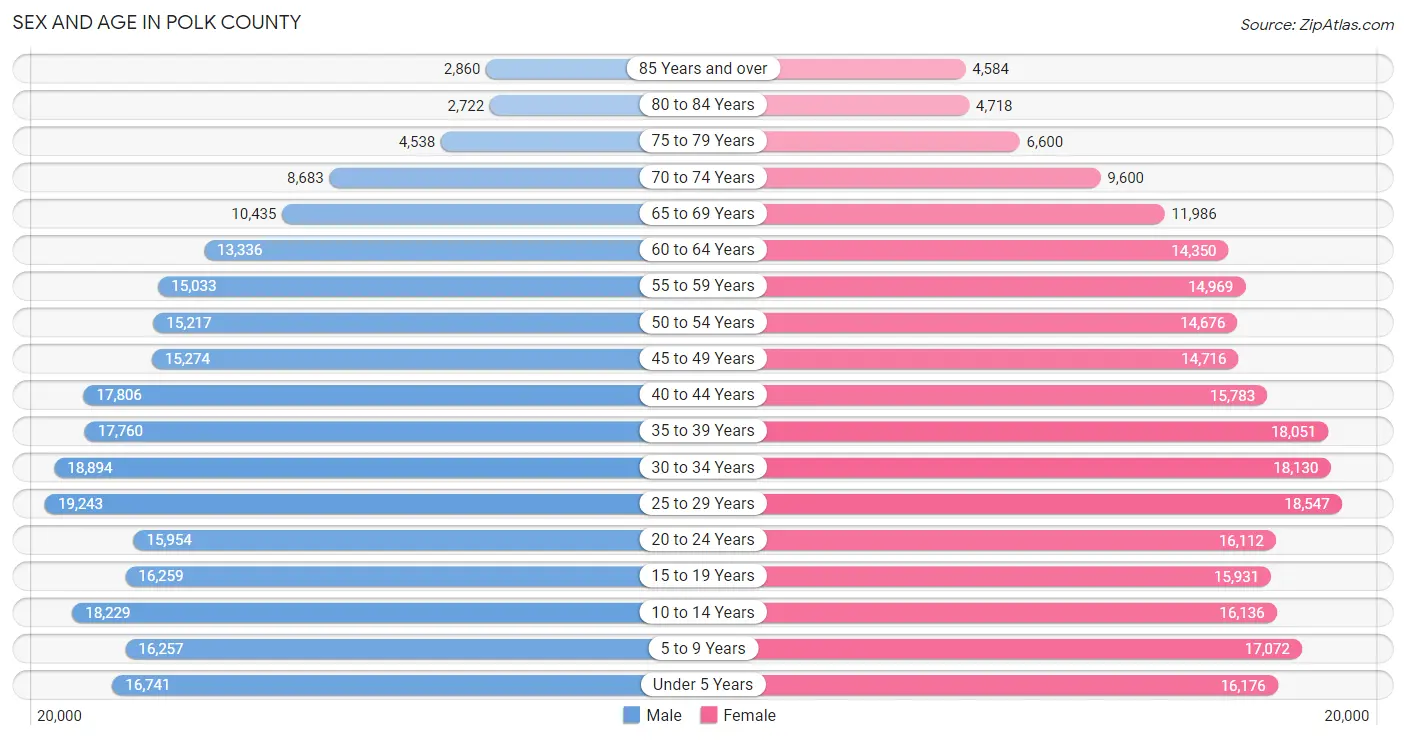
The most populous age groups in Polk County are 25 to 29 Years (19,243 | 7.9%) for men and 25 to 29 Years (18,547 | 7.5%) for women.
| Age Bracket | Male | Female |
| Under 5 Years | 16,741 (6.8%) | 16,176 (6.5%) |
| 5 to 9 Years | 16,257 (6.6%) | 17,072 (6.9%) |
| 10 to 14 Years | 18,229 (7.4%) | 16,136 (6.5%) |
| 15 to 19 Years | 16,259 (6.6%) | 15,931 (6.4%) |
| 20 to 24 Years | 15,954 (6.5%) | 16,112 (6.5%) |
| 25 to 29 Years | 19,243 (7.9%) | 18,547 (7.5%) |
| 30 to 34 Years | 18,894 (7.7%) | 18,130 (7.3%) |
| 35 to 39 Years | 17,760 (7.2%) | 18,051 (7.3%) |
| 40 to 44 Years | 17,806 (7.3%) | 15,783 (6.4%) |
| 45 to 49 Years | 15,274 (6.2%) | 14,716 (5.9%) |
| 50 to 54 Years | 15,217 (6.2%) | 14,676 (5.9%) |
| 55 to 59 Years | 15,033 (6.1%) | 14,969 (6.0%) |
| 60 to 64 Years | 13,336 (5.4%) | 14,350 (5.8%) |
| 65 to 69 Years | 10,435 (4.3%) | 11,986 (4.8%) |
| 70 to 74 Years | 8,683 (3.5%) | 9,600 (3.9%) |
| 75 to 79 Years | 4,538 (1.8%) | 6,600 (2.7%) |
| 80 to 84 Years | 2,722 (1.1%) | 4,718 (1.9%) |
| 85 Years and over | 2,860 (1.2%) | 4,584 (1.8%) |
| Total | 245,241 (100.0%) | 248,137 (100.0%) |
Families and Households in Polk County
Median Family Size in Polk County
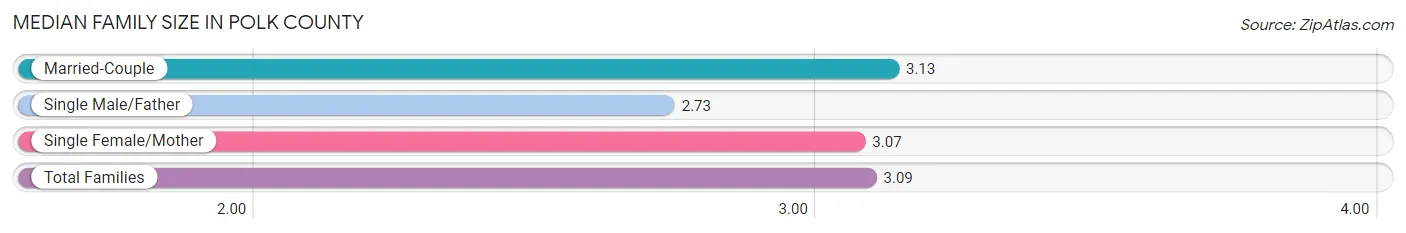
The median family size in Polk County is 3.09 persons per family, with married-couple families (91,042 | 74.7%) accounting for the largest median family size of 3.13 persons per family. On the other hand, single male/father families (8,861 | 7.3%) represent the smallest median family size with 2.73 persons per family.
| Family Type | # Families | Family Size |
| Married-Couple | 91,042 (74.7%) | 3.13 |
| Single Male/Father | 8,861 (7.3%) | 2.73 |
| Single Female/Mother | 22,003 (18.0%) | 3.07 |
| Total Families | 121,906 (100.0%) | 3.09 |
Median Household Size in Polk County
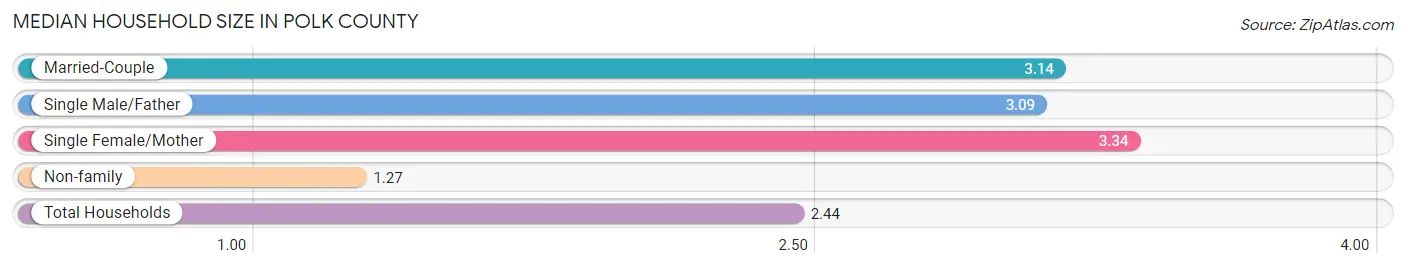
The median household size in Polk County is 2.44 persons per household, with single female/mother households (22,003 | 11.1%) accounting for the largest median household size of 3.34 persons per household. non-family households (77,107 | 38.7%) represent the smallest median household size with 1.27 persons per household.
| Household Type | # Households | Household Size |
| Married-Couple | 91,042 (45.8%) | 3.14 |
| Single Male/Father | 8,861 (4.4%) | 3.09 |
| Single Female/Mother | 22,003 (11.1%) | 3.34 |
| Non-family | 77,107 (38.7%) | 1.27 |
| Total Households | 199,013 (100.0%) | 2.44 |
Household Size by Marriage Status in Polk County
Out of a total of 199,013 households in Polk County, 121,906 (61.3%) are family households, while 77,107 (38.7%) are nonfamily households. The most numerous type of family households are 2-person households, comprising 52,476, and the most common type of nonfamily households are 1-person households, comprising 60,366.
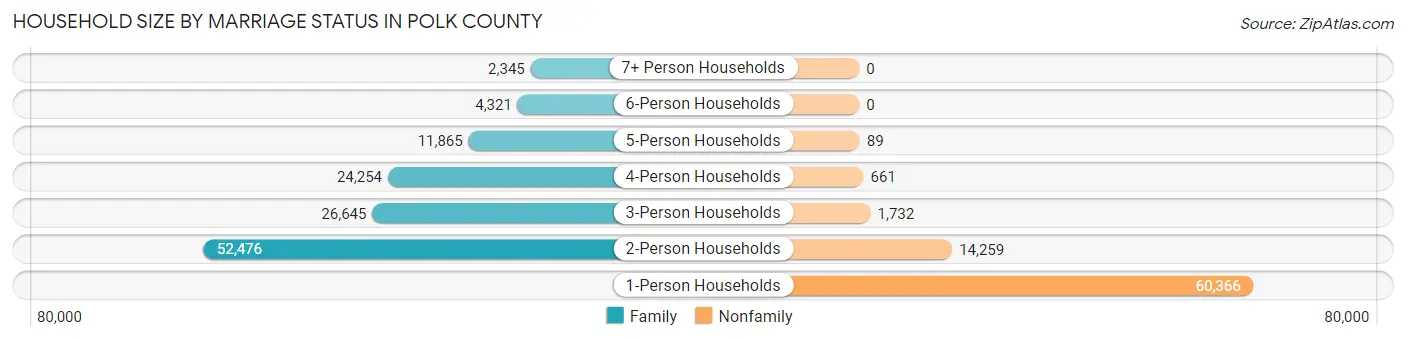
| Household Size | Family Households | Nonfamily Households |
| 1-Person Households | - | 60,366 (30.3%) |
| 2-Person Households | 52,476 (26.4%) | 14,259 (7.2%) |
| 3-Person Households | 26,645 (13.4%) | 1,732 (0.9%) |
| 4-Person Households | 24,254 (12.2%) | 661 (0.3%) |
| 5-Person Households | 11,865 (6.0%) | 89 (0.0%) |
| 6-Person Households | 4,321 (2.2%) | 0 (0.0%) |
| 7+ Person Households | 2,345 (1.2%) | 0 (0.0%) |
| Total | 121,906 (61.3%) | 77,107 (38.7%) |
Female Fertility in Polk County
Fertility by Age in Polk County
Average fertility rate in Polk County is 47.0 births per 1,000 women. Women in the age bracket of 20 to 34 years have the highest fertility rate with 75.0 births per 1,000 women. Women in the age bracket of 20 to 34 years acount for 69.1% of all women with births.
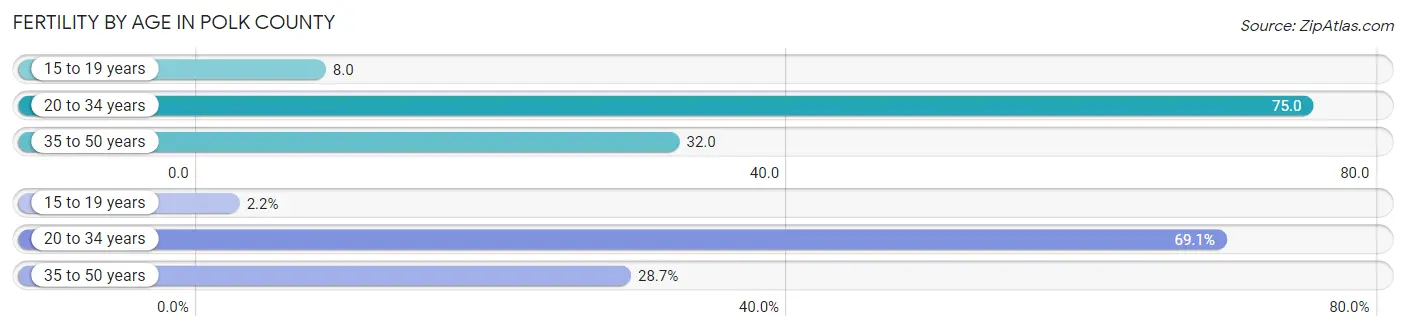
| Age Bracket | Women with Births | Births / 1,000 Women |
| 15 to 19 years | 123 (2.1%) | 8.0 |
| 20 to 34 years | 3,951 (69.1%) | 75.0 |
| 35 to 50 years | 1,641 (28.7%) | 32.0 |
| Total | 5,715 (100.0%) | 47.0 |
Fertility by Age by Marriage Status in Polk County
77.5% of women with births (5,715) in Polk County are married. The highest percentage of unmarried women with births falls into 15 to 19 years age bracket with 68.3% of them unmarried at the time of birth, while the lowest percentage of unmarried women with births belong to 35 to 50 years age bracket with 16.2% of them unmarried.
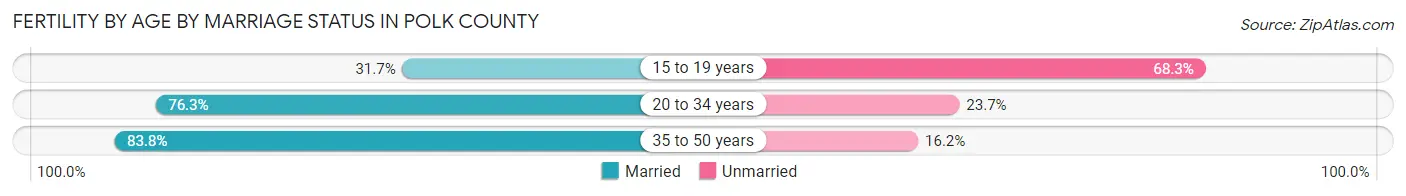
| Age Bracket | Married | Unmarried |
| 15 to 19 years | 39 (31.7%) | 84 (68.3%) |
| 20 to 34 years | 3,015 (76.3%) | 936 (23.7%) |
| 35 to 50 years | 1,375 (83.8%) | 266 (16.2%) |
| Total | 4,429 (77.5%) | 1,286 (22.5%) |
Fertility by Education in Polk County
Average fertility rate in Polk County is 47.0 births per 1,000 women. Women with the education attainment of graduate degree have the highest fertility rate of 63.0 births per 1,000 women, while women with the education attainment of less than high school have the lowest fertility at 36.0 births per 1,000 women. Women with the education attainment of bachelor's degree represent 27.1% of all women with births.
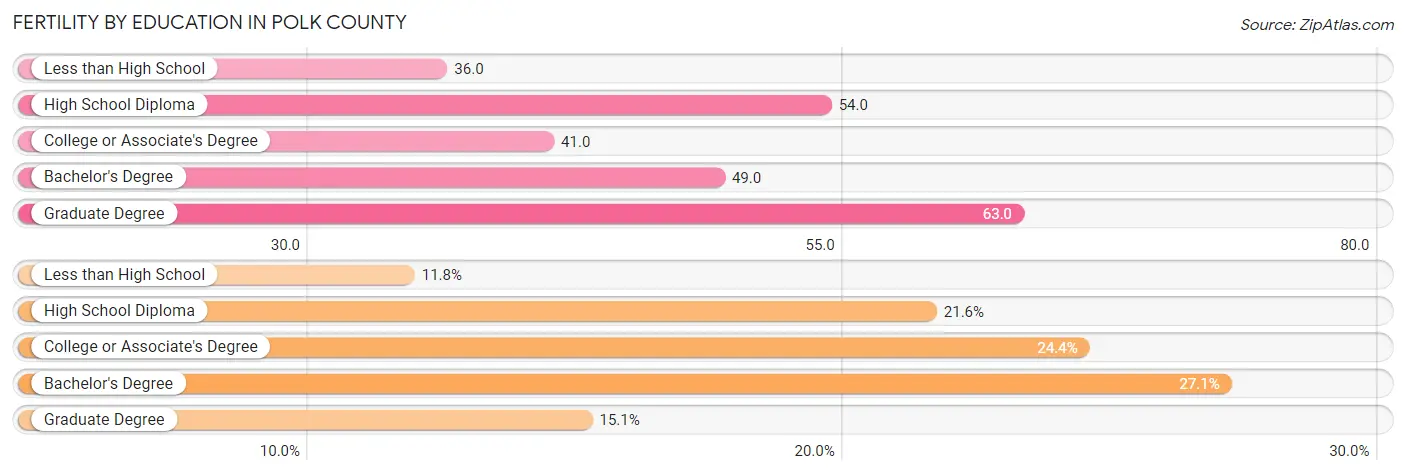
| Educational Attainment | Women with Births | Births / 1,000 Women |
| Less than High School | 674 (11.8%) | 36.0 |
| High School Diploma | 1,233 (21.6%) | 54.0 |
| College or Associate's Degree | 1,396 (24.4%) | 41.0 |
| Bachelor's Degree | 1,548 (27.1%) | 49.0 |
| Graduate Degree | 864 (15.1%) | 63.0 |
| Total | 5,715 (100.0%) | 47.0 |
Fertility by Education by Marriage Status in Polk County
22.5% of women with births in Polk County are unmarried. Women with the educational attainment of graduate degree are most likely to be married with 95.5% of them married at childbirth, while women with the educational attainment of high school diploma are least likely to be married with 48.3% of them unmarried at childbirth.
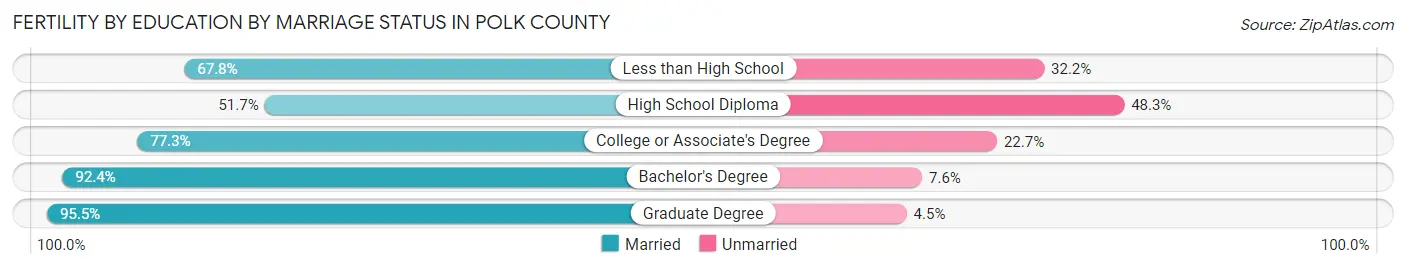
| Educational Attainment | Married | Unmarried |
| Less than High School | 457 (67.8%) | 217 (32.2%) |
| High School Diploma | 637 (51.7%) | 596 (48.3%) |
| College or Associate's Degree | 1,079 (77.3%) | 317 (22.7%) |
| Bachelor's Degree | 1,430 (92.4%) | 118 (7.6%) |
| Graduate Degree | 825 (95.5%) | 39 (4.5%) |
| Total | 4,429 (77.5%) | 1,286 (22.5%) |
Employment Characteristics in Polk County
Employment by Class of Employer in Polk County
Among the 257,254 employed individuals in Polk County, private company employees (182,332 | 70.9%), not-for-profit organizations (23,656 | 9.2%), and local government employees (14,978 | 5.8%) make up the most common classes of employment.
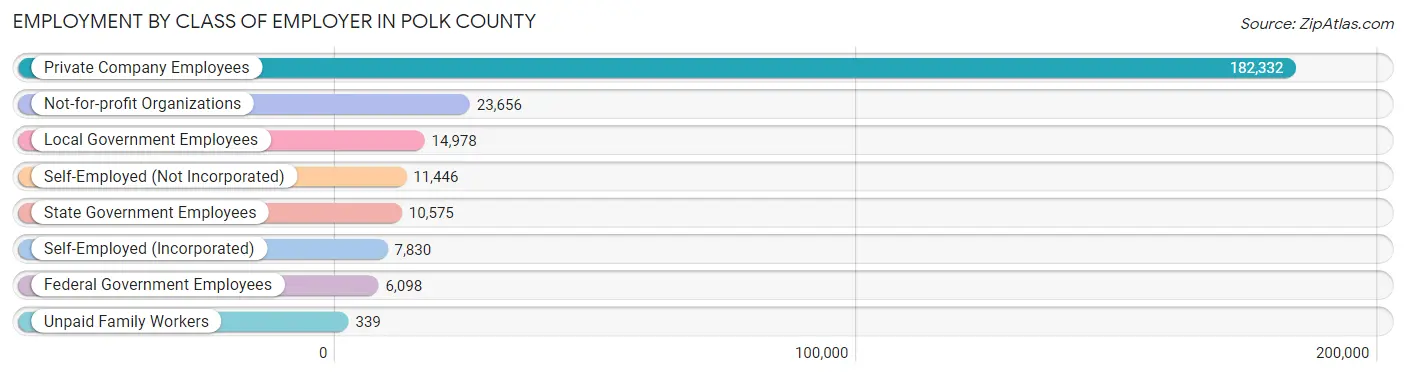
| Employer Class | # Employees | % Employees |
| Private Company Employees | 182,332 | 70.9% |
| Self-Employed (Incorporated) | 7,830 | 3.0% |
| Self-Employed (Not Incorporated) | 11,446 | 4.4% |
| Not-for-profit Organizations | 23,656 | 9.2% |
| Local Government Employees | 14,978 | 5.8% |
| State Government Employees | 10,575 | 4.1% |
| Federal Government Employees | 6,098 | 2.4% |
| Unpaid Family Workers | 339 | 0.1% |
| Total | 257,254 | 100.0% |
Employment Status by Age in Polk County
According to the labor force statistics for Polk County, out of the total population over 16 years of age (386,736), 71.1% or 274,969 individuals are in the labor force, with 4.5% or 12,374 of them unemployed. The age group with the highest labor force participation rate is 35 to 44 years, with 89.4% or 62,044 individuals in the labor force. Within the labor force, the 16 to 19 years age range has the highest percentage of unemployed individuals, with 14.7% or 2,077 of them being unemployed.
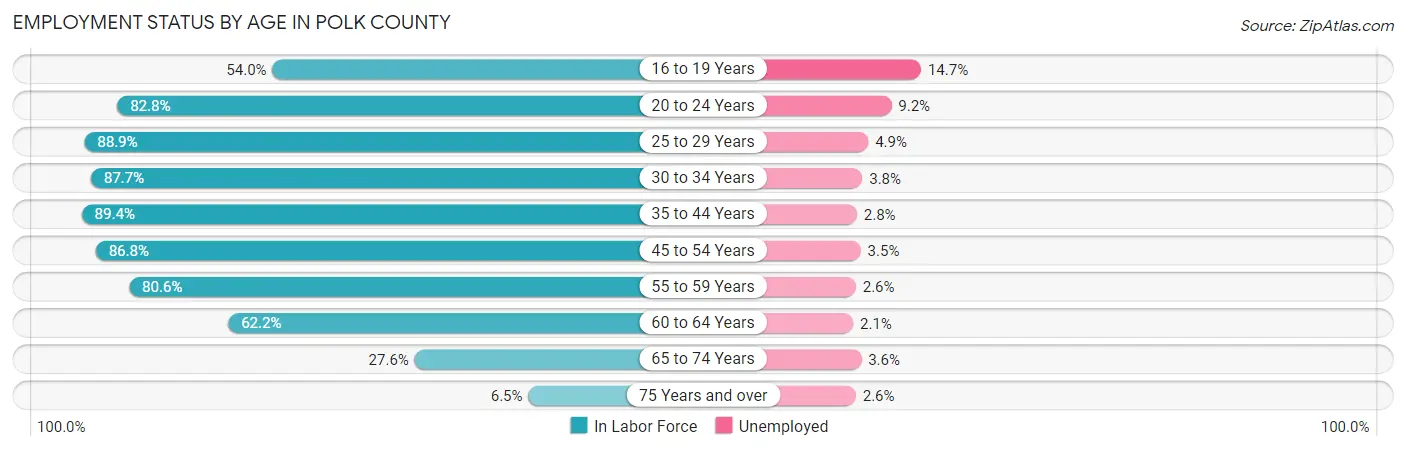
| Age Bracket | In Labor Force | Unemployed |
| 16 to 19 Years | 14,126 (54.0%) | 2,077 (14.7%) |
| 20 to 24 Years | 26,551 (82.8%) | 2,443 (9.2%) |
| 25 to 29 Years | 33,595 (88.9%) | 1,646 (4.9%) |
| 30 to 34 Years | 32,470 (87.7%) | 1,234 (3.8%) |
| 35 to 44 Years | 62,044 (89.4%) | 1,737 (2.8%) |
| 45 to 54 Years | 51,978 (86.8%) | 1,819 (3.5%) |
| 55 to 59 Years | 24,182 (80.6%) | 629 (2.6%) |
| 60 to 64 Years | 17,221 (62.2%) | 362 (2.1%) |
| 65 to 74 Years | 11,234 (27.6%) | 404 (3.6%) |
| 75 Years and over | 1,691 (6.5%) | 44 (2.6%) |
| Total | 274,969 (71.1%) | 12,374 (4.5%) |
Employment Status by Educational Attainment in Polk County
According to labor force statistics for Polk County, 84.6% of individuals (221,470) out of the total population between 25 and 64 years of age (261,785) are in the labor force, with 3.3% or 7,309 of them being unemployed. The group with the highest labor force participation rate are those with the educational attainment of bachelor's degree or higher, with 90.7% or 96,848 individuals in the labor force. Within the labor force, individuals with less than high school education have the highest percentage of unemployment, with 8.4% or 1,148 of them being unemployed.
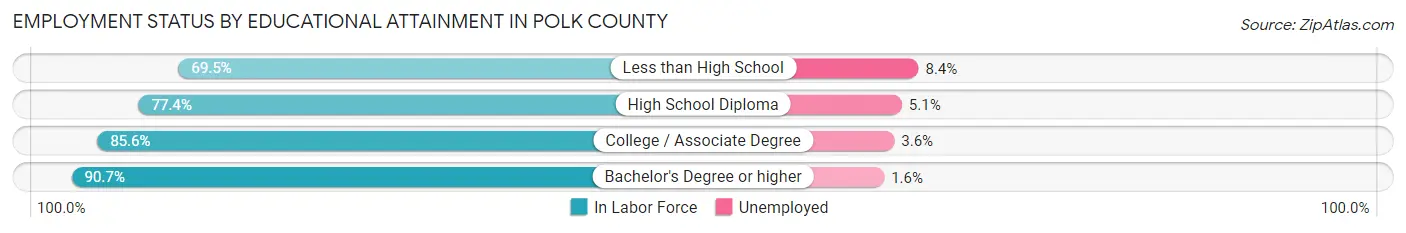
| Educational Attainment | In Labor Force | Unemployed |
| Less than High School | 13,662 (69.5%) | 1,651 (8.4%) |
| High School Diploma | 45,946 (77.4%) | 3,027 (5.1%) |
| College / Associate Degree | 65,046 (85.6%) | 2,736 (3.6%) |
| Bachelor's Degree or higher | 96,848 (90.7%) | 1,708 (1.6%) |
| Total | 221,470 (84.6%) | 8,639 (3.3%) |
Employment Occupations by Sex in Polk County
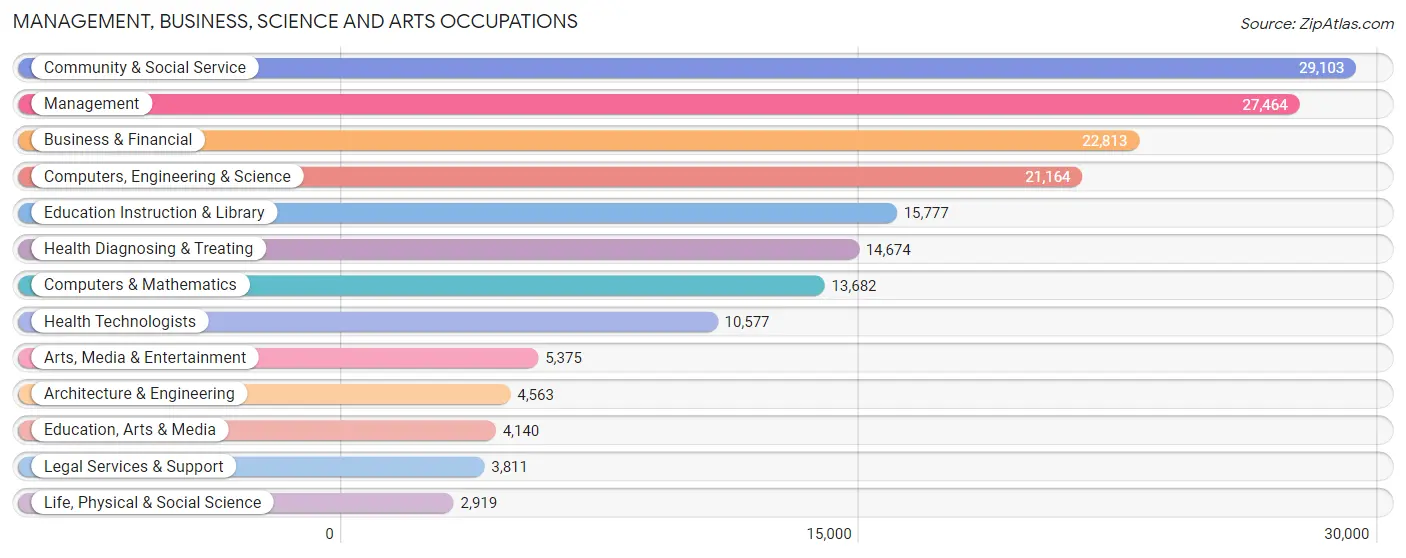
Management, Business, Science and Arts Occupations
The most common Management, Business, Science and Arts occupations in Polk County are Community & Social Service (29,103 | 11.1%), Management (27,464 | 10.5%), Business & Financial (22,813 | 8.7%), Computers, Engineering & Science (21,164 | 8.1%), and Education Instruction & Library (15,777 | 6.0%).
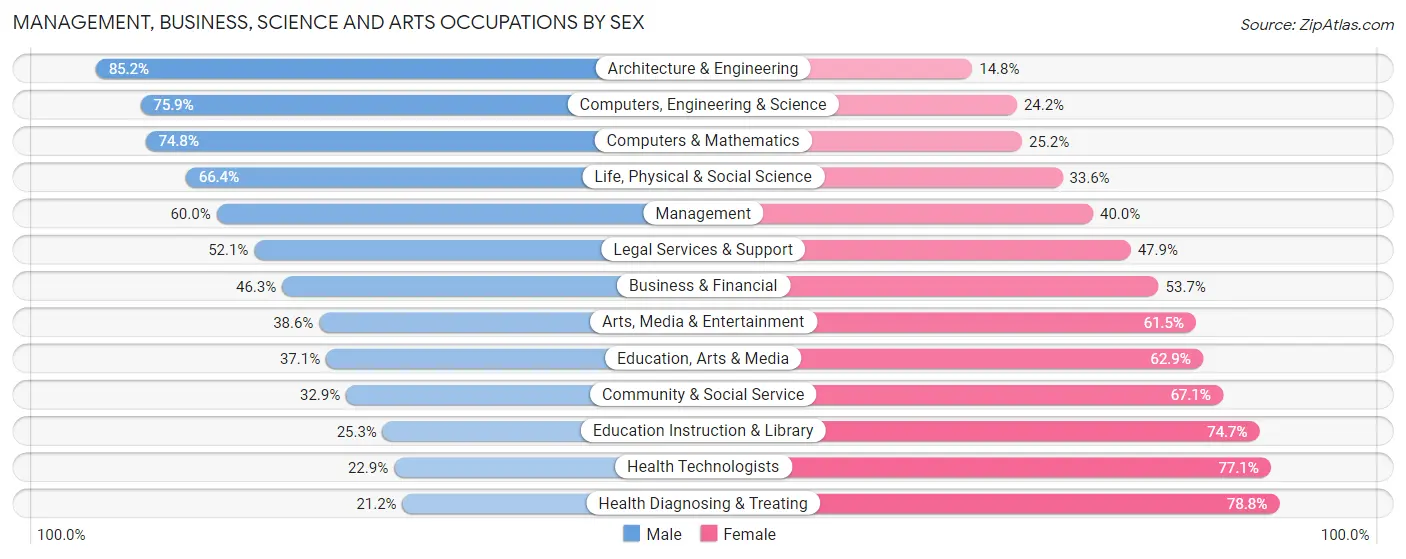
Management, Business, Science and Arts Occupations by Sex
Within the Management, Business, Science and Arts occupations in Polk County, the most male-oriented occupations are Architecture & Engineering (85.2%), Computers, Engineering & Science (75.8%), and Computers & Mathematics (74.8%), while the most female-oriented occupations are Health Diagnosing & Treating (78.8%), Health Technologists (77.1%), and Education Instruction & Library (74.7%).
| Occupation | Male | Female |
| Management | 16,470 (60.0%) | 10,994 (40.0%) |
| Business & Financial | 10,561 (46.3%) | 12,252 (53.7%) |
| Computers, Engineering & Science | 16,053 (75.8%) | 5,111 (24.1%) |
| Computers & Mathematics | 10,230 (74.8%) | 3,452 (25.2%) |
| Architecture & Engineering | 3,886 (85.2%) | 677 (14.8%) |
| Life, Physical & Social Science | 1,937 (66.4%) | 982 (33.6%) |
| Community & Social Service | 9,586 (32.9%) | 19,517 (67.1%) |
| Education, Arts & Media | 1,537 (37.1%) | 2,603 (62.9%) |
| Legal Services & Support | 1,986 (52.1%) | 1,825 (47.9%) |
| Education Instruction & Library | 3,991 (25.3%) | 11,786 (74.7%) |
| Arts, Media & Entertainment | 2,072 (38.6%) | 3,303 (61.5%) |
| Health Diagnosing & Treating | 3,108 (21.2%) | 11,566 (78.8%) |
| Health Technologists | 2,426 (22.9%) | 8,151 (77.1%) |
| Total (Category) | 55,778 (48.4%) | 59,440 (51.6%) |
| Total (Overall) | 137,850 (52.7%) | 123,832 (47.3%) |
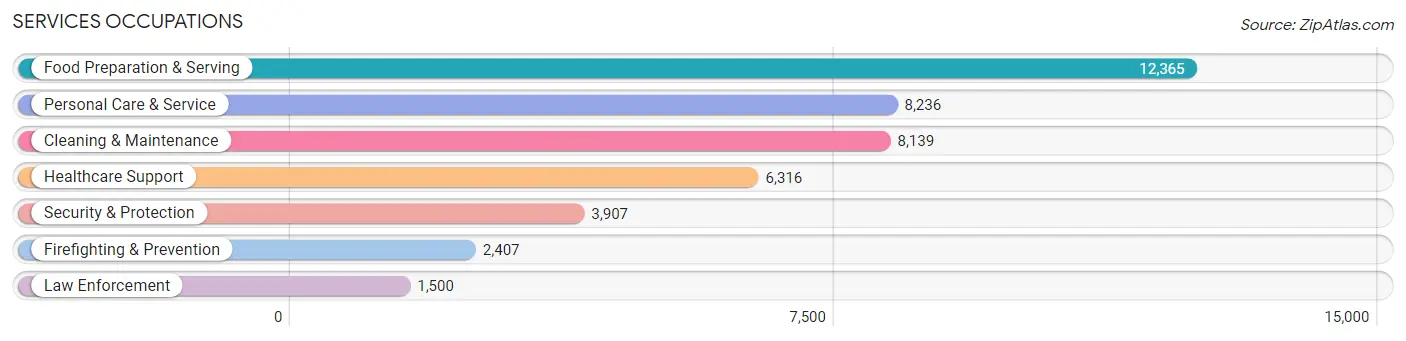
Services Occupations
The most common Services occupations in Polk County are Food Preparation & Serving (12,365 | 4.7%), Personal Care & Service (8,236 | 3.2%), Cleaning & Maintenance (8,139 | 3.1%), Healthcare Support (6,316 | 2.4%), and Security & Protection (3,907 | 1.5%).
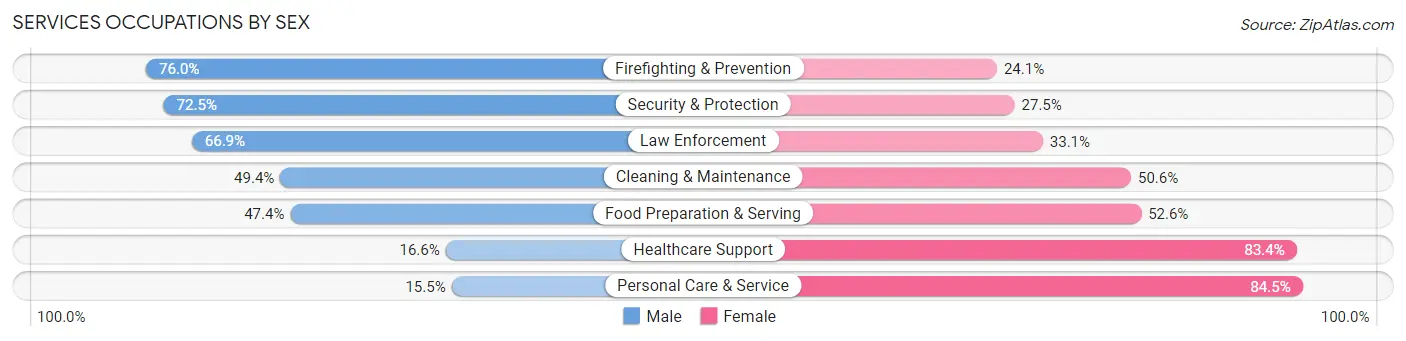
Services Occupations by Sex
Within the Services occupations in Polk County, the most male-oriented occupations are Firefighting & Prevention (75.9%), Security & Protection (72.5%), and Law Enforcement (66.9%), while the most female-oriented occupations are Personal Care & Service (84.5%), Healthcare Support (83.4%), and Food Preparation & Serving (52.6%).
| Occupation | Male | Female |
| Healthcare Support | 1,051 (16.6%) | 5,265 (83.4%) |
| Security & Protection | 2,831 (72.5%) | 1,076 (27.5%) |
| Firefighting & Prevention | 1,828 (75.9%) | 579 (24.0%) |
| Law Enforcement | 1,003 (66.9%) | 497 (33.1%) |
| Food Preparation & Serving | 5,861 (47.4%) | 6,504 (52.6%) |
| Cleaning & Maintenance | 4,021 (49.4%) | 4,118 (50.6%) |
| Personal Care & Service | 1,274 (15.5%) | 6,962 (84.5%) |
| Total (Category) | 15,038 (38.6%) | 23,925 (61.4%) |
| Total (Overall) | 137,850 (52.7%) | 123,832 (47.3%) |
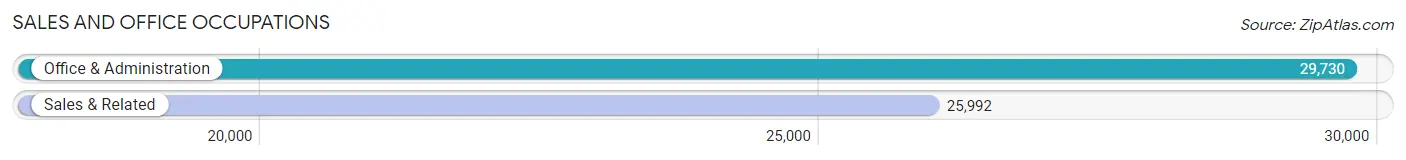
Sales and Office Occupations
The most common Sales and Office occupations in Polk County are Office & Administration (29,730 | 11.4%), and Sales & Related (25,992 | 9.9%).
Sales and Office Occupations by Sex
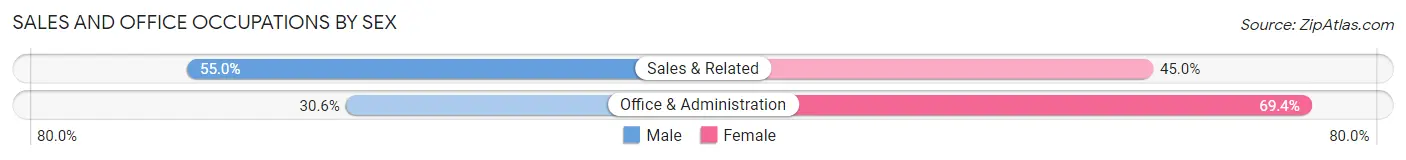
| Occupation | Male | Female |
| Sales & Related | 14,296 (55.0%) | 11,696 (45.0%) |
| Office & Administration | 9,101 (30.6%) | 20,629 (69.4%) |
| Total (Category) | 23,397 (42.0%) | 32,325 (58.0%) |
| Total (Overall) | 137,850 (52.7%) | 123,832 (47.3%) |
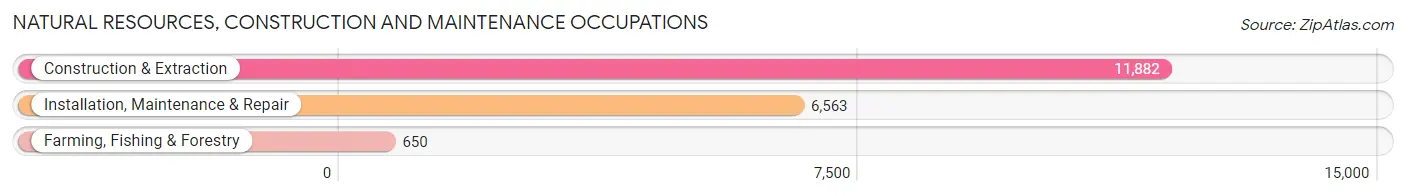
Natural Resources, Construction and Maintenance Occupations
The most common Natural Resources, Construction and Maintenance occupations in Polk County are Construction & Extraction (11,882 | 4.5%), Installation, Maintenance & Repair (6,563 | 2.5%), and Farming, Fishing & Forestry (650 | 0.3%).
Natural Resources, Construction and Maintenance Occupations by Sex
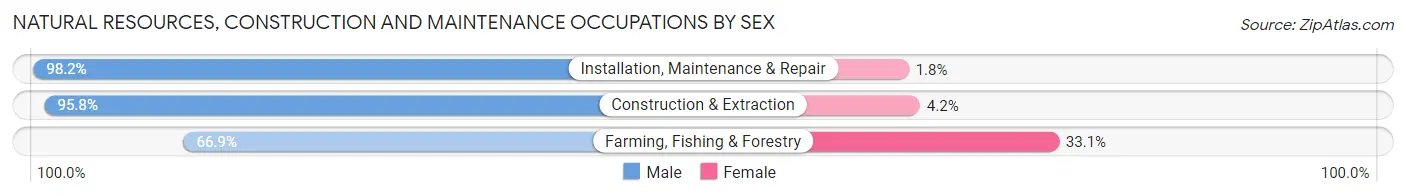
| Occupation | Male | Female |
| Farming, Fishing & Forestry | 435 (66.9%) | 215 (33.1%) |
| Construction & Extraction | 11,388 (95.8%) | 494 (4.2%) |
| Installation, Maintenance & Repair | 6,443 (98.2%) | 120 (1.8%) |
| Total (Category) | 18,266 (95.7%) | 829 (4.3%) |
| Total (Overall) | 137,850 (52.7%) | 123,832 (47.3%) |
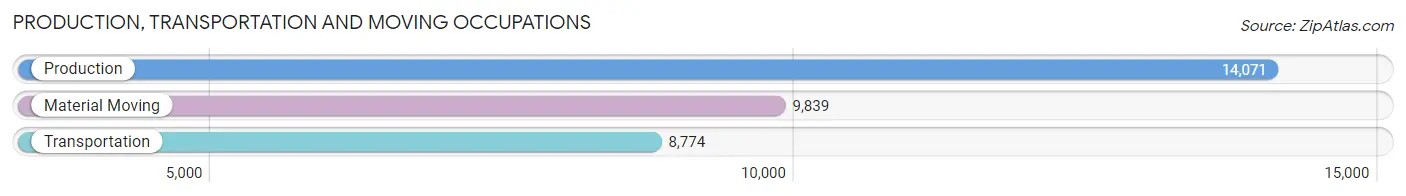
Production, Transportation and Moving Occupations
The most common Production, Transportation and Moving occupations in Polk County are Production (14,071 | 5.4%), Material Moving (9,839 | 3.8%), and Transportation (8,774 | 3.4%).
Production, Transportation and Moving Occupations by Sex
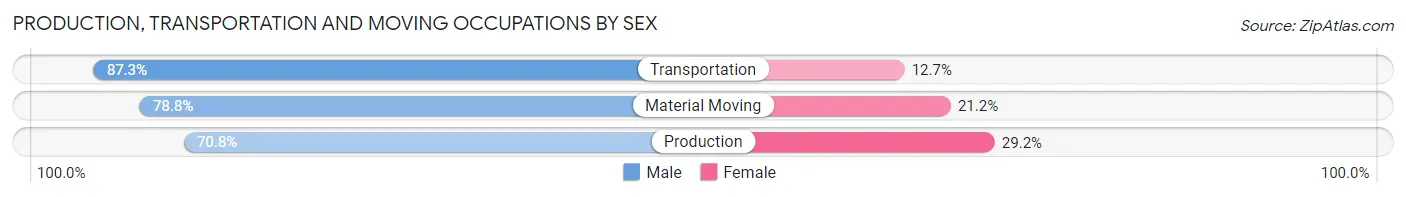
| Occupation | Male | Female |
| Production | 9,956 (70.8%) | 4,115 (29.2%) |
| Transportation | 7,660 (87.3%) | 1,114 (12.7%) |
| Material Moving | 7,755 (78.8%) | 2,084 (21.2%) |
| Total (Category) | 25,371 (77.6%) | 7,313 (22.4%) |
| Total (Overall) | 137,850 (52.7%) | 123,832 (47.3%) |
Employment Industries by Sex in Polk County
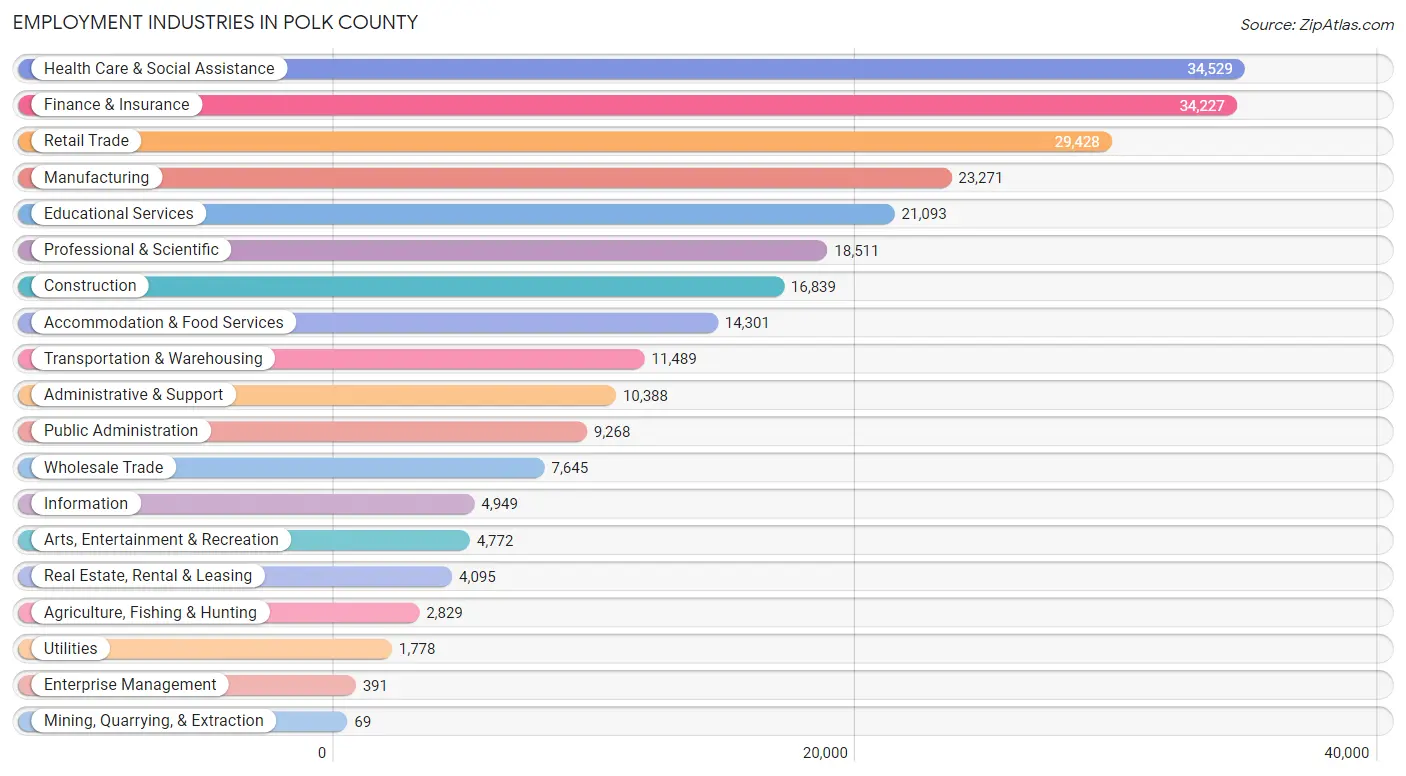
Employment Industries in Polk County
The major employment industries in Polk County include Health Care & Social Assistance (34,529 | 13.2%), Finance & Insurance (34,227 | 13.1%), Retail Trade (29,428 | 11.3%), Manufacturing (23,271 | 8.9%), and Educational Services (21,093 | 8.1%).
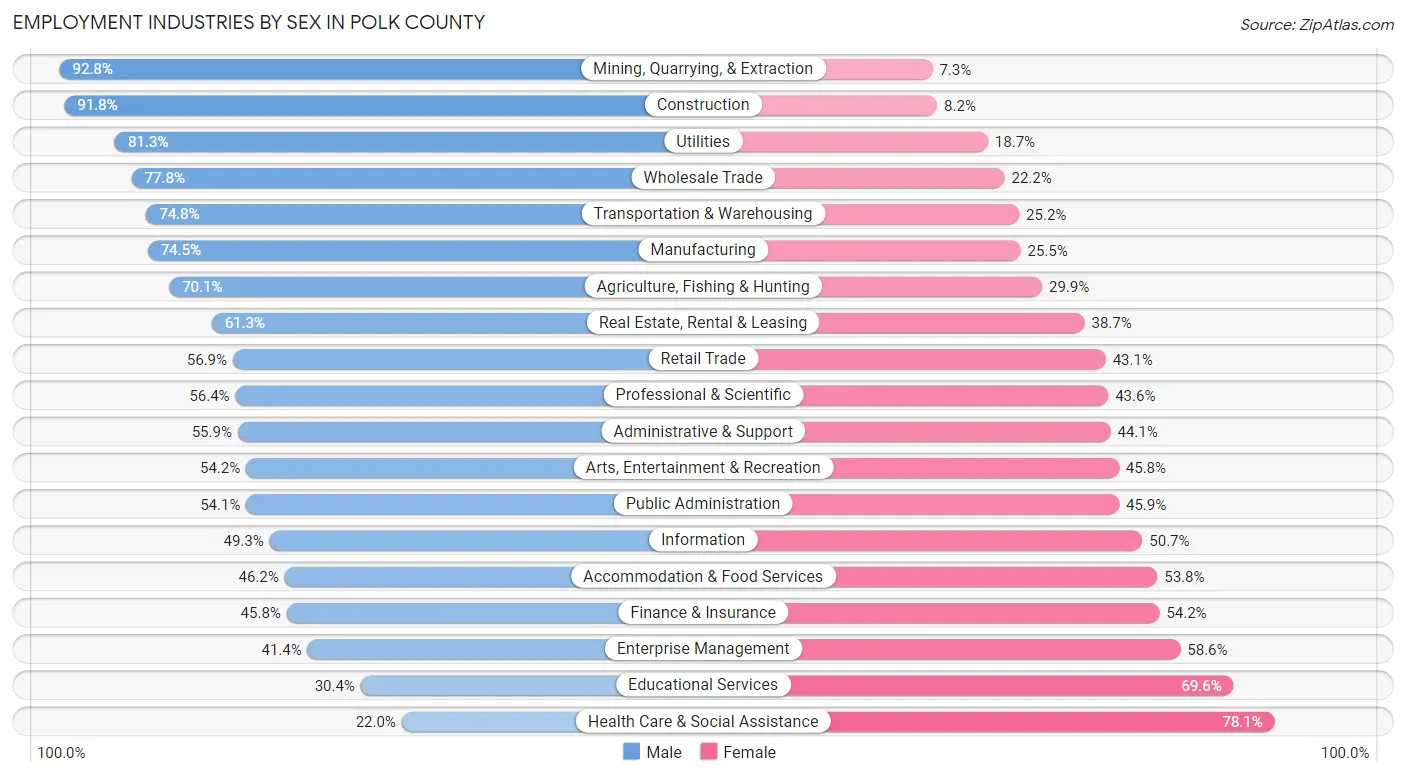
Employment Industries by Sex in Polk County
The Polk County industries that see more men than women are Mining, Quarrying, & Extraction (92.7%), Construction (91.8%), and Utilities (81.3%), whereas the industries that tend to have a higher number of women are Health Care & Social Assistance (78.0%), Educational Services (69.6%), and Enterprise Management (58.6%).
| Industry | Male | Female |
| Agriculture, Fishing & Hunting | 1,982 (70.1%) | 847 (29.9%) |
| Mining, Quarrying, & Extraction | 64 (92.7%) | 5 (7.2%) |
| Construction | 15,453 (91.8%) | 1,386 (8.2%) |
| Manufacturing | 17,340 (74.5%) | 5,931 (25.5%) |
| Wholesale Trade | 5,950 (77.8%) | 1,695 (22.2%) |
| Retail Trade | 16,743 (56.9%) | 12,685 (43.1%) |
| Transportation & Warehousing | 8,594 (74.8%) | 2,895 (25.2%) |
| Utilities | 1,445 (81.3%) | 333 (18.7%) |
| Information | 2,440 (49.3%) | 2,509 (50.7%) |
| Finance & Insurance | 15,662 (45.8%) | 18,565 (54.2%) |
| Real Estate, Rental & Leasing | 2,509 (61.3%) | 1,586 (38.7%) |
| Professional & Scientific | 10,432 (56.4%) | 8,079 (43.6%) |
| Enterprise Management | 162 (41.4%) | 229 (58.6%) |
| Administrative & Support | 5,806 (55.9%) | 4,582 (44.1%) |
| Educational Services | 6,419 (30.4%) | 14,674 (69.6%) |
| Health Care & Social Assistance | 7,578 (22.0%) | 26,951 (78.0%) |
| Arts, Entertainment & Recreation | 2,585 (54.2%) | 2,187 (45.8%) |
| Accommodation & Food Services | 6,607 (46.2%) | 7,694 (53.8%) |
| Public Administration | 5,016 (54.1%) | 4,252 (45.9%) |
| Total | 137,850 (52.7%) | 123,832 (47.3%) |
Education in Polk County
School Enrollment in Polk County
The most common levels of schooling among the 119,514 students in Polk County are high school (27,343 | 22.9%), elementary school (26,216 | 21.9%), and middle school (26,031 | 21.8%).
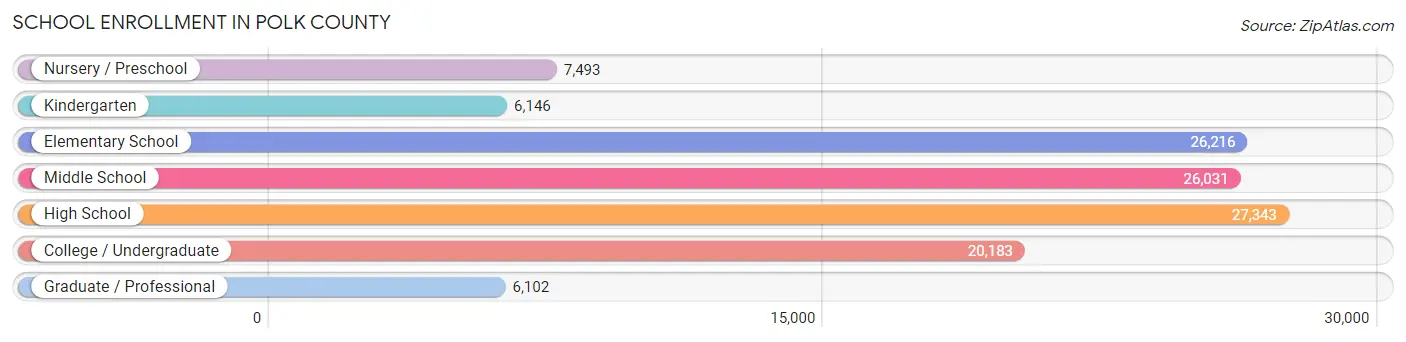
| School Level | # Students | % Students |
| Nursery / Preschool | 7,493 | 6.3% |
| Kindergarten | 6,146 | 5.1% |
| Elementary School | 26,216 | 21.9% |
| Middle School | 26,031 | 21.8% |
| High School | 27,343 | 22.9% |
| College / Undergraduate | 20,183 | 16.9% |
| Graduate / Professional | 6,102 | 5.1% |
| Total | 119,514 | 100.0% |
School Enrollment by Age by Funding Source in Polk County
Out of a total of 119,514 students who are enrolled in schools in Polk County, 19,959 (16.7%) attend a private institution, while the remaining 99,555 (83.3%) are enrolled in public schools. The age group of 20 to 24 year olds has the highest likelihood of being enrolled in private schools, with 3,976 (36.9% in the age bracket) enrolled. Conversely, the age group of 15 to 17 year olds has the lowest likelihood of being enrolled in a private school, with 18,040 (93.7% in the age bracket) attending a public institution.
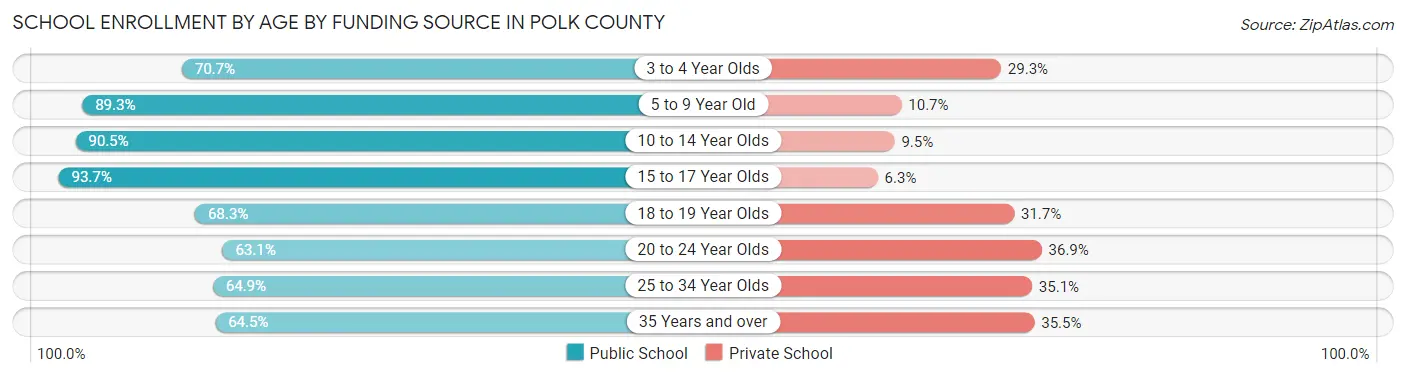
| Age Bracket | Public School | Private School |
| 3 to 4 Year Olds | 3,779 (70.7%) | 1,565 (29.3%) |
| 5 to 9 Year Old | 27,862 (89.3%) | 3,352 (10.7%) |
| 10 to 14 Year Olds | 29,749 (90.5%) | 3,110 (9.5%) |
| 15 to 17 Year Olds | 18,040 (93.7%) | 1,219 (6.3%) |
| 18 to 19 Year Olds | 5,621 (68.3%) | 2,614 (31.7%) |
| 20 to 24 Year Olds | 6,808 (63.1%) | 3,976 (36.9%) |
| 25 to 34 Year Olds | 4,546 (64.9%) | 2,454 (35.1%) |
| 35 Years and over | 3,108 (64.5%) | 1,711 (35.5%) |
| Total | 99,555 (83.3%) | 19,959 (16.7%) |
Educational Attainment by Field of Study in Polk County
Business (33,235 | 23.7%), education (18,145 | 12.9%), science & technology (11,908 | 8.5%), bio, nature & agricultural (10,510 | 7.5%), and social sciences (9,559 | 6.8%) are the most common fields of study among 140,294 individuals in Polk County who have obtained a bachelor's degree or higher.
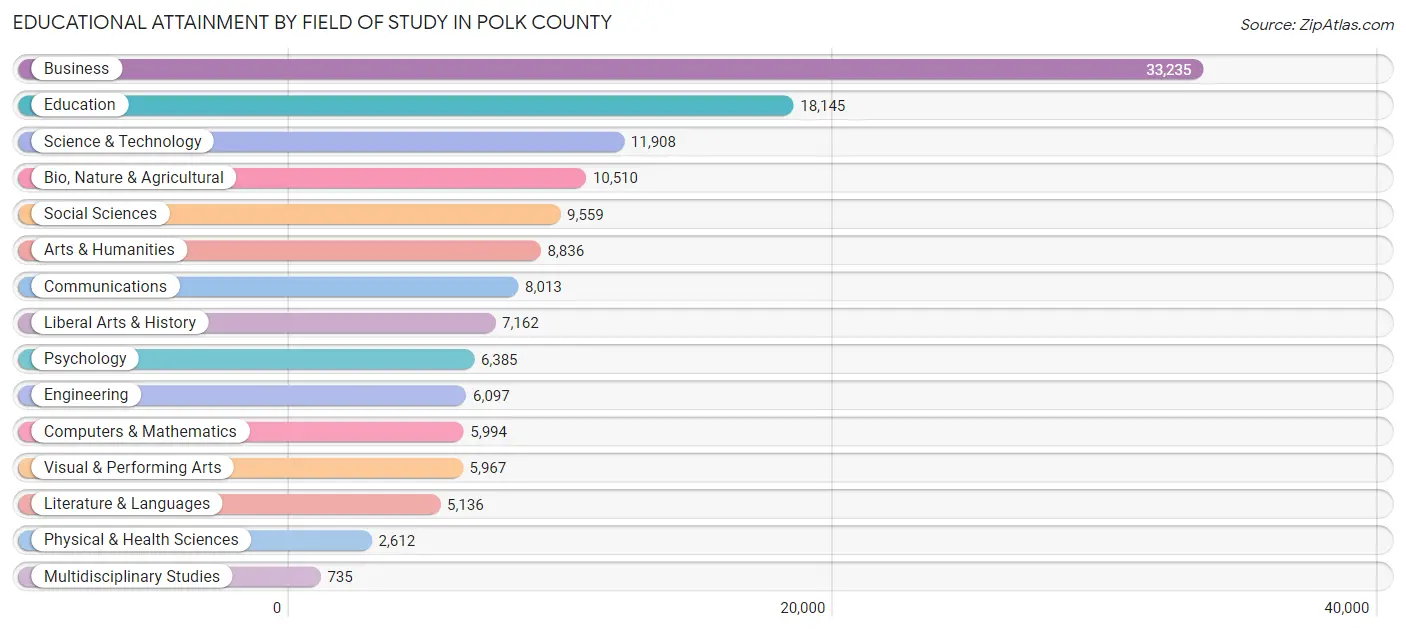
| Field of Study | # Graduates | % Graduates |
| Computers & Mathematics | 5,994 | 4.3% |
| Bio, Nature & Agricultural | 10,510 | 7.5% |
| Physical & Health Sciences | 2,612 | 1.9% |
| Psychology | 6,385 | 4.5% |
| Social Sciences | 9,559 | 6.8% |
| Engineering | 6,097 | 4.3% |
| Multidisciplinary Studies | 735 | 0.5% |
| Science & Technology | 11,908 | 8.5% |
| Business | 33,235 | 23.7% |
| Education | 18,145 | 12.9% |
| Literature & Languages | 5,136 | 3.7% |
| Liberal Arts & History | 7,162 | 5.1% |
| Visual & Performing Arts | 5,967 | 4.3% |
| Communications | 8,013 | 5.7% |
| Arts & Humanities | 8,836 | 6.3% |
| Total | 140,294 | 100.0% |
Transportation & Commute in Polk County
Vehicle Availability by Sex in Polk County
The most prevalent vehicle ownership categories in Polk County are males with 2 vehicles (63,509, accounting for 46.9%) and females with 2 vehicles (53,677, making up 52.8%).
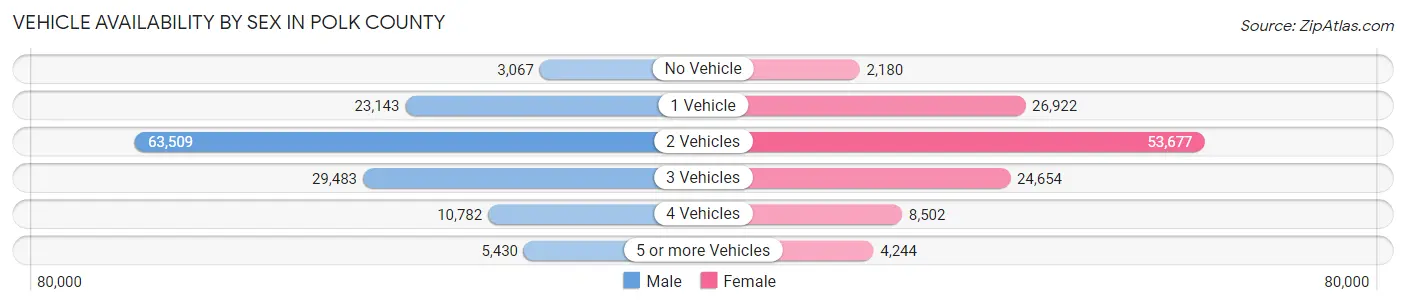
| Vehicles Available | Male | Female |
| No Vehicle | 3,067 (2.3%) | 2,180 (1.8%) |
| 1 Vehicle | 23,143 (17.1%) | 26,922 (22.4%) |
| 2 Vehicles | 63,509 (46.9%) | 53,677 (44.7%) |
| 3 Vehicles | 29,483 (21.8%) | 24,654 (20.5%) |
| 4 Vehicles | 10,782 (8.0%) | 8,502 (7.1%) |
| 5 or more Vehicles | 5,430 (4.0%) | 4,244 (3.5%) |
| Total | 135,414 (100.0%) | 120,179 (100.0%) |
Commute Time in Polk County
The most frequently occuring commute durations in Polk County are 15 to 19 minutes (48,048 commuters, 21.3%), 20 to 24 minutes (45,783 commuters, 20.3%), and 10 to 14 minutes (39,265 commuters, 17.4%).
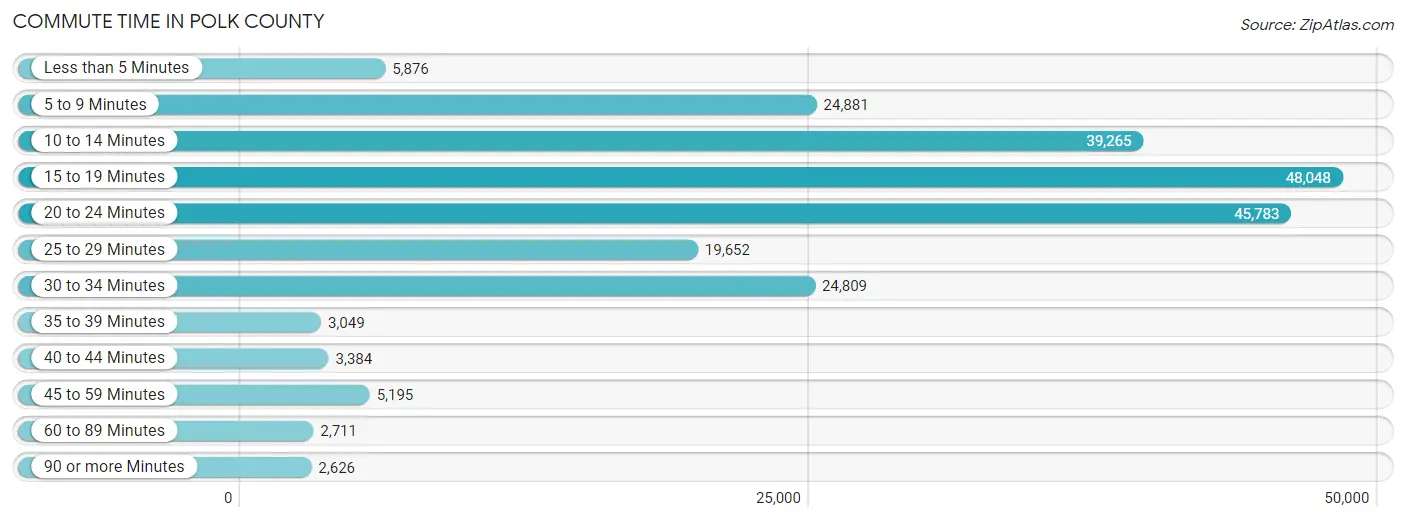
| Commute Time | # Commuters | % Commuters |
| Less than 5 Minutes | 5,876 | 2.6% |
| 5 to 9 Minutes | 24,881 | 11.0% |
| 10 to 14 Minutes | 39,265 | 17.4% |
| 15 to 19 Minutes | 48,048 | 21.3% |
| 20 to 24 Minutes | 45,783 | 20.3% |
| 25 to 29 Minutes | 19,652 | 8.7% |
| 30 to 34 Minutes | 24,809 | 11.0% |
| 35 to 39 Minutes | 3,049 | 1.3% |
| 40 to 44 Minutes | 3,384 | 1.5% |
| 45 to 59 Minutes | 5,195 | 2.3% |
| 60 to 89 Minutes | 2,711 | 1.2% |
| 90 or more Minutes | 2,626 | 1.2% |
Commute Time by Sex in Polk County
The most common commute times in Polk County are 20 to 24 minutes (25,496 commuters, 21.1%) for males and 15 to 19 minutes (22,694 commuters, 21.7%) for females.
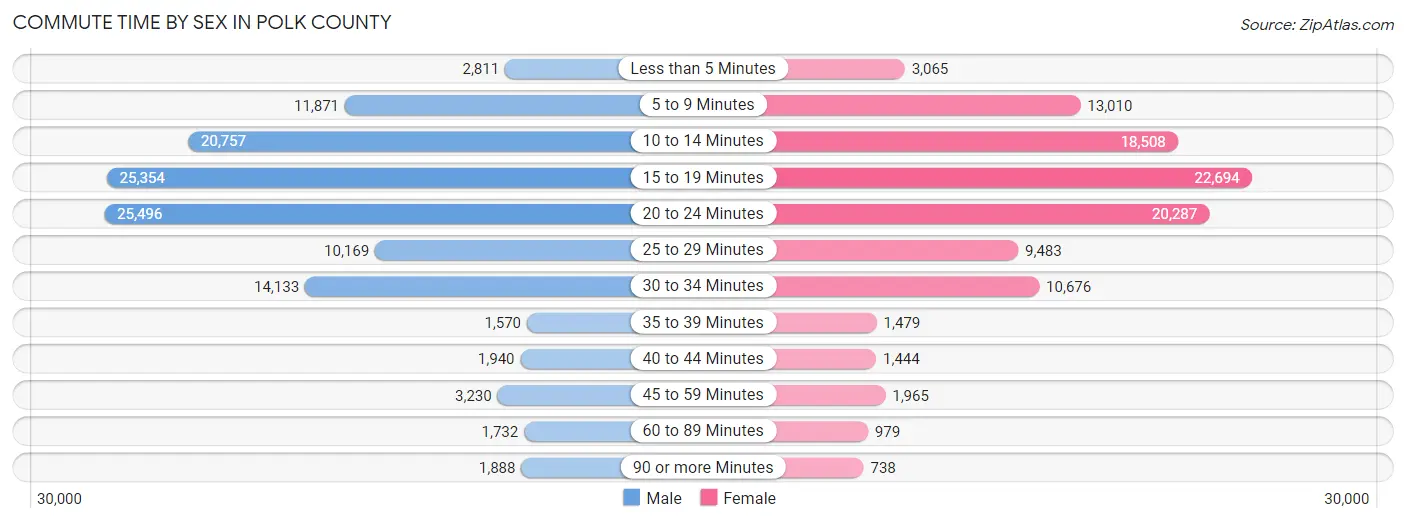
| Commute Time | Male | Female |
| Less than 5 Minutes | 2,811 (2.3%) | 3,065 (2.9%) |
| 5 to 9 Minutes | 11,871 (9.8%) | 13,010 (12.5%) |
| 10 to 14 Minutes | 20,757 (17.2%) | 18,508 (17.7%) |
| 15 to 19 Minutes | 25,354 (21.0%) | 22,694 (21.7%) |
| 20 to 24 Minutes | 25,496 (21.1%) | 20,287 (19.5%) |
| 25 to 29 Minutes | 10,169 (8.4%) | 9,483 (9.1%) |
| 30 to 34 Minutes | 14,133 (11.7%) | 10,676 (10.2%) |
| 35 to 39 Minutes | 1,570 (1.3%) | 1,479 (1.4%) |
| 40 to 44 Minutes | 1,940 (1.6%) | 1,444 (1.4%) |
| 45 to 59 Minutes | 3,230 (2.7%) | 1,965 (1.9%) |
| 60 to 89 Minutes | 1,732 (1.4%) | 979 (0.9%) |
| 90 or more Minutes | 1,888 (1.6%) | 738 (0.7%) |
Time of Departure to Work by Sex in Polk County
The most frequent times of departure to work in Polk County are 7:30 AM to 7:59 AM (18,309, 15.1%) for males and 7:30 AM to 7:59 AM (18,862, 18.1%) for females.
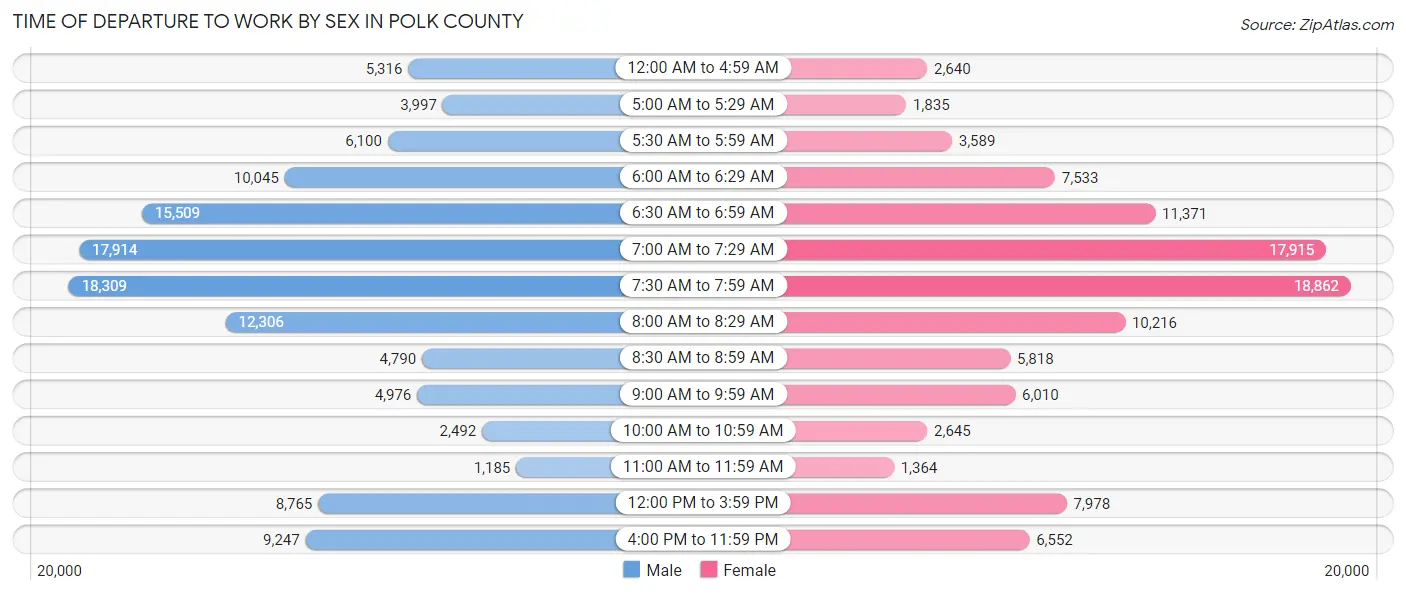
| Time of Departure | Male | Female |
| 12:00 AM to 4:59 AM | 5,316 (4.4%) | 2,640 (2.5%) |
| 5:00 AM to 5:29 AM | 3,997 (3.3%) | 1,835 (1.8%) |
| 5:30 AM to 5:59 AM | 6,100 (5.0%) | 3,589 (3.4%) |
| 6:00 AM to 6:29 AM | 10,045 (8.3%) | 7,533 (7.2%) |
| 6:30 AM to 6:59 AM | 15,509 (12.8%) | 11,371 (10.9%) |
| 7:00 AM to 7:29 AM | 17,914 (14.8%) | 17,915 (17.2%) |
| 7:30 AM to 7:59 AM | 18,309 (15.1%) | 18,862 (18.1%) |
| 8:00 AM to 8:29 AM | 12,306 (10.2%) | 10,216 (9.8%) |
| 8:30 AM to 8:59 AM | 4,790 (4.0%) | 5,818 (5.6%) |
| 9:00 AM to 9:59 AM | 4,976 (4.1%) | 6,010 (5.8%) |
| 10:00 AM to 10:59 AM | 2,492 (2.1%) | 2,645 (2.5%) |
| 11:00 AM to 11:59 AM | 1,185 (1.0%) | 1,364 (1.3%) |
| 12:00 PM to 3:59 PM | 8,765 (7.2%) | 7,978 (7.6%) |
| 4:00 PM to 11:59 PM | 9,247 (7.6%) | 6,552 (6.3%) |
| Total | 120,951 (100.0%) | 104,328 (100.0%) |
Housing Occupancy in Polk County
Occupancy by Ownership in Polk County
Of the total 199,013 dwellings in Polk County, owner-occupied units account for 133,444 (67.0%), while renter-occupied units make up 65,569 (33.0%).
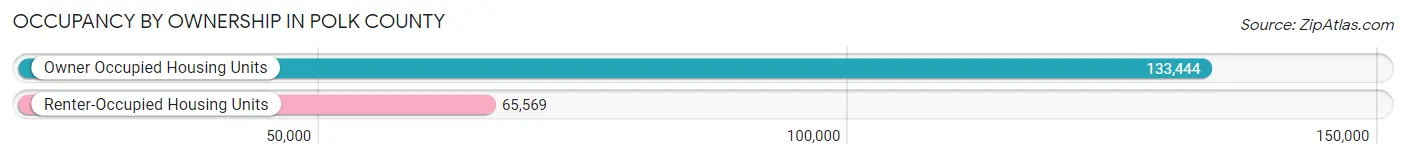
| Occupancy | # Housing Units | % Housing Units |
| Owner Occupied Housing Units | 133,444 | 67.0% |
| Renter-Occupied Housing Units | 65,569 | 33.0% |
| Total Occupied Housing Units | 199,013 | 100.0% |
Occupancy by Household Size in Polk County
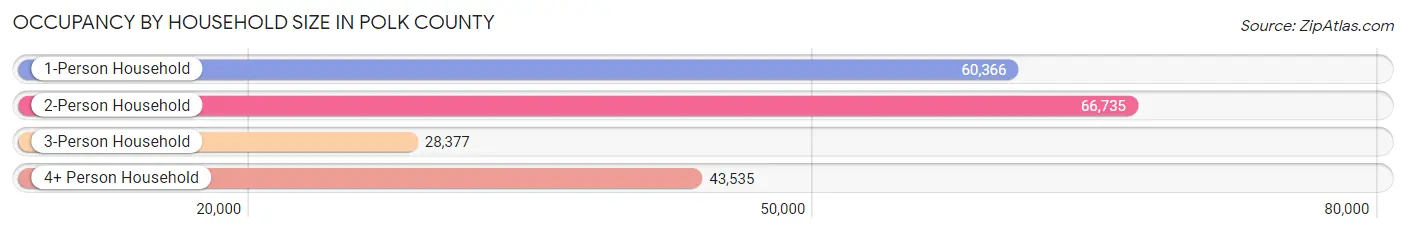
| Household Size | # Housing Units | % Housing Units |
| 1-Person Household | 60,366 | 30.3% |
| 2-Person Household | 66,735 | 33.5% |
| 3-Person Household | 28,377 | 14.3% |
| 4+ Person Household | 43,535 | 21.9% |
| Total Housing Units | 199,013 | 100.0% |
Occupancy by Ownership by Household Size in Polk County
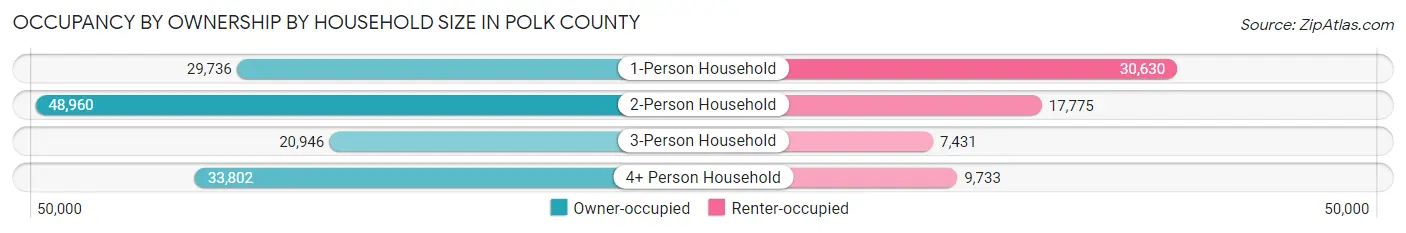
| Household Size | Owner-occupied | Renter-occupied |
| 1-Person Household | 29,736 (49.3%) | 30,630 (50.7%) |
| 2-Person Household | 48,960 (73.4%) | 17,775 (26.6%) |
| 3-Person Household | 20,946 (73.8%) | 7,431 (26.2%) |
| 4+ Person Household | 33,802 (77.6%) | 9,733 (22.4%) |
| Total Housing Units | 133,444 (67.0%) | 65,569 (33.0%) |
Occupancy by Educational Attainment in Polk County
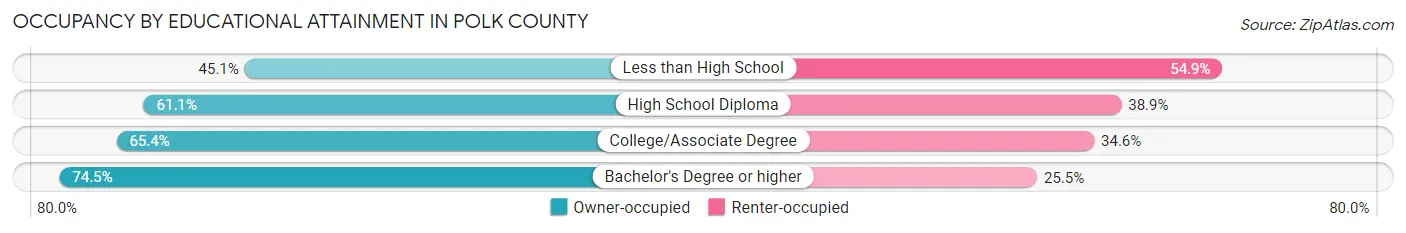
| Household Size | Owner-occupied | Renter-occupied |
| Less than High School | 5,426 (45.1%) | 6,606 (54.9%) |
| High School Diploma | 26,459 (61.1%) | 16,831 (38.9%) |
| College/Associate Degree | 39,472 (65.4%) | 20,854 (34.6%) |
| Bachelor's Degree or higher | 62,087 (74.5%) | 21,278 (25.5%) |
Occupancy by Age of Householder in Polk County
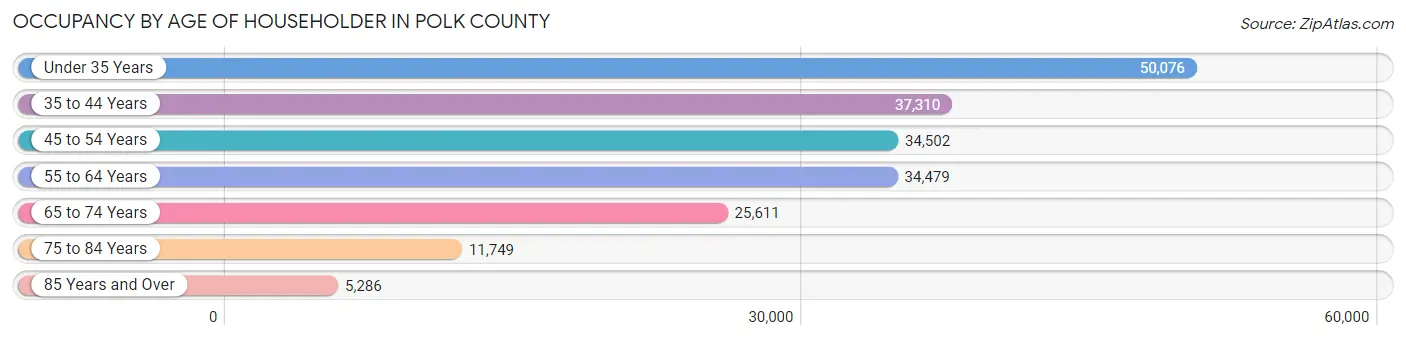
| Age Bracket | # Households | % Households |
| Under 35 Years | 50,076 | 25.2% |
| 35 to 44 Years | 37,310 | 18.8% |
| 45 to 54 Years | 34,502 | 17.3% |
| 55 to 64 Years | 34,479 | 17.3% |
| 65 to 74 Years | 25,611 | 12.9% |
| 75 to 84 Years | 11,749 | 5.9% |
| 85 Years and Over | 5,286 | 2.7% |
| Total | 199,013 | 100.0% |
Housing Finances in Polk County
Median Income by Occupancy in Polk County
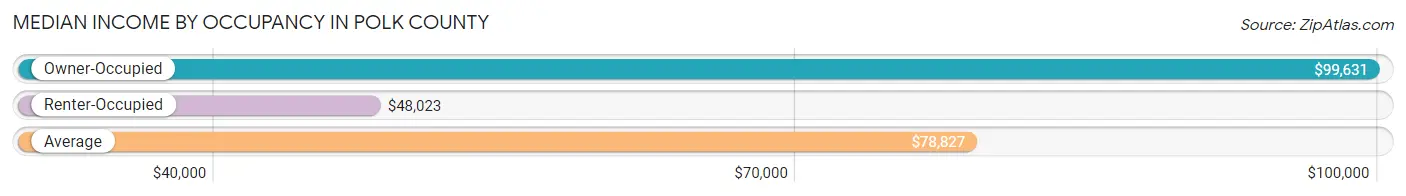
| Occupancy Type | # Households | Median Income |
| Owner-Occupied | 133,444 (67.0%) | $99,631 |
| Renter-Occupied | 65,569 (33.0%) | $48,023 |
| Average | 199,013 (100.0%) | $78,827 |
Occupancy by Householder Income Bracket in Polk County
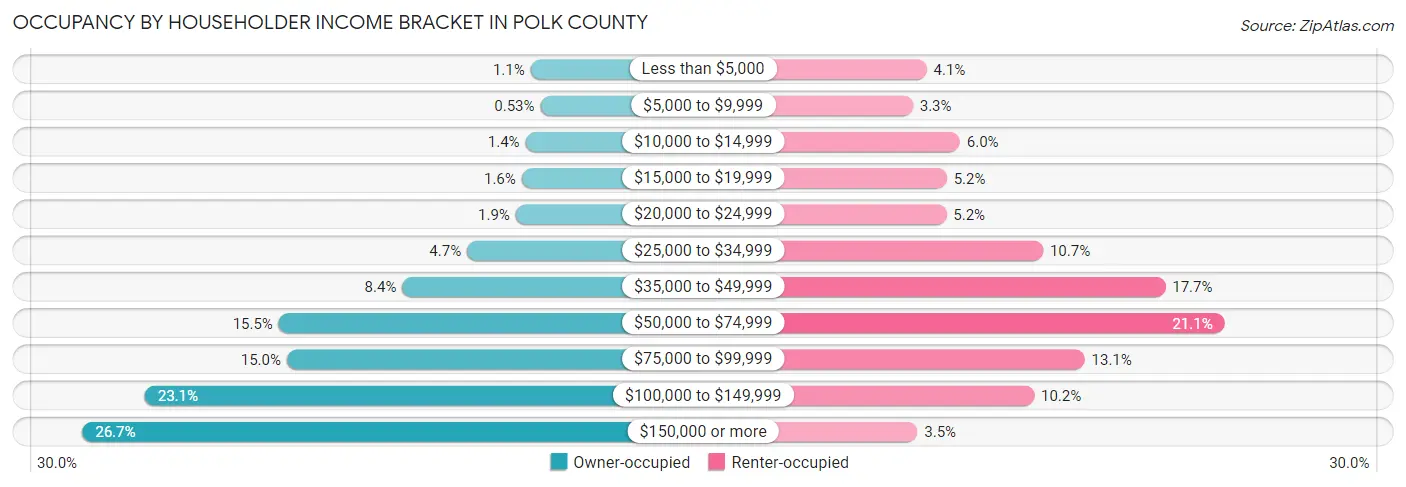
| Income Bracket | Owner-occupied | Renter-occupied |
| Less than $5,000 | 1,456 (1.1%) | 2,662 (4.1%) |
| $5,000 to $9,999 | 711 (0.5%) | 2,141 (3.3%) |
| $10,000 to $14,999 | 1,838 (1.4%) | 3,906 (6.0%) |
| $15,000 to $19,999 | 2,140 (1.6%) | 3,415 (5.2%) |
| $20,000 to $24,999 | 2,591 (1.9%) | 3,401 (5.2%) |
| $25,000 to $34,999 | 6,297 (4.7%) | 7,025 (10.7%) |
| $35,000 to $49,999 | 11,230 (8.4%) | 11,607 (17.7%) |
| $50,000 to $74,999 | 20,655 (15.5%) | 13,823 (21.1%) |
| $75,000 to $99,999 | 20,037 (15.0%) | 8,586 (13.1%) |
| $100,000 to $149,999 | 30,861 (23.1%) | 6,687 (10.2%) |
| $150,000 or more | 35,628 (26.7%) | 2,316 (3.5%) |
| Total | 133,444 (100.0%) | 65,569 (100.0%) |
Monthly Housing Cost Tiers in Polk County
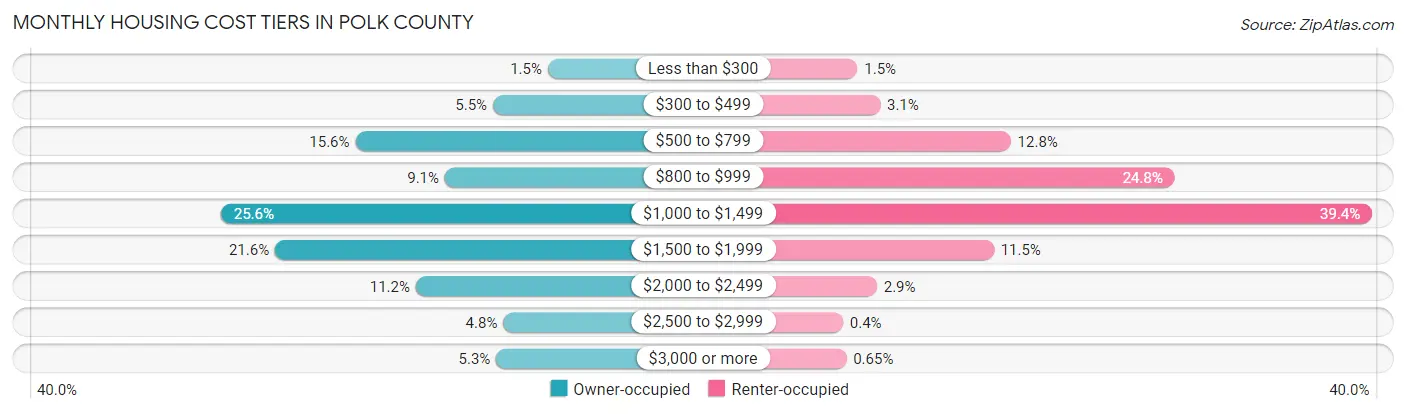
| Monthly Cost | Owner-occupied | Renter-occupied |
| Less than $300 | 1,955 (1.5%) | 962 (1.5%) |
| $300 to $499 | 7,358 (5.5%) | 2,057 (3.1%) |
| $500 to $799 | 20,864 (15.6%) | 8,369 (12.8%) |
| $800 to $999 | 12,081 (9.0%) | 16,285 (24.8%) |
| $1,000 to $1,499 | 34,100 (25.6%) | 25,816 (39.4%) |
| $1,500 to $1,999 | 28,776 (21.6%) | 7,549 (11.5%) |
| $2,000 to $2,499 | 14,931 (11.2%) | 1,904 (2.9%) |
| $2,500 to $2,999 | 6,343 (4.8%) | 259 (0.4%) |
| $3,000 or more | 7,036 (5.3%) | 424 (0.6%) |
| Total | 133,444 (100.0%) | 65,569 (100.0%) |
Physical Housing Characteristics in Polk County
Housing Structures in Polk County
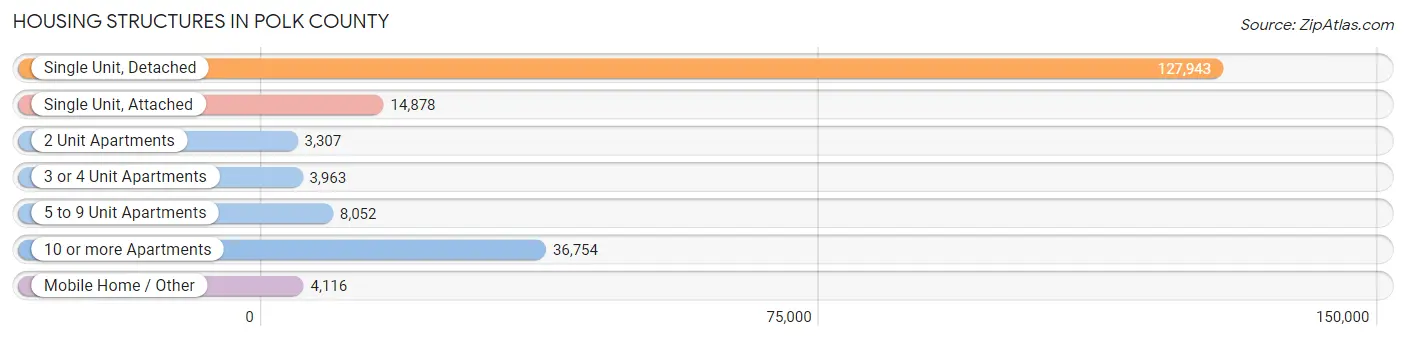
| Structure Type | # Housing Units | % Housing Units |
| Single Unit, Detached | 127,943 | 64.3% |
| Single Unit, Attached | 14,878 | 7.5% |
| 2 Unit Apartments | 3,307 | 1.7% |
| 3 or 4 Unit Apartments | 3,963 | 2.0% |
| 5 to 9 Unit Apartments | 8,052 | 4.1% |
| 10 or more Apartments | 36,754 | 18.5% |
| Mobile Home / Other | 4,116 | 2.1% |
| Total | 199,013 | 100.0% |
Housing Structures by Occupancy in Polk County
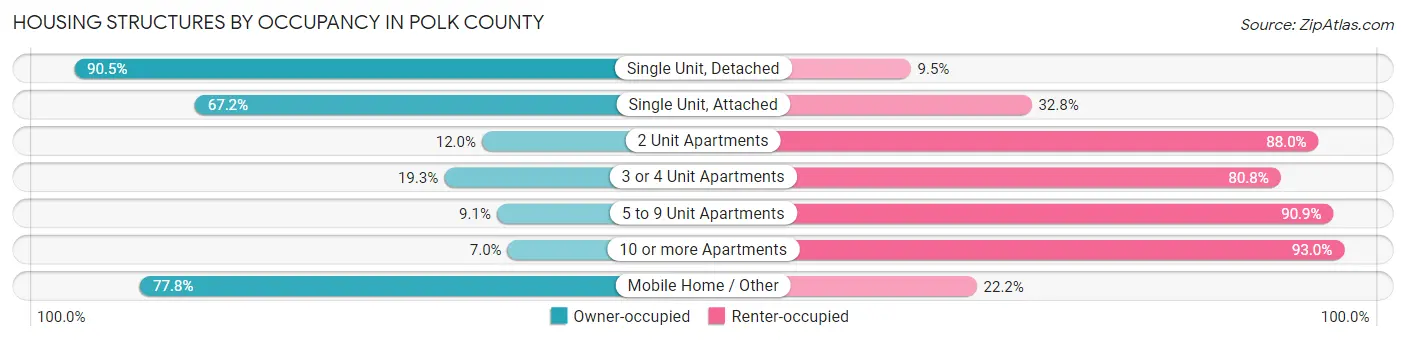
| Structure Type | Owner-occupied | Renter-occupied |
| Single Unit, Detached | 115,766 (90.5%) | 12,177 (9.5%) |
| Single Unit, Attached | 9,999 (67.2%) | 4,879 (32.8%) |
| 2 Unit Apartments | 396 (12.0%) | 2,911 (88.0%) |
| 3 or 4 Unit Apartments | 763 (19.3%) | 3,200 (80.7%) |
| 5 to 9 Unit Apartments | 733 (9.1%) | 7,319 (90.9%) |
| 10 or more Apartments | 2,586 (7.0%) | 34,168 (93.0%) |
| Mobile Home / Other | 3,201 (77.8%) | 915 (22.2%) |
| Total | 133,444 (67.0%) | 65,569 (33.0%) |
Housing Structures by Number of Rooms in Polk County
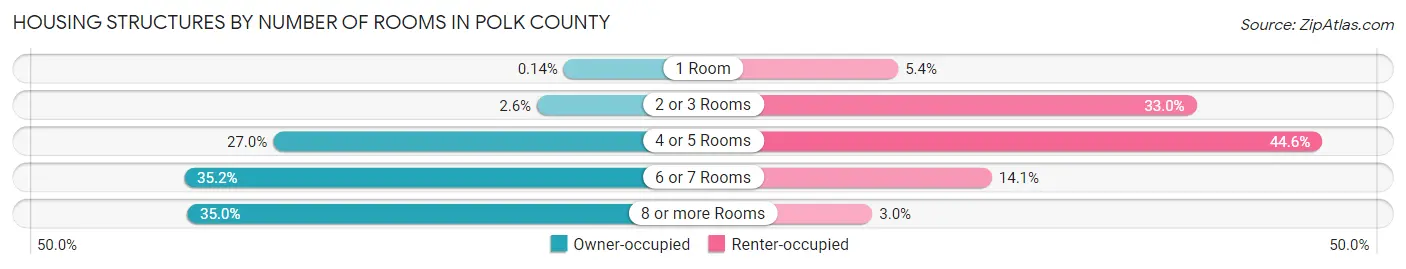
| Number of Rooms | Owner-occupied | Renter-occupied |
| 1 Room | 191 (0.1%) | 3,533 (5.4%) |
| 2 or 3 Rooms | 3,495 (2.6%) | 21,620 (33.0%) |
| 4 or 5 Rooms | 36,056 (27.0%) | 29,232 (44.6%) |
| 6 or 7 Rooms | 47,030 (35.2%) | 9,215 (14.1%) |
| 8 or more Rooms | 46,672 (35.0%) | 1,969 (3.0%) |
| Total | 133,444 (100.0%) | 65,569 (100.0%) |
Housing Structure by Heating Type in Polk County
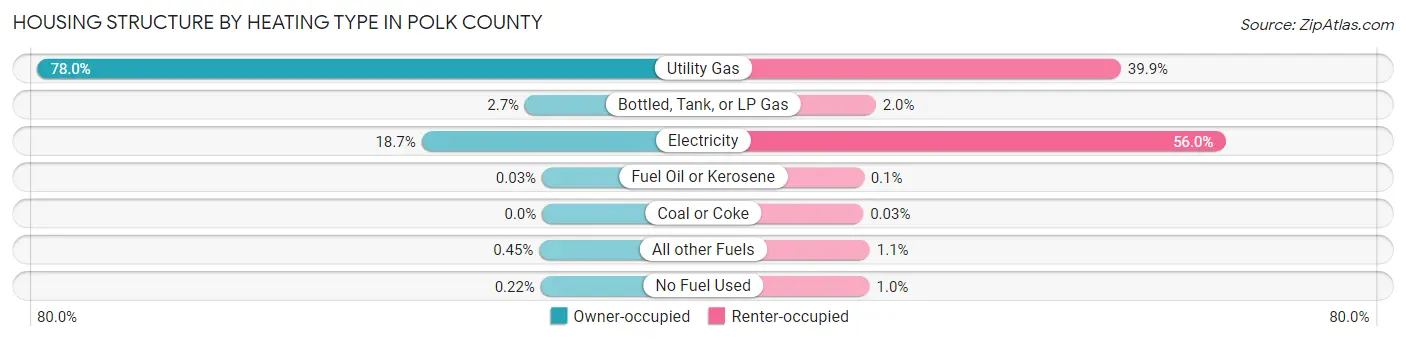
| Heating Type | Owner-occupied | Renter-occupied |
| Utility Gas | 104,095 (78.0%) | 26,134 (39.9%) |
| Bottled, Tank, or LP Gas | 3,534 (2.6%) | 1,290 (2.0%) |
| Electricity | 24,891 (18.6%) | 36,707 (56.0%) |
| Fuel Oil or Kerosene | 39 (0.0%) | 64 (0.1%) |
| Coal or Coke | 0 (0.0%) | 21 (0.0%) |
| All other Fuels | 595 (0.4%) | 689 (1.1%) |
| No Fuel Used | 290 (0.2%) | 664 (1.0%) |
| Total | 133,444 (100.0%) | 65,569 (100.0%) |
Household Vehicle Usage in Polk County
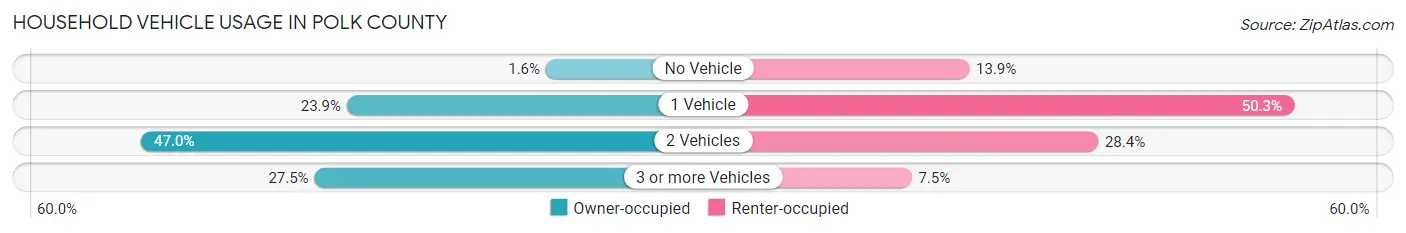
| Vehicles per Household | Owner-occupied | Renter-occupied |
| No Vehicle | 2,150 (1.6%) | 9,122 (13.9%) |
| 1 Vehicle | 31,904 (23.9%) | 32,969 (50.3%) |
| 2 Vehicles | 62,652 (46.9%) | 18,592 (28.3%) |
| 3 or more Vehicles | 36,738 (27.5%) | 4,886 (7.4%) |
| Total | 133,444 (100.0%) | 65,569 (100.0%) |
Real Estate & Mortgages in Polk County
Real Estate and Mortgage Overview in Polk County
| Characteristic | Without Mortgage | With Mortgage |
| Housing Units | 39,610 | 93,834 |
| Median Property Value | $214,600 | $238,600 |
| Median Household Income | $73,424 | $28,333 |
| Monthly Housing Costs | $676 | $6,908 |
| Real Estate Taxes | $3,925 | $2,150 |
Property Value by Mortgage Status in Polk County
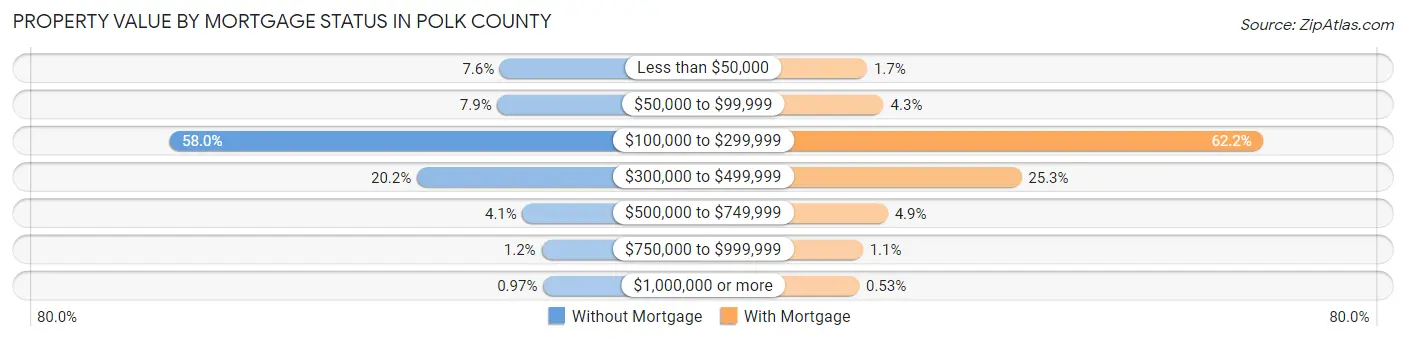
| Property Value | Without Mortgage | With Mortgage |
| Less than $50,000 | 2,992 (7.5%) | 1,635 (1.7%) |
| $50,000 to $99,999 | 3,144 (7.9%) | 4,016 (4.3%) |
| $100,000 to $299,999 | 22,970 (58.0%) | 58,355 (62.2%) |
| $300,000 to $499,999 | 8,001 (20.2%) | 23,711 (25.3%) |
| $500,000 to $749,999 | 1,626 (4.1%) | 4,602 (4.9%) |
| $750,000 to $999,999 | 491 (1.2%) | 1,019 (1.1%) |
| $1,000,000 or more | 386 (1.0%) | 496 (0.5%) |
| Total | 39,610 (100.0%) | 93,834 (100.0%) |
Household Income by Mortgage Status in Polk County
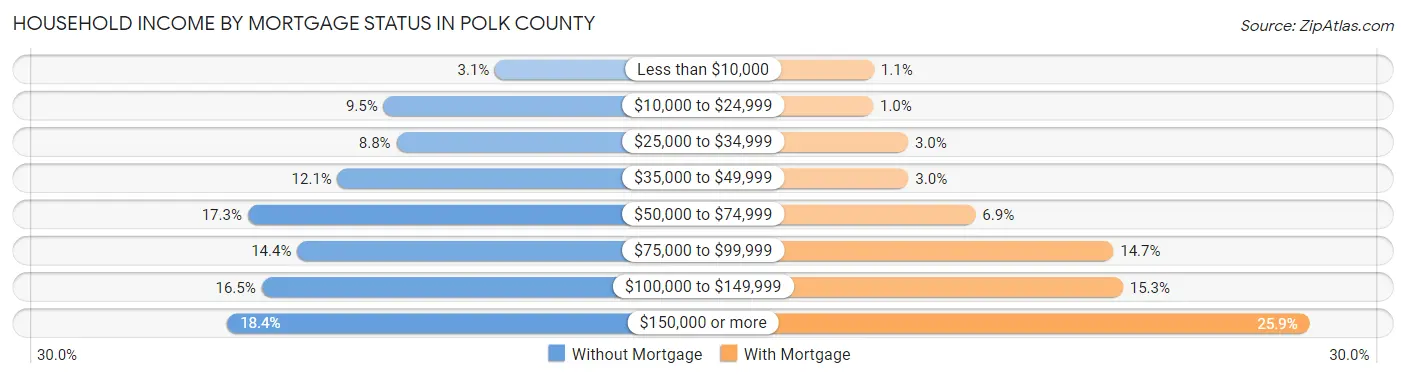
| Household Income | Without Mortgage | With Mortgage |
| Less than $10,000 | 1,231 (3.1%) | 986 (1.1%) |
| $10,000 to $24,999 | 3,758 (9.5%) | 936 (1.0%) |
| $25,000 to $34,999 | 3,464 (8.7%) | 2,811 (3.0%) |
| $35,000 to $49,999 | 4,798 (12.1%) | 2,833 (3.0%) |
| $50,000 to $74,999 | 6,832 (17.2%) | 6,432 (6.9%) |
| $75,000 to $99,999 | 5,713 (14.4%) | 13,823 (14.7%) |
| $100,000 to $149,999 | 6,519 (16.5%) | 14,324 (15.3%) |
| $150,000 or more | 7,295 (18.4%) | 24,342 (25.9%) |
| Total | 39,610 (100.0%) | 93,834 (100.0%) |
Property Value to Household Income Ratio in Polk County
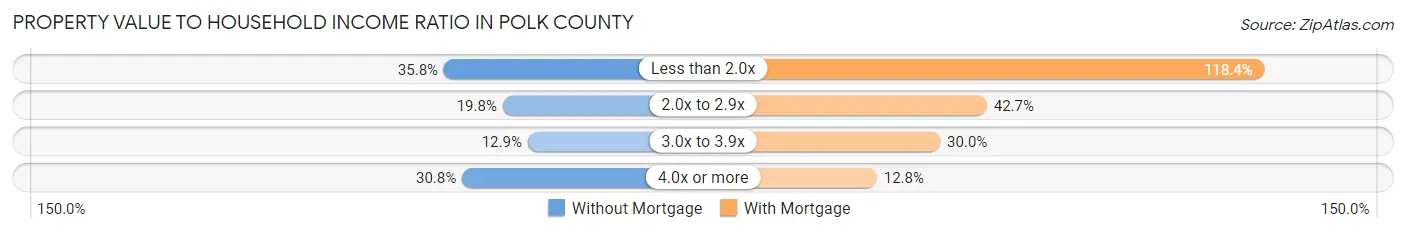
| Value-to-Income Ratio | Without Mortgage | With Mortgage |
| Less than 2.0x | 14,172 (35.8%) | 111,116 (118.4%) |
| 2.0x to 2.9x | 7,822 (19.8%) | 40,105 (42.7%) |
| 3.0x to 3.9x | 5,122 (12.9%) | 28,177 (30.0%) |
| 4.0x or more | 12,216 (30.8%) | 11,995 (12.8%) |
| Total | 39,610 (100.0%) | 93,834 (100.0%) |
Real Estate Taxes by Mortgage Status in Polk County
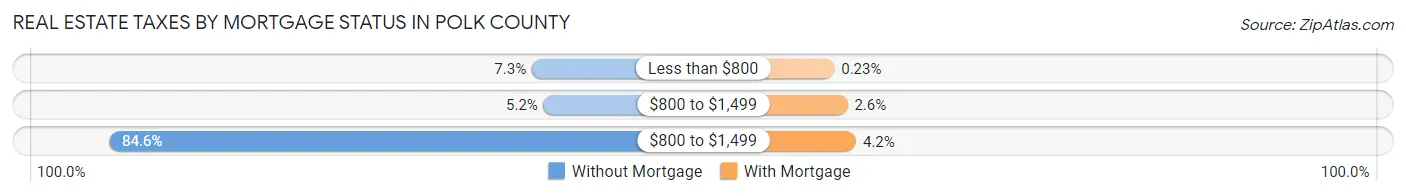
| Property Taxes | Without Mortgage | With Mortgage |
| Less than $800 | 2,903 (7.3%) | 218 (0.2%) |
| $800 to $1,499 | 2,055 (5.2%) | 2,469 (2.6%) |
| $800 to $1,499 | 33,493 (84.6%) | 3,939 (4.2%) |
| Total | 39,610 (100.0%) | 93,834 (100.0%) |
Health & Disability in Polk County
Health Insurance Coverage by Age in Polk County
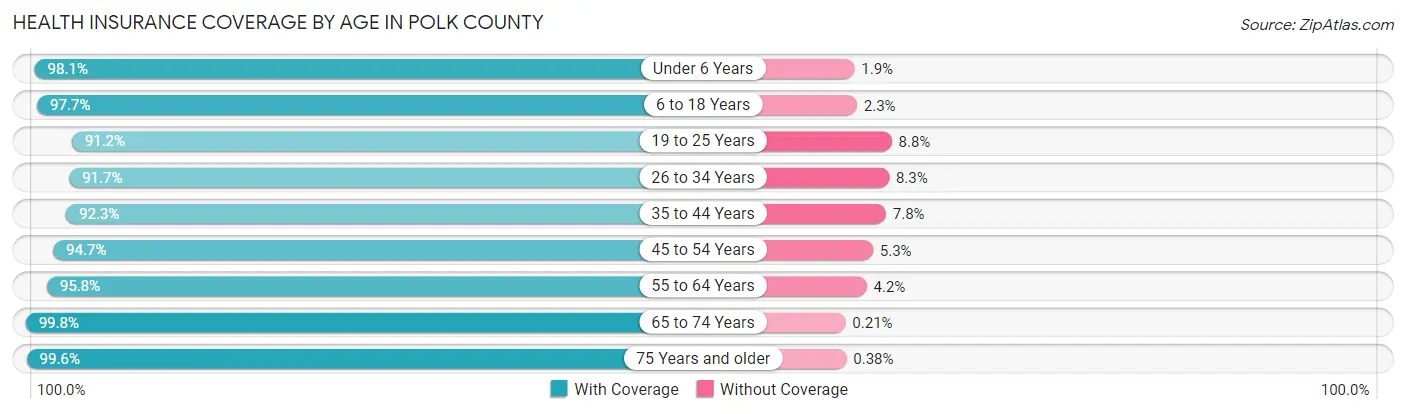
| Age Bracket | With Coverage | Without Coverage |
| Under 6 Years | 38,780 (98.1%) | 742 (1.9%) |
| 6 to 18 Years | 85,297 (97.7%) | 2,041 (2.3%) |
| 19 to 25 Years | 40,558 (91.2%) | 3,921 (8.8%) |
| 26 to 34 Years | 61,192 (91.7%) | 5,563 (8.3%) |
| 35 to 44 Years | 62,997 (92.2%) | 5,294 (7.7%) |
| 45 to 54 Years | 56,179 (94.7%) | 3,160 (5.3%) |
| 55 to 64 Years | 55,032 (95.8%) | 2,389 (4.2%) |
| 65 to 74 Years | 40,246 (99.8%) | 85 (0.2%) |
| 75 Years and older | 24,230 (99.6%) | 92 (0.4%) |
| Total | 464,511 (95.2%) | 23,287 (4.8%) |
Health Insurance Coverage by Citizenship Status in Polk County
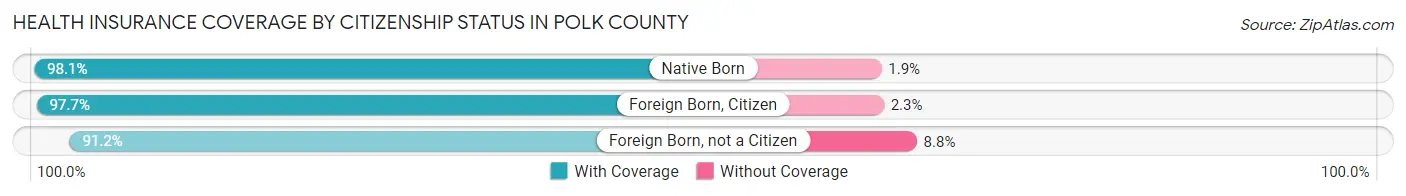
| Citizenship Status | With Coverage | Without Coverage |
| Native Born | 38,780 (98.1%) | 742 (1.9%) |
| Foreign Born, Citizen | 85,297 (97.7%) | 2,041 (2.3%) |
| Foreign Born, not a Citizen | 40,558 (91.2%) | 3,921 (8.8%) |
Health Insurance Coverage by Household Income in Polk County
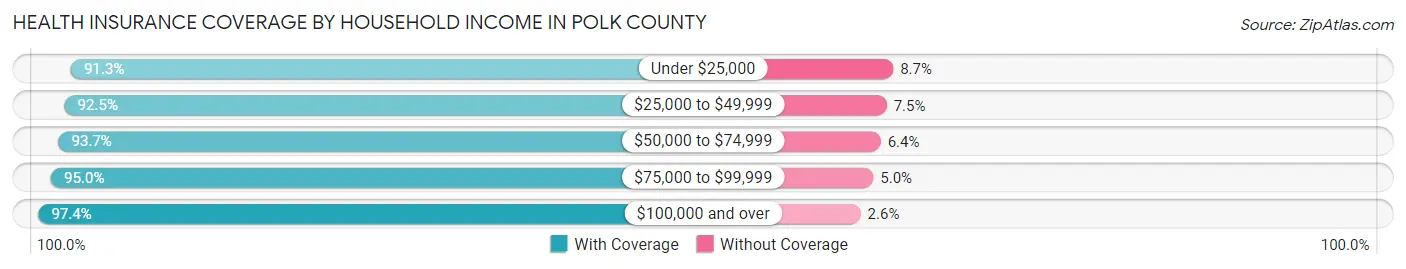
| Household Income | With Coverage | Without Coverage |
| Under $25,000 | 37,939 (91.3%) | 3,614 (8.7%) |
| $25,000 to $49,999 | 64,752 (92.5%) | 5,237 (7.5%) |
| $50,000 to $74,999 | 71,258 (93.6%) | 4,834 (6.4%) |
| $75,000 to $99,999 | 68,983 (95.0%) | 3,608 (5.0%) |
| $100,000 and over | 217,475 (97.4%) | 5,799 (2.6%) |
Public vs Private Health Insurance Coverage by Age in Polk County
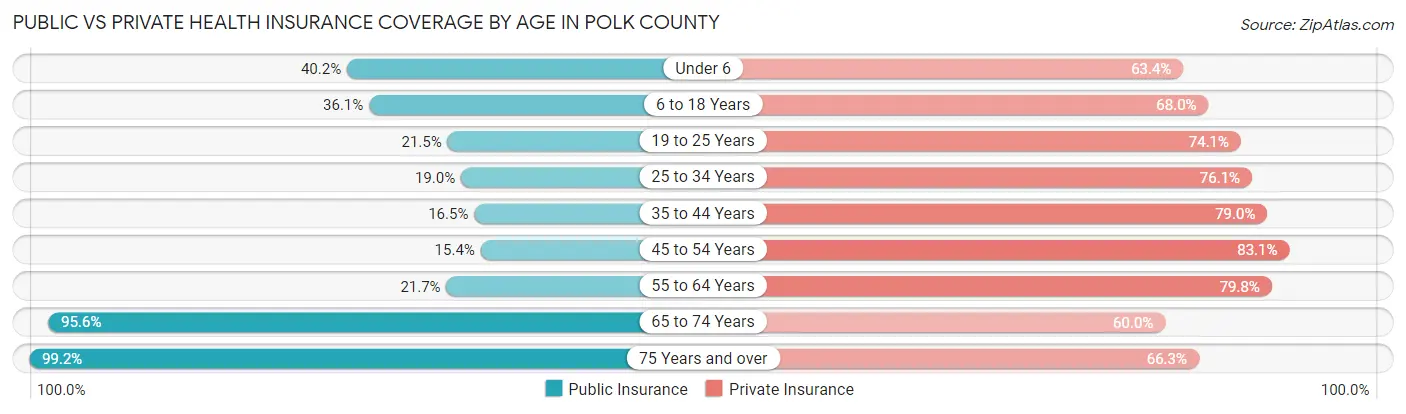
| Age Bracket | Public Insurance | Private Insurance |
| Under 6 | 15,871 (40.2%) | 25,043 (63.4%) |
| 6 to 18 Years | 31,484 (36.0%) | 59,421 (68.0%) |
| 19 to 25 Years | 9,559 (21.5%) | 32,946 (74.1%) |
| 25 to 34 Years | 12,681 (19.0%) | 50,815 (76.1%) |
| 35 to 44 Years | 11,298 (16.5%) | 53,925 (79.0%) |
| 45 to 54 Years | 9,111 (15.3%) | 49,286 (83.1%) |
| 55 to 64 Years | 12,461 (21.7%) | 45,818 (79.8%) |
| 65 to 74 Years | 38,574 (95.6%) | 24,202 (60.0%) |
| 75 Years and over | 24,125 (99.2%) | 16,115 (66.3%) |
| Total | 165,164 (33.9%) | 357,571 (73.3%) |
Disability Status by Sex by Age in Polk County
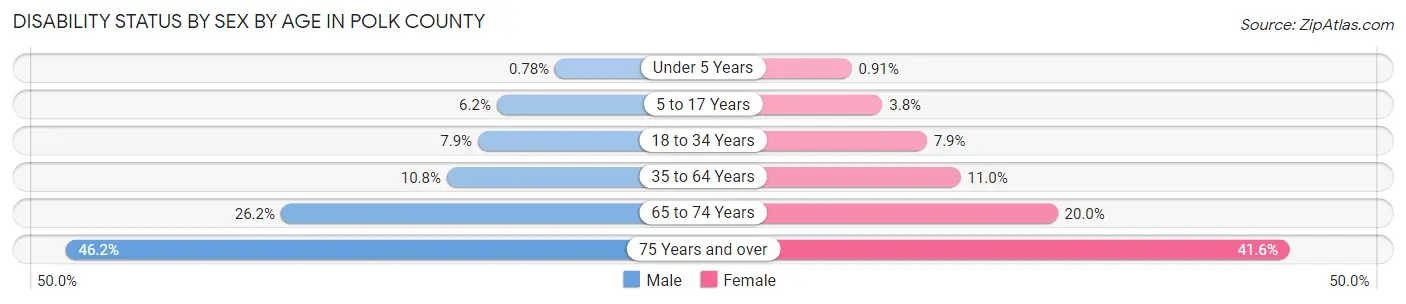
| Age Bracket | Male | Female |
| Under 5 Years | 130 (0.8%) | 148 (0.9%) |
| 5 to 17 Years | 2,750 (6.2%) | 1,617 (3.8%) |
| 18 to 34 Years | 4,698 (7.9%) | 4,607 (7.9%) |
| 35 to 64 Years | 10,080 (10.8%) | 10,129 (11.0%) |
| 65 to 74 Years | 4,968 (26.2%) | 4,283 (20.0%) |
| 75 Years and over | 4,512 (46.2%) | 6,051 (41.6%) |
Disability Class by Sex by Age in Polk County
Disability Class: Hearing Difficulty
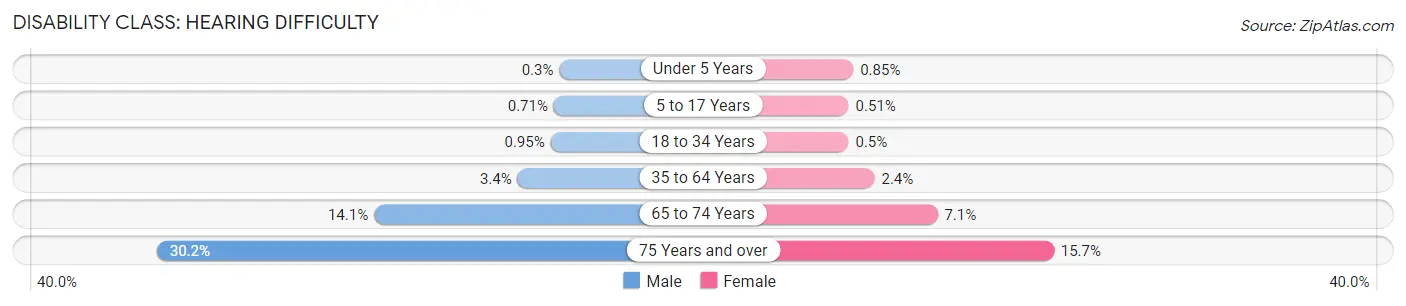
| Age Bracket | Male | Female |
| Under 5 Years | 50 (0.3%) | 137 (0.9%) |
| 5 to 17 Years | 314 (0.7%) | 220 (0.5%) |
| 18 to 34 Years | 561 (0.9%) | 294 (0.5%) |
| 35 to 64 Years | 3,170 (3.4%) | 2,237 (2.4%) |
| 65 to 74 Years | 2,664 (14.1%) | 1,518 (7.1%) |
| 75 Years and over | 2,948 (30.2%) | 2,291 (15.7%) |
Disability Class: Vision Difficulty
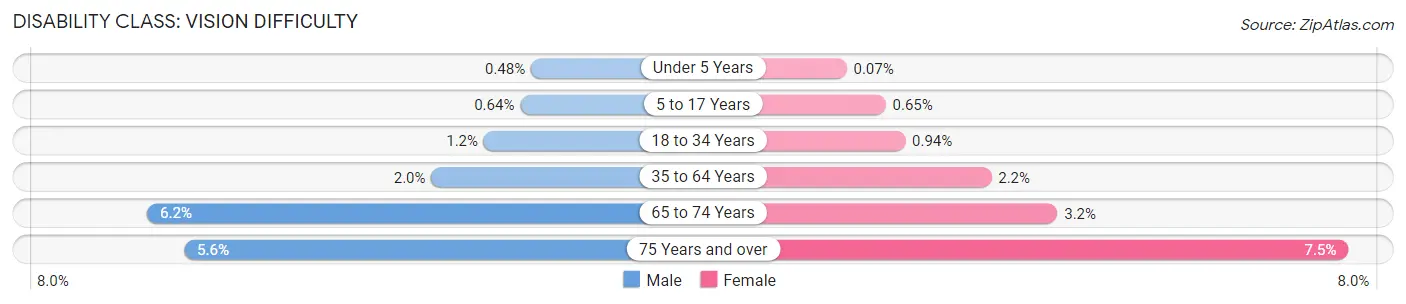
| Age Bracket | Male | Female |
| Under 5 Years | 80 (0.5%) | 11 (0.1%) |
| 5 to 17 Years | 287 (0.6%) | 279 (0.6%) |
| 18 to 34 Years | 698 (1.2%) | 549 (0.9%) |
| 35 to 64 Years | 1,827 (2.0%) | 2,042 (2.2%) |
| 65 to 74 Years | 1,170 (6.2%) | 684 (3.2%) |
| 75 Years and over | 550 (5.6%) | 1,094 (7.5%) |
Disability Class: Cognitive Difficulty
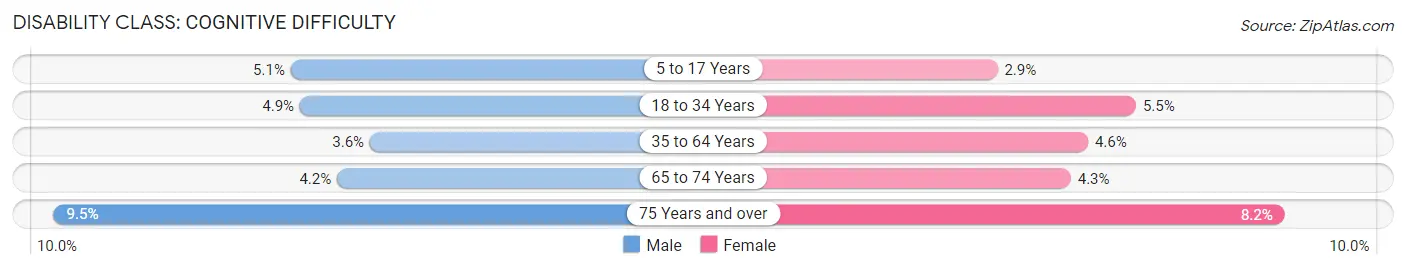
| Age Bracket | Male | Female |
| 5 to 17 Years | 2,254 (5.1%) | 1,245 (2.9%) |
| 18 to 34 Years | 2,897 (4.9%) | 3,187 (5.5%) |
| 35 to 64 Years | 3,346 (3.6%) | 4,197 (4.6%) |
| 65 to 74 Years | 795 (4.2%) | 909 (4.3%) |
| 75 Years and over | 924 (9.5%) | 1,197 (8.2%) |
Disability Class: Ambulatory Difficulty
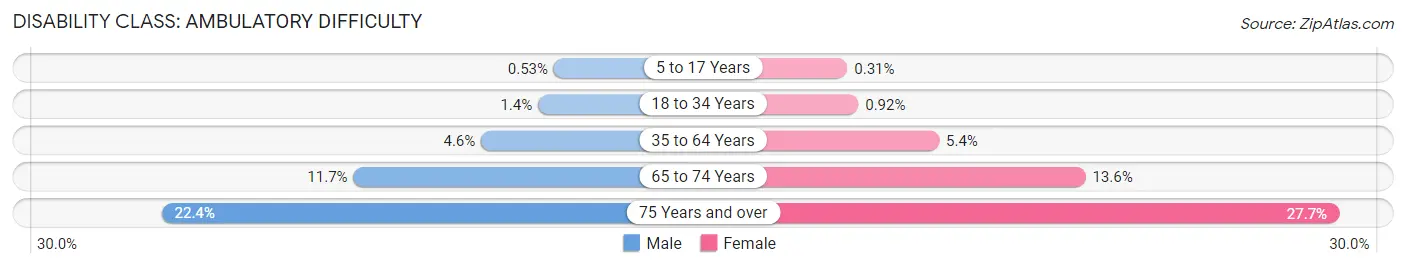
| Age Bracket | Male | Female |
| 5 to 17 Years | 238 (0.5%) | 132 (0.3%) |
| 18 to 34 Years | 837 (1.4%) | 538 (0.9%) |
| 35 to 64 Years | 4,266 (4.6%) | 4,981 (5.4%) |
| 65 to 74 Years | 2,215 (11.7%) | 2,902 (13.6%) |
| 75 Years and over | 2,185 (22.4%) | 4,029 (27.7%) |
Disability Class: Self-Care Difficulty
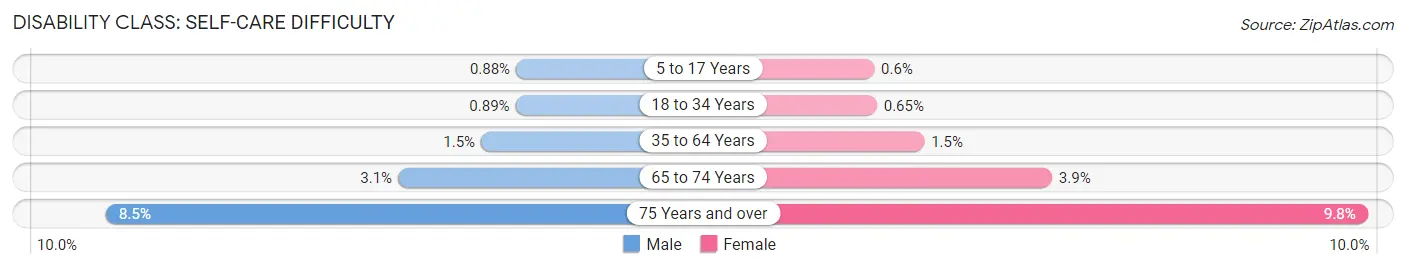
| Age Bracket | Male | Female |
| 5 to 17 Years | 393 (0.9%) | 258 (0.6%) |
| 18 to 34 Years | 530 (0.9%) | 382 (0.6%) |
| 35 to 64 Years | 1,428 (1.5%) | 1,402 (1.5%) |
| 65 to 74 Years | 581 (3.1%) | 835 (3.9%) |
| 75 Years and over | 829 (8.5%) | 1,420 (9.8%) |
Technology Access in Polk County
Computing Device Access in Polk County
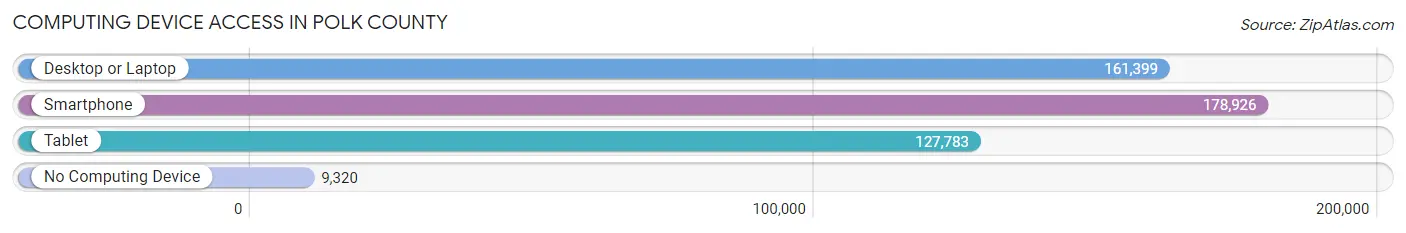
| Device Type | # Households | % Households |
| Desktop or Laptop | 161,399 | 81.1% |
| Smartphone | 178,926 | 89.9% |
| Tablet | 127,783 | 64.2% |
| No Computing Device | 9,320 | 4.7% |
| Total | 199,013 | 100.0% |
Internet Access in Polk County
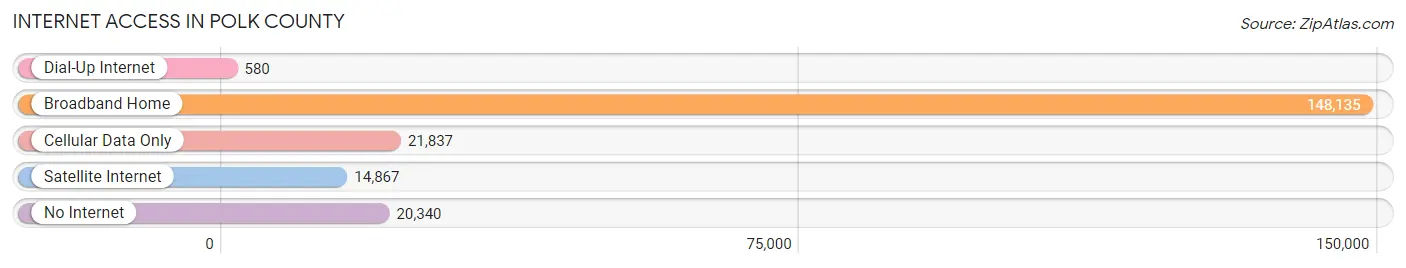
| Internet Type | # Households | % Households |
| Dial-Up Internet | 580 | 0.3% |
| Broadband Home | 148,135 | 74.4% |
| Cellular Data Only | 21,837 | 11.0% |
| Satellite Internet | 14,867 | 7.5% |
| No Internet | 20,340 | 10.2% |
| Total | 199,013 | 100.0% |
Polk County Summary
Polk County, Iowa is located in the central part of the state and is the most populous county in the state. It is bordered by Dallas, Warren, Madison, Jasper, Story, Boone, and Guthrie counties. The county seat is Des Moines, the state capital.
History
Polk County was established in 1846 and named after James K. Polk, the 11th President of the United States. The county was originally part of the Iowa Territory, which was established in 1838. The county was originally populated by Native American tribes, including the Sauk, Fox, and Ioway.
The first settlers in the county were mostly from the eastern United States, and they began arriving in the 1840s. The first county seat was established in Fort Des Moines, which was located near the Des Moines River. The county seat was moved to Des Moines in 1857.
The county experienced rapid growth in the late 19th and early 20th centuries, due to the arrival of immigrants from Europe and the growth of the railroad industry. The population of the county increased from just over 10,000 in 1880 to over 200,000 by 1920.
Geography
Polk County covers an area of 577 square miles and is located in the central part of the state. The county is bordered by Dallas, Warren, Madison, Jasper, Story, Boone, and Guthrie counties. The Des Moines River runs through the county, and the Raccoon River forms part of the county’s eastern border.
The county is mostly flat, with some rolling hills in the northern and western parts of the county. The highest point in the county is located in the northwest corner, at an elevation of 1,068 feet. The county is located in the Central Corn Belt Plains ecoregion, which is characterized by flat to gently rolling terrain and fertile soils.
Economy
The economy of Polk County is largely based on agriculture, manufacturing, and services. The county is home to several large agricultural companies, including Pioneer Hi-Bred International, DuPont Pioneer, and Monsanto. The county is also home to several large manufacturing companies, including John Deere, Rockwell Collins, and 3M.
The county is also home to several large service companies, including Wells Fargo, Principal Financial Group, and UnityPoint Health. The county is also home to several large retail companies, including Hy-Vee, Target, and Walmart.
Demographics
As of the 2010 census, the population of Polk County was 431,670, making it the most populous county in the state. The population is estimated to be 447,743 as of 2019. The population is fairly evenly split between men and women, with 50.3% of the population being male and 49.7% being female.
The median age of the population is 35.7 years, and the median household income is $60,945. The largest racial group in the county is white, making up 79.2% of the population. Other racial groups include African American (10.3%), Asian (4.7%), and Hispanic or Latino (4.2%).
The county is home to several large universities, including Drake University, Des Moines University, and Grand View University. The county is also home to several large hospitals, including MercyOne Des Moines Medical Center, Iowa Methodist Medical Center, and Blank Children’s Hospital.
Common Questions
What is Per Capita Income in Polk County?
Per Capita income in Polk County is $41,894.
What is the Median Family Income in Polk County?
Median Family Income in Polk County is $99,161.
What is the Median Household income in Polk County?
Median Household Income in Polk County is $78,827.
What is Income or Wage Gap in Polk County?
Income or Wage Gap in Polk County is 25.5%.
Women in Polk County earn 74.5 cents for every dollar earned by a man.
What is Family Income Deficit in Polk County?
Family Income Deficit in Polk County is $11,234.
Families that are below poverty line in Polk County earn $11,234 less on average than the poverty threshold level.
What is Inequality or Gini Index in Polk County?
Inequality or Gini Index in Polk County is 0.43.
What is the Total Population of Polk County?
Total Population of Polk County is 493,378.
What is the Total Male Population of Polk County?
Total Male Population of Polk County is 245,241.
What is the Total Female Population of Polk County?
Total Female Population of Polk County is 248,137.
What is the Ratio of Males per 100 Females in Polk County?
There are 98.83 Males per 100 Females in Polk County.
What is the Ratio of Females per 100 Males in Polk County?
There are 101.18 Females per 100 Males in Polk County.
What is the Median Population Age in Polk County?
Median Population Age in Polk County is 36.1 Years.
What is the Average Family Size in Polk County
Average Family Size in Polk County is 3.1 People.
What is the Average Household Size in Polk County
Average Household Size in Polk County is 2.4 People.
How Large is the Labor Force in Polk County?
There are 274,969 People in the Labor Forcein in Polk County.
What is the Percentage of People in the Labor Force in Polk County?
71.1% of People are in the Labor Force in Polk County.
What is the Unemployment Rate in Polk County?
Unemployment Rate in Polk County is 4.5%.